comScore: 2017 Cross-Platform Future in Focus
15
For info about the proprietary technology used in comScore products, refer to http://comscore.com/About_comScore/Patents Will have new cover
-
Upload
comscore -
Category
Data & Analytics
-
view
525 -
download
1
Transcript of comScore: 2017 Cross-Platform Future in Focus

For info about the proprietary technology used in comScore products, refer to http://comscore.com/About_comScore/Patents
Will have new cover

© comScore, Inc. Proprietary. 2
About this report
This is a condensed version of the 73-page 2017 U.S. Cross-Platform Future in Focus. To download the full complimentary
version of the report, please visit:
comscore.com/USFutureinFocus2017
Important Definitions:
Total Digital: The combination of desktop and mobile.
Mobile: The combination of smartphone and tablet. When data is referring specifically to smartphones or tablets, it will be labeled accordingly.
Unique visitor: A person who visits an app or digital media property at least once over the course of a month.
Digital Video Recorder (DVR): An electronic device used to record live television and watch later. Viewing via a DVR is often referred to as time-shifted recorded viewing.
Video-on-Demand (VOD): Refers to video content that is made available via the traditional cable, telco or satellite service operators for on-demand viewing, as opposed to the regularly
scheduled live TV viewing or time-shifted DVR viewing.
Over-the-Top (OTT): Refers to video content that is transmitted via the internet to one’s television set, instead of via the traditional cable, telco or satellite service operators.
For more information about subscribing to comScore services, please contact us at comscore.com/learnmore.
© comScore, Inc. Proprietary. 3
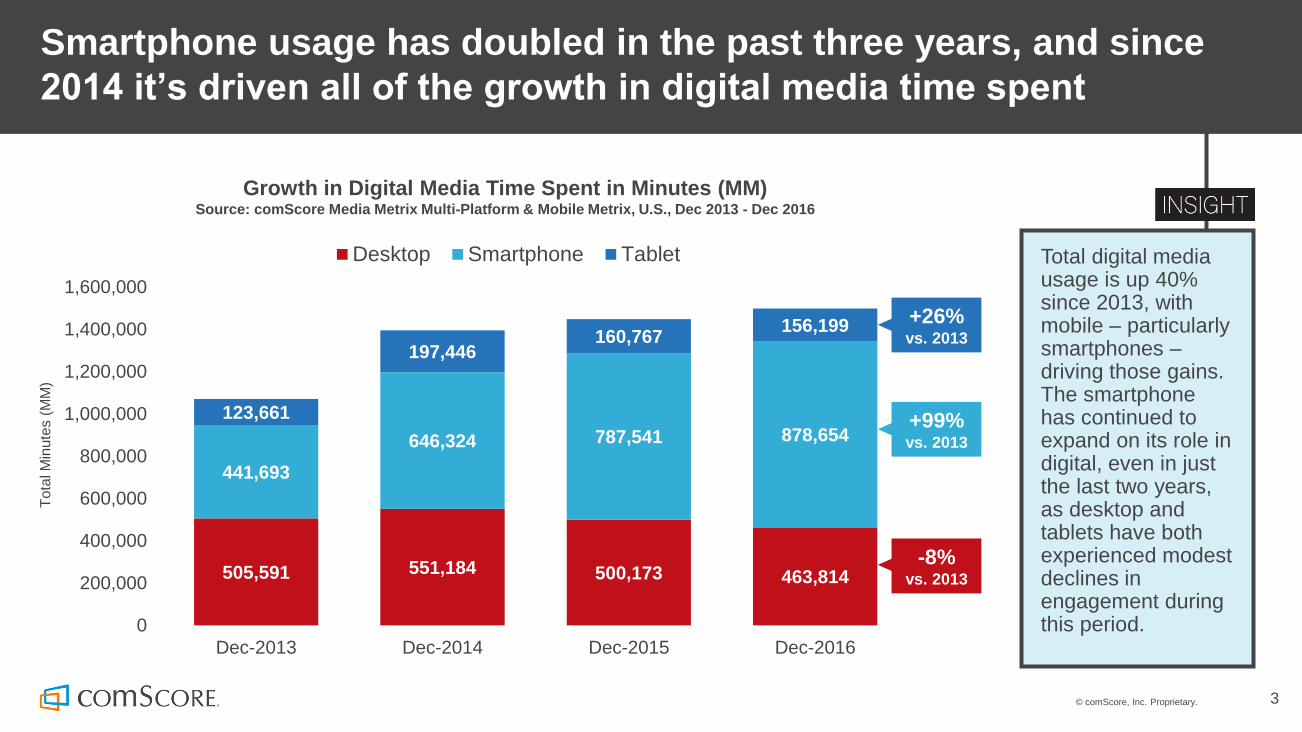
Smartphone usage has doubled in the past three years, and since
2014 it’s driven all of the growth in digital media time spent
Total digital media usage is up 40% since 2013, with mobile – particularly smartphones –driving those gains. The smartphone has continued to expand on its role in digital, even in just the last two years, as desktop and tablets have both experienced modest declines in engagement during this period.
Growth in Digital Media Time Spent in Minutes (MM)Source: comScore Media Metrix Multi-Platform & Mobile Metrix, U.S., Dec 2013 - Dec 2016
505,591 551,184 500,173 463,814
441,693
646,324 787,541 878,654
123,661
197,446160,767
156,199
0
200,000
400,000
600,000
800,000
1,000,000
1,200,000
1,400,000
1,600,000
Dec-2013 Dec-2014 Dec-2015 Dec-2016
To
tal M
inute
s (
MM
)
Desktop Smartphone Tablet
+26% vs. 2013
+99%vs. 2013
-8%vs. 2013

© comScore, Inc. Proprietary. 4
Mobile now represents almost 7 in 10 digital media minutes, and
smartphone apps alone account for half of all digital time spent
With desktop engagement faltering in recent years, it has lost share to mobile –which now accounts for 69% of digital media time spent. Mobile apps now drive 60% of digital time spent, and smartphone apps alone currently account for a majority of digital media consumption.
Share of Digital Media Time Spent by PlatformSource: comScore Media Metrix Multi-Platform & Mobile Metrix, U.S., Total Audience, Dec 2013 – Dec 2016
25%
30%
35%
40%
45%
50%
55%
60%
65%
70%
75%
Dec-2013 Jun-2014 Dec-2014 Jun-2015 Dec-2015 Jun-2016 Dec-2016
Share of Digital Time Spent on MOBILE APP
Share of Digital Time Spent on MOBILE
31%
60%
Share of Digital Time Spent on DESKTOP
+16pts
+16pts
-16pts
44%
53%
47%
Share of Digital Time Spent on SMARTPHONE APP+16pts
35%
51%
69%

© comScore, Inc. Proprietary. 5
Google Sites, Facebook and Yahoo Sites remain the top digital
media properties and the only ones with 200+ MM visitors
The average Top 10 digital media property has 39% of its audience visiting only on mobile and 34% visiting on both mobile and desktop. For five of the Top 10, a majority of their digital media audiences are mobile-only visitors, highlighting the importance of mobile as a primary touchpoint for many large digital media companies.
Top Digital Properties: Unique Visitors (MM) by PlatformSource: comScore Media Metrix Multi-Platform, U.S., Dec 2016
0 50 100 150 200 250 300
Google Sites
Yahoo Sites
Microsoft Sites
Amazon Sites
Comcast NBCUniversal
CBS Interactive
AOL, Inc.
Apple Inc.
Time Inc. Network (U.S)
Desktop Only Multi-Platform Mobile Only
209 MM
206 MM
190 MM
189 MM
164 MM
163 MM
157 MM
153 MM
129 MM
247 MM
© comScore, Inc. Proprietary. 6
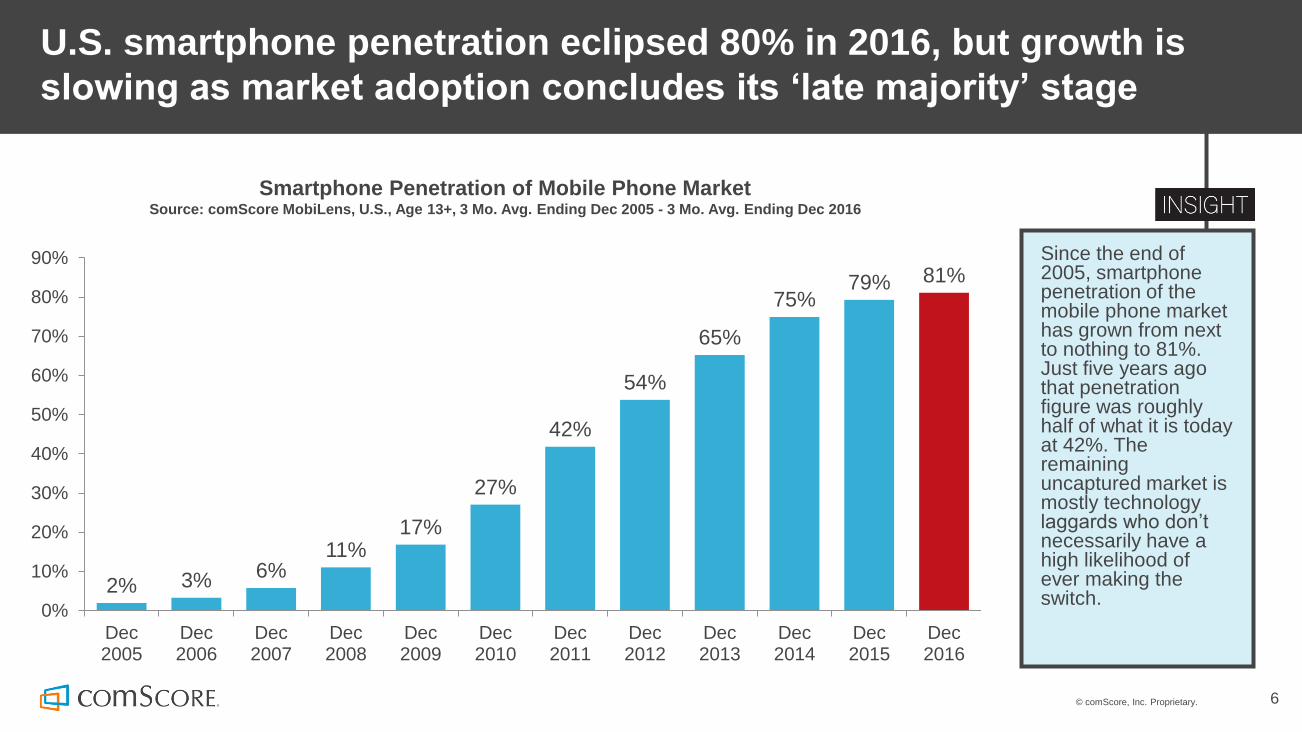
U.S. smartphone penetration eclipsed 80% in 2016, but growth is
slowing as market adoption concludes its ‘late majority’ stage
Since the end of 2005, smartphone penetration of the mobile phone market has grown from next to nothing to 81%. Just five years ago that penetration figure was roughly half of what it is today at 42%. The remaining uncaptured market is mostly technology laggards who don’t necessarily have a high likelihood of ever making the switch.
Smartphone Penetration of Mobile Phone MarketSource: comScore MobiLens, U.S., Age 13+, 3 Mo. Avg. Ending Dec 2005 - 3 Mo. Avg. Ending Dec 2016
2% 3% 6%11%
17%
27%
42%
54%
65%
75%79% 81%
0%
10%
20%
30%
40%
50%
60%
70%
80%
90%
Dec2005
Dec2006
Dec2007
Dec2008
Dec2009
Dec2010
Dec2011
Dec2012
Dec2013
Dec2014
Dec2015
Dec2016

© comScore, Inc. Proprietary. 7
Share of Total Digital Time Spent by Content CategorySource: comScore Media Metrix Multi-Platform, U.S., Total Audience, December 2016
Social media and video viewing are the two most popular online
activities, together accounting for more than a third of all internet time
Social Media20%
Multimedia14%
Entertainment - Music11%
Games8%
Portals5%
Retail5%
Directories/Resources4%
News/Information3%
e-mail3%
Search/Navigation3%
Instant Messengers2%
Photos2%
Lifestyles2%
Sports2%
All Other16% Social Media leads
all categories in engagement, accounting for 1 out of 5 minutes spent online. The next largest categories being Multimedia, Music and Games highlight that digital is being increasingly used for entertainment – now more so than ever with the rise of mobile and consumers’ need to make use of their “in-between” time.
© comScore, Inc. Proprietary. 8
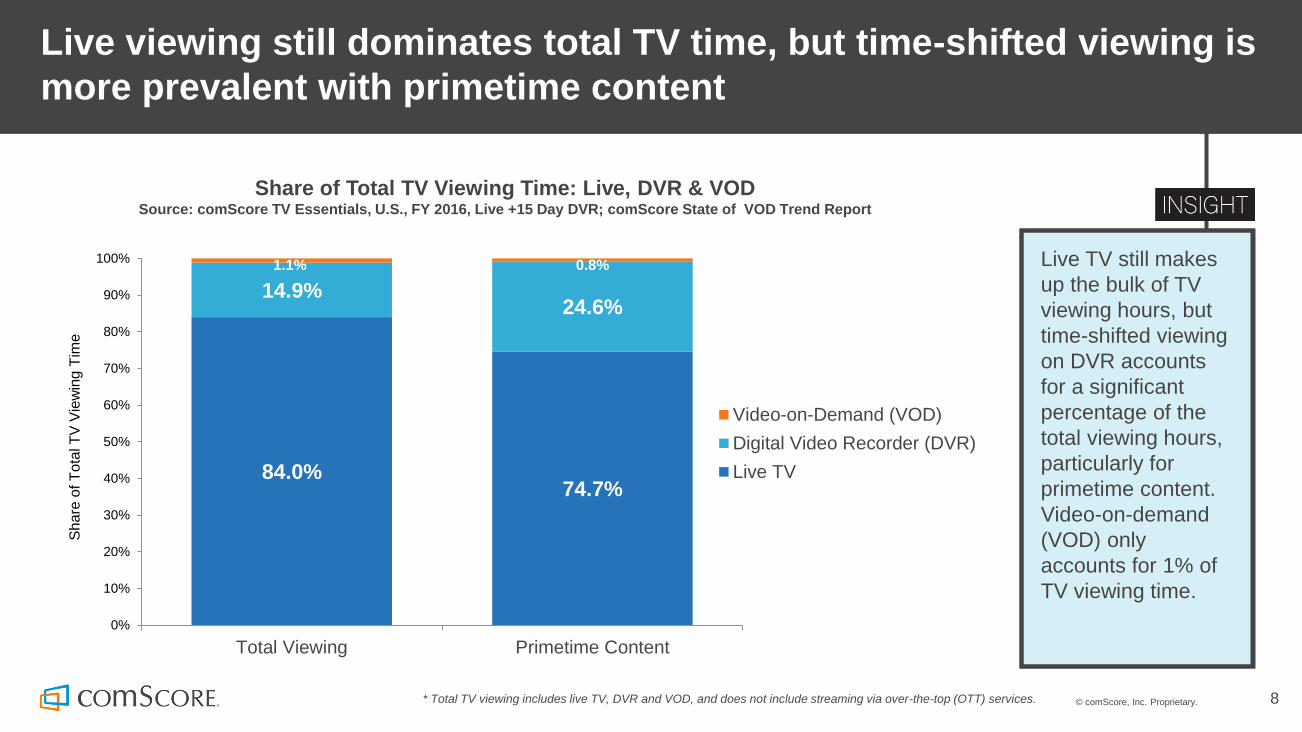
Live viewing still dominates total TV time, but time-shifted viewing is
more prevalent with primetime content
Live TV still makes
up the bulk of TV
viewing hours, but
time-shifted viewing
on DVR accounts
for a significant
percentage of the
total viewing hours,
particularly for
primetime content.
Video-on-demand
(VOD) only
accounts for 1% of
TV viewing time.
Share of Total TV Viewing Time: Live, DVR & VODSource: comScore TV Essentials, U.S., FY 2016, Live +15 Day DVR; comScore State of VOD Trend Report
84.0%74.7%
14.9%24.6%
1.1% 0.8%
0%
10%
20%
30%
40%
50%
60%
70%
80%
90%
100%
Total Viewing Primetime Content
Sh
are
of T
ota
l T
V V
iew
ing
Tim
e
Video-on-Demand (VOD)
Digital Video Recorder (DVR)
Live TV
* Total TV viewing includes live TV, DVR and VOD, and does not include streaming via over-the-top (OTT) services.
© comScore, Inc. Proprietary. 9
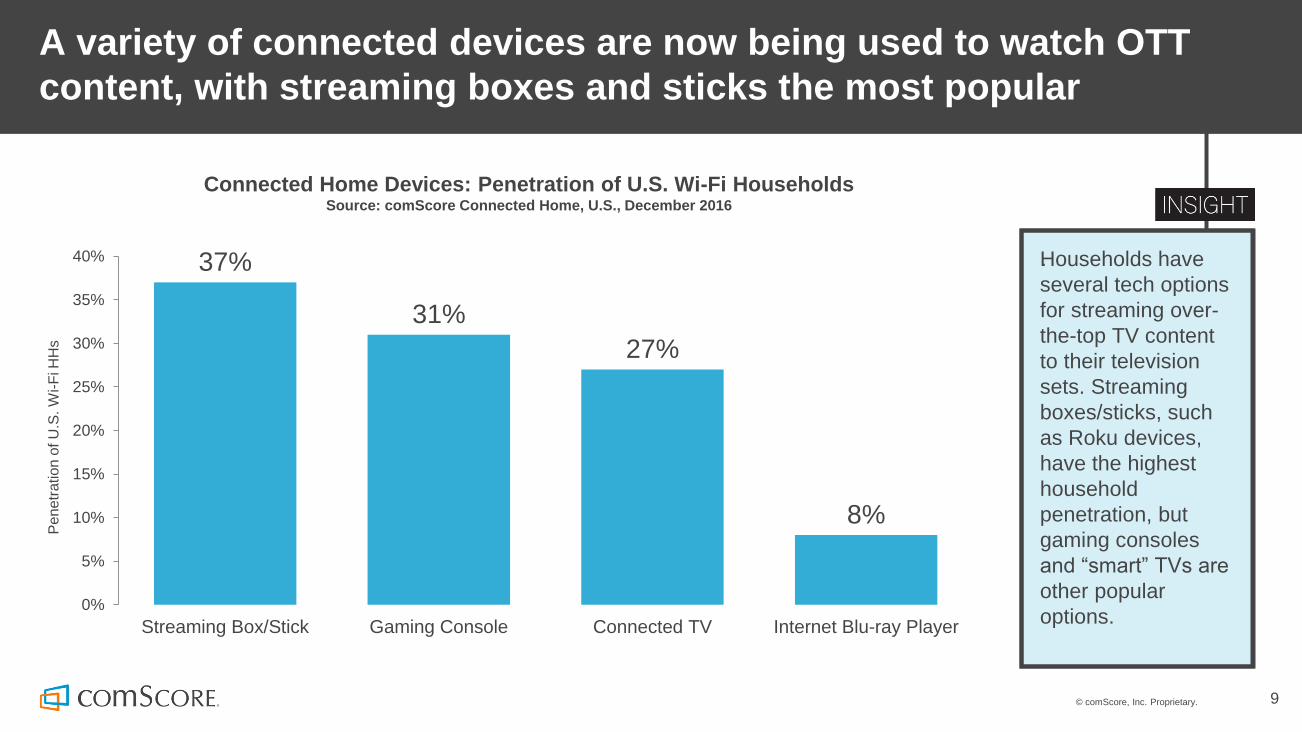
A variety of connected devices are now being used to watch OTT
content, with streaming boxes and sticks the most popular
37%
31%
27%
8%
0%
5%
10%
15%
20%
25%
30%
35%
40%
Streaming Box/Stick Gaming Console Connected TV Internet Blu-ray Player
Pe
ne
tra
tion
of U
.S. W
i-F
i HH
s
Connected Home Devices: Penetration of U.S. Wi-Fi HouseholdsSource: comScore Connected Home, U.S., December 2016
Households have
several tech options
for streaming over-
the-top TV content
to their television
sets. Streaming
boxes/sticks, such
as Roku devices,
have the highest
household
penetration, but
gaming consoles
and “smart” TVs are
other popular
options.
.

© comScore, Inc. Proprietary. 10
Nearly half of digital ad impressions can’t have an impact because
they’re not viewable or not delivered to a human
Nearly half of all desktop ad impressions are unable to deliver an advertising impact. While most of these non-viewable ads are simply delivered to parts of the web page that are out of view, a meaningful percentage is being delivered to bots and other forms of invalid traffic that is by definition not viewable to a human.
Percentage of Viewable Desktop Ad Impressions in U.S.Source: comScore vCE Benchmarks, U.S., Q4 2016
54%40%
6%
Viewable
Non-viewable
Invalid Traffic (IVT)

© comScore, Inc. Proprietary. 11
Both desktop and mobile ads deliver branding effectiveness, but
mobile performs better – particularly at the bottom of the funnel
Mobile ads caused point lifts up to 3x greater than ads on desktop across four key brand metrics and performed especially strong in middle and bottom-funnel metrics, such as favorability, intent to buy and likelihood to recommend. Less ad clutter and proximity to point of purchase may be driving better effectiveness for mobile ads.
Percentage Point Lift in Brand Metrics for Desktop and Mobile AdsSource: comScore BSL and BSL Mobile Benchmarks, U.S., 2014 - 2016
Aided awareness
Favorability
Likelihood to recommend
Purchase Intent
1.3 2.6
1.3 2.9
1.5 2.8
1.3 4.0
Desktop Mobile
3.1xdesktop
1.9xdesktop
2.2xdesktop
2.0xdesktop
© comScore, Inc. Proprietary. 12
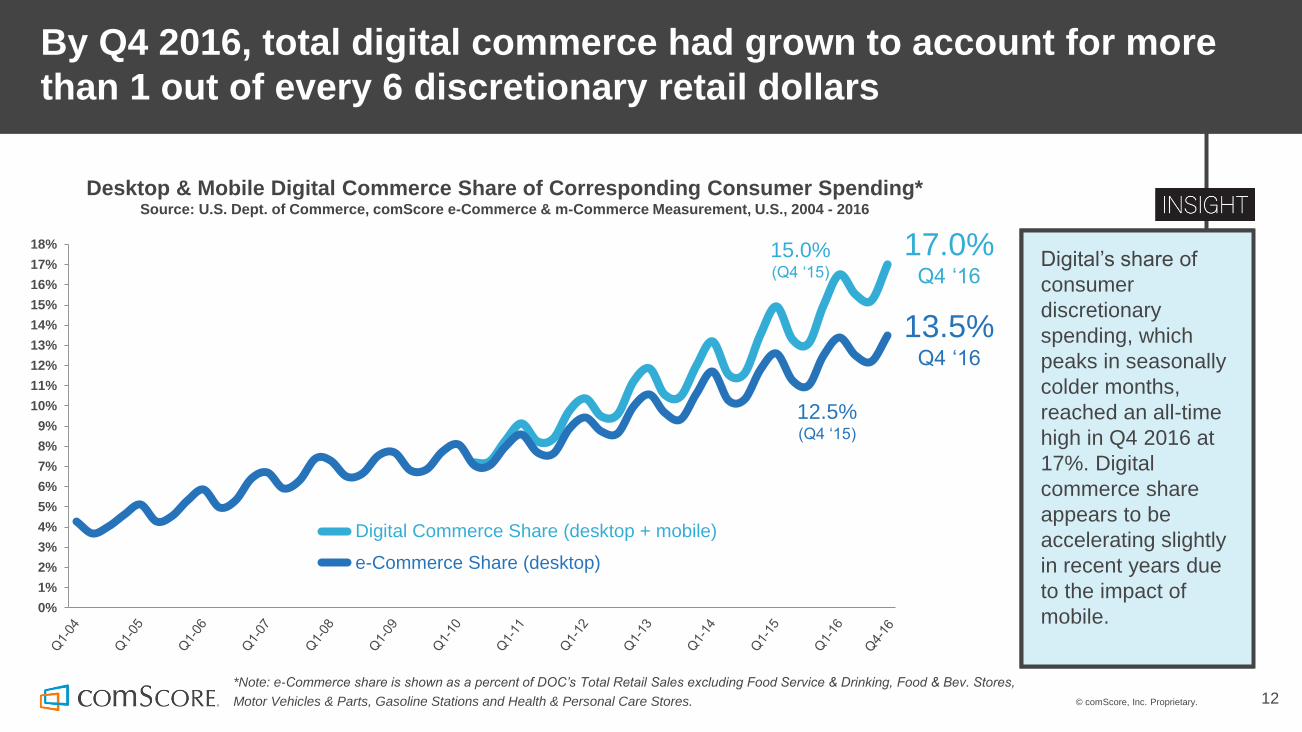
By Q4 2016, total digital commerce had grown to account for more
than 1 out of every 6 discretionary retail dollars
Desktop & Mobile Digital Commerce Share of Corresponding Consumer Spending*Source: U.S. Dept. of Commerce, comScore e-Commerce & m-Commerce Measurement, U.S., 2004 - 2016
0%
1%
2%
3%
4%
5%
6%
7%
8%
9%
10%
11%
12%
13%
14%
15%
16%
17%
18%
Digital Commerce Share (desktop + mobile)
e-Commerce Share (desktop)
*Note: e-Commerce share is shown as a percent of DOC’s Total Retail Sales excluding Food Service & Drinking, Food & Bev. Stores,
Motor Vehicles & Parts, Gasoline Stations and Health & Personal Care Stores.
15.0%(Q4 ‘15)
13.5%Q4 ‘16
17.0%Q4 ‘16
12.5%(Q4 ‘15)
Digital’s share of
consumer
discretionary
spending, which
peaks in seasonally
colder months,
reached an all-time
high in Q4 2016 at
17%. Digital
commerce share
appears to be
accelerating slightly
in recent years due
to the impact of
mobile.
© comScore, Inc. Proprietary. 13
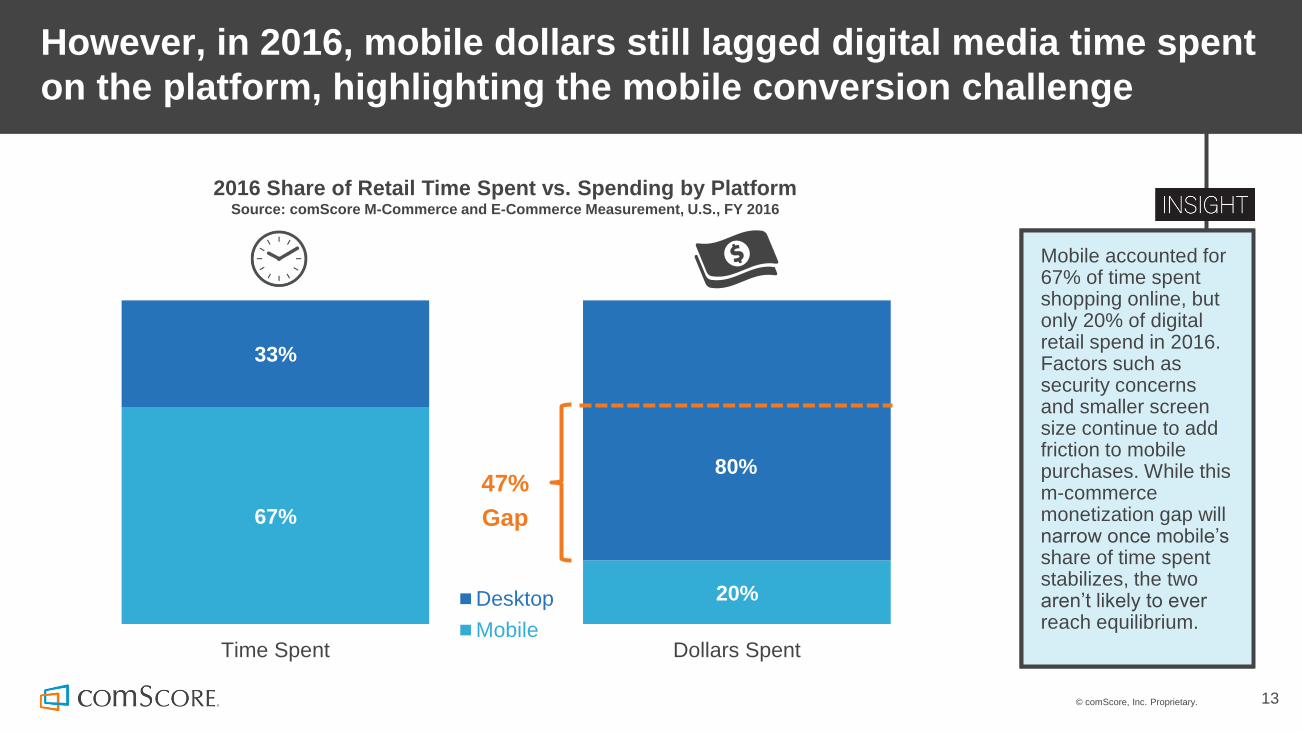
However, in 2016, mobile dollars still lagged digital media time spent
on the platform, highlighting the mobile conversion challenge
Mobile accounted for 67% of time spent shopping online, but only 20% of digital retail spend in 2016. Factors such as security concerns and smaller screen size continue to add friction to mobile purchases. While this m-commerce monetization gap will narrow once mobile’s share of time spent stabilizes, the two aren’t likely to ever reach equilibrium.
2016 Share of Retail Time Spent vs. Spending by PlatformSource: comScore M-Commerce and E-Commerce Measurement, U.S., FY 2016
67%
20%
33%
80%
Time Spent Dollars Spent
Desktop
Mobile
47%
Gap

© comScore, Inc. Proprietary. 14
As was the case in 2015, the Top 10 in 2016 featured mostly action movies and animated family-friendly films, with Disney distributing four of the top five films in 2016. Impressively, Star Wars: The Force Awakens cracked this past year’s Top 10 despite being released in mid-December 2015.
Finding Dory led the 2016 domestic box office as one of six Disney
films to rank in the Top 10
Top 10 Grossing Box Office Movies in 2016 ($ Millions)Source: comScore Box Office Essentials, North America, Jan. 1 – Dec. 31, 2016
$486.3
$408.2
$408.1
$368.4
$364.0
$363.1
$341.3
$330.4
$325.1
$284.7
Finding Dory
Rogue One: A Star Wars Story*
Captain America: Civil War
Secret Life Of Pets, The
Jungle Book, The
Deadpool
Zootopia
Batman V Superman: Dawn Of Justice
Suicide Squad
Star Wars: The Force Awakens
* Rogue One was released on December 16, 2016, and therefore was only in theaters the last two weeks of the year.
Warner Bros.
20th Century Fox
Universal
Disney

© comScore, Inc. Proprietary. 15© 2017 comScore, Inc.For info about the proprietary technology used in comScore products, refer to http://www.comscore.com/About-comScore/Patents
To download the full
73-page version
of this report,
please visit:
For more information about the report, please contact:
ANDREW LIPSMAN,
VP Marketing & Insights
ADAM LELLA,
Senior Marketing Insights Analyst
comscore.com/USFutureinFocus2017