COMS 6998-06 Network Theory Week 10 Dragomir R. Radev Wednesdays, 6:10-8 PM 325 Pupin Terrace Fall...
41
COMS 6998-06 Network Theory Week 10 Dragomir R. Radev Wednesdays, 6:10-8 PM 325 Pupin Terrace Fall 2010
-
Upload
anabel-atkins -
Category
Documents
-
view
213 -
download
0
Transcript of COMS 6998-06 Network Theory Week 10 Dragomir R. Radev Wednesdays, 6:10-8 PM 325 Pupin Terrace Fall...
COMS 6998-06 Network TheoryWeek 10
Dragomir R. RadevWednesdays, 6:10-8 PM
325 Pupin TerraceFall 2010
(16) Biological, technological and information networks
Biological networks
• Protein interaction networks
• Metabolic networks
• Gene regulatory networks
Gene expression
• The process of converting genetic information (DNA) into proteins
• The central dogma of cell biology: information passes from nucleic acid to another nucleic acid (e.g., DNA to RNA) or from a nucleic acid (e.g., RNA) to proteins
• DNA is composed of bases: adenine (A), thymine (T), cytosine (C), and guanine (G)
• A binds with T, C binds with G.
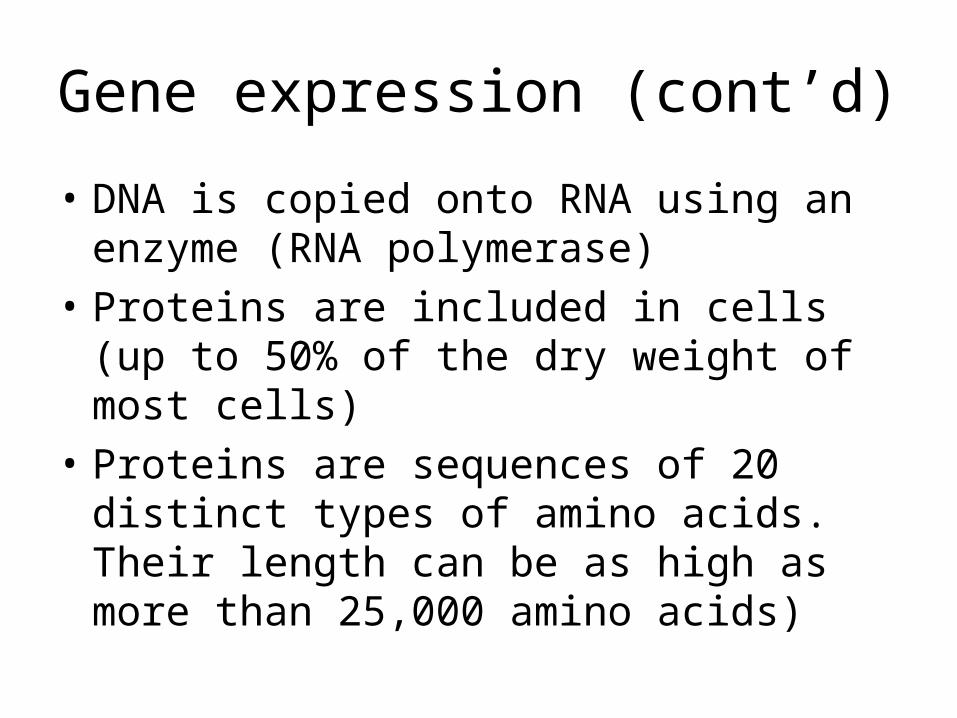
Gene expression (cont’d)
• DNA is copied onto RNA using an enzyme (RNA polymerase)
• Proteins are included in cells (up to 50% of the dry weight of most cells)
• Proteins are sequences of 20 distinct types of amino acids. Their length can be as high as more than 25,000 amino acids)
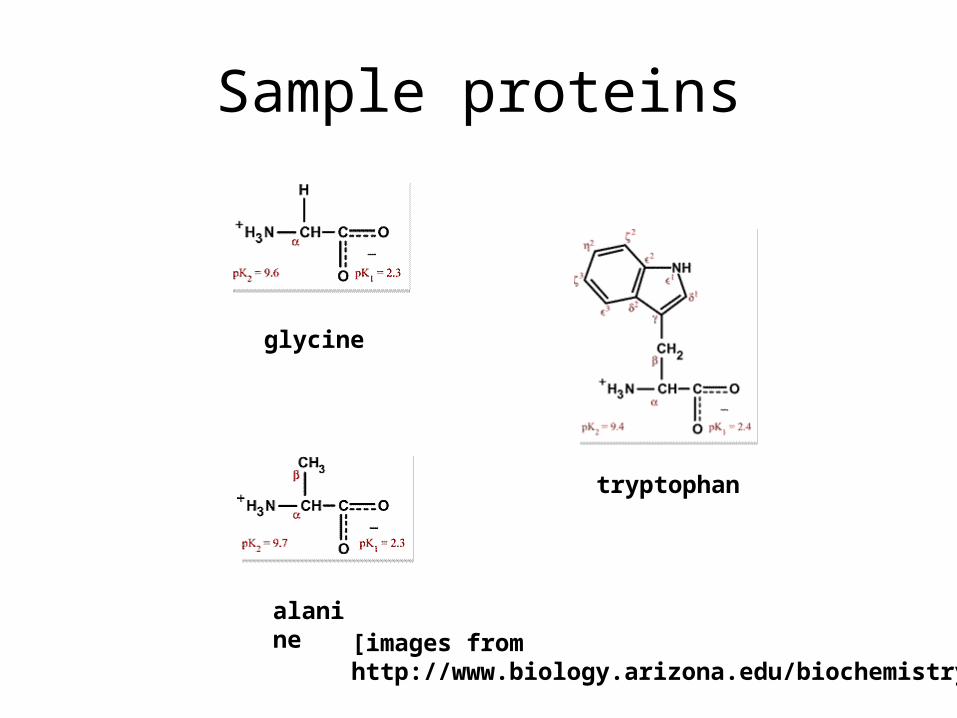
Sample proteins
glycine
alanine
tryptophan
[images fromhttp://www.biology.arizona.edu/biochemistry]
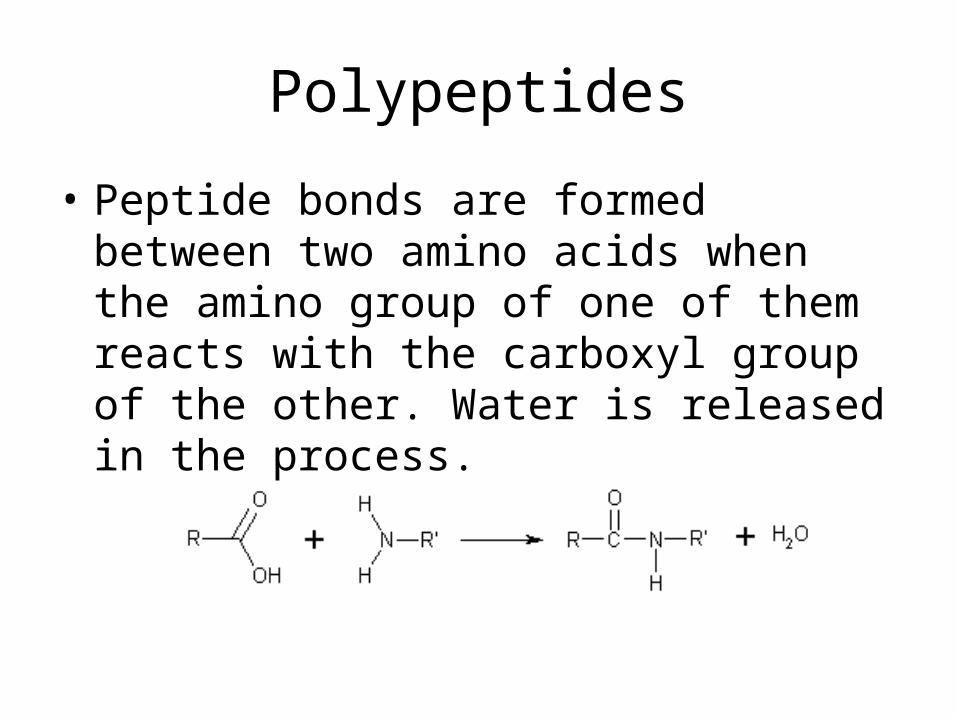
Polypeptides
• Peptide bonds are formed between two amino acids when the amino group of one of them reacts with the carboxyl group of the other. Water is released in the process.
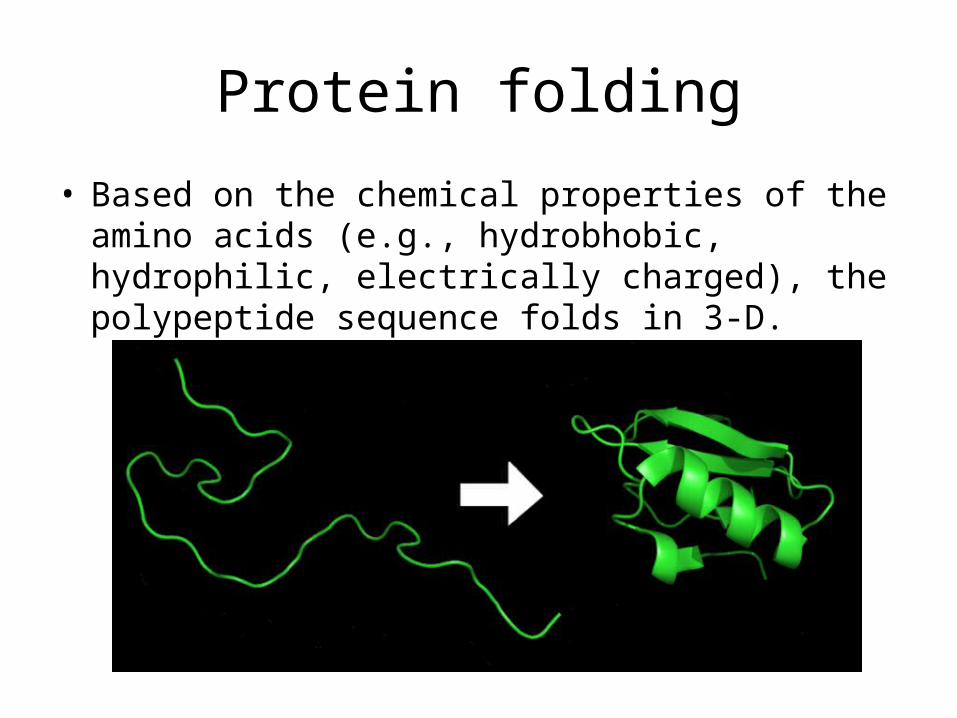
Protein folding
• Based on the chemical properties of the amino acids (e.g., hydrobhobic, hydrophilic, electrically charged), the polypeptide sequence folds in 3-D.
Protein interactions
• Signal transduction – communication between external signals and the inside of the cell
• Proteins may carry each other
• Phosphorylation
• Protein complexes
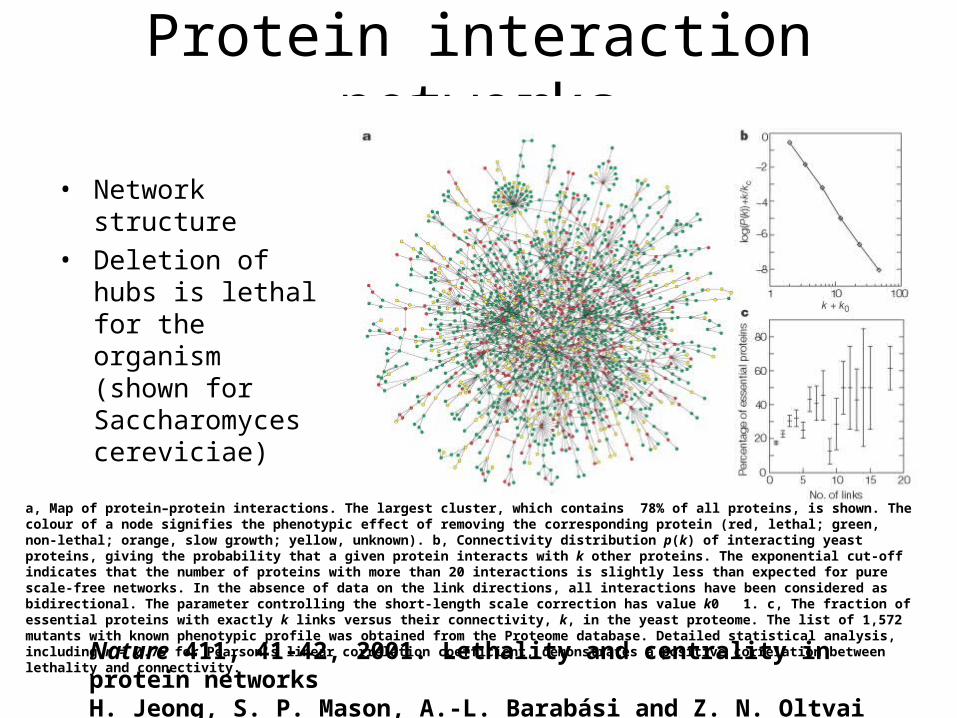
Protein interaction networks
• Network structure• Deletion of hubs is
lethal for the organism (shown for Saccharomyces cereviciae)
Nature 411, 41-42, 2001. Lethality and centrality in protein networksH. Jeong, S. P. Mason, A.-L. Barabási and Z. N. Oltvai
a, Map of protein–protein interactions. The largest cluster, which contains 78% of all proteins, is shown. The colour of a node signifies the phenotypic effect of removing the corresponding protein (red, lethal; green, non-lethal; orange, slow growth; yellow, unknown). b, Connectivity distribution p(k) of interacting yeast proteins, giving the probability that a given protein interacts with k other proteins. The exponential cut-off indicates that the number of proteins with more than 20 interactions is slightly less than expected for pure scale-free networks. In the absence of data on the link directions, all interactions have been considered as bidirectional. The parameter controlling the short-length scale correction has value k0 1. c, The fraction of essential proteins with exactly k links versus their connectivity, k, in the yeast proteome. The list of 1,572 mutants with known phenotypic profile was obtained from the Proteome database. Detailed statistical analysis, including r = 0.75 for Pearson's linear correlation coefficient, demonstrates a positive correlation between lethality and connectivity.
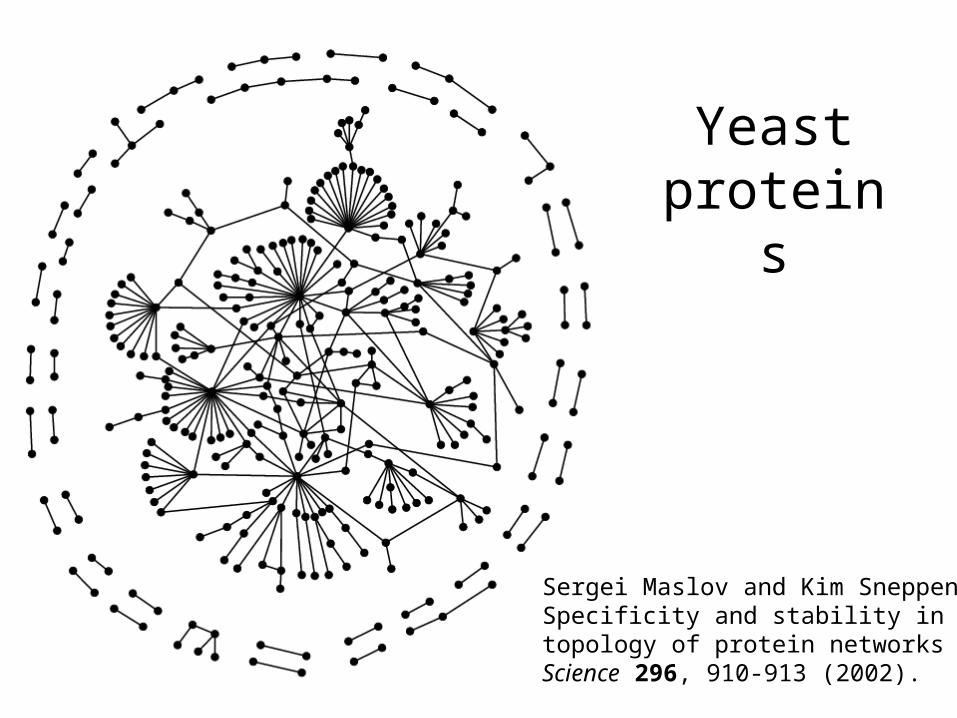
Sergei Maslov and Kim SneppenSpecificity and stability intopology of protein networksScience 296, 910-913 (2002).
Yeast proteins
• Challenge in extracting relevant information from vast amount of publications– Biomedical literature growing rapidly ( > 14 million articles in PubMed)– Delay in including new discoveries to curated databases– Most information uncovered in unstructured text of biomedical
publications
• Determining gene-disease associations requires laborious experiments over hundreds of genes– e.g. Genetic linkage analysis
Approach: Text mining and network analysis for predicting gene-disease associations
Joint work with Arzucan Ozgur, Thuy Vu, David States
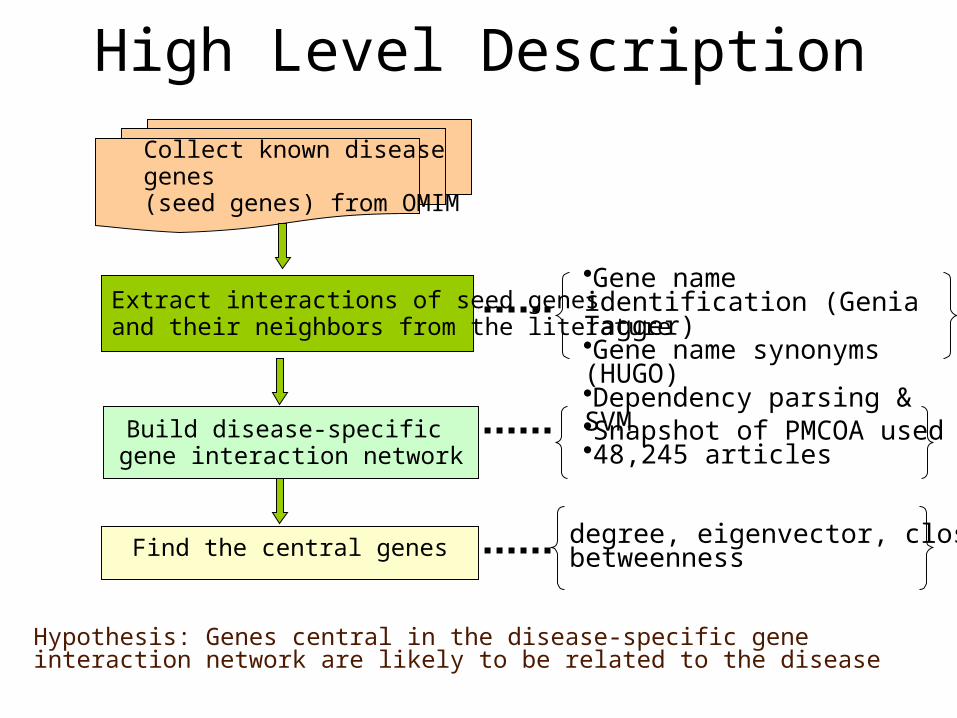
High Level Description
Extract interactions of seed genes and their neighbors from the literature
Build disease-specific gene interaction network
Collect known disease genes(seed genes) from OMIM
Find the central genes degree, eigenvector, closeness,betweenness
Gene name identification (Genia Tagger)Gene name synonyms (HUGO) Dependency parsing & SVM
Hypothesis: Genes central in the disease-specific gene interaction network are likely to be related to the disease
Snapshot of PMCOA used 48,245 articles
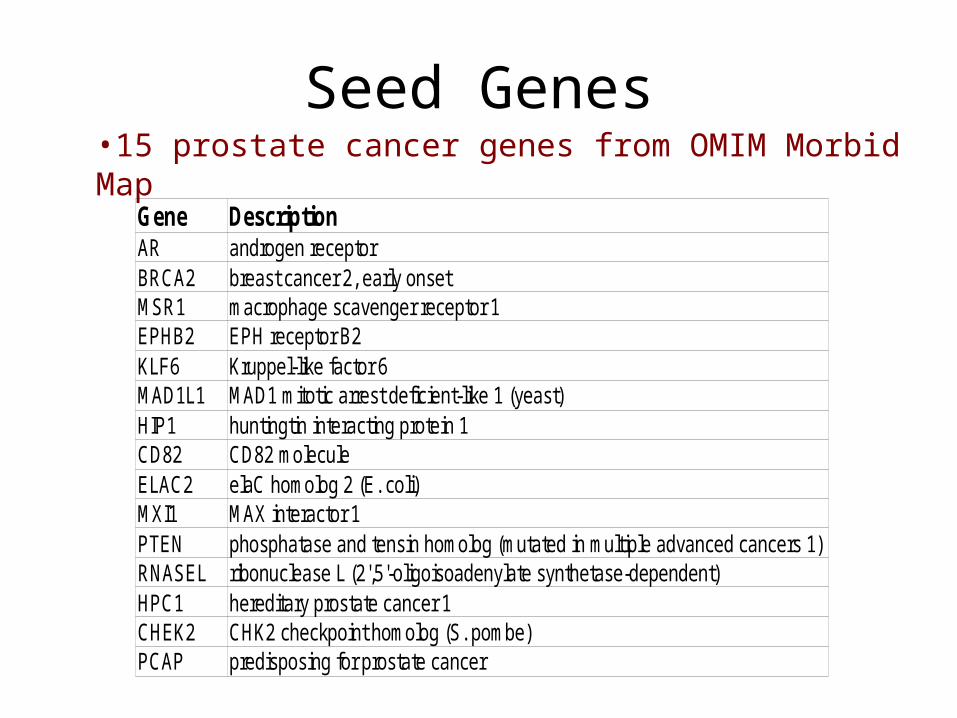
•15 prostate cancer genes from OMIM Morbid Map
Seed Genes
Gene DescriptionAR androgen receptorBRCA2 breast cancer 2, early onsetMSR1 macrophage scavenger receptor 1EPHB2 EPH receptor B2KLF6 Kruppel-like factor 6MAD1L1 MAD1 mitotic arrest deficient-like 1 (yeast)HIP1 huntingtin interacting protein 1CD82 CD82 moleculeELAC2 elaC homolog 2 (E. coli)MXI1 MAX interactor 1PTEN phosphatase and tensin homolog (mutated in multiple advanced cancers 1)RNASEL ribonuclease L (2',5'-oligoisoadenylate synthetase-dependent)HPC1 hereditary prostate cancer 1CHEK2 CHK2 checkpoint homolog (S. pombe)PCAP predisposing for prostate cancer
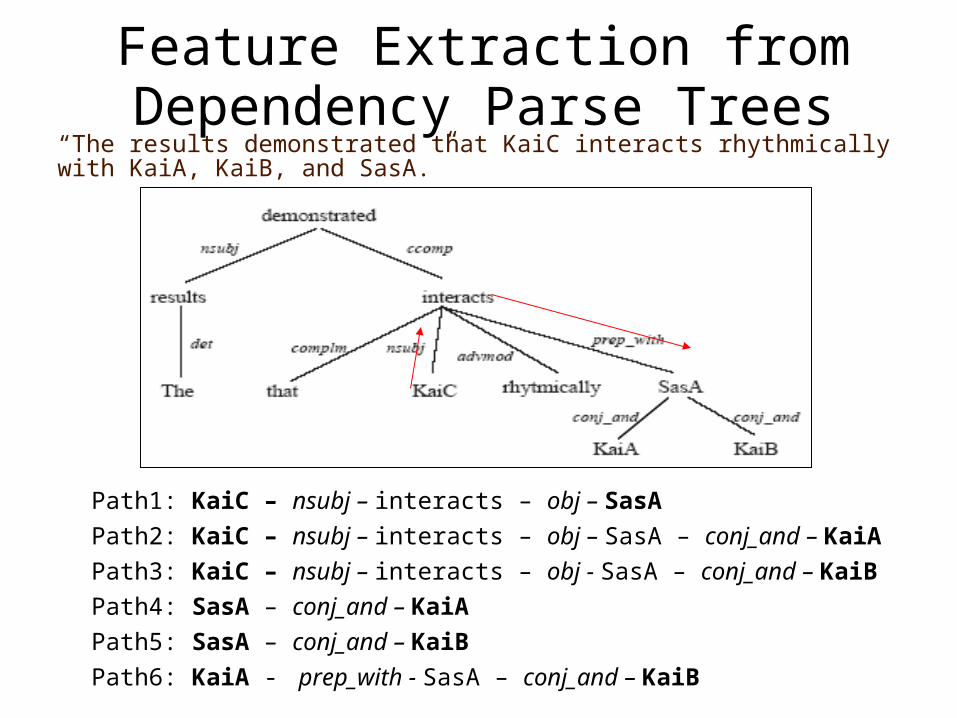
Feature Extraction from Dependency Parse Trees
Path1: KaiC – nsubj – interacts – obj – SasA
Path2: KaiC – nsubj – interacts – obj – SasA – conj_and – KaiA
Path3: KaiC – nsubj – interacts – obj - SasA – conj_and – KaiB
Path4: SasA – conj_and – KaiA
Path5: SasA – conj_and – KaiB
Path6: KaiA - prep_with - SasA – conj_and – KaiB
“The results demonstrated that KaiC interacts rhythmically with KaiA, KaiB, and SasA.”
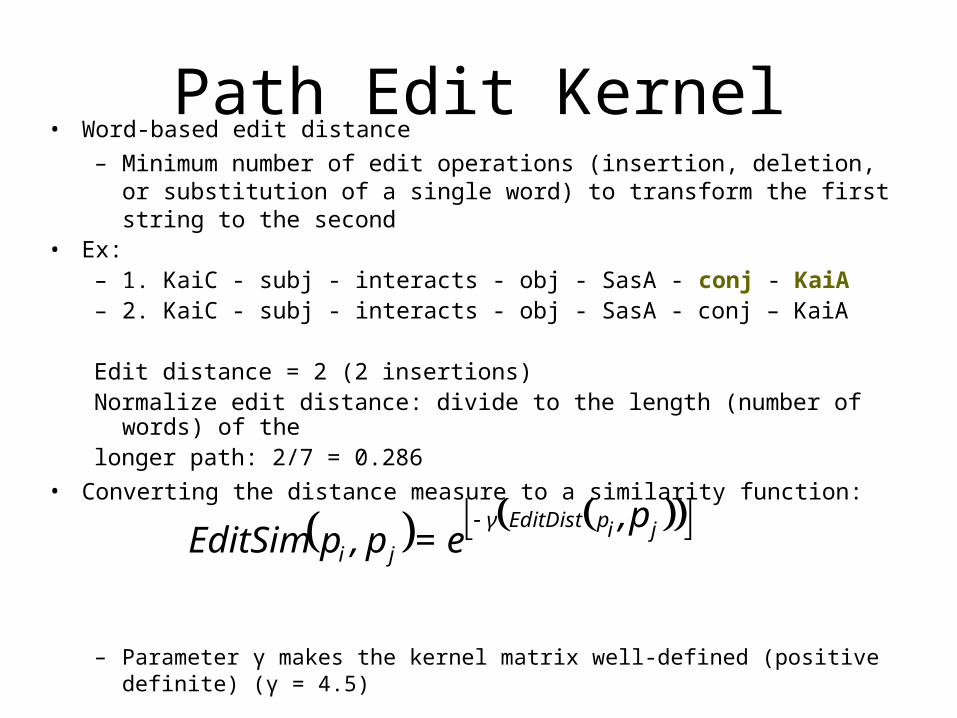
Path Edit Kernel• Word-based edit distance
– Minimum number of edit operations (insertion, deletion, or substitution of a single word) to transform the first string to the second
• Ex:– 1. KaiC - subj - interacts - obj - SasA - conj - KaiA– 2. KaiC - subj - interacts - obj - SasA - conj – KaiA
Edit distance = 2 (2 insertions) Normalize edit distance: divide to the length (number of words) of thelonger path: 2/7 = 0.286
• Converting the distance measure to a similarity function:
– Parameter γ makes the kernel matrix well-defined (positive definite) (γ = 4.5)
jipEditDistγ
ji
p,e=p,pEditSim
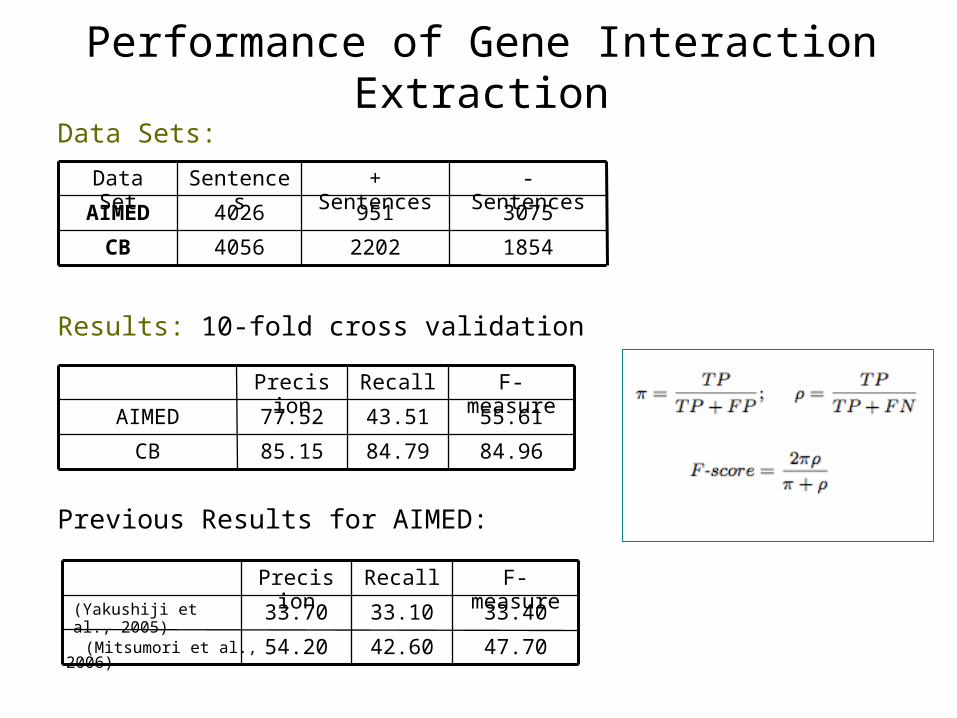
Performance of Gene Interaction ExtractionData Sets:
Results: 10-fold cross validation
Previous Results for AIMED:
185422024056CB
30759514026AIMED
- Sentences+ SentencesSentencesData Set
84.9684.7985.15CB
55.6143.5177.52AIMED
F-measureRecallPrecision
47.7042.6054.20
33.4033.1033.70(Yakushiji et al., 2005)
F-measureRecallPrecision
(Mitsumori et al., 2006)

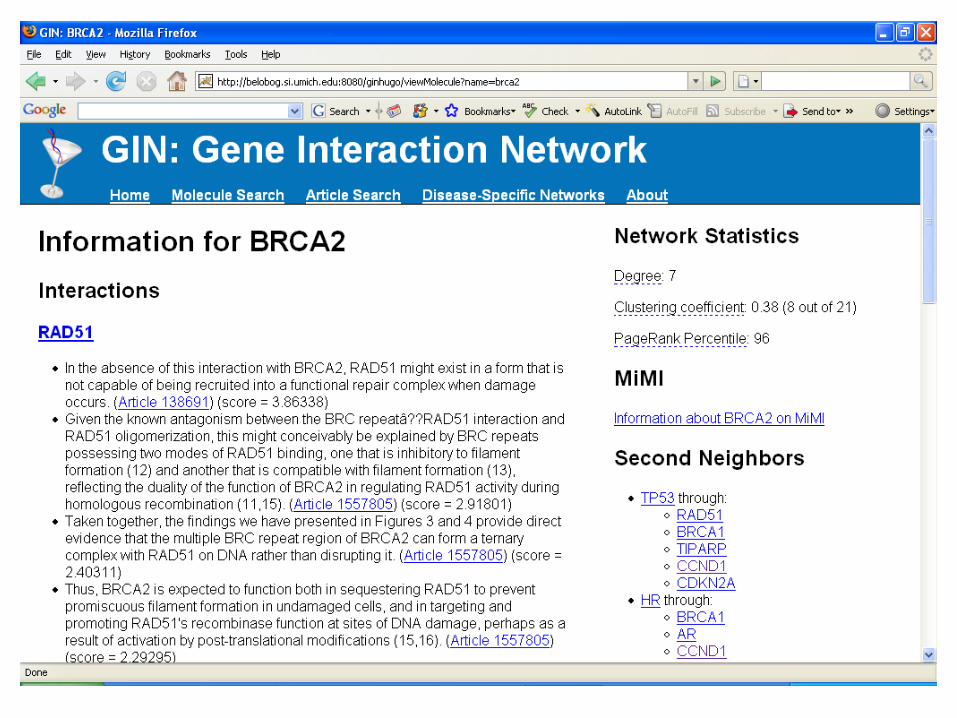
Constructing the Interaction Network• Sample extracted interaction sentences:
– PTEN is transcriptionally regulated by transcription factors such as p53 and Egr-1.
– In response to DNA damage, the cell-cycle checkpoint kinase CHEK2 can be activated by ATM kinase to phosphorylate p53 and BRCA1, which are involved in cell-cycle control and apoptosis.
– The interactions of RAD51 with TP53, RPA and the BRC repeats of BRCA2 are relatively well understood (see Discussion).
– The interaction of BRCA2 with HsRad51 is significantly more different to both RadA and RecA (Figure 2c).
• The constructed graph:
BRCA1 CHEK2 p53 PTEN Egr-1
TP53 RAD51 BRCA2 HsRad51
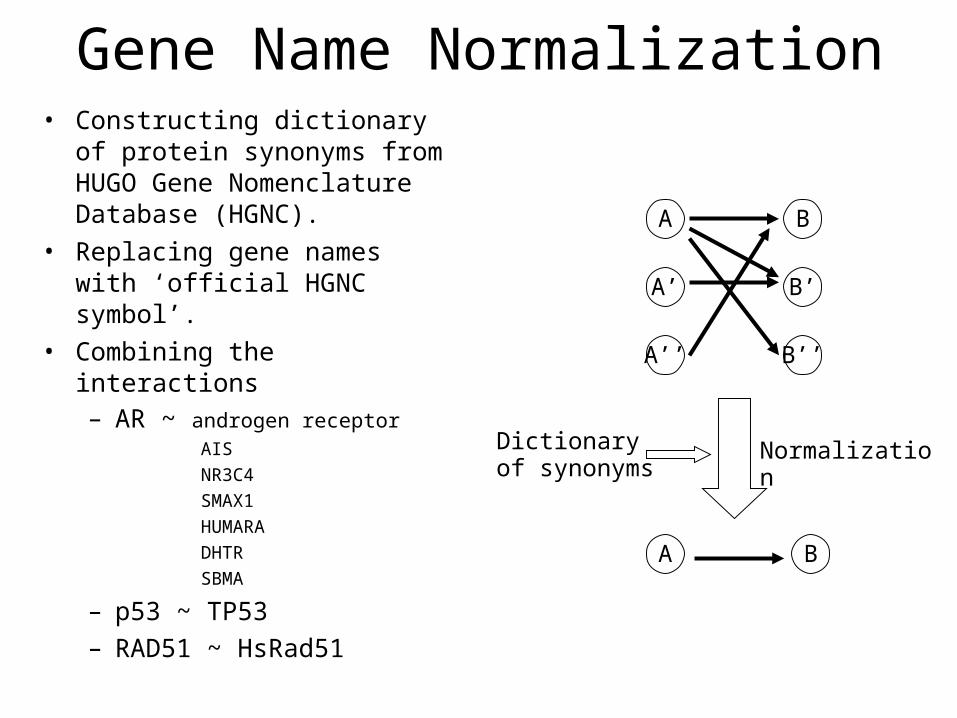
Gene Name Normalization• Constructing dictionary of
protein synonyms from HUGO Gene Nomenclature Database (HGNC).
• Replacing gene names with ‘official HGNC symbol’.
• Combining the interactions– AR ~ androgen receptor
AIS
NR3C4
SMAX1
HUMARA
DHTR
SBMA
– p53 ~ TP53– RAD51 ~ HsRad51
A
A’
A’’
B
B’
B’’
A B
Dictionary of synonyms
Normalization
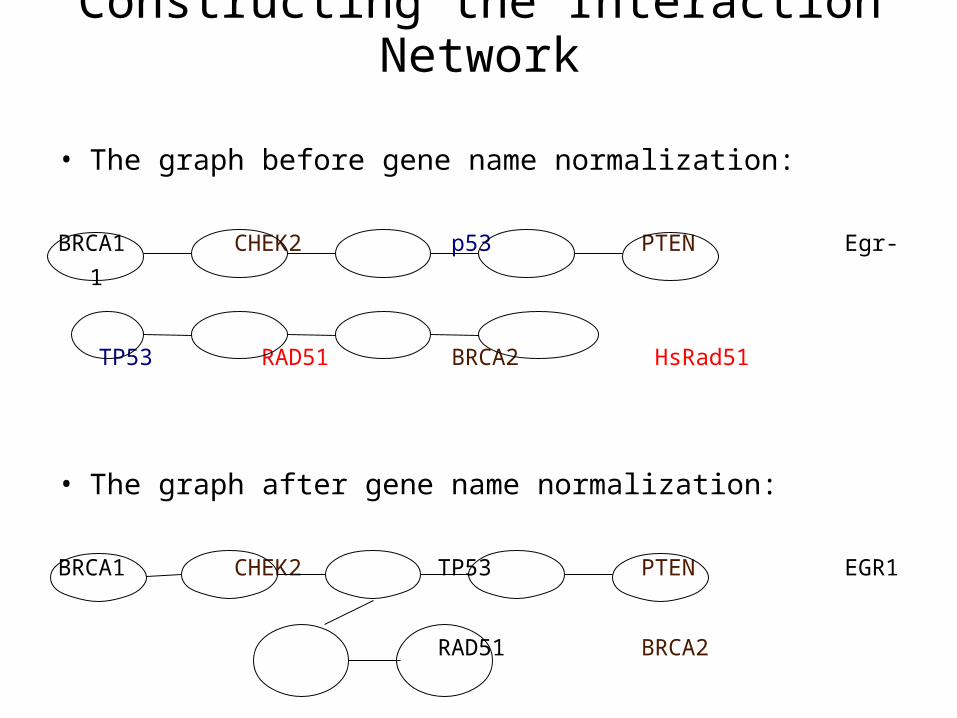
Constructing the Interaction Network
• The graph before gene name normalization:
BRCA1 CHEK2 p53 PTEN Egr-1
TP53 RAD51 BRCA2 HsRad51
• The graph after gene name normalization:
BRCA1 CHEK2 TP53 PTEN EGR1
RAD51 BRCA2
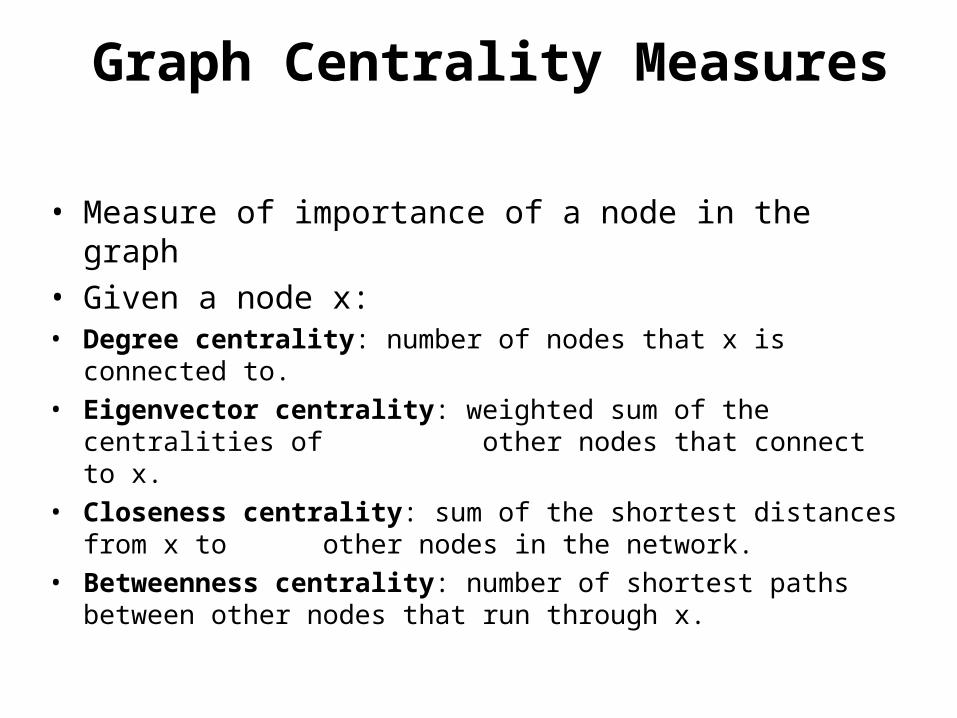
Graph Centrality Measures
• Measure of importance of a node in the graph• Given a node x:• Degree centrality: number of nodes that x is connected to.• Eigenvector centrality: weighted sum of the centralities of
other nodes that connect to x. • Closeness centrality: sum of the shortest distances from x to
other nodes in the network.• Betweenness centrality: number of shortest paths between other
nodes that run through x.

• 226 nodes• 1,187 edges• Diameter = 6• Average shortest path length = 2.57• Watts-Strogatz Clustering Coefficient = 0.4497
– C(rand) = 0.0487
• Power-law exponent = 2.24
• Small-world network with power-law degree distribution
Properties of the disease-specific network
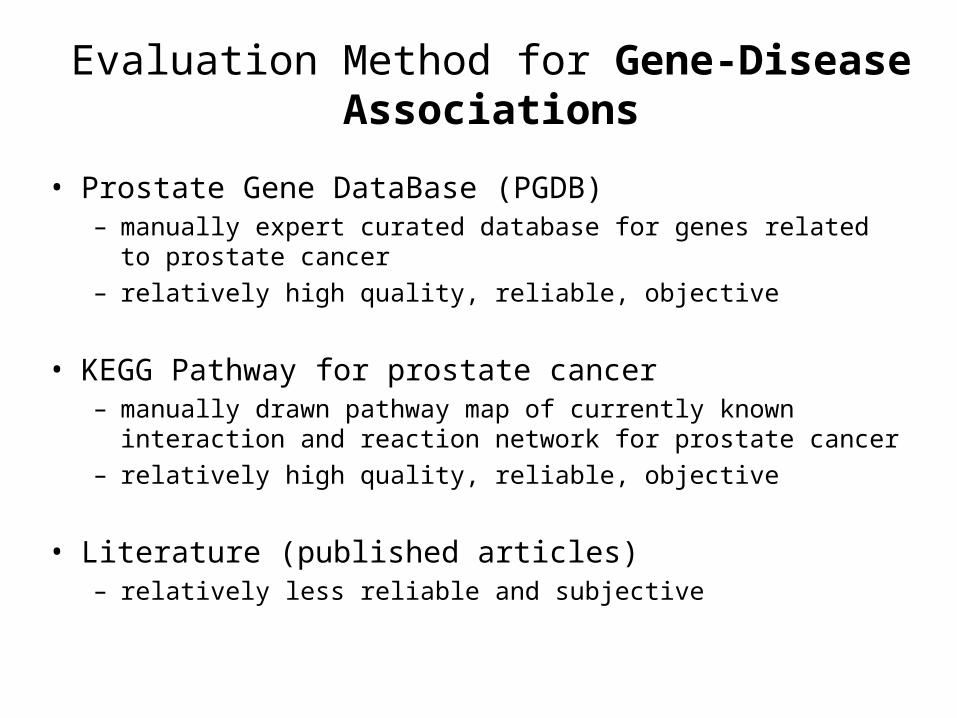
Evaluation Method for Gene-Disease Associations
• Prostate Gene DataBase (PGDB)– manually expert curated database for genes related to prostate
cancer– relatively high quality, reliable, objective
• KEGG Pathway for prostate cancer– manually drawn pathway map of currently known interaction and
reaction network for prostate cancer– relatively high quality, reliable, objective
• Literature (published articles)– relatively less reliable and subjective
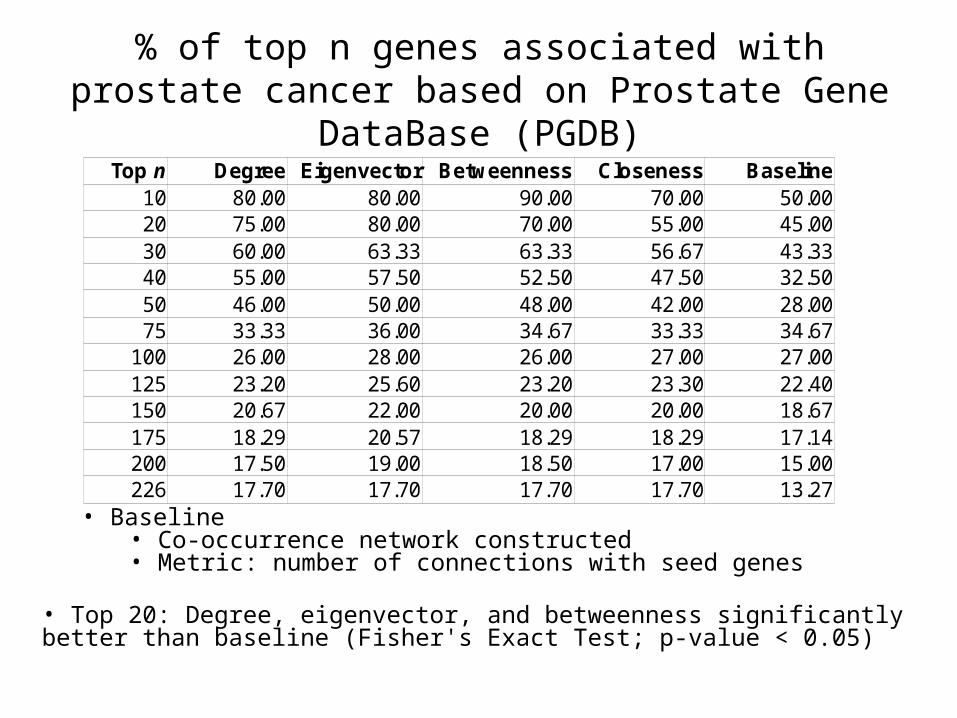
% of top n genes associated with prostate cancer based on Prostate Gene DataBase (PGDB)
Degree Eigenvector Betweenness Closeness Baseline10 80.00 80.00 90.00 70.00 50.0020 75.00 80.00 70.00 55.00 45.0030 60.00 63.33 63.33 56.67 43.3340 55.00 57.50 52.50 47.50 32.5050 46.00 50.00 48.00 42.00 28.0075 33.33 36.00 34.67 33.33 34.67
100 26.00 28.00 26.00 27.00 27.00125 23.20 25.60 23.20 23.30 22.40150 20.67 22.00 20.00 20.00 18.67175 18.29 20.57 18.29 18.29 17.14200 17.50 19.00 18.50 17.00 15.00226 17.70 17.70 17.70 17.70 13.27
Top n
• Baseline• Co-occurrence network constructed• Metric: number of connections with seed genes
• Top 20: Degree, eigenvector, and betweenness significantly better than baseline (Fisher's Exact Test; p-value < 0.05)
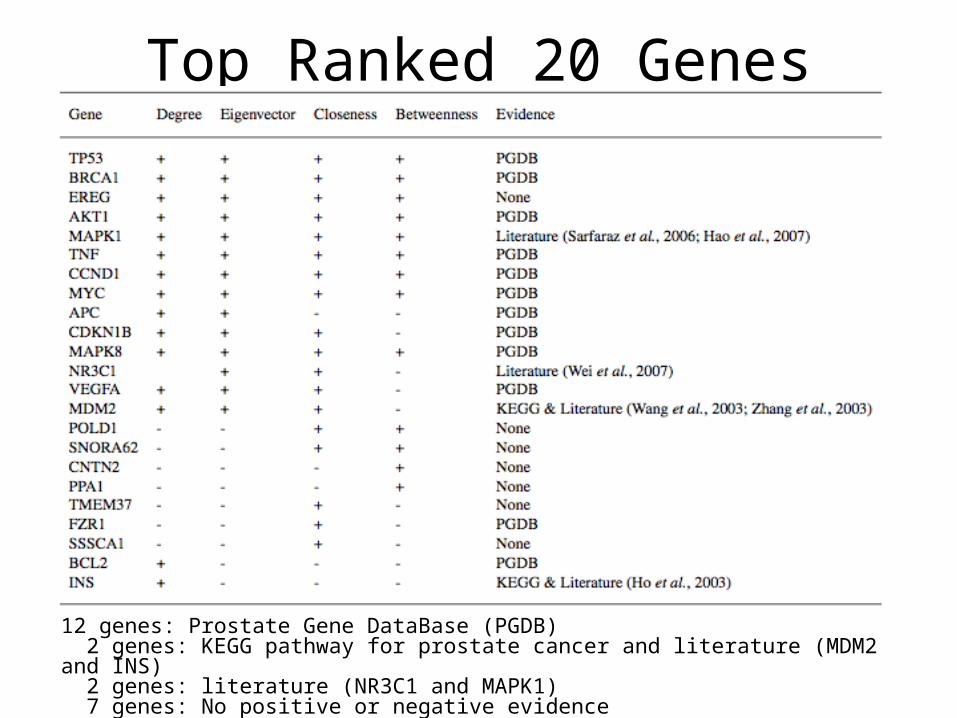
Top Ranked 20 Genes
12 genes: Prostate Gene DataBase (PGDB) 2 genes: KEGG pathway for prostate cancer and literature (MDM2 and INS) 2 genes: literature (NR3C1 and MAPK1) 7 genes: No positive or negative evidence

Evidence from the literature• MDM2
– “MDM2 has a role in prostate cancer growth via p53 dependent and p53-independent mechanisms” (Wang et al., 2003; Zhang et al., 2003)
• INS– “Polymorphism of the insulin gene is associated with increased
prostate cancer risk” (Ho et al., 2003)
References:• Ho, G., Melman, A., Liu, S., Li, M., Yu, H., Negassa, A., Burk, R., Hsing, A., Ghavamian, R., and
Chua, S. J. (2003). Br J Cancer, 88(2), 263–269.
• Wang, H., Yu, D., Agrawal, S., and Zhang, R. (2003). Prostate, 54(3), 194–205.• Zhang, Z., Li, M., Wang, H., Agrawal, S., and Zhang, R. (2003). Proc Natl Acad Sci,
100(20), 11636–11641.
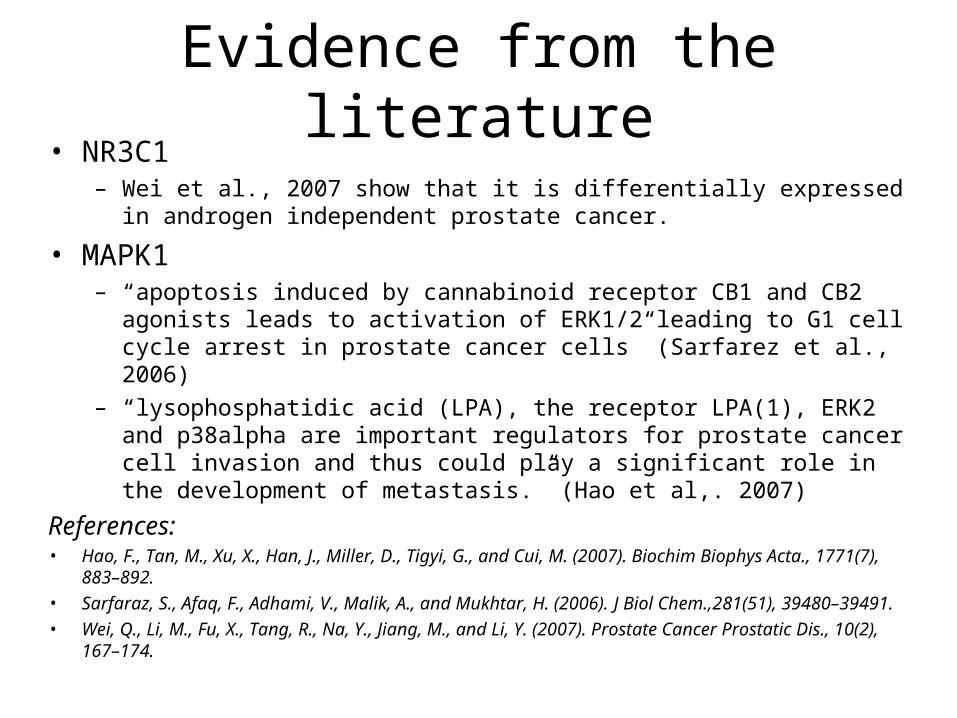
Evidence from the literature• NR3C1
– Wei et al., 2007 show that it is differentially expressed in androgen independent prostate cancer.
• MAPK1– “apoptosis induced by cannabinoid receptor CB1 and CB2 agonists leads
to activation of ERK1/2 leading to G1 cell cycle arrest in prostate cancer cells” (Sarfarez et al., 2006)
– “lysophosphatidic acid (LPA), the receptor LPA(1), ERK2 and p38alpha are important regulators for prostate cancer cell invasion and thus could play a significant role in the development of metastasis.” (Hao et al,. 2007)
References:• Hao, F., Tan, M., Xu, X., Han, J., Miller, D., Tigyi, G., and Cui, M. (2007). Biochim Biophys Acta.,
1771(7), 883–892.
• Sarfaraz, S., Afaq, F., Adhami, V., Malik, A., and Mukhtar, H. (2006). J Biol Chem.,281(51), 39480–39491.
• Wei, Q., Li, M., Fu, X., Tang, R., Na, Y., Jiang, M., and Li, Y. (2007). Prostate Cancer Prostatic Dis., 10(2), 167–174.
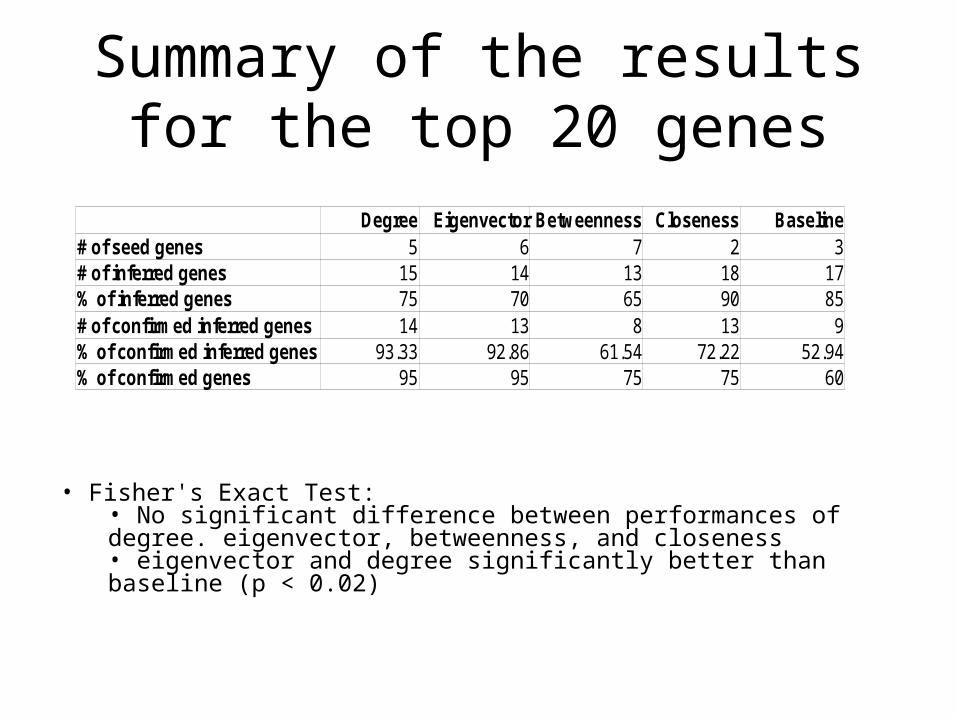
Summary of the results for the top 20 genes
Degree Eigenvector Betweenness Closeness Baseline# of seed genes 5 6 7 2 3# of inferred genes 15 14 13 18 17% of inferred genes 75 70 65 90 85# of confirmed inferred genes 14 13 8 13 9% of confirmed inferred genes 93.33 92.86 61.54 72.22 52.94% of confirmed genes 95 95 75 75 60
• Fisher's Exact Test:• No significant difference between performances of degree. eigenvector, betweenness, and closeness• eigenvector and degree significantly better than baseline (p < 0.02)
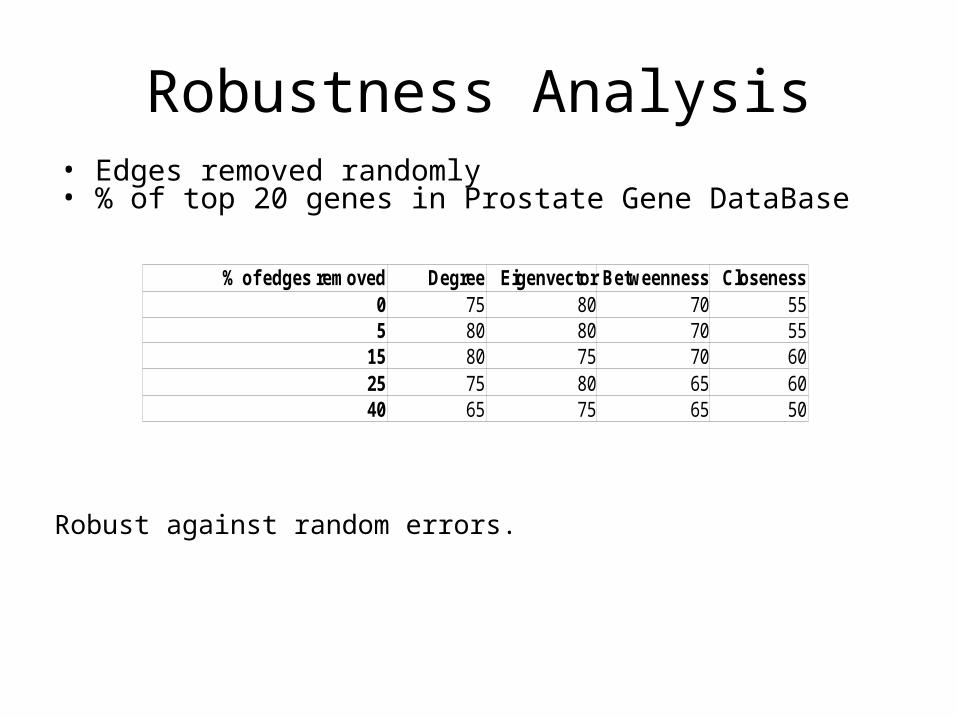
Robustness Analysis
% of edges removed Degree Eigenvector Betweenness Closeness0 75 80 70 555 80 80 70 55
15 80 75 70 6025 75 80 65 6040 65 75 65 50
• Edges removed randomly• % of top 20 genes in Prostate Gene DataBase
Robust against random errors.
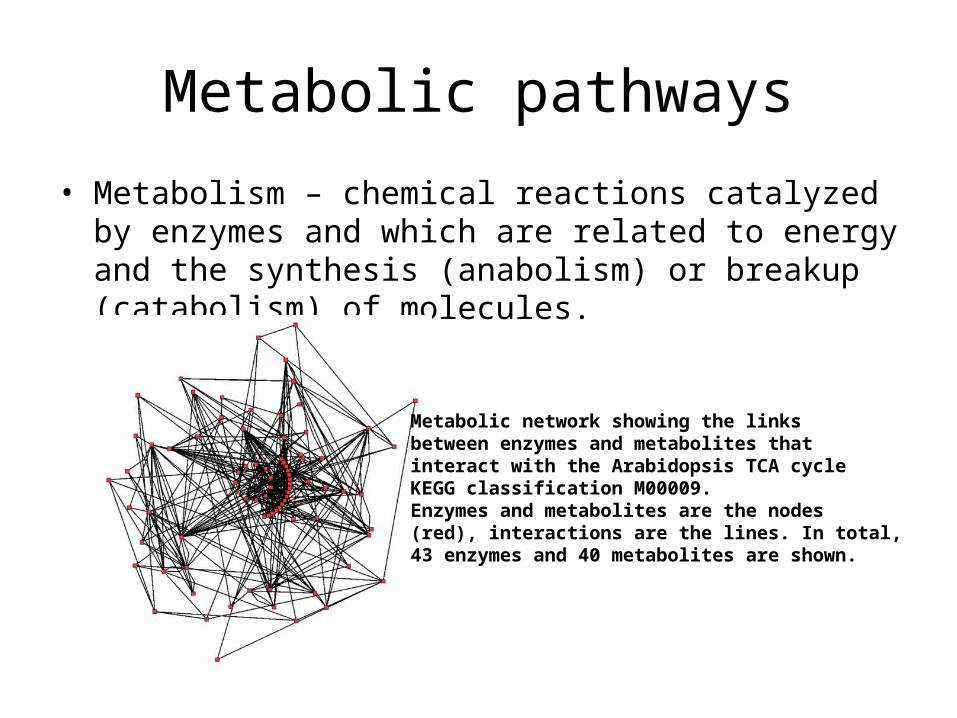
Metabolic pathways
• Metabolism – chemical reactions catalyzed by enzymes and which are related to energy and the synthesis (anabolism) or breakup (catabolism) of molecules.
Metabolic network showing the links between enzymes and metabolites that interact with the Arabidopsis TCA cycle KEGG classification M00009. Enzymes and metabolites are the nodes(red), interactions are the lines. In total,43 enzymes and 40 metabolites are shown.
Metabolic pathways
• Most reactions are not reversible so the graph is directed.
• http://www.gwu.edu/~mpb/ - all major metabolic pathways
• Example: tryptophan synthesis: http://www.gwu.edu/~mpb/shikimate3.htm
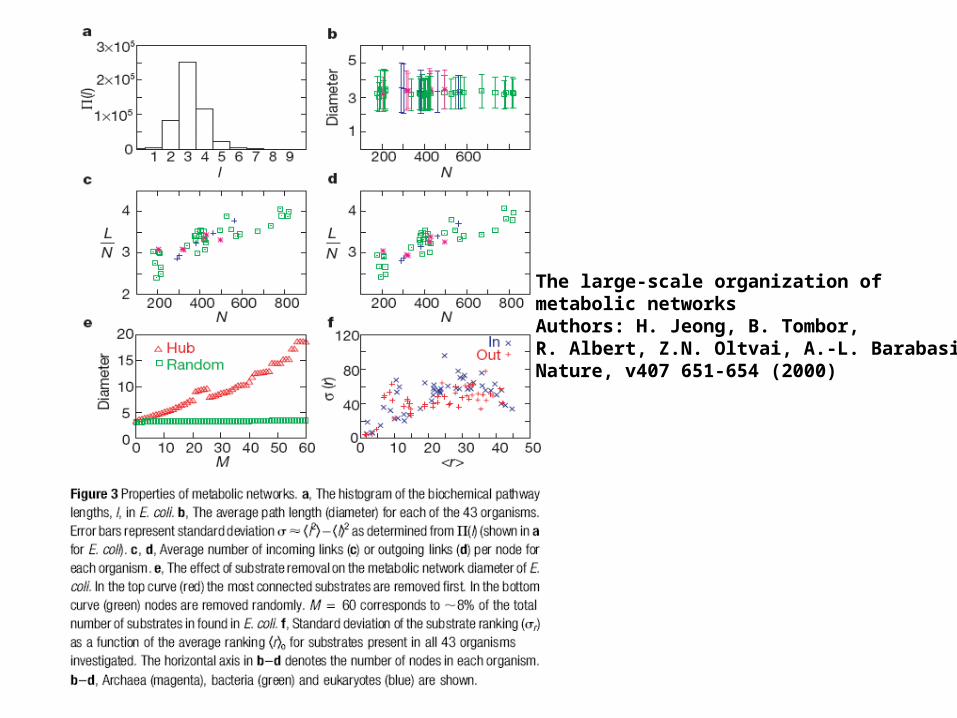
The large-scale organization ofmetabolic networksAuthors: H. Jeong, B. Tombor,R. Albert, Z.N. Oltvai, A.-L. BarabasiNature, v407 651-654 (2000)
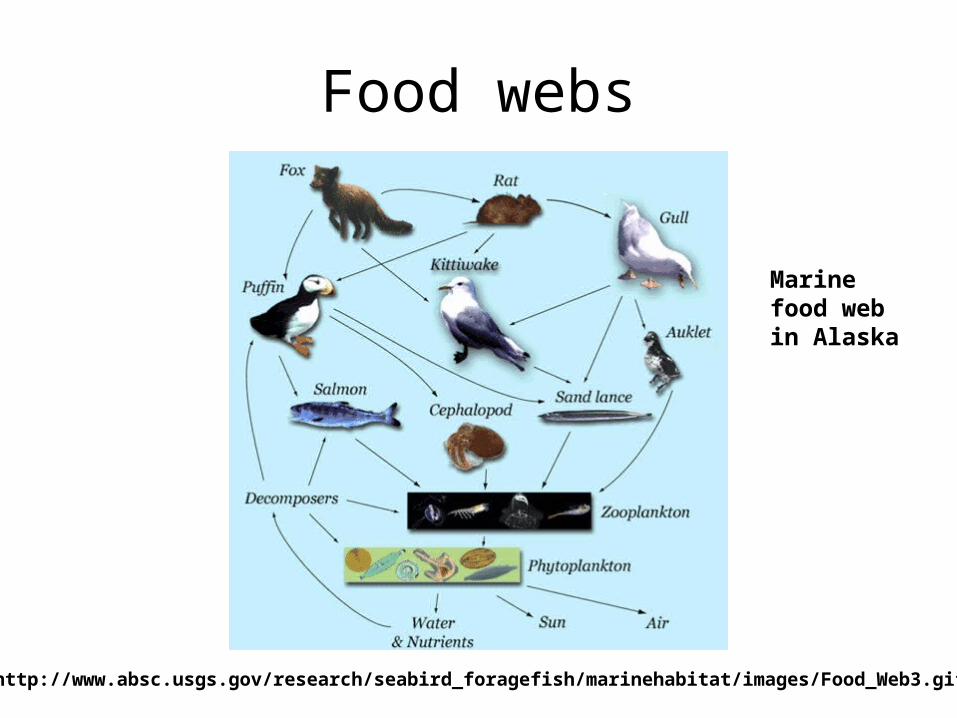
Food webs
[http://www.absc.usgs.gov/research/seabird_foragefish/marinehabitat/images/Food_Web3.gif]
Marinefood webin Alaska
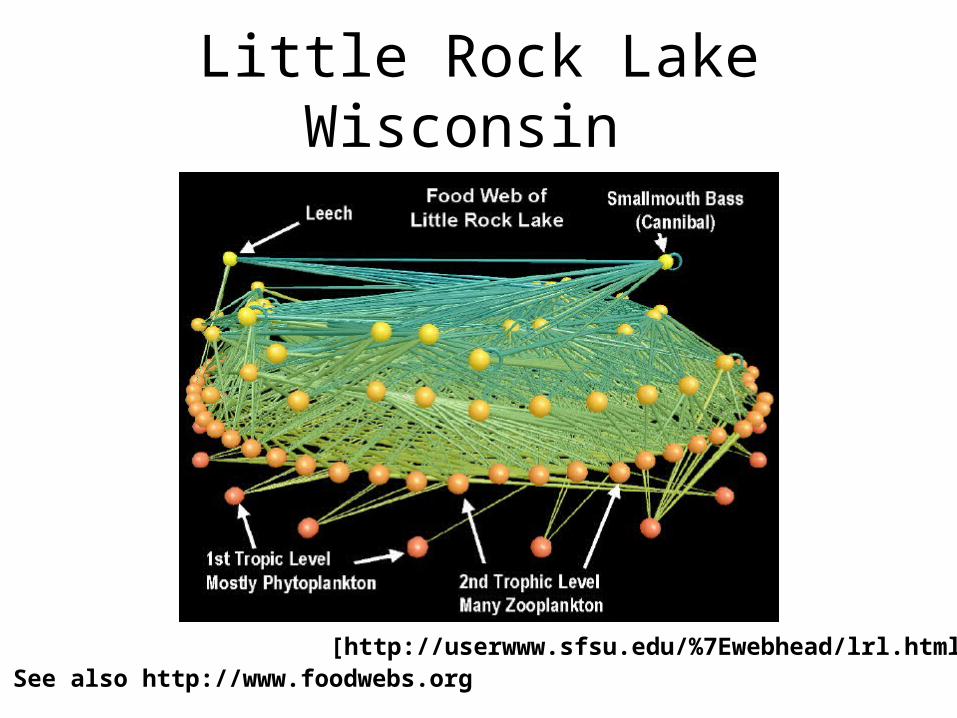
Little Rock Lake Wisconsin
[http://userwww.sfsu.edu/%7Ewebhead/lrl.html]See also http://www.foodwebs.org
Connectance
• X=m/n(n-1) – number of actual predations relative to the number of possible ones.
• Sample values: 0.31 (Skipwith Pound), 0.12 (St. Martin Island), 0.03 (Silwood Park).
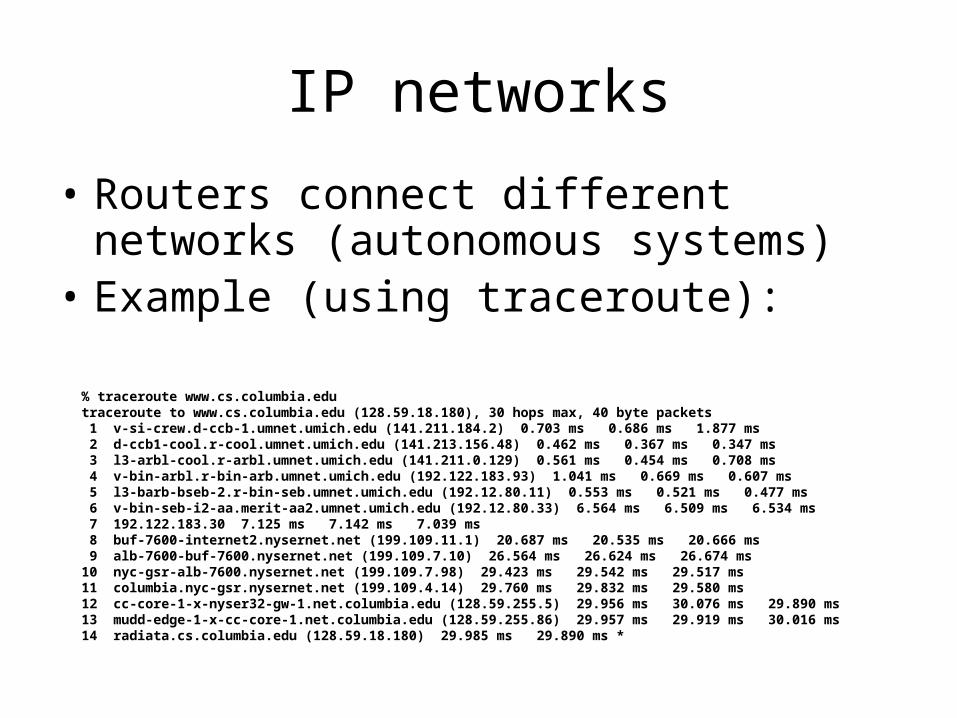
IP networks
• Routers connect different networks (autonomous systems)
• Example (using traceroute):
% traceroute www.cs.columbia.edutraceroute to www.cs.columbia.edu (128.59.18.180), 30 hops max, 40 byte packets 1 v-si-crew.d-ccb-1.umnet.umich.edu (141.211.184.2) 0.703 ms 0.686 ms 1.877 ms 2 d-ccb1-cool.r-cool.umnet.umich.edu (141.213.156.48) 0.462 ms 0.367 ms 0.347 ms 3 l3-arbl-cool.r-arbl.umnet.umich.edu (141.211.0.129) 0.561 ms 0.454 ms 0.708 ms 4 v-bin-arbl.r-bin-arb.umnet.umich.edu (192.122.183.93) 1.041 ms 0.669 ms 0.607 ms 5 l3-barb-bseb-2.r-bin-seb.umnet.umich.edu (192.12.80.11) 0.553 ms 0.521 ms 0.477 ms 6 v-bin-seb-i2-aa.merit-aa2.umnet.umich.edu (192.12.80.33) 6.564 ms 6.509 ms 6.534 ms 7 192.122.183.30 7.125 ms 7.142 ms 7.039 ms 8 buf-7600-internet2.nysernet.net (199.109.11.1) 20.687 ms 20.535 ms 20.666 ms 9 alb-7600-buf-7600.nysernet.net (199.109.7.10) 26.564 ms 26.624 ms 26.674 ms10 nyc-gsr-alb-7600.nysernet.net (199.109.7.98) 29.423 ms 29.542 ms 29.517 ms11 columbia.nyc-gsr.nysernet.net (199.109.4.14) 29.760 ms 29.832 ms 29.580 ms12 cc-core-1-x-nyser32-gw-1.net.columbia.edu (128.59.255.5) 29.956 ms 30.076 ms 29.890 ms13 mudd-edge-1-x-cc-core-1.net.columbia.edu (128.59.255.86) 29.957 ms 29.919 ms 30.016 ms14 radiata.cs.columbia.edu (128.59.18.180) 29.985 ms 29.890 ms *
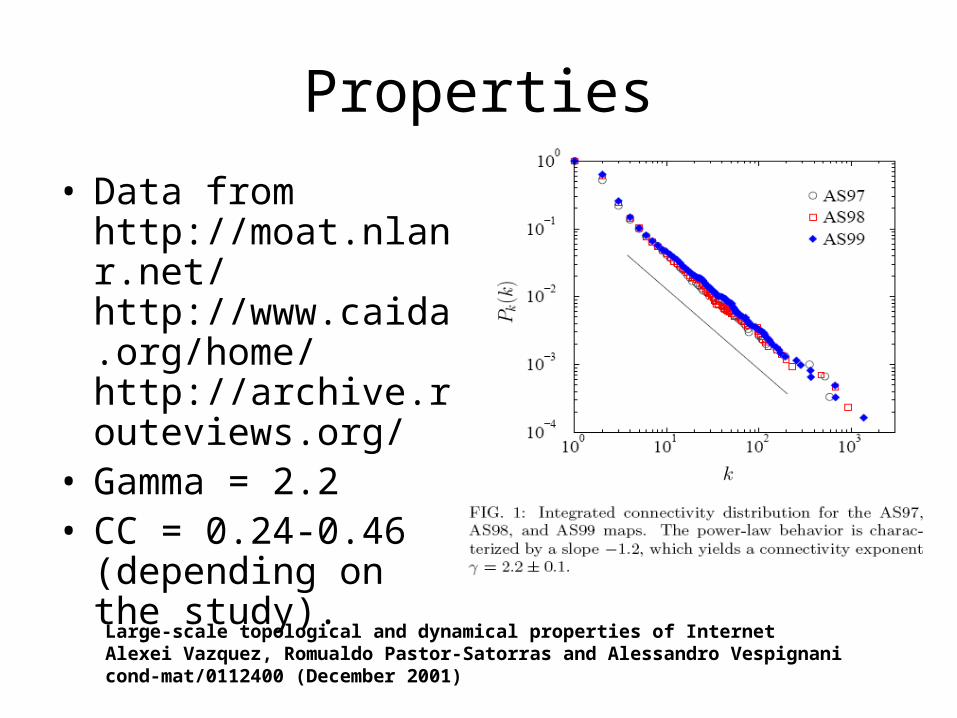
Properties
• Data from http://moat.nlanr.net/http://www.caida.org/home/ http://archive.routeviews.org/
• Gamma = 2.2• CC = 0.24-0.46
(depending on the study).
Large-scale topological and dynamical properties of InternetAlexei Vazquez, Romualdo Pastor-Satorras and Alessandro Vespignani cond-mat/0112400 (December 2001)
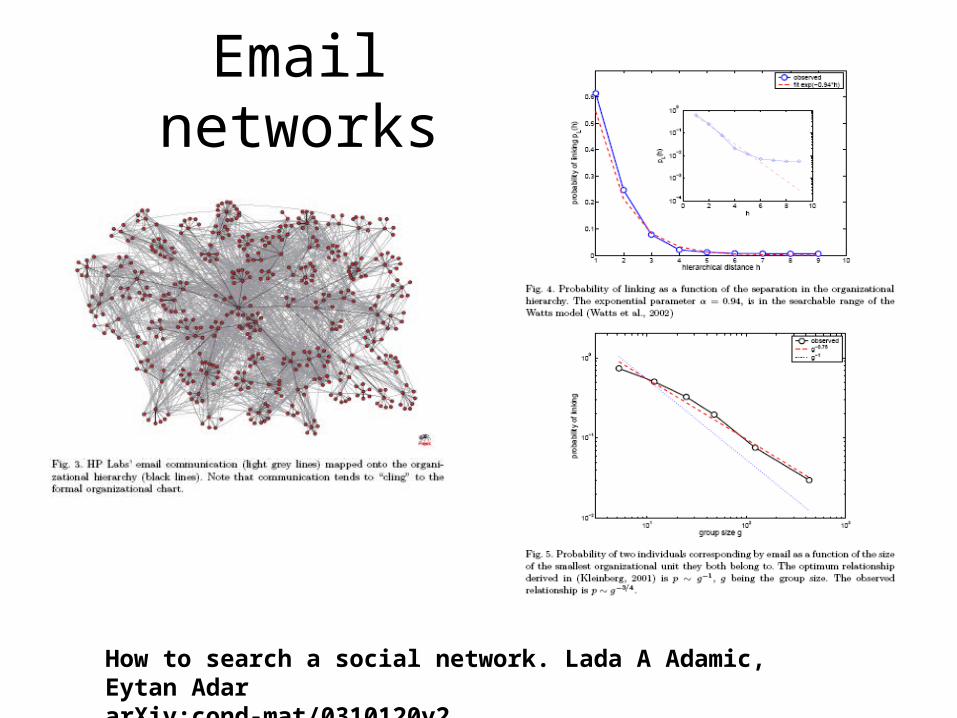
Email networks
How to search a social network. Lada A Adamic, Eytan AdararXiv:cond-mat/0310120v2


![Michael I. Pupin: From Immigrant to Inventor [1924]](https://static.fdocuments.us/doc/165x107/547c15c7b4af9f670e8b4a9e/michael-i-pupin-from-immigrant-to-inventor-1924.jpg)