Computer Systems Performance Analysis and … · Computer Systems Performance Analysis and...
21
12.12.02 - 1 37-235 Perf.Eval.&Benchmarking © Stricker, Kurmann Computer Systems Performance Analysis and Benchmarking (37-235) Analytic Modeling Simulation Measurements / Benchmarking Lecture/Assignments/Projects: Dipl. Inf. Ing. Christian Kurmann Textbook: Raj Jain, “The Art of Computer Systems Perfor- mance Analysis”, 1991 Wiley & Sons, New York Topic of Today: • Introduction Experimental Design •2 k Factorial Design •2 k r Factorial Design
Transcript of Computer Systems Performance Analysis and … · Computer Systems Performance Analysis and...

12.12.02 - 1 37-235 Perf.Eval.&Benchmarking © Stricker, Kurmann
Computer Systems PerformanceAnalysis and Benchmarking
(37-235)
Analytic ModelingSimulation
Measurements / Benchmarking
Lecture/Assignments/Projects:Dipl. Inf. Ing. Christian Kurmann
Textbook:Raj Jain, “The Art of Computer Systems Perfor-mance Analysis”, 1991 Wiley & Sons, New York
Topic of Today:
• Introduction Experimental Design
• 2k Factorial Design
• 2kr Factorial Design
12.12.02 - 2 37-235 Perf.Eval.&Benchmarking © Stricker, Kurmann
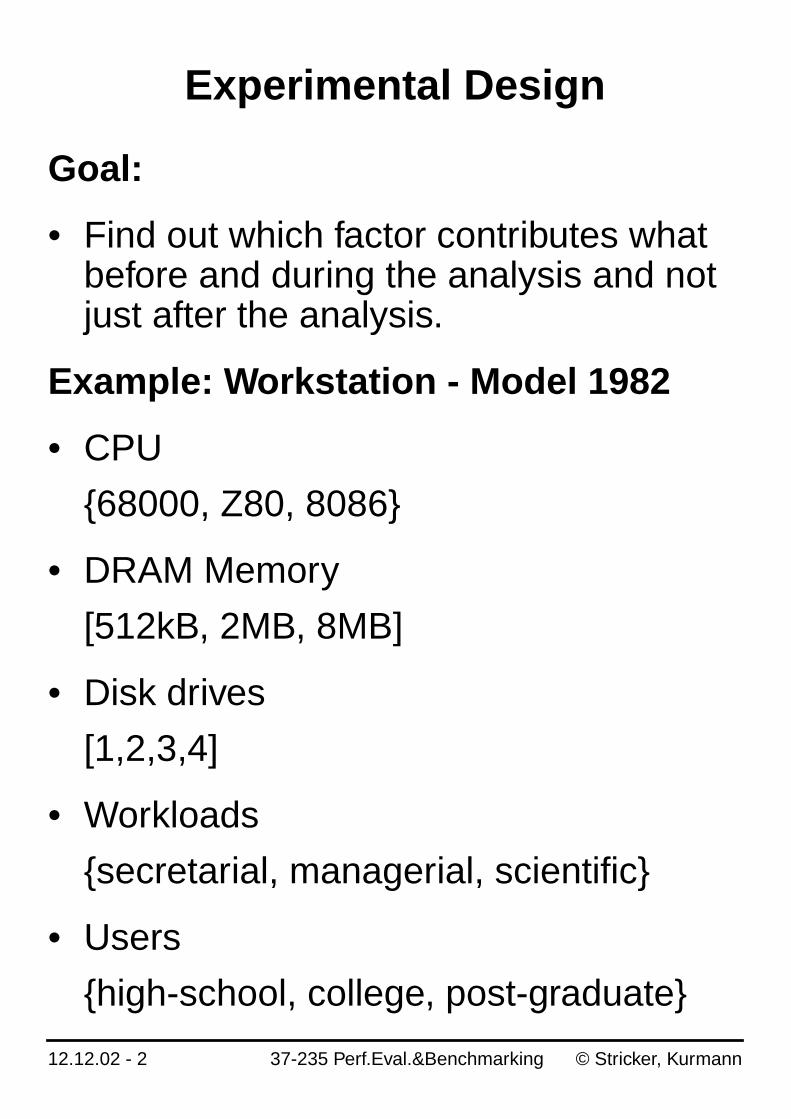
Experimental Design
Goal:
• Find out which factor contributes whatbefore and during the analysis and notjust after the analysis.
Example: Workstation - Model 1982
• CPU
{68000, Z80, 8086}
• DRAM Memory
[512kB, 2MB, 8MB]
• Disk drives
[1,2,3,4]
• Workloads
{secretarial, managerial, scientific}
• Users
{high-school, college, post-graduate}
12.12.02 - 3 37-235 Perf.Eval.&Benchmarking © Stricker, Kurmann
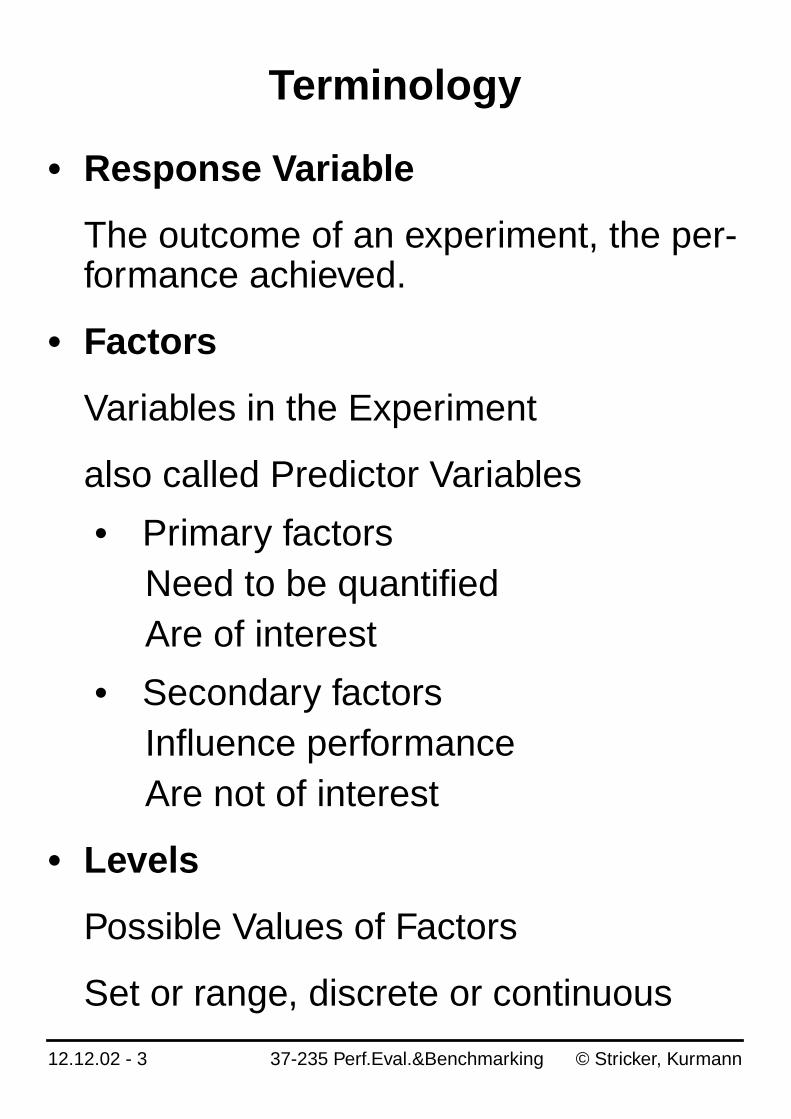
Terminology
• Response Variable
The outcome of an experiment, the per-formance achieved.
• Factors
Variables in the Experiment
also called Predictor Variables
• Primary factorsNeed to be quantifiedAre of interest
• Secondary factorsInfluence performanceAre not of interest
• Levels
Possible Values of Factors
Set or range, discrete or continuous
12.12.02 - 4 37-235 Perf.Eval.&Benchmarking © Stricker, Kurmann
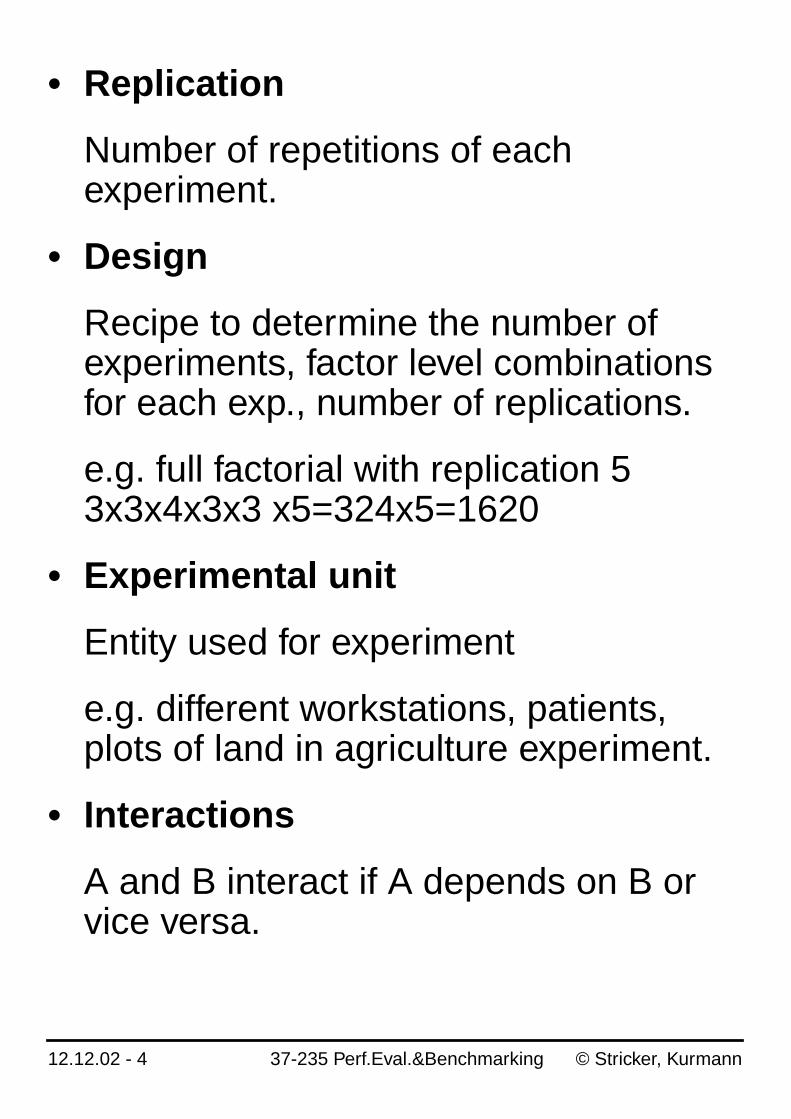
• Replication
Number of repetitions of eachexperiment.
• Design
Recipe to determine the number ofexperiments, factor level combinationsfor each exp., number of replications.
e.g. full factorial with replication 53x3x4x3x3 x5=324x5=1620
• Experimental unit
Entity used for experiment
e.g. different workstations, patients,plots of land in agriculture experiment.
• Interactions
A and B interact if A depends on B orvice versa.
12.12.02 - 5 37-235 Perf.Eval.&Benchmarking © Stricker, Kurmann
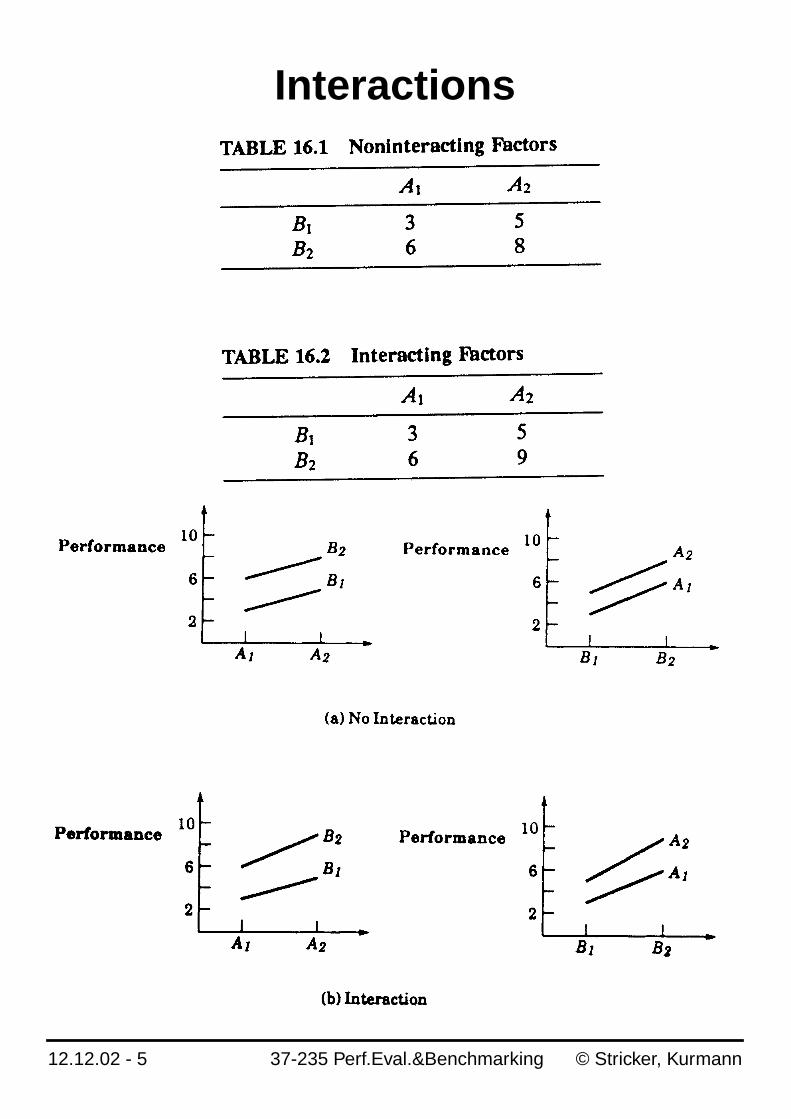
Interactions
12.12.02 - 6 37-235 Perf.Eval.&Benchmarking © Stricker, Kurmann
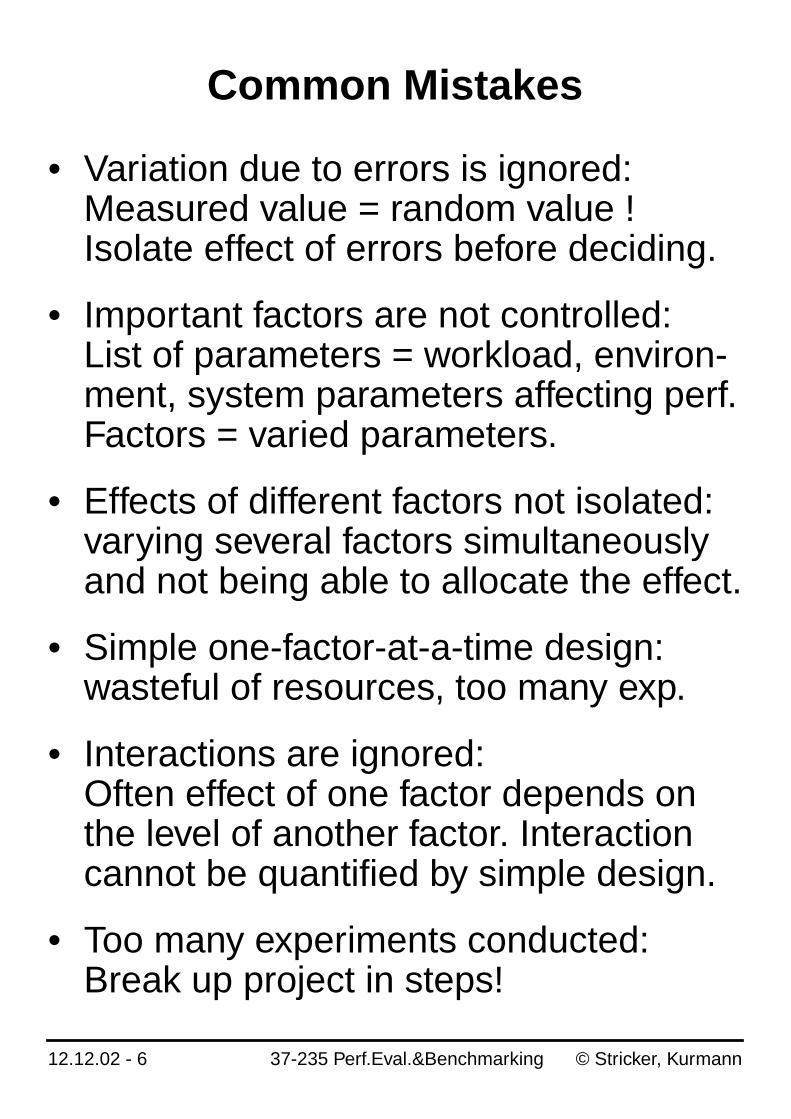
Common Mistakes
• Variation due to errors is ignored:Measured value = random value !Isolate effect of errors before deciding.
• Important factors are not controlled:List of parameters = workload, environ-ment, system parameters affecting perf.Factors = varied parameters.
• Effects of different factors not isolated:varying several factors simultaneouslyand not being able to allocate the effect.
• Simple one-factor-at-a-time design:wasteful of resources, too many exp.
• Interactions are ignored:Often effect of one factor depends onthe level of another factor. Interactioncannot be quantified by simple design.
• Too many experiments conducted:Break up project in steps!
12.12.02 - 7 37-235 Perf.Eval.&Benchmarking © Stricker, Kurmann
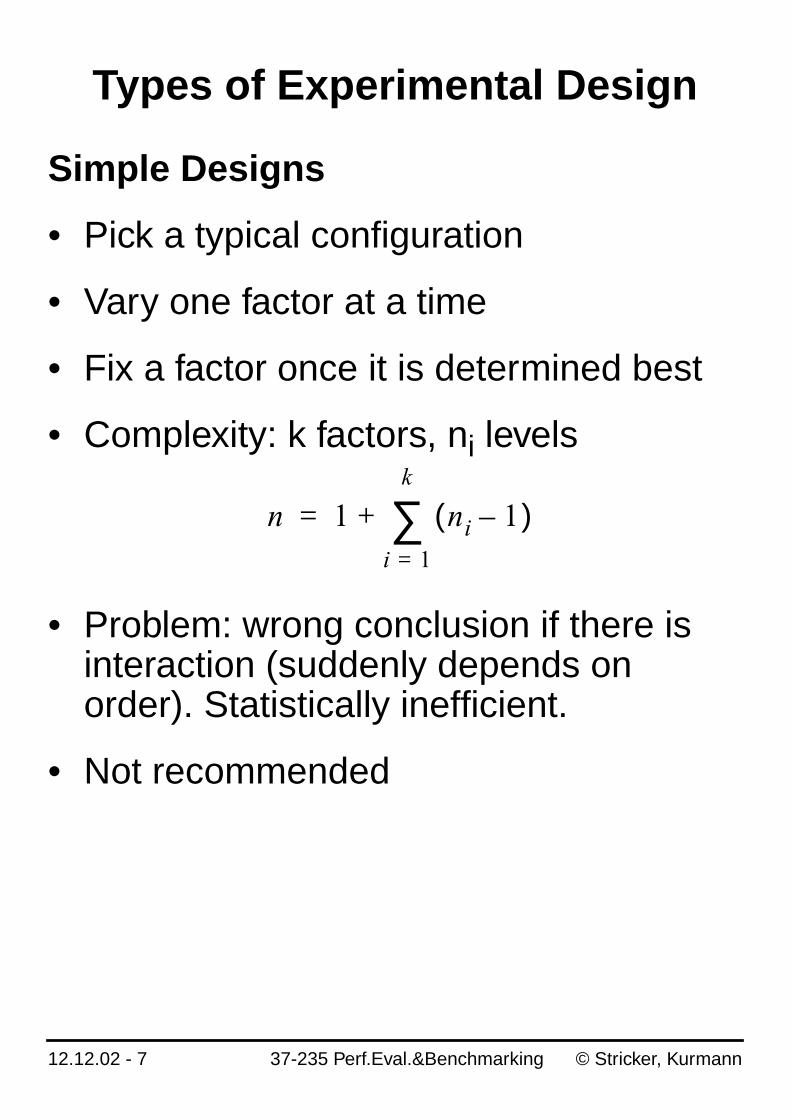
Types of Experimental Design
Simple Designs
• Pick a typical configuration
• Vary one factor at a time
• Fix a factor once it is determined best
• Complexity: k factors, ni levels
• Problem: wrong conclusion if there isinteraction (suddenly depends onorder). Statistically inefficient.
• Not recommended
n 1 ni 1–( )i 1=
k
∑+=
12.12.02 - 8 37-235 Perf.Eval.&Benchmarking © Stricker, Kurmann
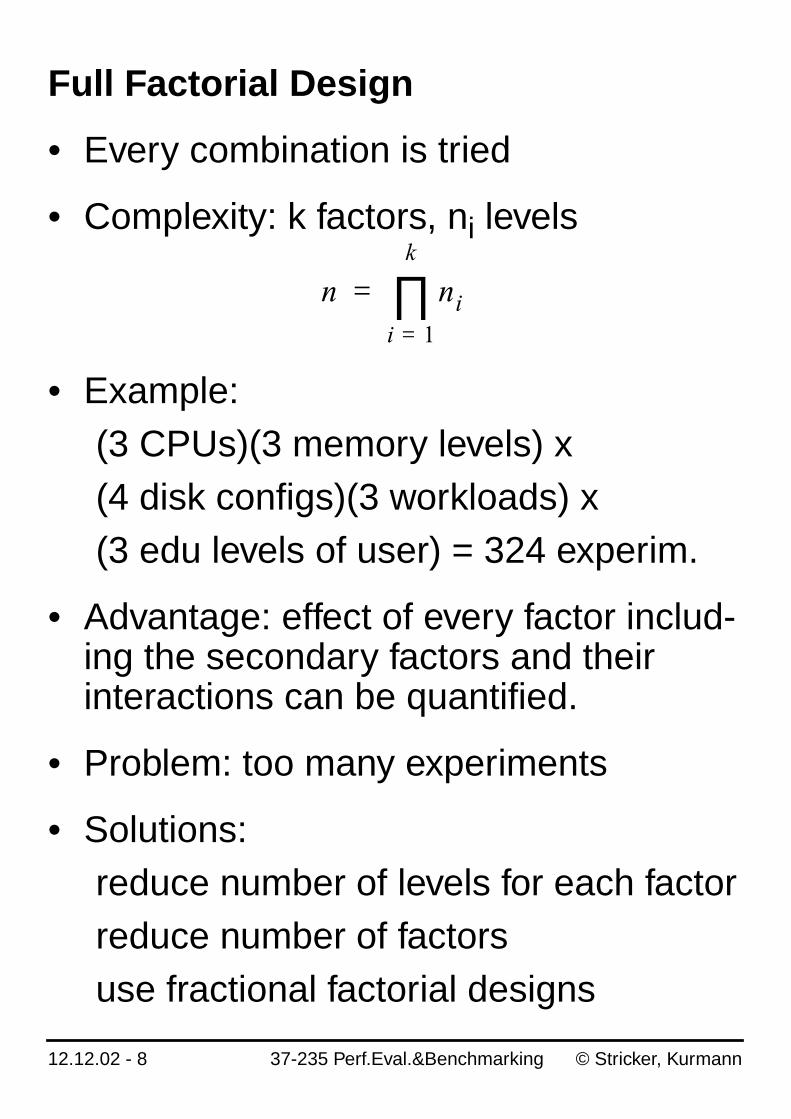
Full Factorial Design
• Every combination is tried
• Complexity: k factors, ni levels
• Example:(3 CPUs)(3 memory levels) x(4 disk configs)(3 workloads) x(3 edu levels of user) = 324 experim.
• Advantage: effect of every factor includ-ing the secondary factors and theirinteractions can be quantified.
• Problem: too many experiments
• Solutions:reduce number of levels for each factorreduce number of factorsuse fractional factorial designs
n nii 1=
k
∏=
12.12.02 - 9 37-235 Perf.Eval.&Benchmarking © Stricker, Kurmann
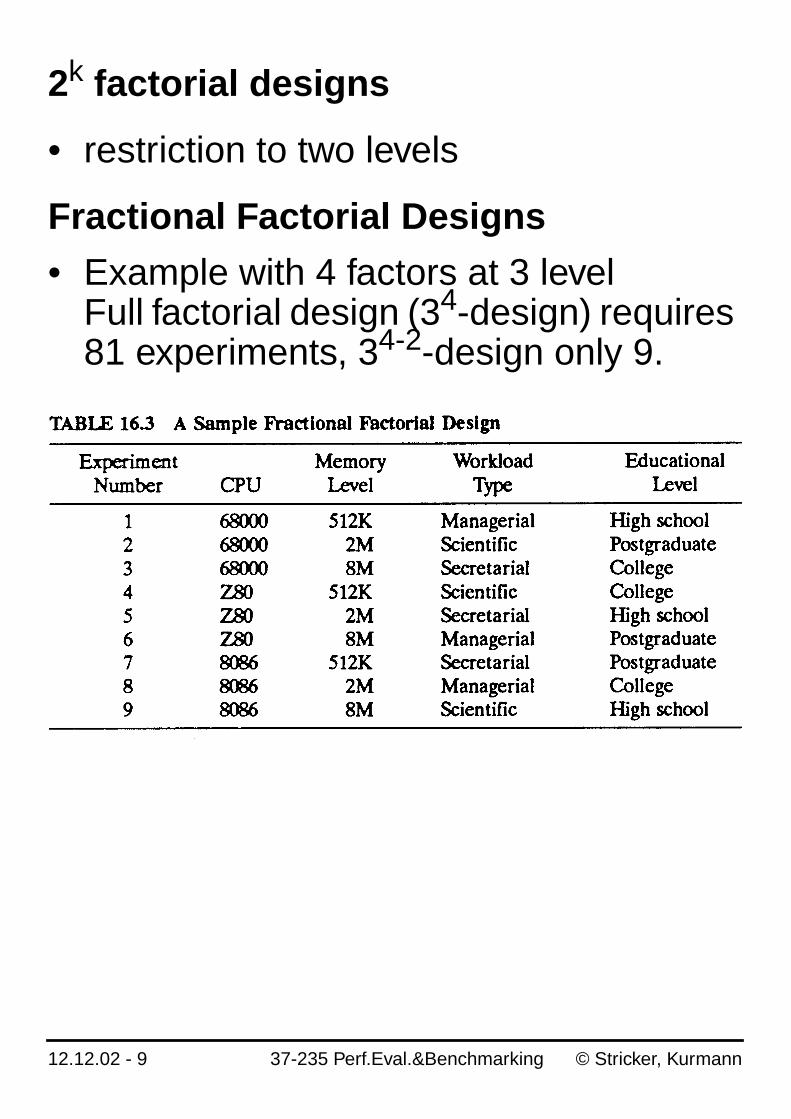
2k factorial designs
• restriction to two levels
Fractional Factorial Designs
• Example with 4 factors at 3 levelFull factorial design (34-design) requires81 experiments, 34-2-design only 9.
12.12.02 - 10 37-235 Perf.Eval.&Benchmarking © Stricker, Kurmann
2k Factorial Designs
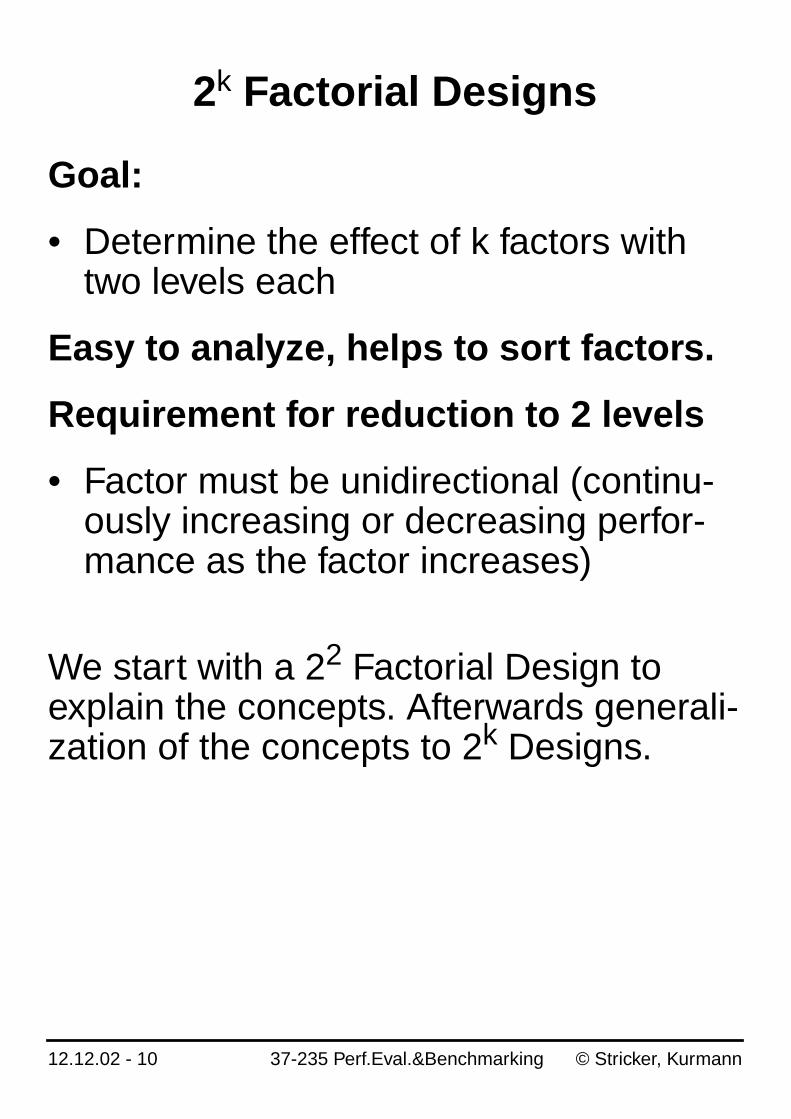
Goal:
• Determine the effect of k factors withtwo levels each
Easy to analyze, helps to sort factors.
Requirement for reduction to 2 levels
• Factor must be unidirectional (continu-ously increasing or decreasing perfor-mance as the factor increases)
We start with a 22 Factorial Design toexplain the concepts. Afterwards generali-zation of the concepts to 2k Designs.
12.12.02 - 11 37-235 Perf.Eval.&Benchmarking © Stricker, Kurmann
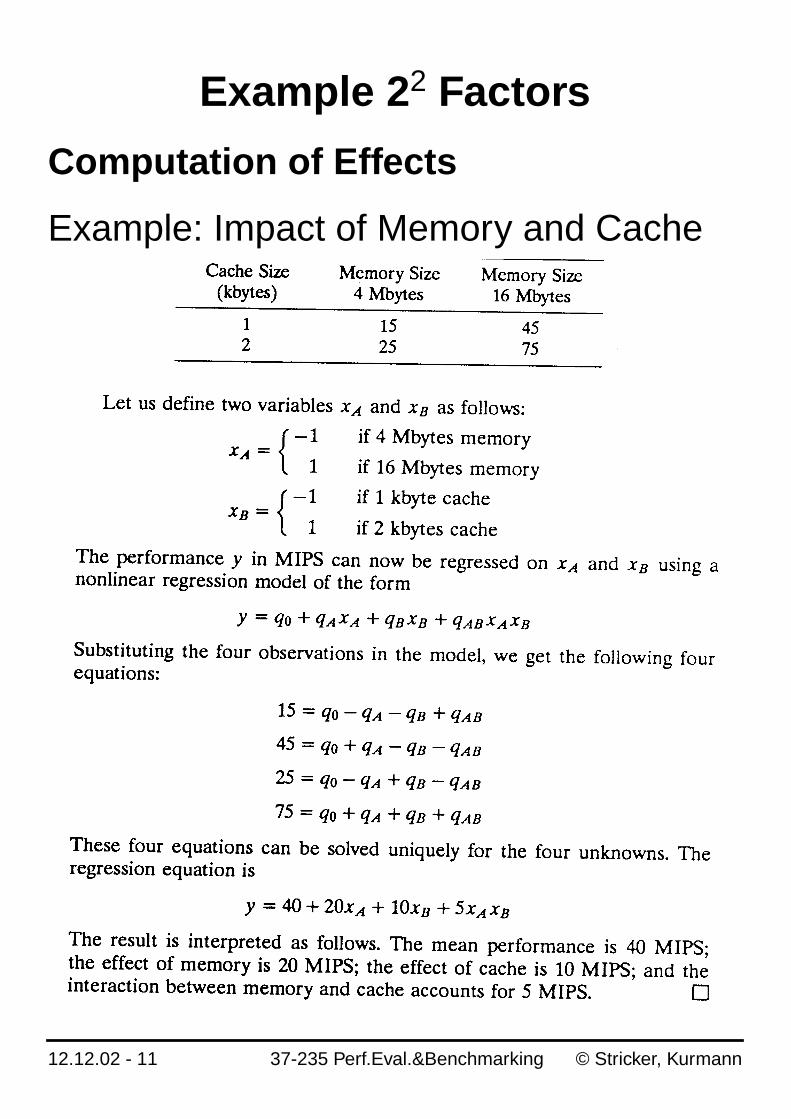
Example 22 Factors
Computation of Effects
Example: Impact of Memory and Cache
12.12.02 - 12 37-235 Perf.Eval.&Benchmarking © Stricker, Kurmann
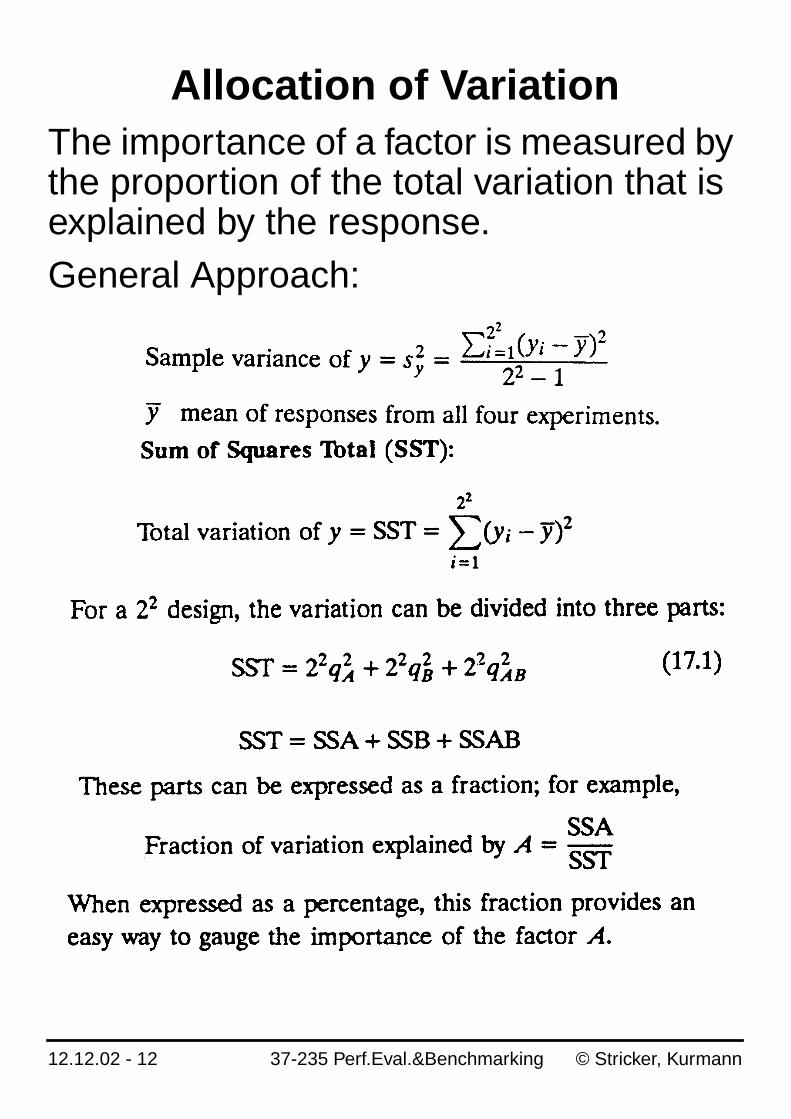
Allocation of VariationThe importance of a factor is measured bythe proportion of the total variation that isexplained by the response.General Approach:
12.12.02 - 13 37-235 Perf.Eval.&Benchmarking © Stricker, Kurmann
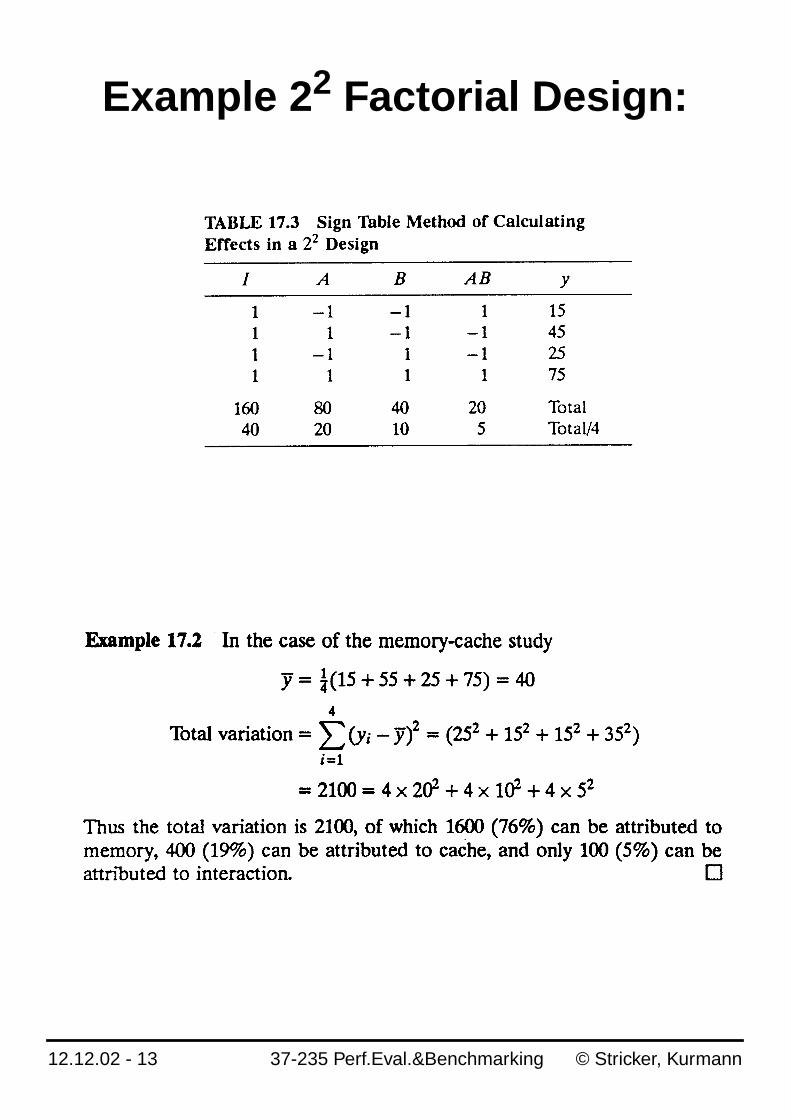
Example 22 Factorial Design:
12.12.02 - 14 37-235 Perf.Eval.&Benchmarking © Stricker, Kurmann
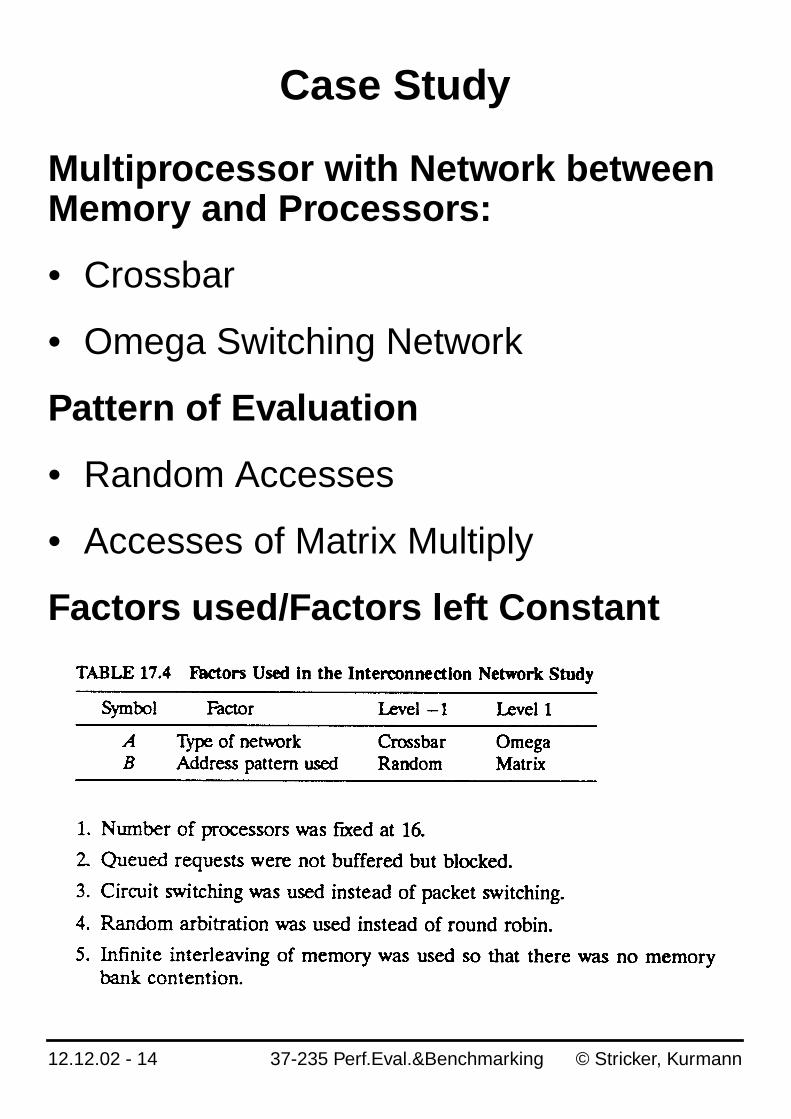
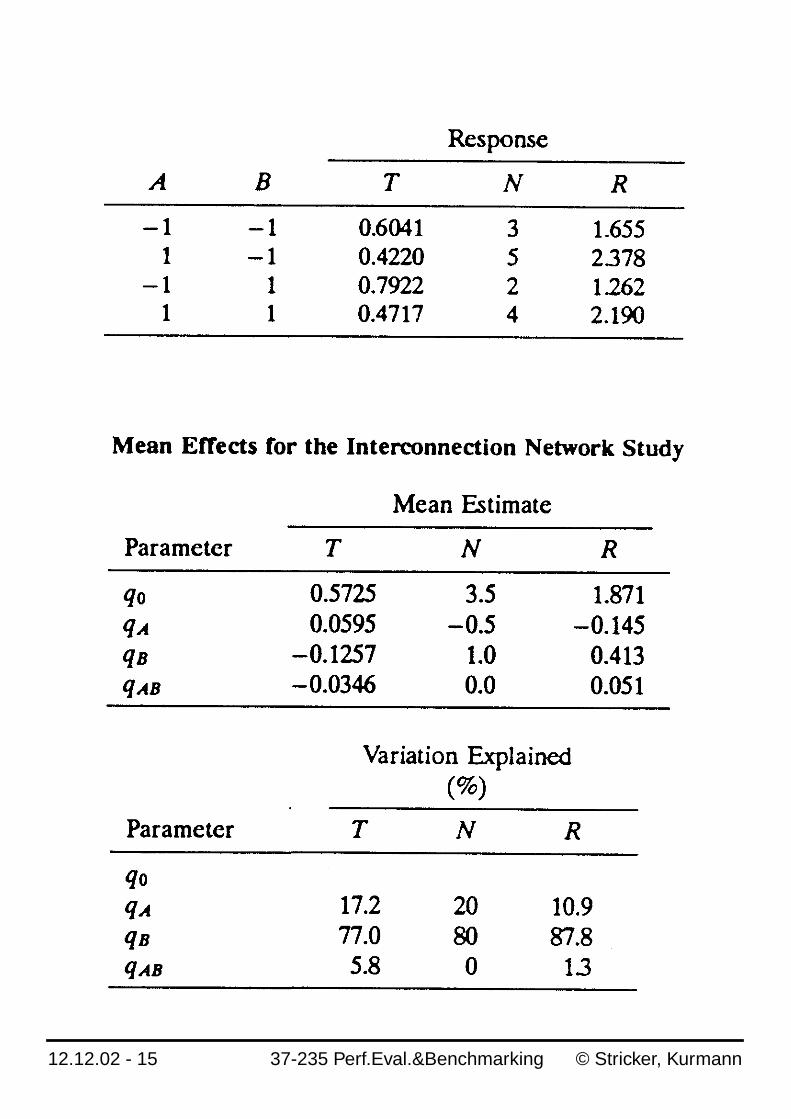
Case Study
Multiprocessor with Network betweenMemory and Processors:
• Crossbar
• Omega Switching Network
Pattern of Evaluation
• Random Accesses
• Accesses of Matrix Multiply
Factors used/Factors left Constant
12.12.02 - 15 37-235 Perf.Eval.&Benchmarking © Stricker, Kurmann
12.12.02 - 16 37-235 Perf.Eval.&Benchmarking © Stricker, Kurmann
2kr Factorial Designwith Replication
The problem with 2k factorial designsis that the error cannot be estimated.By repeating the measurements under thesame factor-level allows quantifying theerror.A 2kr-design is a 2k-design that is repea-ted r times. This leads to 2kr observations.
12.12.02 - 17 37-235 Perf.Eval.&Benchmarking © Stricker, Kurmann
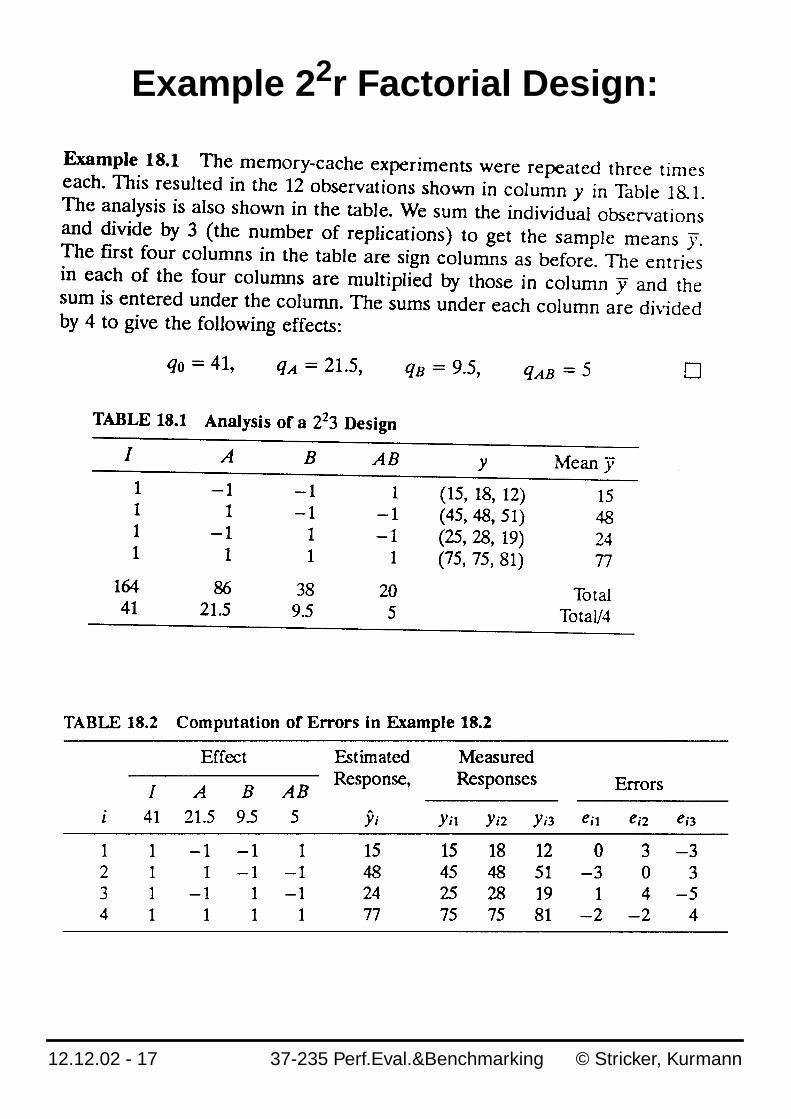
Example 22r Factorial Design:
12.12.02 - 18 37-235 Perf.Eval.&Benchmarking © Stricker, Kurmann
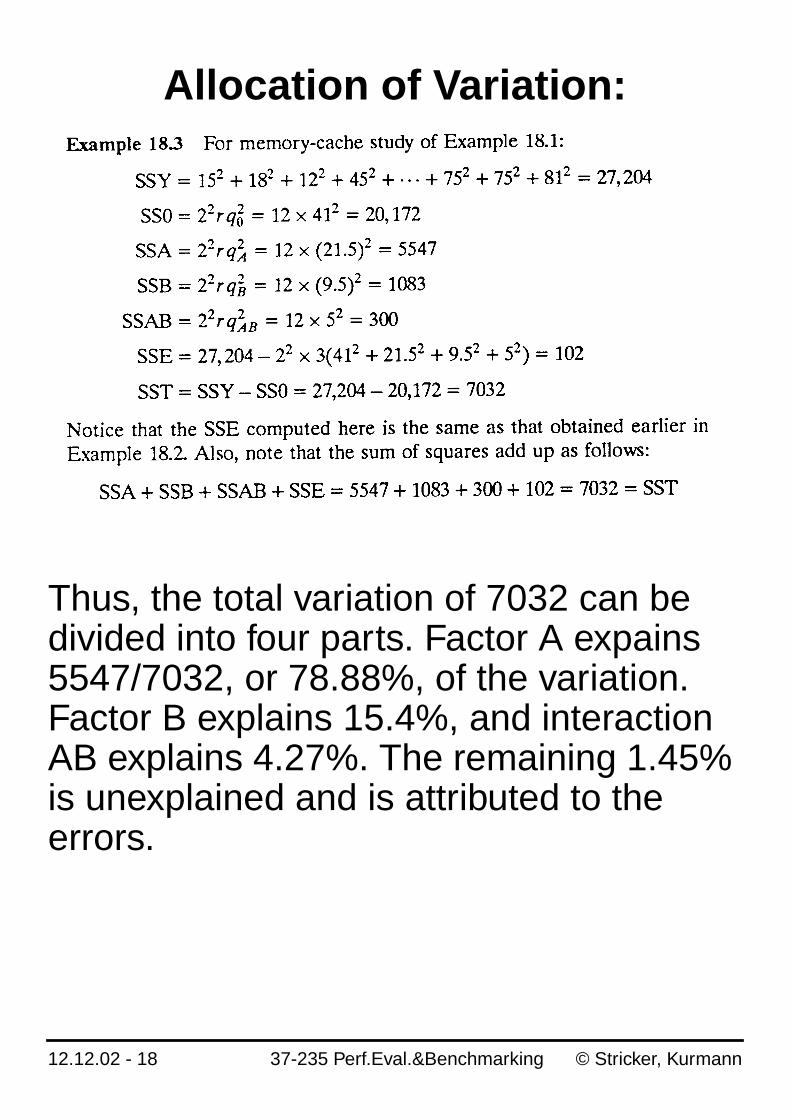
Allocation of Variation:
Thus, the total variation of 7032 can bedivided into four parts. Factor A expains5547/7032, or 78.88%, of the variation.Factor B explains 15.4%, and interactionAB explains 4.27%. The remaining 1.45%is unexplained and is attributed to theerrors.
12.12.02 - 19 37-235 Perf.Eval.&Benchmarking © Stricker, Kurmann
Visual Test for Assumptions
• Model errors statistically independent
• Model errors additive
• Errors normally distributed
• Errors have const. Std.Dev.
• Effects of Factors are additive
Independence of Errors (IID)
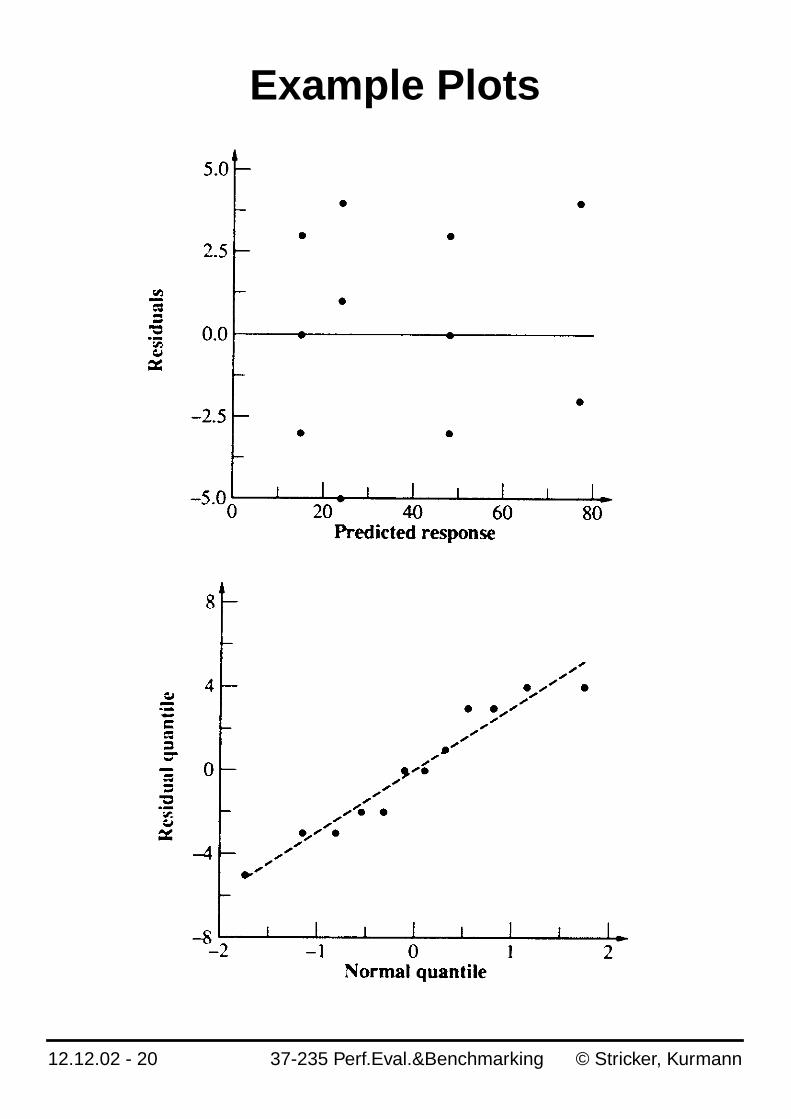
• compute residuals
• scatter plot
Normal Distribution of Errors
• quantile/quantile plot
Constant Std.Dev. of Errors
• y vs. various levels of factor
12.12.02 - 20 37-235 Perf.Eval.&Benchmarking © Stricker, Kurmann
Example Plots
12.12.02 - 21 37-235 Perf.Eval.&Benchmarking © Stricker, Kurmann
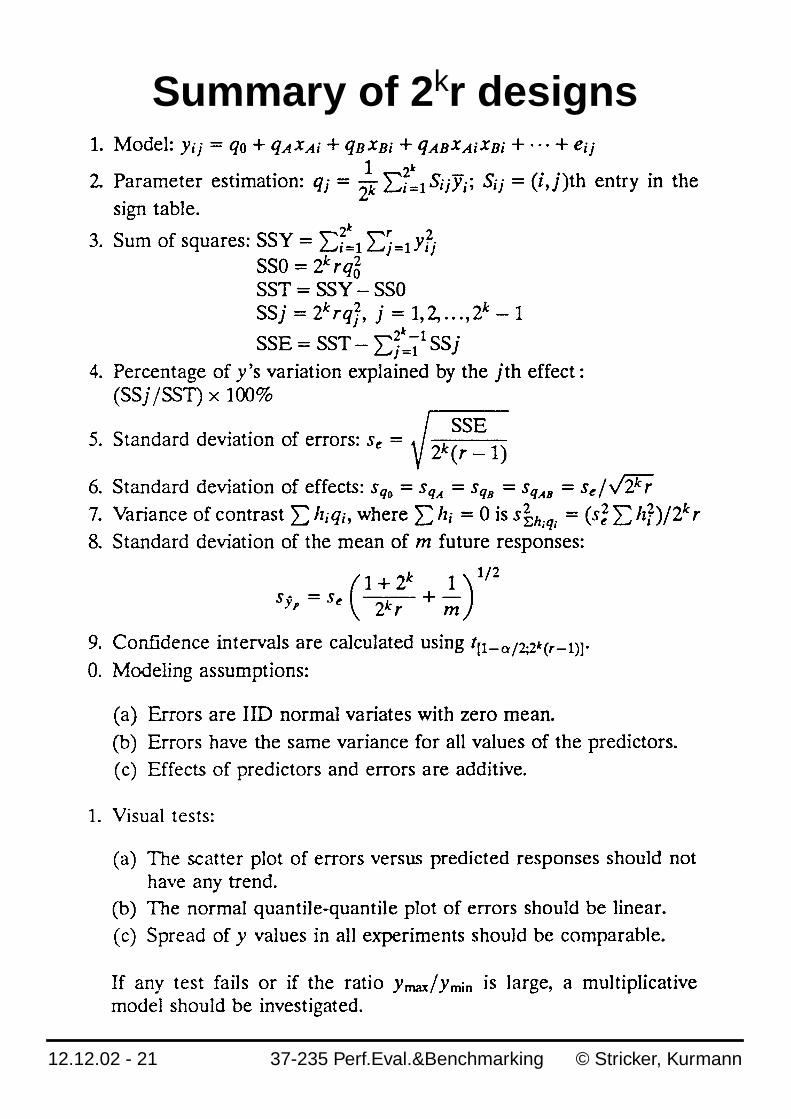
Summary of 2kr designs