Computer Simulation for Rafting Traffic on the Colorado ...
22
Page 1 of 22 Computer Simulation for Rafting Traffic on the Colorado River, C. A. Roberts and H. R. Gimblett, Proc. 5th Conf. Research on Colorado Plateau, USGS, 2001, 19 – 30. Computer Simulation for Rafting Traffic on the Colorado River Catherine A. Roberts Associate Professor Department of Mathematics and Computer Science College of the Holy Cross Worcester, Massachusetts, USA 01610 and Randy Gimblett Associate Professor School of Renewable Natural Resources The University of Arizona Tucson, Arizona, USA 85721
Transcript of Computer Simulation for Rafting Traffic on the Colorado ...

Page 1 of 22
Computer Simulation for Rafting Traffic on the Colorado River, C. A. Roberts and H. R.Gimblett, Proc. 5th Conf. Research on Colorado Plateau, USGS, 2001, 19 – 30.
Computer Simulation for Rafting Traffic on the Colorado River
Catherine A. Roberts
Associate Professor
Department of Mathematics and Computer Science
College of the Holy Cross
Worcester, Massachusetts, USA 01610
and
Randy Gimblett
Associate Professor
School of Renewable Natural Resources
The University of Arizona
Tucson, Arizona, USA 85721

Page 2 of 22
Abstract
A computer program called the Grand Canyon River Trip Simulator (GCRTSim) has been
developed for use by managers at the Grand Canyon National Park. GCRTSim consists of a
database and a simulator, as well as extensive analysis tools. The database will eventually
contain approximately 500 trip diaries collected in 1998 and 1999 that report stops for activities
and camping along the 226 mile Colorado River corridor within the purview of the National Park
Service. The simulator provides users with the opportunity to set up prospective launch
schedules for rafting trips and to simulate rafting seasons using these launch calendars. Both the
trip diary database and the results of the simulations can be analyzed using extensive graphing
tools. The analysis can provide insight into use levels that could impact both the recreational
experiences and the treasured resources along the Colorado River corridor.
Key Words Colorado River, Simulation, Grand Canyon National Park, Rafting, Management,
Launch Schedule, Model

Page 3 of 22
Introduction
The 1989 Colorado River Management Plan (CRMP, 1989) governs the recreational rafting
traffic on the Colorado River within the Grand Canyon National Park. This document sets limits
on use and is the guiding document for Park managers in charge of supervising and governing
both commercial and noncommercial use of the river for rafting purposes. To help supplement
the ability of managers to understand the complex human-environment interactions in this
setting, a team of faculty and students from the University of Arizona's School of Renewable
Natural Resources and from Northern Arizona University's Department of Mathematics and
Statistics have worked since April 1998 on the Grand Canyon River Trip Simulator Project
(GCRTSim) (see Bieri 2001, Cherry 1997, Gimblett et. al. 2000).
The goal of GCRTSim is two fold -- to improve understanding of the current conditions and to
predict the possible outcomes of changes to the current set of regulations guiding river rafting
traffic. First, we collected trip diaries from rafting parties and we used these data, for example,
to inform the Park Service about the frequency of use of various camping and attraction sites.
The data from these trip reports, coupled with extensive expert interviews, informed the
development of an artificial-intelligence and statistical-based computer simulation model of
rafting traffic along the Colorado River (see Brian & Thomas 1985, Jalbert 1990, 1992, 1992,
1993, Kaplinski et. al. 1998, Kearsley & Quarteroli 1997, O’Brien et. al. 1997, O’Brien &
Roberts 2000, Roberts 1998, Shelby & Nielsen 1976a, 1976b, 1976c, 1976d). The simulator can
approximate the behavior of rafting trips under a wide range of natural or imposed conditions.
GCRTSim can thus consider an imaginary launch schedule or a proposed set of new regulations

Page 4 of 22
and simulate several season's worth of river trips. The resultant data can subsequently be
analyzed to provide insight into the potential consequences of the imaginary launch schedule or
proposed set of new regulations. The intent is to provide the Park Service managers with more
information about the existing conditions on the Colorado River, as well as enable them to gain
insight into the potential consequences of any new management actions under consideration.
Computers have provided a venue for investigating human recreational use since the mid-1970’s
(see Bishop & Gimblett 1999, Borkan & Underhill 1989, Schechter 1975, Schechter & Lucus
1978, Underhill et. al. 1986, Van Wagendonk 1979). With recent advances in computing and the
development of artificial intelligence algorithms, the potential to make real progress in this area
has grown immensely. While it is a natural next step in the management of natural resources to
take advantage of the potential offered by these recent advances, to date little has been done in
this arena. Some recent work has developed a related intelligent-agent based program to study
the interactions between jeep tours, bicyclists and hikers in a recreational setting in Sedona AZ in
(Gimblett et al 1996). Our efforts have been to design a computer simulation model that
examines the complex interactions between humans and the natural environment. Each rafting
trip is an intelligent agent, that is, it is imbued with the intelligence to respond dynamically to its
environment and to modify its plans accordingly. This represents a new approach for managers
in the National Park system, in that we are able to combine statistical analysis, artificial
intelligence and tools from mathematical modeling in a cutting edge fashion. Our efforts reported
here represent a contribution to this new era of sophisticated computer models.

Page 5 of 22
In the GCRTSim project, we have used a large data set, statistical analysis, as well as artificial-
intelligence techniques such as fuzzy logic have been used in combination. The GCRTSim
computer simulation is a new approach for providing natural resource managers with the ability
to set up alternative management scenarios and witness the potential outcomes of those changes
on the system.
Methods
The first step was to collect data -- not only to understand the popularity of various camping and
attraction sites along the Colorado River corridor, but also to understand the reasoning and logic
employed by trip leaders when executing their trips. We needed to have as detailed a picture of
the use patterns on the river, as well as an understanding of how various trip leaders make
decisions about where to stop, when to stop, and how long to remain at a given location.
In 1998 and 1999, trip leaders were asked to complete trip itineraries. These trip reports listed
the time in and time out for every reasonable location -- we identified 250 sites between the
launching area at Lees Ferry and Diamond Creek (the location where the National Park Service
stops monitoring people and activity on the Colorado River). Approximately 500 trip diaries
were collected, representing about a 50 per cent return rate for the commercial trips and a 30 per
cent return rate for the private trips over the collection period. The trip diaries represent trips of
all lengths and propulsion types (motorized, non-motorized).

Page 6 of 22
To help gain support for assisting in this data collection effort, the authors worked with various
constituent groups. To reach private boaters, presentations were given at the annual meetings the
Grand Canyon Private Boater Association and subsequently, email notification was sent to their
membership encouraging participation in our study. Moreover, the permit office at the Grand
Canyon National Park also sent information directly to permit holders. At orientation on the day
of launch, the ranger at Lees Ferry provided materials to the permit holders. To reach the
commercial trips, presentations were given at meetings of the Grand Canyon River Outfitters
Association. The outfitters made individual decisions as to how to implement their support of
this project. Some, for example, required their guides to complete trip reports. Others
distributed the trip reports to their guides with a request to participate. The authors also met with
the Grand Canyon River Outfitters Association to solicit the support of the river guide
community. A summary of the meeting dates and locations can be found at
http://jan.ucc.nau.edu/~car/msl. Although completing the trip diaries was optional, we recognize
that the data collected is, nonetheless, far more comprehensive than anything previously
available. A statistical analysis is currently underway to determine more precisely how
representative and reasonable this database of trip reports is.
During 1998, extensive interviews were conducted with over fifteen river guides. These guides
were identified by the Grand Canyon River Outfitters Association, the Private Boaters
Association and the Grand Canyon River Guides Association. These guides collectively
represented many years of experience running the Colorado River either privately (non-
commercially) or as guides for commercial outfitters. They had experience at various river flow
regimes and with all types of watercraft (oars, paddle boats, dories, motor boats). The intent of

Page 7 of 22
the interviews was to learn as much as possible about the logic employed by a river guide when
taking a trip down the Colorado River. Questions were open-ended and extensive. For example,
to understand how a guide might choose a campsite we asked questions such as, "When do you
start thinking about camping for the evening?", "What campsites do you like and why; which
ones do you try to avoid and why?", "List every factor that goes into the selection process of
choosing a campsite and explain why each factor is important.". The result was a complex
matrix of possibilities for campsite selection based on every imaginable scenario or situation that
might be faced by a river guide. The scenarios could either be the result of human interactions
and decisions, or they could be the result of responding to the natural environment. For example,
a trip might avoid a campsite because a conversation earlier in the day revealed that another trip
was planning to select that site (result of a human interaction and decision) or, alternatively, a
trip might avoid a campsite because when they arrive a recent rainfall has rendered the campable
area too small for their group size (result of responding to the natural environment).
The simulation engine of the program represents a hybrid program that uses both statistical data
from the trip diary database along with artificial intelligence algorithms developed from the
expert interview process. As development of the simulation engine proceeded, additional
analysis of the database or additional querying of expert guides have been utilized as needed.
The simulation engine is constructed as an object-oriented system that uses elements of fuzzy
logic in the decision structure (see Gimblett et. al. 2000, Manneville et al 1989, Reghis &
Raventa 1998, Tecuci & Dybala 1998). Fuzzy logic is an artificial intelligence construct that
permits a decision to be made by weighing several factors or variables in an appropriate manner.
Fuzzy logic theory provides a robust and full range of decision-making tools that are suitable for

Page 8 of 22
capturing much of the nuance inherent in making complex decisions in the natural environment
of the Colorado River. For example, when a trip is choosing a campsite, the current conditions
of the river and the individual trip play a role, as does the historical popularity of a campsite
under consideration. Fuzzy logic takes into account all these factors and weighs them
appropriately so that each trip's campsite decision represents a reasonable outcome for that given,
particular set of circumstances.
The simulation engine reads in a launch schedule (that could represent the current launch
schedule or a prospective calendar created by the user) then creates and launches the trips from
Lees Ferry. These simulated trips execute their days on the river by choosing attraction sites for
hikes or other activities, by stopping for lunch, and by selecting an appropriate campsite each
night. Certain trips must be at given locations on certain times (e.g. some trips exchange
passengers at Phantom Ranch) and the trips are managed by the simulator to meet these fixed
points as scheduled. Moreover, a sophisticated planning algorithm helps each simulated trip plan
out an optimal schedule that will, for example, include stops at the key attraction sites and ensure
that campsite selections are appropriate. A comprehensive record is kept for each simulated trip.
This record includes, for example, where and when it encounters other trips, where it chooses to
engage in an activity or to stop to camp and the duration of time spent engaged in each activity
or camp stop.
After running a simulation, the created database can be queried to investigate the outcome of that
particular launch schedule. For example, one could query the top ten attraction sites and
compare the simulation output with the data from the real 1998 and/or 1999 trip diaries to

Page 9 of 22
observe any changes. There are a number of standard and non-standard queries possible to help
the user of GCRTSim judge whether the outcome of a simulation represents an improvement or
not over the current conditions in the Grand Canyon National Park.
GCRTSim has the ability to run simulations representing new prospective launch calendars. It is
also possible for the user to manipulate other conditions along the river corridor. For example,
the user could restrict camping or activities at any number of sites. In this instance, a user could
compare data from, for example, the 1998 trip diaries as well as from simulations run off of the
1998 launch schedule both with or without the added camping/activity restrictions. A judgement
could then be made about the possible consequences of such a management action on the
dynamics of the river rafting traffic in the Colorado River corridor.
Results
GCRTSim allows for numerous types of graphs and charts from a database (real or simulated) to
help give the user insight into Colorado River rafting traffic dynamics. To help illustrate some
of the uses for GCRTSim, it is important to note that the trip report database itself represents a
wealth of valuable information. To date, only the 1998 trip reports are available for analysis.
Not only is it useful to examine the "real data" from the trip reports, but comparisons are also
possible between this "real data" and various simulation runs. Simulations were run using a
launch calendar judged as a typical schedule under the 1989 Colorado River Management Plan.
Simulations were run at both 100 per cent use levels and then again at 50 per cent use level.

Page 10 of 22
Comparisons were made between the simulations and the real data and are presented here. .It
must be noted that the 1998 trip reports represented an approximate 40 per cent of the actual
launches, whereas a simulation of 100 per cent use level represents a complete launch calendar.
At the 50 per cent use levels, about half of the launches were removed from the standard launch
calendar. This involved some judgements, but for the most part, the 50 per cent use launch
schedule represents an even cut of all trip types, considering such features as propulsion type,
commercial/private, and trip length.
The authors caution the reader that the results presented here are illustrative only. It would be
unwise to draw conclusions regarding the management of the launch schedule based on the
graphs presented in this paper. First of all, the 100 per cent and 50 per cent use levels were
created somewhat arbitrarily and can’t be presumed to illustrate scenarios that would be worthy
of serious consideration. Secondly, in order to evaluate the potential impact of an alternative
scenario (such as a 50 per cent use level), it is necessary to examine multiple outputs from the
simulation model – only a few such indicators are presented here. The point of this exercise is
simply to illustrate the types of output that are made available to a user of the simulation model.
To illustrate the type of output that is available, for example, a user can compare the popularity
of key attraction and camping sites along the river corridor. In Fig. 1, the most popular attraction
sites are presented from each of three data sets: the “real” data from the 1998 trip reports and the
“simulated” data from both 100 per cent and 50 per cent use levels. It is not surprising that key
attraction sites remain popular regardless of the number of trips on the river. One can see that
the simulated trips are choosing the same top attraction sites, but at a lower frequency than that
Page 11 of 22
reported in the real data. Some of this error can be explained by the fact that the real data does
not represent a full river. Still, efforts are underway to refine the model to better reflect the
current conditions on the river. Data such as is presented in Fig. 1 provides some insight into
how reducing the number of launches might affect the selection of attraction sites. Again, the
historical popularity of these sites keep them as key attraction sites regardless of the use level,
although the amount of use that these sites experience does change. It is interesting to note that
this same dynamic does not hold for campsites. While the popularity of some campsites remain
high under any use level, others fall into less use when there is less competition on the river.
An important distinction between the "real data" and the "simulated data" can be viewed by
examining Fig. 2 and Fig. 3. In each case, the graph shows the distribution of all trips along the
river corridor on a particular day. The horizontal axis shows the river mile, the vertical axis
shows the number of trips that reported being at each location on that particular day. In Fig. 2,
the data shows only the "real data" from the trip reports collected from one day. Clearly, several
trips were on the river that day but we did not receive a trip report from each one of them. In
Fig. 3, the distribution of a complete launch schedule simulation is given for one day. While it
does not match up perfectly with the trip diary data, it still gives a sense for the distribution of
parties along the river corridor. Note that the real data is incomplete, whereas the simulated data
represents a complete scenario where every trip is represented. This explains why there are so
many more trips represented on the graphs of simulated data over ones of real data alone. The
higher peaks represent more trips having been at those locations on that same day. A closer
analysis of these peaks can lead to insights about contacts between parties and congestion at
certain key attraction sites.

Page 12 of 22
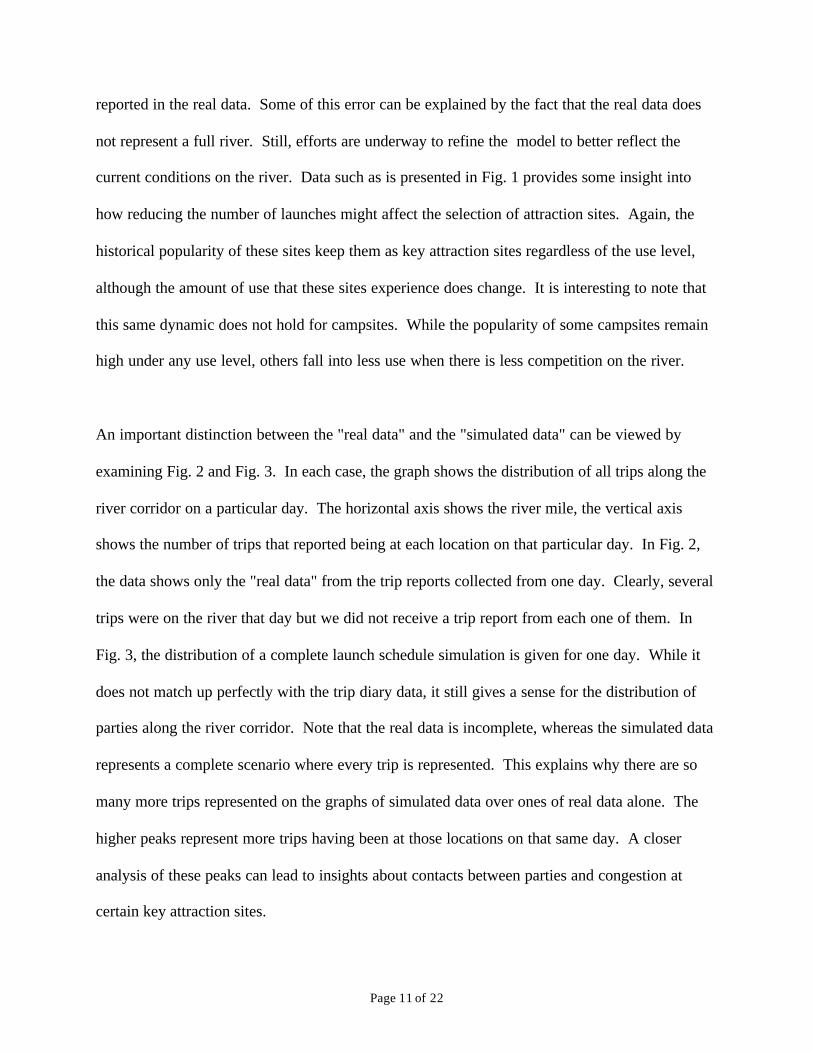
Another helpful analytical tool is represented in Fig. 4. Here, the horizontal axis represents the
day of the trip while the vertical axis represents the river mile. The focus here is only on trips of
length 15 days. All of the records for 15-day trips were averaged together to create one line that
represents the average or the "typical" 15 day trip. The slope of this line gives a sense of the
velocity of the trips as they travel down the Colorado River corridor. Comparisons between
these graphs give us a sense of the accuracy of our simulator. For example, the slope of the line
for the real data and the 100% simulation data are closely calibrated. After day 10 (so, on the
final third of the trip), however, the real data average trip speed is slower and the average trip
location distance is less than the simulated data. This indicates that the simulation might have
some error that becomes obvious only after running the trips more than ten days, and helps
identify an area for further attention in our refining efforts.
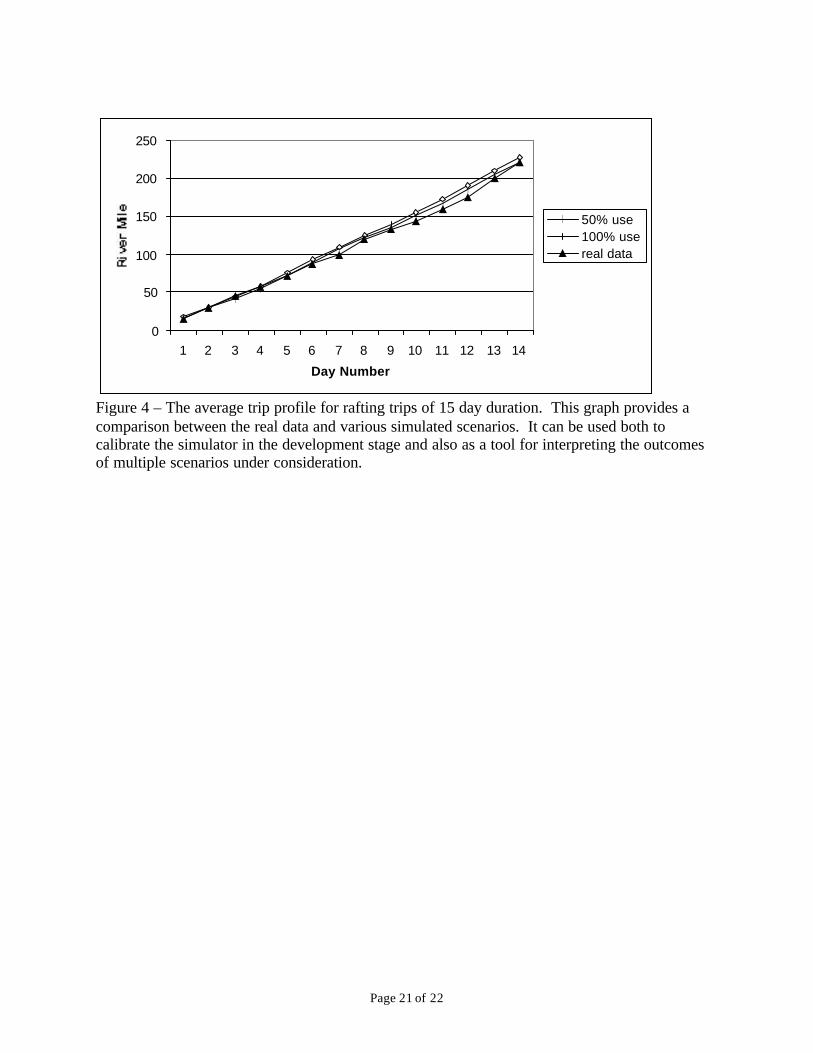
The final figure (Fig. 5) shows the same output but takes the average of all the trips, not just the
ones of 15 day duration. This must be interpreted carefully. On the one hand, each line captures
the average location of each trip on a daily basis. On the other hand, it also represents trips of
many different lengths. The anomalous decrease after day 6 is not due to trips backtracking
along the river (this is impossible), but rather shows the effects of shorter trip lengths that travel
the entire river corridor (all 250 miles) in six or seven days and are then removed from the data
set. A more useful query might involve separating out these shorter, motorized trips for
individual analysis. On day 7, you are only viewing trips that are of length greater than or equal
to seven days. The simulated data are useful to use because it provides an indication that the
simulation is capturing the real data flow of rafting trips in some sort of "average" sense. The

Page 13 of 22
similarities in the graphs in these figures support a certain robustness in the simulator's ability to
capture the basic flow of rafting traffic on the Colorado River. The simulator appears, however,
to result in trip itineraries that are further down river than the real data indicates. This is, again,
the area of focus for improving the next version of our simulator.
In addition to specific queries that result in graphs where one can compare the outputs of various
simulation scenarios, GCRTSim provides a comprehensive report based pre-established
Management Objectives. These objectives were established in the 1989 Colorado River
Management Plan and are the guidelines that the National Park Services employs in order to see
if a given launch scenario results in the types of conditions on the river that are considered
acceptable. For example, one management objective regards the number of river contacts per
day. The objective is that there should be an 80 per cent probability that a trip will make contact
with seven or fewer river parties, with up to 90 minutes in sight of less than 125 other people. A
simulation run based on 100 per cent use showed that this particular management objective
resulted in an average probability of 54.53 per cent that the party contacts will remain within the
management standards. A simulation run based on 50 per cent resulted in an average probability
of 91.09 per cent that the party contacts will remain with in the management standards. Results
like these will enable users of GCRTSim to judge the potential of alternative management
scenarios under consideration.

Page 14 of 22
Discussion
GCRTSim is both a repository for an extensive database of trip reports completed during 1998
and 1999 and an integrated statistical and artificial intelligence-based computer simulation that
models complex, dynamic human-environment interactions in the river corridor of the Grand
Canyon National Park. It will be used by managers at Grand Canyon National Park to help
understand the potential impact of various alternative management scenarios for rafting trips on
the Colorado River.
In many ways, this represents a preliminary report since the 1999 trip diary data are not yet
available and since additional improvements and refinements for the simulation engine are
planned for much of the year 2000. The real test will be subsequent to this, when the model is
used extensively to examine the potential outcomes of various alternative launch schedules. The
insight that can be provided by GCRTSim is expected to be a valuable contribution to a complex
situation, that of managing rafting traffic on the Colorado River in an optimal way for both
recreators and for the natural resource itself. For up-to-date information on the status of this
project, visit the website at http://jan.ucc.nau.edu/~car/msl or http://odin.math.nau.edu.
Acknowledgements
The authors would like to acknowledge the team members involved in this project: Dr. Terry
Daniel, Dr. Michael I. Ratliff, Micheal Meitner, Susan Cherry, Doug Stallman, Rian Bogle, Rob

Page 15 of 22
Allred, Joanna Bieri, Gary O'Brien and Dana Kilbourne. This project would not be possible
without funding from the Grand Canyon National Park, the University of Arizona and Northern
Arizona University (including the NAU-NASA Space Grant). The authors also wish to thank the
countless people who have contributed to our understanding of the complex nature of running
rafting trips down the Colorado River. This includes Linda Jalbert, Laurie Domler and others
from Grand Canyon National Park, the Grand Canyon River Outfitters Association, the Grand
Canyon Private Boaters Association, the Grand Canyon River Guides and several social science
researchers involved with the Grand Canyon National Park.
References
Bieri, J.A. and C A. Roberts. 2000. Using the Grand Canyon River Trip Simulator to Test NewLaunch Schedules on the Colorado River. AWIS Magazine, Association for Women in Science,Washington DC. 29: 6-10.
Bishop, I.D and H.R. Gimblett. 1999. Management of Recreational Areas: Geographic InformationSystems, Autonomous Agents and Virtual Reality. Environment and Planning B. Planning andDesign 2000 27: 423-435.
Borkan, R.E. and A.H. Underhill. 1989. Simulating the Effects of Glen Canyon Dam Releases onGrand Canyon River Trips. Environmental Management 13: 347-354.
Brian, N.J., and J.R. Thomas. 1984. The 1983 Colorado River Beach campsite inventory. NationalPark Service Division of Resource Management, Grand Canyon National Park, Grand Canyon,56 pp.
Cherry, S. 1997. Modeling of River Trips on the Colorado River in Grand Canyon National Park.Unpublished Paper. School of Renewable Natural Resources. University of Arizona. Tucson,Arizona.
Colorado River Management Plan. 1989. National Park Service, U.S. Department of the Interior.
Gimblett, H. R., C.A. Roberts, T. Daniel, M. Mitner, S. Cherry, D. Kilbourne, M. Ratliff, D.Stallman, R. Bogle. 2000. Intelligent Agent Modeling for Simulating and Evaluating River TripScheduling Scenarios for the Grand Canyon National Park. Pages 245-275. in H.R. GimblettH.R. editor. Integrating GIS and Agent based modeling techniques for Understanding Social andEcological Processes, Oxford Press, London.

Page 16 of 22
Gimblett, H.R., B. Durnota and R.M. Itami. 1996. Spatially Explicit Autonomous Agents forModeling Recreation Use in Complex Wilderness Landscapes. Complex International Journal 3.
Jalbert, L. M. 1990. Monitoring Visitor Distribution and Use Patterns Along the Colorado RiverCorridor: River Contact Survey and Attraction Site Monitoring. Resource File in Grand CanyonScience Center, Grand Canyon National Park. 47pp.
Jalbert, L. M. 1991. Monitoring Visitor Distribution and Use Patterns Along the Colorado RiverCorridor: River Contact Survey and Attraction Site Monitoring. Resource File in Grand CanyonScience Center, Grand Canyon National Park. 32pp.
Jalbert, L. M. 1992. The Influence of Discharge on Recreational Values including Crowding andCongestions and Safety in Grand Canyon National Park. Division of Resources Management inCooperation with Glen Canyon Environmental Studies. Grand Canyon National Park.
Jalbert. L. M. 1993. Colorado River Management; Resource Monitoring Program: RecreationalImpacts to Camp and Attraction Site Quality, River Rehabilitation and Visitor Experience,Program Summary. Resource File in Grand Canyon Science Center, Grand Canyon NationalPark. 14pp.
Kaplinski, M., J. Hazel, M. Manone, R. Parnell and A. Dale. 1998. Colorado River sediment storagein Grand Canyon during calendar year 1997, final report to the U.S. Bureau of Reclamation,Grand Canyon Monitoring and Research Center, Flagstaff, AZ, 65pp.
Kearsley, L. and R. Quartaroli. 1997. Effects of a beach/habitat building flow on campsites inGrand Canyon: Final Report of Applied Technology Associates for the Glen CanyonEnvironmental Studies, 18 pp.
Manneville, P., N. Boccara, G.Y. Yichniac and R. Bidaux. 1989. Cellular Automata and Modeling ofComplex Physical Systems. Springer, New York.
O’Brien, G.O., J. Jansen, K.S. Thompson, A.R. Potochnik and K.J. Burke. 1997. Effects of theEffects of Continuous High Flows and Daily Fluctuating Flows from Glen Canyon Dam onGrand Canyon Beaches, 1997 and 1998:A Continuation of a Repeat Photography Study byGrand Canyon River Guides, Inc. (Adopt-a-Beach Program) Administrative report for GrandCanyon Monitoring And Research Center by the Grand Canyon River Guides Adopt-a-Beachprogram.
O’Brien, Gary and C.A. Roberts. 2000. Evaluation of river beach carrying capacity informationutilized by the Grand Canyon River Trip Simulator: Analysis and recommendations for futurestudy. Unpublished Paper. Northern Arizona University. Flagstaff, AZ.
Reghis, M. and E. Reventa. 1998. Classical and fuzzy concepts in mathematical logic andapplications. CRC Press, Boca Raton.
Roberts, C.A, 1998. Expert Interviews with Grand Canyon River Guides. Unpublished Paper.Northern Arizona University. Flagstaff, AZ.
Schechter, M. 1975. Simulation model of wilderness area use. Resources for the Future,Washington, D.C. pp. 172.
Shelby, B. and J.M. Nielsen. 1976a. Design and Method of the Sociological Research in the GrandCanyon. Technical Report No. 1, Colorado River Research Program Report Series, U.S.Department of Interior, National Park Service.

Page 17 of 22
Shelby, B. and J.M. Nielsen. 1976b. Motors and Oars in the Grand Canyon. Technical Report No. 2,Colorado River Research Program Report Series, U.S. Department of Interior, National ParkService.
Shelby, B. and J.M. Nielsen.. 1976c. Use levels and Crowding in the Grand Canyon. TechnicalReport No. 3, Colorado River Research Program Report Series, U.S. Department of Interior,National Park Service.
Shelby, B. and J.M. Nielsen. 1976d. Private and Commercial Trips on the Grand Canyon. TechnicalReport No. 4, Colorado River Research Program Report Series, U.S. Department of Interior,National Park Service.
Shechter, M. and R.L. Lucus. 1978. Simulation of Recreational Use for Park and WildernessManagement. Johns Hopkins University Press for Resources for the Future, Inc., Washington,DC. 220 pp.
Tecuci, G. and T. Dybala. 1998. Building intelligent agents: an apprenticeship multi-strategy learningtheory, methodology, tool and case studies (San Diego: Academic Press).
Underhill, A. H., A.B. Xaba and R.E. Borkan. 1986. The Wilderness Simulation Model Applied toColorado River Boating in Grand Canyon National Park, USA. Environmental Management. 10:367-374.
Van Wagendonk, J. W. 1979. Use of a wilderness simulator for management decisions. Proc.1st Conf. Sci. Res. In the Nat’l. Parks. Trans. And Proc. Series 5: 1039-1040.

Page 18 of 22
Figure 1 – Comparison of recreational visitation at key attraction sites along the Colorado Rivercorridor within the Grand Canyon National Park. Real data corresponds to trip diaries collectedduring the 1998 river running season. The 100% and 50% results arise from simulationsconducted from a scenario representing typical 100% use and a scenario consisting of 50%reduction in people, boats and user days.
Fig. 1: Activity Sites
0.000.100.200.300.400.500.600.700.800.901.00
Site Name
100% use50% usereal data
Top Ten Activity Sites
0.000.100.200.300.400.500.600.700.800.901.00
Site Name
100% use50% usereal data
Activity Sites
0.000.100.200.300.400.500.600.700.800.901.00
Site Name
100% use50% usereal data

Page 19 of 22
Figure 2 - Distribution of rafting trips along the Colorado River corridor within the GrandCanyon National park over one day as reported in diaries collected during the 1998 river runningseason. The horizontal axis marks the river mile, the vertical axis indicates the number of tripsthat reported being at that river mile on July 15, 1998. Note that not all trips on the riversubmitted a trip diary.

Page 20 of 22
Figure 3 - Distribution of rafting trips along the Colorado River corridor within the GrandCanyon National park over one day resulting from a simulation of a scenario that represents thetypical 100 per cent use-level. The horizontal axis marks the river mile, the vertical axisindicates the number of trips that were simulated as being at that river mile on July 15, 1998.
Page 21 of 22
Figure 4 – The average trip profile for rafting trips of 15 day duration. This graph provides acomparison between the real data and various simulated scenarios. It can be used both tocalibrate the simulator in the development stage and also as a tool for interpreting the outcomesof multiple scenarios under consideration.
Fig. 4: 15 day trips
0
50
100
150
200
250
1 2 3 4 5 6 7 8 9 10 11 12 13 14
Day Number
50% use100% usereal data
0
50
100
150
200
250
1 2 3 4 5 6 7 8 9 10 11 12 13 14
Day Number
50% use100% usereal data
Page 22 of 22
Figure 5 – The average trip profile for trips of all lengths. This provides a comparison betweenthe real data and various simulated scenarios, although it must be interpreted carefully. Graphdoes indicate that simulated trips are capturing the real data in an average sense.
Fig. 5: all trip lengths
0
50
100
150
200
250
300
Day Number
50% use100% usereal data
0
50
100
150
200
250
300
Day Number
50% use100% usereal data