
BSc Computer Networks and Security; BSc Computer Networks ...

Computer Networks 52 (2008) 2728–2744
Contents lists available at ScienceDirect
Computer Networks
journal homepage: www.elsevier .com/locate /comnet
An experimental study of inter-cell interference effects on systemperformance in unplanned wireless LAN deployments
Mesut Ali Ergin *, Kishore Ramachandran, Marco GruteserWINLAB, Electrical and Computer Engineering Department, Rutgers, The State University of New Jersey, 671 Route 1 South, North Brunswick, NJ 08902-3390, USA
a r t i c l e i n f o
Article history:Received 4 October 2007Received in revised form 10 March 2008Accepted 28 May 2008Available online 13 June 2008
Responsible Editor: E. Gregori
Keywords:Unplanned WLAN DeploymentsHigh-density WLANsInter-cell interferenceWireless testbedsReal-world evaluationWireless experimentation
1389-1286/$ - see front matter � 2008 Elsevier B.Vdoi:10.1016/j.comnet.2008.05.013
* Corresponding author. Tel.: +1 732 932 6857; faE-mail addresses: [email protected], ergin@winl
Ergin), [email protected] (K. Ramachandrarutgers.edu (M. Gruteser).
1 In this study, we are interested in the performancWireless LANs. Therefore the term ‘WLAN’ has beentext to refer to IEEE 802.11a/b/g Wireless LANs.
a b s t r a c t
In this paper, we report on our experimental study of the effects of inter-cell interferenceon IEEE 802.11 performance. Due to growing use of wireless LANs (WLANs) in residentialareas and settings supporting flash crowds, chaotic unplanned deployments are becomingthe norm rather than an exception. Environments in which these WLANs are deployed,have many nearby access points and stations on the same channel, either due to lack ofcoordination or insufficient available channels. Thus, inter-cell interference is commonbut not well-understood. According to conventional wisdom, the efficiency of an IEEE802.11 network is determined by the number of active clients. However, we find that witha typical TCP-dominant workload, cumulative system throughput is characterized by thenumber of actively interfering access points rather than the number of clients. We verifythat due to TCP flow control, the number of backlogged stations in such a network equalstwice the number of active access points. Thus, a single access point network proves veryrobust even with over one hundred clients, while multiple interfering access points lead toa significant increase in collisions that reduces throughput and affects media traffic. Onlytwo congested interfering cells prevent high quality VoIP calls. Based on these findings,we suggest a practical contention window adaptation technique using information onthe number of nearby access points rather than clients. We also point out the need for col-lision-resilient rate adaptation in such a setting. Together these techniques can largelyrecover the 50% loss in cumulative throughput in a setting with four strongly interferingaccess points.
� 2008 Elsevier B.V. All rights reserved.
1. Introduction
Penetration of IEEE 802.11 Wireless LANs (WLANs)1
into everyday life has started with data communicationsfor laptop PCs and is now continuing with the integrationof WLAN capabilities into consumer devices such as printers,music players and mobile phones. Recent projections esti-mate that by 2011, 340 million WiFi enabled phones will
. All rights reserved.
x: +1 732 932 6882.ab.rutgers.edu (M.A.n), gruteser@winlab.
e of IEEE 802.11a/b/gused throughout the
be shipping yearly [1]. Such a usage growth likely leads toincreased inter-cell interference. Conventional inter-cellinterference mitigation requires careful site surveys to pre-vent neighboring cells from operating on the same channel,as well as transmission power control and other receiverparameter optimizations (such as carrier sensitivity adjust-ment) to increase spatial reuse. Dynamic forms of these ap-proaches are also proposed to ease their adoption, such asdistributed channel selection.
Even with such mitigation techniques, however, severalfactors make complete elimination of inter-cell interfer-ence non-trivial in WLANs. First, many WLANs, especiallyin residential or small business areas, are deployed in anunplanned and chaotic manner. Lack of coordination be-tween neighbors and the restrictions of many ISP contracts

M.A. Ergin et al. / Computer Networks 52 (2008) 2728–2744 2729
lead to over-deployment of access points. War-drivingstudies of these networks have found up to 80 accesspoints in communication range, with 40% of them config-ured on the industrial, scientific and medical (ISM) radiobands at 2450 MHz, channel number 6 [2]. Second, the in-creased usage of wireless multimedia including voice-over-WiFi has motivated WLAN system designs whereneighboring light-weight access points operate on thesame channel to minimize handoff time [3]. Third, thenumber of available non-overlapping channels in the unli-censed spectrum for IEEE 802.11a/b/g is still low, evenwith the 2006 US FCC allocation of 11 additional channelsin 5 GHz spectrum. Hence, even frequency planned net-works that provide blanket coverage over larger campusescannot fully avoid inter-cell interference, especially withthe trend towards high capacity radio switches that re-quire multiple channels per cell [3].
Unfortunately, in these unplanned environments, littleis known about the effects of inter-cell interference on IEEE802.11 system performance. Detailed analytical and simu-lation models exist for the MAC protocol scalability [4,5]and experimental studies have characterized scalabilityunder TCP and UDP workloads [6] in the single-cell case.However, system scalability in the common unplannedmulti-cell case remains largely unexplored. Multi-cell net-works have been studied through measurement campaignsin real-world campus [7] or conference settings [8,9] andrecent measurements in a dense conference deploymenthave detected performance anomalies [9,10], but the datadoes not allow a detailed analysis of root causes.
New contributions: This paper presents a systematicanalysis of the effect of inter-cell interference in such un-planned, high-density WLANs through detailed experi-ments and simulations. Our work complements previousreal-world measurements through experimentation withover hundred IEEE 802.11 enabled nodes in a repeatablelaboratory setting with controlled interference. Thus, it al-lows in-depth analysis through simulations and repeatableexperiments, with precisely known configurations.
We expand our initial findings presented in [11] by con-ducting elaborate large-scale realistic experiments on theORBIT testbed [12] as well as evaluating multimedia perfor-mance (esp. VoIP) through experiments and simulations.We also suggest a practical solution that can recover signif-icant part of the losses demonstrated in this study. In sum-mary, our contributions with this paper include:
� Analyzing system performance using a realistic TCPdominated workload in unplanned multi-cell WLANsby conducting experiments on the ORBIT testbed as wellas QualNet simulator [13]. Results show that a single-cell network remains remarkably robust even with125+ clients; the collision rate remains low. Thisextends Choi et al.’s empirical results [6] for 16 clientsto a much larger network, with realistic client associa-tion patterns, and bursty traffic mixes. We also showthat, in an unplanned multi-cell network, however, thecollision rate increases significantly.
� Providing novel insights into the behavior of TCP inmulti-cell WLANs. Due to TCP flow control, the numberof backlogged stations equals twice the number of active
access points, meaning that network efficiency is deter-mined by the number of interfering access points, not thenumber of clients. In addition, we show that TCP cannotregulate the flows in the IEEE 802.11 network for opti-mal system operating point (i.e. max. throughput) acrossdifferent contention window settings.
� Quantifying the effect of inter-cell interference on mul-timedia traffic and on throughput loss due to inefficientrate adaptation. Even with Wireless Multimedia Exten-sions, based on the IEEE 802.11e standard [14], VoIPusers can still experience substantial performance deg-radation in unplanned deployments. This deteriorationstarts to occur even when the number of interferingAPs is relatively small (three). Video streaming in thenetwork makes the system performance worse for VoIPusers.
� Identifying a practical distributed interference mitiga-tion technique: contention window adaptation based onthe number of active access points, not the number of cli-ents in the network. We also show that an additional20% gain would be possible with collision-resilient rateadaptation.
Road map: The remainder of this paper is organized asfollows. The next section explains our evaluation method-ology and the details of the realistic traffic workload wehave used. In Section 3, we characterize the effect ofnode-density (both client and AP density), traffic variabil-ity, and client arrival pattern, on system performance.This is followed by Section 4, which details TCP perfor-mance in single-cell and unplanned multi-cell WLANs.Section 5 goes on to describe the effects of inter-cellinterference on multimedia applications. In Section 6,we examine performance restoration techniques and thegains that could be obtained by accurate implementa-tions. We discuss related work in Section 7 and concludethe paper in Section 8.
2. Experiment setup and traffic models
We leverage the publicly accessible ORBIT testbed [12]to carry out systematic and controlled experiments. In ourevaluations, we use the network topology shown in Fig. 1.The main components of this integrated wired/wireless IPnetwork are wired nodes hosting application servers, wire-less access points (AP) and stations (STA). We focus onapplication behavior in the wireless access segment, whichconsists of multiple, interfering basic service sets (BSS) onthe same channel, in close proximity. All nodes remain incommunication range emulating future very high-densitydeployments. Evaluating the effect of hidden nodes is be-yond the scope of this paper. Pairwise SNR profile of allnodes in our testbed allows communication using IEEE802.11a at 54 Mbits/s rate with less that 1% packet errorrate.
2.1. Experimental and simulation setup
Table 1 provides a list of the parameters we used on theORBIT testbed. To ensure that our results are representative

Fig. 1. ORBIT testbed experiment setup with configurable number of access points and up to 400 nodes.
Table 1Attribute summary for ORBIT experiments
Attribute Value
Radio nodes 1 GHz VIA C3 Processor, 512 MB RAM, 20 GBHDD
Wireless interfaces 2 X Atheros AR5212 based mini-PCI 802.11a/gWireless output
power18 dBm
PHY/MAC/Freq. used IEEE 802.11a/ Operating at UNII Band Channel52
PHY link speed(Fixed)
Up to 54 Mbits/s
MAC payload size 1300 bytesMAC retries 10O/S used Linux 2.6.18Driver software MadWifi svn.21XX [15]
2 Note that we used a modified MAC retry value of 10 to match thoseused in our ORBIT experiments.
3 MOS is a subjective score (ranging from 0 to 5) used to evaluate voicequality as perceived by an average user of the system. Details can be foundin ITU G.107 and G.113.
4 Note that whenever Bianchi’s saturation model is used for comparisons,corresponding experiments on simulator and the testbed will incur bulktransfer workloads to satisfy backlogged station requirements of the model.
2730 M.A. Ergin et al. / Computer Networks 52 (2008) 2728–2744
of real-world behavior, we first carried out calibration testscomparing throughput of the ORBIT machines configuredas APs (that use the MadWifi driver [15]) with commercialCisco (1200 series) and D-Link APs. We did not observe asignificant difference (less than 5%). We also configuredthe APs as bridges and used traffic sniffers (via tcpdump)on both the wired and wireless segments. To allow otherresearchers to replicate, and build on our experiments inthe ORBIT environment, we have published relevant trafficscripts, tools, and frame dump traces through the CRAW-DAD archive [16] as rutgersnap_density traceset [17].
For our simulations, we chose QualNet [13] (the com-mercial successor of GloMoSim) due to its accurate physicallayer interference model, which can affect higher layer per-formance comparisons [18]. In particular, QualNet’s SINRcalculation taking into account the cumulative interferencepower from all concurrent senders is very important formeasuring the effect of MAC collisions in our high-densitysimulations. Note that the default ns-2 model may underes-timate collisions, since it only keeps track of the strongestinterferer, not the sum of all interference signals.
Before running our simulations, we made sure that twobugs in the particular version of the simulator: (i) losingslot synchronization when resuming backoff (already de-scribed in [19]), and (ii) improper resetting of CW valuesfor IEEE 802.11e EDCA [14] access queues, were fixed.
The parameters that we used in our simulations are out-lined in Table 22.
Metrics: For performance evaluation, we choose to useapplication-specific metrics. Thus, for the performance ofTCP-based applications, we focus on system throughputand throughput fairness (Jain’s fairness index [20]). Formultimedia applications such as VoIP, we utilize bothquantitative metrics such as application-level packet droprate, latency and jitter as well as a standard subjectivequality metric, namely mean opinion score (MOS).3
The rationale behind conducting our experiments in acontrolled laboratory setting (such as ORBIT) rather thana real deployed WLAN is as follows. First, it allows detailedinstrumentation to understand MAC-level behavior with-out the use of large numbers of sniffers. Second, experi-ments are repeatable that is they are not dependent ontime-varying shadowing and interference patterns. Theseallow both easier investigation of root causes and directlycomparing alternative solutions. Finally, the high-densityplacement of 400 nodes allows us to experiment with den-sities that may be expected in future years rather thanfocussing solely on today’s system performance.
2.2. Validation experiment
Throughout the paper, we will use collision-dominatedpacket error rate (PER) and system throughput measure-ments obtained from Bianchi’s IEEE 802.11 model that as-sumes that all stations are backlogged [4], the QualNetsimulator [13], and the ORBIT wireless testbed [12], tocompare the performance of the wireless networks ofinterest.4 To be able to validate such a comparison, we con-duct a saturation data transfer experiment on an IEEE802.11a network of two active nodes using 36 Mbits/s fixed

Table 2Attribute summary for simulations
Attribute Value
PHY 5.2 GHz, Two Ray Ground, Tx. power of 18 dBm, Rx. Sensitivity of �78 dBm (at 36 Mbps)MAC Basic access (RTS off), Variable CWmin (mostly 15), CWmax of 1023, 16 ls SIFS, 34 ls DIFS, 9 ls Slot time, 28 bytes MAC header, 14 bytes ACK
frame size, 1300 bytes MAC payload, 10 retriesNET IPv4, IP Queue size of 75,000 bytesTCP NewReno with RFC 1323, Max. segment size of 1300 bytes, Send/Rcv buffer size of 110 KB, Delayed ACK disabled
Table 3Validation experiment results for Bianchi’s model, QualNet simulator andthe ORBIT testbed
Avg. PER (%) Avg. throughput (Mbits/ s)
Bianchi’s model 10.17 23.14QualNet simulator 11.02 22.28ORBIT testbed 9.86 24.67
M.A. Ergin et al. / Computer Networks 52 (2008) 2728–2744 2731
rate, sending 1500-byte UDP packets, for a duration of fiveminutes. Average PER and throughput results obtained fromMATLAB simulations of Bianchi’s model, the QualNet simu-lator and the ORBIT testbed for this configuration are re-ported in Table 3. From this and other similar experiments,for the configurations tested, we have repeatedly observedthat results from all three methods are very close, validatingtheir potential comparability.
2.3. Traffic model
Workloads: Since inter-cell interference patterns are af-fected by end-user workloads, we designed a synthetic of-fice workload in addition to bulk TCP-only workloads. Theoffice workload is based on several hours of sniffer tracesobtained in our academic office/lab environment from asingle access point serving up to 50 students and faculty.These measurements indicate that 97% of packets use theTCP protocol and about 75% of traffic is generated by webtraffic, as illustrated in Fig. 2a. In the figure, all percentagesare based on the number of bytes communicated in theWLAN and only application protocols with >2% contribu-tion are individually referred. These measurements arereasonably consistent with, except for a 20% increase inweb traffic, with an earlier analysis of SIGCOMM 2001 con-ference traces covering 4 APs and 195 stations [8], which isalso shown in the figure.
Thus, 75% of the synthetic workload consists of burstyweb traffic, following the self-similar ON–OFF traffic modeldescribed in [21]. We directly emulate the HTML transfer,browser processing, and HTML object retrieval phasesusing the HTTP 1.1 compliant GNU wget page retrieval tool[22] to access a local webserver serving web pages and ob-jects obtained from an academic web server. The model weused for this emulation is illustrated in Fig. 2b. The user’sthinking time X (inactive time) between page accesses fol-lows a Pareto distribution:
PrðX > xÞ ¼ xxm
� ��k
ð1Þ
with shape parameter k = 1.5 and lower bound xm = 1, assuggested in [21]. We concentrate on TCP downlink traffic,
since it represents typical access point usage for webbrowsing. Also, earlier results [23] showed that the direc-tion of TCP traffic is not significant. This is mostly due tothe equal frame flow rate requirement of TCP in data seg-ment and ACK directions.
The remaining share of the workload comprises a mix ofVoIP traffic (over UDP/IP) using the G.711 codec withH.323 signalling (3% of overall volume), and TCP packettransfers with exponentially distributed interarrival times(21% of the overall volume on average) as background traf-fic. These flows are emulated through the D-ITG traffic gen-erator v.2.4.3 [24]. In the experiments, each station isassigned a traffic generation profile to satisfy the workloaddistribution outlined above, and keeps this profile until theend of the experiment.
User arrival pattern: Another factor that might poten-tially affect system performance is client associationdynamics. To measure performance in a more realisticmanner, we extracted the user arrival patterns from WLANtraces of the 62nd IETF meeting [9]. In particular, we usethe arrival pattern of the users returning from lunch be-tween 12:30 p.m. to 1:00 p.m., as illustrated in Fig. 3. TheIETF WLAN comprised over 150 APs and more than 700users. Note the significant variance in user associations,for example at 43 min into the trace, the number of userson channel 11 quickly increases from approximately 50to over 250 within a two minute window.
3. Analysis of the system performance
In this section, we study the system performance of amulti-cell wireless network deployment, where the cellsinterfere with each other. We systematically examine theeffect of access point density, traffic variability, user arrivalpattern and station density to understand root causes ofperformance problems. We begin with an experiment thatemulates the characteristics of short-term conferencedeployments [9,10], with multiple APs, a web-dominatedtraffic workload, and a dynamic station arrival pattern.Emulating such a scenario in a controlled environment willallow us to isolate the effect of these factors on networkthroughput.
3.1. Multi-cell network with realistic workload
This 11 min experiment comprises four APs and 75STAs, selected randomly from the 400-node ORBIT mainradio grid. Once APs are operational on UNII 5 GHz BandChannel 52, using IEEE 802.11a, stations start to associatewith the network by following the dynamic client arrivalpattern described in Section 2.3. This arrival pattern is

Fig. 2. (a) WLAN application workload characterization. (b) ON–OFF model for emulating realistic WWW access [21].
Fig. 3. Dynamic client arrival patterns from traces of the 62th IETF meeting [16] showing rapid changes in number of associated users.
2732 M.A. Ergin et al. / Computer Networks 52 (2008) 2728–2744
illustrated in Fig. 4a. All APs use the same SSID, thus STAsselect the AP with the highest Received Signal StrengthIndication (RSSI) at their position. In this experiment, thefour APs have 32, 13, 13, and 17 stations associated,respectively.
Fig. 4b summarizes the system performance in terms ofthe cumulative system throughput for the network. We
attribute the throughput spikes, especially with about 30STAs, to our user model for web browsing traffic (i.e.,thinking/perceiving phase vs. fetching/downloadingphase). As more STAs arrive, communication demands in-crease, and an averaging effect is observed in the overallsystem throughput. Our observations from this experimentare:

(a) Station (STA) arrival dynamics (b) ORBIT experiment for 4 APs, 75 STAs
Fig. 4. System performance for the most general case: multi-cell with many clients using realistic traffic and arrival patterns.
M.A. Ergin et al. / Computer Networks 52 (2008) 2728–2744 2733
� The steady state average system throughput, 8.71 Mbits/s (calculated over the last three minutes of the experi-ment after all 75 STAs arrived) is below the capacity ofa 54 Mbits/s IEEE 802.11a network [25]. In fact, a oneAP/one-STA baseline experiment using TCP bulk datatransfer, we conducted, yielded 24.02 Mbits/s averagesteady state throughput in the same experimentenvironment.
� Distribution of clients across access points is uneven.One of the APs in the experiment serves more than twicethe number of STAs of another AP. To investigate thisfurther, we conducted an experiment with 320 stations(STA) and 12 co-located (to the extend ORBIT testbed’sfixed node placement allows) APs. We observe a similaruneven distribution as shown in Fig. 5. At the stations,we have logged RSSI measurements for the co-locatedAPs and found out that they differed likely due to a com-bination of multipath, antenna gains, RF frontenddynamics, connectors, and cabling. In summary, even a
Fig. 5. Experiment with 320 stations and 12 APs showing a
high-density distribution of client positions with line-of-sight propagation does not necessarily lead to aneven distribution of associations over co-located accesspoints. This observation motivates the need for associa-tion control techniques in multi-channel/multi-APWLAN installations (e.g., [10]) aiming to create evenload distribution within the network.
To understand the root cause of threefold throughputchange, we will study the effect of access point density,traffic workload, dynamic user arrivals, and station densityon this result.
3.2. The Effect of the Number of APs
To measure the effect of the number of APs, we repeatthe previous experiment with one, two, and three accesspoints, while keeping the total number of STAs and theiroffered load the same. Results from this experiment are
ssociation patterns and distribution to access points.
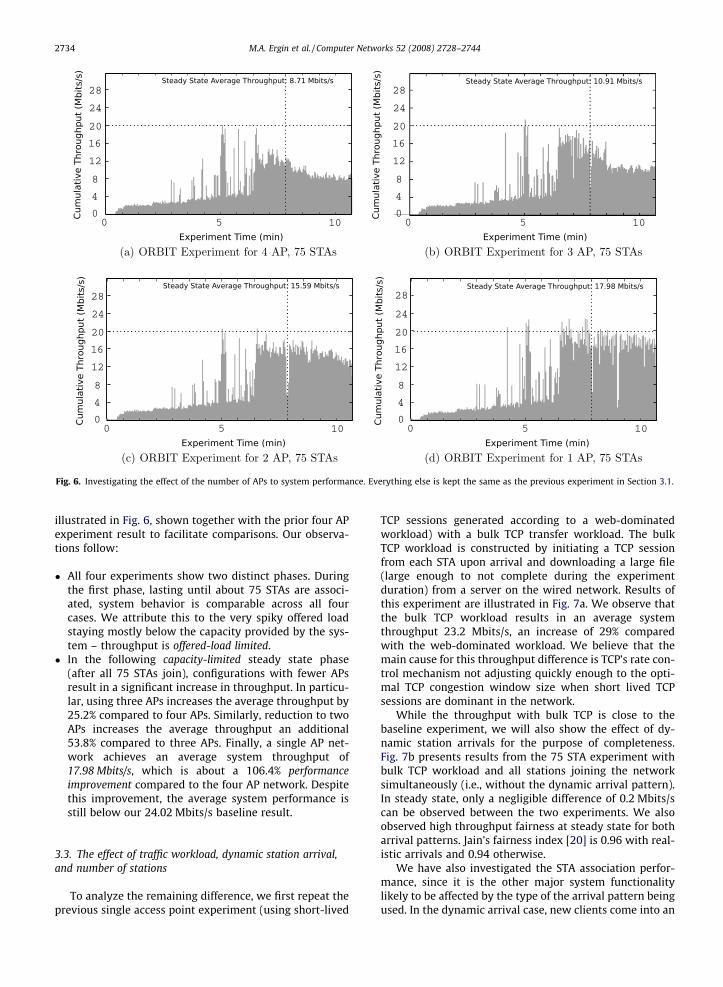
Fig. 6. Investigating the effect of the number of APs to system performance. Everything else is kept the same as the previous experiment in Section 3.1.
2734 M.A. Ergin et al. / Computer Networks 52 (2008) 2728–2744
illustrated in Fig. 6, shown together with the prior four APexperiment result to facilitate comparisons. Our observa-tions follow:
� All four experiments show two distinct phases. Duringthe first phase, lasting until about 75 STAs are associ-ated, system behavior is comparable across all fourcases. We attribute this to the very spiky offered loadstaying mostly below the capacity provided by the sys-tem – throughput is offered-load limited.
� In the following capacity-limited steady state phase(after all 75 STAs join), configurations with fewer APsresult in a significant increase in throughput. In particu-lar, using three APs increases the average throughput by25.2% compared to four APs. Similarly, reduction to twoAPs increases the average throughput an additional53.8% compared to three APs. Finally, a single AP net-work achieves an average system throughput of17.98 Mbits/s, which is about a 106.4% performanceimprovement compared to the four AP network. Despitethis improvement, the average system performance isstill below our 24.02 Mbits/s baseline result.
3.3. The effect of traffic workload, dynamic station arrival,and number of stations
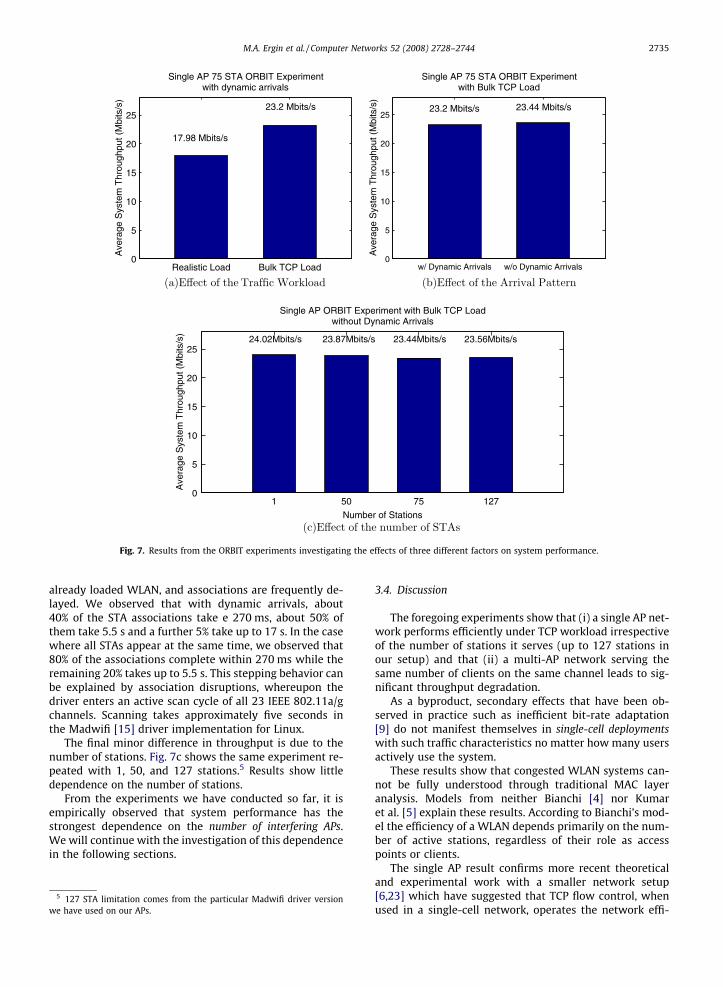
To analyze the remaining difference, we first repeat theprevious single access point experiment (using short-lived
TCP sessions generated according to a web-dominatedworkload) with a bulk TCP transfer workload. The bulkTCP workload is constructed by initiating a TCP sessionfrom each STA upon arrival and downloading a large file(large enough to not complete during the experimentduration) from a server on the wired network. Results ofthis experiment are illustrated in Fig. 7a. We observe thatthe bulk TCP workload results in an average systemthroughput 23.2 Mbits/s, an increase of 29% comparedwith the web-dominated workload. We believe that themain cause for this throughput difference is TCP’s rate con-trol mechanism not adjusting quickly enough to the opti-mal TCP congestion window size when short lived TCPsessions are dominant in the network.
While the throughput with bulk TCP is close to thebaseline experiment, we will also show the effect of dy-namic station arrivals for the purpose of completeness.Fig. 7b presents results from the 75 STA experiment withbulk TCP workload and all stations joining the networksimultaneously (i.e., without the dynamic arrival pattern).In steady state, only a negligible difference of 0.2 Mbits/scan be observed between the two experiments. We alsoobserved high throughput fairness at steady state for botharrival patterns. Jain’s fairness index [20] is 0.96 with real-istic arrivals and 0.94 otherwise.
We have also investigated the STA association perfor-mance, since it is the other major system functionalitylikely to be affected by the type of the arrival pattern beingused. In the dynamic arrival case, new clients come into an
Realistic Load Bulk TCP Load0
5
10
15
20
25A
vera
ge S
yste
m T
hrou
ghpu
t (M
bits
/s)
Single AP 75 STA ORBIT Experimentwith dynamic arrivals
17.98 Mbits/s
23.2 Mbits/s
w/ Dynamic Arrivals w/o Dynamic Arrivals0
5
10
15
20
25
Ave
rage
Sys
tem
Thr
ough
put (
Mbi
ts/s
)
Single AP 75 STA ORBIT Experimentwith Bulk TCP Load
23.2 Mbits/s 23.44 Mbits/s
1 50 75 1270
5
10
15
20
25
Number of Stations
Ave
rage
Sys
tem
Thr
ough
put (
Mbi
ts/s
)
Single AP ORBIT Experiment with Bulk TCP Loadwithout Dynamic Arrivals
24.02Mbits/s 23.87Mbits/s 23.44Mbits/s 23.56Mbits/s
Fig. 7. Results from the ORBIT experiments investigating the effects of three different factors on system performance.
M.A. Ergin et al. / Computer Networks 52 (2008) 2728–2744 2735
already loaded WLAN, and associations are frequently de-layed. We observed that with dynamic arrivals, about40% of the STA associations take e 270 ms, about 50% ofthem take 5.5 s and a further 5% take up to 17 s. In the casewhere all STAs appear at the same time, we observed that80% of the associations complete within 270 ms while theremaining 20% takes up to 5.5 s. This stepping behavior canbe explained by association disruptions, whereupon thedriver enters an active scan cycle of all 23 IEEE 802.11a/gchannels. Scanning takes approximately five seconds inthe Madwifi [15] driver implementation for Linux.
The final minor difference in throughput is due to thenumber of stations. Fig. 7c shows the same experiment re-peated with 1, 50, and 127 stations.5 Results show littledependence on the number of stations.
From the experiments we have conducted so far, it isempirically observed that system performance has thestrongest dependence on the number of interfering APs.We will continue with the investigation of this dependencein the following sections.
5 127 STA limitation comes from the particular Madwifi driver versionwe have used on our APs.
3.4. Discussion
The foregoing experiments show that (i) a single AP net-work performs efficiently under TCP workload irrespectiveof the number of stations it serves (up to 127 stations inour setup) and that (ii) a multi-AP network serving thesame number of clients on the same channel leads to sig-nificant throughput degradation.
As a byproduct, secondary effects that have been ob-served in practice such as inefficient bit-rate adaptation[9] do not manifest themselves in single-cell deploymentswith such traffic characteristics no matter how many usersactively use the system.
These results show that congested WLAN systems can-not be fully understood through traditional MAC layeranalysis. Models from neither Bianchi [4] nor Kumaret al. [5] explain these results. According to Bianchi’s mod-el the efficiency of a WLAN depends primarily on the num-ber of active stations, regardless of their role as accesspoints or clients.
The single AP result confirms more recent theoreticaland experimental work with a smaller network setup[6,23] which have suggested that TCP flow control, whenused in a single-cell network, operates the network effi-

0
10
20
30
40
50
16840
Mea
n PE
R (
%)
Number of stations
1AP2AP
0
10
20
30
40
50
16840
Mea
n PE
R (
%)
Number of stations
1AP2AP
Fig. 8. (a) Empirical and (b) simulated collision-caused packet error rate (PER) with up to 16 clients and 2 APs. (c) Collision-PER predicted by Bianchi’sModel.
2736 M.A. Ergin et al. / Computer Networks 52 (2008) 2728–2744
ciently and maintains robust system throughput regardlessof the number of STAs. The multi-AP result, to our knowl-edge, has not yet been reported and we analyze it furtherin the following section.
4. TCP analysis in multi-cell networks
The reduction in cumulative throughput for multi-cellnetworks raises the following inter-related questions:
� Why is TCP Reno over WLAN robust against intra-cellcongestion but not against inter-cell congestion andinterference?
� Does TCP Reno adjust the flow rate to minimizecollisions?
In this section, we will answer the above questions byidentifying the applicability of Gong and Marbach’s TCP[26] model to multi-cell networks, validate it throughexperiments and simulation, and finalize by discussingTCP’s flow control’s ability to identify the optimal operat-ing point.
6 In these experiments, we do not consider dynamic STA arrivals and bit-rate adaptation in order to focus on MAC contention in a baseline scenario.
4.1. Gong and Marbach’s model for multi-cell networks
According to Gong and Marbach’s model [26] of TCP, ina single BSS case, on average, two stations will be back-logged, irrespective of the number of clients. Also, if n addi-tional flows, in the form of Independent basic service set(IBSS, a.k.a. an ad hoc network) are added as interferers,the expected number of active (i.e., backlogged) nodes inthe network would be 2(1 + n).
While Gong and Marbach do not comment on the mul-ti-AP case, all assumptions made for IBSS flows also holdfor BSS networks. Following the same steps, one can there-fore also derive the following proposition:
Consider multiple IEEE 802.11 infrastructure networks(BSS) with the following two characteristics: (1) Each BSSconsists of at least one station and a single AP. All BSSare within transmission range of each other. (2) There isa single TCP connection per client and applications usingTCP connections always have data to send. For a networktopology consisting of i BSSs, in steady state, the expectednumber of backlogged nodes then equals 2i.
4.2. Verification via experiments and simulations
To verify the proposition in Section 4.1, we study thecollision rate observed in the ORBIT experiments,6 wherewe use bulk TCP workload on six different network configu-rations (one and two APs, four, eight and sixteen STAs).Using Bianchi’s model, we can then calculate the collisionrates for the number of backlogged stations predicted byGong and Marbach’s model and compare it with the mea-surement result. We use this indirect approach, since MACqueues are maintained in hardware and we cannot directlydetermine whether a station is backlogged.
We further approximate the collision rate with theoverall packet error rate (PER) from these experiments,since WLAN devices cannot distinguish collisions fromother transmission errors and thus do not allow direct col-lision measurements. This approximation is accurate, sincewe operate in a high SNR environment where frame-errorsdue to pure channel bit-errors are negligible (<1% in ourtests). As additional validation, we also simulate the sameconfiguration in QualNet where we can extract the exactcollision rate.
Fig. 8a and b shows the mean collision rate as the num-ber of STAs is increased for one and two AP networks in theORBIT testbed experiments and simulations, respectively.In both cases, we observe that PER due to collisions is mar-ginally affected by an increase in the number of stationsbut is significantly affected by an increase in the numberof APs – an increase from 1 to 2 APs more than doublesthe average PER from 11% to nearly 28%. Near identical re-sults from the simulations and the ORBIT experiments alsoindicate that the collision rate approximation we used wasreasonable.
The empirical collision rate with a single AP (for 4, 8, and16 STAs) matches the PER value predicted by Bianchi’s sat-uration model [4] with two backlogged stations. Similarly,the empirical collision rate with two APs (for 4, 8, and 16STAs) matches the PER value predicted by Bianchi’s modelwith four backlogged stations. Predictions of Bianchi’smodel, obtained from MATLAB simulations, for the sameexperiment configuration are provided in Fig. 8c. To furtherverify the accuracy of this model, we conduct additional

Fig. 9. Accuracy of the model relative to simulation results. All simulation results exhibited very small variance characteristics, hence errorbars are notshown here.
Fig. 10. Collision rate behavior of TCP under varying CWmin values.
M.A. Ergin et al. / Computer Networks 52 (2008) 2728–2744 2737
simulations with four and eight APs connecting up to 32STAs and report the modeling error. Observed PER frommodel predictions and simulations closely follow eachother. The percentage modelling error is illustrated inFig. 9b – the worst case error is only 11.76%. Moreover,modeling error reduces with an increasing number of inter-fering APs. We also observed that these simulation resultsexhibited negligible variance (a maximum PER variance of0.12) across ten runs with different random seeds. These re-sults verify that each active cell increases the total numberof backlogged stations in the network by two, as stated bythe proposition in Section 4.1. The network efficiency in aTCP dominated network, for this reason, is primarily a func-tion of the number of interfering APs.
4.3. Discussion
Incidentally, an IEEE 802.11a network running with twobacklogged stations maximizes throughput according toBianchi’s model. Fewer backlogged stations lead to toomuch idle time, while more backlogged stations lead totoo much collision overhead. Thus, one may ask whetherTCP’s flow control algorithm, designed for managing con-gestion in the Internet, can also control the flow rate tomaximize throughput in congested wireless networks?And if so, why does it not achieve this under co-channelinterference from other access points?
To address these questions, we conducted simulationsin which we change the MAC CWmin parameter, whilekeeping the number of stations constant (32) and usingbulk TCP transfers to saturate the channel. If TCP can iden-tify the optimal operating point to maximize throughput insingle AP networks, it should respond to the changed MACCWmin settings with a corresponding change in the numberof backlogged stations. Recall that to maximize 802.11 net-work throughput, the number of backlogged stations hasto increase with an increase in MAC CWmin, to balance col-lisions against idle overhead [4].
Fig. 10 shows the MAC PER under TCP for the single APcase (with 32 STA) with increasing CWmin. It also shows theexpected packet error rate when only two stations arebacklogged (i.e., no TCP adjustment) labeled as ‘‘analyticalPER prediction” and an optimal PER curve, which corre-sponds to the PER at which the cumulative MAC through-put is maximized. Note that the observed (measured)
MAC PER curve approaches the optimal value forCWmin = 16, but does not follow the curve for higher CWmin
settings. Instead it tracks the PER for two backlogged sta-tions, indicating that in general, TCP’s flow control cannotidentify the MAC operating point at which throughput ismaximized.
Instead the measured results can be explained throughan interaction between flow control and MAC layer chan-nel access. A TCP workload leads to two backlogged sta-tions for each access point because TCP requires an equalpacket flow rate both up- and downlink directions (i.e.,DATA and ACK). Regardless of the direction of the data traf-fic, the flow is limited by the AP’s MAC layer channel accessprobability. Two backlogged stations means that on aver-age the AP itself and one associate station are backlogged.If more associated stations were backlogged, they togetherwould have a higher channel access probability than theaccess points, and the backlogged queues would empty.Similarly, adding more APs increases the cumulative chan-nel access probability for APs, hence they can excite moreclient stations (one per AP).
Note that this result is not a function of the downlinkdominance of the traffic [23]. We have also independentlycarried out simulations to compare a TCP-uplink domi-nated scenario and observed that direction of data trafficdid not change the throughput or collision rates signifi-cantly (<1%).
5. Effect of AP density on multimedia over WLAN
In this section, we evaluate the effect of inter-cell inter-ference on multimedia traffic, with and without wireless

Table 4Empirical VoIP performance
No. of APs VoIP Call #1 VoIP Call #2
Packet drop rate (%) Avg. jitter (ms) Avg. latency (ms) Avg. drop rate (%) Avg. jitter (ms) Avg. latency (ms)
1 0.14 2.11 54 0.78 2.16 782 1.55 4.16 77 1.12 2.50 653 2.97 4.82 101 1.84 5.76 1384 11.40 8.63 304 10.82 7.85 191
2738 M.A. Ergin et al. / Computer Networks 52 (2008) 2728–2744
multimedia extensions (WME).7 We place a special empha-sis on voice-over-IP (VoIP) application performance sincemost current video streaming traffic is not interactive, i.e.it can be buffered and transported over HTTP/TCP (e.g., You-TubeTM video streaming). The recent emergence of IEEE802.11 in VoIP handsets and cell phones, however, can beexpected to lead to increased VoIP usage on access points.
5.1. Performance over Legacy IEEE 802.11a
We first characterize VoIP performance in environ-ments with legacy IEEE 802.11a stations using our realisticworkload mix. For this purpose, we conduct ORBIT experi-ments configured as in Section 3.1 (IEEE 802.11a, 75 STAswith realistic arrivals, and up to 4 APs). We then designatetwo of the stations randomly as VoIP devices and allowthem to each initiate a VoIP call towards our sink on thewired network of the testbed. VoIP sessions start at uni-formly distributed random times during the experimentand last for 270 s. A VoIP call runs over an RTP/UDP sessionusing G.711 with one sample per packet as the codec (voiceactivity detection disabled). For each VoIP call, we measurepacket error rate, mean jitter, and mean latency. Table 4summarizes results from these experiments.
As per ITU-T Recommendation G.114 [27], we consider150 ms as the upper latency limit for acceptable VoIP com-munications. Similarly, we consider 75 ms and 3% theupper limits on jitter and packet loss, respectively [28].Our key observations follow:
� A single congested access point can support two VoIPcalls with acceptable performance, even without theuse of WME quality of service differentiation.
� The two VoIP calls can be supported with adequate per-formance only in a congested environment with nomore than two interfering APs. With the addition ofthe third AP, packet loss rate and latency values for bothVoIP calls approach the limits described above. For fourAPs, packet error rates and latency reach an unaccept-able 11% and 300 ms, respectively.
Overall, the addition of two VoIP flows has a negligibleeffect on the throughput of the other TCP flows, since eachVoIP flow only generates an application layer load of64 Kbits/s. We do not observe unacceptable jitter in anyrepetition of the experiment, likely because the VoIP recei-
7 WME is an interoperability standard from the WiFi Alliance based onthe IEEE 802.11e standard [14].
ver was placed only one hop away from the VoIP sourceson our wired testbed network.
These results indicate that for WLAN-enabled hybridphones to work well in interference-limited multi-APdeployments (e.g., apartments with many residents eachusing their own WLAN) changes to legacy IEEE 802.11a/b/g are inevitable. Next, we investigate whether the recentchanges provided by WiFi Alliance’s WME address thisproblem.
5.2. Performance over IEEE 802.11e (WME)
For WME experiments, we relied on QualNet simula-tions, because MadWifi WME implementation [15] on Ath-eros WLAN hardware was in its early stages ofdevelopment while we conducted our experiments. Wefirst conduct WME-enabled version of the VoIP experi-ments we carried out in the ORBIT testbed with two VoIPdevices, for the purposes of facilitating direct comparisons.Then, we also experiment with a higher number of VoIPsessions as well as scenarios involving video streamingsessions. For the latter, we use the mean opinion score(MOS) metric to characterize user perceived audio qualityof VoIP calls. For the video streaming traffic, we configuredthe throughput mean and variance of the offered load tothose captured from a five minute long movie segment en-coded from DVD using DivX 5.1. The mean data rate of thestream used in the experiments presented here was382.5 Kbit/s.
We assign application traffic to the WME MAC accessqueues as follows: video streaming to the Video queue(WME_AC_VI), and VoIP calls to the Voice queue(WME_AC_VO) and all other TCP data flows to the Best Ef-fort queue (WME_AC_BE). EDCA parameter-set values forall four access queues conform to the default values sug-gested by the IEEE 802.11e standard [14].
Results from the WME-enabled simulations of one andfour AP networks are given in Table 5, and they can becompared to the ones reported in Table 4, obtained fromthe experiments on the ORBIT testbed. Fig. 11 presentsthe results from the second set of experiments where wereport the subjective quality for each of the VoIP calls interms of MOS. These experiments vary the number of VoIPand video streaming sessions and the number of interfer-ing access points. We observe that:
� Use of WME improves media quality in the multi-cellcase. Average latency values of the two VoIP calls inthe four AP network remains acceptable, in contrast tothe non-WME case. With WME, up to 10 concurrent

Table 5Simulated VoIP performance
No. of APs VoIP Call #1 VoIP Call #2
Packet drop rate (%) Avg. jitter (ms) Avg. latency (ms) Avg. drop rate (%) Avg. jitter (ms) Avg. latency (ms)
1 0 1.01 30 0 1.21 344 4.11 6.86 117 6.20 7.24 126
Fig. 11. Simulated VoIP MOS results for varying intensities of multimedia traffic carried over one and four AP networks using IEEE 802.11e (WME).
Fig. 12. Default value for AIFSN parameter of IEEE 802.11e Best Effortqueue results in decreasing throughput for bulk data traffic, even in theabsence of any multimedia traffic.
M.A. Ergin et al. / Computer Networks 52 (2008) 2728–2744 2739
VoIP sessions can now be supported with a MOS at thefair level, compared to 2 VoIP sessions with 2 interferingaccess points without WME.
� With increasing amounts of media traffic, the MOS forVoIP sessions still indicate significant quality degrada-tion. At 10 video and 10 concurrent VoIP sessions, aver-age quality approaches the poor rating.
� While not shown in the figure, we also observed a ten-fold increase in video streaming jitter for the four APscenario. For non-interactive videos this can likely beaddressed through application buffering. For video con-ferencing applications, however, this jitter may beunacceptable.
As expected, we observed a throughput reduction forbest effort traffic when more media streams are added,demonstrating effective MAC layer prioritization of mediatraffic. Also note that switching to WME reduces capacityeven without media traffic, because the best effort queueto which all regular traffic is assigned uses a larger inter-frame space than default IEEE 802.11a/b/g (i.e., an AIFSNof 3). This increase in the interframe space by one slot(9 ls for IEEE 802.11a, and 20 ls for IEEE 802.11b) resultsin an 14% reduction of best effort throughput with 32 sta-tions and 4 APs in IEEE 802.11a. We observed that up to14% drop in throughput was likely for 32 station 4 APWME simulations, when compared to the results from leg-acy IEEE 802.11a (see Fig. 12).
Overall, WME provides an improvement in interferencetolerance but not a complete solution. Additional measureswill be needed to make media traffic resilient against inter-cell interference. We investigate such additional tech-niques next.
6. Improving performance of unplanned dense APdeployments
We have seen that inter-cell interference reducescumulative throughput in WLAN systems with TCP-domi-nant workloads much more significantly than intra-cellcontention. Also, the detrimental effects of inter-cell inter-ference are more severe on multimedia traffic.

2740 M.A. Ergin et al. / Computer Networks 52 (2008) 2728–2744
We propose a contention window adaptation solutionthat addresses this challenge at the MAC layer. We proposea MAC layer solution because the root cause of the prob-lems we observed was increasing contention due to addedinterference, and it could be best addressed with a localsolution at the wireless last hop. End-to-end approaches(e.g., TCP tweaks) or network-wide solutions (e.g., IPtweaks) are undesirable due to changes that will be re-quired at millions of hosts all over the world. The otherPHY/MAC layer techniques are complimentary to our pro-posal, they can increase overall capacity, but in chaoticdense deployments several interfering access points mightstill remain after applying these techniques. Most relevantones are visited in Section 7.
We first describe and evaluate the contention windowadaptation approach, and then end with a discussion thathighlights other challenges that should be addressed fora complete system solution.
6.1. CWmin adaptation using active AP count
It is well-known that IEEE 802.11 MAC performance canbe improved by selecting a CWmin appropriate for the cur-rent number of active clients in the network [29–31]. Wepropose instead that the selection of CWmin for a typicalTCP dominated multi-cell WLAN system should be based onthe number of interfering access points, not the number of cli-ents. This method provides the following advantages:
� Knowing the number of access points allows more accu-rate selection of CWmin under a TCP workload thanknowing the number of transmitting clients. As our ear-lier analysis has shown the collision rate under TCP isdetermined by the number of access points, since TCPflow control regulates client activity.
� The number of active APs is easier to obtain than thenumber of clients, since APs announce their presencethrough beacon packets and tend to remain active andstationary over longer durations. Clients might also helpdetermining the number of access points by listening forAP beacon packets.
Given the number of active APs Nb, the optimal conten-tion window can be derived by combining our insightregarding the number of backlogged stations under TCPworkloads with earlier contention window adaptationwork. According to [31] bandwidth can be maximized with
a contention window CW�j ¼
ffiffiffiffiffiffiffiffi2bT 0Dp
rjþ 1, where
b ¼ RMj¼1Njrj
� �2� RM
j¼1Njr2j and Nj is the number of active
users for each priority queue. Since we do not considermultiple priority queues here, b reduces to N(N � 1). Alsosubstituting T 0D ¼ T
Tsyields
CWmin ¼
ffiffiffiffiffiffiffiffiffiffiffiffiffiffiffiffiffiffiffiffiffiffiffiffiffiffiffiffi2NðN � 1Þ T
Ts
sþ 1; ð2Þ
where T is the time required for the transmission of a MACframe (excluding DIFS and backoff, including ACK recep-tion), and Ts is the duration of a MAC time-slot. Using theinsight from Section 4 that the number of backlogged sta-tions equals twice the number of active access points, we
can substitute N = 2Nb, which formulates CWmin in termsof the number of active access points as
CWmin ¼ 2
ffiffiffiffiffiffiffiffiffiffiffiffiffiffiffiffiffiffiffiffiffiffiffiffiffiffiffiffiffiffiffiffiNbð2Nb � 1Þ T
Ts
sþ 1: ð3Þ
6.2. Implementation of CWmin adaptation
This subsection describes an AP-centric algorithm fordetermining the number of active access points Nb and dis-tributing the CWmin setting. While a client-centric or hy-brid approaches are also possible, we have chosen thisapproach because it minimizes the number of devices thatneed to be modified to the access points.
The number of active access points Nb should ideallyonly include access points that actively communicate withat least one client. Since APs transmit beacons even whennone of their clients are active, however, the proposedalgorithm determines the expected E[Nb], by consideringthe percentage of the time neighboring APs consume chan-nel resources. The IEEE 802.11h standard [32], which de-fines spectrum and transmit power managementextensions, allows for channel-related measurement-ex-change mechanisms that can be extended to supportE[Nb] calculation in a standards-compliant way.
Algorithm 1. CWmin update algorithm APs execute. It findsthe effective number of active APs in the vicinity and usesthis to update CWmin and propagate it further down to itsSTAs with the next beacon.
// Accepts: CurrentChannel, tp, T, Ts
// Updates: (System Parameter) CWmin
1. for every tp seconds do2. NeighborAPList[]=doBackgroundScan
(CurrentChannel);3. for each APi in NeighborAPList[] do4. sendFrame(80211H_MEASR_REQUEST, APi);5. recvFrame=readFrame
(80211H_MEASR_REPORT);6. %_Backlgi=parseFrame(recvFrame,
BACKLOG_FRACTION);7. end8. %_Busyself = measure(CHANNEL_BUSY_FRACTION,
self);9. E½Nb� ¼ 1
100 � ½% Busyself þP8i% Backlgi�;
10. CWmin ¼ d2ffiffiffiffiffiffiffiffiffiffiffiffiffiffiffiffiffiffiffiffiffiffiffiffiffiffiffiffiffiffiffiffiffiffiffiffiffiffiffiffiffiE½Nb�ð2E½Nb� � 1Þ T
Ts
qþ 1e;
11. update_EDCA_ParamSet(CWmin);12. end
The AP-centric approach for this purpose is outlined inAlgorithm 1. The algorithm periodically calculates CWmin
every tp seconds by requesting neighboring APs (visiblethrough their beacons) to report the percentage of the timetheir frame queues were not empty (i.e. BACKLOG_FRAC-TION) during the last tp seconds. This message exchangecan be implemented within the IEEE 802.11h measure-ment request/report framework by using one of the re-served measurement type definitions. Querying AP sends

M.A. Ergin et al. / Computer Networks 52 (2008) 2728–2744 2741
an IEEE 802.11h measurement request frame (80211H_MEASR_REQUEST) to the AP of interest, and the receivingAP responds to this with a measurement report frame(80211H_MEASR_REPORT) including its BACKLOG_FRAC-TION measurement (see lines 2–7 of the algorithm). Thesereports from neighboring APs, when combined with themeasuring access point’s own wireless channel-busy per-centage measurement (CHANNEL_BUSY_FRACTION), allowdetermining E[Nb] more precisely; a neighboring AP whichis backlogged 50% of the time for example, increases E[Nb]by 1
2. E[Nb] calculated this way is used to update CWmin (seeline 10 of the algorithm), which in turn is included in thenext AP beacon to be announced to the STAs of this APthrough IEEE 802.11e EDCA parameter set information ele-ment [14].
6.3. Simulation results
We conduct fixed-bit-rate simulations with 32 STAs toobserve the potential improvement that our CWmin selec-tion can provide. The results assume that all stations accu-rately estimate the number of active access points. Fig. 13shows that for both exact CWmin values suggested by theEq. (3) above, and for the nearest power of two (which isa practical restriction in today’s WLAN hardware), CWmin
adaptation based on the number of APs reduced the colli-sion-based losses significantly, keeping them close to theresidual collision losses of a single AP scenario. Also, thegranularity of CWmin adaptation in powers of two doesnot have a significant negative effect on performance. Notethat reduction in PER not only improves throughput butalso reduces delay that affected multimedia streams as de-scribed in Section 5.
Note that the optimality of this CWmin tuning strategy,in terms of achieving proportionally fair bandwidth alloca-tion and maximizing utilization has already been shown in[31]. Note also that, in the trivial case of a single-cell, Nb = 1and CWmin is reduced to a constant, consistent with the re-sult that, in the case of a single-cell, the number of back-logged stations is constant. Finally, the proposed CWmin
adaptation strategy is optimized for TCP dominated work-
Fig. 13. Simulations with 32 STAs showing potential gains from incorporating A(b), throughput curves for ‘‘Optimal CWmin” and ‘‘Nearest practical CWmin” almo
loads (as compared to the earlier work which provides asolution for UDP-dominated workloads [31]). In mixedtraffic environments, where UDP accounts for a significantshare of network traffic and is used on many stations, theproposed solution would have to take into account the in-crease in the number of active nodes due to this additionalUDP traffic. Estimating the exact number of active nodes inthis case remains an interesting open topic for future work.
6.4. Discussion: relationship to collision-resilient bit-rateadaptation
Collision-aware rate adaptation is a further MAC layertechnique to improve performance in congested IEEE802.11 networks. Prior work [9,33,34] has shown thatmany bit-rate algorithms choose low bit-rates in congestedenvironments – short-term collision errors are misinter-preted as longer-term changes in path loss. The bit-ratereduction further decreases available capacity, leading tomore collisions.
One might believe that CWmin adaptation eliminates theneed for collision-aware rate adaptation techniques be-cause it substantially reduces collisions. From the CWmin
adaptation results in Fig. 13a, we observe, however, thateven at the optimal operating point a residual collision rateremains. We also observe from our multi-cell experimentsthat bit-rate adaptation is responsible for a substantialfraction of throughput loss and that even with the residualcollision rate bit-rate adaptation in the MadWifi driverdoes not choose optimal rates. Fig. 14 shows the bit-ratedistribution of SampleRate [35], the default bit-rate adap-tation scheme in the MadWifi driver, for up to 10 accesspoints and 50 clients. With more APs, an increasing per-centage of frames are transmitted at the lower bit-rates,even though signal-to-noise ratio (SNR) at most receiversin our experiment environment is high enough for commu-nication at 54 Mbits/s and the total number of clients re-mains constant. For example, 60% of frames use 6 Mbits/sfor the 10 AP experiment. Even with the residual collisionrate in the one AP case, however, less than 20% of framesare transmitted at the optimal bit-rate of 54 Mbit/s.
P Count-based CW adaptation into WLAN with inter-cell interference (inst overlap).

Fig. 14. Empirical IEEE 802.11 bit-rate distribution with the SampleRatealgorithm.
2742 M.A. Ergin et al. / Computer Networks 52 (2008) 2728–2744
Hence, we believe that improving the collision-resil-iency of bit-rate adaptation mechanisms must be an inte-gral part of the solution space. Based on the observationsin [34,36,33], a potential solution to achieving collision-resiliency could be through the adaptive use of the RTS/CTS mechanism. Rate adaptation algorithms could leveragethis backwards-compatible mechanism such that theyignore RTS losses, which could be due to collision, and re-act only to data packet losses that occur after the channel isreserved. Packet losses that occur when the channel is re-served are most likely because SNR at the receiver is nothigh enough to support the current bit-rate. Thus, thismechanism could be used to distinguish between lossesdue to collision and those due to poor channel conditions.
7. Related work
Related work, most relevant to our study, that modelsthe interaction between TCP and IEEE 802.11 is presentedin [6,23,26]. Choi et al. [6] and Bruno et al. [23] show thatfor both downlink and uplink traffic, cumulative TCPthroughput does not degrade in single-cell WLANs. In[26], a discrete time model explaining the interaction be-tween TCP and IEEE 802.11 is presented for a networktopology consisting of multiple source destination pairsalong with an infrastructure-like network. In this paper,we showed that their model can also be extended for mul-ti-cell infrastructure networks. In addition, the authors of[37], study TCP fairness in the presence of simultaneousuplink and downlink traffic and observed significantunfairness among TCP flows. They model the interactionbetween TCP and IEEE 802.11 but do not consider the ef-fect of MAC congestion. We differ from all these studiessince we study the interaction between TCP and IEEE802.11 for high-density multi-cell WLANs.
Several studies in the past have also proposed tuningthe contention window (CW) to maximize utilization[29–31]. In [29], the authors determine that finding a bal-ance between the bandwidth loss associated (i) with colli-sions and (ii) with the time spent by the nodes backing off(idle period) is possible. Heusse et al. [30] use an AIMDalgorithm to tune the CW so as to maintain the idle periodat a desirable level. Hu et al. [31] analyze the ability of IEEE
802.11e EDCA [14] to maximize bandwidth utilization andprovide service differentiation. However, all these studiesfocus on the single-cell WLAN and address the situationof multiple competing clients. We believe that we are thefirst to apply CWmin adaptation to mitigate interferencefrom adjacent BSSs in unplanned deployments.
Apart from CWmin adjustment, there are a number ofcomplementary techniques to address interference-basedperformance degradation in IEEE 802.11 WLANs. Theycan be grouped into the following broad categories:
Transceiver parameter optimization: This category in-cludes transmit power, carrier sense threshold and recei-ver sensitivity adjustments. In [38], the authors proposetuning the carrier sense threshold at the receiver to miti-gate interference effects and a dynamic power manage-ment technique to reduce interference in unplanneddeployments is proposed in [2]. In [39], a combination ofreceiver sensitivity and clear-channel-assessment adapta-tion is proposed. However, the authors themselves pointout the suboptimal behavior of their approaches in uncoor-dinated environments. More recently [40], proposes a dis-tributed algorithm to jointly adjust transmit power andIEEE 802.11 bit-rate to reduce interference while not sacri-ficing performance.
Channel assignment: This category includes static anddynamic channel assignment techniques to mitigate inter-ference. In [41], the authors show that static channelassignment techniques cause unfairness in unplanneddeployments and then describe a decentralized channelhopping scheme that improves fairness by distributinginterference evenly among neighboring BSSs. We arguethat this solution may not fully be able to mitigate conten-tion in environments where the number of interfering APsare higher than the number of orthogonal channels. TheCFAssign-RaC algorithm presented in [42] jointly addressthe issues of channel assignment and load balancing incentrally administered WLANs. Given the uncoordinatednature of the deployments we consider, this solution isnot directly applicable here.
Association control and load balancing: These approachesbalance client load across a set of APs [42–44] by changingthe point of association of the clients. For that reason, theyhave an inherent assumption of requiring coordination andorthogonality of channels across APs. Recently, [10] pro-pose an association management solution to preventWLANs from accepting more clients than they can serveefficiently. However, their solution mandates that clientsincur delays on the order of minutes.
Some WLAN equipment vendors [45–47] offer WLANcontroller-based products that improve performance inhigh-density deployments through load balancing andother proprietary algorithms. These products are targetedat planned deployments where all access points are con-nected to the same controller infrastructure, hence theydo not address unplanned deployments.
8. Conclusions
In this work, we have investigated the effect of inter-cell interference on unplanned WLAN performance. While

M.A. Ergin et al. / Computer Networks 52 (2008) 2728–2744 2743
inter-cell interference should ideally be avoided throughcareful access point placement, frequency selection, andtransceiver parameter control, current chaotic wirelessdeployments and the limited number of available channelsmake inter-cell interference a reality. Therefore, we havemeasured the effect of such interference both in a testbedwith more than one hundred nodes and through simula-tions. We have
� Found that cumulative throughput degrades signifi-cantly, by 50% with four interfering access points, whileit remains remarkably robust with over one hundred cli-ents in the single-cell case.
� Verified that TCP’s flow control leads to an average of 2inodes concurrently backlogged in the network, where iis the number of actively interfering access points. Thus,the collision rate increases with the number of accesspoints. TCP does not adjust its flow rate to optimizethroughput for different CWmin choices.
� Showed that increased collision rate with inter-cellinterference also affects media streaming. With onlytwo congested interfering access points, VoIP meanopinion score (MOS) is unsatisfactory.
� Described a novel and practical approach that selects theappropriate CWmin based on the number of active accesspoints, not the number of active clients. This approachleads to increased throughput in a network with primar-ily TCP workloads.
These findings underline the need to consider systemperformance in addition to studying the MAC layer in isola-tion. We also point out the importance of collision-resilientrate adaptation algorithms. Even with improved CWmin
selection, a further 20% cumulative throughput gain maybe possible through collision-resilient bit-rate adaptation.
Acknowledgement
We thank Dipankar Raychaudhuri and Ivan Seskar ofWINLAB, Rutgers University for their valuable commentson this study. This material is based upon work supportedby the National Science Foundation under Grants Nos. CNS0335244 and CNS 0627032.
References
[1] ABI research <http://www.abiresearch.com>, 2007.[2] A. Akella, G. Judd, S. Seshan, P. Steenkiste, Self-management in
chaotic wireless deployments, in: Proceedings of ACM MOBICOM,2005, pp. 185–199.
[3] Extricom, Inc. <http://www.extricom.com>.[4] G. Bianchi, Performance analysis of the IEEE 802.11 distributed
coordination function, IEEE JSAC 18 (3) (2000) 535–547.[5] P. Gupta, P. Kumar, The capacity of wireless networks, IEEE Trans.
Info. Theory 46 (2000) 388–404.[6] S. Choi, K. Park, C. Kim, On the performance characteristics of
WLANs: revisited, SIGMETRICS Perform. Eval. Rev. 33 (1) (2005) 97–108.
[7] T. Henderson, D. Kotz, I. Abyzov, The changing usage of a maturecampus-wide wireless network, in: Proceedings of ACM MOBICOM,2004, pp. 187–201.
[8] A. Balachandran, G.M. Voelker, P. Bahl, P.V. Rangan, Characterizinguser behavior and network performance in a public wireless LAN, in:Proceedings of SIGMETRICS, 2002, pp. 195–205. URL <http://doi.acm.org/10.1145/511334.511359>.
[9] A.P. Jardosh, K.N. Ramachandran, K.C. Almeroth, E.M. Belding-Royer,Understanding congestion in IEEE 802.11b wireless networks, in:Proceedings of USENIX IMC, 2005, pp. 279–292.
[10] A.P. Jardosh, K. Mittal, K.N. Ramachandran, E.M. Belding, K.C.Almeroth, IQU: Practical queue-based user association managementfor WLANs, in: Proceedings of ACM MOBICOM, 2006, pp. 158–169.
[11] M.A. Ergin, K. Ramachandran, M. Gruteser, Understanding the effectof access point density on wireless LAN performance, in:Proceedings of ACM MOBICOM, 2007, pp. 350–353.
[12] D. Raychaudhuri, I. Seskar, M. Ott, S. Ganu, K. Ramachandran, H.Kremo, R. Siracusa, H. Liu, M. Singh, Overview of the orbit radio gridtestbed for evaluation of next-generation wireless networkprotocols, in: Proceedings of IEEE WCNC, vol. 3, 2005, pp. 1664–1669.
[13] Scalable Network Technologies, Qualnet v.3.9.5 user’s guide <http://www.qualnet.com>, May 2006.
[14] IEEE, Standard Document, IEEE Std 802.11e-2005 (Amendment toIEEE Std 802.11, 1999 Edition (Reaff 2003).
[15] MADWiFi, Multiband Atheros Driver for WiFi <http://madwifi.org>,2007.
[16] Wireless packet traces of the 62. IETF Meeting, archived atCRAWDAD <http://crawdad.cs.dartmouth.edu/ietf2005>.
[17] Acess Point Density Traces rutgers/ap_density at CRAWDAD <http://crawdad.cs.dartmouth.edu/rutgers/ap_density>, 2007.
[18] M. Takai, J. Martin, R. Bagrodia, Effects of wireless physical layermodeling in mobile ad hoc networks, in: Proceedings of ACMMOBIHOC, 2001, pp. 87–94.
[19] H. Chang, V. Misra, D. Rubenstein, A general model and analysis ofphysical layer capture in 802.11 networks, in: Proceedings of IEEEINFOCOM, 2006, pp. 1–12.
[20] R. Jain, D. Chiu, W. Hawe, A quantitative measure of fairness anddiscrimination for resource allocation in shared computer systems,Tech. Rep., DEC TR-301, September 1984.
[21] P. Barford, M. Crovella, Generating representative web workloads fornetwork and server performance evaluation, in: Proceedings of ACMSIGMETRICS, 1998, pp. 151–160.
[22] GNU wget file retrieval tool <http://www.gnu.org/software/wget>.[23] R. Bruno, M. Conti, E. Gregori, Performance modelling and
measurements of tcp transfer throughput in 802.11-based WLAN,in: Proceedings of ACM MSWiM, 2006, pp. 4–11.
[24] A. Botta, A. Dainotti, A. Pescape, Multi-protocol and multi-platformtraffic generation and measurement, in: IEEE INFOCOM 2007 DemoSession, 2007.
[25] Y. Xiao, J. Rosdahl, Throughput and delay limits of IEEE 802.11, IEEECommun. Lett. 6 (8) (2002) 355–357.
[26] Y. Gong, P. Marbach, Interaction of rate and medium access controlin wireless networks: the single cell case, in: Proceedings of ACMMOBIHOC, 2006, pp. 178–189.
[27] ITU-T Rec. G.114 One-way Transmission Time <http://tinyurl.com/2z4co5>.
[28] Cisco Systems Inc, White Paper – A clear understanding: what makesvoice over IP work? <http://tinyurl.com/3jko5>, 2002.
[29] F. Cali, M. Conti, E. Gregori, Dynamic tuning of the IEEE 802.11protocol to achieve a theoretical throughput limit, IEEE/ACM Trans.Netw. 8 (6) (2000) 785–799.
[30] M. Heusse, F. Rousseau, R. Guillier, A. Duda, Idle sense: an optimalaccess method for high throughput and fairness in rate diversewireless LANs, in: Proceedings of ACM SIGCOMM, 2005, pp. 121–132.
[31] C. Hu, J.C. Hou, A novel approach to contention control in IEEE802.11e-operated WLANs, Tech. Rep. UIUCDCS-R-2005-2600, Univ.of Illinois at Urbana-Champaign (August 2006).
[32] IEEE, Std. 802.11h: Wireless LAN medium access control (MAC) andphysical layer (PHY) specifications: Amendment 5: Spectrum andtransmit power management extensions in the 5 GHz band ineurope.
[33] J. Kim, S. Kim, S. Choi, D. Qiao, CARA: Collision-aware rate adaptationfor IEEE 802.11 WLANs, in: Proceedings of IEEE INFOCOM, Barcelona,Spain, 2006, pp. 1–11.
[34] K. Ramachandran, H. Kremo, M. Gruteser, P. Spasojevic, I. Seskar,Scalability analysis of rate adaptation techniques in congested IEEE802.11 networks: An orbit testbed comparative study, in:Proceedings of IEEE WoWMoM, 2007, pp. 1–12.
[35] J.C. Bicket, Bit-rate selection in wireless networks, Master’s thesis,M.I.T., Cambridge, MA, February 2005.
[36] S.H.Y. Wong, S. Lu, H. Yang, V. Bharghavan, Robust rate adaptationfor 802.11 wireless networks, in: Proceedings of ACM MOBICOM,2006, pp. 146–157.
[37] S. Pilosof, R. Ramjee, D. Raz, Y. Shavitt, P. Sinha, Understanding TCPfairness over Wireless LAN, in: Proceedings of IEEE INFOCOM, 2003,pp. 863–872.
2744 M.A. Ergin et al. / Computer Netw
[38] A. Vasan, R. Ramjee, T.Y.C. Woo, ECHOS - enhanced capacity 802.11hotspots., in: Proceedings of IEEE INFOCOM, 2005, pp. 1562–1572.
[39] J. Zhu, B. Metzler, X. Guo, Y. Liu, Adaptive csma for scalable networkcapacity in high-density WLAN: A hardware prototyping approach,in: Proceedings of IEEE INFOCOM, 2006, pp. 1–10.
[40] T.-S. Kim, J.C. Hou, H. Lim, Improving spatial reuse through tuningtransmit power, carrier sense threshold, and data rate in multihopwireless networks, in: Proceedings of ACM MOBICOM, 2006, pp.366–377.
[41] A. Mishra, V. Shrivastava, D. Agarwal, S. Banerjee, S. Ganguly,Distributed channel management in uncoordinated wirelessenvironments, in: Proceedings of ACM MOBICOM, 2006, pp. 170–181.
[42] A. Mishra, V. Brik, S. Banerjee, A. Srinivasan, W. Arbaugh, A client-driven approach for channel management in wireless LANs, in:Proceedings of IEEE INFOCOM, 2006, pp. 1–12.
[43] Y. Bejerano, S.-J. Han, L.E. Li, Fairness and load balancing in wirelessLANs using association control, in: Proceedings of ACM MOBICOM,2004, pp. 315–329.
[44] F. Guo, T. cker Chiueh, Scalable and robust WLAN connectivity usingaccess point array, in: Proceedings of DSN 2005, 2005, pp. 288–297.
[45] Aruba Networks, Inc. <http://www.arubanetworks.com>.[46] Cisco Systems, Inc. <http://www.cisco.com>.[47] Trapeze Networks <http://www.trapezenetworks.com>.
Mesut Ali Ergin ([email protected]) isa Ph.D. candidate in the Department of Elec-trical and Computer Engineering at Rutgers,the State University of New Jersey, USA andworks as a graduate assistant in WirelessInformation Networks Laboratory (WINLAB)since 2004. He received an MS degree inComputer Engineering from Bogazici Univer-sity, Turkey, and a BS degree in Control andComputer Engineering from Istanbul Techni-cal University, Turkey, in 2003 and 1999,respectively. His research interests include
design and evaluation of wireless and mobile systems for realistic futureusage scenarios. He is a member of the IEEE Communication Society.
Kishore Ramachandran ([email protected]) is a Ph.D. Candidate in theDepartment of Electrical and Computer Engi-neering at Rutgers University and a graduateresearch assistant at WINLAB. His researchinterests include wireless networks andmobile computing with an emphasis on radioresource management, network scalabilityand measurement. He received the M.S.degree in Computer and Systems Engineeringfrom Rensselaer Polytechnic Institute (RPI),NY. and the B.E. degree in Telecommunica-
tions Engineering from the University of Mumbai, India, in 2002 and2000, respectively.
orks 52 (2008) 2728–2744
Marco Gruteser ([email protected]) is an assistant professor at WINLAB,Rutgers University. His research interestsinclude location-aware networking andbuilding reliable, secure, and privacy-awarecommunication systems for vehicular net-works. He received his Ph.D. in computerscience from the University of Colorado atBoulder. He is a member of the IEEE ComputerSociety and the ACM.