Computer Assisted Image Analysis - Uppsala University “perfect solution” Similar to the...
40
Computer Assisted Image Analysis Lecture 1 - Introduction Amin Allalou [email protected] Centre for Image Analysis Uppsala University 2009-03-23 A. Allalou (Uppsala University) Introduction 2009-03-23 1 / 38
Transcript of Computer Assisted Image Analysis - Uppsala University “perfect solution” Similar to the...

Computer Assisted Image AnalysisLecture 1 - Introduction
Amin [email protected]
Centre for Image AnalysisUppsala University
2009-03-23
A. Allalou (Uppsala University) Introduction 2009-03-23 1 / 38
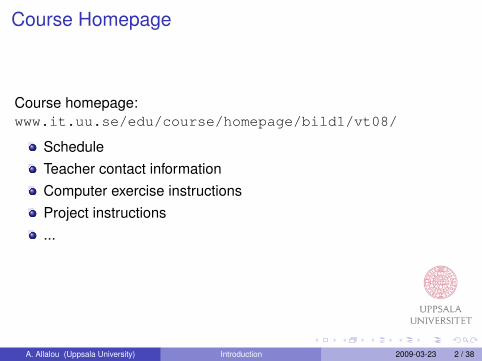
Course Homepage
Course homepage:www.it.uu.se/edu/course/homepage/bild1/vt08/
ScheduleTeacher contact informationComputer exercise instructionsProject instructions...
A. Allalou (Uppsala University) Introduction 2009-03-23 2 / 38

Course Litterature
Digital Image Processing 3rd Edition, by Gonzales and Woods(Digital Image Processing Using Matlab, by Gonzales and Woods)
Book homepage:www.imageprocessingplace.com
A. Allalou (Uppsala University) Introduction 2009-03-23 3 / 38

Teachers
Pollacksbacken, House 2, floor 1www.cb.uu.se
Amin Allalou (lectures and projects)[email protected]
Milan Gavrilovic(lectures and projects)[email protected]
Hamid Sarve (lecture)[email protected]
Gustaf Kylberg (lectures and labs)[email protected]
Patrik Malm (lectures and labs)[email protected]
A. Allalou (Uppsala University) Introduction 2009-03-23 4 / 38

Organisations
Swedish Society for Automated Image Analysiswww.ssba.org.se
Free membership for students
Newsletter (PDF)
Annual symposium
Annual summer school (3-4 days)
Member of IAPR
International Association for Pattern Recognitionwww.iapr.org
Newsletter
Conferences
Journals
A. Allalou (Uppsala University) Introduction 2009-03-23 5 / 38

Course Arrangement
18 lectures3 computer exercises (1-2 students per group)
I Introduction to digital image analysisI SegmentationI Classification
1 project (2 students per group)I Small “real world” problem
A. Allalou (Uppsala University) Introduction 2009-03-23 6 / 38

Computer Exercise 1Introduction to Digital Image Analysis
Learn how to work with an image in Matlab.
Histogram, filtering, arithmetics, FFT etc.Report done orally during lab sessionOtherwise hand in a written report
Good to idéa to start before the scheduled time.
A. Allalou (Uppsala University) Introduction 2009-03-23 7 / 38

Computer Exercise 2Segmentation
Segmentation and analysis of circular objects using Matlab ImageProcessing Toolbox.
Combine functions to segment and analyse image of coinsNo “perfect solution”Similar to the projects, but with more guidanceWritten lab report
A. Allalou (Uppsala University) Introduction 2009-03-23 8 / 38
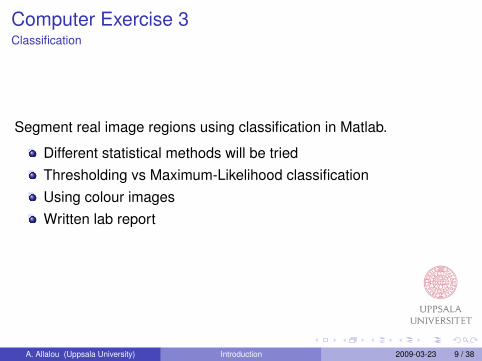
Computer Exercise 3Classification
Segment real image regions using classification in Matlab.
Different statistical methods will be triedThresholding vs Maximum-Likelihood classificationUsing colour imagesWritten lab report
A. Allalou (Uppsala University) Introduction 2009-03-23 9 / 38

Project
Experiment with Matlab (including the Image Processing Toolbox) tosolve a real image analysis problem.
10 different projects availableGroups of 2 students per groupNo time scheduled for projectExtensive reportOral presentation at the end of the course
A. Allalou (Uppsala University) Introduction 2009-03-23 10 / 38

IntroductionWhat is a digital image?
rat.png Rat nose
>> I = imread (’rat.png’ ) ;>> A = I (26 :35 , 125:134)A =
94 100 104 119 125 136 143 153 157 158103 104 106 98 103 119 141 155 159 160109 136 136 123 95 78 117 149 155 160110 130 144 149 129 78 97 151 161 158109 137 178 167 119 78 101 185 188 161100 143 167 134 87 85 134 216 209 172104 123 166 161 155 160 205 229 218 181125 131 172 179 180 208 238 237 228 200131 148 172 175 188 228 239 238 228 206161 169 162 163 193 228 230 237 220 199
A. Allalou (Uppsala University) Introduction 2009-03-23 11 / 38

Why Digital Image Analysis?
HumanIdentificationRecognitionSee and describe relationsInterpretation usingexperience
ComputerMeasuring absolute valuesPerform calculationsNever gets tiredCheapFastObjective
A. Allalou (Uppsala University) Introduction 2009-03-23 12 / 38
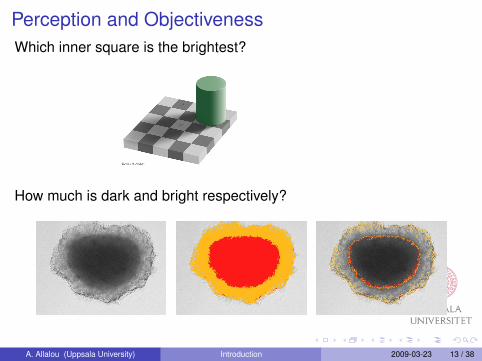
Perception and ObjectivenessWhich inner square is the brightest?
How much is dark and bright respectively?
A. Allalou (Uppsala University) Introduction 2009-03-23 13 / 38

Perception and ObjectivenessWhich inner square is the brightest?
How much is dark and bright respectively?
A. Allalou (Uppsala University) Introduction 2009-03-23 14 / 38

Application ExamplesAgricultural and Environmental
A. Allalou (Uppsala University) Introduction 2009-03-23 15 / 38

Application ExamplesMedical and Biomedical
A. Allalou (Uppsala University) Introduction 2009-03-23 16 / 38

Problem Solving Using Image AnalysisFundamental steps
Problem
Image acquisition
Preprocessing
Segmentation Representation
Classification
Knowledge base
Result
Low level
Intermediate level
High level
A. Allalou (Uppsala University) Introduction 2009-03-23 17 / 38

Image Processing vs Image AnalysisDifference in Terminology
Image Processing
=⇒
Image Analysis
=⇒
Blue eyes8cm earsGreek flag
A. Allalou (Uppsala University) Introduction 2009-03-23 18 / 38
Course Contents
DigitizationPointwise operationsLocal neighbourhood operationsFourier transform (FFT)SegmentationMathematical morphologyObject description and representationWaveletsImage restorationColourClassificationImage coding and compression
A. Allalou (Uppsala University) Introduction 2009-03-23 19 / 38

Electromagnetic Spectrum
A. Allalou (Uppsala University) Introduction 2009-03-23 20 / 38
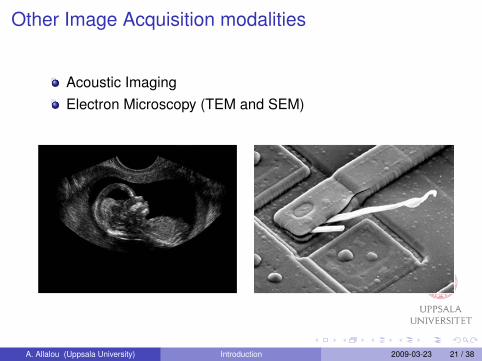
Other Image Acquisition modalities
Acoustic ImagingElectron Microscopy (TEM and SEM)
A. Allalou (Uppsala University) Introduction 2009-03-23 21 / 38

Creating a Digital Image
Illumination source
Scene elementImaging system
Imageplane
A. Allalou (Uppsala University) Introduction 2009-03-23 22 / 38

Creating a Digital Image
Illumination source
Scene elementImaging system
Imageplane
A. Allalou (Uppsala University) Introduction 2009-03-23 22 / 38

Creating a Digital Image
Illumination source
Scene elementImaging system
Imageplane
Output
A. Allalou (Uppsala University) Introduction 2009-03-23 22 / 38

Sensors
Point scanner
Line scanner
Array scanner
A. Allalou (Uppsala University) Introduction 2009-03-23 23 / 38

Digital Images
A 2D grayscale image f (x, y)The value of f (x, y) is the intensity, or graylevel, at position (x, y).When an image is digitized it is sampled in
SPACE (x, y): image samplingAMPLITUDE f (x, y): graylevel quantization
94 100 104 119 125 136 143 153 157 158103 104 106 98 103 119 141 155 159 160109 136 136 123 95 78 117 149 155 160110 130 144 149 129 78 97 151 161 158109 137 178 167 119 78 101 185 188 161100 143 167 134 87 85 134 216 209 172104 123 166 161 155 160 205 229 218 181125 131 172 179 180 208 238 237 228 200131 148 172 175 188 228 239 238 228 206161 169 162 163 193 228 230 237 220 199
A. Allalou (Uppsala University) Introduction 2009-03-23 24 / 38

Spatial Sampling
A. Allalou (Uppsala University) Introduction 2009-03-23 25 / 38

Spatial Sampling
512 256 128
64 32
A. Allalou (Uppsala University) Introduction 2009-03-23 26 / 38
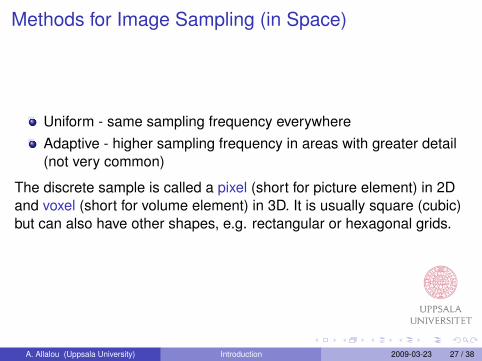
Methods for Image Sampling (in Space)
Uniform - same sampling frequency everywhereAdaptive - higher sampling frequency in areas with greater detail(not very common)
The discrete sample is called a pixel (short for picture element) in 2Dand voxel (short for volume element) in 3D. It is usually square (cubic)but can also have other shapes, e.g. rectangular or hexagonal grids.
A. Allalou (Uppsala University) Introduction 2009-03-23 27 / 38

Sampling Density and Resolution
Resolution is the smallest discernible detail in an image.The sampling density (together with the imaging system) limits theresolution.Sampling density at scanning is often measured in dots per inch(dpi) = pixels per 2.5 cm on the input object (e.g. paper). The“dot-size” may however be greater than the distance between twosamples, leading to a lower resolution. Always test!Sample twice as often as the smallest detail you need to resolve.
A. Allalou (Uppsala University) Introduction 2009-03-23 28 / 38

Graylevel Quantization
256 32
8 2
A. Allalou (Uppsala University) Introduction 2009-03-23 29 / 38

Graylevel Quantization
256 128 64 32
16 8 4 2
A. Allalou (Uppsala University) Introduction 2009-03-23 30 / 38

Methods for Quantization (in Amplitude)
Uniform (linear) - the intensities of the object are mapped directlyto the graylevels of the image.Logarithmic - higher intensity resolution in darker areas (thehuman eye is logarithmic).
imag
ein
tens
ity
object intensityim
age
inte
nsity
object intensity
A. Allalou (Uppsala University) Introduction 2009-03-23 31 / 38

Common Quantization Levels
Image values when using integers, f (x, y) ∈ [0, 2n − 1].
Bits Interval Commentn = 1 [0, 1] “binary image”n = 5 [0, 31] what the human can resolve locallyn = 8 [0, 255] 1 byte, very commonn = 16 [0, 65535] common in imaging systemsn = 24 [0, 16.2× 10⁶] common in colour images (3× 8 bit for RGB)
A. Allalou (Uppsala University) Introduction 2009-03-23 32 / 38

Choice of Sampling
What will the image be used for?What are the limitations in memory and speed?Will we only use the image for visual interpretation or do we wantto do any image analysis?What information is relevant for the analysis (i.e., color, spatialand/or graylevel resolution)?
A. Allalou (Uppsala University) Introduction 2009-03-23 33 / 38

Resampling, Graylevel Interpolation
Nearest neighbour, NN.Bilinear, interpolation from four closest neighbours.
g(x, y)
T
f (x, y)
Resampling
A. Allalou (Uppsala University) Introduction 2009-03-23 34 / 38

Resampling, Graylevel Interpolation
Original imageRotation with NN
interpolationRotation with bilinear
interpolation
A. Allalou (Uppsala University) Introduction 2009-03-23 35 / 38

Aliasing when Sampling
The image information may be obscured if the sampling frequency isdifferent from “frequencies” in the image.
A. Allalou (Uppsala University) Introduction 2009-03-23 36 / 38

Examples of Aliasing Effects
NN
Bilinear
The frequency of thin lines is too high tobe correctly represented when the imageis subsampled to 1/4 of its size.
This image was scannedfrom a magazine,resulting in a patterndue to the frequency ofthe raster in the printing.
A. Allalou (Uppsala University) Introduction 2009-03-23 37 / 38

Review Questions
What is the difference between image processing and imageanalysis?Spatial sampling vs. graylevel quantization?What is the difference between nearest neighbour and bilinearinterpolation?How often should you sample with respect to the smallest detailthat needs to be resolved?What is aliasing?
A. Allalou (Uppsala University) Introduction 2009-03-23 38 / 38


![Metrotomography University Uppsala OPT [Kompatibilitetsläge]](https://static.fdocuments.us/doc/165x107/6169eddf11a7b741a34ceeae/metrotomography-university-uppsala-opt-kompatibilitetslge.jpg)