computer aided iterative design-a future trend in computer aided engineering software
6
COMPUTER AIDED ITERATIVE DESIGN – A FUTURE TREND IN COMPUTER AIDED ENGINEERING SOFTWARE Yo-Ming Hsieh * and Song-Xu Tsai Department of Construction Engineering, National Taiwan University of Science and Technology, Taipei, Taiwan * Corresponding author ([email protected] ) ABSTRACT: Typical engineering design processes involve an initial design, followed by iterations of analyses, interpreting and evaluating analyses results, and proposing new design or modifying existing design. The final design often results from intuitions obtained during this iterative process. Most computer-aided engineering (CAE) software focuses on the computer-aided analysis by advancing capabilities in pre-processing, computation, and post-processing. However, little attention has been paid to the support of the aforementioned iterative design process, which is the common practice in engineering design. Authors believe the next-generation CAE software should evolve into CAID (Computer- Aided Iterative Design) software to help engineers go through the iterative design process and develop better engineering designs. In this paper, key software requirements for the iterative design process are discussed in this work. Furthermore, prototype CAID software developed using C ++ , Qt, and VTK is demonstrated. The analyzing capability of the developed CAID software is based on an essential software framework for meshfree methods (ESFM). The proposed CAID concept and prototype software shall provide guidelines for future CAE software development. Keywords: Computer-aided Design, Computer-aided Engineering, Meshfree, Meshless 1. INTRODUCTION Computer-aided engineering (CAE) software such as ABAQUS and ANSYS, among many others, has become one of the essential tools in engineering designs. By using CAE software, engineering designs can be objectively evaluated and their performances can be predicted to see if requirements can be fulfilled. In general, designs must go through an iterative process depicted in Fig. 1: Fig. 1 General Engineering Design Process CAE software generally divides an engineering analysis into three steps: 1) pre-processing, 2) analysis/calculation, and 3) post-processing. Pre-processing prepares computer models that can be understood by the calculation module; analysis/calculation computes solutions based on user-defined procedures in the prepared model; post- processing visualizes the computed solutions to help users check performances and gain insights to the analyzed problem. Most CAE software has invested significant effort to perfect these three steps, i.e. the upper part of Fig. 1, to help users easily and intuitively create models and generates meshes in finite element methods (FEM), to incorporate and to advance analyzing capabilities (e.g. multi-physics) to achieve realism in simulations, and to conveniently visualize and explore computed solutions. However, the iterative design process (i.e. the bottom part of Fig 1.) has received little or no attention, and this is unfortunate because the iterative design process, taking engineers from reported results to the next design, helps and inspires engineers devise better engineering designs. S31-6 1110
Transcript of computer aided iterative design-a future trend in computer aided engineering software

COMPUTER AIDED ITERATIVE DESIGN – A FUTURE TREND IN COMPUTER AIDED ENGINEERING SOFTWARE
Yo-Ming Hsieh* and Song-Xu Tsai
Department of Construction Engineering, National Taiwan University of Science and Technology, Taipei, Taiwan
* Corresponding author ([email protected])
ABSTRACT: Typical engineering design processes involve an initial design, followed by iterations of analyses,
interpreting and evaluating analyses results, and proposing new design or modifying existing design. The final design
often results from intuitions obtained during this iterative process. Most computer-aided engineering (CAE) software
focuses on the computer-aided analysis by advancing capabilities in pre-processing, computation, and post-processing.
However, little attention has been paid to the support of the aforementioned iterative design process, which is the common
practice in engineering design. Authors believe the next-generation CAE software should evolve into CAID (Computer-
Aided Iterative Design) software to help engineers go through the iterative design process and develop better engineering
designs. In this paper, key software requirements for the iterative design process are discussed in this work. Furthermore,
prototype CAID software developed using C++, Qt, and VTK is demonstrated. The analyzing capability of the developed
CAID software is based on an essential software framework for meshfree methods (ESFM). The proposed CAID concept
and prototype software shall provide guidelines for future CAE software development.
Keywords: Computer-aided Design, Computer-aided Engineering, Meshfree, Meshless
1. INTRODUCTION
Computer-aided engineering (CAE) software such as
ABAQUS and ANSYS, among many others, has become
one of the essential tools in engineering designs. By
using CAE software, engineering designs can be
objectively evaluated and their performances can be
predicted to see if requirements can be fulfilled. In
general, designs must go through an iterative process
depicted in Fig. 1:
Fig. 1 General Engineering Design Process
CAE software generally divides an engineering analysis
into three steps: 1) pre-processing, 2) analysis/calculation,
and 3) post-processing. Pre-processing prepares
computer models that can be understood by the calculation
module; analysis/calculation computes solutions based on
user-defined procedures in the prepared model; post-
processing visualizes the computed solutions to help users
check performances and gain insights to the analyzed
problem. Most CAE software has invested significant
effort to perfect these three steps, i.e. the upper part of Fig.
1, to help users easily and intuitively create models and
generates meshes in finite element methods (FEM), to
incorporate and to advance analyzing capabilities (e.g.
multi-physics) to achieve realism in simulations, and to
conveniently visualize and explore computed solutions.
However, the iterative design process (i.e. the bottom part
of Fig 1.) has received little or no attention, and this is
unfortunate because the iterative design process, taking
engineers from reported results to the next design, helps
and inspires engineers devise better engineering designs.
S31-6
1110

In the current practice, engineers need to perform
unproductive and tedious tasks in order to conduct the
iterative design process. For example, managing
revisions of designs often uses naming conventions applied
to computer files generated by CAE software. Such
naming conventions are necessary to keep track of
exploration of design space. Such practice, however, is
prone to user errors. One may accidently overwrite an
already conducted analysis, and one may explore a design
twice without even being noticed. The lack of support for
iterative design processes in CAE software eventually
results in reluctance of performing many iterations of
design revisions. Insufficient explorations of design
space inhabit devising economic and ingenious engineering
designs.
In this paper, we first propose essential software
requirements for supporting iterative designs in CAE
software. These requirements are discussed and
implemented in our prototype software incorporating three
software components: 1) ESFM – an Essential Software
Framework for Meshfree methods[1] for performing
mechanical analyses, 2) Qt software framework[2] for
creating graphical user interface and generating 2D models
to be analyzed, and 3) VTK[3] for visualizing results.
2. SOFTWARE REQUIREMENTS
The main objective of Computer Aided Iterative Design
(CAID) software is to extend CAE software to incorporate
functionalities for supporting the iterative design process.
We propose three essential functionalities in order to
support the iterative design process: 1) design-revision
tracking, 2) model-revision tracking, and 3) result
comparison.
2.1 Design-Revision Tracking
Design-revision tracking concerns about tracking the
evolution of designs. It is common that one design may
inspire many derivative designs, and many of them may
lead to one new design. Keeping the hierarchy of designs
helps engineers 1) comprehend the explored design space
and 2) strategized exploration plans for the uncharted
design space. Such function enables engineers explore
the design space effectively and efficiently, and should help
devise better designs.
2.2 Model-Revision Tracking
Model-revision tracking refers to tracking changes between
the original designs to derivative designs. During the
design exploration, existing designs or models are revised
to create new designs or models, and these changes should
be tracked and recorded, so that engineers can know the
difference between the original versus the derivative
designs. It is common that differences between two
designs cannot be recalled by engineers who created them
after an extended period of time. Therefore, keeping
these changes would allow engineers quickly understand
differences between existing models, leading to
comprehension of the explored design space.
The changes need to be recorded for model-revision
tracking include changes in a) the geometry, b) material
property definitions, c) loading conditions, and d)
boundary conditions. By recording these changes,
engineers can recall the model differences between two
related models. Furthermore, in addition to recording
these model changes, physical meanings for each change
should also be recorded and entered by users. Because
Today’s software usually cannot understand physical
meanings of add/removing/changing model entities, and
these physical meanings may be important to record to
make revisions meaningful and self-explained.
2.3 Analysis Results Comparison
The other important function needed to inspire new designs
is to be able to compare computed results from different
designs, and to be able to work on new designs while
displaying the comparison. Users need to be able to
compare results from different analyses to see which
design performs better. By comparing results from
different analyses, new designs can be inspired by
comparing results and knowing why one design performs
better than the other design in certain aspects.
3. SOFTWARE COMPONENTS
After requirements are identified, prototype software is
developed accordingly to realize these requirements, and
the prototype software we developed incorporates three
S31-6
1111

different software libraries: 1) Qt, 2) VTK, and 3) ESFM.
These libraries are briefly introduced in this section.
3.1 Qt
Qt[2] is a rich software framework for C++ language. It is
available and cross platform on all major operating systems
(Windows, MacOS, Linux, etc.). Qt is a rich class library
containing many classes, such as graphical user interface
(GUI), 2D/3D drawings, networking, database, etc. We
mainly use Its GUI and 2D drawing classes to develop our
prototype software.
3.2 VTK
VTK (Visualization Toolkit[3]) is a high-level graphical
class library containing more than 2000 classes, and is
available on all major operating systems, just like Qt.
VTK uses visualization pipelines to encapsulate low level
graphical function calls in OpenGL. Fundamental
components in the pipeline, in the usual processing order,
contains source filter mapper actor renderer
render window. Source represents the raw data; filter
defines transformations to data; mapper is the procedure to
transform data into drawable objects; actor present drawing
properties; renderer concretizes the 3D presentation; render
window presents the visualization on screen. Table 1 lists
the VTK classes used and their purposes.
3.3 ESFM
ESFM (Essential Software Framework for Meshfree
Methods[1]) is our homegrown software framework for
implementing meshfree methods [4-6]. The software
allows us to implement various meshfree methods with
different combinations of shape functions, support domain
definitions, etc. ESFM is integrated in this work to
conduct analyses in solid mechanics.
4. DEMONSTRATION
This section demonstrates some features in our developed
prototype program to show how to achieve the functional
requirements that we drafted for CAID software.
4.1 Graphical User Interface - Overview
Fig. 2 shows our developed prototype program. The
program’s graphical user interface has three windows
labeled as A, B, and C in Fig. 2. Window A chooses or
creates a design or model to work on; window B presents
the modeling space for creating designs; window C is the
interface for visualizing analysis results obtained from the
analysis for model shown in B. Separating model-
selection (A), pre-processing (B), and post-processing (C)
into three windows allows the program to take advantage
of multiple monitors for presenting information easily. It
should be noted the displays in B and C are always
synchronized. Furthermore, separating modeling window
and post-processing window allows users see the built
model with the analyses results simultaneously. Most of
today’s CAE software cannot present models with analysis
results, and its post-processing windows usually do not
present the same detail as in the pre-processing window.
Our design removes such restriction and enables better
understanding of analysis results with the model.
Table 1. VTK classes used in the prototype software Class. class name purpose
vtkArrowSource Drawing arrows vtkConeSource Drawing cones vtkPointSource Drawing points vtkLineSource Drawing lines vtkSphereSource Drawing sphers
Source
vtkCubeSource Drawing cubes vtkDoubleArray Data array vtkPointData Point data Data vtkUnstructuredGrid mesh data vtkDelaunay2D Delaunay process
Filter vtkContourFilter Create contours vtkPolyDataMapper
MappervtkDataSetMapper
Data-drawing conversions
vtkActor Drawing propertiesvtkAxesActor Axes vtkScalarBarActor Color legends vtkCaptionActor2D Drawing Text
Actor
vtkPropAssembly Compound drawings
QVTKWidget Qt-VTK integrationGUI
vtkOrientationMarkerWidget Draw orientations vtkRenderer Render presentationvtkColorTransferFunction Map value to color vtkProperty2D
Misc.
vtkProperty Drawing properties
4.2 Model Selection Window
Fig. 3 shows the model selection window in detail. The
model selection window controls the interested design or
model the users want to operate or want to see. The
S31-6
1112

itemName column can be modified by users to enter
meaningful titles for the selected analysis, and more
comments can be entered in the bottom part of the window
in the “record” tab or the “comment” tab. The check box
in front of the each model can be used to select models to
be compared in the post-processing window. The
comparison will be discussed in later sections. The
currently active model shown in the both pre-processing
window and the post-processing window is highlighted
with bold font. Each model has also a column recording
the date and time of the model creation time automatically
generated by the program.
Pre-processing Window Post-processing Window
Model Selection Window
Fig. 2. A three-window design for graphical user interface
facilitating the use of multiple monitors
The hierarchy relationships between models is preserved
and presented in the model selection window as trees. It
is seen in Fig. 3 that models with id 1, 3, and 4 are siblings
that are all derived from model with id 0; and the model
with id 2 is the child of model id 1. By using trees to
manage models, we can easily identify which model is
derived from which parent model, and this derivation
usually means the child model inherits most of the parent
model with some modifications. The modifications of the
child model from the parent model will be discussed
further in Section 4.4.
4.3 Pre-processing Window
The pre-processing window serves two purposes, one is to
create an entirely new model, and the other one is to
modify an existing model to create a derived model. It
contains functions to 1) drawing geometries, 2) adding
forces, 3) imposing boundary conditions, 4) applying
material properties, 5) spray calculation nodes, 6)
performing modifications, and 7) analyzing. Most
functions are rather similar to usual CAE software.
However, since the meshfree method is the method of
choice in our implementation, nodes need to be spread
inside the material domain of interest. There are three
ways implemented to spread nodes in a region: 1) use
regular spacing, 2) use random spacing, 3) first use regular
spacing to generate nodes and then move each spread node
by a short random distance. Some methods prefer the
third method than the first one. To ensure nodes are
spread inside the region of interest, collision detection
functions of Qt are used. Each spread node must collide
with the interested region in order to be inside of the region,
all generated nodes that do not collide with the region will
be removed. Thus, using collision detection function Qt
eases our implementation of spreading nodes in a specified
region.
Fig. 3. The model selection window showing 5 models and
their relationships with one another
In addition to creating new models, deriving models from
existing designs are common practices. This is achieved
by using the model selection window to select an existing
model, and then choose “new model” function to create a
derived model. Once derived model is created, each
modification performed by the user will recorded
S31-6
1113
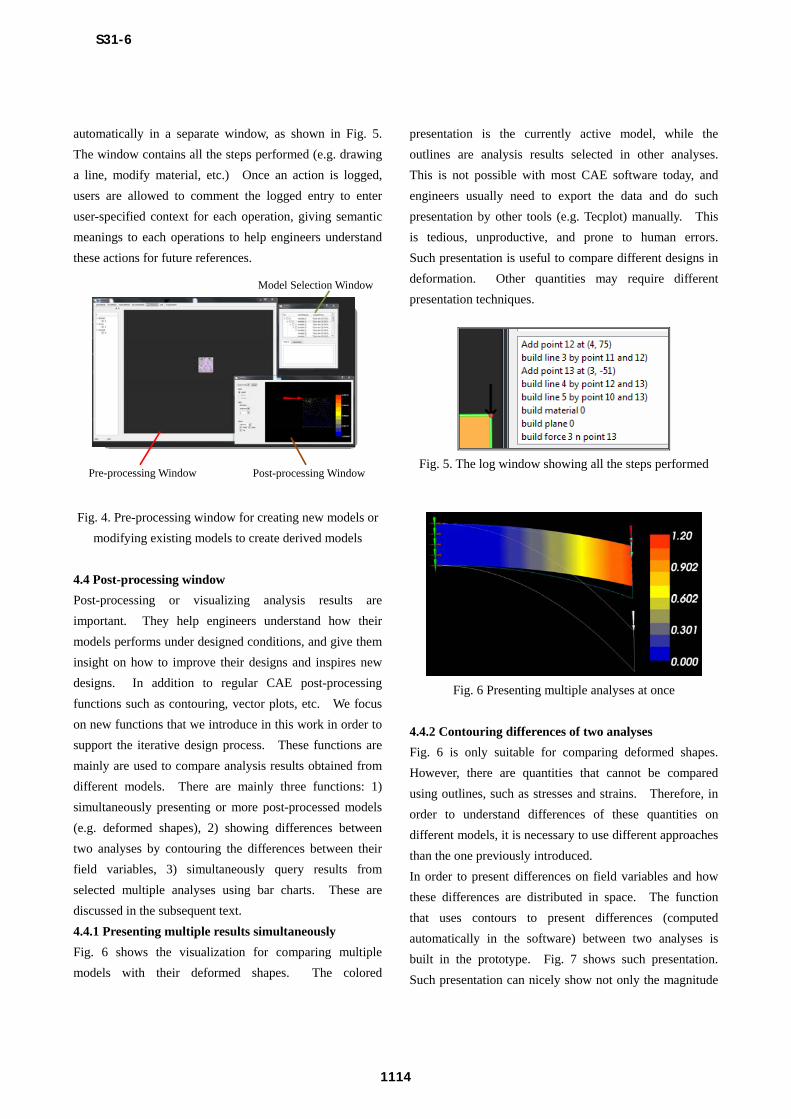
automatically in a separate window, as shown in Fig. 5.
The window contains all the steps performed (e.g. drawing
a line, modify material, etc.) Once an action is logged,
users are allowed to comment the logged entry to enter
user-specified context for each operation, giving semantic
meanings to each operations to help engineers understand
these actions for future references.
Pre-processing Window Post-processing Window
Model Selection Window
Fig. 4. Pre-processing window for creating new models or
modifying existing models to create derived models
4.4 Post-processing window
Post-processing or visualizing analysis results are
important. They help engineers understand how their
models performs under designed conditions, and give them
insight on how to improve their designs and inspires new
designs. In addition to regular CAE post-processing
functions such as contouring, vector plots, etc. We focus
on new functions that we introduce in this work in order to
support the iterative design process. These functions are
mainly are used to compare analysis results obtained from
different models. There are mainly three functions: 1)
simultaneously presenting or more post-processed models
(e.g. deformed shapes), 2) showing differences between
two analyses by contouring the differences between their
field variables, 3) simultaneously query results from
selected multiple analyses using bar charts. These are
discussed in the subsequent text.
4.4.1 Presenting multiple results simultaneously
Fig. 6 shows the visualization for comparing multiple
models with their deformed shapes. The colored
presentation is the currently active model, while the
outlines are analysis results selected in other analyses.
This is not possible with most CAE software today, and
engineers usually need to export the data and do such
presentation by other tools (e.g. Tecplot) manually. This
is tedious, unproductive, and prone to human errors.
Such presentation is useful to compare different designs in
deformation. Other quantities may require different
presentation techniques.
Fig. 5. The log window showing all the steps performed
Fig. 6 Presenting multiple analyses at once
4.4.2 Contouring differences of two analyses
Fig. 6 is only suitable for comparing deformed shapes.
However, there are quantities that cannot be compared
using outlines, such as stresses and strains. Therefore, in
order to understand differences of these quantities on
different models, it is necessary to use different approaches
than the one previously introduced.
In order to present differences on field variables and how
these differences are distributed in space. The function
that uses contours to present differences (computed
automatically in the software) between two analyses is
built in the prototype. Fig. 7 shows such presentation.
Such presentation can nicely show not only the magnitude
S31-6
1114
of differences, but also how the differences are distributed
in space. Such functionality does exist in some CAE
software, but often they are limited showing differences
between steps of the same model. However, there are
issues associated with such approach, especially when the
two models having different geometries. This is an issue
remains to be solved.
Fig. 7 Contouring differences between two analyses.
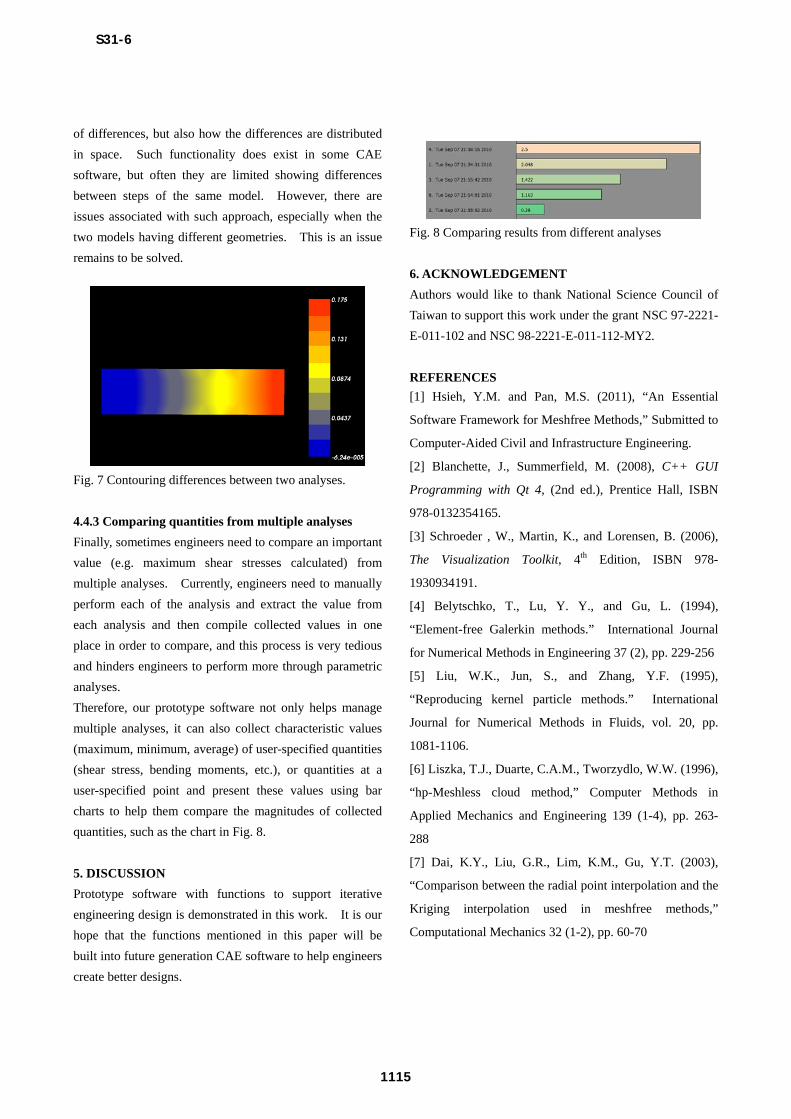
4.4.3 Comparing quantities from multiple analyses
Finally, sometimes engineers need to compare an important
value (e.g. maximum shear stresses calculated) from
multiple analyses. Currently, engineers need to manually
perform each of the analysis and extract the value from
each analysis and then compile collected values in one
place in order to compare, and this process is very tedious
and hinders engineers to perform more through parametric
analyses.
Therefore, our prototype software not only helps manage
multiple analyses, it can also collect characteristic values
(maximum, minimum, average) of user-specified quantities
(shear stress, bending moments, etc.), or quantities at a
user-specified point and present these values using bar
charts to help them compare the magnitudes of collected
quantities, such as the chart in Fig. 8.
5. DISCUSSION
Prototype software with functions to support iterative
engineering design is demonstrated in this work. It is our
hope that the functions mentioned in this paper will be
built into future generation CAE software to help engineers
create better designs.
Fig. 8 Comparing results from different analyses
6. ACKNOWLEDGEMENT
Authors would like to thank National Science Council of
Taiwan to support this work under the grant NSC 97-2221-
E-011-102 and NSC 98-2221-E-011-112-MY2.
REFERENCES
[1] Hsieh, Y.M. and Pan, M.S. (2011), “An Essential
Software Framework for Meshfree Methods,” Submitted to
Computer-Aided Civil and Infrastructure Engineering.
[2] Blanchette, J., Summerfield, M. (2008), C++ GUI
Programming with Qt 4, (2nd ed.), Prentice Hall, ISBN
978-0132354165.
[3] Schroeder , W., Martin, K., and Lorensen, B. (2006),
The Visualization Toolkit, 4th Edition, ISBN 978-
1930934191.
[4] Belytschko, T., Lu, Y. Y., and Gu, L. (1994),
“Element-free Galerkin methods.” International Journal
for Numerical Methods in Engineering 37 (2), pp. 229-256
[5] Liu, W.K., Jun, S., and Zhang, Y.F. (1995),
“Reproducing kernel particle methods.” International
Journal for Numerical Methods in Fluids, vol. 20, pp.
1081-1106.
[6] Liszka, T.J., Duarte, C.A.M., Tworzydlo, W.W. (1996),
“hp-Meshless cloud method,” Computer Methods in
Applied Mechanics and Engineering 139 (1-4), pp. 263-
288
[7] Dai, K.Y., Liu, G.R., Lim, K.M., Gu, Y.T. (2003),
“Comparison between the radial point interpolation and the
Kriging interpolation used in meshfree methods,”
Computational Mechanics 32 (1-2), pp. 60-70
S31-6
1115