Computational Models of Symbolic Rhythm Similarity
51
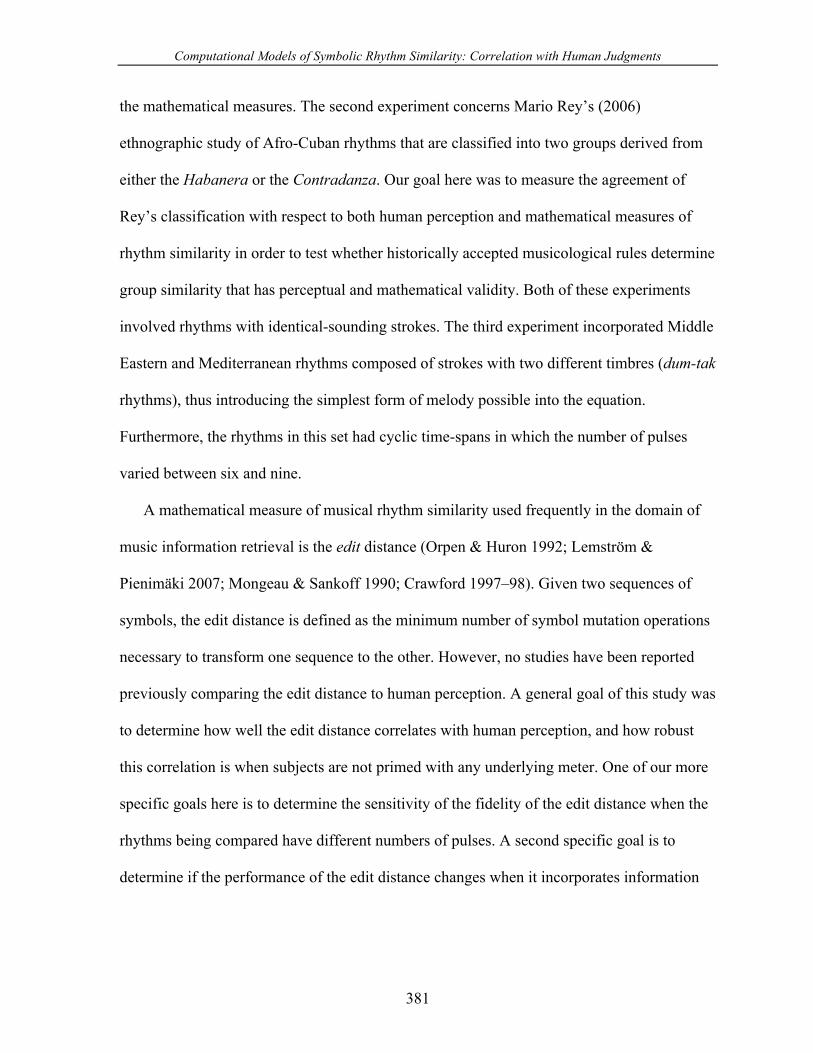
Computational Models of Symbolic Rhythm Similarity: Correlation with Human Judgments 1 Godfried T. Toussaint Malcolm Campbell Naor Brown 1. INTRODUCTION fundamental problem in computational musicology is the design of a mathematical measure, or computational model, of symbolic rhythm similarity. The applications of such a measure include modeling the perceptual mechanisms involved in rhythm recognition by humans, music information retrieval by computers, and the phylogenetic analysis of rhythms in evolutionary studies (Toussaint 2004, 2002; Jan 2007; Dean, Byron & Bailes 2009–2010; Van Den Broek & Todd 2009–10). In this paper a novel approach to describing rhythmic relationships in music is introduced by means of three rhythm similarity experiments. The first involves a group of six distinguished Afro-Cuban timelines that had previously been compared with a variety of mathematical measures of rhythm similarity in the context of the phylogenetic analysis of rhythms (Toussaint 2004, 2002). For some applications it is desirable to obtain a measure that correlates well with human perception of rhythm similarity. With this goal in mind, experiments were performed in which a group of listeners compared and judged the similarity of the same six timelines used in Toussaint (2002). The results obtained from these experiments are compared with those obtained with 1 This research was funded by the National Sciences and Engineering Research Council of Canada (NSERC), administered through McGill University, Montreal, and by the Radcliffe Institute for Advanced Study at Harvard University, Cambridge, MA, where the first author was the Emeline Bigelow Conland Fellow for the 2009–10 academic year. This project was carried out at the Radcliffe Institute, and completed in the Music Department at Harvard University, where the first author is presently a Visiting Scholar. A
Transcript of Computational Models of Symbolic Rhythm Similarity
Computational Models of Symbolic Rhythm Similarity: Correlation with Human Judgments1
Godfried T. Toussaint Malcolm Campbell Naor Brown
1. INTRODUCTION
fundamental problem in computational musicology is the design of a mathematical
measure, or computational model, of symbolic rhythm similarity. The applications of
such a measure include modeling the perceptual mechanisms involved in rhythm recognition
by humans, music information retrieval by computers, and the phylogenetic analysis of
rhythms in evolutionary studies (Toussaint 2004, 2002; Jan 2007; Dean, Byron & Bailes
2009–2010; Van Den Broek & Todd 2009–10). In this paper a novel approach to describing
rhythmic relationships in music is introduced by means of three rhythm similarity
experiments. The first involves a group of six distinguished Afro-Cuban timelines that had
previously been compared with a variety of mathematical measures of rhythm similarity in
the context of the phylogenetic analysis of rhythms (Toussaint 2004, 2002). For some
applications it is desirable to obtain a measure that correlates well with human perception of
rhythm similarity. With this goal in mind, experiments were performed in which a group of
listeners compared and judged the similarity of the same six timelines used in Toussaint
(2002). The results obtained from these experiments are compared with those obtained with
1 This research was funded by the National Sciences and Engineering Research Council of Canada (NSERC), administered through McGill University, Montreal, and by the Radcliffe Institute for Advanced Study at Harvard University, Cambridge, MA, where the first author was the Emeline Bigelow Conland Fellow for the 2009–10 academic year. This project was carried out at the Radcliffe Institute, and completed in the Music Department at Harvard University, where the first author is presently a Visiting Scholar.
A
Computational Models of Symbolic Rhythm Similarity: Correlation with Human Judgments
381
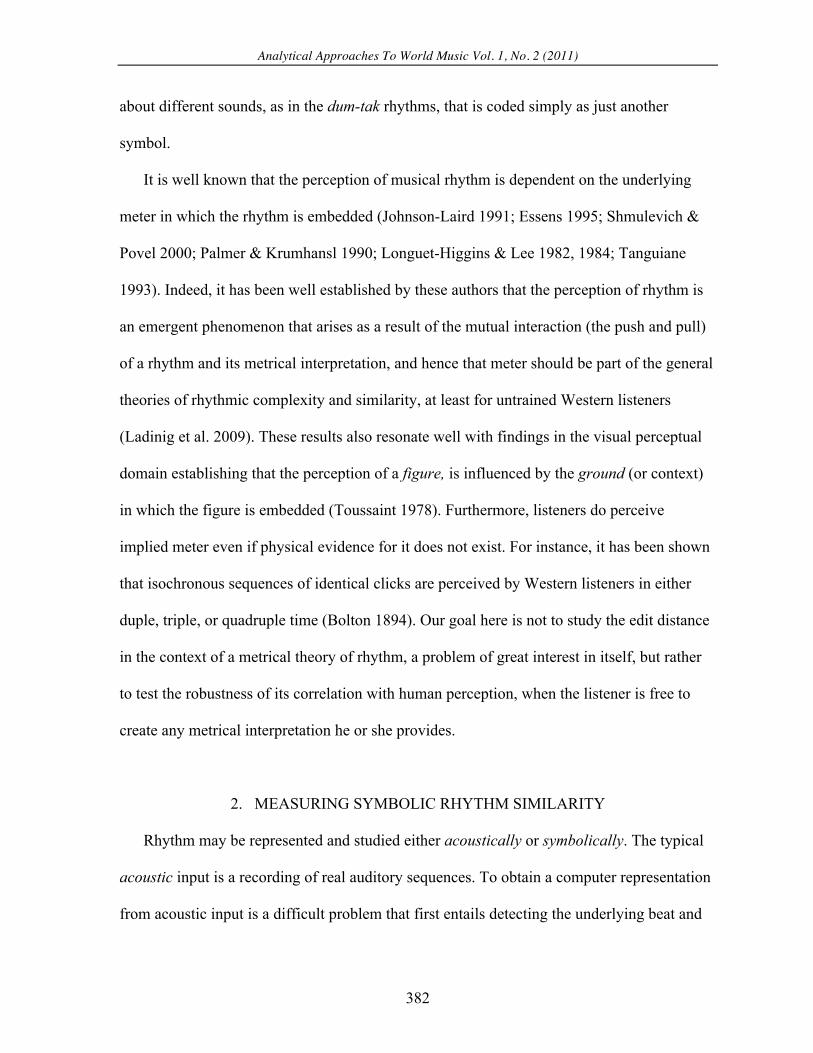
the mathematical measures. The second experiment concerns Mario Rey’s (2006)
ethnographic study of Afro-Cuban rhythms that are classified into two groups derived from
either the Habanera or the Contradanza. Our goal here was to measure the agreement of
Rey’s classification with respect to both human perception and mathematical measures of
rhythm similarity in order to test whether historically accepted musicological rules determine
group similarity that has perceptual and mathematical validity. Both of these experiments
involved rhythms with identical-sounding strokes. The third experiment incorporated Middle
Eastern and Mediterranean rhythms composed of strokes with two different timbres (dum-tak
rhythms), thus introducing the simplest form of melody possible into the equation.
Furthermore, the rhythms in this set had cyclic time-spans in which the number of pulses
varied between six and nine.
A mathematical measure of musical rhythm similarity used frequently in the domain of
music information retrieval is the edit distance (Orpen & Huron 1992; Lemström &
Pienimäki 2007; Mongeau & Sankoff 1990; Crawford 1997–98). Given two sequences of
symbols, the edit distance is defined as the minimum number of symbol mutation operations
necessary to transform one sequence to the other. However, no studies have been reported
previously comparing the edit distance to human perception. A general goal of this study was
to determine how well the edit distance correlates with human perception, and how robust
this correlation is when subjects are not primed with any underlying meter. One of our more
specific goals here is to determine the sensitivity of the fidelity of the edit distance when the
rhythms being compared have different numbers of pulses. A second specific goal is to
determine if the performance of the edit distance changes when it incorporates information
Analytical Approaches To World Music Vol. 1, No. 2 (2011)
382
about different sounds, as in the dum-tak rhythms, that is coded simply as just another
symbol.
It is well known that the perception of musical rhythm is dependent on the underlying
meter in which the rhythm is embedded (Johnson-Laird 1991; Essens 1995; Shmulevich &
Povel 2000; Palmer & Krumhansl 1990; Longuet-Higgins & Lee 1982, 1984; Tanguiane
1993). Indeed, it has been well established by these authors that the perception of rhythm is
an emergent phenomenon that arises as a result of the mutual interaction (the push and pull)
of a rhythm and its metrical interpretation, and hence that meter should be part of the general
theories of rhythmic complexity and similarity, at least for untrained Western listeners
(Ladinig et al. 2009). These results also resonate well with findings in the visual perceptual
domain establishing that the perception of a figure, is influenced by the ground (or context)
in which the figure is embedded (Toussaint 1978). Furthermore, listeners do perceive
implied meter even if physical evidence for it does not exist. For instance, it has been shown
that isochronous sequences of identical clicks are perceived by Western listeners in either
duple, triple, or quadruple time (Bolton 1894). Our goal here is not to study the edit distance
in the context of a metrical theory of rhythm, a problem of great interest in itself, but rather
to test the robustness of its correlation with human perception, when the listener is free to
create any metrical interpretation he or she provides.
2. MEASURING SYMBOLIC RHYTHM SIMILARITY
Rhythm may be represented and studied either acoustically or symbolically. The typical
acoustic input is a recording of real auditory sequences. To obtain a computer representation
from acoustic input is a difficult problem that first entails detecting the underlying beat and
Computational Models of Symbolic Rhythm Similarity: Correlation with Human Judgments
383
the onsets of notes (Dixon 2001). Furthermore, in this setting the locations of the resulting
onsets are not determined by simple integers or rational numbers, but instead, due to a
variety of musical phenomena such as micro-timing, and expressivity, may lie anywhere on
the real line (time). The typical symbolic input, on the other hand, is notated rhythm, such as
in Western music notation, or in box notation, in which the locations of the onsets of notes
are known exactly, and the duration intervals between onsets may be described by small
integers. This study is concerned with the analysis of rhythm from the symbolic point of
view. Thus the mathematical measures of similarity tested are computed on an input
consisting of rhythms represented in box notation, i.e., sequences of unit-time symbols. To
measure the correlation of mathematical measures with human perception, however, an
acoustic input must be created for the listening tests. The acoustic signals used in the
experiments consisted of identical clinical sound impulses (much like the sound of two sticks
striking each other) created electronically so as to mimic the symbolic input as closely as
possible.
Previous studies on symbolic musical rhythm similarity with Afro-Cuban timelines and
Flamenco meters generated encouraging results using the swap distance. A swap is perhaps
the simplest mutation operation that may be performed on a rhythm when it is represented in
box notation as a binary sequence of elemental pulses of two kinds: onsets and rests. An
onset is a sounded pulse, whereas a rest is a silent pulse. Note that unlike some usage of the
term in the literature, we use the word pulse in a purely mathematical way, and no musical
interpretations, such as strong pulse, weak pulse, or beat for example, are implied. Since this
study is not concerned with the effects of tempo on perception, throughout this research it is
assumed that the duration of one pulse is the same, typically that of a sixteenth note which is
Analytical Approaches To World Music Vol. 1, No. 2 (2011)
384
determined by the shortest duration necessary to be able to represent a rhythm. For example
the eight-pulse rhythm [x . x . x . . .], unless required for some special comparisons, would be
represented as the four-pulse rhythm [x x x . ].
A swap interchanges the positions of an onset and a rest that are adjacent to each other in
the sequence. For example, the four-pulse cyclic rhythm [x x x . ] may be obtained from the
rhythm [x x . x ] by a single swap operation that interchanges the values (sounds and rests) of
the third and fourth pulses in the cycle. The swap distance between two rhythms is the
minimum number of swaps needed to convert one rhythm to the other. In the statistics
literature concerning the problem of measuring the similarity between two permutations of
symbols, a swap is called a pairwise adjacent transposition, and the swap distance has been
used as a measure of disarray or rank correlation (Diaconis & Graham 1977; Kendall 1970).
If two rhythms being compared have the same number of onsets this distance is trivial to
compute, since for all i the i-th onset of the first rhythm must in effect move, by a suitable
sequence of swaps, to the position of the i-th onset of the second rhythm. For example, to
convert the sixteen-pulse clave son rhythm [x . . x . . x . . . x . x . . .] to the sixteen-pulse rap
[x . . . x . . x . x . . x . . .] requires three swaps: the second and third onsets of the first rhythm
must advance by one pulse, and the third onset must retreat by one pulse. When one rhythm
has more onsets than another, the swap distance has been modified in the following way
(Toussaint 2003). Let D denote the denser of the two rhythms, and S denote the sparser of
the two. Here the density refers to the number of onsets contained in the cyclic rhythm. Then
the swap distance between D and S is defined as the minimum number of swaps required to
convert D to S, with the constraints that every onset of D must move to the location of an
onset of S, and every onset of S must accommodate at least one onset of D. As an example,
Computational Models of Symbolic Rhythm Similarity: Correlation with Human Judgments
385
consider converting the famous “door-knock” rhythm given by [x . x x x . x . . . x . x . . .] to
the clave son [x . . x . . x . . . x . x . . .]. Here the first, third, fifth, sixth, and seventh onsets of
the first rhythm coincide with the first, second, third, fourth, and fifth onsets of the second
rhythm, respectively, and thus they remain where they are. On the other hand, the second and
fourth onsets of the first rhythm both move to the position of the second onset of the second
rhythm, yielding a swap distance of 2.
Although the judgments obtained in previous listening experiments with human subjects
using Flamenco meters correlated well with those of the swap distance measure, the
Flamenco rhythms were limited in terms of rhythmic variety and the number of rhythms used
(Guastavino, Gómez, Toussaint, Marandola, & Gómez 2009). Therefore one goal of the
present study was to determine how well this simple distance measure performs on rhythms
from different genres, and how it compares with the more generally employable edit distance
used in music information retrieval applications. The edit distance between two sequences of
symbols is defined as the minimum number of edit operations required to transform one
sequence to the other (Mongeau & Sankoff 1990; Crawford, Iliopoulos, & Raman 1997–98).
The edit operations permitted are of three types: insertions, deletions, and substitutions.
Insertions and deletions insert and delete, respectively, a symbol anywhere within the
sequence. For example, the eight-pulse rhythm [x x . x x . x . ] may be obtained from the
seven-pulse rhythm [x x . x x . . ] by inserting the symbol ‘x’ between the sixth and seventh
pulses in the seven-pulse rhythm. A deletion is the inverse operation of an insertion. A
substitution replaces one symbol for another. For instance, the eight-pulse rhythm [x x x x x
x . . ] may be converted to the six-pulse rhythm [x x x . . . ] by changing the sixth symbol in
the eight-pulse rhythm from ‘x’ to ‘.’ (a substitution) and deleting the first two ‘x’ symbols.
Analytical Approaches To World Music Vol. 1, No. 2 (2011)
386
Thus, the edit distance simply permits the comparison of rhythms that have different
numbers of pulses as well as onsets, since deletions shorten the duration of a rhythm, and
insertions lengthen it.
3. PHYLOGENETIC TREE ANALYSIS
Traditionally, a phylogenetic tree, also referred to as an evolutionary tree, is a tree or
branching diagram in which the branches indicate evolutionary relationships between
biological organisms in a group, based on the measurement of similarity between physical
features or genetic material such as DNA molecules, obtained from pairs of organisms in the
group. Such trees resemble the dendrograms of traditional cluster analysis, and as such, may
be used also for the purpose of measuring and visualizing the similarity relations that exist
between the members in a group of biological objects (Carrizo 2004). However, the objects
in this study, rather than being biological organisms, are cultural objects, namely sequences
of symbols that represent musical rhythms. The application of phylogenetic methods to
cultural objects, and the study of their evolution is not new. Indeed, such techniques have
been applied to a wide variety of cultural objects for some time (Hage et. al. 1998; Mace,
Holden, & Shennan 2005).
There exist a variety of different approaches to the construction of phylogenetic trees,
ranging from distance-based methods to maximum parsimony, maximum likelihood, and
Bayesian inference, to name a few. For our study of musical rhythms the distance-based
approach was the most convenient. Such methods assume that a distance matrix is available
that contains the distance between every pair of rhythms. The phylogenetic tree is then
constructed so that the minimum distance between every pair of rhythms, measured along the
Computational Models of Symbolic Rhythm Similarity: Correlation with Human Judgments
387
branches in the tree (geodesic), corresponds as closely as possible to the corresponding
distance entry in the distance matrix. Within this class of methods we chose to use the
popular neighbor joining approach (Saitou and Nei 1987). The software package SplitsTree-4
provides a powerful framework for computing phylognetic trees from distance matrices
obtained from a group of objects (Huson 1998). One of its virtues is that it may be used to
compute more general graphs (or networks) that are not in fact trees. In addition the package
allows for the application of several tools including BioNJ, a phylogenetic tree computed on
the basis of a novel neighbor-joining algorithm (Gascuel 1997).
The methodology used in the study reported here is reminiscent of previous methods
applied in the pitch domain by Quinn (2001), and Mavromatis and Williamson (1999a,
1999b). These authors were motivated by a desire to visualize the relationships between
chords, and hence applied traditional cluster analysis methods to compare a variety of
measures of chord similarity. Our study focuses on rhythms, and is motivated also by the
desire to infer phylogenies of collections of rhythms, thus propelling us to use phylogenetic
analysis, supported by Mantel tests, in lieu of cluster analysis. Both methods generate trees
in the process. However, the trees differ from each other. A cluster analysis tree is a
statement about the grouping of a collection of rhythms according to distances computed
between all pairs of rhythms and pairs of sub-clusters of rhythms. The main drawback of
cluster analysis trees is that they implicitly assume a constant rate of evolution of the
rhythms in all branches of the tree. They are useful for visualizing the rhythms but limited
for inferring phylogenies. A phylogenetic tree, on the other hand, is a statement about the
evolutionary relationship between a collection of rhythms. Phylogenetics trees, such as those
produced by the BioNJ algorithm used here, do not assume that the rate of evolution is the
Analytical Approaches To World Music Vol. 1, No. 2 (2011)
388
same in all branches of the tree, and are more suitable for inferring phylogenies as well as
reconstructing ancestral rhythms.
4. STATISTICAL ANALYSIS
A phylogenetic tree of a collection of rhythms provides a compelling visualization of
the various relationships that exist between all the rhythms, as well as of their possible
evolutionary phylogeny. However, it is not without its limitations. If the distances that make
up the distance matrix do not permit an exact representation in the form of a tree in two-
dimensional space, the algorithms construct an approximate representation that minimizes
the differences between the distances in the matrix and those in the tree, thus introducing
some error in the actual drawing of the tree. Furthermore, by itself the tree does not provide a
quantitative measure of the similarity between the two distance matrices being compared.
For this purpose there exist two appropriate statistical tests: the Mantel test (Dietz 1983;
Hage et al. 1998), and the Procrustes test (Schneider & Borlund 2007a, 2007b). Both tests
belong to the family of permutation tests for measuring the association between two distance
matrices. They are designed to be used in situations where the elements in the matrix are not
independent, as is the case in our rhythm study, thus ruling out conventional correlation tests.
The Mantel test is designed to compare and evaluate the degree of monotonicity between
different similarity measures, and uses a distance (dissimilarity) matrix as input. Procrustes
analysis, on the other hand, is designed to compare and evaluate the resemblance between
ordination results based on different similarity measures, and is used for comparing the
shapes of geometric configurations of points. Since in our study the rhythms are not
represented as points in some feature space, but rather yield a distance matrix, and our goal is
Computational Models of Symbolic Rhythm Similarity: Correlation with Human Judgments
389
to compare the rhythm similarity measures themselves, the Mantel test was deemed more
appropriate. Accordingly, in this work all the Mantel tests were performed using the
software developed by Eric Bonnet and Yves Van de Peer, with 10,000 repetitions each
(Bonnet & Van de Peer 2002).
5. EXPERIMENT 1: AFRO-CUBAN TIMELINES
5.1 Rhythms and Computational Models
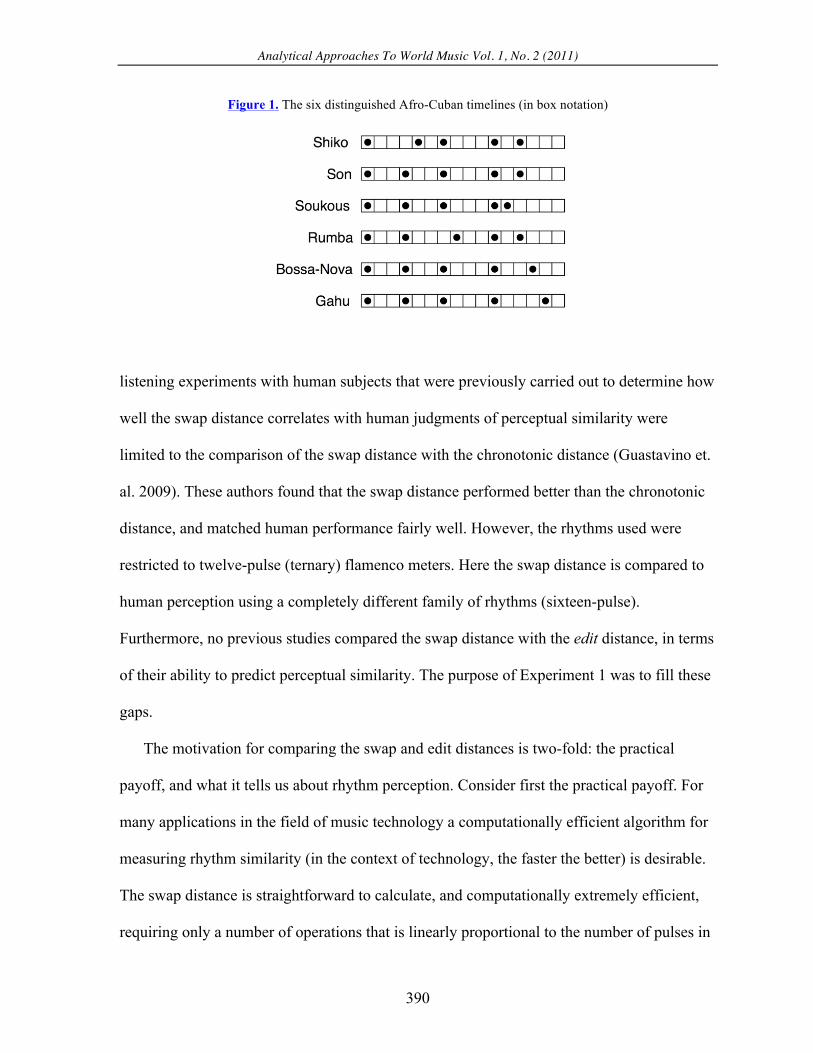
The first experiment used a group of rhythms consisting of six distinguished Afro-Cuban
timelines previously investigated by Toussaint (2002). These six timelines, all of which
consist of five onsets in a sixteen-pulse cycle, are shown in Figure 1. These six rhythms were
previously used to explore several mathematical approaches to rhythm analysis, including
geometric feature extraction, automatic classification via decision trees, comparison of
objective, information-theoretic, cognitive, and performance complexity measures, rhythm
similarity and grouping, as well as phylogenetic and combinatorial analyses (Toussaint
2002). The rhythms were chosen because they represent some of the most important
timelines (rhythmic ostinatos) used in traditional as well as the world music of today, and
such timelines are effective markers of the structural evolution of rhythms, and their cultural
transmission. Indeed, in describing timeline patterns such as these, Gerhard Kubik (1999,
56), states: “their mathematical structures are cultural invariables.”
Of the various mathematical measures of rhythm similarity previously explored with
these rhythms, the swap distance appeared to be the most promising from the conceptual,
computational, and music-theoretical points of view (Toussaint 2002). However, the
Analytical Approaches To World Music Vol. 1, No. 2 (2011)
390
Figure 1. The six distinguished Afro-Cuban timelines (in box notation)
listening experiments with human subjects that were previously carried out to determine how
well the swap distance correlates with human judgments of perceptual similarity were
limited to the comparison of the swap distance with the chronotonic distance (Guastavino et.
al. 2009). These authors found that the swap distance performed better than the chronotonic
distance, and matched human performance fairly well. However, the rhythms used were
restricted to twelve-pulse (ternary) flamenco meters. Here the swap distance is compared to
human perception using a completely different family of rhythms (sixteen-pulse).
Furthermore, no previous studies compared the swap distance with the edit distance, in terms
of their ability to predict perceptual similarity. The purpose of Experiment 1 was to fill these
gaps.
The motivation for comparing the swap and edit distances is two-fold: the practical
payoff, and what it tells us about rhythm perception. Consider first the practical payoff. For
many applications in the field of music technology a computationally efficient algorithm for
measuring rhythm similarity (in the context of technology, the faster the better) is desirable.
The swap distance is straightforward to calculate, and computationally extremely efficient,
requiring only a number of operations that is linearly proportional to the number of pulses in
Computational Models of Symbolic Rhythm Similarity: Correlation with Human Judgments
391
the rhythms. The edit distance, on the other hand, is more difficult to compute, requiring
dynamic programming and a number of operations that is proportional to the square of the
number of pulses in the rhythms. From this point of view, and other things being equal, the
swap distance would be preferred over the edit distance.
It is worth pointing out that although the swap distance is much simpler to compute than
the edit distance, and also conceptually simpler, in the sense that it contains a single
operation (swap) rather than three operations (substitution, insertion, deletion), this does not
imply that the swap operation is incapable of generating as much rhythmic variety as the edit
distance for rhythms with fixed numbers of onsets and pulses. First note that a swap that
changes [x .] to [. x] may be implemented by the edit distance with either two substitutions,
or with a deletion followed by an insertion. The structural result of performing these
operations ends up being the same for both the swap and edit distance measures but the cost
is different with each. Furthermore, although it is tempting to conclude at first glance that
swaps are limited to transpositions of existing durations, this is not the case. Consider for
example the rhythm X = [x . . . x . x ] with durations (421). Swapping the fourth and fifth
pulses yields the rhythm Y = [x . . x . . x] with durations (331), which is not a transposition
of (421). The power of the edit distance over the swap distance comes rather from the ability
of its three operations to alter the number of onsets and pulses in the rhythms that it
generates, thus making it applicable to the comparison of a wider class of rhythms.
Concerning rhythm perception, the swap and edit distance measures differ in some of
their computational strategies. The swap distance involves repetition of local swap
operations that bring all the onsets of one rhythm into alignment with those of the other
rhythm. The edit distance, on the other hand, tends to involve grouping onsets together and
Analytical Approaches To World Music Vol. 1, No. 2 (2011)
392
then moving them together as a group, if it will result in the reduction of the total number of
operations. The computational strategy of the distance measure that achieves a higher
correlation with human judgments provides a candidate for a better model for rhythm
perception. A concrete example will clarify the distinction between these two strategies at
work. Consider the two twelve-pulse rhythms given by A = [x . . . x . x . x . x . ] and B = [x .
. x . x . x . x . . ]. The minimum number of swaps required to convert A to B involves the
four local swaps of the second, third, fourth, and fifth onsets of A with their four preceding
rests, respectively, yielding a swap distance equal to 4. The edit distance, on the other hand,
is equal to 2, and may be obtained as follows. First, a deletion of the rest at pulse 4 in the
twelve-pulse rhythm given by A = [x . . . x . x . x . x . ] yields the eleven-pulse rhythm A' =
[x . . x . x . x . x . ]. Second, inserting a rest after pulse 11 in A' yields the rhythm [x . . x . x .
x . x . . ] = B, the desired result. Note that the single deletion operation of the rest at pulse 4
in rhythm A moves all onsets of A into alignment with all onsets of B.
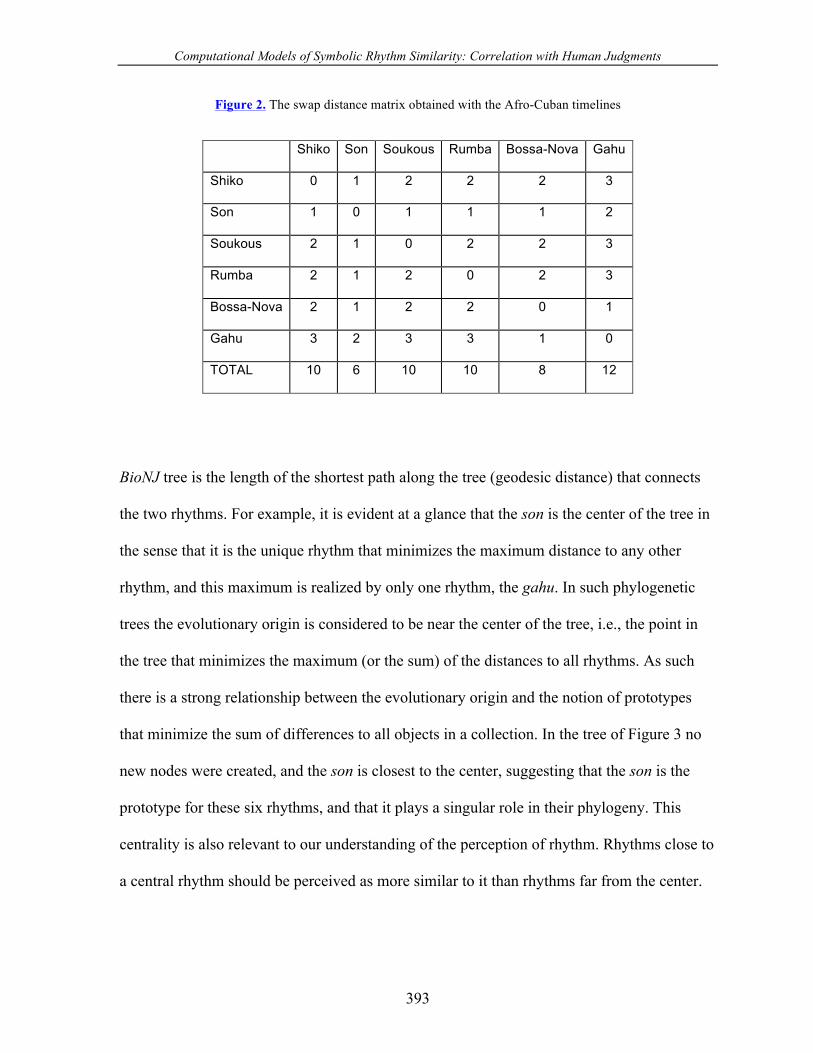
The distance matrix for the six rhythms listed in Figure 1, computed with the swap
distance, is given in Figure 2, where the bottom row contains the values (labeled TOTAL) of
the sums of the distances of each rhythm to all the others. This value is a measure of the
uniqueness of each rhythm in the group as a whole. Thus, the son, with a value of 6, is the
most similar, whereas the gahu, with a score of 12, is the most different. More specifically,
this number indicates for each rhythm the number of swaps needed to generate all the
rhythms in the group. Therefore the son is the most parsimonious.
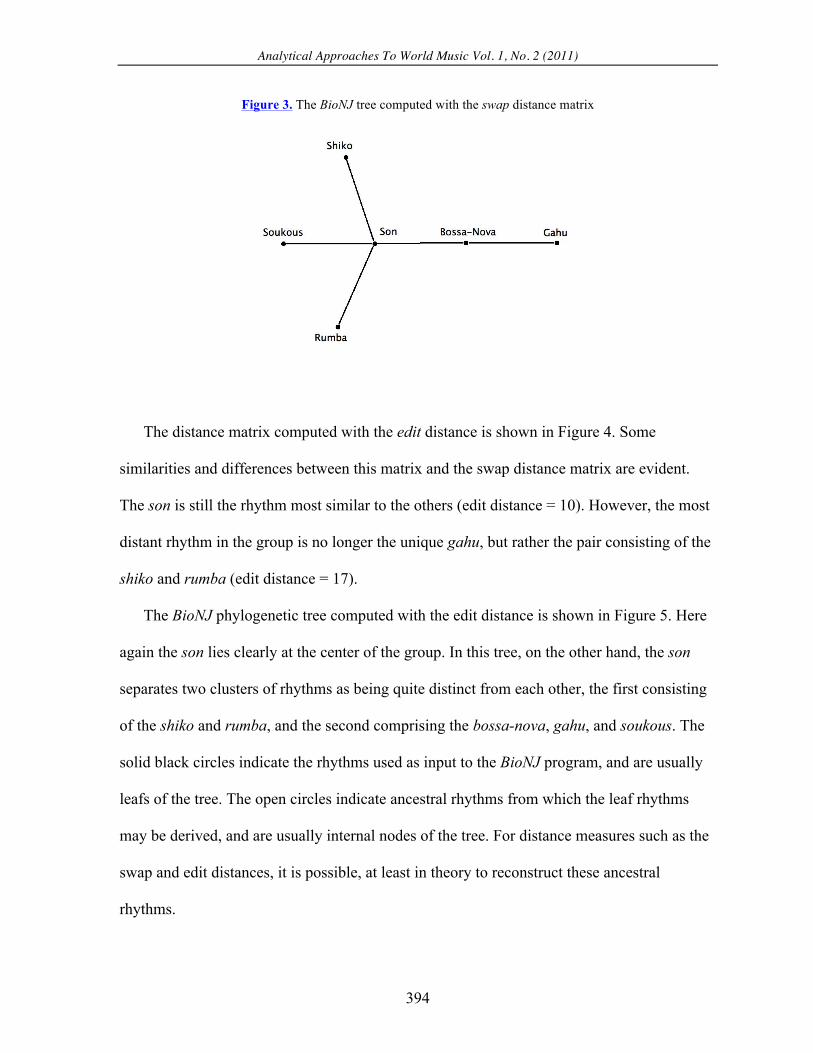
The BioNJ phylogenetic tree computed with the swap distance matrix of Figure 2 is
shown in Figure 3. This tree provides a concise and immediate visualization of all the
relationships present in the distance matrix. The distance between any pair of rhythms in the
Computational Models of Symbolic Rhythm Similarity: Correlation with Human Judgments
393
Figure 2. The swap distance matrix obtained with the Afro-Cuban timelines
Shiko Son Soukous Rumba Bossa-Nova Gahu
Shiko 0 1 2 2 2 3
Son 1 0 1 1 1 2
Soukous 2 1 0 2 2 3
Rumba 2 1 2 0 2 3
Bossa-Nova 2 1 2 2 0 1
Gahu 3 2 3 3 1 0
TOTAL 10 6 10 10 8 12
BioNJ tree is the length of the shortest path along the tree (geodesic distance) that connects
the two rhythms. For example, it is evident at a glance that the son is the center of the tree in
the sense that it is the unique rhythm that minimizes the maximum distance to any other
rhythm, and this maximum is realized by only one rhythm, the gahu. In such phylogenetic
trees the evolutionary origin is considered to be near the center of the tree, i.e., the point in
the tree that minimizes the maximum (or the sum) of the distances to all rhythms. As such
there is a strong relationship between the evolutionary origin and the notion of prototypes
that minimize the sum of differences to all objects in a collection. In the tree of Figure 3 no
new nodes were created, and the son is closest to the center, suggesting that the son is the
prototype for these six rhythms, and that it plays a singular role in their phylogeny. This
centrality is also relevant to our understanding of the perception of rhythm. Rhythms close to
a central rhythm should be perceived as more similar to it than rhythms far from the center.
Analytical Approaches To World Music Vol. 1, No. 2 (2011)
394
Figure 3. The BioNJ tree computed with the swap distance matrix
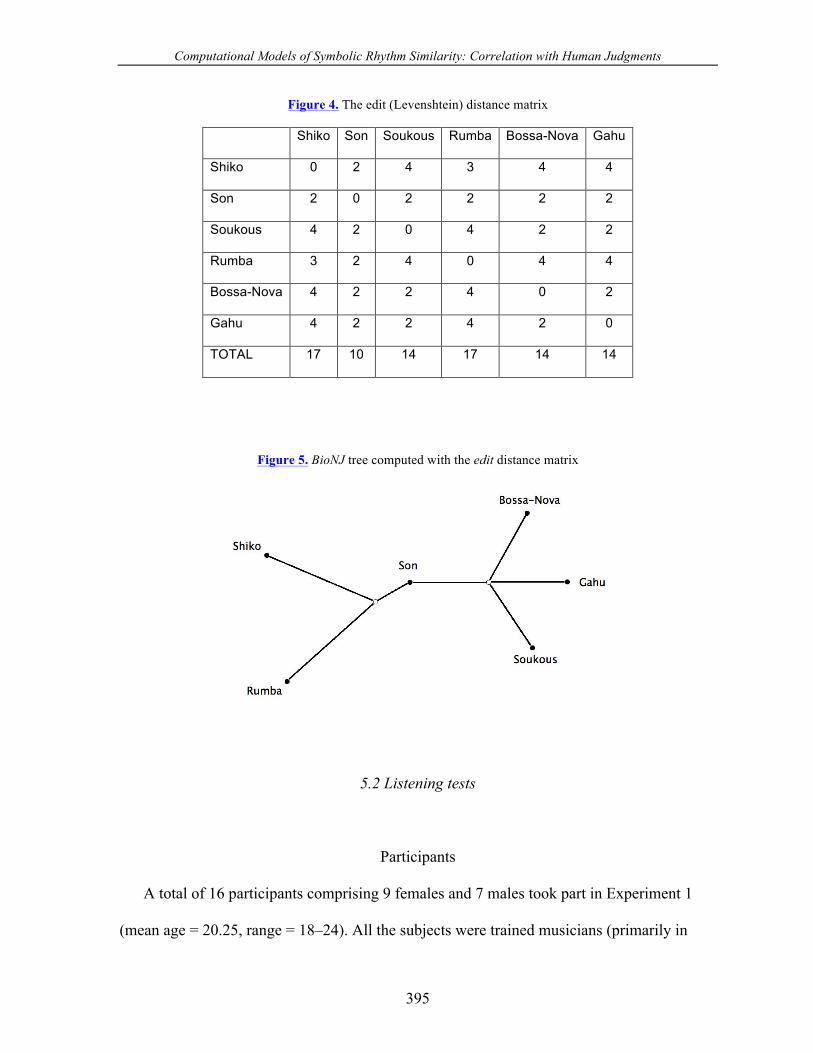
The distance matrix computed with the edit distance is shown in Figure 4. Some
similarities and differences between this matrix and the swap distance matrix are evident.
The son is still the rhythm most similar to the others (edit distance = 10). However, the most
distant rhythm in the group is no longer the unique gahu, but rather the pair consisting of the
shiko and rumba (edit distance = 17).
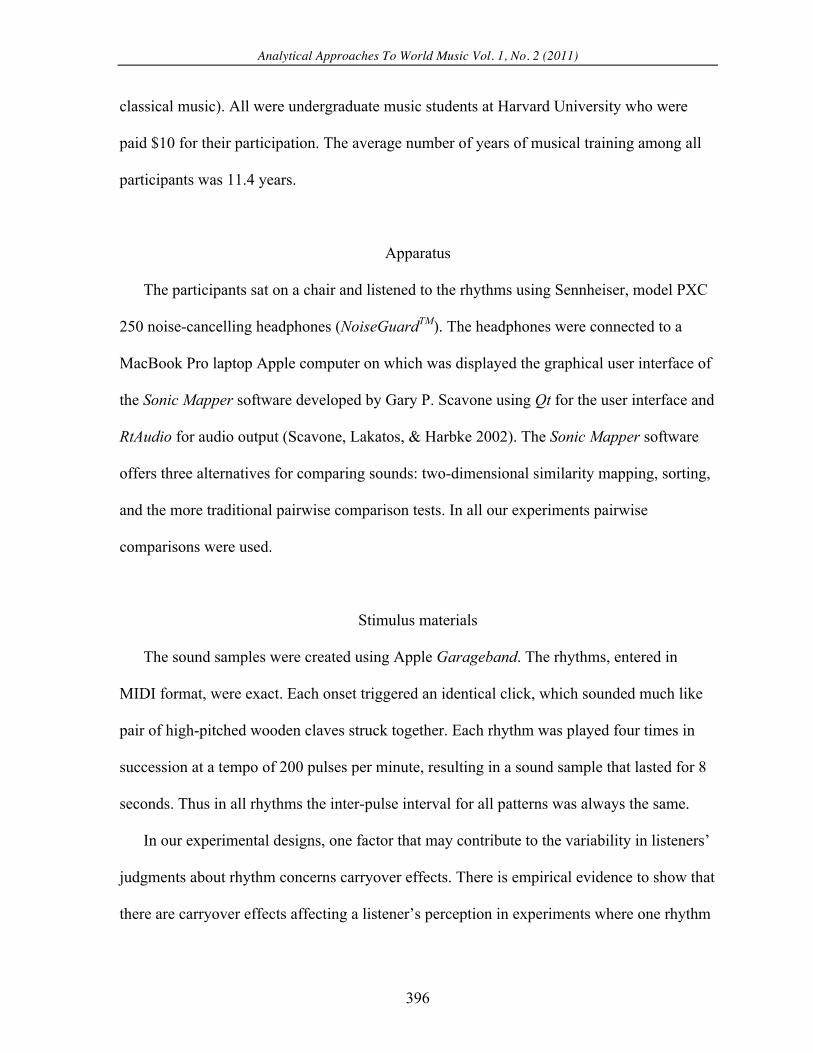
The BioNJ phylogenetic tree computed with the edit distance is shown in Figure 5. Here
again the son lies clearly at the center of the group. In this tree, on the other hand, the son
separates two clusters of rhythms as being quite distinct from each other, the first consisting
of the shiko and rumba, and the second comprising the bossa-nova, gahu, and soukous. The
solid black circles indicate the rhythms used as input to the BioNJ program, and are usually
leafs of the tree. The open circles indicate ancestral rhythms from which the leaf rhythms
may be derived, and are usually internal nodes of the tree. For distance measures such as the
swap and edit distances, it is possible, at least in theory to reconstruct these ancestral
rhythms.
Computational Models of Symbolic Rhythm Similarity: Correlation with Human Judgments
395
Figure 4. The edit (Levenshtein) distance matrix
Shiko Son Soukous Rumba Bossa-Nova Gahu
Shiko 0 2 4 3 4 4
Son 2 0 2 2 2 2
Soukous 4 2 0 4 2 2
Rumba 3 2 4 0 4 4
Bossa-Nova 4 2 2 4 0 2
Gahu 4 2 2 4 2 0
TOTAL 17 10 14 17 14 14
Figure 5. BioNJ tree computed with the edit distance matrix
5.2 Listening tests
Participants
A total of 16 participants comprising 9 females and 7 males took part in Experiment 1
(mean age = 20.25, range = 18–24). All the subjects were trained musicians (primarily in
Analytical Approaches To World Music Vol. 1, No. 2 (2011)
396
classical music). All were undergraduate music students at Harvard University who were
paid $10 for their participation. The average number of years of musical training among all
participants was 11.4 years.
Apparatus
The participants sat on a chair and listened to the rhythms using Sennheiser, model PXC
250 noise-cancelling headphones (NoiseGuardTM). The headphones were connected to a
MacBook Pro laptop Apple computer on which was displayed the graphical user interface of
the Sonic Mapper software developed by Gary P. Scavone using Qt for the user interface and
RtAudio for audio output (Scavone, Lakatos, & Harbke 2002). The Sonic Mapper software
offers three alternatives for comparing sounds: two-dimensional similarity mapping, sorting,
and the more traditional pairwise comparison tests. In all our experiments pairwise
comparisons were used.
Stimulus materials
The sound samples were created using Apple Garageband. The rhythms, entered in
MIDI format, were exact. Each onset triggered an identical click, which sounded much like
pair of high-pitched wooden claves struck together. Each rhythm was played four times in
succession at a tempo of 200 pulses per minute, resulting in a sound sample that lasted for 8
seconds. Thus in all rhythms the inter-pulse interval for all patterns was always the same.
In our experimental designs, one factor that may contribute to the variability in listeners’
judgments about rhythm concerns carryover effects. There is empirical evidence to show that
there are carryover effects affecting a listener’s perception in experiments where one rhythm
Computational Models of Symbolic Rhythm Similarity: Correlation with Human Judgments
397
is presented following another rhythm (Beauvillain 1983; Francis & Ciocca 2003), or when
the tempo is varied (Desain, Jansen, & Honing 2000), or when pitch is varied (Pitt &
Monahan 1987). In our experiments tempo and pitch were kept constant at all times.
Some may argue that rhythm is not a mere sequence of identical clicks or onsets.
However, the music literature is filled with a plethora of definitions of rhythm (Abdy
Williams 2009, 24). Rhythm may be studied at a variety of different levels of richness of
information that may include any combination of properties such as pitch, intensity, micro-
timing deviations, dynamic differences, timbre, texture, harmony, accentuation patterns, and
beat/metrical structure (Cooper & Meyer 1960). Here we strip rhythms down to their barest
representations as pure durational patterns. Hence we also refer to these rhythms as
durational rhythms, to emphasize that the structure of their objective input representation is
determined purely by duration.
Procedure
Each participant was seated in an isolated, quiet room with a laptop, headphones, and a
sheet of instructions. Before the start of the experiment the participant filled out a form with
some biographical data. The instructions told the participants that they would be hearing 30
pairs of rhythms, and that they would be asked to compare them using a sliding scale from 1
(most dissimilar) to 10 (most similar). SonicMapper presented the pairs of rhythms to the
participants in a randomized order. Within this random order each pair of rhythms (A, B)
was presented twice, once with rhythm A heard before rhythm B, and once with rhythm B
heard before rhythm A. Each test took approximately 20 to 30 minutes to complete. The
subjects did not listen to the rhythms before the experiment began, they were not trained to
Analytical Approaches To World Music Vol. 1, No. 2 (2011)
398
judge the range of possible similarity and dissimilarity judgments, and they were not given
practice trials or taught how to use a similarity scale.
5.3 Results of Experiment 1
The output of the SonicMapper consisted of a set of similarity ratings for each pair of
rhythms in each of the two orders of presentation for each participant. The median of these
similarity ratings, across all the participants, was used in order to reduce the impact of
outliers, and the resulting numbers were subtracted from 10 to convert them to “distances.”
The resulting distance matrix is shown in Figure 6. The entries at the bottom row (labeled
TOTAL) list the sums of the distances from each rhythm (indicated at the top of the
columns) to all the other rhythms, summed in both directions of presentation, and divided by
two. Thus the score of any given rhythm is equal to half the sum of all the values in that
rhythm’s row and column. In subsequent calculations the mean scores were compared to the
median scores, and they gave virtually the same trees and correlation values.
To compute a phylogenetic tree the BioNJ program requires as input a symmetric
distance matrix. When the matrix is not symmetric (as is the case in Figure 6) the program
automatically symmetrizes it by averaging the corresponding pairs of non-diagonal elements.
The BioNJ tree computed with the symmetrized version of the matrix of Figure 6 is given in
Figure 7.
Since the BioNJ phylogenetic tree program automatically produces a symmetric matrix
from a non-symmetric matrix, we wanted to determine if there was a significant difference in
judgments depending on the order in which the pairs of rhythms were presented to the
listeners during the experiments. Therefore a Mantel test was performed to measure the
Computational Models of Symbolic Rhythm Similarity: Correlation with Human Judgments
399
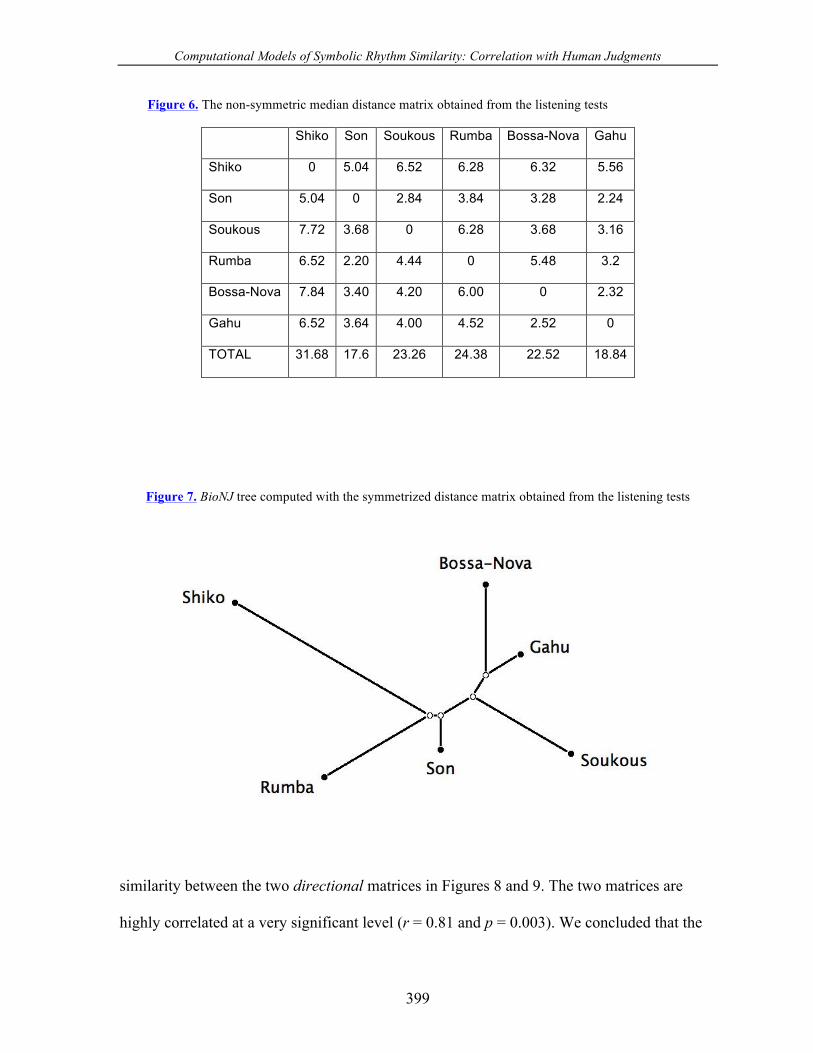
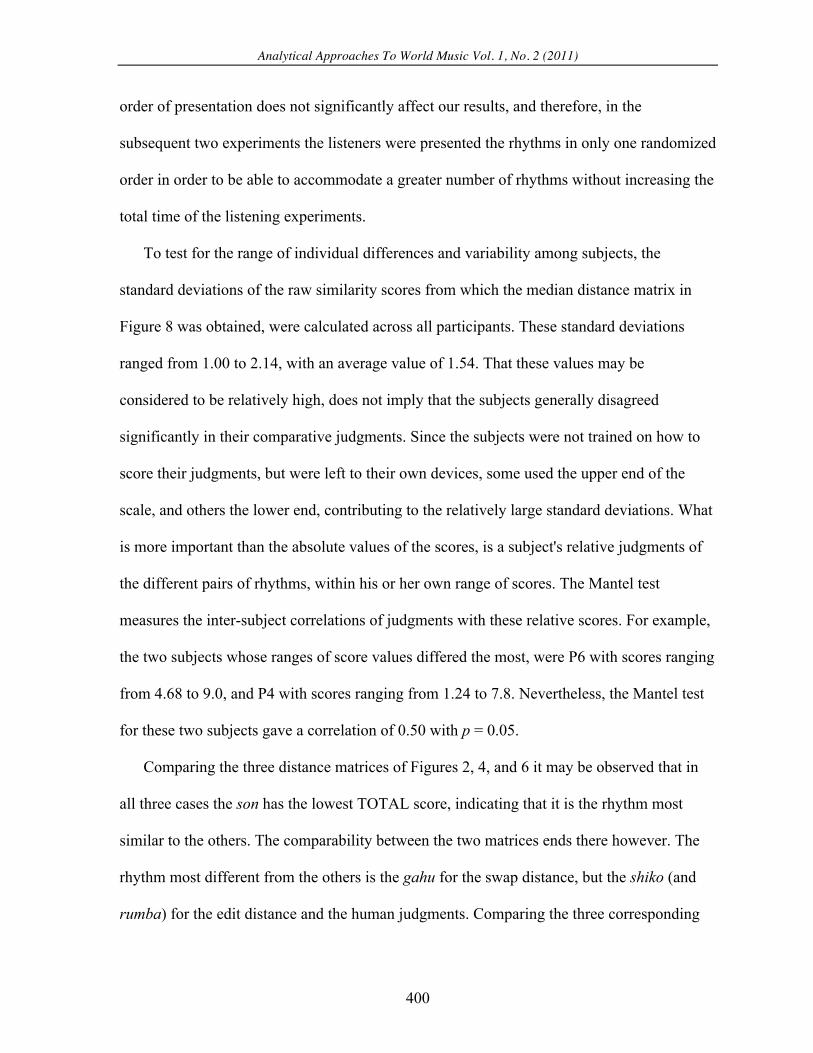
Figure 6. The non-symmetric median distance matrix obtained from the listening tests
Shiko Son Soukous Rumba Bossa-Nova Gahu
Shiko 0 5.04 6.52 6.28 6.32 5.56
Son 5.04 0 2.84 3.84 3.28 2.24
Soukous 7.72 3.68 0 6.28 3.68 3.16
Rumba 6.52 2.20 4.44 0 5.48 3.2
Bossa-Nova 7.84 3.40 4.20 6.00 0 2.32
Gahu 6.52 3.64 4.00 4.52 2.52 0
TOTAL 31.68 17.6 23.26 24.38 22.52 18.84
Figure 7. BioNJ tree computed with the symmetrized distance matrix obtained from the listening tests
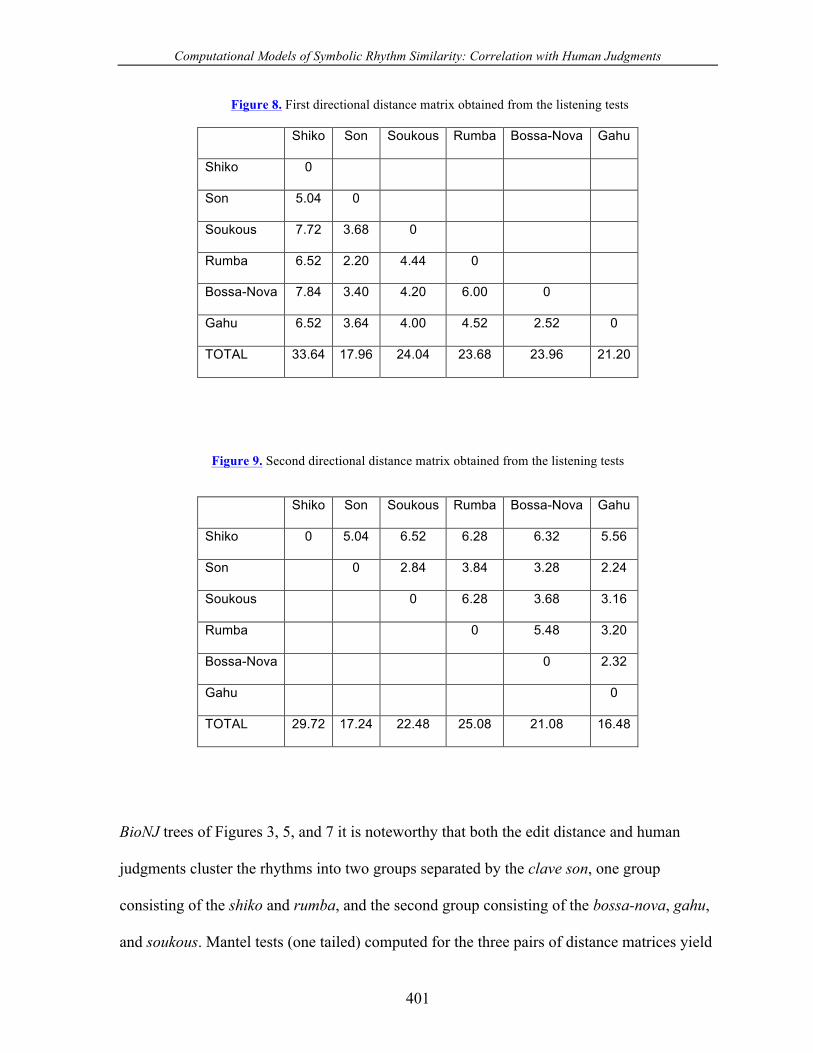
similarity between the two directional matrices in Figures 8 and 9. The two matrices are
highly correlated at a very significant level (r = 0.81 and p = 0.003). We concluded that the
Analytical Approaches To World Music Vol. 1, No. 2 (2011)
400
order of presentation does not significantly affect our results, and therefore, in the
subsequent two experiments the listeners were presented the rhythms in only one randomized
order in order to be able to accommodate a greater number of rhythms without increasing the
total time of the listening experiments.
To test for the range of individual differences and variability among subjects, the
standard deviations of the raw similarity scores from which the median distance matrix in
Figure 8 was obtained, were calculated across all participants. These standard deviations
ranged from 1.00 to 2.14, with an average value of 1.54. That these values may be
considered to be relatively high, does not imply that the subjects generally disagreed
significantly in their comparative judgments. Since the subjects were not trained on how to
score their judgments, but were left to their own devices, some used the upper end of the
scale, and others the lower end, contributing to the relatively large standard deviations. What
is more important than the absolute values of the scores, is a subject's relative judgments of
the different pairs of rhythms, within his or her own range of scores. The Mantel test
measures the inter-subject correlations of judgments with these relative scores. For example,
the two subjects whose ranges of score values differed the most, were P6 with scores ranging
from 4.68 to 9.0, and P4 with scores ranging from 1.24 to 7.8. Nevertheless, the Mantel test
for these two subjects gave a correlation of 0.50 with p = 0.05.
Comparing the three distance matrices of Figures 2, 4, and 6 it may be observed that in
all three cases the son has the lowest TOTAL score, indicating that it is the rhythm most
similar to the others. The comparability between the two matrices ends there however. The
rhythm most different from the others is the gahu for the swap distance, but the shiko (and
rumba) for the edit distance and the human judgments. Comparing the three corresponding
Computational Models of Symbolic Rhythm Similarity: Correlation with Human Judgments
401
Figure 8. First directional distance matrix obtained from the listening tests
Shiko Son Soukous Rumba Bossa-Nova Gahu
Shiko 0
Son 5.04 0
Soukous 7.72 3.68 0
Rumba 6.52 2.20 4.44 0
Bossa-Nova 7.84 3.40 4.20 6.00 0
Gahu 6.52 3.64 4.00 4.52 2.52 0
TOTAL 33.64 17.96 24.04 23.68 23.96 21.20
Figure 9. Second directional distance matrix obtained from the listening tests
Shiko Son Soukous Rumba Bossa-Nova Gahu
Shiko 0 5.04 6.52 6.28 6.32 5.56
Son 0 2.84 3.84 3.28 2.24
Soukous 0 6.28 3.68 3.16
Rumba 0 5.48 3.20
Bossa-Nova 0 2.32
Gahu 0
TOTAL 29.72 17.24 22.48 25.08 21.08 16.48
BioNJ trees of Figures 3, 5, and 7 it is noteworthy that both the edit distance and human
judgments cluster the rhythms into two groups separated by the clave son, one group
consisting of the shiko and rumba, and the second group consisting of the bossa-nova, gahu,
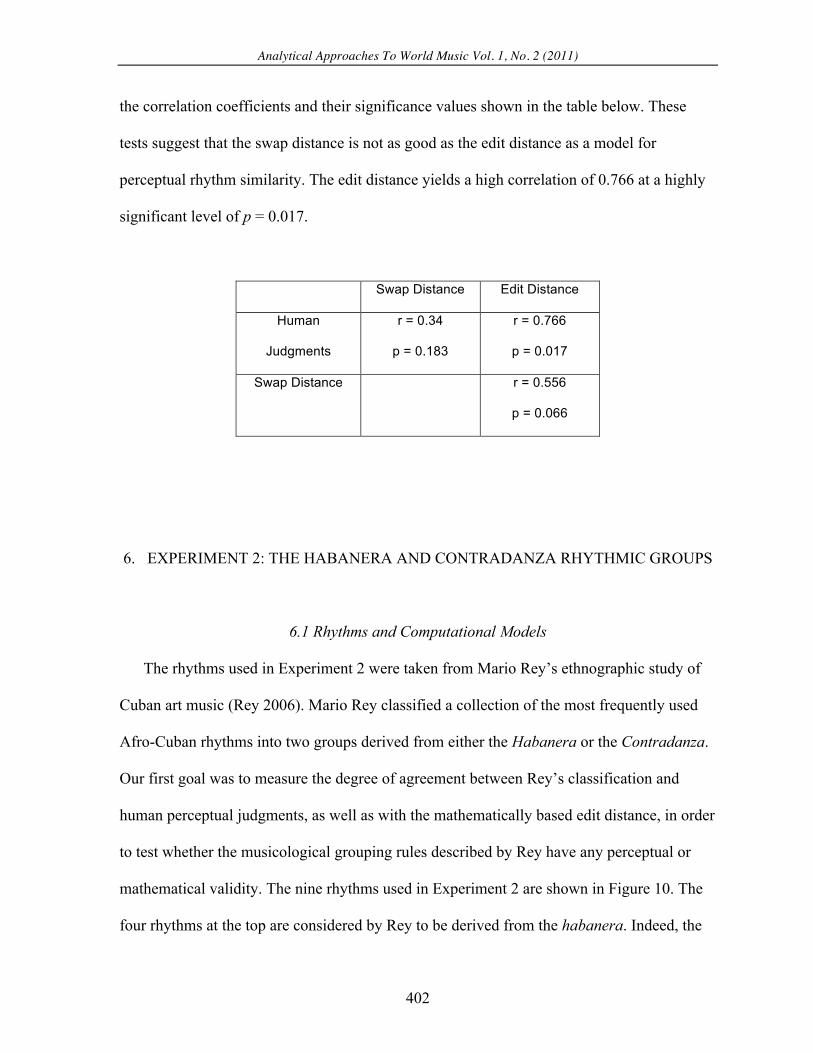
and soukous. Mantel tests (one tailed) computed for the three pairs of distance matrices yield
Analytical Approaches To World Music Vol. 1, No. 2 (2011)
402
the correlation coefficients and their significance values shown in the table below. These
tests suggest that the swap distance is not as good as the edit distance as a model for
perceptual rhythm similarity. The edit distance yields a high correlation of 0.766 at a highly
significant level of p = 0.017.
Swap Distance Edit Distance
Human
Judgments
r = 0.34
p = 0.183
r = 0.766
p = 0.017
Swap Distance r = 0.556
p = 0.066
6. EXPERIMENT 2: THE HABANERA AND CONTRADANZA RHYTHMIC GROUPS
6.1 Rhythms and Computational Models
The rhythms used in Experiment 2 were taken from Mario Rey’s ethnographic study of
Cuban art music (Rey 2006). Mario Rey classified a collection of the most frequently used
Afro-Cuban rhythms into two groups derived from either the Habanera or the Contradanza.
Our first goal was to measure the degree of agreement between Rey’s classification and
human perceptual judgments, as well as with the mathematically based edit distance, in order
to test whether the musicological grouping rules described by Rey have any perceptual or
mathematical validity. The nine rhythms used in Experiment 2 are shown in Figure 10. The
four rhythms at the top are considered by Rey to be derived from the habanera. Indeed, the
Computational Models of Symbolic Rhythm Similarity: Correlation with Human Judgments
403
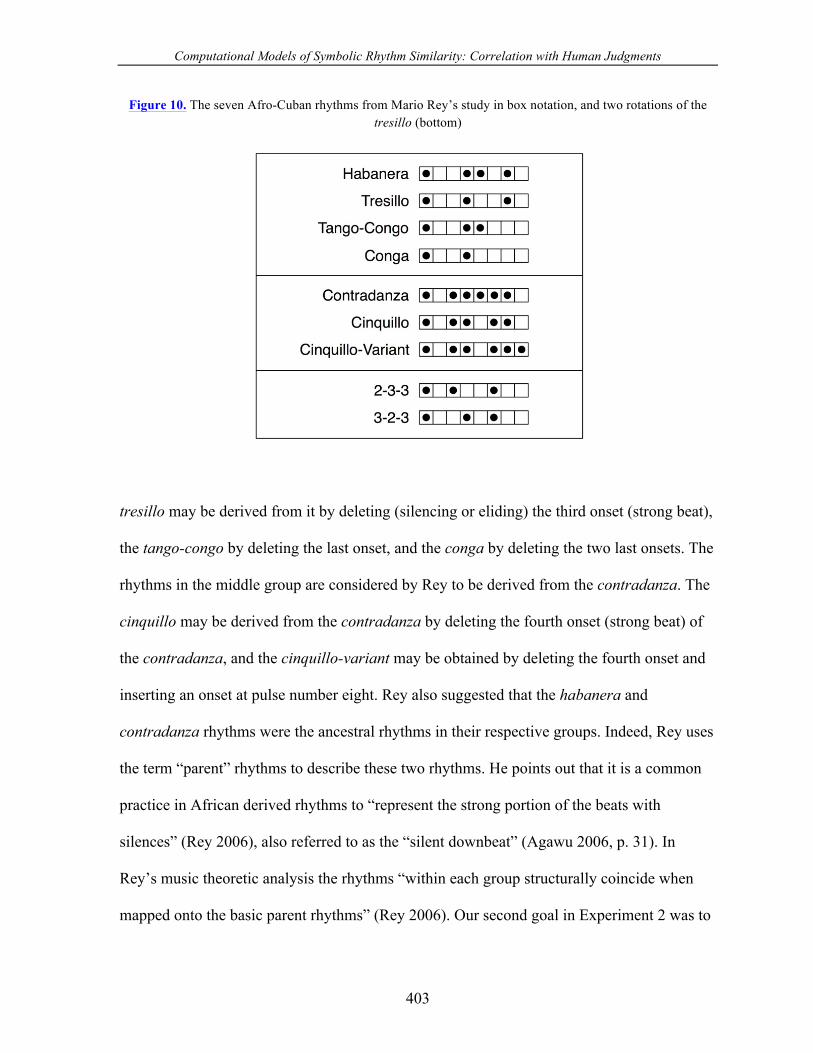
Figure 10. The seven Afro-Cuban rhythms from Mario Rey’s study in box notation, and two rotations of the tresillo (bottom)
tresillo may be derived from it by deleting (silencing or eliding) the third onset (strong beat),
the tango-congo by deleting the last onset, and the conga by deleting the two last onsets. The
rhythms in the middle group are considered by Rey to be derived from the contradanza. The
cinquillo may be derived from the contradanza by deleting the fourth onset (strong beat) of
the contradanza, and the cinquillo-variant may be obtained by deleting the fourth onset and
inserting an onset at pulse number eight. Rey also suggested that the habanera and
contradanza rhythms were the ancestral rhythms in their respective groups. Indeed, Rey uses
the term “parent” rhythms to describe these two rhythms. He points out that it is a common
practice in African derived rhythms to “represent the strong portion of the beats with
silences” (Rey 2006), also referred to as the “silent downbeat” (Agawu 2006, p. 31). In
Rey’s music theoretic analysis the rhythms “within each group structurally coincide when
mapped onto the basic parent rhythms” (Rey 2006). Our second goal in Experiment 2 was to
Analytical Approaches To World Music Vol. 1, No. 2 (2011)
404
determine if phylogenetic trees that use the edit distance support Rey’s analysis. The last
group of two rhythms at the bottom of Figure 10 were added to Rey’s collection because
they are rotations of the tresillo and are used all over the world.
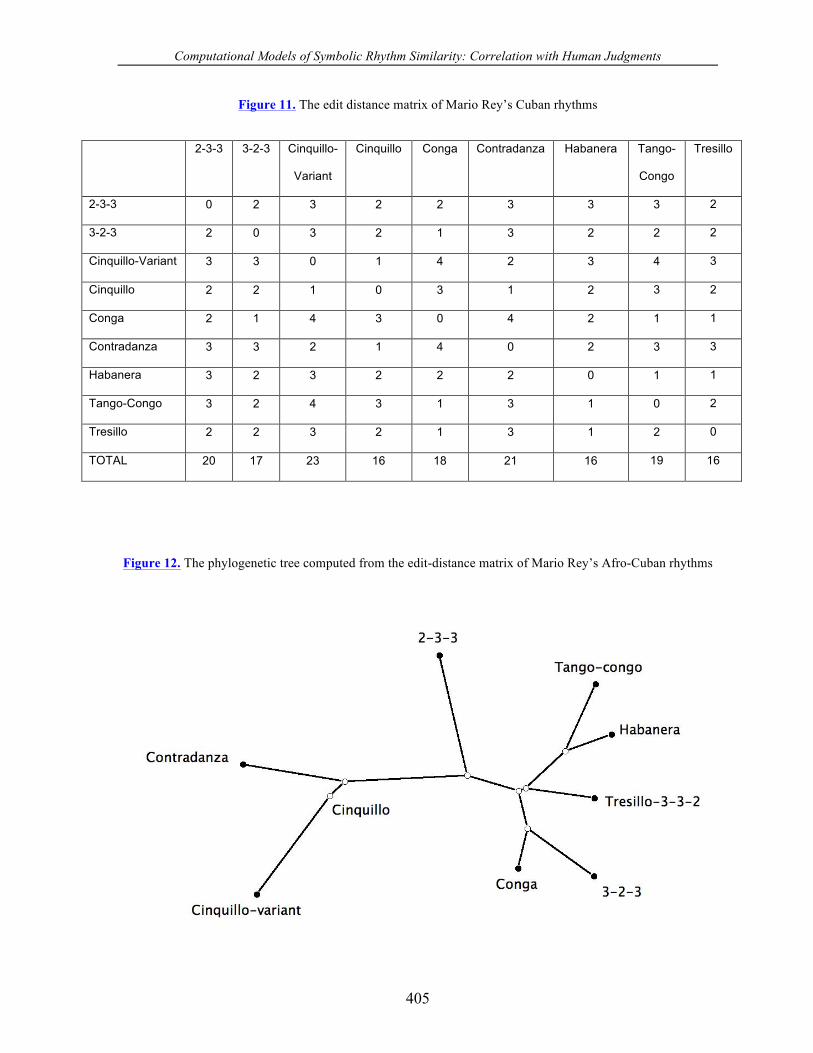
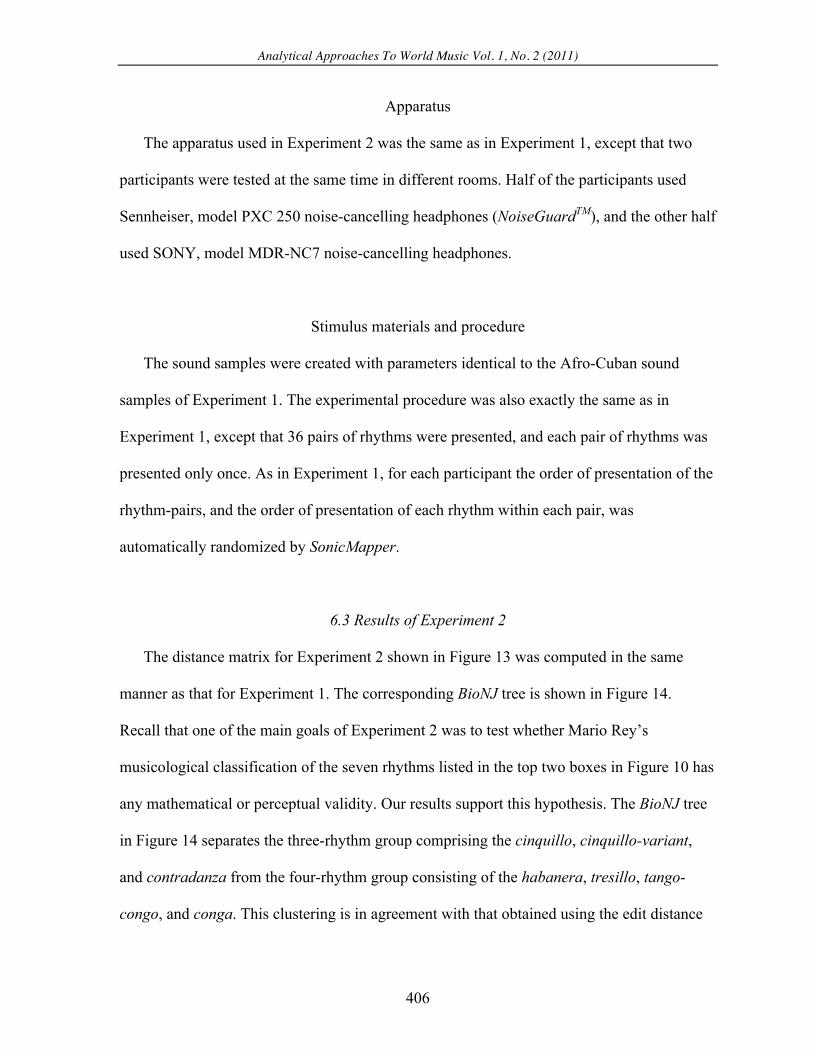
The edit distance matrix and corresponding BioNJ tree computed from these nine
rhythms are shown in Figures 11 and 12, respectively. The tree in Figure 12 exhibits two
main clusters in which the first cluster, comprising the contradanza, cinquillo, and cinquillo-
variant, is widely separated from the second cluster consisting of the remaining rhythms.
This second cluster contains the singleton 2-3-3 rhythm widely separated from the remaining
rhythms. In the remaining rhythms two sub-clusters are also evident: the pair making up the
tango-congo and habanera, and the pair consisting of the conga and the 3-2-3 rhythm.
6.2 Listening tests
Participants
A total of 16 participants comprising 8 females and 8 males took part in Experiment 2
(mean age = 29.5, range = 18–57). Half of the subjects were Radcliffe Fellows at the
Radcliffe Institute for Advanced Study at Harvard University, and half were undergraduate
music students at Harvard University, who were paid $10 for their participation. The
Radcliffe Fellows represented a wide assortment of academic disciplines. The average
number of years of musical training among all participants was 9.1 years.
Computational Models of Symbolic Rhythm Similarity: Correlation with Human Judgments
405
Figure 11. The edit distance matrix of Mario Rey’s Cuban rhythms
2-3-3 3-2-3 Cinquillo-
Variant
Cinquillo Conga Contradanza Habanera Tango-
Congo
Tresillo
2-3-3 0 2 3 2 2 3 3 3 2
3-2-3 2 0 3 2 1 3 2 2 2
Cinquillo-Variant 3 3 0 1 4 2 3 4 3
Cinquillo 2 2 1 0 3 1 2 3 2
Conga 2 1 4 3 0 4 2 1 1
Contradanza 3 3 2 1 4 0 2 3 3
Habanera 3 2 3 2 2 2 0 1 1
Tango-Congo 3 2 4 3 1 3 1 0 2
Tresillo 2 2 3 2 1 3 1 2 0
TOTAL 20 17 23 16 18 21 16 19 16
Figure 12. The phylogenetic tree computed from the edit-distance matrix of Mario Rey’s Afro-Cuban rhythms
Analytical Approaches To World Music Vol. 1, No. 2 (2011)
406
Apparatus
The apparatus used in Experiment 2 was the same as in Experiment 1, except that two
participants were tested at the same time in different rooms. Half of the participants used
Sennheiser, model PXC 250 noise-cancelling headphones (NoiseGuardTM), and the other half
used SONY, model MDR-NC7 noise-cancelling headphones.
Stimulus materials and procedure
The sound samples were created with parameters identical to the Afro-Cuban sound
samples of Experiment 1. The experimental procedure was also exactly the same as in
Experiment 1, except that 36 pairs of rhythms were presented, and each pair of rhythms was
presented only once. As in Experiment 1, for each participant the order of presentation of the
rhythm-pairs, and the order of presentation of each rhythm within each pair, was
automatically randomized by SonicMapper.
6.3 Results of Experiment 2
The distance matrix for Experiment 2 shown in Figure 13 was computed in the same
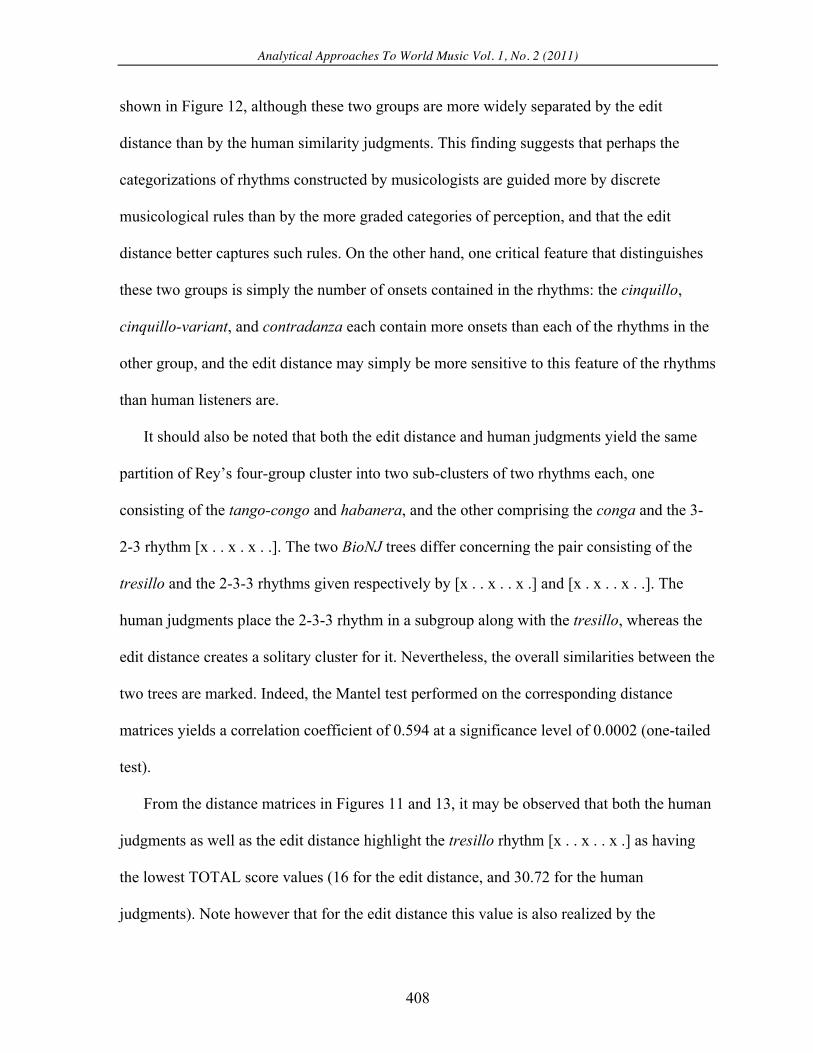
manner as that for Experiment 1. The corresponding BioNJ tree is shown in Figure 14.
Recall that one of the main goals of Experiment 2 was to test whether Mario Rey’s
musicological classification of the seven rhythms listed in the top two boxes in Figure 10 has
any mathematical or perceptual validity. Our results support this hypothesis. The BioNJ tree
in Figure 14 separates the three-rhythm group comprising the cinquillo, cinquillo-variant,
and contradanza from the four-rhythm group consisting of the habanera, tresillo, tango-
congo, and conga. This clustering is in agreement with that obtained using the edit distance
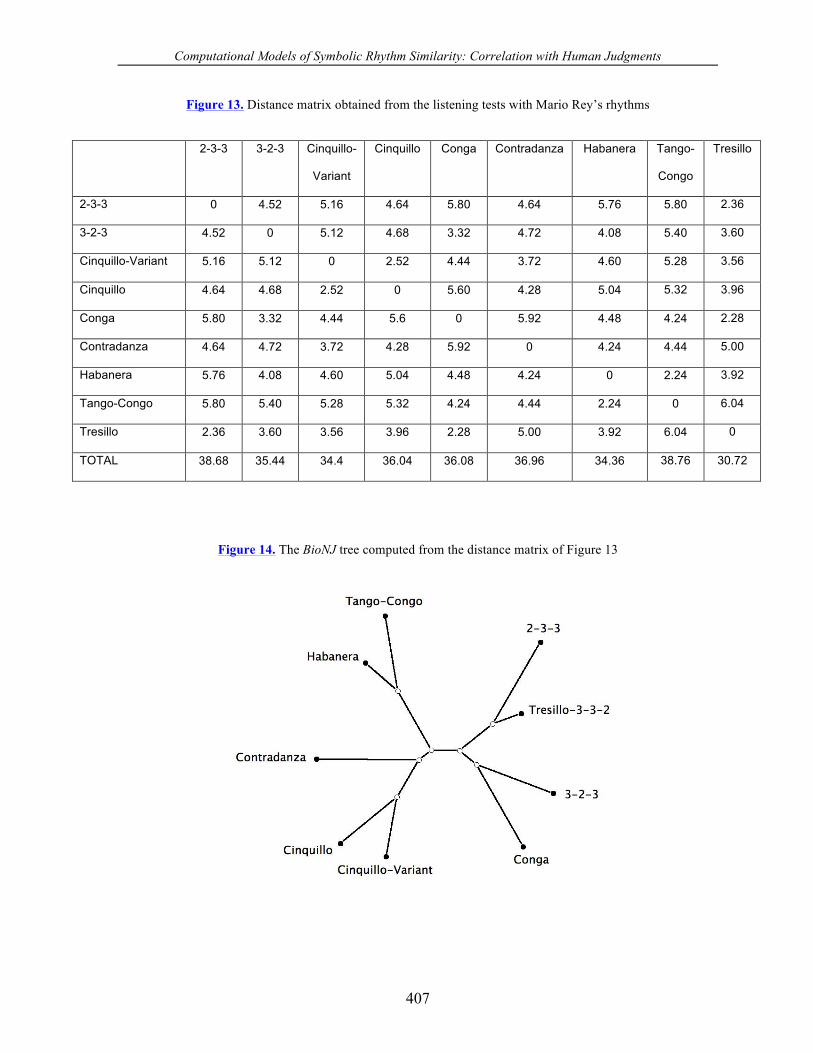
Computational Models of Symbolic Rhythm Similarity: Correlation with Human Judgments
407
Figure 13. Distance matrix obtained from the listening tests with Mario Rey’s rhythms
2-3-3 3-2-3 Cinquillo-
Variant
Cinquillo Conga Contradanza Habanera Tango-
Congo
Tresillo
2-3-3 0 4.52 5.16 4.64 5.80 4.64 5.76 5.80 2.36
3-2-3 4.52 0 5.12 4.68 3.32 4.72 4.08 5.40 3.60
Cinquillo-Variant 5.16 5.12 0 2.52 4.44 3.72 4.60 5.28 3.56
Cinquillo 4.64 4.68 2.52 0 5.60 4.28 5.04 5.32 3.96
Conga 5.80 3.32 4.44 5.6 0 5.92 4.48 4.24 2.28
Contradanza 4.64 4.72 3.72 4.28 5.92 0 4.24 4.44 5.00
Habanera 5.76 4.08 4.60 5.04 4.48 4.24 0 2.24 3.92
Tango-Congo 5.80 5.40 5.28 5.32 4.24 4.44 2.24 0 6.04
Tresillo 2.36 3.60 3.56 3.96 2.28 5.00 3.92 6.04 0
TOTAL 38.68 35.44 34.4 36.04 36.08 36.96 34.36 38.76 30.72
Figure 14. The BioNJ tree computed from the distance matrix of Figure 13
Analytical Approaches To World Music Vol. 1, No. 2 (2011)
408
shown in Figure 12, although these two groups are more widely separated by the edit
distance than by the human similarity judgments. This finding suggests that perhaps the
categorizations of rhythms constructed by musicologists are guided more by discrete
musicological rules than by the more graded categories of perception, and that the edit
distance better captures such rules. On the other hand, one critical feature that distinguishes
these two groups is simply the number of onsets contained in the rhythms: the cinquillo,
cinquillo-variant, and contradanza each contain more onsets than each of the rhythms in the
other group, and the edit distance may simply be more sensitive to this feature of the rhythms
than human listeners are.
It should also be noted that both the edit distance and human judgments yield the same
partition of Rey’s four-group cluster into two sub-clusters of two rhythms each, one
consisting of the tango-congo and habanera, and the other comprising the conga and the 3-
2-3 rhythm [x . . x . x . .]. The two BioNJ trees differ concerning the pair consisting of the
tresillo and the 2-3-3 rhythms given respectively by [x . . x . . x .] and [x . x . . x . .]. The
human judgments place the 2-3-3 rhythm in a subgroup along with the tresillo, whereas the
edit distance creates a solitary cluster for it. Nevertheless, the overall similarities between the
two trees are marked. Indeed, the Mantel test performed on the corresponding distance
matrices yields a correlation coefficient of 0.594 at a significance level of 0.0002 (one-tailed
test).
From the distance matrices in Figures 11 and 13, it may be observed that both the human
judgments as well as the edit distance highlight the tresillo rhythm [x . . x . . x .] as having
the lowest TOTAL score values (16 for the edit distance, and 30.72 for the human
judgments). Note however that for the edit distance this value is also realized by the
Computational Models of Symbolic Rhythm Similarity: Correlation with Human Judgments
409
habanera [x . . x x . x .] and the cinquillo [x . x x . x x .]. As an aside it is worth pointing out
that the tresillo consists of the first eight pulses (measure) of the world-famous clave son
timeline given by [x . . x . . x . . . x . x . . . ], a rhythm that is considered to have conquered
the world (Toussaint 2010).
Recall that Mario Rey, in his qualitative ethnographic study, considers the habanera and
contradanza to be the ancestral rhythms (“parents”) of the upper two groups of rhythms
illustrated in Figure 10. However, the perceptual information characterized by the distance
matrix and BioNJ tree obtained from the human judgments does not support these claims, but
rather suggests that the tresillo, by virtue of being the most parsimonious rhythm, is the
ancestor of the entire group. On the other hand, the more objective criteria given by the
distance matrix (Figure 11) and BioNJ tree (Figure 12) obtained from the edit distance, tell a
different story. Here three rhythms are tied for being most parsimonious, with TOTAL
scores equal to 16: the tresillo, the habanera, and the cinquillo. This suggests that, along
with the tresillo, the habanera is also a likely contender for the ancestral rhythm of the first
group, in partial support of Rey’s claim. On the other hand, contrary to Rey’s claim, the edit
distance selects the cinquillo rather than the contradanza as the ancestral rhythm for the
second group in Rey’s classification. These findings suggest again that, like the
categorizations of rhythms constructed by musicologists, it may be that the genealogies they
formulate are guided more by explicit musicological rules passed down by teachers than by
perceptual similarities. After all, the edit distance permits ancestral rhythms to have either
fewer or more onsets than its descendants, whereas in Rey’s analysis it appears that his
definition of parent rhythms implies that they contain the onsets of their offspring,
notwithstanding the cinquillo-variant.
Analytical Approaches To World Music Vol. 1, No. 2 (2011)
410
To test for the range of individual differences and variability among subjects, the
standard deviations of the raw similarity scores from which the median distance matrix in
Figure 13 was obtained, were calculated across all participants. These standard deviations
ranged from 1.35 to 2.26, with an average value of 1.7, slightly higher than for Experiment I.
Furthermore, there were some real outliers among the listeners, subjects that did not agree
with each other at all. For example, the two subjects whose ranges of score values differed
the most, were those labeled A3 and B7, with scores ranging from 3.1 to 8.8 and 2.0 to 6.7,
respectively. The Mantel test for these two subjects gave a correlation of –0.44 with p =
0.008.
7. EXPERIMENT 3: THE MIDDLE EASTERN AND MEDITERRANEAN RHYTHMS
7.1 Rhythms and Computational Models
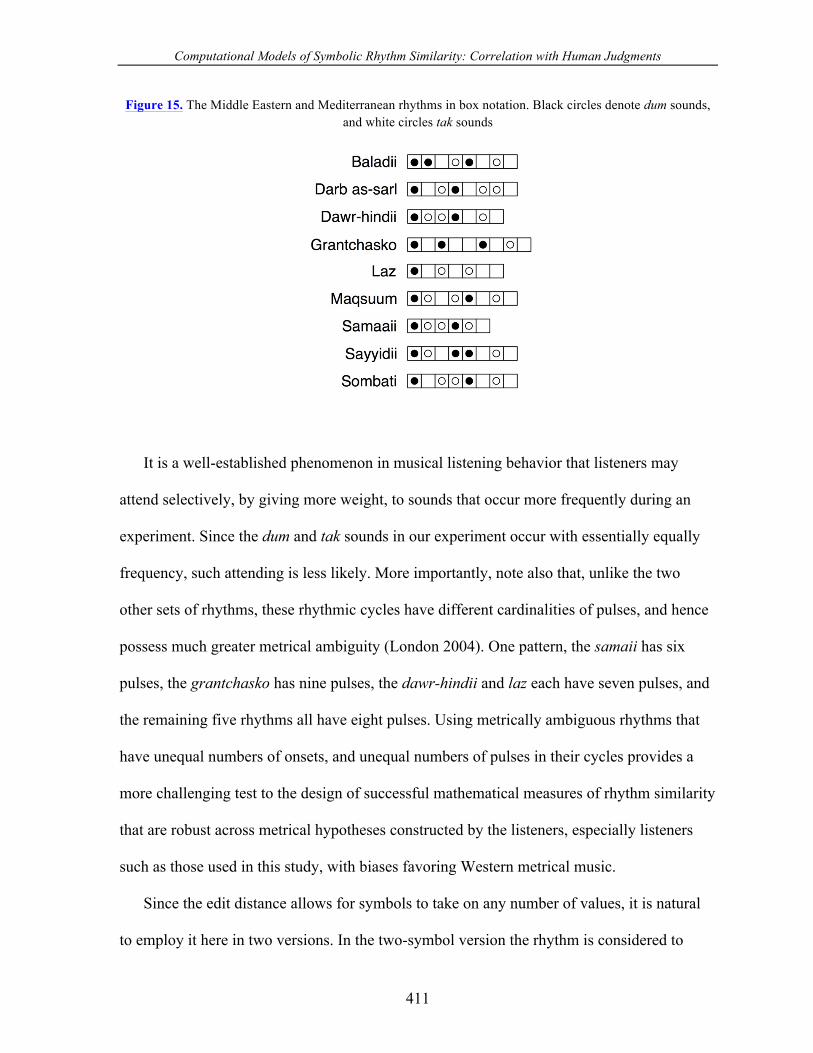
Experiment 3 used a set of dance rhythms, shown in Figure 15, that are completely
different from the timelines used in the first two experiments. Unlike the other two sets of
rhythms, these nine Middle Eastern and Mediterranean rhythms consist of two sounds, a low
mellow sound called dum, and a dry high-pitched sound called a tak. For this reason these
rhythms are often referred to as dum-tak rhythms (Shiloah 1995; Touma 1996; Middle
Eastern Rhythms FAQ, http://www.khafif.com/rhy/, accessed Jan. 13, 2011). The dum is
normally struck in the center of the drum skin, whereas the tak is played on the rim of the
drum. In the box-notation in Figure 15 the dum is notated with a black-filled circle, and the
tak with a white-filled circle. Note that the nine rhythms in combination contain an almost
equal number of dum (20) and tak (22) sounds.
Computational Models of Symbolic Rhythm Similarity: Correlation with Human Judgments
411
Figure 15. The Middle Eastern and Mediterranean rhythms in box notation. Black circles denote dum sounds, and white circles tak sounds
It is a well-established phenomenon in musical listening behavior that listeners may
attend selectively, by giving more weight, to sounds that occur more frequently during an
experiment. Since the dum and tak sounds in our experiment occur with essentially equally
frequency, such attending is less likely. More importantly, note also that, unlike the two
other sets of rhythms, these rhythmic cycles have different cardinalities of pulses, and hence
possess much greater metrical ambiguity (London 2004). One pattern, the samaii has six
pulses, the grantchasko has nine pulses, the dawr-hindii and laz each have seven pulses, and
the remaining five rhythms all have eight pulses. Using metrically ambiguous rhythms that
have unequal numbers of onsets, and unequal numbers of pulses in their cycles provides a
more challenging test to the design of successful mathematical measures of rhythm similarity
that are robust across metrical hypotheses constructed by the listeners, especially listeners
such as those used in this study, with biases favoring Western metrical music.
Since the edit distance allows for symbols to take on any number of values, it is natural
to employ it here in two versions. In the two-symbol version the rhythm is considered to
Analytical Approaches To World Music Vol. 1, No. 2 (2011)
412
consist of sounded and silent pulses only, without distinguishing between the dum and the
tak. In the three-symbol version the rhythm consists of dum, tak, and silent pulses. Therefore
in the two-symbol similarity calculations the three rhythms baladii, maqsuum, and sayyidii
are obviously all identical. One of the goals of this experiment was to determine whether,
and by how much, the results would improve if the rhythms were encoded with three rather
than two symbols in order to distinguish them from each other. The two-symbol and three-
symbol edit distance matrices computed with the nine rhythms of Figure 15, along with their
corresponding BioNJ trees are given in Figures 16–19.
7.2 Listening tests
Participants
A total of 16 participants comprising 8 females and 8 males took part in Experiment 3
(mean age = 24.1, range = 18–58). Two subjects were Radcliffe Fellows at the Radcliffe
Institute for Advanced Study at Harvard University, and fourteen were undergraduate
students at Harvard University, who were paid $15 for their participation. The average
number of years of musical training among all participants was 10.9 years.
Apparatus, stimulus materials, and procedure
The apparatus used in Experiment 3 was the same as in Experiment 2. The sound
samples were created in the same way as in the first two experiments, but instead of a
wooden clave-like click, a low dum sound (like a hand hitting the center of a drum), and a
higher tak sound (similar to a hand striking the edge of a drum) were used. The tempo was
kept constant for each sound sample so that they ranged in duration from 8 to 11 seconds
Computational Models of Symbolic Rhythm Similarity: Correlation with Human Judgments
413
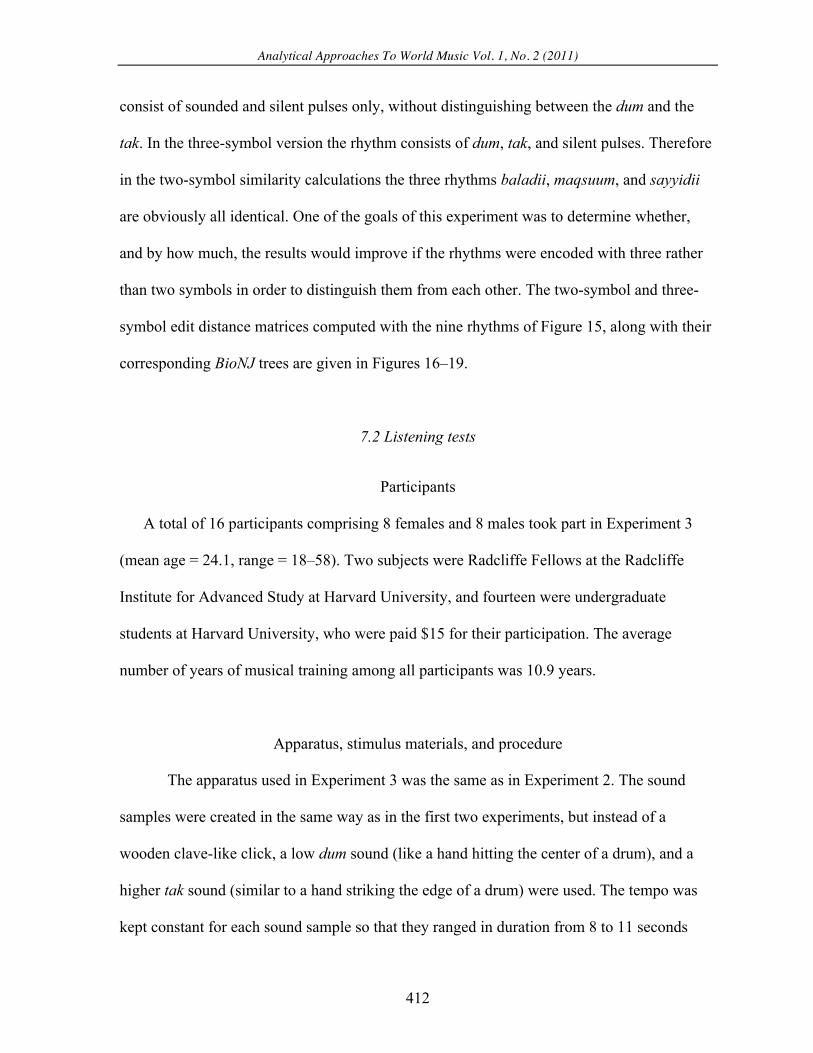
Figure 16. The two-symbol edit distance matrix for the Middle Eastern and Mediterranean dum-tak rhythms
Baladii Darb-
as-sarl
Dawr-
hindii
Grantchasko Laz Maqsuum Samaaii Sayyidii Sombati
Baladii 0 2 1 2 3 0 2 0 2
Darb-as-sarl 2 0 2 2 2 2 2 2 2
Dawr-hindii 1 2 0 3 3 1 1 1 1
Grantchasko 2 2 3 0 2 2 4 2 2
Laz 3 2 3 2 0 3 3 3 2
Maqsuum 0 2 1 2 3 0 2 0 2
Samaaii 2 2 1 4 3 2 0 2 2
Sayyidii 0 2 1 2 3 0 2 0 2
Sombati 2 2 1 2 2 2 2 2 0
TOTAL 12 16 13 19 21 12 18 12 15
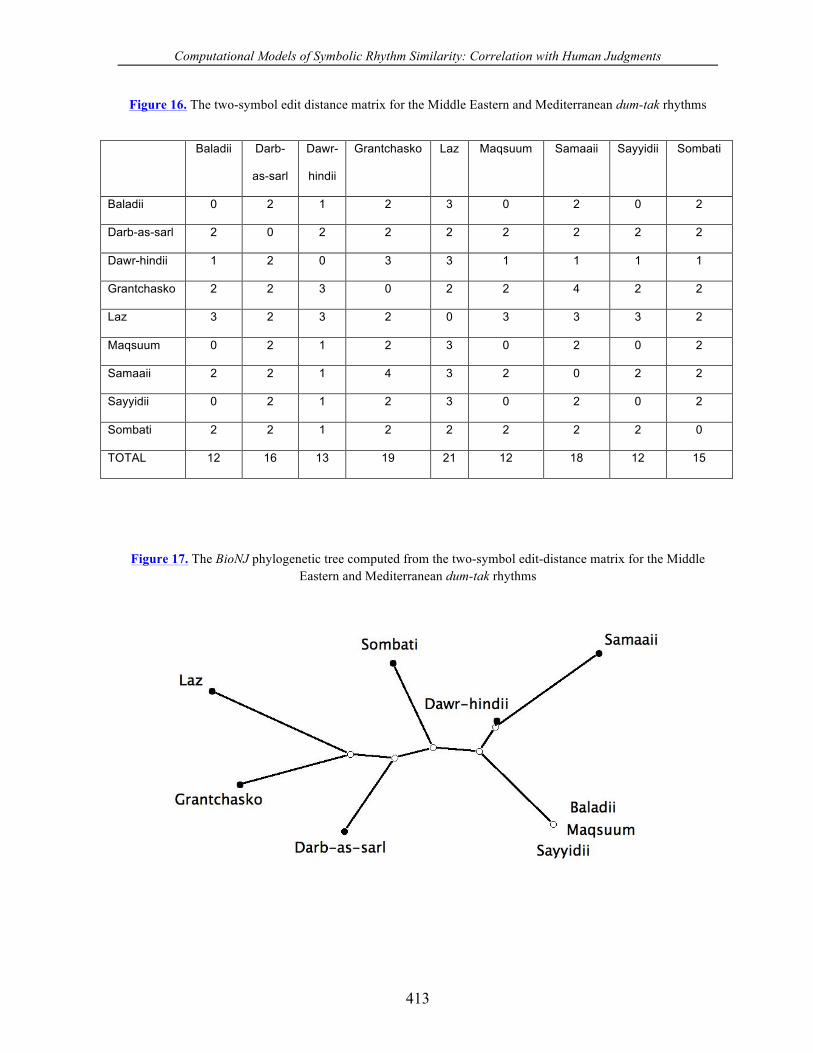
Figure 17. The BioNJ phylogenetic tree computed from the two-symbol edit-distance matrix for the Middle Eastern and Mediterranean dum-tak rhythms
Analytical Approaches To World Music Vol. 1, No. 2 (2011)
414
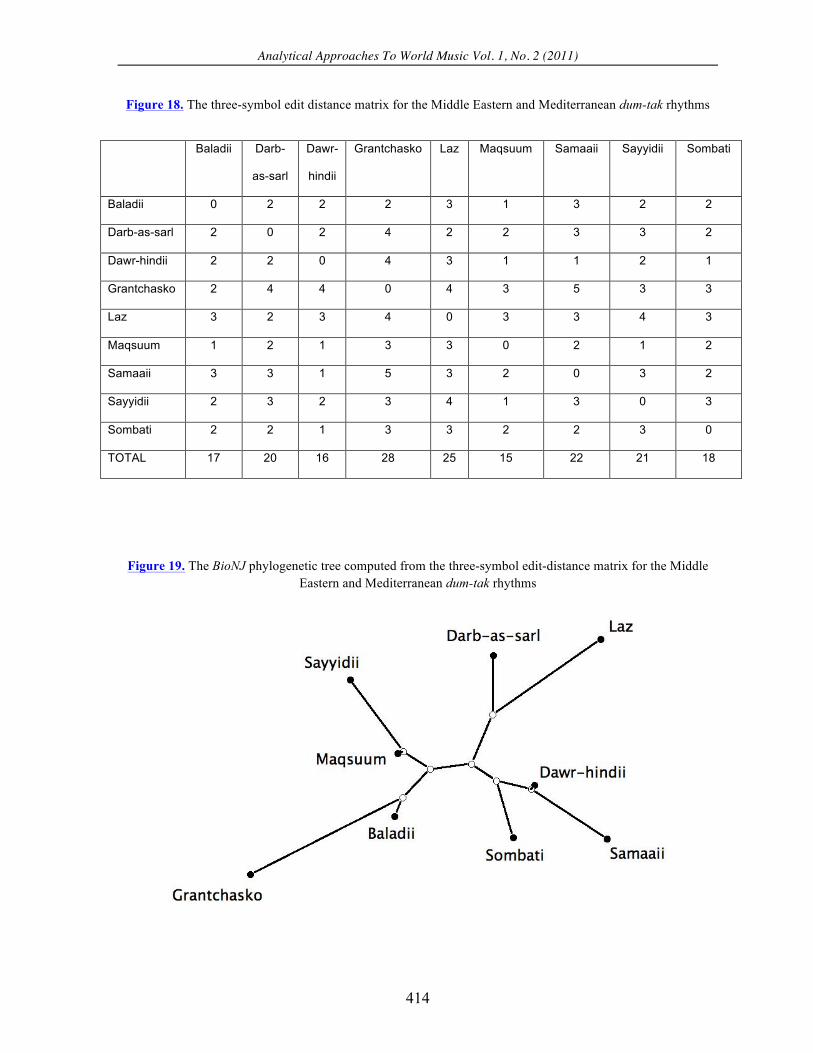
Figure 18. The three-symbol edit distance matrix for the Middle Eastern and Mediterranean dum-tak rhythms
Baladii Darb-
as-sarl
Dawr-
hindii
Grantchasko Laz Maqsuum Samaaii Sayyidii Sombati
Baladii 0 2 2 2 3 1 3 2 2
Darb-as-sarl 2 0 2 4 2 2 3 3 2
Dawr-hindii 2 2 0 4 3 1 1 2 1
Grantchasko 2 4 4 0 4 3 5 3 3
Laz 3 2 3 4 0 3 3 4 3
Maqsuum 1 2 1 3 3 0 2 1 2
Samaaii 3 3 1 5 3 2 0 3 2
Sayyidii 2 3 2 3 4 1 3 0 3
Sombati 2 2 1 3 3 2 2 3 0
TOTAL 17 20 16 28 25 15 22 21 18
Figure 19. The BioNJ phylogenetic tree computed from the three-symbol edit-distance matrix for the Middle Eastern and Mediterranean dum-tak rhythms
Computational Models of Symbolic Rhythm Similarity: Correlation with Human Judgments
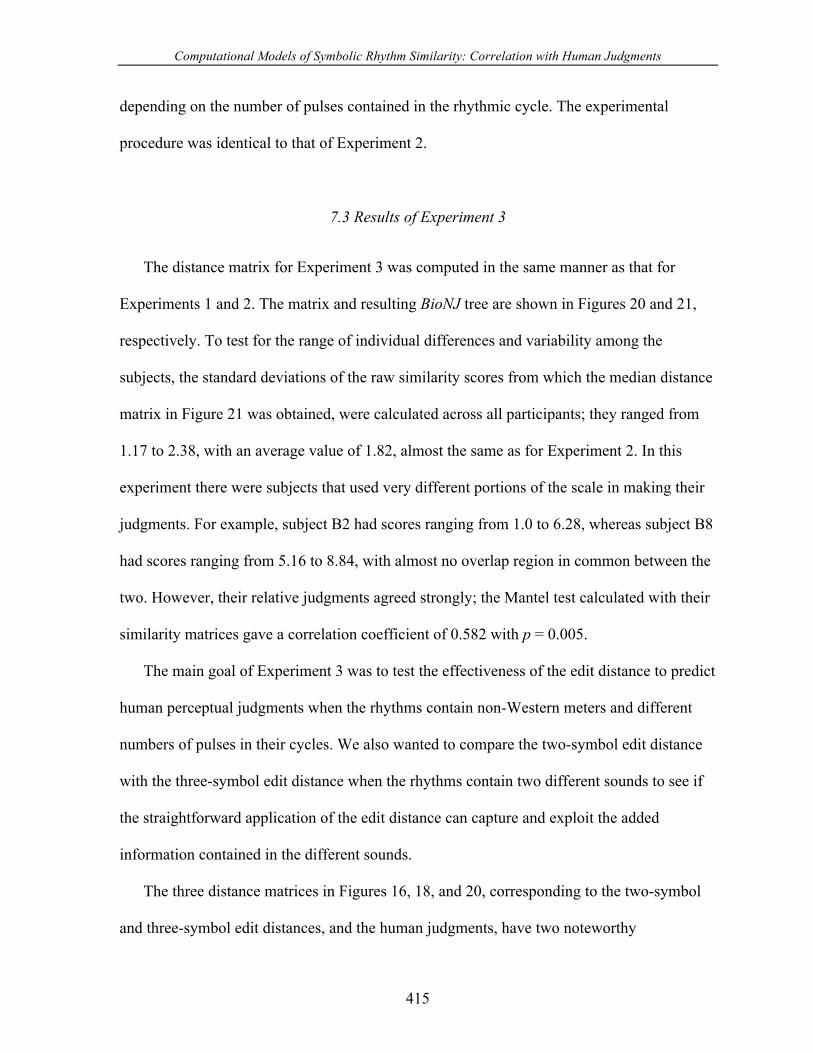
415
depending on the number of pulses contained in the rhythmic cycle. The experimental
procedure was identical to that of Experiment 2.
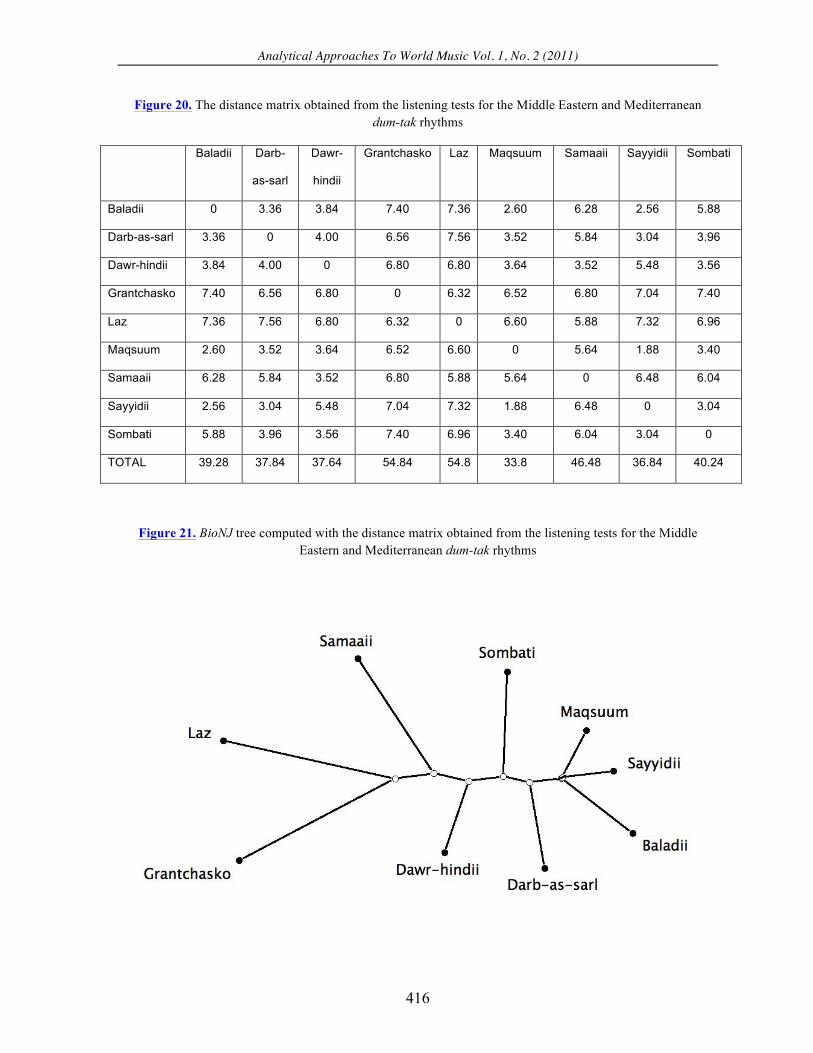
7.3 Results of Experiment 3
The distance matrix for Experiment 3 was computed in the same manner as that for
Experiments 1 and 2. The matrix and resulting BioNJ tree are shown in Figures 20 and 21,
respectively. To test for the range of individual differences and variability among the
subjects, the standard deviations of the raw similarity scores from which the median distance
matrix in Figure 21 was obtained, were calculated across all participants; they ranged from
1.17 to 2.38, with an average value of 1.82, almost the same as for Experiment 2. In this
experiment there were subjects that used very different portions of the scale in making their
judgments. For example, subject B2 had scores ranging from 1.0 to 6.28, whereas subject B8
had scores ranging from 5.16 to 8.84, with almost no overlap region in common between the
two. However, their relative judgments agreed strongly; the Mantel test calculated with their
similarity matrices gave a correlation coefficient of 0.582 with p = 0.005.
The main goal of Experiment 3 was to test the effectiveness of the edit distance to predict
human perceptual judgments when the rhythms contain non-Western meters and different
numbers of pulses in their cycles. We also wanted to compare the two-symbol edit distance
with the three-symbol edit distance when the rhythms contain two different sounds to see if
the straightforward application of the edit distance can capture and exploit the added
information contained in the different sounds.
The three distance matrices in Figures 16, 18, and 20, corresponding to the two-symbol
and three-symbol edit distances, and the human judgments, have two noteworthy
Analytical Approaches To World Music Vol. 1, No. 2 (2011)
416
Figure 20. The distance matrix obtained from the listening tests for the Middle Eastern and Mediterranean dum-tak rhythms
Baladii Darb-
as-sarl
Dawr-
hindii
Grantchasko Laz Maqsuum Samaaii Sayyidii Sombati
Baladii 0 3.36 3.84 7.40 7.36 2.60 6.28 2.56 5.88
Darb-as-sarl 3.36 0 4.00 6.56 7.56 3.52 5.84 3.04 3.96
Dawr-hindii 3.84 4.00 0 6.80 6.80 3.64 3.52 5.48 3.56
Grantchasko 7.40 6.56 6.80 0 6.32 6.52 6.80 7.04 7.40
Laz 7.36 7.56 6.80 6.32 0 6.60 5.88 7.32 6.96
Maqsuum 2.60 3.52 3.64 6.52 6.60 0 5.64 1.88 3.40
Samaaii 6.28 5.84 3.52 6.80 5.88 5.64 0 6.48 6.04
Sayyidii 2.56 3.04 5.48 7.04 7.32 1.88 6.48 0 3.04
Sombati 5.88 3.96 3.56 7.40 6.96 3.40 6.04 3.04 0
TOTAL 39.28 37.84 37.64 54.84 54.8 33.8 46.48 36.84 40.24
Figure 21. BioNJ tree computed with the distance matrix obtained from the listening tests for the Middle Eastern and Mediterranean dum-tak rhythms
Computational Models of Symbolic Rhythm Similarity: Correlation with Human Judgments
417
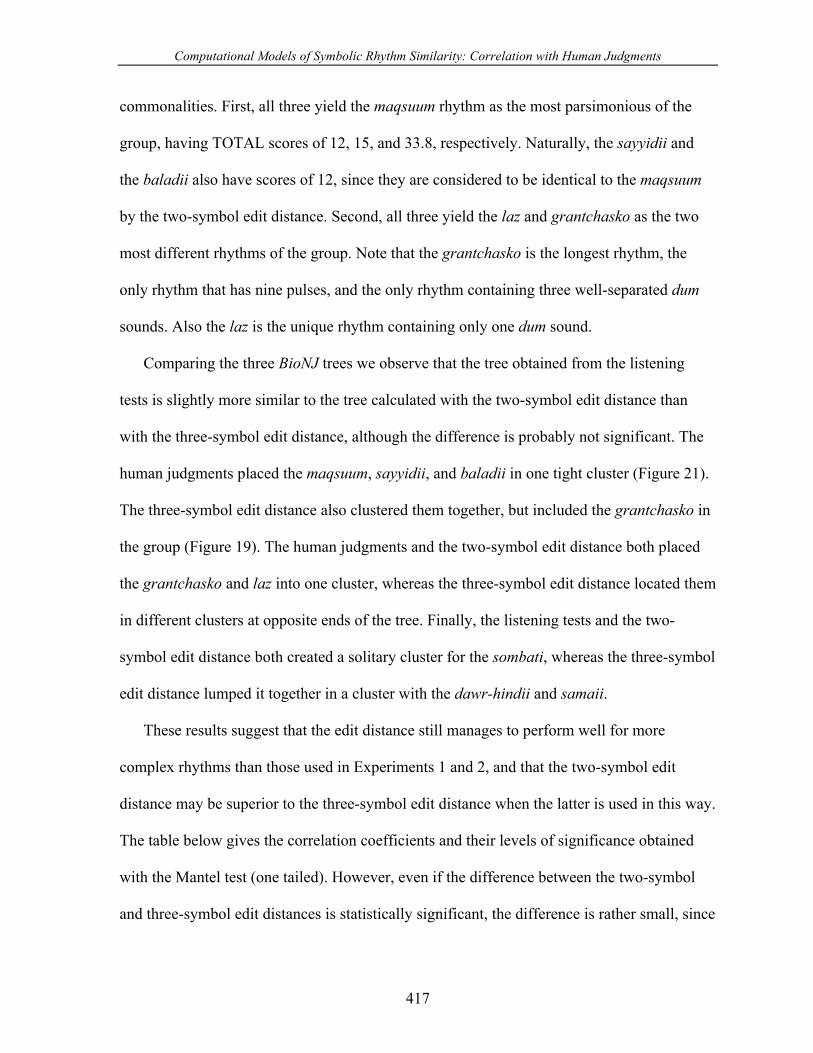
commonalities. First, all three yield the maqsuum rhythm as the most parsimonious of the
group, having TOTAL scores of 12, 15, and 33.8, respectively. Naturally, the sayyidii and
the baladii also have scores of 12, since they are considered to be identical to the maqsuum
by the two-symbol edit distance. Second, all three yield the laz and grantchasko as the two
most different rhythms of the group. Note that the grantchasko is the longest rhythm, the
only rhythm that has nine pulses, and the only rhythm containing three well-separated dum
sounds. Also the laz is the unique rhythm containing only one dum sound.
Comparing the three BioNJ trees we observe that the tree obtained from the listening
tests is slightly more similar to the tree calculated with the two-symbol edit distance than
with the three-symbol edit distance, although the difference is probably not significant. The
human judgments placed the maqsuum, sayyidii, and baladii in one tight cluster (Figure 21).
The three-symbol edit distance also clustered them together, but included the grantchasko in
the group (Figure 19). The human judgments and the two-symbol edit distance both placed
the grantchasko and laz into one cluster, whereas the three-symbol edit distance located them
in different clusters at opposite ends of the tree. Finally, the listening tests and the two-
symbol edit distance both created a solitary cluster for the sombati, whereas the three-symbol
edit distance lumped it together in a cluster with the dawr-hindii and samaii.
These results suggest that the edit distance still manages to perform well for more
complex rhythms than those used in Experiments 1 and 2, and that the two-symbol edit
distance may be superior to the three-symbol edit distance when the latter is used in this way.
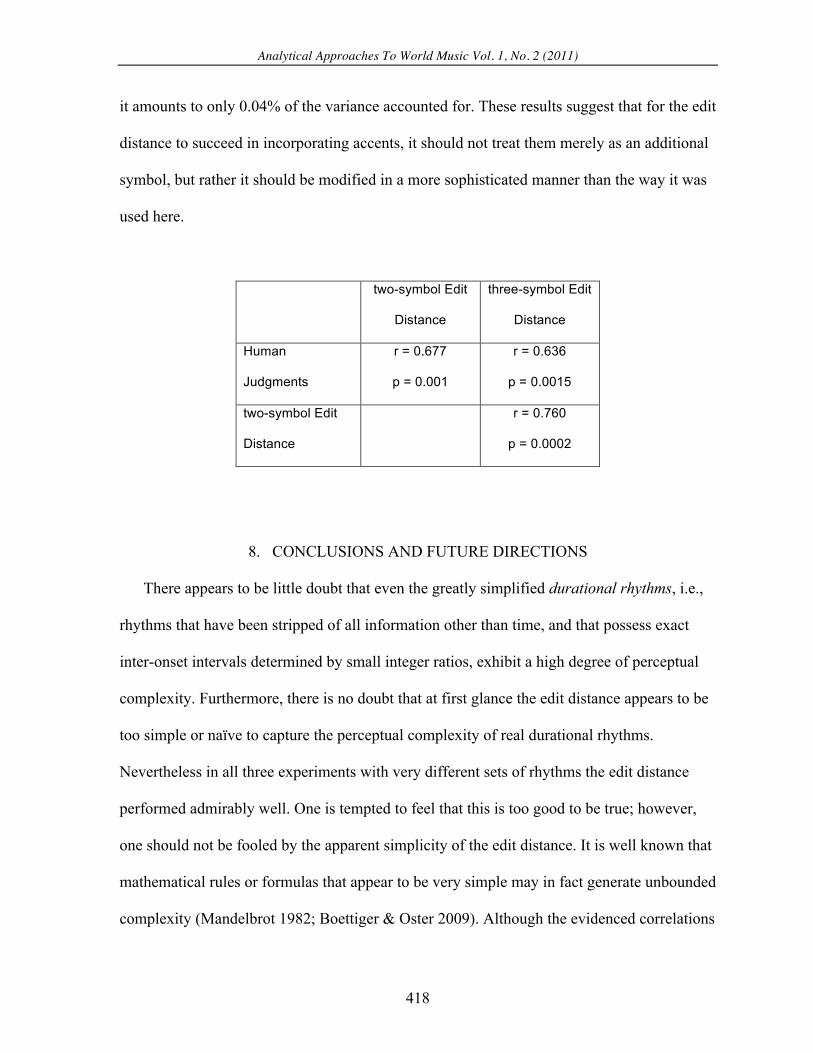
The table below gives the correlation coefficients and their levels of significance obtained
with the Mantel test (one tailed). However, even if the difference between the two-symbol
and three-symbol edit distances is statistically significant, the difference is rather small, since
Analytical Approaches To World Music Vol. 1, No. 2 (2011)
418
it amounts to only 0.04% of the variance accounted for. These results suggest that for the edit
distance to succeed in incorporating accents, it should not treat them merely as an additional
symbol, but rather it should be modified in a more sophisticated manner than the way it was
used here.
two-symbol Edit
Distance
three-symbol Edit
Distance
Human
Judgments
r = 0.677
p = 0.001
r = 0.636
p = 0.0015
two-symbol Edit
Distance
r = 0.760
p = 0.0002
8. CONCLUSIONS AND FUTURE DIRECTIONS
There appears to be little doubt that even the greatly simplified durational rhythms, i.e.,
rhythms that have been stripped of all information other than time, and that possess exact
inter-onset intervals determined by small integer ratios, exhibit a high degree of perceptual
complexity. Furthermore, there is no doubt that at first glance the edit distance appears to be
too simple or naïve to capture the perceptual complexity of real durational rhythms.
Nevertheless in all three experiments with very different sets of rhythms the edit distance
performed admirably well. One is tempted to feel that this is too good to be true; however,
one should not be fooled by the apparent simplicity of the edit distance. It is well known that
mathematical rules or formulas that appear to be very simple may in fact generate unbounded
complexity (Mandelbrot 1982; Boettiger & Oster 2009). Although the evidenced correlations
Computational Models of Symbolic Rhythm Similarity: Correlation with Human Judgments
419
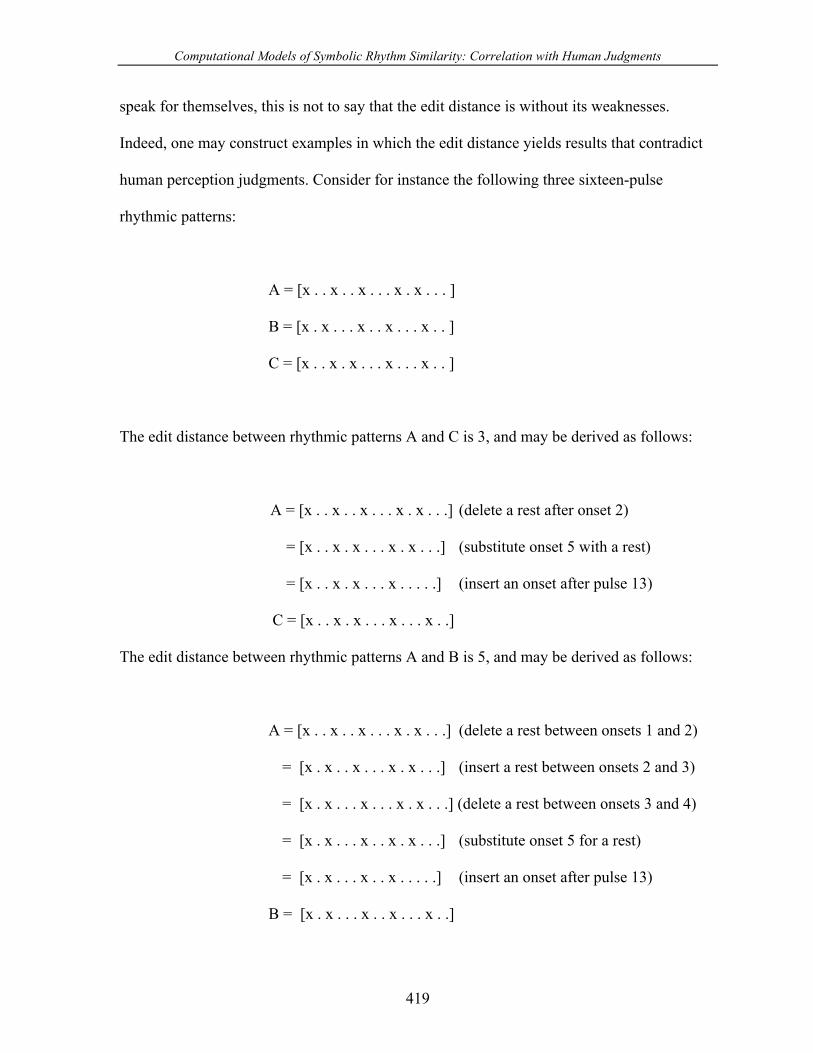
speak for themselves, this is not to say that the edit distance is without its weaknesses.
Indeed, one may construct examples in which the edit distance yields results that contradict
human perception judgments. Consider for instance the following three sixteen-pulse
rhythmic patterns:
A = [x . . x . . x . . . x . x . . . ]
B = [x . x . . . x . . x . . . x . . ]
C = [x . . x . x . . . x . . . x . . ]
The edit distance between rhythmic patterns A and C is 3, and may be derived as follows:
A = [x . . x . . x . . . x . x . . .] (delete a rest after onset 2)
= [x . . x . x . . . x . x . . .] (substitute onset 5 with a rest)
= [x . . x . x . . . x . . . . .] (insert an onset after pulse 13)
C = [x . . x . x . . . x . . . x . .]
The edit distance between rhythmic patterns A and B is 5, and may be derived as follows:
A = [x . . x . . x . . . x . x . . .] (delete a rest between onsets 1 and 2)
= [x . x . . x . . . x . x . . .] (insert a rest between onsets 2 and 3)
= [x . x . . . x . . . x . x . . .] (delete a rest between onsets 3 and 4)
= [x . x . . . x . . x . x . . .] (substitute onset 5 for a rest)
= [x . x . . . x . . x . . . . .] (insert an onset after pulse 13)
B = [x . x . . . x . . x . . . x . .]
Analytical Approaches To World Music Vol. 1, No. 2 (2011)
420
In other words, rhythm A (the clave son), is dictated by the edit distance to be more similar
to rhythm C than to rhythm B. Contrary to this however, most listeners consider rhythm A to
be more similar to rhythm B than to rhythm C.
Turning to the results from the experiments reported here, although the edit distance and
human judgments yield the same global clustering of the six Afro-Cuban rhythms, evidenced
in Figures 5 and 7, the edit distance fails to reflect more refined local variations evident in
the tree obtained from the human judgments. Within the three-group cluster comprising the
bossa-nova, gahu, and soukous, the human judgments yield a sub-cluster consisting of the
bossa-nova and gahu (see Figure 7), which the edit distance fails to capture. Also the human
subjects judged the shiko to be more distant from the son than the rumba, but according to
the edit distance they are equally distant. Along the same lines, in Experiment 2 the human
judgments placed the 2-3-3 rhythm in a cluster with the tresillo (Figure 14), but the edit
distance created a solitary cluster for it (Figure 11).
It is conceivable that the good correlations obtained in Experiments 1 and 2 are due to the
fact that a rather constrained set of rhythms sharing a similar metric environment has been
used. In Experiment 1, all the rhythms have sixteen pulses and five onsets, and in
Experiment 2, eight-pulse long patterns are used where the two groups have significantly
different numbers of onsets (2–4 onsets in the first group and 5–6 onsets in the second
group). Therefore, concerning Rey’s categorization, a trivial rule that merely counts the
number of onsets can separate these two classes, and the edit distance may implicitly be
doing just that. Of course, we used these rhythms precisely because they form part of Rey’s
ethnographic study. Moreover, the number of onsets in a pattern may be a perfectly valid
feature that determines rhythm similarity, although it tends to measure superficial rather than
Computational Models of Symbolic Rhythm Similarity: Correlation with Human Judgments
421
deep structure. However, we may ask if good correlations to human judgments would still be
obtained if more varied rhythms (including random patterns) were included in the
experiment. This issue will be addressed in a future study.
Experiment 3 suggests that the two-symbol edit distance may be a slightly better model
of perception (r = 0.677, p = 0.001) than the three-symbol edit distance (r = 0.636, p =
0.0015). This does not imply however, that using the additional information provided by
differentiating the two sounds necessarily degrades performance, or is even useless for the
task. Besides the fact that the difference may not be significant, it may merely indicate that
this way of coding this information (by means of two distinct symbols in the edit distance
computations) may not be the best approach. Hopefully the results presented here will clarify
the strengths and weaknesses of the edit distance, and motivate its modification so that it is
impervious to counterexamples, and provides an even better match with human judgments.
One possible solution might be to assign suitable weights to the various operations of the edit
distance that depend on perceptual temporal universals. However, such research is left for
the future.
The results obtained here also suggest a new approach to the investigation of cultural
prototypes. While discourse on the topic of prototypicality is preliminary at this stage, the
following discussion stimulated by the present research, is offered as a starting point for
future research in this direction.
There exist various parameters for prototypicality, such as commonality or anteriority.
For instance, a dog may be a prototypical member of the category ‘mammal’ because it is
encountered more often in urban environments, rather than being necessarily the most highly
representative instance of a mammal. Inuits in the North Pole may have a very different
Analytical Approaches To World Music Vol. 1, No. 2 (2011)
422
mammal prototype. Analogously, a specific musical pattern may be the prototype of a
motivic/thematic category simply because it appears at the beginning of a musical work. The
term prototype is used here in a limited way to refer to a good exemplar or a highly
representative instance of a category (Rosch 1975; MacLaury 1991). Trehub and Unyk
(1991) emphasize cross-cultural and developmental strategies for identifying natural music
prototypes, by which they mean those that have a biological core rather than one derived
from experience. They suggest that in those instances where categories can be defined, such
as Rey's categorization of Afro-Cuban rhythms, and the Middle Eastern and Mediterranean
rhythms analyzed above, the best prototypes should be those that are maximally similar to
the other members in the category. They also suggest that if the prototypes have a biological
significance, they should bring into evidence cross-cultural, as well as developmental,
similarities in their perception. Accordingly research to determine candidates for prototypes
has in the past focused on searching for patterns that exist across different cultures and
developmental stages. In particular Trehub and Unyk (1991) review the literature on the
identification of good melodies in general, and prototypical lullabies in particular. The
approach to the study of rhythmic prototypes presented here offers a novel quantitative
method to obtain one type of natural prototypes, namely those that are maximally similar to
all other rhythms in a category, in the sense that they minimize the sum of the edit distances
to all the other rhythms in the category.
For the category of the six distinguished timelines consisting of five onsets and sixteen
pulses, all three distance matrices for the swap distance, edit distance, and listening
experiments given in Figures 2, 4, and 6, respectively, single out the clave son as the best
prototype. For the category consisting of Mario Rey's Afro-Cuban rhythms, the listening
Computational Models of Symbolic Rhythm Similarity: Correlation with Human Judgments
423
experiments isolate the tresillo [x . . x . . x . ] as the best prototype (Figure 13), but the edit
distance (Figure 11) also yields the habanera [x . . x x . x . ] and cinquillo [x . x x . x x . ] as
candidates tied with the tresillo for the position of best prototype.
For the category of Middle-Eastern and Mediterranean dum-tak rhythms the listening
experiments and the three-symbol edit distance both select the maqsuum as the best
prototype. However, the two-symbol edit distance naturally includes the baladii and the
sayyidii as equal contenders, since all three rhythms have the same rhythmic pattern [x x . x
x . x . ]. In the three instances the prototype rhythms obtained by minimizing the sum of the
edit distances, confirm existing musicological evidence of their distinguished status. The
clave son has a noteworthy eight-hundred-year history of universal appeal (Toussaint 2010).
The tresillo, and cinquillo, the ancient Greek dochmiac and hypodochmius patterns,
respectively (Abdy Williams 2009; West 2005, 144) are rhythms found in traditional music
in many parts of the world (Toussaint 2005). The maqsuum pattern is known throughout the
Middle East (Hagoel 2003). Note that the duration pattern of the maqsuum rhythm is a
rotation of the cinquillo, and thus both belong to the same rhythm necklace. The fact that the
edit distance generates this pattern as the best prototype in two distinct musical cultures
(genres, categories) such as Afro-Cuban rhythms and Middle-Eastern and Mediterranean
rhythms provides objective and quantitative evidence to support the hypothesis that this
rhythm necklace may indeed be a universal music prototype.
As already stated in the introduction, the current study ignores the issue of meter
altogether. Hence it remains unclear how meter may influence the perceptual results and its
effect on the edit distance. We have also ignored the related topic of syncopation, which
results from the interaction between the measurable rhythm and the perceived, anticipated
Analytical Approaches To World Music Vol. 1, No. 2 (2011)
424
meter (Fitch & Rosenfeld 2007; Honing 2006; Smith & Honing 2006). In a future study we
plan to evaluate the edit distance and mathematical measures of syncopation (Thul &
Toussaint 2008) as a function of both the perception of the underlying meter and the
perception of syncopation.
In the experiments reported here most of the listeners had a strong Western Classical
Musical bias, evidenced by their backgrounds. From cross-cultural studies it is known that
these listeners probably bring to these listening tests a tacit but definite bias to hear rhythms
in either 4/4 and 3/4 meters, or minor variations thereof (Stobart & Cross 2000; Stevens
2004). Nevertheless, in Experiment 3 the edit distance gave a high and significant correlation
with human perception. It is possible that listeners acculturated in Middle Eastern and
Mediterranean music idioms such as asymmetrical meters would generate different distance
matrices. In a future experiment we plan to test the edit distance using these same rhythms
but with listeners from the Middle East.
REFERENCES
Abdy Williams, C. F. 2009. The Aristoxenian Theory Of Musical Rhythm. New York: Cambridge University Press.
Agawu, K. 2006. “Structural Analysis Or Cultural Analysis? Competing Perspectives On
The ‘Standard Pattern’ Of West African Rhythm.” Journal of the American Musicological Society 59.1: 1–46.
Beauvillain, C. 1983. “Auditory Perception Of Dissonant Polyrhythms.” Perception and
Psychophysics 34.6: 585–592.
Berenzweig, A., Logan, B., Ellis, D. P. & Whitman, B. 2004. A Large-Scale Evaluation Of Acoustic And Subjective Music-Similarity Measures. Computer Music Journal 28.2: 63–76.
Computational Models of Symbolic Rhythm Similarity: Correlation with Human Judgments
425
Boettiger, A. N. & Oster, G. 2009. Emergent Complexity In Simple Neural Systems. Communicative & Integrative Biology 2.6: 1–4.
Bolton, T. L. 1894. “Rhythm.” The American Journal of Psychology 6: 145–238.
Bonnet, E., & Van de Peer, Y. 2002. “zt: A Software Tool For Simple And Partial Mantel
Tests.” Journal of Statistical Software 7.10: 1–12.
Carrizo, S. F. 2004. “Phylogenetic trees: an information visualization perspective.” Proceedings of the Second Conference on Asia-Pacific Bioinformatics 29: 315–320.
Cooper, G. & Meyer, L. B. 1960. The Rhythmic Structure Of Music. Chicago: The
University of Chicago Press.
Crawford, T., Iliopoulos, C. S., & Raman, R. 1997–98. “String-Matching Techniques For Melodic Similarity And Melodic Recognition.” Computing in Musicology 11: 73–100.
Dean, R. T., Byron, T., & Bailes, F. A. 2009–2010. “The Pulse Of Symmetry: On The
Possible Co-Evolution Of Rhythm In Music And Dance.” Musicæ Scientiæ Special Issue on Music and Evolution: 341–367.
Demorest, S. M. & Serlin, R. C. 1997. “The Integration Of Pitch And Rhythm In Musical
Judgment: Testing Age-Related Trends In Novice Listeners.” Journal of Research in Music Education 45.1: 67–79.
Desain, P., Jansen, C., and Honing, H. 2000. “How Identification Of Rhythmic Categories
Depends On Tempo And Meter.” In Proceedings of the Sixth International Conference on Music Perception and Cognition. Keele, UK: Keele University Department of Psychology.
Diaconis P., & Graham, R. L. 1977. “Spearman’s Footrule As A Measure Of Disarray.”
Journal of the Royal Statistical Society B-39.2: 262–268.
Dietz, E. J. 1983. “Permutation Tests For Association Between Two Distance Matrices.” Systematic Zoology 32.1: 21–26.
Dixon, S. 2001. “Automatic Extraction Of Tempo And Beat From Expressive
Performances.” Journal of New Music Research 30.1: 39–58.
Analytical Approaches To World Music Vol. 1, No. 2 (2011)
426
Essens, P. 1995. “Structuring Temporal Sequences: Comparison Of Models And Factors Of Complexity”. Perception and Psychophysics 57.4: 519–532.
Ferraro, P., & Hanna, P. 2007. “Optimizations Of Local Edition For Evaluating Similarity
Between Monophonic Musical Sequences.” Proceedings of the 8th International Conference on Information Retrieval. Pittsburgh PA, U.S.A.
Fitch, W. T., & Rosenfeld, A. J. 2007. “Perception And Production Of Syncopated
Rhythms.” Music Perception 25: 43–58.
Francis, A. L. & Ciocca, V. 2003. “Stimulus Presentation Order And The Perception Of Lexical Tones In Cantonese.” Journal of the Acoustical Society of America 114.3: 1611–1621.
Gascuel, O. 1997. “BIONJ: An Improved Version Of The NJ Algorithm Based On A Simple
Model Of Sequence Data.” Molecular Biology and Evolution 14.7: 685–695.
Guastavino, C., Gómez, F., Toussaint, G. T., Marandola, F., & Gómez, E. 2009. “Measuring Similarity Between Flamenco Rhythmic Patterns.” Journal of New Music Research 38.2: 129–138.
Hage, P., Harary, F., & Krackhardt, D. 1998. “A Test Of Communication And Cultural
Similarity In Polyhesian Prehistory.” Current Anthropology 39.5: 699–703.
Hagoel, K. 2003. The Art Of Middle Eastern Rhythm. Kfar Sava, Israel: OR-TAV Music Publications.
Honing, H. 2006. “Computational Modeling Of Music Cognition: A Case Study On Model
Selection.” Music Perception 23.5: 365–76.
Huson, D. H., & Bryant, D. 2006. “Application Of Phylogenetic Networks In Evolutionary Studies.” Molecular Biology and Evolution 23.2: 254–267.
Huson, D. H. 1998. “Splitstree: A Program For Analyzing And Visualizing Evolutionary
Data.” Bioinformatics 14.10: 68–73.
Jan, S. 2007. The Memetics Of Music: A Neo-Darwinian View Of Musical Structure And Culture. Aldershot, England: Ashgate Publishing.
Computational Models of Symbolic Rhythm Similarity: Correlation with Human Judgments
427
Johnson-Laird, P. N. 1991. “Rhythm And Meter: A Theory At The Computational Level.” Psychomusicology 10.2: 88–106.
Kendall, M. 1970. Rank correlation methods. London: Griffin. Kubik, G. 1999. Africa and the blues. Jackson: University Press of Mississippi.
Ladinig, O., Honing, H., Háden, G., & Winkler, I. 2009. “Probing Attentive And Pre-Attentive Emergent Meter In Adult Listeners With No Extensive Music Training.” Music Perception 26.4: 377–386.
Lemström, K., & Pienimäki, A. 2007. “On Comparing Edit Distance And Geometric
Frameworks In Content-Based Retrieval Of Symbolically Encoded Polyphonic Music.” Musicæ Scientiæ Discussion Forum 4A: 135–151.
Lipo, C. P., O’Brien, M. J., Collard, M., & Shennan, S. J., Eds. 2006. Mapping Our
Ancestors: Phylogenetic Approaches In Anthropology And Prehistory. New Brunswick: Transaction Publishers.
London, J. 2004. Hearing In Time. New York: Oxford University Press.
Longuet-Higgins, H. C. & Lee, C. S. 1984. “The Rhythmic Interpretation Of Monophonic Music.” Music Perception 1.4: 424–41.
________. 1982. “The Perception Of Musical Rhythms.” Perception 11: 115–128.
Mace, R., Holden, C. J., & Shennan, S., Eds. 2005. The Evolution Of Cultural Diversity: A
Phylogenetics Approach. London: UCL Press. MacLaury, R. E. 1991. “Prototypes Revisited.” Annual Review of Anthropology 20: 55–74. Mandelbrot, B. B. 1982. The Fractal Geometry Of Nature. W.H. Freeman and Company.
Mantel, N. 1967. “The Detection Of Disease Clustering And A Generalized Regression Approach.” Cancer Research 27: 209–220.
Mavromatis, P., & Williamson, V. 1999a. “Toward A Perceptual Model For Categorizing
Atonal Sonorities.” The Annual Conference of the Society for Music Theory, Atlanta, Georgia.
Analytical Approaches To World Music Vol. 1, No. 2 (2011)
428
________. 1999b. “Categorizing Atonal Sonorities: Multidimensional Scaling, Tree-Fitting And Clustering Compared.” The Annual Conference of the Society for Music Perception and Cognition, Evanston, Illinois.
Mongeau, M., & Sankoff, D. 1990. “Comparison Of Musical Sequences.” Computers and
the Humanities 24: 161–175.
Orpen, K. S., & Huron, D. 1992. “Measurement Of Similarity In Music: A Quantitative Approach For Non-Parametric Representations.” Computers in Music Research 4: 1–44.
Palmer, C. & Krumhansl, C. L. 1990. “Mental Representations For Musical Meter.” Journal
of Experimental Psychology - Human Perception and Performance 16:4: 728–41.
Pitt, M. A. & Monahan, C. B. 1987. “The Perceived Similarity Of Auditory Polyrhythms.” Perception and Psychophysics 41.6: 534–546.
Quinn, I. 2001. “Listening To Similarity Relations.” Perspectives of New Music 39.2: 108–
158.
Rey, M. 2006. “The Rhythmic Component Of Afrocubanismo In The Art Music Of Cuba.” Black Music Research Journal 26.2: 181–212.
Rosch, E. 1975. “Universals And Cultural Specifics In Human Categorization.” In Cross-
Cultural Perspectives on Learning, edited by R. Breslin, S. Bochner, & W. Lonner. New York: Halsted Press.
Saitou, N., & Nei, M. 1987. “The Neighbor-Joining Method: A New Method For
Reconstructing Phylogenetic Trees.” Molecular Biology and Evolution 4: 406–425.
Scavone, G. P., Lakatos, S., & Harbke, C. R. 2002. “The Sonic Mapper: An Interactive Program For Obtaining Similarity Ratings With Auditory Stimuli.” Proceedings of the International Conference on Auditory Display. Kyoto, Japan.
Schneider, J. W. & Borlund, P. 2007a. “Matrix Comparison, Part 1: Motivation And
Important Issues For Measuring The Resemblance Between Proximity Measures Or Ordination Results.” Journal of the American Society for Information Science and Technology 58.11: 1586–1595.
Computational Models of Symbolic Rhythm Similarity: Correlation with Human Judgments
429
________. 2007b. “Matrix Comparison, Part 2: Measuring The Resemblance Between Proximity Measures Or Ordination Results By Use Of The Mantel And Procrustes Statistic.” Journal of the American Society for Information Science and Technology, 58.11: 1596–1609.
Shiloah, A. 1995. Music In The World Of Islam: A Socio-Cultural Study. Aldershot, England: Scolar Press.
Shmulevich, I. & Povel, D.-J. 2000. “Measures Of Temporal Pattern Complexity.” Journal
of New Music Research 29.1: 61–69.
Smith, L. M. & Honing, H. 2006. “Evaluating And Extending Computational Models Of Rhythmic Syncopation In Music.” In Proceedings of the International Computer Music Conference. New Orleans, LA: 688–91.
Stevens, C. 2004. “Cross-Cultural Studies Of Musical Pitch And Time.” Acoustical Science & Technology 25.6: 433–438.
Stobart H. & Cross, I. 2000. “The Andean Anacrusis? Rhythmic Structure And Perception In Easter Songs Of Northern Potosí, Bolivia.” British Journal of Ethnomusicology 9: 63–94.
Talianová, M. 2007. “Survey Of Molecular Phylogenetics.” Plant Soil Environment 53.9:
413–416.
Tanguiane, A. S. 1993. Artificial Perception And Music Recognition. Berlin: Springer-Verlag.
Thul, E. & Toussaint, G. T. 2008. “Rhythm Complexity Measures: A Comparison Of
Mathematical Models Of Human Perception And Performance.” Proc. 9th International Conference on Music Information Retrieval. Philadelphia, PA, September 14–18: 663–668.
Touma, H. H. 1996. The Music Of The Arabs. Portland: Amadeus Press.
Toussaint, G. T. 2011. “The Rhythm That Conquered The World: What Makes A “Good”
Rhythm Good.” Percussive Notes, in press.
________. 2005. “The Euclidean algorithm generates traditional musical rhythms.” In Proceedings of BRIDGES: Mathematical Connections in Art, Music, and Science. Banff, Alberta, Canada: 47–56.
Analytical Approaches To World Music Vol. 1, No. 2 (2011)
430
________. 2004. “A Comparison Of Rhythmic Similarity Measures.” In Proc. 5th International Conference on Music Information Retrieval. Barcelona, Spain: 242–245.
________. 2003. “Algorithmic, Geometric, And Combinatorial Problems In Computational
Music Theory.” Proceedings of X Encuentros de Geometria Computacional. University of Sevilla, Sevilla, Spain: 101–107.
________. 2002. “A Mathematical Analysis Of African, Brazilian, And Cuban Clave
Rhythms.” Proceedings of BRIDGES: Mathematical Connections in Art, Music and Science. Towson University, Towson, MD: 157–168.
________. 1978. “The Use Of Context In Pattern Recognition.” Pattern Recognition 10:
189–204.
Trehub, S. E., & Unyk, A. M. 1991. “Music Prototypes In Developmental Perspective.” Psychomusicology 10: 73–87.
Van Den Broek, E. M. F., & Todd, P. M. 2009–10. “Evolution Of Rhythm As An Indicator
Of Mate Quality.” Musicæ Scientiæ, Special Issue on Music and Evolution: 369–386. West, M. L. 2005. Ancient Greek Music. Oxford: Clarendon Press.
Witten, I. H, Manzara, L. C., & D. Conklin, D. 1994. “Comparing Human And Computational Models Of Music Prediction.” Computer Music Journal 18.1: 70–80.


![Measuring Musical Rhythm Similarity: Further …file.scirp.org/pdf/JCC_2016112915262128.pdf(cost) is minimizedover all such possible assignments [14]. For example, the two rhythms](https://static.fdocuments.us/doc/165x107/5b08c9ea7f8b9ac90f8d16a0/measuring-musical-rhythm-similarity-further-filescirporgpdfjcc-cost-is-minimizedover.jpg)