Computational Modeling of Microstructural … Library/Events/2012/26th Annual...Computational...
43
Computational Modeling of Microstructural Evolution in Alloys for Advanced Fossil Power Systems Youhai Wen 26 th Annual Conference on Fossil Energy Materials, April 17-19, 2012, Pittsburgh, PA
-
Upload
nguyendiep -
Category
Documents
-
view
225 -
download
0
Transcript of Computational Modeling of Microstructural … Library/Events/2012/26th Annual...Computational...

Computational Modeling of Microstructural Evolution in Alloys
for Advanced Fossil Power Systems
Youhai Wen
26th Annual Conference on Fossil Energy Materials, April 17-19, 2012, Pittsburgh, PA
2
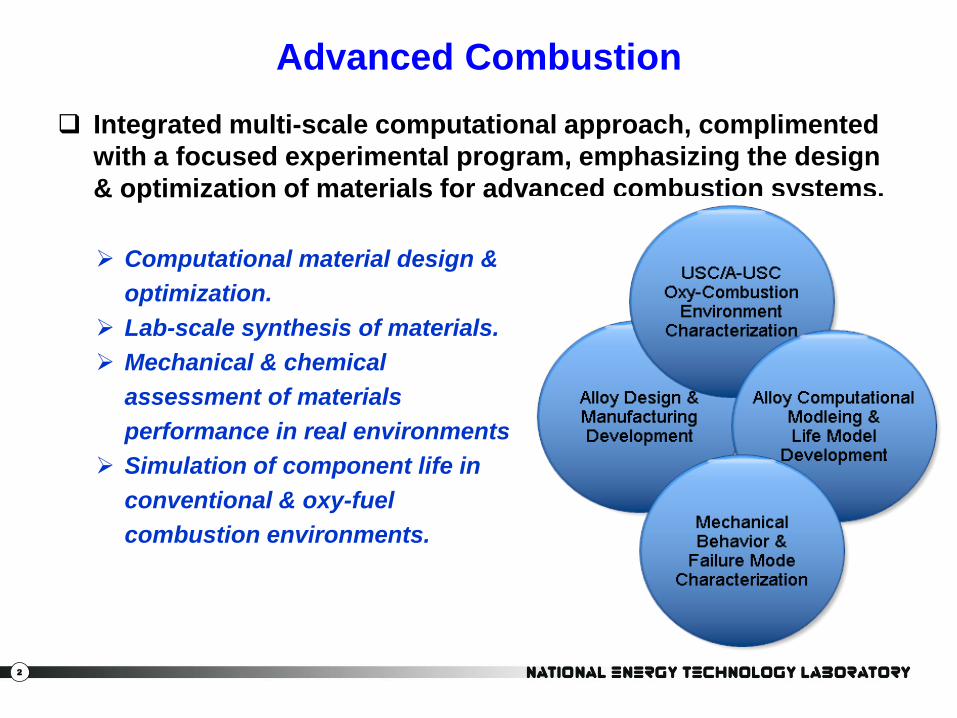
Advanced Combustion
Integrated multi-scale computational approach, complimented
with a focused experimental program, emphasizing the design
& optimization of materials for advanced combustion systems.
Computational material design &
optimization.
Lab-scale synthesis of materials.
Mechanical & chemical
assessment of materials
performance in real environments
Simulation of component life in
conventional & oxy-fuel
combustion environments.

3
New Energy Generating Technologies and High-
Temperature Structural Materials for Boilers and Turbines
500 600 700 800 900 1000 1100 1300 1400 1500 1200 Temperature (ºC)
Ferritic St.
Austenitic St.
Ni Based Superalloys
Refractory Metal Based Alloys
Advance USC
Plant Syngas Turbines
Hydrogen Turbines
Oxy-Fuel Turbines
• Lack of experience with alloy performance in these extreme conditions and
times scales necessary for advanced FE systems
• Need for reliable and fast methods for predicting materials performance.
• Integrated computational and focused experimental approach.
Advanced FE systems
– Extreme environment
(corrosive,T,P)
– Components have to
last 10,000’s to
100,000’s hours

4
Computational Materials Science
Kinetic processes at high T:
Phase transformation
Defect structure evolutions
Grain growth
Recrystallization
Precipitation
How to achieve
optimum microstructure
Can we freeze it?
Can it survive?
If so, how long?
Objectives of Microstructural Evolution Modeling
• Identify the underlying thermodynamic driving force
• Identify the underlying kinetic mechanisms
• Understand the microstructure evolution path under a given condition
• Predict life of a component based on microstructure-property relationships
Environment effect: Oxidation
5
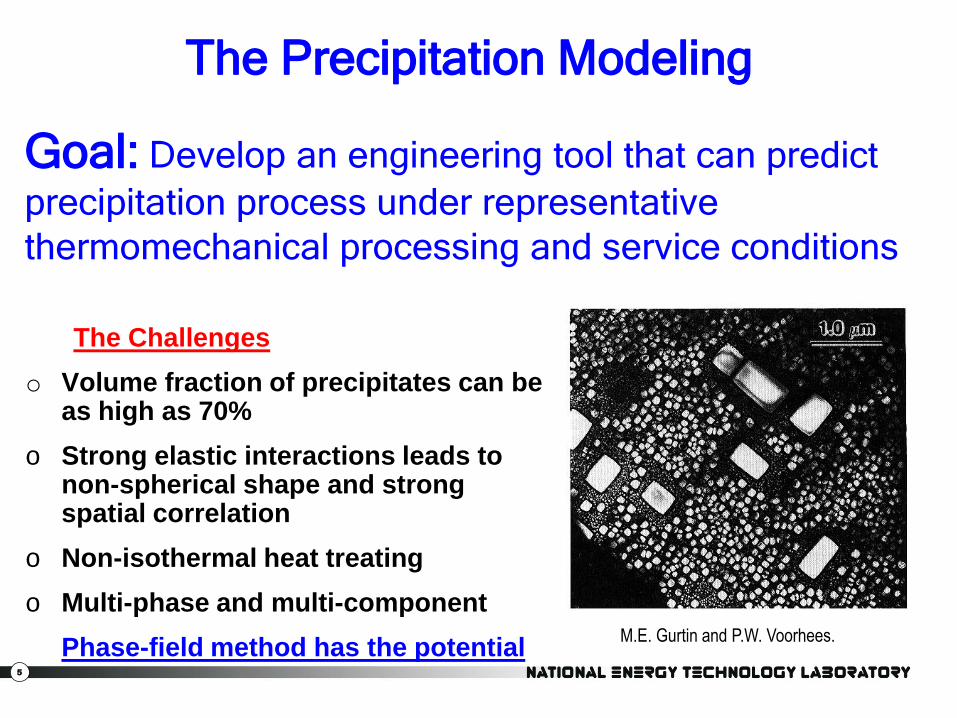
The Challenges
o Volume fraction of precipitates can be as high as 70%
o Strong elastic interactions leads to non-spherical shape and strong spatial correlation
o Non-isothermal heat treating
o Multi-phase and multi-component
Phase-field method has the potential
M.E. Gurtin and P.W. Voorhees.
Goal: Develop an engineering tool that can predict
precipitation process under representative
thermomechanical processing and service conditions
The Precipitation Modeling
6
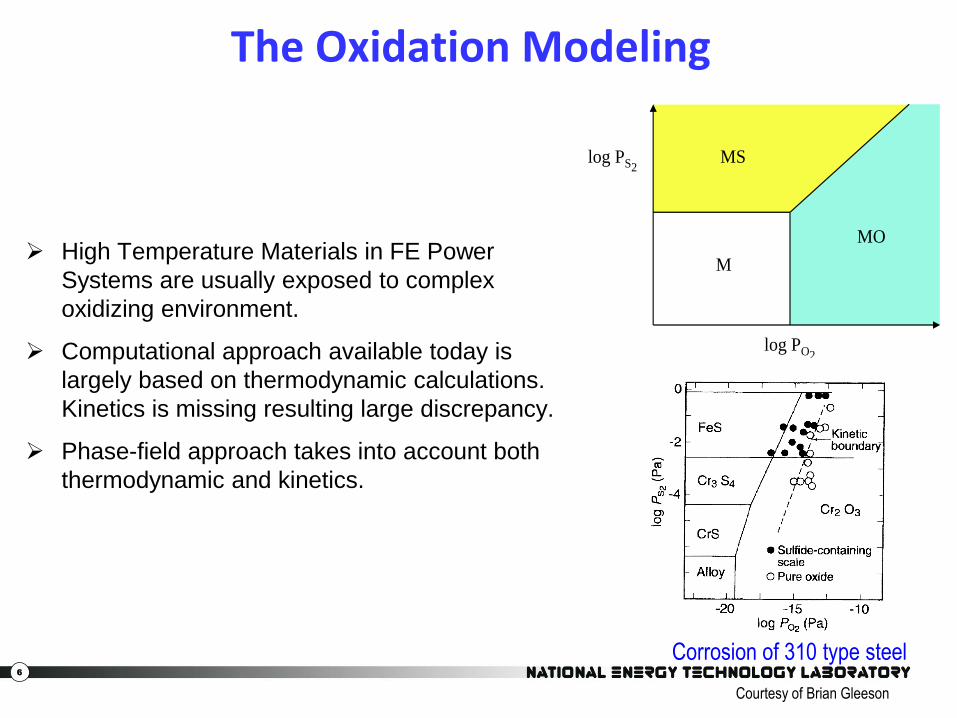
The Oxidation Modeling
High Temperature Materials in FE Power
Systems are usually exposed to complex
oxidizing environment.
Computational approach available today is
largely based on thermodynamic calculations.
Kinetics is missing resulting large discrepancy.
Phase-field approach takes into account both
thermodynamic and kinetics.
log PS2
log PO2
M
MS
MO
Courtesy of Brian Gleeson
Corrosion of 310 type steel
7
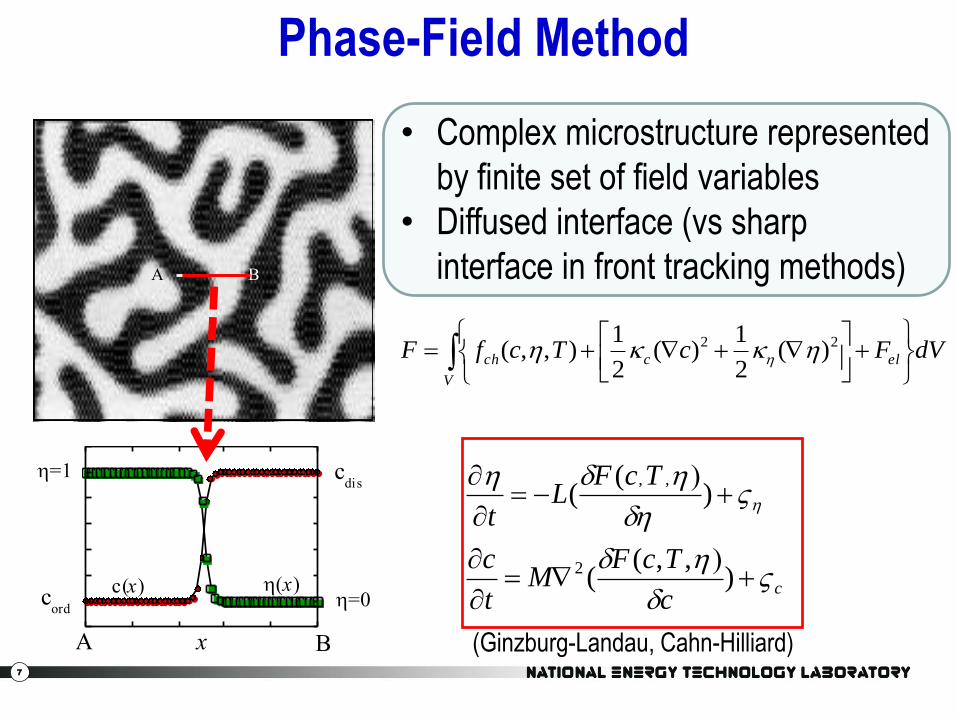
Phase-Field Method
cc
TcFM
t
c
TcFL
t
),,(
(
)(
(
2
,,
A B
A B
c(x)
x
(x)
cdis
cord
=0
=1
(Ginzburg-Landau, Cahn-Hilliard)
V
elcch dVFcTcfF 22 )(2
1)(
2
1),,(
• Complex microstructure represented
by finite set of field variables
• Diffused interface (vs sharp
interface in front tracking methods)

8
Choose field variables
Formulate the free energy
Calculate driving forces
F/c, F/i
Integrate kinetic equations to
update field variables
Define initial microstructure, e.g.
c r , t D t ( i r , t D t ( ,
c r , t 0 ( , i r , t 0 (
Find material parameters
Phase-Field Method (cont.)
Wen et al: Hexagonal-to-
orthorhombic transformation,
Phil. Mag. A, 2000
Wen’06: Effect of heterogeneous
nucleation on microstructure in
Al-Sc alloy
Wen’08, Acta mater.

9
In-House Multi-Phase-Multi-Component
Phase-Field Based Precipitation Model
• 1D, 2D, and 3D capability
• Multi-Component: 7 components in present work
• Multi-Phase? and ’ in Ni-base superalloys
• Direct link to CALPHAD Database: PanEngine
from CompuTherm
Goal: Develop a tool for long-term microstructure stability testing in precipitation strengthened alloy systems

10
DF images showing ’ size and distribution in H282 with different test conditions
Haynes 282
Advanced Combustion, Jeffrey Hawk
High temperature alloys typically use
a combination of matrix
strengthening precipitates, carbides
and high dislocation density to impart
strength.
In Ni-base superalloys for use in
steam power plants at temperatures
up to 760°C, the main strengthening
phase is gamma prime. Volume
fraction and precipitate morphology
are two important factors in alloy
strength – both influence matrix
strength and deformation behavior in
the alloy.
The character of grain boundaries
and the phases found there are also
important in generating high
temperature creep strength and
long-term microstructural stability.

11
Coarsening
Time (hr)
0 50 100 150 200
Ave
rage
Ra
diu
s (
nm
)
56
58
60
62
64
66
68
70
72
74
Haynes 282
256x256 grid points, isothermal annealing at 760oC, =90.0 mJ/m2
Normalize Size
0.2 0.4 0.6 0.8 1.0 1.2 1.4 1.6N
um
ber
Part
icle
s
0
10
20
30
40
50
t = 1hr
110 hrs
200 hrs
Al Co Cr Fe Mo Ti Ni Vol.%
wt.% 1.5 10.0 20.0 1.5 8.5 2.1 bal 18.86

12
Effect of Lattice Misfit
256x256 grid points, isothermal annealing at 760oC, =90.0 mJ/m2
t = 200hrs
Time (hr)
0 50 100 150 200
Ave
rage
Ra
diu
s (
nm
)
56
58
60
62
64
66
68
70
72
74
Without Lattice Misfit
With Lattice Misfit Haynes 282
• Negative misfit (-1.78%)
• Coarsening rate decreased
• Negligible effect on morphology
Lattice misfit good for
microstructure stability

13
Effect of Initial Configuration
Normailized Size
0.2 0.4 0.6 0.8 1.0 1.2 1.4 1.6
Nu
mb
er
of
Pa
rtic
les
0
10
20
30
40
50
Normalized Size
0.2 0.4 0.6 0.8 1.0 1.2 1.4 1.6
Nu
mb
er
of
Pa
rtic
les
0
10
20
30
40
50
Normailized Size
0.0 0.5 1.0 1.5 2.0
Nu
mb
er
of
Pa
rtic
les
0
20
40
60
80
100
120
140
160
180
Time (hr)
0 100 200 300 400
Ave
rage
Ra
diu
s (
nm
)
45
50
55
60
65
70
75
256x256 grid points, isothermal annealing at 760oC, =90.0 mJ/m2
Normailized Size
0.0 0.5 1.0 1.5 2.0
Nu
mb
er
of
Pa
rtic
les
0
20
40
60
80
100
120
140
160
180
Normalized Size
0.4 0.6 0.8 1.0 1.2 1.4 1.6
Nu
mb
er
of P
art
icle
s
0
2
4
6
8
10
12
14
Normailized Size
0.2 0.4 0.6 0.8 1.0 1.2 1.4
Nu
mb
er
of
Pa
rtic
les
0
2
4
6
8
10
12
14
16
18
20
A virtual microstructural stability testing machine!
14
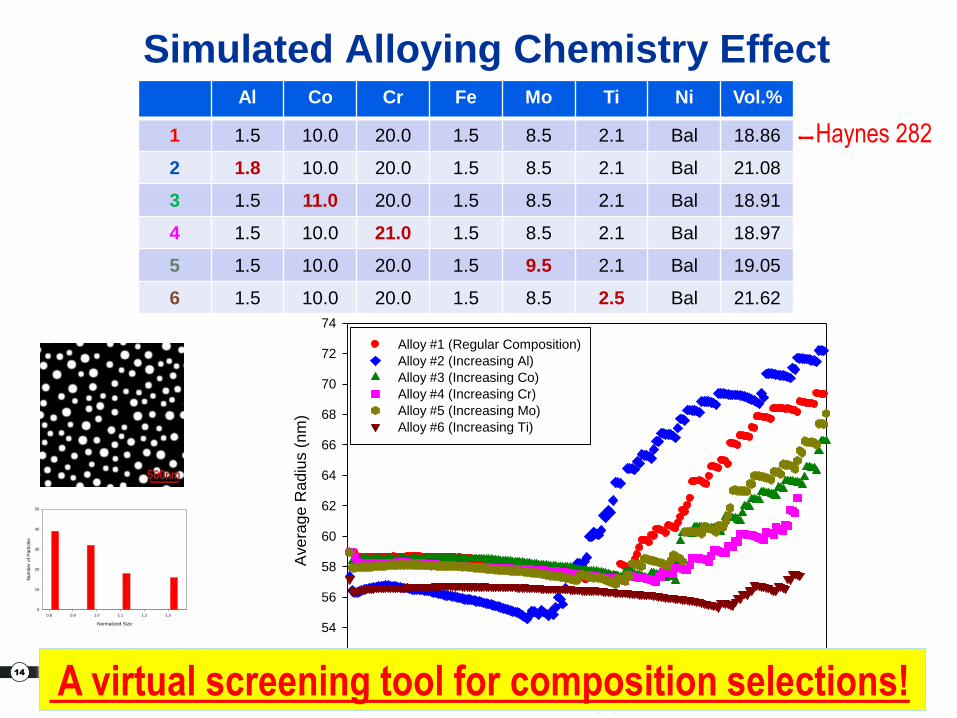
Time (hr)
0 50 100 150 200
Ave
rage
Ra
diu
s (
nm
)
52
54
56
58
60
62
64
66
68
70
72
74
Alloy #1 (Regular Composition)
Alloy #2 (Increasing Al)
Alloy #3 (Increasing Co)
Alloy #4 (Increasing Cr)
Alloy #5 (Increasing Mo)
Alloy #6 (Increasing Ti)
Simulated Alloying Chemistry Effect
Normalized Size
0.8 0.9 1.0 1.1 1.2 1.3
Num
ber
of
Part
icle
s
0
10
20
30
40
50
Al Co Cr Fe Mo Ti Ni Vol.%
1 1.5 10.0 20.0 1.5 8.5 2.1 Bal 18.86
2 1.8 10.0 20.0 1.5 8.5 2.1 Bal 21.08
3 1.5 11.0 20.0 1.5 8.5 2.1 Bal 18.91
4 1.5 10.0 21.0 1.5 8.5 2.1 Bal 18.97
5 1.5 10.0 20.0 1.5 9.5 2.1 Bal 19.05
6 1.5 10.0 20.0 1.5 8.5 2.5 Bal 21.62
Haynes 282
A virtual screening tool for composition selections!

15
Phase-Field Modeling of Oxidation
2ion of OconcentrattxX
alde and metnguish oxid to distiphase fieltx
),(
),(
M MO MO + M M PO2
Reaction Zone Pure Oxide
=1 Pure Metal
=0 0<<1
(
X
FM
t
XFL
t
dVXfF
wgXfhXfhXf
ch
moch
)( ;
)(2
),(
)()()(1)()(),(
2
22 )(2
1)(;)(
2
1)( eq
mm
eq
oo XXXfXXXf
MOOM 22
1

16
1-D Oxidation Modeling Results
0
0.2
0.4
0.6
0.8
1
1.2
0 30 60 90 120 150
Phase-field and concentration
profile as a function of time
con
cen
trat
ion p
rofi
le
position
Isothermal, Dm = DO
0
0.2
0.4
0.6
0.8
1
1.2
0 30 60 90 120 150
Phase-field and concentration
profile as a function of time
con
cen
trat
ion p
rofi
le
position
Isothermal, Dm = DO
0
1
2
3
4
5
6
7
8
0 20 40 60 80 100 120
Oxide Thickness as a Function of Time
Dm/Do=3
Dm/Do=1
Dm/Do=0.001
thic
knes
s
time
0
5
10
15
20
0 50 100 150 200 250
Oxide Thickness as a Function of Time
critical thickness = 4.0total thicknessno critical thickness
Ox
ide
Th
ick
nes
s
time
0
2
4
6
8
10
12
0 50 100 150 200 250 300
ox
ide
thic
kn
ess
time
Oxidation under linearly increased T
time
Do decreased
Dm fixed
17
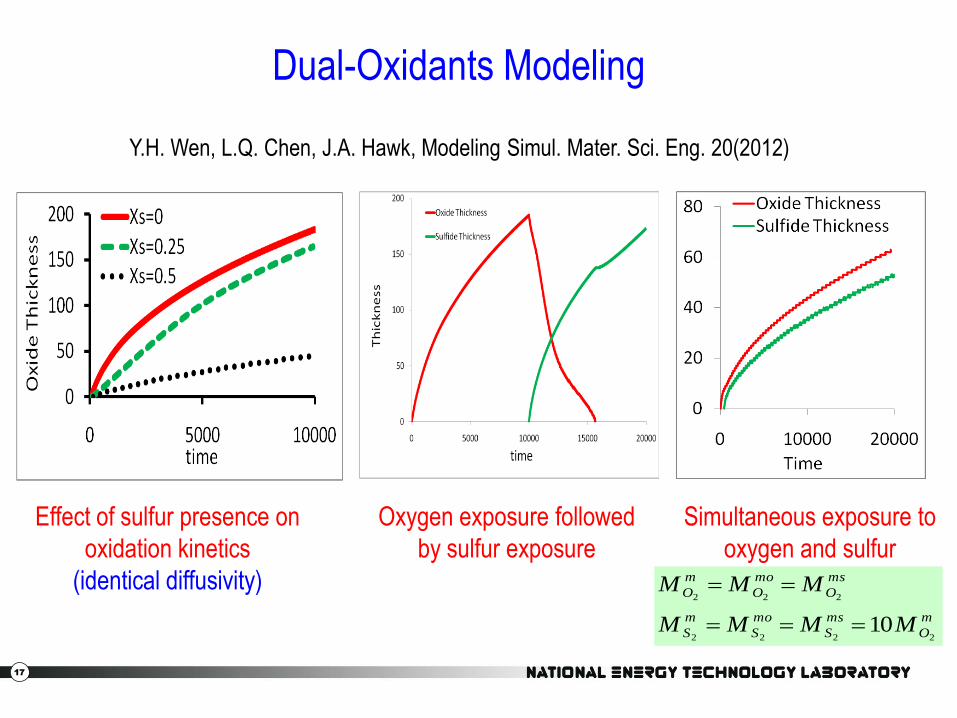
Dual-Oxidants Modeling
Effect of sulfur presence on
oxidation kinetics
(identical diffusivity)
Oxygen exposure followed
by sulfur exposure
Simultaneous exposure to
oxygen and sulfur
m
O
ms
S
mo
S
m
S
ms
O
mo
O
m
O
MMMM
MMM
2222
222
10
Y.H. Wen, L.Q. Chen, J.A. Hawk, Modeling Simul. Mater. Sci. Eng. 20(2012)
18
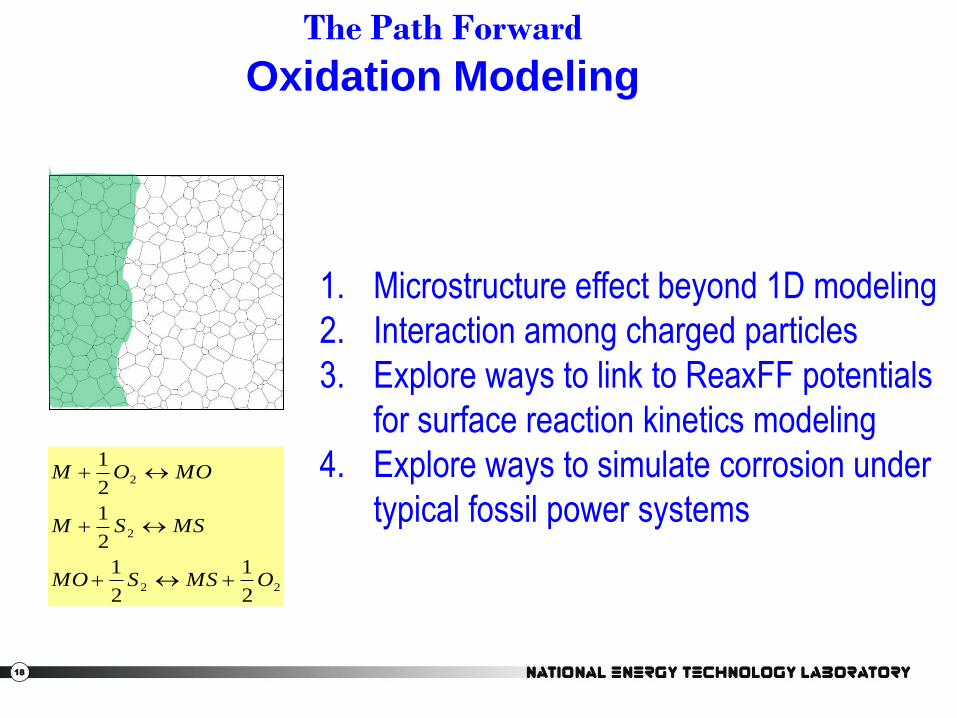
The Path Forward
Oxidation Modeling
22
2
2
2
1
2
1
2
1
2
1
OMSSMO
MSSM
MOOM
1. Microstructure effect beyond 1D modeling
2. Interaction among charged particles
3. Explore ways to link to ReaxFF potentials
for surface reaction kinetics modeling
4. Explore ways to simulate corrosion under
typical fossil power systems

19
The major phases present in precipitate-strengthened Ni-base superalloys are:
Gamma (): The continuous matrix – a face-centered cubic nickel-base austenitic phase, that
usually contains a high percentage of solid-solution elements such as Co, Cr and Mo.
Gamma Prime (’): The primary strengthening phase in nickel-base superalloys. ’ is a coherently
precipitating phase, with the composition Ni3(Al,Ti), and being quite ductile, imparts strength to the
matrix without lowering the fracture toughness of the alloy.
Carbides: Carbon, added at levels of 0.05-0.2 wt%, combines with reactive and refractory elements
to form carbides (such as TiC). These begin to decompose during heat treatment and service,
forming lower carbides such as M23C6 and M6C. The general opinion is that in superalloys with grain
boundaries, carbides are beneficial by increasing rupture strength at high temperatures.
Topologically Close-Packed Phases: These are generally undesirable, brittle phases that can form
during heat treatment or service. They tie up and ’ strengthening elements in a non-useful form,
reducing creep strength and acting as crack initiators.
Excerpted from TMS Superalloys: A Primer and History
The Path Forward
Precipitation Modeling

20
Phase-Field Modeling of Carbide Precipitations Kinetics in
Ni-base superalloy and 9Cr Steel? Courtesy of Mitsu Murayama at VirginiaTech
The Path Forward
Precipitation Modeling

21
Develop a phase-field based engineering tool to predict
location specific grain size distribution in a large
component under thermo-mechanical processing.
Potential Modeling Subjects:
• Zener pinning effects due to 2nd-phase presence
• DRX, MDRX, and recovery modeling
• Abnormal grain growth due to: a) DRX & MDRX; b)
large spread of misorientation dependent
interfacial energies and grain boundary mobilities
• Plastic deformation, etc.
The Path Forward
Grain Growth Modeling

22
Summary
• Described a Phase-Field model that can simulate precipitation kinetics in Ni-based commercial alloys. We demonstrated that this model can be used to help alloy design for a more stable precipitation microstructure.
• Presented some preliminary results for oxidation kinetics modeling in a simplified 1D case.
• Described the path forward for our modeling effort.

23
Acknowledgements
• Strategic Center for Coal, NETL for supporting this ORD activity through the IPT Program.
– Robert Romanosky (Technology Manager)
– Patricia Rawls (Project Manager)
– David Alman and Jeffrey Hawk (ORD Technical Coordinator)
• Kevin Wu
Disclaimer: "This report was prepared as an account of work sponsored by an agency of the United States Government. Neither the United States Government nor any agency thereof, nor any of their employees, makes any warranty, express or implied, or assumes any legal liability or responsibility for the accuracy, completeness, or usefulness of any information, apparatus, product, or process disclosed, or represents that its use would not infringe privately owned rights. Reference herein to any specific commercial product, process, or service by trade name,trademark, manufacturer, or otherwise does not necessarily constitute or imply its endorsement, recommendation, or favoring by the United States Government or any agency thereof. The views and opinions of authors expressed herein do not necessarily state or reflect those of the United States Government or any agency thereof."

24
Backup Slides

25
Materials for Advanced FE systems
Advanced FE systems
– Extreme environment (corrosive,T,P)
– Components have to last 10,000’s to 100,000’s hours
Lack of experience with alloy performance in these conditions

26
ORD FY 2012 R&D Portfolio--SCC In
itia
tive
R
esea
rch
Tea
ms
ORD Portfolio for SCC
Powell
Carbon Capture
Morreale/
Berry
Post-Combustion
Luebke
Sorbents
Solvents
Membranes
Oxygen Separations
Pre-Combustion
Luebke
Sorbents
Solvents
Membranes
Carbon Sequestration
Guthrie/
Martello
Multiphase Flow
Strazisar
Fundamental Processes
Strazisar
Storage Potential
Strazisar
Storage Performance
Strazisar
Geospatial Data
Strazisar
Advanced Energy Systems
Richards/ Gemmen
Adv Combustion
Hawk
Turbine Thermal Management
Alvin
Gasification
Guenther
Fuels ???
Link
Fuel Cells ???
Gerdes
Cross Cutting Research
Syamlal/Summers
Innovative Process Technologies
Alman
CCSI
Miller
NRAP
Bromhal
CCSSI-ARRA
Richards/Breault
NRAP
Bromhal
CCSI
Miller
ICMI
Straub
SBEUC-ARRA
Syamlal/Wirfel

27
NETL-RUA Advanced Combustion Task
• Task Description: – Provide the mechanical and physical property information needed to
allow rational design, development and/or choice of alloys, manufacturing approaches, and environmental exposure and component life models to enable oxy-fuel combustion boilers to operate at Ultra-Supercritical (650oC & 22-30 MPa) and/or Advanced Ultra-Supercritical conditions (760oC & 35 MPa).
• How this task contributes to the program: – Higher temperatures will allow higher efficiency oxy-fuel systems
– Identifies how to address corrosion issues from wider coal choices/impurities
• Unique or complimentary aspects: – Applies existing DOE collaborations specifically to oxy-fuel issues:
• DOE FE 1400F Boiler Consortium
• US-UK FE Collaboration
– Significant industrial collaborations already in place
– Unique contribution to FE program for oxy-fuel systems
– Results help both steam turbines* and oxy-fuel systems

28
Creep Rate comparison
(650C, 838 MPa ) G.B.Viswanathan, et al Acta mater. 2005
Rene 88DT Disk Alloy
205 C/min 24 C/min
Why Care About Microstructure?
Why care about microstructure modeling?
Fast
Cool
Slow
Cool

29
Processing
Properties
Performance
Today Microstructure and Engineering Design
30
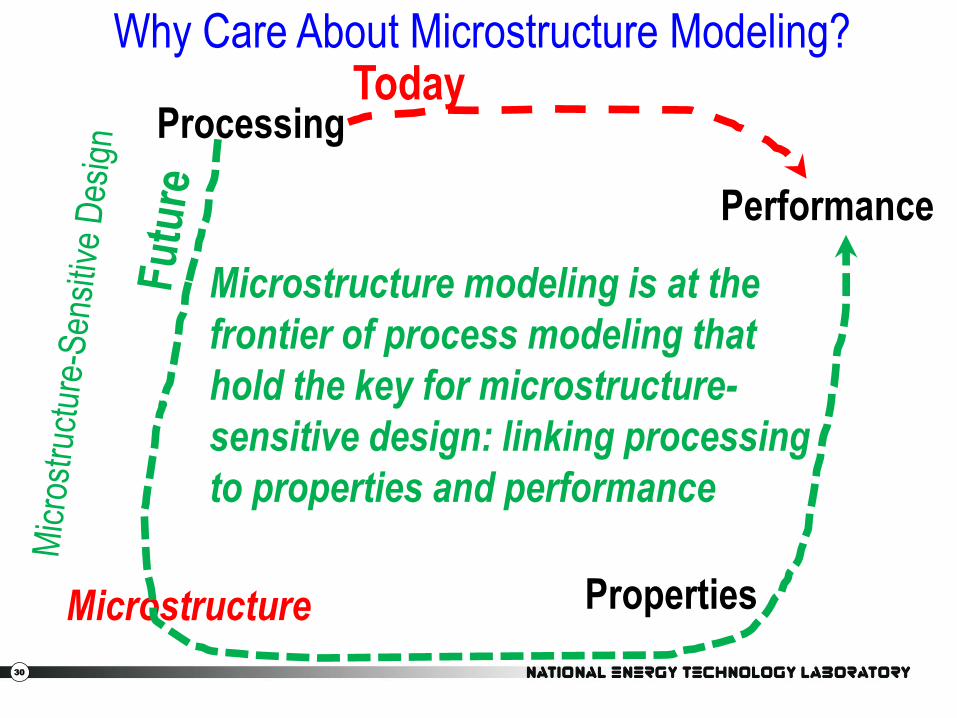
Processing
Microstructure Properties
Performance
Why Care About Microstructure Modeling?
Microstructure modeling is at the
frontier of process modeling that
hold the key for microstructure-
sensitive design: linking processing
to properties and performance
Today
31
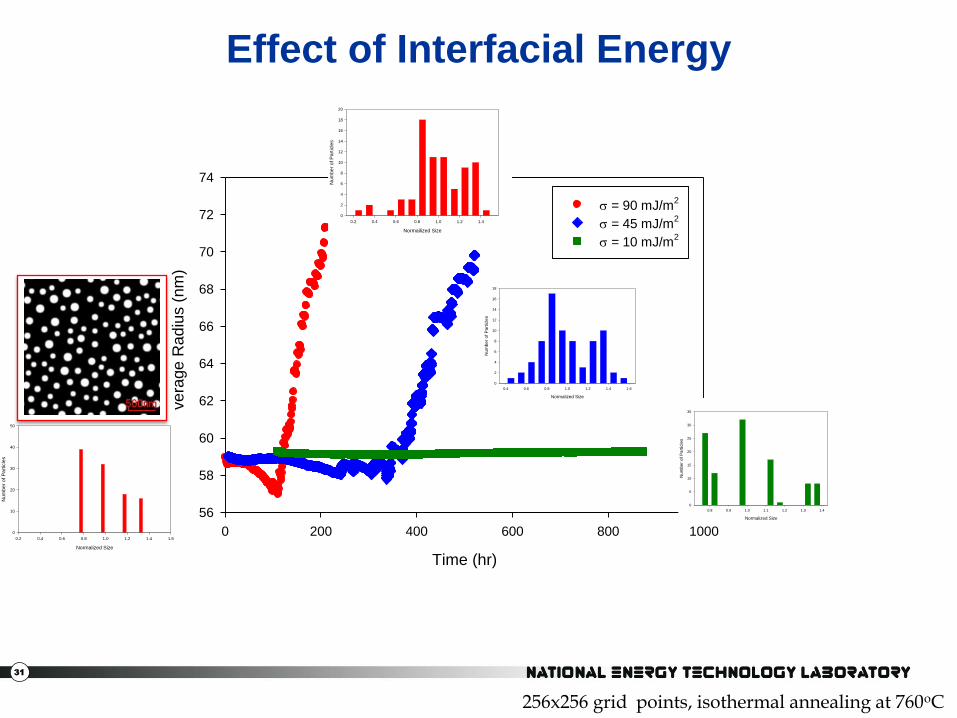
Effect of Interfacial Energy
Time (hr)
0 200 400 600 800 1000
Ave
rage
Ra
diu
s (
nm
)
56
58
60
62
64
66
68
70
72
74
= 90 mJ/m2
= 45 mJ/m2
= 10 mJ/m2
Normalized Size
0.2 0.4 0.6 0.8 1.0 1.2 1.4 1.6
Num
ber
of
Part
icle
s
0
10
20
30
40
50
Normailized Size
0.2 0.4 0.6 0.8 1.0 1.2 1.4
Nu
mb
er
of P
art
icle
s
0
2
4
6
8
10
12
14
16
18
20
Normalized Size
0.8 0.9 1.0 1.1 1.2 1.3 1.4
Num
ber
of
Part
icle
s
0
5
10
15
20
25
30
35
Normalized Size
0.4 0.6 0.8 1.0 1.2 1.4 1.6
Num
ber
of
Part
icle
s
0
2
4
6
8
10
12
14
16
18
256x256 grid points, isothermal annealing at 760oC

32
Effect of Mobility in phase
Time (hr)
0 20 40 60 80 100 120
Ave
rage
Ra
diu
s (
nm
)
56
58
60
62
64
66
68
70
72
74
' = 0.01
' =
Normalized Size
0.4 0.6 0.8 1.0 1.2 1.4
Num
ber
of
Pa
rtic
les
0
2
4
6
8
10
12
14
16
18
20
' = 0.01
' =
256x256 grid points, isothermal annealing at 760oC, =90.0 mJ/m2
− Larger diffusivity in slightly increase the coarsening rate

33
Mean Field Strategy for Oxidation Modeling
Screening
Oxidation Lifetime Modeling
Identify Protective Oxide Cr2O3, Al2O3, …
Find Oxide Stability Range Ni-(Al,Cr,..)-O Thermodynamic Database
Find Alloy Composition Range •Identify Key Reaction Element (Al, Cr…) •Sufficient Supply of Reaction Element(Prevent Internal Oxidation) •Ni-based Alloy Thermodynamic Database •Ni-based Alloy Mobility Database
Diffusion Modeling •Diffusion in Ni-based Alloys •Oxidation Boundary Conditions •Lifetime Prediction (Insufficient Supply of Reaction Element, Surface Condition Outside Stability Range…)
Ni-based Alloys Oxide

34
0
5
10
15
20
25
30
WE
IGH
T-P
ER
CE
NT
CR
0 5 10 15 20 25 30 35 40
10-6
DISTANCE
Cr Evaporation
IN740 Al Co Cr Fe Mo Mn Ti Ni
wt.% 0.9 20.0 25.0 0.7 0.5 0.3 1.8 bal
200hrs
2000hrs
Ke = 2.13x10⁻⁹ kg/(m2s)
− Based on evaporation boundary condition proposed by G. R.Holcomb*
* G.R. Holcomb, J. Electochem. Soc., 156(9), C292(2009)
0
0.1
0.2
0.3
0.4
0.5
0.6
0.7
0.8
0.9
1.0
NP
(FC
C_L
12)
0 5 10 15 20 25 30 35 40
10-6
DISTANCE
200hrs
2000hrs
Cr Concentration volume fraction

35
0.1
0.2
0.3
0.4
0.5
0.6
0.7
0.8
0.9
1.0
NP
(FC
C_L
12)
0 200 400 600 800 1000 1200 1400 1600 1800 2000
FUNCTION TT
Cr Evaporation
IN740 Al Co Cr Fe Mo Mn Ti Ni
wt.% 0.9 20.0 25.0 0.7 0.5 0.3 1.8 bal
Cr Concentration at the Surface
0
5
10
15
20
25
30
WE
IGH
T-P
ER
CE
NT
CR
0 200 400 600 800 1000 1200 1400 1600 1800 2000
FUNCTION TTTime (hr) Time (hr)
volume fraction at the Surface
36
-45500
-45000
-44500
-44000
-43500
-43000
-42500
-42000
-41500
-41000
-40500
-40000
MU
(CR
)
20 21 22 23 24 25 26 27 28 29 30
MASS_PERCENT CR
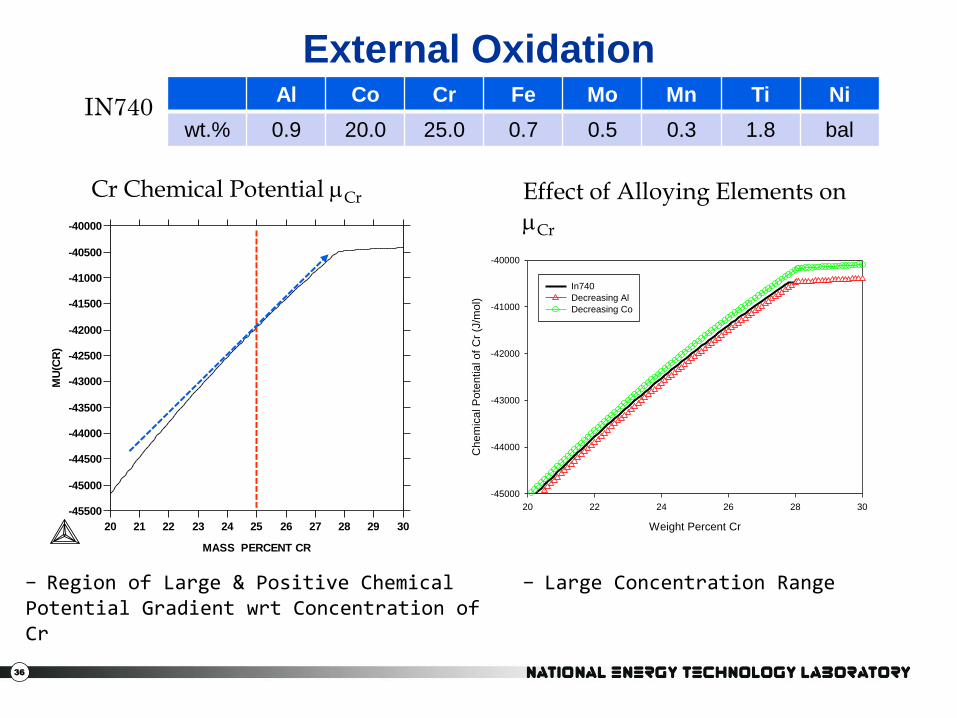
External Oxidation
IN740 Al Co Cr Fe Mo Mn Ti Ni
wt.% 0.9 20.0 25.0 0.7 0.5 0.3 1.8 bal
− Region of Large & Positive Chemical Potential Gradient wrt Concentration of Cr
− Large Concentration Range
Cr Chemical Potential mCr
Weight Percent Cr
20 22 24 26 28 30
Che
mic
al P
ote
ntial of
Cr
(J/m
ol)
-45000
-44000
-43000
-42000
-41000
-40000
In740
Decreasing Al
Decreasing Co
Effect of Alloying Elements on mCr

37
External Oxidation
15
16
17
18
19
20
21
10-23
M(F
CC
_A
1,C
R)
20 21 22 23 24 25 26 27 28 29 30
MASS_PERCENT CR
− Large Atomic Mobility (Diffusivity) of Cr
Cr Atomic Mobility MCr
IN740 Al Co Cr Fe Mo Mn Ti Ni
wt.% 0.9 20.0 25.0 0.7 0.5 0.3 1.8 bal
14
15
16
17
18
19
20
21
10-23
M(F
CC
_A
1,C
R)
20 21 22 23 24 25 26 27 28 29 30
MASS_PERCENT CR
Decreasing Cr
Decreasing Al
Effect of Alloying Elements on MCr

38
Multi-Component Multi-Phase Phase-Field Model
Multi-Component, Multi-Phase
Kim-Kim-Suzuki(KKS) Model*
flexible interfacial energy
practical length scale
* Kim et al., Phys. Review E, 60(6), 7186(1999)
Link to CALPHAD Database
Mass Conservation
Equal Chemical Potential
Multiphase Model**
multiphase
multi-variant
poly-crystal
** Steinbach et al., Physica D, 94, 135(1996)
Local Free Energy Barrier
Gradient Energy
i
k
m
i
ik cc
1

39
Phase-Field Model: (cont.)
Elastic Effect t due to Lattice Misfit
Vegard’s law
n
m
mijij
moijmijij
rXmr
XaXa
m
1
0000
0000
)()()(
)()(
Composition-dependent eigenstrain
40
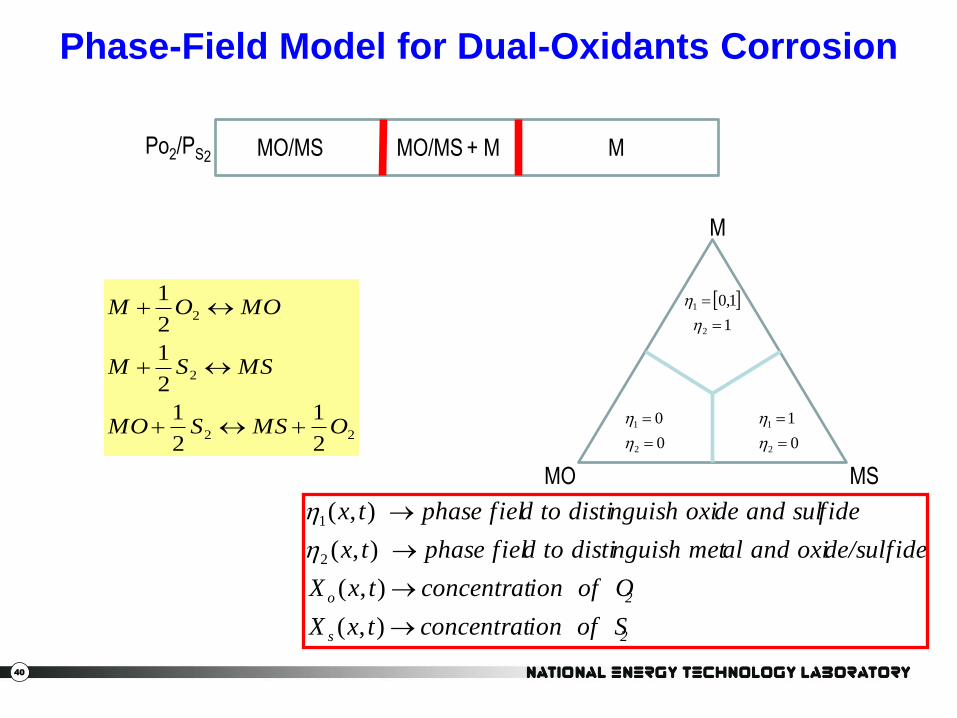
Phase-Field Model for Dual-Oxidants Corrosion
2s
2o
ion of SconcentrattxX
ion of OconcentrattxX
de/sulf ideal and oxinguish metd to distiphase fieltx
fidede and sulnguish oxid to distiphase fieltx
),(
),(
),(
),(
2
1
M MO/MS MO/MS + M M Po2/PS2
22
2
2
2
1
2
1
2
1
2
1
OMSSMO
MSSM
MOOM
MO
M
MS
0
0
2
1
0
1
2
1
1
1,0
2
1

41
Phase-Field Model for Dual-Oxidants
Corrosion
(
(
j
j
j
i
ii
i moi
ii
ii
soch
so
msmo
chsomsoch
somosomsso
msmo
ch
X
FM
t
XFL
t
dVXXXfF
gwXXfhXXfhXXf
gwXXfhXXfhXXf
),( ;
)(2
)(2
),,,(
)()(),,()(1),()(),,,(
)(),()(1),()(),,(
21
2,1 ,
22
21
2121
/
2221
11111
/
M
MS MO
0
0
2
1
0
1
2
1
]1,0[1
)2,1(
),( )1)(1()1( 2221212
iL
SOi MMMM
i
mo
i
ms
i
m
ii
iii
s
is
o
iosoi
w
msmomiXXXXXXf
,,
),,()()(2
1),( 22
Thermodynamics
Kinetics
12

42
Oxidation Modeling: Exposure to O2 only
Decreased Xo(x=0)
4
1 to
6
12
npk n
o

43
Effect of anisotropic elasticity on precipitations
with presence of grain boundaries Courtesy of Longqing Chen at PSU
The Path Forward
Precipitation Modeling


![UNCLASSI]I ED A D 402! 2I 2 - dtic.milI ED A D 402! 2I 2 ... IN CONTINUUM MECHANICS by M. E. Gurtin SiA APR? TIv 25 ... M. E. Gurtin Brown riUniversity 1. Introduction.](https://static.fdocuments.us/doc/165x107/5af062f87f8b9ac57a8e871b/unclassii-ed-a-d-402-2i-2-dtic-i-ed-a-d-402-2i-2-in-continuum-mechanics.jpg)