Computational Modeling and Analysis for Complex Systems
35
Haijun Gong*, Paolo Zuliani*, Anvesh Komuravelli *, James R. Faeder # , Edmund M. Clarke* Pancreatic Cancer Research and HMGB1 Signaling Pathway * #
Transcript of Computational Modeling and Analysis for Complex Systems

Haijun Gong*, Paolo Zuliani*, Anvesh Komuravelli*,
James R. Faeder#, Edmund M. Clarke*
Pancreatic Cancer Research and
HMGB1 Signaling Pathway
* #
07/16/0907/16/0907/16/0907/16/0907/16/09
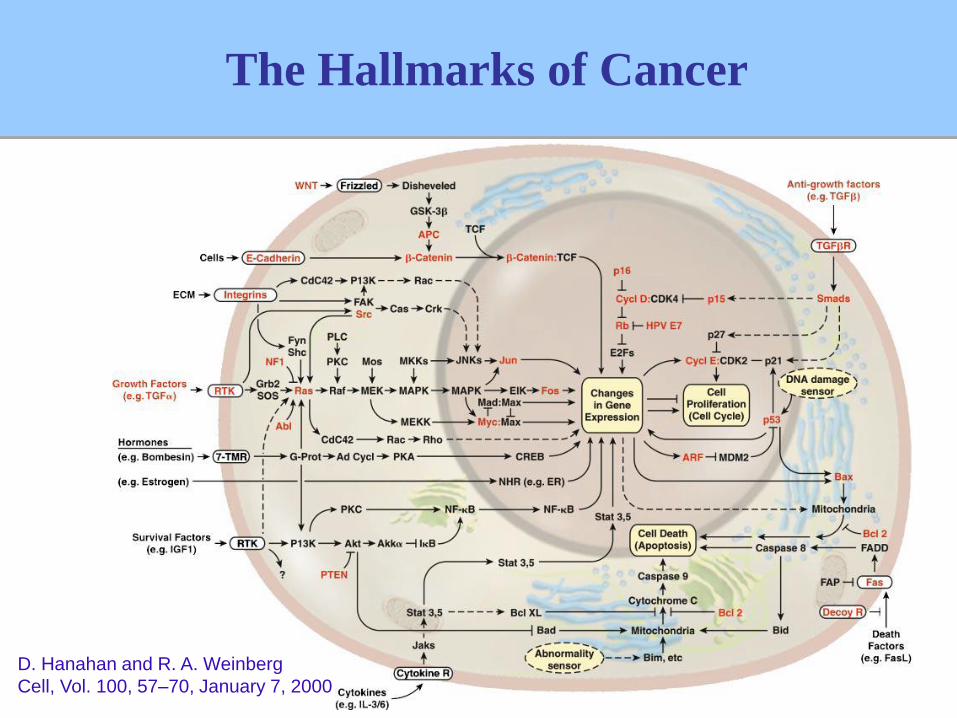
The Hallmarks of Cancer
D. Hanahan and R. A. Weinberg
Cell, Vol. 100, 57–70, January 7, 2000
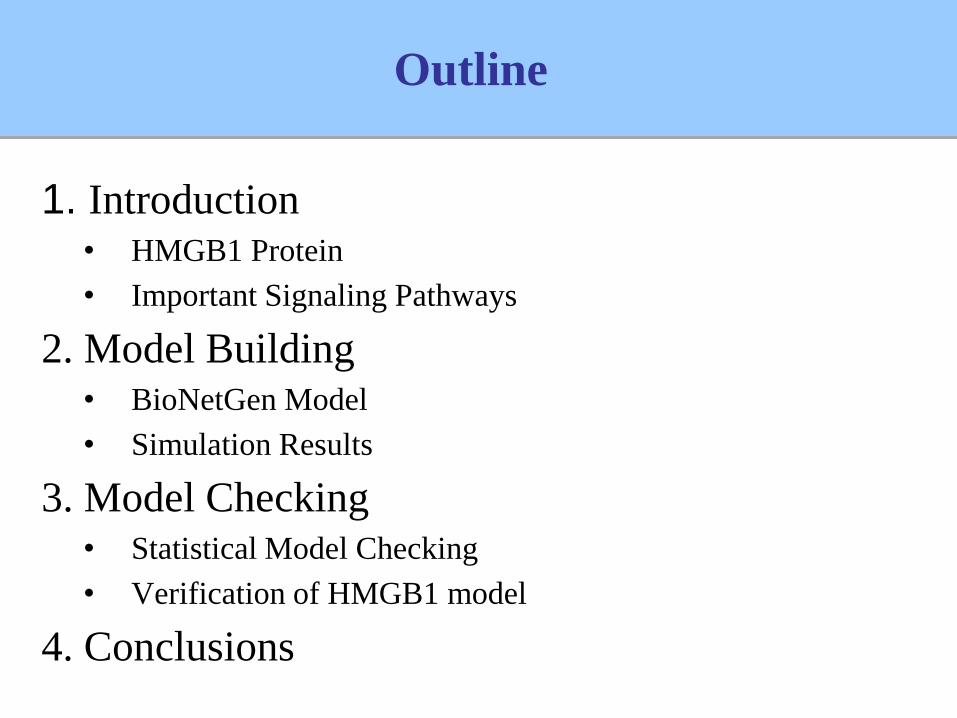
Outline
1. Introduction• HMGB1 Protein
• Important Signaling Pathways
2. Model Building• BioNetGen Model
• Simulation Results
3. Model Checking• Statistical Model Checking
• Verification of HMGB1 model
4. Conclusions07/16/0907/16/0907/16/0907/16/0907/16/09

The Protein HMGB1
• High-Mobility Group Protein 1 (HMGB1):
• DNA-binding protein and regulates gene transcription
• released from damaged or stressed cells, etc.
• HMGB1 activates RAGE or TLR2/4
• RAGE: Receptor for Advanced
Glycation End products.
• TLR: Toll-like receptor
• RAGE/TLR activation can activate NFkB and RAS signaling pathways which causes inflammation or tumorigenesis.
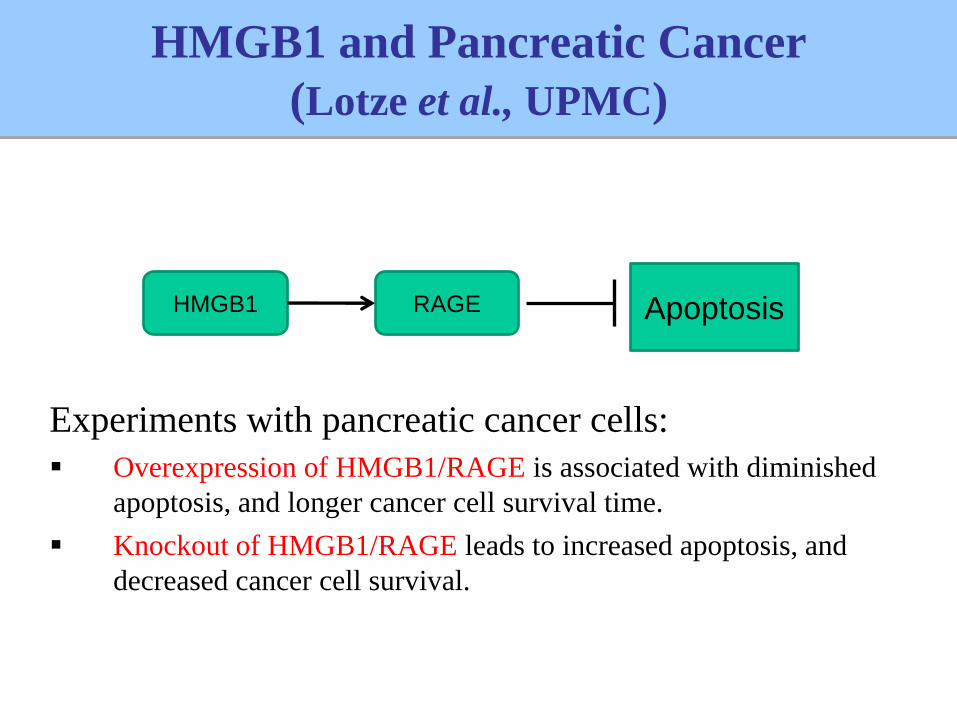
HMGB1 and Pancreatic Cancer
(Lotze et al., UPMC)
Experiments with pancreatic cancer cells:
Overexpression of HMGB1/RAGE is associated with diminished
apoptosis, and longer cancer cell survival time.
Knockout of HMGB1/RAGE leads to increased apoptosis, and
decreased cancer cell survival.
HMGB1 RAGE Apoptosis
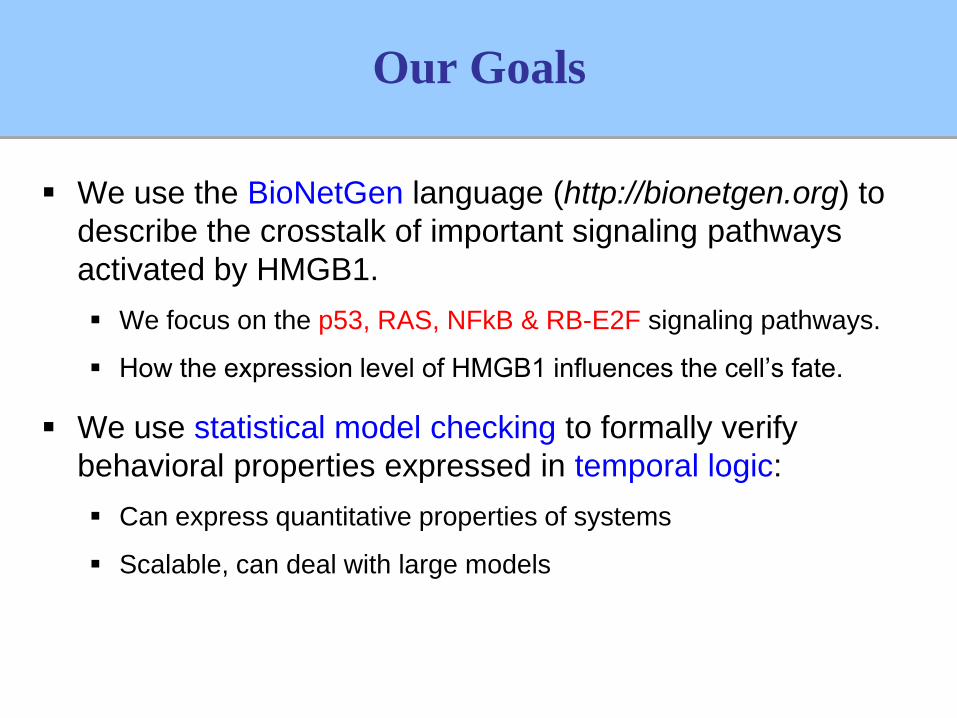
We use the BioNetGen language (http://bionetgen.org) to
describe the crosstalk of important signaling pathways
activated by HMGB1.
We focus on the p53, RAS, NFkB & RB-E2F signaling pathways.
How the expression level of HMGB1 influences the cell’s fate.
We use statistical model checking to formally verify
behavioral properties expressed in temporal logic:
Can express quantitative properties of systems
Scalable, can deal with large models
07/16/0907/16/0907/16/0907/16/0907/16/09
Our Goals

P53-RAS-RB Crosstalk Model
First computational model of HMGB1 signal
transduction in tumorigenesis.
Focus on the crosstalk of p53, RAS, & RB signaling
pathways.
More details in the paper “Analysis and Verification
of the HMGB1 Signaling Pathway” published in
BMC Bioinformatics 11 (Suppl 7) (2010)
07/16/0907/16/0907/16/0907/16/0907/16/09

Apoptosis
RB-E2F
HMGB1
E2F
Myc
CyclinE
CyclinD
ARF
P53
PTEN
mdm2
RASRASaPI3K
PIP3PIP2
RAFaRAF
ERKpERK
RAGEaRAGE
AKTpAKT
MDM2pMDM2
RBp RB
MEKMEKp
deg
deg
deg degdeg
deg
deg
deg
P21deg
INK4Adeg
S Phase
PI3K-p53 pathway
P53 is a tumor suppressor, is mutated in more
than 50% of cancers.
Functions of P53: 1. Induces cell cycle arrest: P21, etc.
2. DNA repair
3. Initiates apoptosis – Programmed Cell Death: Bax, etc.
Negative feedback loop:
PI3K PIP3 AKT MDM2 ─┤ p53
MDM2
Positive feedback loop:
p53 PTEN ─┤ PIP3 AKT MDM2
─┤ p53
Apoptosis
RB-E2F
HMGB1
E2F
Myc
CyclinE
CyclinD
ARF
P53
PTEN
mdm2
RASRASaPI3K
PIP3PIP2
RAFaRAF
ERKpERK
RAGEaRAGE
AKTpAKT
MDM2pMDM2
RBp RB
MEKMEKp
deg
deg
deg degdeg
deg
deg
deg
P21deg
INK4Adeg
S Phase
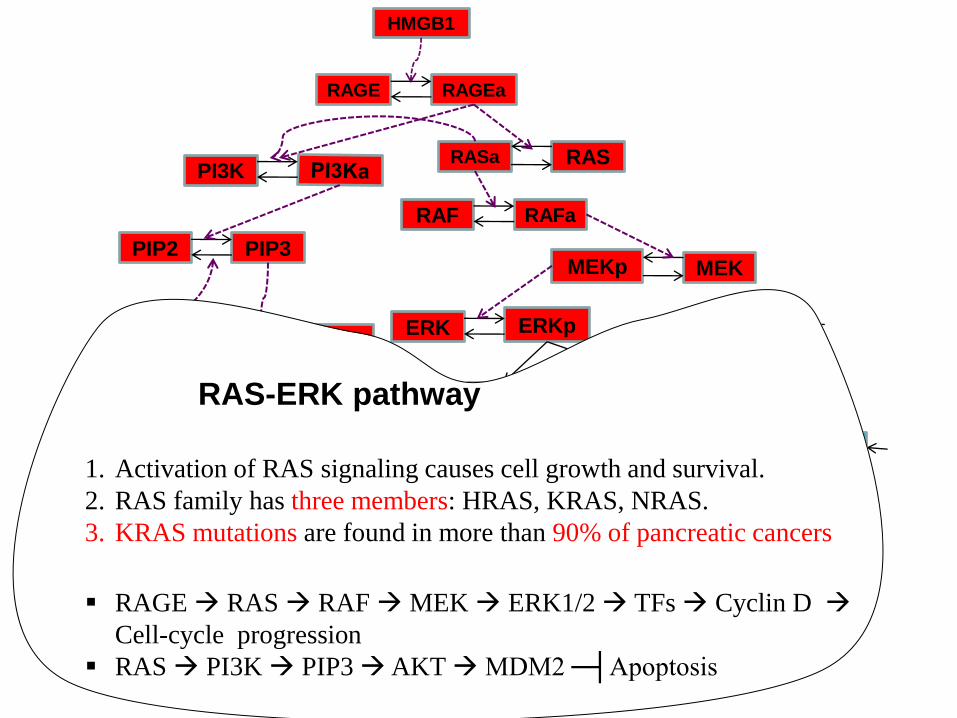
RAS-ERK pathway
1. Activation of RAS signaling causes cell growth and survival.
2. RAS family has three members: HRAS, KRAS, NRAS.
3. KRAS mutations are found in more than 90% of pancreatic cancers.
RAGE RAS RAF MEK ERK1/2 TFs Cyclin D
Cell-cycle progression
RAS PI3K PIP3 AKT MDM2 ─┤Apoptosis 9
Apoptosis
RB-E2F
HMGB1
E2F
Myc
CyclinE
CyclinD
ARF
P53
PTEN
mdm2
RASRASaPI3K
PIP3PIP2
RAFaRAF
ERKpERK
RAGEaRAGE
AKTpAKT
MDM2pMDM2
RBp RB
MEKMEKp
deg
deg
deg degdeg
deg
deg
deg
P21deg
INK4Adeg
S Phase
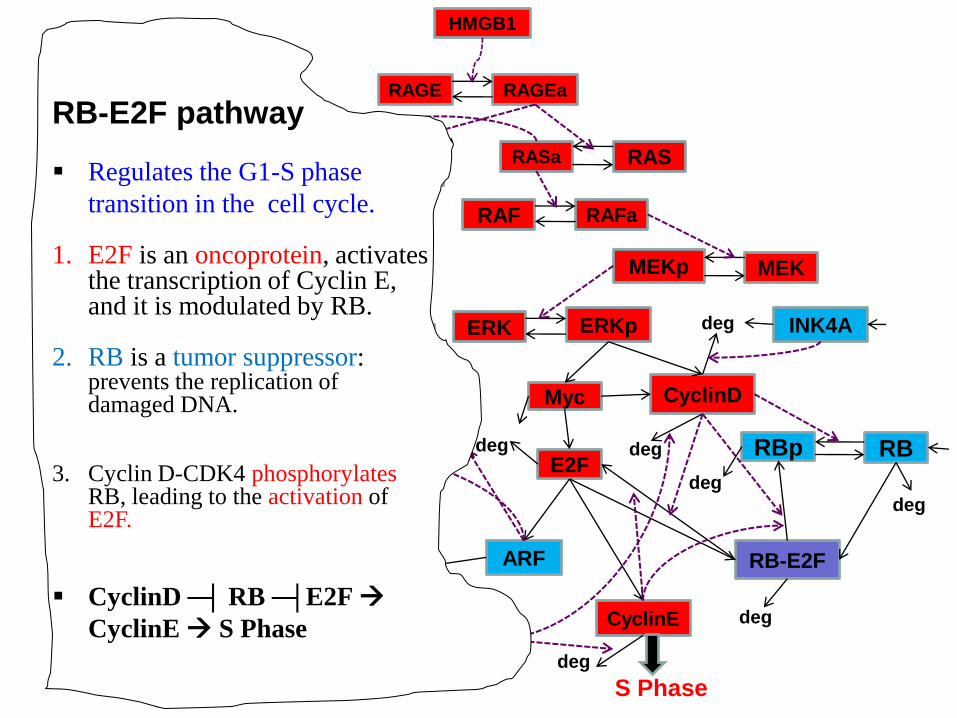
RB-E2F pathway
Regulates the G1-S phase
transition in the cell cycle.
1. E2F is an oncoprotein, activates the transcription of Cyclin E, and it is modulated by RB.
2. RB is a tumor suppressor: prevents the replication of damaged DNA.
3. Cyclin D-CDK4 phosphorylatesRB, leading to the activation of E2F.
CyclinD ─┤ RB ─┤E2F
CyclinE S Phase
10
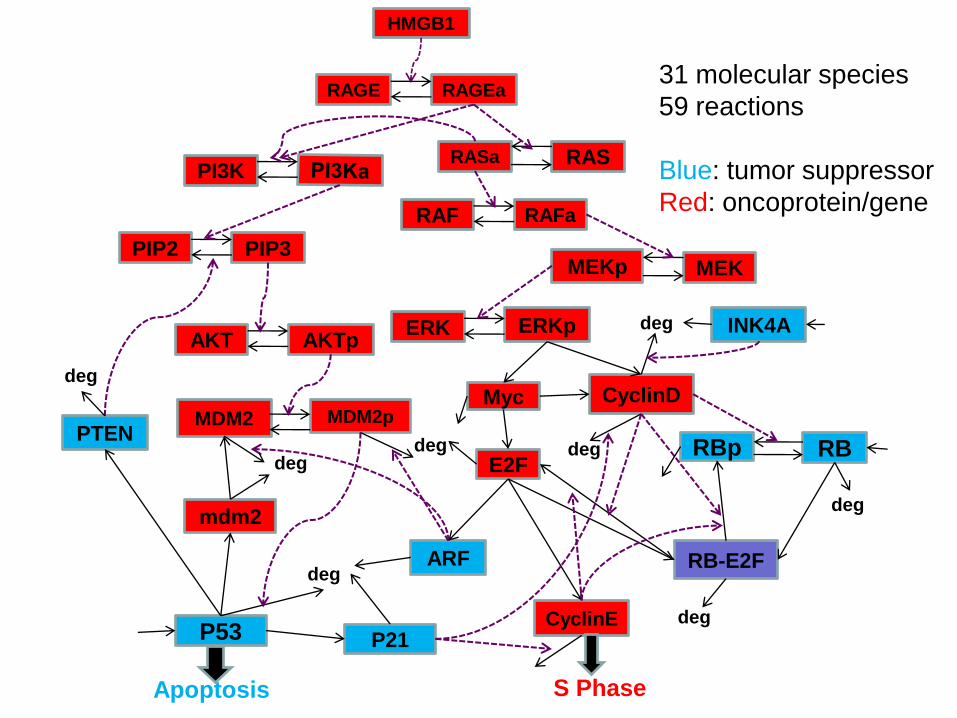
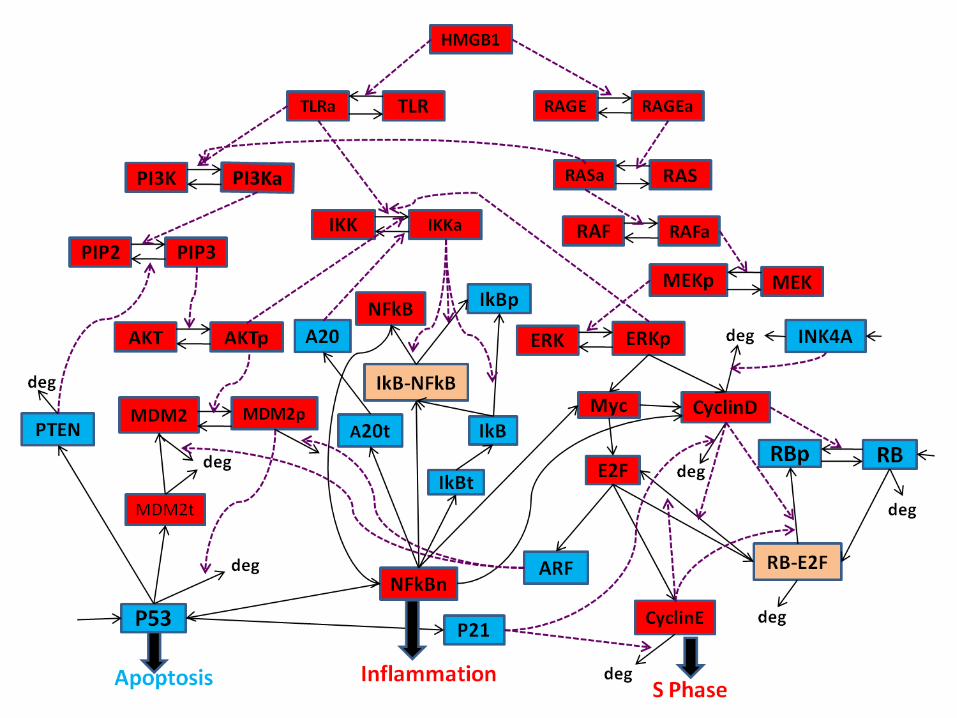
31 molecular species
59 reactions
Blue: tumor suppressor
Red: oncoprotein/gene
Apoptosis
RB-E2F
HMGB1
E2F
Myc
CyclinE
CyclinD
ARF
P53
PTEN
mdm2
RASRASaPI3K
PIP3PIP2
RAFaRAF
ERKpERK
RAGEaRAGE
AKTpAKT
MDM2pMDM2
RBp RB
MEKMEKp
deg
deg
deg degdeg
deg
deg
deg
P21deg
INK4Adeg
S Phase11
P53-NFkB-RAS-RB Crosstalk Model
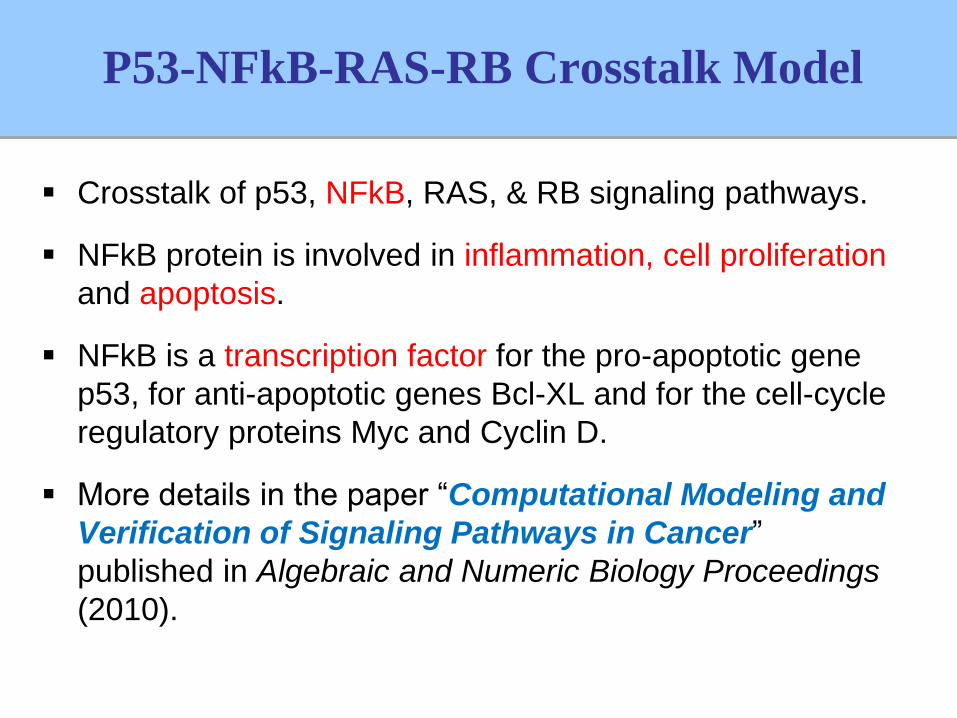
Crosstalk of p53, NFkB, RAS, & RB signaling pathways.
NFkB protein is involved in inflammation, cell proliferation
and apoptosis.
NFkB is a transcription factor for the pro-apoptotic gene
p53, for anti-apoptotic genes Bcl-XL and for the cell-cycle
regulatory proteins Myc and Cyclin D.
More details in the paper “Computational Modeling and
Verification of Signaling Pathways in Cancer”
published in Algebraic and Numeric Biology Proceedings
(2010).
07/16/0907/16/0907/16/0907/16/0907/16/09

NFkB pathway
2 negative feedback
loops:
1.TLR IKK ─┤ IkB
─┤ NFkB IkB ─┤
NFkB
2.NFkB A20 ─┤
IKK ─┤ IkB ─┤ NFkB
In resting cells IkB exists
only in the cytoplasm,
bound to NFkB
IKK (IkB kinase) can
phosphorylate IkB to
release NFkB
Free NFkB enter
the nucleus to
activate the
expression of A20,
IkB, P53, Cyclin D,
Myc.
Overexpression of NFkB
is common in the
pancreatic cancer.
14
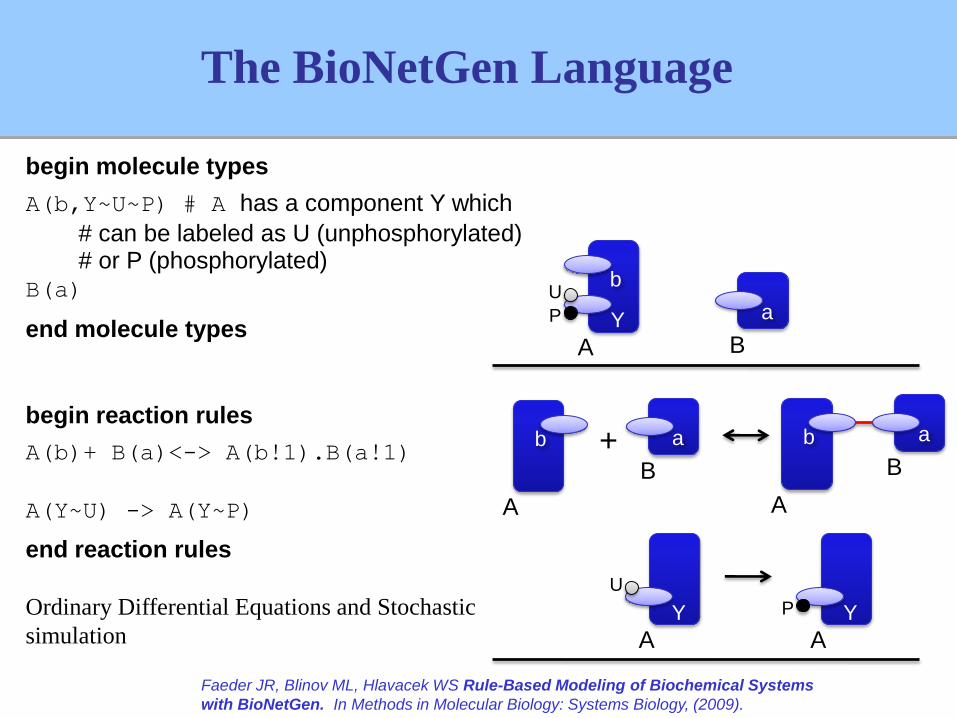
begin molecule types
A(b,Y~U~P) # A has a component Y which
# can be labeled as U (unphosphorylated) # or P (phosphorylated)
B(a)
end molecule types
begin reaction rules
A(b)+ B(a)<-> A(b!1).B(a!1)
A(Y~U) -> A(Y~P)
end reaction rules
Ordinary Differential Equations and Stochastic
simulation (Gillespie’s algorithm)
Faeder JR, Blinov ML, Hlavacek WS Rule-Based Modeling of Biochemical Systems
with BioNetGen. In Methods in Molecular Biology: Systems Biology, (2009).
A
b
Y
U
P
B
a
A
b
B
a+
A
b
B
a
AY
U
AYP
The BioNetGen Language
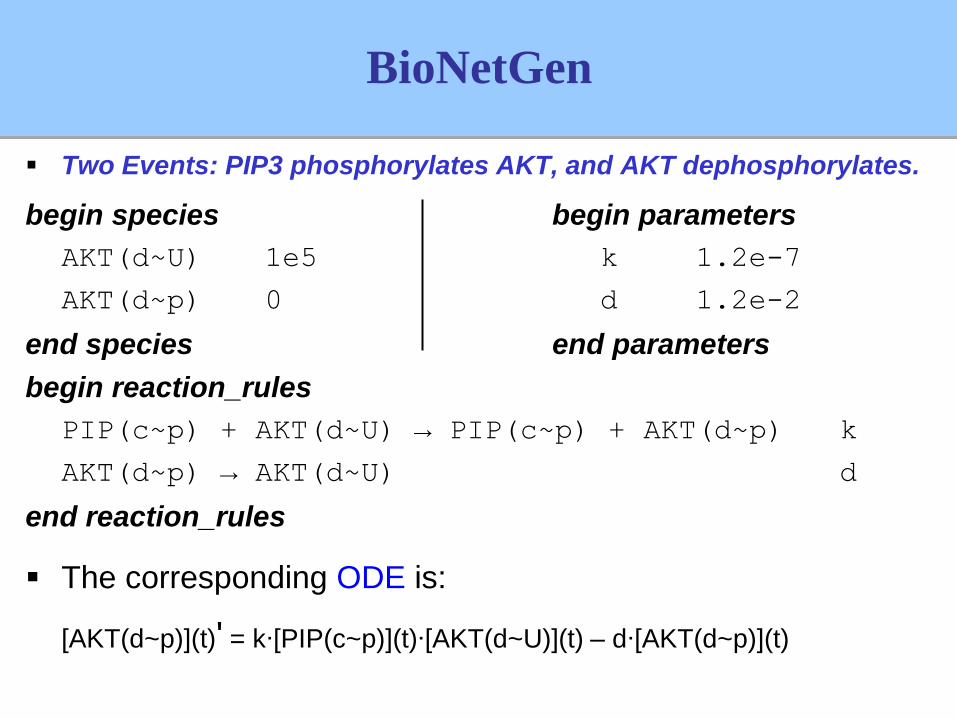
BioNetGen
Two Events: PIP3 phosphorylates AKT, and AKT dephosphorylates.
begin species begin parameters
AKT(d~U) 1e5 k 1.2e-7
AKT(d~p) 0 d 1.2e-2
end species end parameters
begin reaction_rules
PIP(c~p) + AKT(d~U) → PIP(c~p) + AKT(d~p) k
AKT(d~p) → AKT(d~U) d
end reaction_rules
The corresponding ODE is:
[AKT(d~p)](t)' = k∙[PIP(c~p)](t)∙[AKT(d~U)](t) – d∙[AKT(d~p)](t)

Simulations (I)
Baseline simulation of p53, MDM2, Cyclin D/E in response to
HMGB1 release: ODE vs stochastic simulation

Simulations (II)
Baseline simulation of NFkB, IkB, IKK and A20 in response to HMGB1 release.
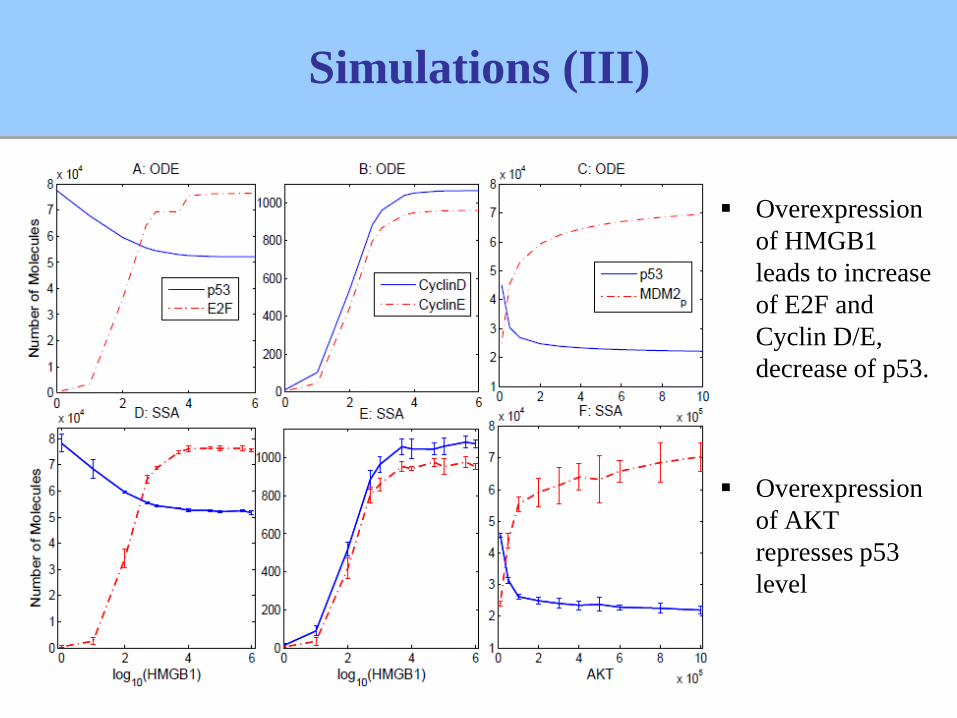
Simulations (III)
Overexpression
of HMGB1
leads to increase
of E2F and
Cyclin D/E,
decrease of p53.
Overexpression
of AKT
represses p53
level
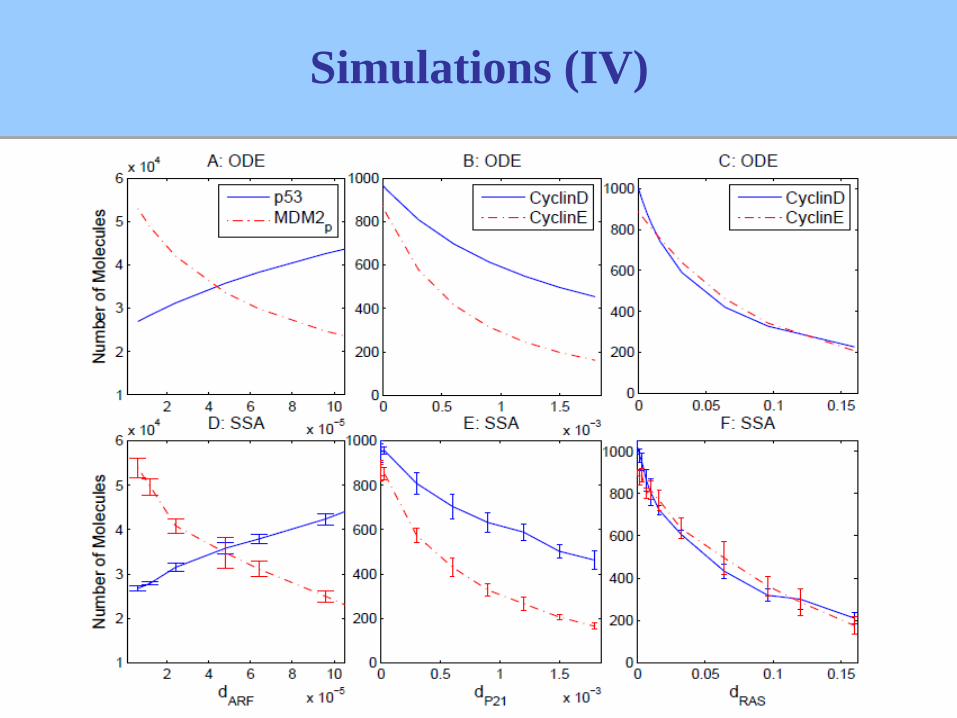
Simulations (IV)

Simulations (V)
IKK overexpress in many cancer cells, it promotes NFkB’s transcription activity
and accelerate cell proliferation.
Overexpression of NFkB is common in pancreatic cancer.

Bounded Linear Temporal Logic (BLTL): Extension of LTL
with time bounds on temporal operators.
Ft a – “a will be true in the Future within time t ”
Gt a – “a will be Globally true between time 0 and t ”
For example: “# of AKTp reach 4,000 within 20 minutes?” –
F20 (AKTp ≥ 4,000)
Let σ = (s0, t0), (s1, t1), . . . be an execution of the model
along states s0, s1, . . .
the system stays in state si for time ti
σi: Execution trace starting at state i.
Bounded Linear Temporal Logic

Verification of BioNetGen Models
Given a stochastic BioNetGen model , Temporal
property Ф, and a fixed 0<θ<1, we ask whether P≥θ (Ф) or
P<θ (Ф).
For example: “could AKTp reach 4,000 within 20 minutes,
with probability at least 0.99?” : P≥0.99 (F20 (AKTp ≥ 4,000))
Does satisfy with probability at least ?
Draw a sample of system simulations and use Statistical
Hypothesis Testing: Null vs. Alternative hypothesis

Statistical Model Checking of biochemical models: M╞═ P≥θ(Φ)?
Statistical Model Checking
Model MStochastic
simulation
BioNetGenStatistical Model Checker
BLTL
property Φ
Formula
monitor
M╞═ P≥θ (Φ)
Statistical
TestM╞═ P≥θ (Φ)
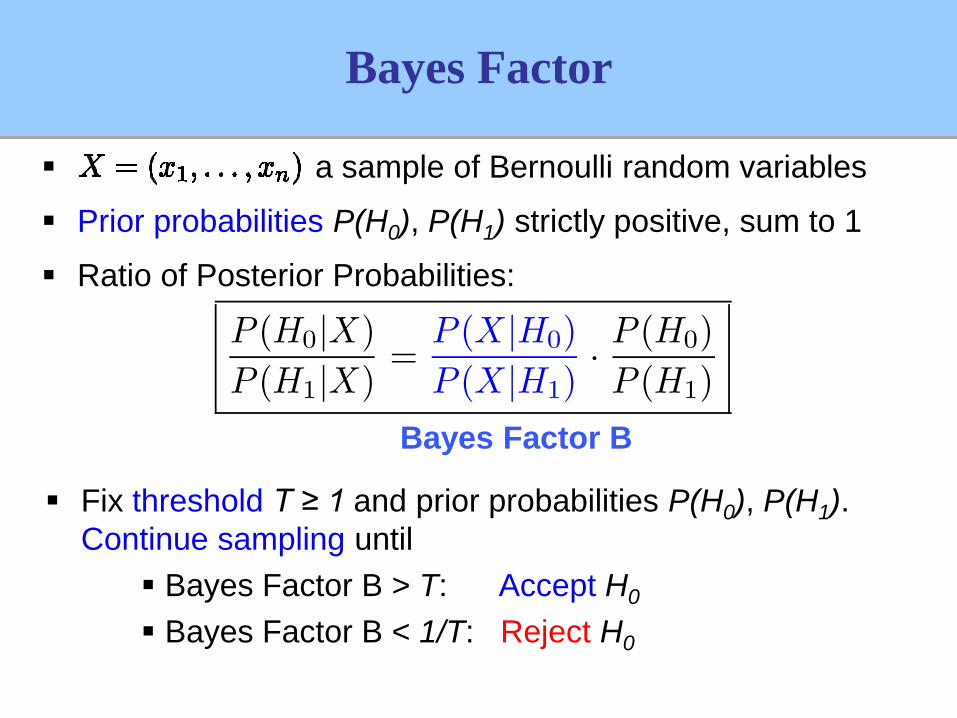
a sample of Bernoulli random variables
Prior probabilities P(H0), P(H1) strictly positive, sum to 1
Ratio of Posterior Probabilities:
Bayes Factor B
Bayes Factor
Fix threshold T ≥ 1 and prior probabilities P(H0), P(H1).
Continue sampling until
Bayes Factor B > T: Accept H0
Bayes Factor B < 1/T: Reject H0

Require: Property P≥θ(Φ), Threshold T ≥ 1, Prior density g
n := 0 {number of traces drawn so far}
x := 0 {number of traces satisfying Φ so far}
repeat
σ := draw a sample trace from BioNetGen (iid)
n := n + 1
if σ Φ then
x := x + 1
endifB := BayesFactor(n, x, g)
until (B > T v B < 1/T )
if (B > T ) then
return “H0 accepted”
else
return “H0 rejected”
endif
SMC Algorithm

Verification (I)
Overexpression of HMGB1 will induce the expression of
cell regulatory protein CyclinE.
We model checked the formula with different initial values
of HMGB1, the probability error is 0.001.
P≥0.9 F600 ( CyclinE > 900 )
HMGB1 # samples # Success Result
102 9 0 False
103 55 16 False
106 22 22 True
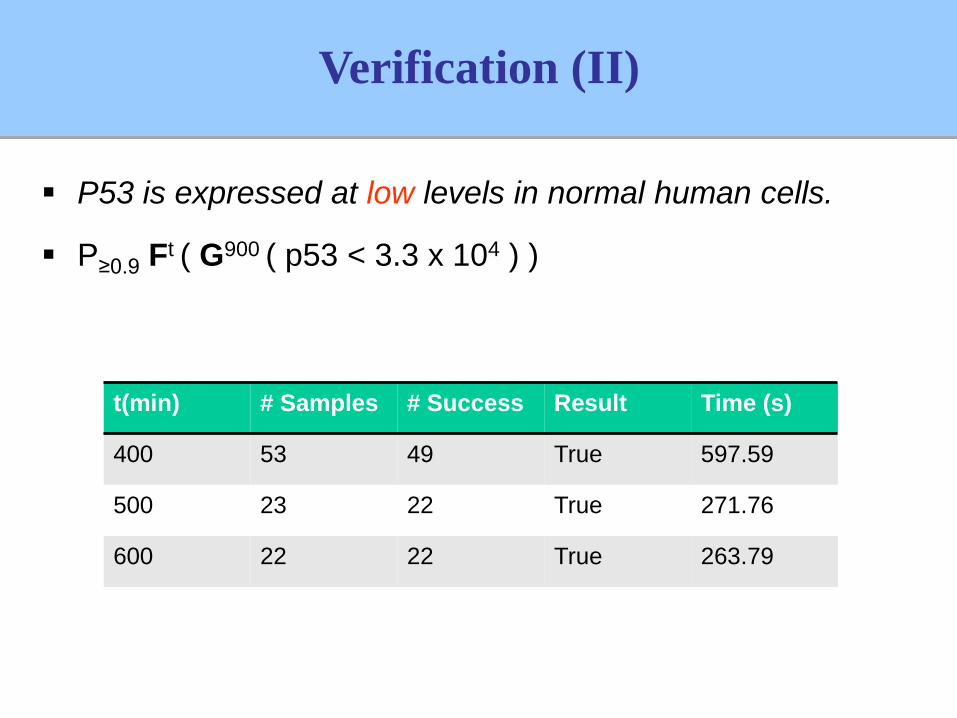
Verification (II)
P53 is expressed at low levels in normal human cells.
P≥0.9 Ft ( G900 ( p53 < 3.3 x 10⁴ ) )
t(min) # Samples # Success Result Time (s)
400 53 49 True 597.59
500 23 22 True 271.76
600 22 22 True 263.79
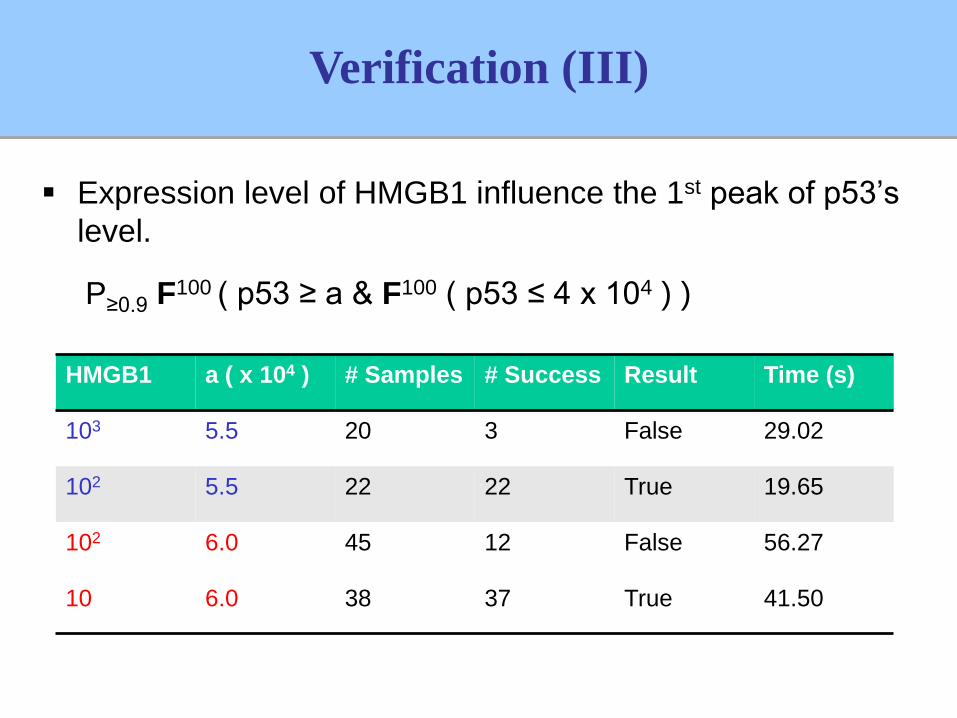
Verification (III)
Expression level of HMGB1 influence the 1st peak of p53’s
level.
P≥0.9 F100 ( p53 ≥ a & F100 ( p53 ≤ 4 x 10⁴ ) )
HMGB1 a ( x 104 ) # Samples # Success Result Time (s)
103 5.5 20 3 False 29.02
102 5.5 22 22 True 19.65
102 6.0 45 12 False 56.27
10 6.0 38 37 True 41.50

Verification (IV)
HMGB1 can activate PI3K, RAS and AKT in large quantities
Let PI3Kr, RASr, and IKKr be the fraction of activated
molecules of PI3K, RAS, and IKK, respectively
We model checked the formula:
P≥0.9 Ft G180 (PI3Kr > 0.9 & RASr > 0.8 & IKKr > 0.6 )
t (min) # Samples # Success Result Time (s)
90 9 0 False 21.27
110 38 37 True 362.19
120 22 22 True 214.38
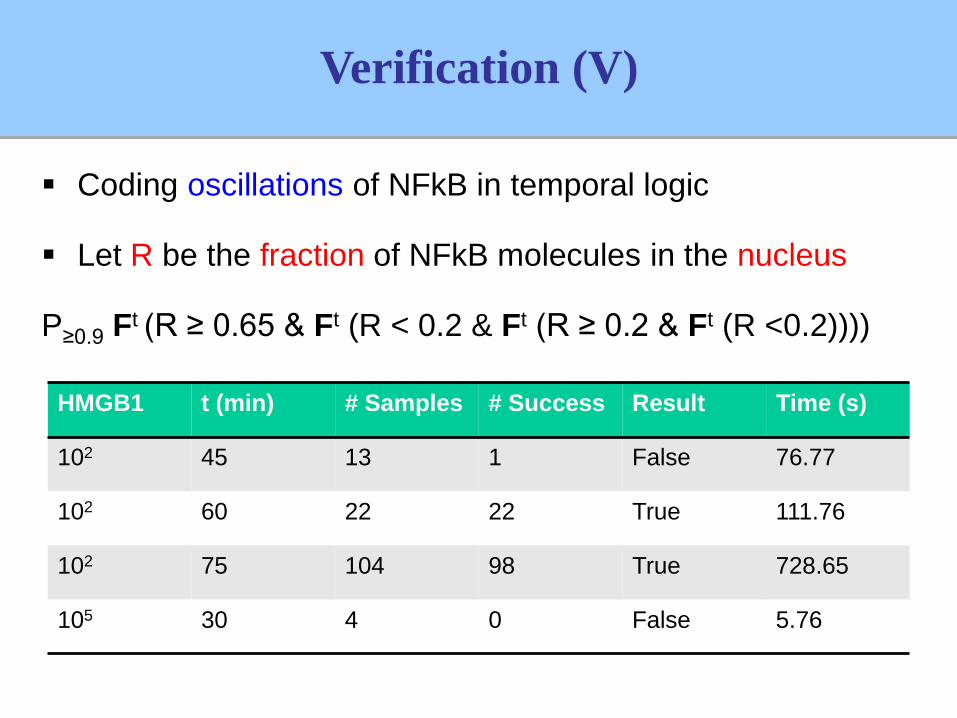
Verification (V)
Coding oscillations of NFkB in temporal logic
Let R be the fraction of NFkB molecules in the nucleus
P≥0.9 Ft (R ≥ 0.65 & Ft (R < 0.2 & Ft (R ≥ 0.2 & Ft (R <0.2))))
HMGB1 t (min) # Samples # Success Result Time (s)
102 45 13 1 False 76.77
102 60 22 22 True 111.76
102 75 104 98 True 728.65
105 30 4 0 False 5.76

Conclusions
Computational model qualitatively confirmed the previous
HMGB1 experimental phenomena.
Our simulations predict a dose-dependent p53, CyclinE, and
NFkB response curve to increasing HMGB1stimulus.
Statistical Model Checking automatically validate our model
with respect to known experimental results.

Future Work
Parameter estimation
Combine Machine Learning (Bayesian Network) and
Model Checking to infer Gene Regulatory Network
Multi-cellular systems
Pancreatic stellate cells

Acknowledgments
This work supported by the NSF Expeditions in
Computing program
Thanks to Michael T. Lotze (University of Pittsburgh) for
calling our attention to HMGB1
Thanks to Marco E. Bianchi (Università San Raffaele) for
discussions on HMGB1

Thank you!
Questions?


![Mathematical and Computational Modeling in Complex ... · ematical modeling of biological processes provides deep insights of the complex cellular systems [13]. Researchers built](https://static.fdocuments.us/doc/165x107/6128a289f285ce430843c0b0/mathematical-and-computational-modeling-in-complex-ematical-modeling-of-biological.jpg)