Comptroller's Monthly Report on State Funds Cash Basis of ...
59
NYS Comptroller THOMAS P. DiNAPOLI Office of Operations Division of Payroll, Accounting and Revenue Services Bureau of Financial Reporting and Oil Spill Remediation COMPTROLLER Office of the NEW YORK STATE Comptroller’s Monthly Report on State Funds Cash Basis of Accounting DECEMBER 2020
Transcript of Comptroller's Monthly Report on State Funds Cash Basis of ...
NYS Comptroller
THOMAS P. DiNAPOLI
Office of Operations
Division of Payroll, Accounting and Revenue Services
Bureau of Financial Reporting and Oil Spill Remediation
COMPTROLLEROffice of the NEW YORK STATE
Comptroller’s Monthly Report on State Funds Cash Basis of AccountingDECEMBER 2020
STATE OF NEW YORK THOMAS P. DiNAPOLI OFFICE OF OPERATIONS STATE COMPTROLLER
DIVISION OF PAYROLL, ACCOUNTING AND REVENUE SERVICES BUREAU OF FINANCIAL REPORTING AND OIL SPILL REMEDIATION
COMPTROLLER'S MONTHLY REPORT TO THE LEGISLATURE ON STATE FUNDS - CASH BASIS OF ACCOUNTINGDecember 31, 2020
TABLE OF CONTENTS
Combined Statements of Cash Receipts, Disbursements and Changes in Fund Balances
Exhibit A Governmental Funds 2Exhibit A Supplemental Governmental Funds - State Operating 3Exhibit A Notes Governmental Funds Footnotes 4Exhibit B Proprietary Funds 5Exhibit C Trust Funds 6Exhibit D Governmental Governmental Funds - Budgetary Basis - Financial Plan and Actual - Governmental 7Exhibit D State Operating Governmental Funds - Budgetary Basis - Financial Plan and Actual - State Operating 8Exhibit D General Fund Governmental Funds - Budgetary Basis - Financial Plan and Actual - General Fund 9Exhibit D Special Revenue Governmental Funds - Budgetary Basis - Financial Plan and Actual - Special Revenue 10Exhibit D Special Revenue State/Federal Governmental Funds - Budgetary Basis - Financial Plan and Actual - Special Revenue State and Federal 11Exhibit D Debt Governmental Funds - Budgetary Basis - Financial Plan and Actual - Debt Service 12Exhibit D Capital Projects Governmental Funds - Budgetary Basis - Financial Plan and Actual - Capital Projects 13Exhibit D Capital Projects State/Federal Governmental Funds - Budgetary Basis - Financial Plan and Actual - Capital Projects State and Federal 14Exhibit E Comparative Schedule of Tax Receipts 15Cash Flow - Governmental Governmental Funds - Governmental 16Cash Flow - State Operating Governmental Funds - State Operating 18
Combining Statements of Cash Receipts, Disbursements and Changes in Fund Balances
Exhibit F General Fund - Statement of Cash Flow 20Exhibit G Special Revenue Funds Combined - Statement of Cash Flow 22Exhibit G State Special Revenue Funds State - Statement of Cash Flow 24Exhibit G Federal Special Revenue Funds Federal - Statement of Cash Flow 26Exhibit H Debt Service Funds - Statement of Cash Flow 28Exhibit I Capital Projects Funds Combined - Statement of Cash Flow 29Exhibit I State Capital Projects Funds State - Statement of Cash Flow 31Exhibit I Federal Capital Projects Funds Federal - Statement of Cash Flow 33Exhibit J Enterprise Funds - Statement of Cash Flow 34Exhibit K Internal Service Funds - Statement of Cash Flow 35Exhibit L Pension Trust Funds - Statement of Cash Flow 36Exhibit M Private Purpose Trust Funds - Statement of Cash Flow 37
Supplementary Schedules
Schedule 1 Governmental Funds - Summary of Cash Receipts, Disbursements and Changes in Fund Balances 38Schedule 2 Proprietary Funds - Summary of Cash Receipts, Disbursements and Changes in Fund Balances 41Schedule 3 Fiduciary Funds - Summary of Cash Receipts, Disbursements and Changes in Fund Balances 42Schedule 4 Sole Custody and Investment Accounts - Statement of Cash Receipts and Disbursements 43Schedule 5 Debt Service Funds - Statement of Direct State Debt Activity 44Schedule 5a Debt Service Funds - Financing Agreements 45Schedule 6 Summary of the Operating Fund Investments 46Appendix A HCRA Resources Fund - Statement of Receipts and Disbursements by Account 47Appendix B HCRA Resources Fund - Statement of Program Disbursements 48Appendix C HCRA Public Goods Pool - Statement of Cash Flow 49Appendix D HCRA Medicaid Disproportionate Share - Statement of Cash Flow 50Appendix E Summary of Off-Budget Spending Report 51Appendix F Schedule of Month-End Temporary Loans Outstanding 52Appendix G Dedicated Infrastructure Investment Fund - Statement of Receipts and Disbursements 56Appendix H Medical Assistance Disbursements - State Funds 57Appendix I Medical Assistance Disbursements - Federal Funds 58
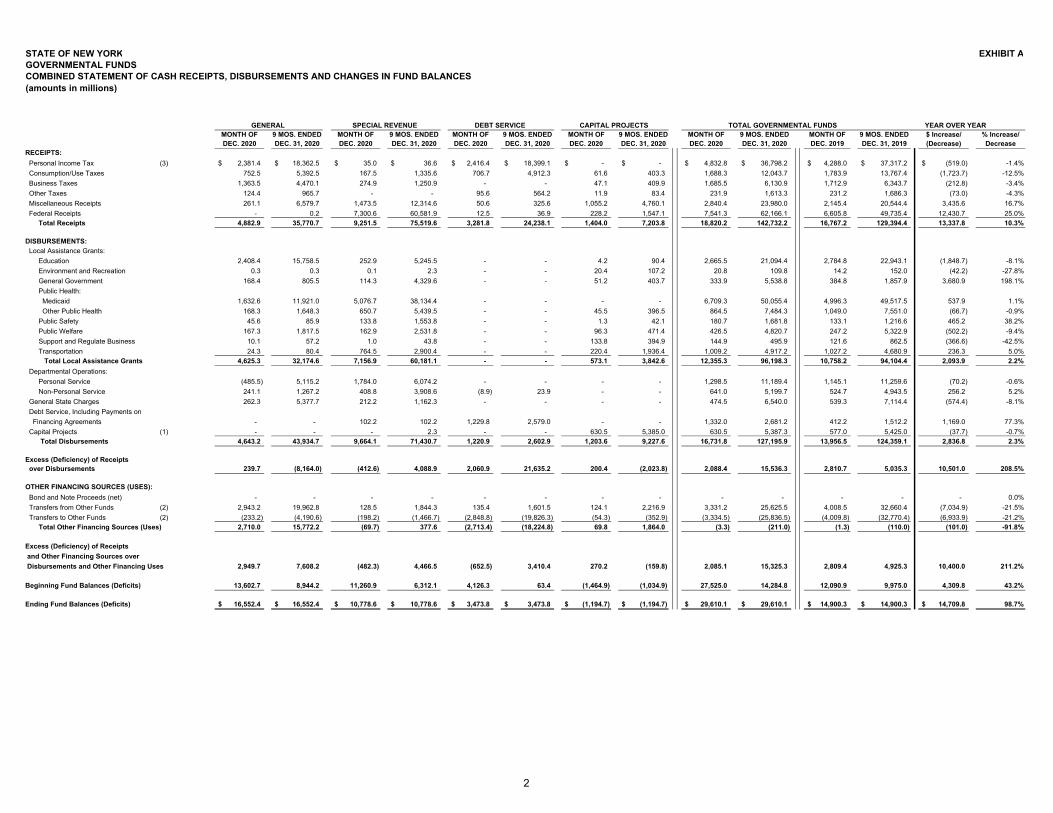
STATE OF NEW YORK EXHIBIT A
GENERAL SPECIAL REVENUE DEBT SERVICE CAPITAL PROJECTS MONTH OF 9 MOS. ENDED MONTH OF 9 MOS. ENDED MONTH OF 9 MOS. ENDED MONTH OF 9 MOS. ENDED MONTH OF 9 MOS. ENDED MONTH OF 9 MOS. ENDED $ Increase/ % Increase/DEC. 2020 DEC. 31, 2020 DEC. 2020 DEC. 31, 2020 DEC. 2020 DEC. 31, 2020 DEC. 2020 DEC. 31, 2020 DEC. 2020 DEC. 31, 2020 DEC. 2019 DEC. 31, 2019 (Decrease) Decrease
RECEIPTS: Personal Income Tax (3) 2,381.4$ 18,362.5$ 35.0$ 36.6$ 2,416.4$ 18,399.1$ -$ -$ 4,832.8$ 36,798.2$ 4,288.0$ 37,317.2$ (519.0)$ -1.4% Consumption/Use Taxes 752.5 5,392.5 167.5 1,335.6 706.7 4,912.3 61.6 403.3 1,688.3 12,043.7 1,783.9 13,767.4 (1,723.7) -12.5% Business Taxes 1,363.5 4,470.1 274.9 1,250.9 - - 47.1 409.9 1,685.5 6,130.9 1,712.9 6,343.7 (212.8) -3.4% Other Taxes 124.4 965.7 - - 95.6 564.2 11.9 83.4 231.9 1,613.3 231.2 1,686.3 (73.0) -4.3% Miscellaneous Receipts 261.1 6,579.7 1,473.5 12,314.6 50.6 325.6 1,055.2 4,760.1 2,840.4 23,980.0 2,145.4 20,544.4 3,435.6 16.7% Federal Receipts - 0.2 7,300.6 60,581.9 12.5 36.9 228.2 1,547.1 7,541.3 62,166.1 6,605.8 49,735.4 12,430.7 25.0% Total Receipts 4,882.9 35,770.7 9,251.5 75,519.6 3,281.8 24,238.1 1,404.0 7,203.8 18,820.2 142,732.2 16,767.2 129,394.4 13,337.8 10.3%
DISBURSEMENTS: Local Assistance Grants: Education 2,408.4 15,758.5 252.9 5,245.5 - - 4.2 90.4 2,665.5 21,094.4 2,784.8 22,943.1 (1,848.7) -8.1% Environment and Recreation 0.3 0.3 0.1 2.3 - - 20.4 107.2 20.8 109.8 14.2 152.0 (42.2) -27.8% General Government 168.4 805.5 114.3 4,329.6 - - 51.2 403.7 333.9 5,538.8 384.8 1,857.9 3,680.9 198.1% Public Health: Medicaid 1,632.6 11,921.0 5,076.7 38,134.4 - - - - 6,709.3 50,055.4 4,996.3 49,517.5 537.9 1.1% Other Public Health 168.3 1,648.3 650.7 5,439.5 - - 45.5 396.5 864.5 7,484.3 1,049.0 7,551.0 (66.7) -0.9% Public Safety 45.6 85.9 133.8 1,553.8 - - 1.3 42.1 180.7 1,681.8 133.1 1,216.6 465.2 38.2% Public Welfare 167.3 1,817.5 162.9 2,531.8 - - 96.3 471.4 426.5 4,820.7 247.2 5,322.9 (502.2) -9.4% Support and Regulate Business 10.1 57.2 1.0 43.8 - - 133.8 394.9 144.9 495.9 121.6 862.5 (366.6) -42.5% Transportation 24.3 80.4 764.5 2,900.4 - - 220.4 1,936.4 1,009.2 4,917.2 1,027.2 4,680.9 236.3 5.0% Total Local Assistance Grants 4,625.3 32,174.6 7,156.9 60,181.1 - - 573.1 3,842.6 12,355.3 96,198.3 10,758.2 94,104.4 2,093.9 2.2% Departmental Operations: Personal Service (485.5) 5,115.2 1,784.0 6,074.2 - - - - 1,298.5 11,189.4 1,145.1 11,259.6 (70.2) -0.6% Non-Personal Service 241.1 1,267.2 408.8 3,908.6 (8.9) 23.9 - - 641.0 5,199.7 524.7 4,943.5 256.2 5.2% General State Charges 262.3 5,377.7 212.2 1,162.3 - - - - 474.5 6,540.0 539.3 7,114.4 (574.4) -8.1% Debt Service, Including Payments on Financing Agreements - - 102.2 102.2 1,229.8 2,579.0 - - 1,332.0 2,681.2 412.2 1,512.2 1,169.0 77.3% Capital Projects (1) - - - 2.3 - - 630.5 5,385.0 630.5 5,387.3 577.0 5,425.0 (37.7) -0.7% Total Disbursements 4,643.2 43,934.7 9,664.1 71,430.7 1,220.9 2,602.9 1,203.6 9,227.6 16,731.8 127,195.9 13,956.5 124,359.1 2,836.8 2.3%
Excess (Deficiency) of Receipts over Disbursements 239.7 (8,164.0) (412.6) 4,088.9 2,060.9 21,635.2 200.4 (2,023.8) 2,088.4 15,536.3 2,810.7 5,035.3 10,501.0 208.5%
OTHER FINANCING SOURCES (USES): Bond and Note Proceeds (net) - - - - - - - - - - - - - 0.0% Transfers from Other Funds (2) 2,943.2 19,962.8 128.5 1,844.3 135.4 1,601.5 124.1 2,216.9 3,331.2 25,625.5 4,008.5 32,660.4 (7,034.9) -21.5% Transfers to Other Funds (2) (233.2) (4,190.6) (198.2) (1,466.7) (2,848.8) (19,826.3) (54.3) (352.9) (3,334.5) (25,836.5) (4,009.8) (32,770.4) (6,933.9) -21.2% Total Other Financing Sources (Uses) 2,710.0 15,772.2 (69.7) 377.6 (2,713.4) (18,224.8) 69.8 1,864.0 (3.3) (211.0) (1.3) (110.0) (101.0) -91.8%
Excess (Deficiency) of Receipts and Other Financing Sources over Disbursements and Other Financing Uses 2,949.7 7,608.2 (482.3) 4,466.5 (652.5) 3,410.4 270.2 (159.8) 2,085.1 15,325.3 2,809.4 4,925.3 10,400.0 211.2%
Beginning Fund Balances (Deficits) 13,602.7 8,944.2 11,260.9 6,312.1 4,126.3 63.4 (1,464.9) (1,034.9) 27,525.0 14,284.8 12,090.9 9,975.0 4,309.8 43.2%
Ending Fund Balances (Deficits) 16,552.4$ 16,552.4$ 10,778.6$ 10,778.6$ 3,473.8$ 3,473.8$ (1,194.7)$ (1,194.7)$ 29,610.1$ 29,610.1$ 14,900.3$ 14,900.3$ 14,709.8$ 98.7%
GOVERNMENTAL FUNDSCOMBINED STATEMENT OF CASH RECEIPTS, DISBURSEMENTS AND CHANGES IN FUND BALANCES (amounts in millions)
TOTAL GOVERNMENTAL FUNDS YEAR OVER YEAR
2

EXHIBIT A SUPPLEMENTAL
(amounts in millions)
GENERAL STATE SPECIAL REVENUE (**) TOTAL STATE OPERATING FUNDS MONTH OF 9 MOS. ENDED MONTH OF 9 MOS. ENDED MONTH OF 9 MOS. ENDED MONTH OF 9 MOS. ENDED MONTH OF 9 MOS. ENDED $ Increase/ % Increase/DEC. 2020 DEC. 31, 2020 DEC. 2020 DEC. 31, 2020 DEC. 2020 DEC. 31, 2020 DEC. 2020 DEC. 31, 2020 DEC. 2019 DEC. 31, 2019 (Decrease) Decrease
RECEIPTS: Personal Income Tax (3) 2,381.4$ 18,362.5$ 35.0$ 36.6$ 2,416.4$ 18,399.1$ 4,832.8$ 36,798.2$ 4,288.0$ 37,317.2$ (519.0)$ -1.4% Consumption/Use Taxes 752.5 5,392.5 167.5 1,335.6 706.7 4,912.3 1,626.7 11,640.4 1,718.1 13,275.3 (1,634.9) -12.3% Business Taxes 1,363.5 4,470.1 274.9 1,250.9 - - 1,638.4 5,721.0 1,658.7 5,828.9 (107.9) -1.9% Other Taxes 124.4 965.7 - - 95.6 564.2 220.0 1,529.9 219.3 1,602.9 (73.0) -4.6% Miscellaneous Receipts 261.1 a 6,579.7 1,463.2 12,165.8 50.6 325.6 1,774.9 19,071.1 1,727.6 16,480.2 2,590.9 15.7% Federal Receipts - 0.2 - 7.2 12.5 36.9 12.5 44.3 - 55.0 (10.7) -19.5% Total Receipts 4,882.9 35,770.7 1,940.6 14,796.1 3,281.8 24,238.1 10,105.3 74,804.9 9,611.7 74,559.5 245.4 0.3%
DISBURSEMENTS: Local Assistance Grants: Education 2,408.4 15,758.5 174.7 3,094.4 - - 2,583.1 18,852.9 2,433.9 20,138.1 (1,285.2) -6.4% Environment and Recreation 0.3 0.3 - 1.8 - - 0.3 2.1 0.7 3.8 (1.7) -44.7% General Government 168.4 805.5 15.7 111.6 - - 184.1 917.1 232.4 1,106.5 (189.4) -17.1% Public Health: Medicaid 1,632.6 11,921.0 490.1 4,170.7 - - 2,122.7 16,091.7 1,734.4 19,299.6 (3,207.9) -16.6% Other Public Health 168.3 1,648.3 95.0 614.5 - - 263.3 2,262.8 382.9 2,412.5 (149.7) -6.2% Public Safety 45.6 85.9 20.4 108.1 - - 66.0 194.0 34.2 275.1 (81.1) -29.5% Public Welfare 167.3 1,817.5 0.9 1.9 - - 168.2 1,819.4 119.2 1,839.9 (20.5) -1.1% Support and Regulate Business 10.1 57.2 0.8 37.6 - - 10.9 94.8 19.0 154.9 (60.1) -38.8% Transportation 24.3 80.4 757.0 2,852.6 - - 781.3 2,933.0 739.5 3,282.3 (349.3) -10.6% Total Local Assistance Grants 4,625.3 32,174.6 1,554.6 10,993.2 - - 6,179.9 43,167.8 5,696.2 48,512.7 (5,344.9) -11.0% Departmental Operations: Personal Service (485.5) 5,115.2 387.5 3,833.0 - - (98.0) 8,948.2 1,092.2 10,771.1 (1,822.9) -16.9% Non-Personal Service 241.1 1,267.2 203.0 1,850.3 (8.9) 23.9 435.2 3,141.4 399.2 3,985.8 (844.4) -21.2% General State Charges 262.3 5,377.7 99.8 678.7 - - 362.1 6,056.4 513.8 6,872.6 (816.2) -11.9% Debt Service, Including Payments on Financing Agreements - - - - 1,229.8 2,579.0 1,229.8 2,579.0 412.2 1,512.2 1,066.8 70.5% Capital Projects - - - - - - - - - - - 0.0% Total Disbursements 4,643.2 43,934.7 2,244.9 17,355.2 1,220.9 2,602.9 8,109.0 63,892.8 8,113.6 71,654.4 (7,761.6) -10.8%
Excess (Deficiency) of Receipts over Disbursements 239.7 (8,164.0) (304.3) (2,559.1) 2,060.9 21,635.2 1,996.3 10,912.1 1,498.1 2,905.1 8,007.0 275.6%
OTHER FINANCING SOURCES (USES): Transfers from Other Funds (2) 2,943.2 19,962.8 138.6 2,394.8 135.4 1,601.5 3,217.2 23,959.1 3,514.4 29,739.8 (5,780.7) -19.4% Transfers to Other Funds (2) (233.2) (4,190.6) (42.5) (233.1) (2,848.8) (19,826.3) (3,124.5) (24,250.0) (3,584.3) (30,983.0) (6,733.0) -21.7% Total Other Financing Sources (Uses) 2,710.0 15,772.2 96.1 2,161.7 (2,713.4) (18,224.8) 92.7 (290.9) (69.9) (1,243.2) 952.3 76.6%
Excess (Deficiency) of Receiptsand Other Financing Sources over Disbursements and Other Financing Uses 2,949.7 7,608.2 (208.2) (397.4) (652.5) 3,410.4 2,089.0 10,621.2 1,428.2 1,661.9 8,959.3 539.1%
Beginning Fund Balances (Deficits) 13,602.7 8,944.2 5,211.5 5,400.7 4,126.3 63.4 22,940.5 14,408.3 12,595.0 12,361.3 2,047.0 16.6%
Ending Fund Balances (Deficits) 16,552.4$ 16,552.4$ 5,003.3$ 5,003.3$ 3,473.8$ 3,473.8$ 25,029.5$ 25,029.5$ 14,023.2$ 14,023.2$ 11,006.3$ 78.5%
(*) State Operating Funds are comprised of the General Fund, State Special Revenue Funds supported by activities from dedicated revenue sources (including operating transfers from Federal Funds) and Debt Service Funds. (**) Eliminations between Special Revenue - State and Federal Funds are not included.
DEBT SERVICE
STATE OF NEW YORKGOVERNMENTAL FUNDS-STATE OPERATING (*)COMBINED STATEMENT OF CASH RECEIPTS, DISBURSEMENTS AND CHANGES IN FUND BALANCES
3
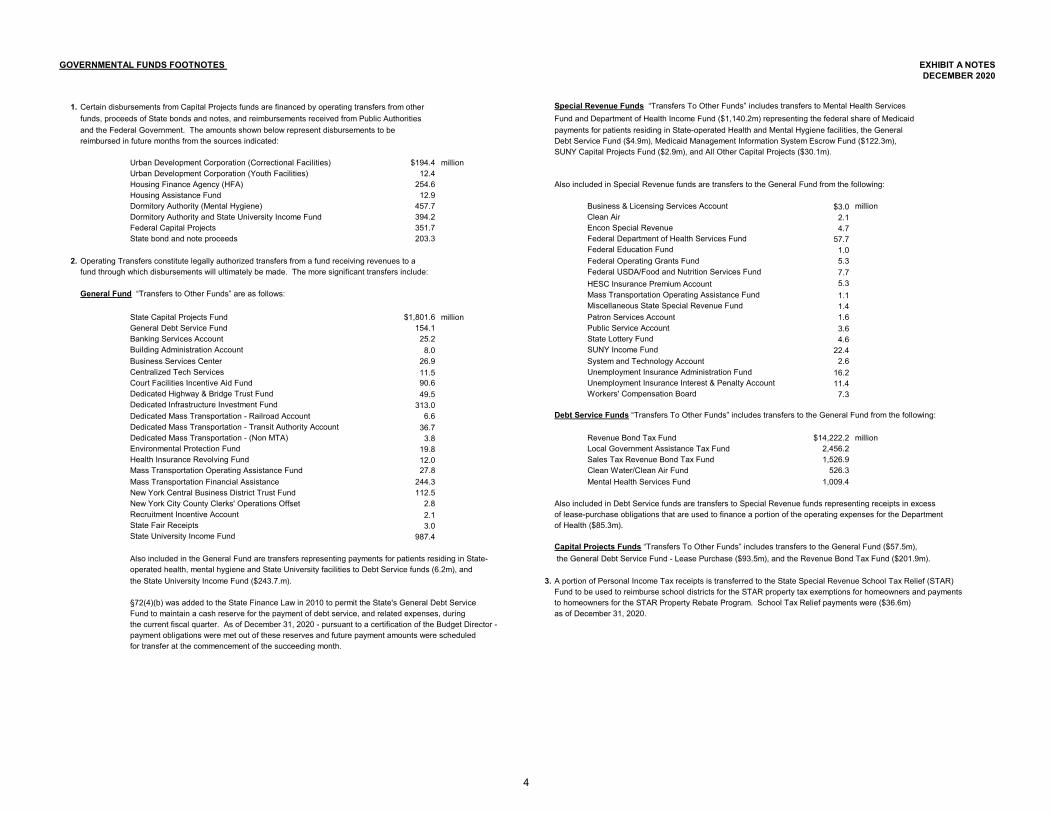
GOVERNMENTAL FUNDS FOOTNOTES EXHIBIT A NOTESDECEMBER 2020
1. Certain disbursements from Capital Projects funds are financed by operating transfers from other Special Revenue Funds “Transfers To Other Funds” includes transfers to Mental Health Services funds, proceeds of State bonds and notes, and reimbursements received from Public Authorities Fund and Department of Health Income Fund ($1,140.2m) representing the federal share of Medicaid and the Federal Government. The amounts shown below represent disbursements to be payments for patients residing in State-operated Health and Mental Hygiene facilities, the Generalreimbursed in future months from the sources indicated: Debt Service Fund ($4.9m), Medicaid Management Information System Escrow Fund ($122.3m),
SUNY Capital Projects Fund ($2.9m), and All Other Capital Projects ($30.1m).Urban Development Corporation (Correctional Facilities) $194.4 millionUrban Development Corporation (Youth Facilities) 12.4Housing Finance Agency (HFA) 254.6 Also included in Special Revenue funds are transfers to the General Fund from the following:Housing Assistance Fund 12.9Dormitory Authority (Mental Hygiene) 457.7 Business & Licensing Services Account $3.0 millionDormitory Authority and State University Income Fund 394.2 Clean Air 2.1Federal Capital Projects 351.7 Encon Special Revenue 4.7State bond and note proceeds 203.3 Federal Department of Health Services Fund 57.7
Federal Education Fund 1.02. Operating Transfers constitute legally authorized transfers from a fund receiving revenues to a Federal Operating Grants Fund 5.3
fund through which disbursements will ultimately be made. The more significant transfers include: Federal USDA/Food and Nutrition Services Fund 7.7HESC Insurance Premium Account 5.3
General Fund “Transfers to Other Funds” are as follows: Mass Transportation Operating Assistance Fund 1.1Miscellaneous State Special Revenue Fund 1.4
State Capital Projects Fund $1,801.6 million Patron Services Account 1.6General Debt Service Fund 154.1 Public Service Account 3.6Banking Services Account 25.2 State Lottery Fund 4.6Building Administration Account 8.0 SUNY Income Fund 22.4Business Services Center 26.9 System and Technology Account 2.6Centralized Tech Services 11.5 Unemployment Insurance Administration Fund 16.2Court Facilities Incentive Aid Fund 90.6 Unemployment Insurance Interest & Penalty Account 11.4Dedicated Highway & Bridge Trust Fund 49.5 Workers' Compensation Board 7.3Dedicated Infrastructure Investment Fund 313.0Dedicated Mass Transportation - Railroad Account 6.6 Debt Service Funds “Transfers To Other Funds” includes transfers to the General Fund from the following:Dedicated Mass Transportation - Transit Authority Account 36.7Dedicated Mass Transportation - (Non MTA) 3.8 Revenue Bond Tax Fund $14,222.2 millionEnvironmental Protection Fund 19.8 Local Government Assistance Tax Fund 2,456.2Health Insurance Revolving Fund 12.0 Sales Tax Revenue Bond Tax Fund 1,526.9Mass Transportation Operating Assistance Fund 27.8 Clean Water/Clean Air Fund 526.3Mass Transportation Financial Assistance 244.3 Mental Health Services Fund 1,009.4New York Central Business District Trust Fund 112.5New York City County Clerks' Operations Offset 2.8 Also included in Debt Service funds are transfers to Special Revenue funds representing receipts in excess Recruitment Incentive Account 2.1 of lease-purchase obligations that are used to finance a portion of the operating expenses for the DepartmentState Fair Receipts 3.0 of Health ($85.3m). State University Income Fund 987.4
Capital Projects Funds “Transfers To Other Funds” includes transfers to the General Fund ($57.5m), Also included in the General Fund are transfers representing payments for patients residing in State- the General Debt Service Fund - Lease Purchase ($93.5m), and the Revenue Bond Tax Fund ($201.9m).operated health, mental hygiene and State University facilities to Debt Service funds (6.2m), and the State University Income Fund ($243.7.m). 3. A portion of Personal Income Tax receipts is transferred to the State Special Revenue School Tax Relief (STAR)
Fund to be used to reimburse school districts for the STAR property tax exemptions for homeowners and payments§72(4)(b) was added to the State Finance Law in 2010 to permit the State's General Debt Service to homeowners for the STAR Property Rebate Program. School Tax Relief payments were ($36.6m) Fund to maintain a cash reserve for the payment of debt service, and related expenses, during as of December 31, 2020.the current fiscal quarter. As of December 31, 2020 - pursuant to a certification of the Budget Director - payment obligations were met out of these reserves and future payment amounts were scheduledfor transfer at the commencement of the succeeding month.
4
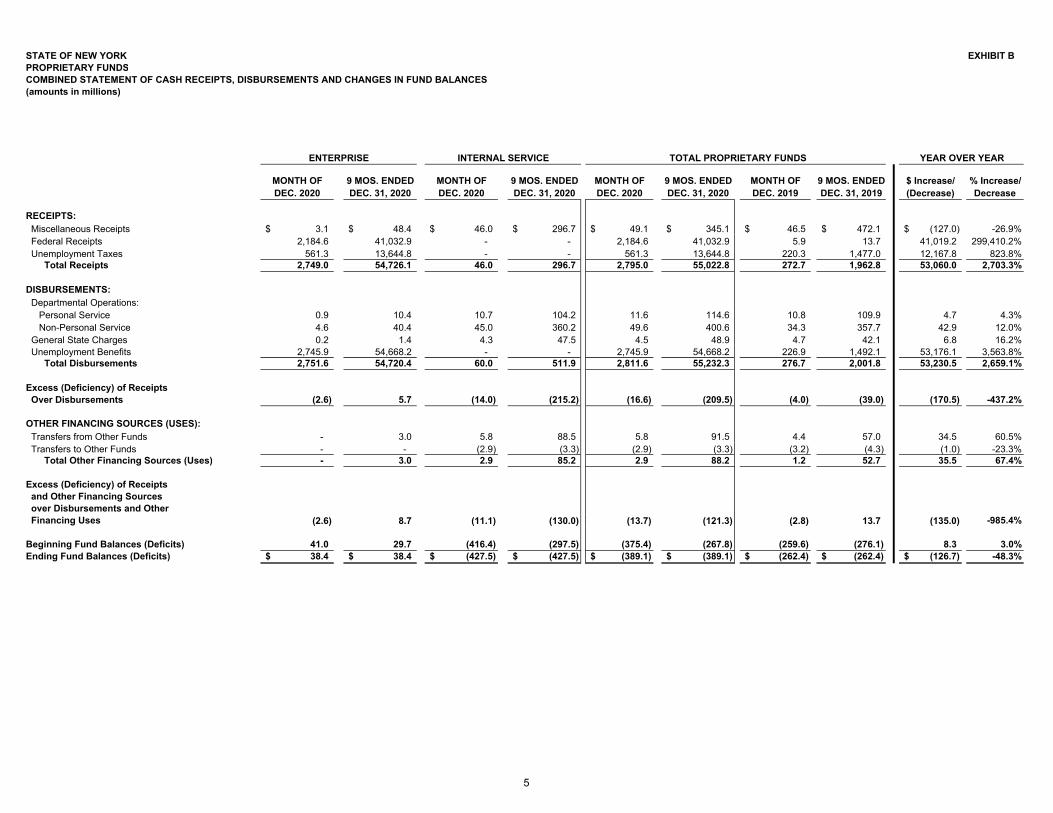
STATE OF NEW YORKPROPRIETARY FUNDSCOMBINED STATEMENT OF CASH RECEIPTS, DISBURSEMENTS AND CHANGES IN FUND BALANCES (amounts in millions)
ENTERPRISE INTERNAL SERVICE TOTAL PROPRIETARY FUNDS YEAR OVER YEAR
MONTH OF 9 MOS. ENDED MONTH OF 9 MOS. ENDED MONTH OF 9 MOS. ENDED MONTH OF 9 MOS. ENDED $ Increase/ % Increase/DEC. 2020 DEC. 31, 2020 DEC. 2020 DEC. 31, 2020 DEC. 2020 DEC. 31, 2020 DEC. 2019 DEC. 31, 2019 (Decrease) Decrease
RECEIPTS: Miscellaneous Receipts 3.1$ 48.4$ 46.0$ 296.7$ 49.1$ 345.1$ 46.5$ 472.1$ (127.0)$ -26.9% Federal Receipts 2,184.6 41,032.9 - - 2,184.6 41,032.9 5.9 13.7 41,019.2 299,410.2% Unemployment Taxes 561.3 13,644.8 - - 561.3 13,644.8 220.3 1,477.0 12,167.8 823.8% Total Receipts 2,749.0 54,726.1 46.0 296.7 2,795.0 55,022.8 272.7 1,962.8 53,060.0 2,703.3%
DISBURSEMENTS: Departmental Operations: Personal Service 0.9 10.4 10.7 104.2 11.6 114.6 10.8 109.9 4.7 4.3% Non-Personal Service 4.6 40.4 45.0 360.2 49.6 400.6 34.3 357.7 42.9 12.0% General State Charges 0.2 1.4 4.3 47.5 4.5 48.9 4.7 42.1 6.8 16.2% Unemployment Benefits 2,745.9 54,668.2 - - 2,745.9 54,668.2 226.9 1,492.1 53,176.1 3,563.8% Total Disbursements 2,751.6 54,720.4 60.0 511.9 2,811.6 55,232.3 276.7 2,001.8 53,230.5 2,659.1%
Excess (Deficiency) of Receipts Over Disbursements (2.6) 5.7 (14.0) (215.2) (16.6) (209.5) (4.0) (39.0) (170.5) -437.2%
OTHER FINANCING SOURCES (USES): Transfers from Other Funds - 3.0 5.8 88.5 5.8 91.5 4.4 57.0 34.5 60.5% Transfers to Other Funds - - (2.9) (3.3) (2.9) (3.3) (3.2) (4.3) (1.0) -23.3% Total Other Financing Sources (Uses) - 3.0 2.9 85.2 2.9 88.2 1.2 52.7 35.5 67.4%
Excess (Deficiency) of Receipts and Other Financing Sources over Disbursements and Other Financing Uses (2.6) 8.7 (11.1) (130.0) (13.7) (121.3) (2.8) 13.7 (135.0) -985.4%
Beginning Fund Balances (Deficits) 41.0 29.7 (416.4) (297.5) (375.4) (267.8) (259.6) (276.1) 8.3 3.0%Ending Fund Balances (Deficits) 38.4$ 38.4$ (427.5)$ (427.5)$ (389.1)$ (389.1)$ (262.4)$ (262.4)$ (126.7)$ -48.3%
EXHIBIT B
5
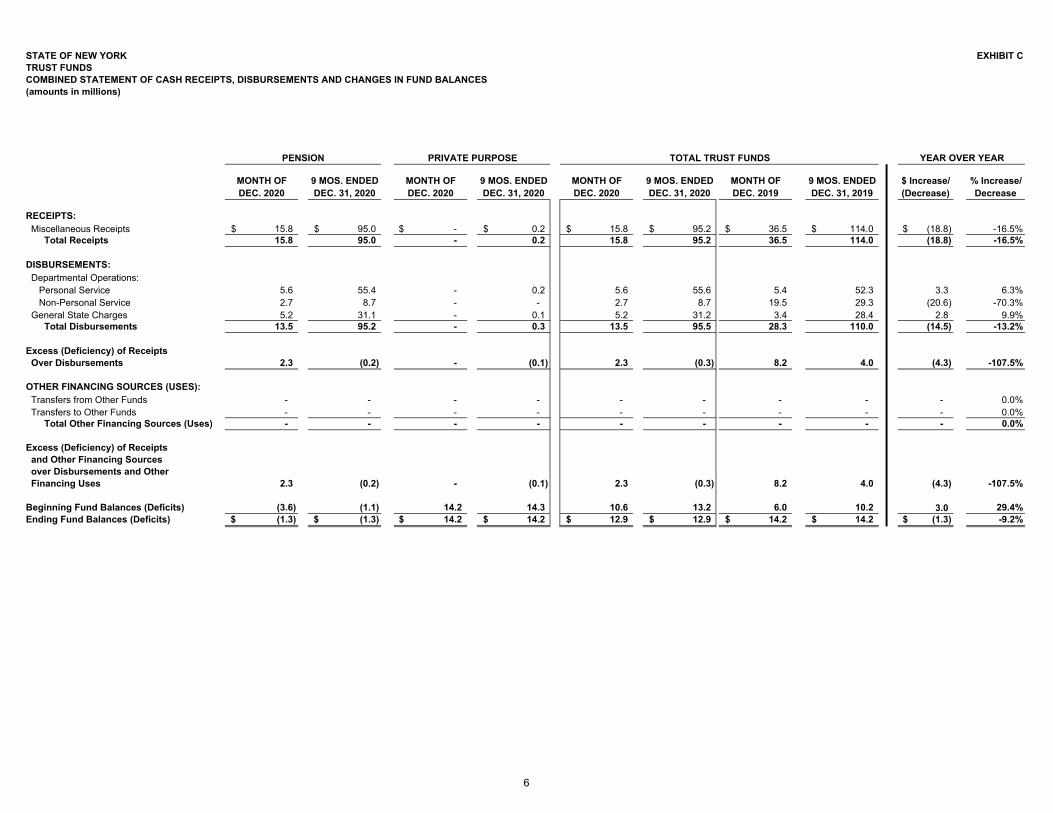
STATE OF NEW YORK EXHIBIT CTRUST FUNDSCOMBINED STATEMENT OF CASH RECEIPTS, DISBURSEMENTS AND CHANGES IN FUND BALANCES (amounts in millions)
PENSION PRIVATE PURPOSE TOTAL TRUST FUNDS
MONTH OF 9 MOS. ENDED MONTH OF 9 MOS. ENDED MONTH OF 9 MOS. ENDED MONTH OF 9 MOS. ENDED $ Increase/ % Increase/DEC. 2020 DEC. 31, 2020 DEC. 2020 DEC. 31, 2020 DEC. 2020 DEC. 31, 2020 DEC. 2019 DEC. 31, 2019 (Decrease) Decrease
RECEIPTS: Miscellaneous Receipts 15.8$ 95.0$ -$ 0.2$ 15.8$ 95.2$ 36.5$ 114.0$ (18.8)$ -16.5% Total Receipts 15.8 95.0 - 0.2 15.8 95.2 36.5 114.0 (18.8) -16.5%
DISBURSEMENTS: Departmental Operations: Personal Service 5.6 55.4 - 0.2 5.6 55.6 5.4 52.3 3.3 6.3% Non-Personal Service 2.7 8.7 - - 2.7 8.7 19.5 29.3 (20.6) -70.3% General State Charges 5.2 31.1 - 0.1 5.2 31.2 3.4 28.4 2.8 9.9% Total Disbursements 13.5 95.2 - 0.3 13.5 95.5 28.3 110.0 (14.5) -13.2%
Excess (Deficiency) of Receipts Over Disbursements 2.3 (0.2) - (0.1) 2.3 (0.3) 8.2 4.0 (4.3) -107.5%
OTHER FINANCING SOURCES (USES): Transfers from Other Funds - - - - - - - - - 0.0% Transfers to Other Funds - - - - - - - - - 0.0% Total Other Financing Sources (Uses) - - - - - - - - - 0.0%
Excess (Deficiency) of Receipts and Other Financing Sources over Disbursements and Other Financing Uses 2.3 (0.2) - (0.1) 2.3 (0.3) 8.2 4.0 (4.3) -107.5%
Beginning Fund Balances (Deficits) (3.6) (1.1) 14.2 14.3 10.6 13.2 6.0 10.2 3.0 29.4%Ending Fund Balances (Deficits) (1.3)$ (1.3)$ 14.2$ 14.2$ 12.9$ 12.9$ 14.2$ 14.2$ (1.3)$ -9.2%
YEAR OVER YEAR
6
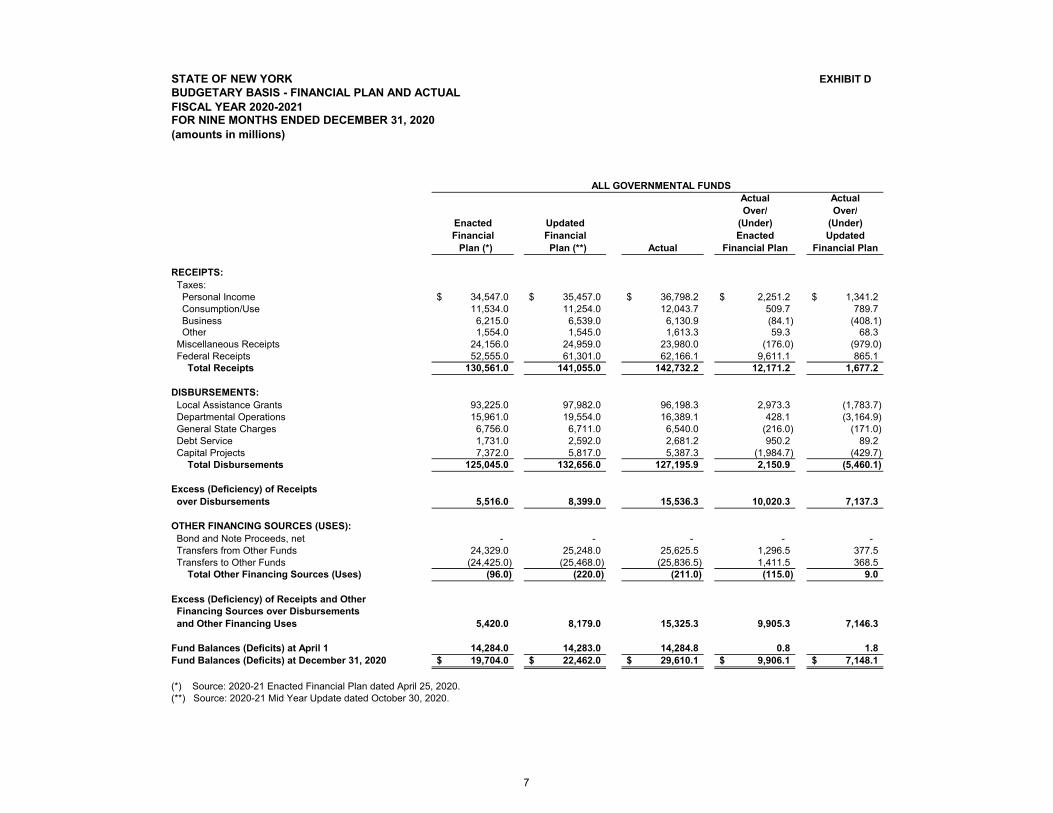
STATE OF NEW YORK EXHIBIT DBUDGETARY BASIS - FINANCIAL PLAN AND ACTUAL
FOR NINE MONTHS ENDED DECEMBER 31, 2020 (amounts in millions)
Actual ActualOver/ Over/
Enacted Updated (Under) (Under)Financial Financial Enacted Updated Plan (*) Plan (**) Actual Financial Plan Financial Plan
RECEIPTS: Taxes: Personal Income 34,547.0$ 35,457.0$ 36,798.2$ 2,251.2$ 1,341.2$ Consumption/Use 11,534.0 11,254.0 12,043.7 509.7 789.7 Business 6,215.0 6,539.0 6,130.9 (84.1) (408.1) Other 1,554.0 1,545.0 1,613.3 59.3 68.3 Miscellaneous Receipts 24,156.0 24,959.0 23,980.0 (176.0) (979.0) Federal Receipts 52,555.0 61,301.0 62,166.1 9,611.1 865.1 Total Receipts 130,561.0 141,055.0 142,732.2 12,171.2 1,677.2
DISBURSEMENTS: Local Assistance Grants 93,225.0 97,982.0 96,198.3 2,973.3 (1,783.7) Departmental Operations 15,961.0 19,554.0 16,389.1 428.1 (3,164.9) General State Charges 6,756.0 6,711.0 6,540.0 (216.0) (171.0) Debt Service 1,731.0 2,592.0 2,681.2 950.2 89.2 Capital Projects 7,372.0 5,817.0 5,387.3 (1,984.7) (429.7) Total Disbursements 125,045.0 132,656.0 127,195.9 2,150.9 (5,460.1)
Excess (Deficiency) of Receipts over Disbursements 5,516.0 8,399.0 15,536.3 10,020.3 7,137.3
OTHER FINANCING SOURCES (USES): Bond and Note Proceeds, net - - - - - Transfers from Other Funds 24,329.0 25,248.0 25,625.5 1,296.5 377.5 Transfers to Other Funds (24,425.0) (25,468.0) (25,836.5) 1,411.5 368.5 Total Other Financing Sources (Uses) (96.0) (220.0) (211.0) (115.0) 9.0
Excess (Deficiency) of Receipts and Other Financing Sources over Disbursements and Other Financing Uses 5,420.0 8,179.0 15,325.3 9,905.3 7,146.3
Fund Balances (Deficits) at April 1 14,284.0 14,283.0 14,284.8 0.8 1.8 Fund Balances (Deficits) at December 31, 2020 19,704.0$ 22,462.0$ 29,610.1$ 9,906.1$ 7,148.1$
(*) Source: 2020-21 Enacted Financial Plan dated April 25, 2020.(**) Source: 2020-21 Mid Year Update dated October 30, 2020.
FISCAL YEAR 2020-2021
ALL GOVERNMENTAL FUNDS
7
STATE OF NEW YORK EXHIBIT DBUDGETARY BASIS - FINANCIAL PLAN AND ACTUAL
FOR NINE MONTHS ENDED DECEMBER 31, 2020 (amounts in millions)
Actual ActualOver/ Over/
Enacted Updated (Under) (Under)Financial Financial Enacted Updated Plan (*) Plan (**) Actual Financial Plan Financial Plan
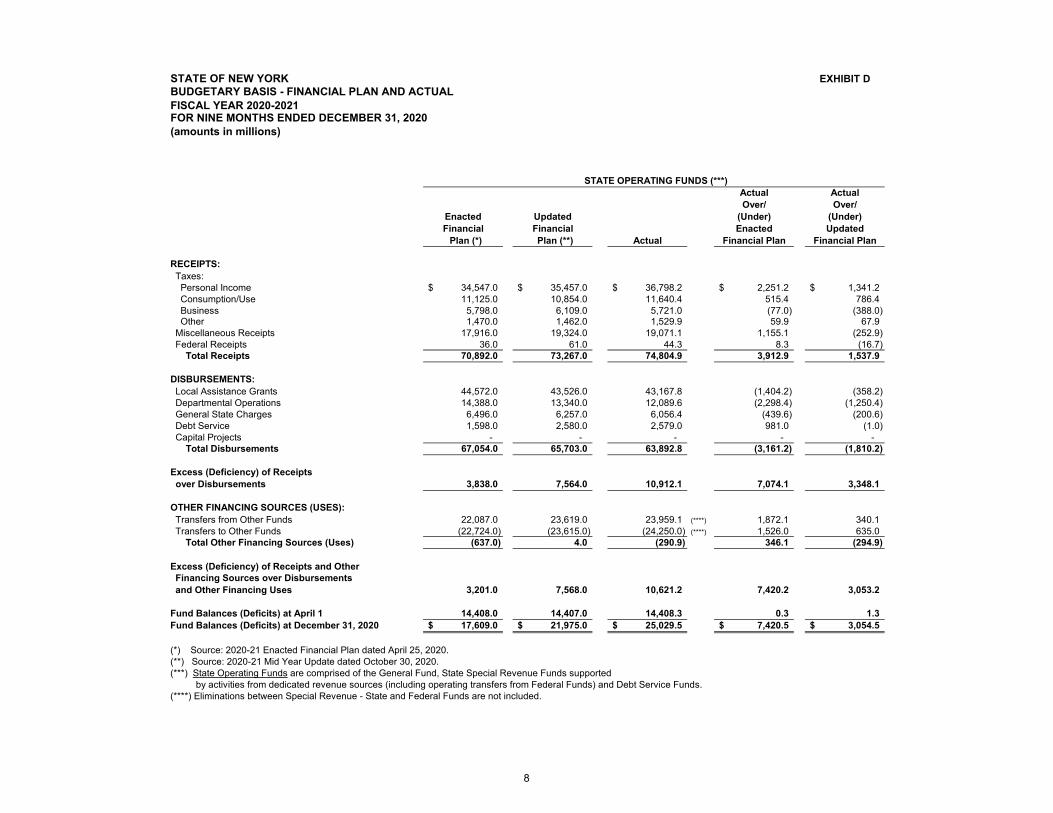
RECEIPTS: Taxes: Personal Income 34,547.0$ 35,457.0$ 36,798.2$ 2,251.2$ 1,341.2$ Consumption/Use 11,125.0 10,854.0 11,640.4 515.4 786.4 Business 5,798.0 6,109.0 5,721.0 (77.0) (388.0) Other 1,470.0 1,462.0 1,529.9 59.9 67.9 Miscellaneous Receipts 17,916.0 19,324.0 19,071.1 1,155.1 (252.9) Federal Receipts 36.0 61.0 44.3 8.3 (16.7) Total Receipts 70,892.0 73,267.0 74,804.9 3,912.9 1,537.9
DISBURSEMENTS: Local Assistance Grants 44,572.0 43,526.0 43,167.8 (1,404.2) (358.2) Departmental Operations 14,388.0 13,340.0 12,089.6 (2,298.4) (1,250.4) General State Charges 6,496.0 6,257.0 6,056.4 (439.6) (200.6) Debt Service 1,598.0 2,580.0 2,579.0 981.0 (1.0) Capital Projects - - - - - Total Disbursements 67,054.0 65,703.0 63,892.8 (3,161.2) (1,810.2)
Excess (Deficiency) of Receipts over Disbursements 3,838.0 7,564.0 10,912.1 7,074.1 3,348.1
OTHER FINANCING SOURCES (USES): Transfers from Other Funds 22,087.0 23,619.0 23,959.1 (****) 1,872.1 340.1 Transfers to Other Funds (22,724.0) (23,615.0) (24,250.0) (****) 1,526.0 635.0 Total Other Financing Sources (Uses) (637.0) 4.0 (290.9) 346.1 (294.9)
Excess (Deficiency) of Receipts and Other Financing Sources over Disbursements and Other Financing Uses 3,201.0 7,568.0 10,621.2 7,420.2 3,053.2
Fund Balances (Deficits) at April 1 14,408.0 14,407.0 14,408.3 0.3 1.3 Fund Balances (Deficits) at December 31, 2020 17,609.0$ 21,975.0$ 25,029.5$ 7,420.5$ 3,054.5$
(*) Source: 2020-21 Enacted Financial Plan dated April 25, 2020.(**) Source: 2020-21 Mid Year Update dated October 30, 2020.(***) State Operating Funds are comprised of the General Fund, State Special Revenue Funds supported by activities from dedicated revenue sources (including operating transfers from Federal Funds) and Debt Service Funds. (****) Eliminations between Special Revenue - State and Federal Funds are not included.
FISCAL YEAR 2020-2021
STATE OPERATING FUNDS (***)
8
STATE OF NEW YORK EXHIBIT DBUDGETARY BASIS - FINANCIAL PLAN AND ACTUAL
FOR NINE MONTHS ENDED DECEMBER 31, 2020 (amounts in millions)
Actual ActualOver/ Over/
Enacted Updated (Under) (Under)Financial Financial Enacted Updated Plan (*) Plan (**) Actual Financial Plan Financial Plan
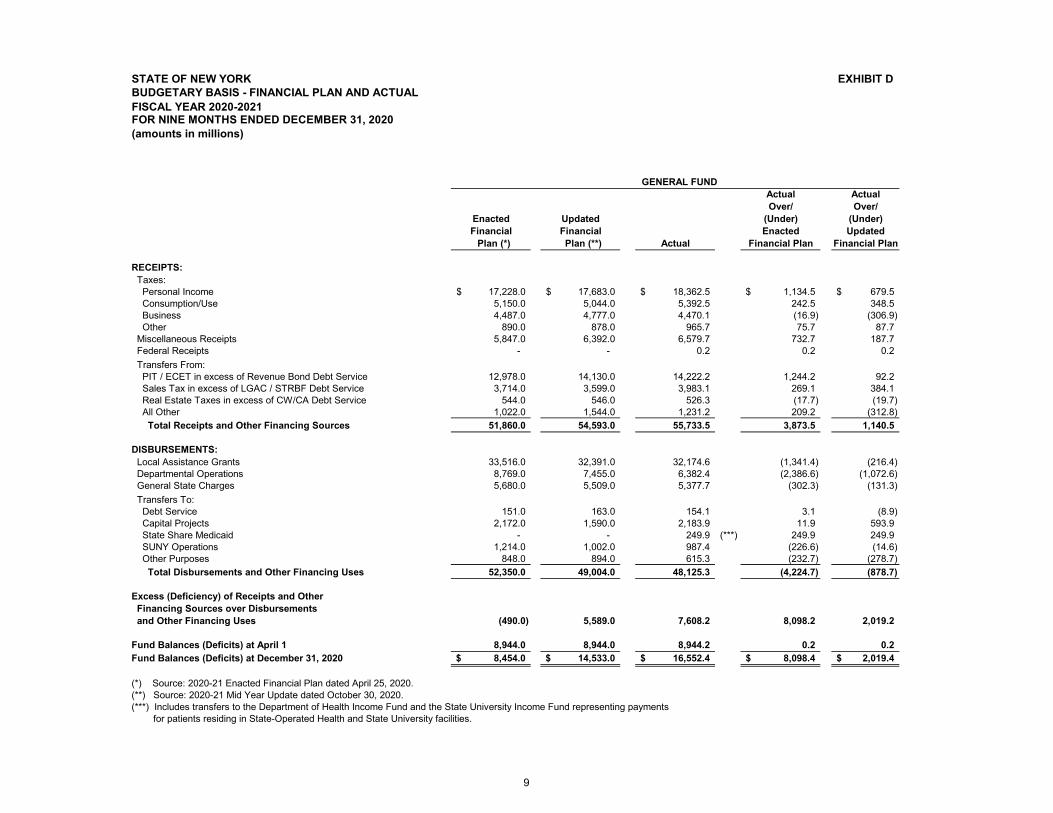
RECEIPTS: Taxes: Personal Income 17,228.0$ 17,683.0$ 18,362.5$ 1,134.5$ 679.5$ Consumption/Use 5,150.0 5,044.0 5,392.5 242.5 348.5 Business 4,487.0 4,777.0 4,470.1 (16.9) (306.9) Other 890.0 878.0 965.7 75.7 87.7 Miscellaneous Receipts 5,847.0 6,392.0 6,579.7 732.7 187.7 Federal Receipts - - 0.2 0.2 0.2 Transfers From: PIT / ECET in excess of Revenue Bond Debt Service 12,978.0 14,130.0 14,222.2 1,244.2 92.2 Sales Tax in excess of LGAC / STRBF Debt Service 3,714.0 3,599.0 3,983.1 269.1 384.1 Real Estate Taxes in excess of CW/CA Debt Service 544.0 546.0 526.3 (17.7) (19.7) All Other 1,022.0 1,544.0 1,231.2 209.2 (312.8) Total Receipts and Other Financing Sources 51,860.0 54,593.0 55,733.5 3,873.5 1,140.5
DISBURSEMENTS: Local Assistance Grants 33,516.0 32,391.0 32,174.6 (1,341.4) (216.4) Departmental Operations 8,769.0 7,455.0 6,382.4 (2,386.6) (1,072.6) General State Charges 5,680.0 5,509.0 5,377.7 (302.3) (131.3) Transfers To: Debt Service 151.0 163.0 154.1 3.1 (8.9) Capital Projects 2,172.0 1,590.0 2,183.9 11.9 593.9 State Share Medicaid - - 249.9 (***) 249.9 249.9 SUNY Operations 1,214.0 1,002.0 987.4 (226.6) (14.6) Other Purposes 848.0 894.0 615.3 (232.7) (278.7) Total Disbursements and Other Financing Uses 52,350.0 49,004.0 48,125.3 (4,224.7) (878.7)
Excess (Deficiency) of Receipts and Other Financing Sources over Disbursements and Other Financing Uses (490.0) 5,589.0 7,608.2 8,098.2 2,019.2
Fund Balances (Deficits) at April 1 8,944.0 8,944.0 8,944.2 0.2 0.2 Fund Balances (Deficits) at December 31, 2020 8,454.0$ 14,533.0$ 16,552.4$ 8,098.4$ 2,019.4$
(*) Source: 2020-21 Enacted Financial Plan dated April 25, 2020.(**) Source: 2020-21 Mid Year Update dated October 30, 2020.(***) Includes transfers to the Department of Health Income Fund and the State University Income Fund representing payments for patients residing in State-Operated Health and State University facilities.
FISCAL YEAR 2020-2021
GENERAL FUND
9
STATE OF NEW YORK EXHIBIT DBUDGETARY BASIS - FINANCIAL PLAN AND ACTUAL
FOR NINE MONTHS ENDED DECEMBER 31, 2020 (amounts in millions)
SPECIAL REVENUE FUNDSActual ActualOver/ Over/
Enacted Updated (Under) (Under)Financial Financial Enacted Updated Plan (*) Plan (**) Actual Eliminations Total Financial Plan Financial Plan
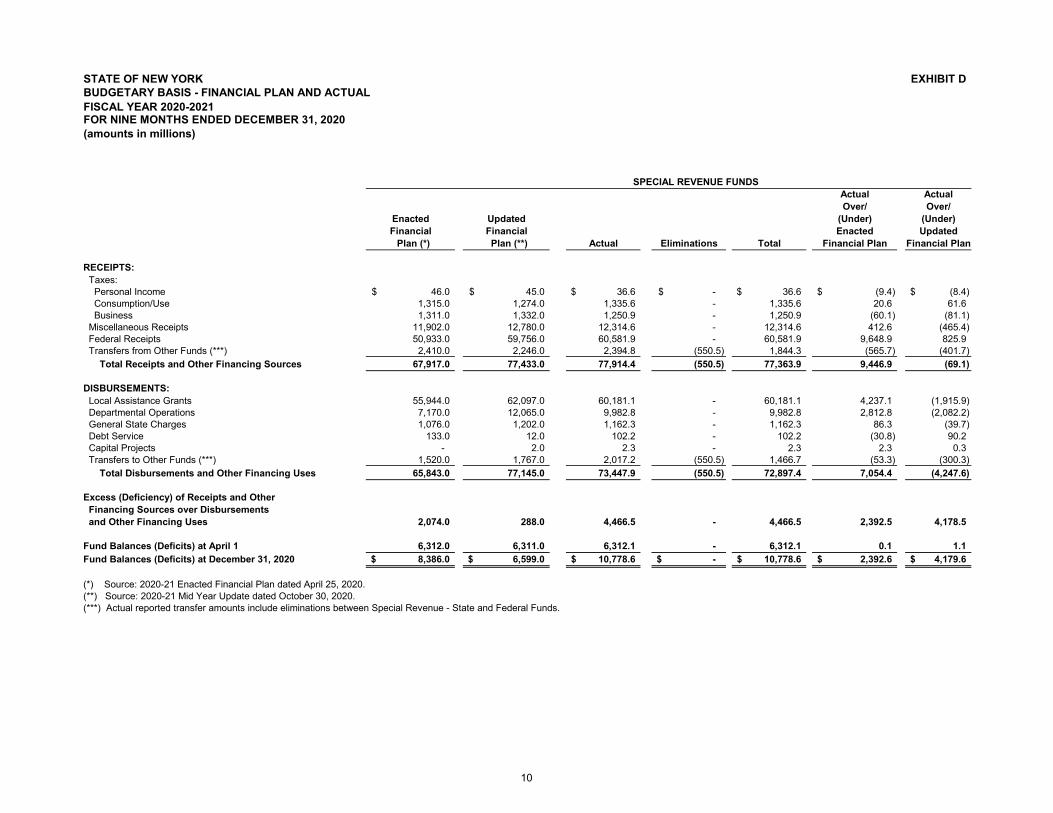
RECEIPTS: Taxes: Personal Income 46.0$ 45.0$ 36.6$ -$ 36.6$ (9.4)$ (8.4)$ Consumption/Use 1,315.0 1,274.0 1,335.6 - 1,335.6 20.6 61.6 Business 1,311.0 1,332.0 1,250.9 - 1,250.9 (60.1) (81.1) Miscellaneous Receipts 11,902.0 12,780.0 12,314.6 - 12,314.6 412.6 (465.4) Federal Receipts 50,933.0 59,756.0 60,581.9 - 60,581.9 9,648.9 825.9 Transfers from Other Funds (***) 2,410.0 2,246.0 2,394.8 (550.5) 1,844.3 (565.7) (401.7) Total Receipts and Other Financing Sources 67,917.0 77,433.0 77,914.4 (550.5) 77,363.9 9,446.9 (69.1)
DISBURSEMENTS: Local Assistance Grants 55,944.0 62,097.0 60,181.1 - 60,181.1 4,237.1 (1,915.9) Departmental Operations 7,170.0 12,065.0 9,982.8 - 9,982.8 2,812.8 (2,082.2) General State Charges 1,076.0 1,202.0 1,162.3 - 1,162.3 86.3 (39.7) Debt Service 133.0 12.0 102.2 - 102.2 (30.8) 90.2 Capital Projects - 2.0 2.3 - 2.3 2.3 0.3 Transfers to Other Funds (***) 1,520.0 1,767.0 2,017.2 (550.5) 1,466.7 (53.3) (300.3) Total Disbursements and Other Financing Uses 65,843.0 77,145.0 73,447.9 (550.5) 72,897.4 7,054.4 (4,247.6)
Excess (Deficiency) of Receipts and Other Financing Sources over Disbursements and Other Financing Uses 2,074.0 288.0 4,466.5 - 4,466.5 2,392.5 4,178.5
Fund Balances (Deficits) at April 1 6,312.0 6,311.0 6,312.1 - 6,312.1 0.1 1.1 Fund Balances (Deficits) at December 31, 2020 8,386.0$ 6,599.0$ 10,778.6$ -$ 10,778.6$ 2,392.6$ 4,179.6$
(*) Source: 2020-21 Enacted Financial Plan dated April 25, 2020.(**) Source: 2020-21 Mid Year Update dated October 30, 2020.(***) Actual reported transfer amounts include eliminations between Special Revenue - State and Federal Funds.
FISCAL YEAR 2020-2021
10
STATE OF NEW YORK EXHIBIT DBUDGETARY BASIS - FINANCIAL PLAN AND ACTUAL
FOR NINE MONTHS ENDED DECEMBER 31, 2020 (amounts in millions)
Actual Actual Actual ActualOver/ Over/ Over/ Over/
Enacted Updated (Under) (Under) Enacted Updated (Under) (Under)Financial Financial Enacted Updated Financial Financial Enacted Updated Plan (*) Plan (**) Actual Financial Plan Financial Plan Plan (*) Plan (**) Actual Financial Plan Financial Plan
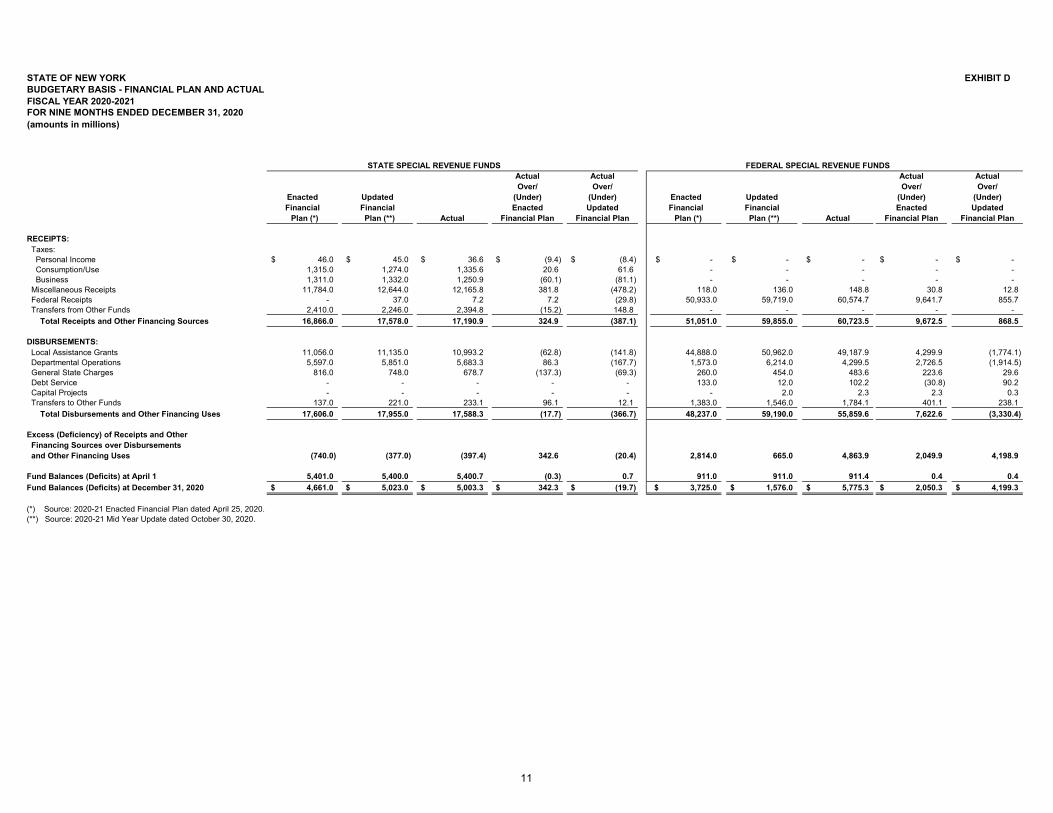
RECEIPTS: Taxes: Personal Income 46.0$ 45.0$ 36.6$ (9.4)$ (8.4)$ -$ -$ -$ -$ -$ Consumption/Use 1,315.0 1,274.0 1,335.6 20.6 61.6 - - - - - Business 1,311.0 1,332.0 1,250.9 (60.1) (81.1) - - - - - Miscellaneous Receipts 11,784.0 12,644.0 12,165.8 381.8 (478.2) 118.0 136.0 148.8 30.8 12.8 Federal Receipts - 37.0 7.2 7.2 (29.8) 50,933.0 59,719.0 60,574.7 9,641.7 855.7 Transfers from Other Funds 2,410.0 2,246.0 2,394.8 (15.2) 148.8 - - - - - Total Receipts and Other Financing Sources 16,866.0 17,578.0 17,190.9 324.9 (387.1) 51,051.0 59,855.0 60,723.5 9,672.5 868.5
DISBURSEMENTS: Local Assistance Grants 11,056.0 11,135.0 10,993.2 (62.8) (141.8) 44,888.0 50,962.0 49,187.9 4,299.9 (1,774.1) Departmental Operations 5,597.0 5,851.0 5,683.3 86.3 (167.7) 1,573.0 6,214.0 4,299.5 2,726.5 (1,914.5) General State Charges 816.0 748.0 678.7 (137.3) (69.3) 260.0 454.0 483.6 223.6 29.6 Debt Service - - - - - 133.0 12.0 102.2 (30.8) 90.2 Capital Projects - - - - - - 2.0 2.3 2.3 0.3 Transfers to Other Funds 137.0 221.0 233.1 96.1 12.1 1,383.0 1,546.0 1,784.1 401.1 238.1 Total Disbursements and Other Financing Uses 17,606.0 17,955.0 17,588.3 (17.7) (366.7) 48,237.0 59,190.0 55,859.6 7,622.6 (3,330.4)
Excess (Deficiency) of Receipts and Other Financing Sources over Disbursements and Other Financing Uses (740.0) (377.0) (397.4) 342.6 (20.4) 2,814.0 665.0 4,863.9 2,049.9 4,198.9
Fund Balances (Deficits) at April 1 5,401.0 5,400.0 5,400.7 (0.3) 0.7 911.0 911.0 911.4 0.4 0.4 Fund Balances (Deficits) at December 31, 2020 4,661.0$ 5,023.0$ 5,003.3$ 342.3$ (19.7)$ 3,725.0$ 1,576.0$ 5,775.3$ 2,050.3$ 4,199.3$
(*) Source: 2020-21 Enacted Financial Plan dated April 25, 2020.(**) Source: 2020-21 Mid Year Update dated October 30, 2020.
FISCAL YEAR 2020-2021
STATE SPECIAL REVENUE FUNDS FEDERAL SPECIAL REVENUE FUNDS
11
STATE OF NEW YORK EXHIBIT DBUDGETARY BASIS - FINANCIAL PLAN AND ACTUAL
FOR NINE MONTHS ENDED DECEMBER 31, 2020 (amounts in millions)
Actual ActualOver/ Over/
Enacted Updated (Under) (Under)Financial Financial Enacted Updated Plan (*) Plan (**) Actual Financial Plan Financial Plan
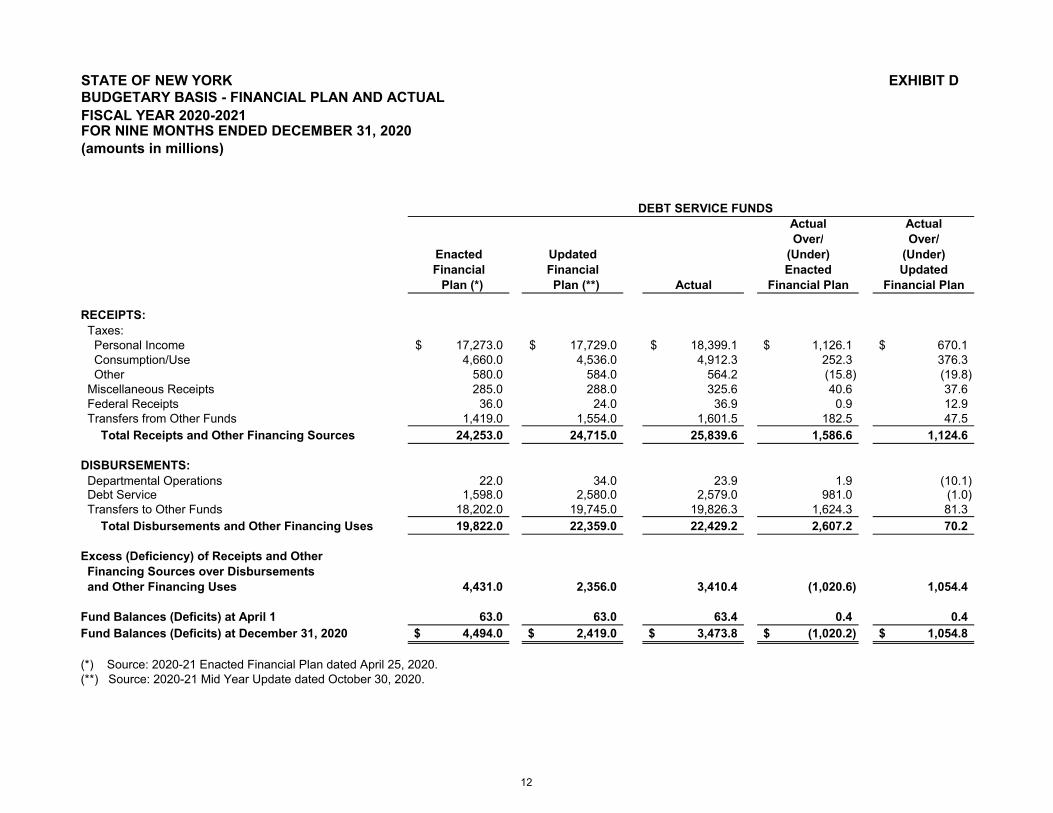
RECEIPTS: Taxes: Personal Income 17,273.0$ 17,729.0$ 18,399.1$ 1,126.1$ 670.1$ Consumption/Use 4,660.0 4,536.0 4,912.3 252.3 376.3 Other 580.0 584.0 564.2 (15.8) (19.8) Miscellaneous Receipts 285.0 288.0 325.6 40.6 37.6 Federal Receipts 36.0 24.0 36.9 0.9 12.9 Transfers from Other Funds 1,419.0 1,554.0 1,601.5 182.5 47.5 Total Receipts and Other Financing Sources 24,253.0 24,715.0 25,839.6 1,586.6 1,124.6
DISBURSEMENTS: Departmental Operations 22.0 34.0 23.9 1.9 (10.1) Debt Service 1,598.0 2,580.0 2,579.0 981.0 (1.0) Transfers to Other Funds 18,202.0 19,745.0 19,826.3 1,624.3 81.3 Total Disbursements and Other Financing Uses 19,822.0 22,359.0 22,429.2 2,607.2 70.2
Excess (Deficiency) of Receipts and Other Financing Sources over Disbursements and Other Financing Uses 4,431.0 2,356.0 3,410.4 (1,020.6) 1,054.4
Fund Balances (Deficits) at April 1 63.0 63.0 63.4 0.4 0.4 Fund Balances (Deficits) at December 31, 2020 4,494.0$ 2,419.0$ 3,473.8$ (1,020.2)$ 1,054.8$
(*) Source: 2020-21 Enacted Financial Plan dated April 25, 2020.(**) Source: 2020-21 Mid Year Update dated October 30, 2020.
DEBT SERVICE FUNDS
FISCAL YEAR 2020-2021
12
STATE OF NEW YORK EXHIBIT DBUDGETARY BASIS - FINANCIAL PLAN AND ACTUAL
FOR NINE MONTHS ENDED DECEMBER 31, 2020 (amounts in millions)
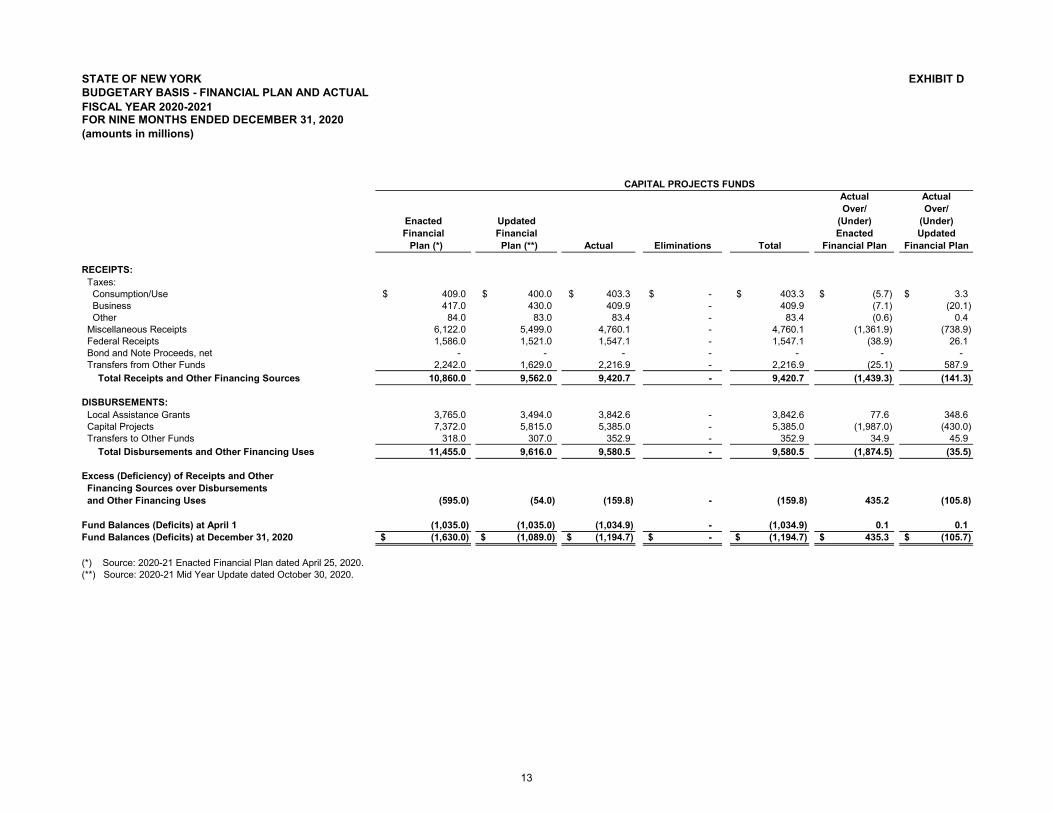
CAPITAL PROJECTS FUNDSActual ActualOver/ Over/
Enacted Updated (Under) (Under)Financial Financial Enacted Updated Plan (*) Plan (**) Actual Eliminations Total Financial Plan Financial Plan
RECEIPTS: Taxes: Consumption/Use 409.0$ 400.0$ 403.3$ -$ 403.3$ (5.7)$ 3.3$ Business 417.0 430.0 409.9 - 409.9 (7.1) (20.1) Other 84.0 83.0 83.4 - 83.4 (0.6) 0.4 Miscellaneous Receipts 6,122.0 5,499.0 4,760.1 - 4,760.1 (1,361.9) (738.9) Federal Receipts 1,586.0 1,521.0 1,547.1 - 1,547.1 (38.9) 26.1 Bond and Note Proceeds, net - - - - - - - Transfers from Other Funds 2,242.0 1,629.0 2,216.9 - 2,216.9 (25.1) 587.9 Total Receipts and Other Financing Sources 10,860.0 9,562.0 9,420.7 - 9,420.7 (1,439.3) (141.3)
DISBURSEMENTS: Local Assistance Grants 3,765.0 3,494.0 3,842.6 - 3,842.6 77.6 348.6 Capital Projects 7,372.0 5,815.0 5,385.0 - 5,385.0 (1,987.0) (430.0) Transfers to Other Funds 318.0 307.0 352.9 - 352.9 34.9 45.9 Total Disbursements and Other Financing Uses 11,455.0 9,616.0 9,580.5 - 9,580.5 (1,874.5) (35.5)
Excess (Deficiency) of Receipts and Other Financing Sources over Disbursements and Other Financing Uses (595.0) (54.0) (159.8) - (159.8) 435.2 (105.8)
Fund Balances (Deficits) at April 1 (1,035.0) (1,035.0) (1,034.9) - (1,034.9) 0.1 0.1 Fund Balances (Deficits) at December 31, 2020 (1,630.0)$ (1,089.0)$ (1,194.7)$ -$ (1,194.7)$ 435.3$ (105.7)$
(*) Source: 2020-21 Enacted Financial Plan dated April 25, 2020.(**) Source: 2020-21 Mid Year Update dated October 30, 2020.
FISCAL YEAR 2020-2021
13
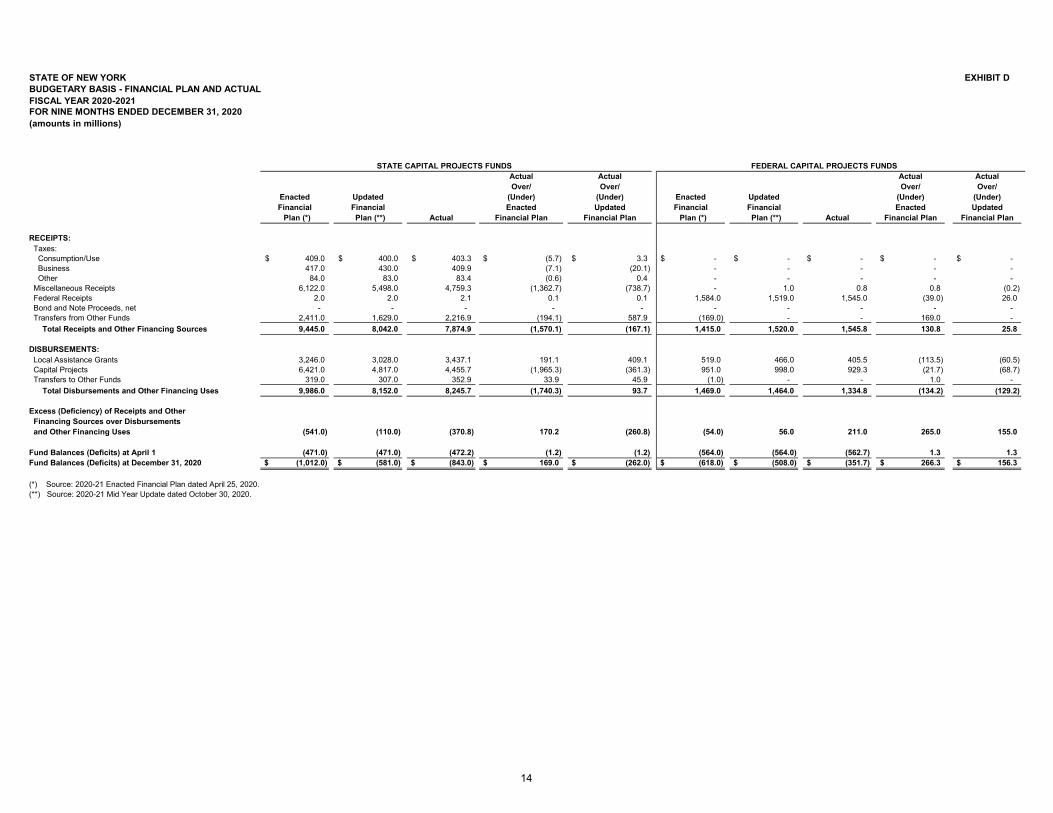
STATE OF NEW YORK EXHIBIT DBUDGETARY BASIS - FINANCIAL PLAN AND ACTUAL
FOR NINE MONTHS ENDED DECEMBER 31, 2020 (amounts in millions)
Actual Actual Actual ActualOver/ Over/ Over/ Over/
Enacted Updated (Under) (Under) Enacted Updated (Under) (Under)Financial Financial Enacted Updated Financial Financial Enacted Updated Plan (*) Plan (**) Actual Financial Plan Financial Plan Plan (*) Plan (**) Actual Financial Plan Financial Plan
RECEIPTS: Taxes: Consumption/Use 409.0$ 400.0$ 403.3$ (5.7)$ 3.3$ -$ -$ -$ -$ -$ Business 417.0 430.0 409.9 (7.1) (20.1) - - - - - Other 84.0 83.0 83.4 (0.6) 0.4 - - - - - Miscellaneous Receipts 6,122.0 5,498.0 4,759.3 (1,362.7) (738.7) - 1.0 0.8 0.8 (0.2) Federal Receipts 2.0 2.0 2.1 0.1 0.1 1,584.0 1,519.0 1,545.0 (39.0) 26.0 Bond and Note Proceeds, net - - - - - - - - - - Transfers from Other Funds 2,411.0 1,629.0 2,216.9 (194.1) 587.9 (169.0) - - 169.0 - Total Receipts and Other Financing Sources 9,445.0 8,042.0 7,874.9 (1,570.1) (167.1) 1,415.0 1,520.0 1,545.8 130.8 25.8
DISBURSEMENTS: Local Assistance Grants 3,246.0 3,028.0 3,437.1 191.1 409.1 519.0 466.0 405.5 (113.5) (60.5) Capital Projects 6,421.0 4,817.0 4,455.7 (1,965.3) (361.3) 951.0 998.0 929.3 (21.7) (68.7) Transfers to Other Funds 319.0 307.0 352.9 33.9 45.9 (1.0) - - 1.0 - Total Disbursements and Other Financing Uses 9,986.0 8,152.0 8,245.7 (1,740.3) 93.7 1,469.0 1,464.0 1,334.8 (134.2) (129.2)
Excess (Deficiency) of Receipts and Other Financing Sources over Disbursements and Other Financing Uses (541.0) (110.0) (370.8) 170.2 (260.8) (54.0) 56.0 211.0 265.0 155.0
Fund Balances (Deficits) at April 1 (471.0) (471.0) (472.2) (1.2) (1.2) (564.0) (564.0) (562.7) 1.3 1.3 Fund Balances (Deficits) at December 31, 2020 (1,012.0)$ (581.0)$ (843.0)$ 169.0$ (262.0)$ (618.0)$ (508.0)$ (351.7)$ 266.3$ 156.3$
(*) Source: 2020-21 Enacted Financial Plan dated April 25, 2020.(**) Source: 2020-21 Mid Year Update dated October 30, 2020.
FISCAL YEAR 2020-2021
STATE CAPITAL PROJECTS FUNDS FEDERAL CAPITAL PROJECTS FUNDS
14
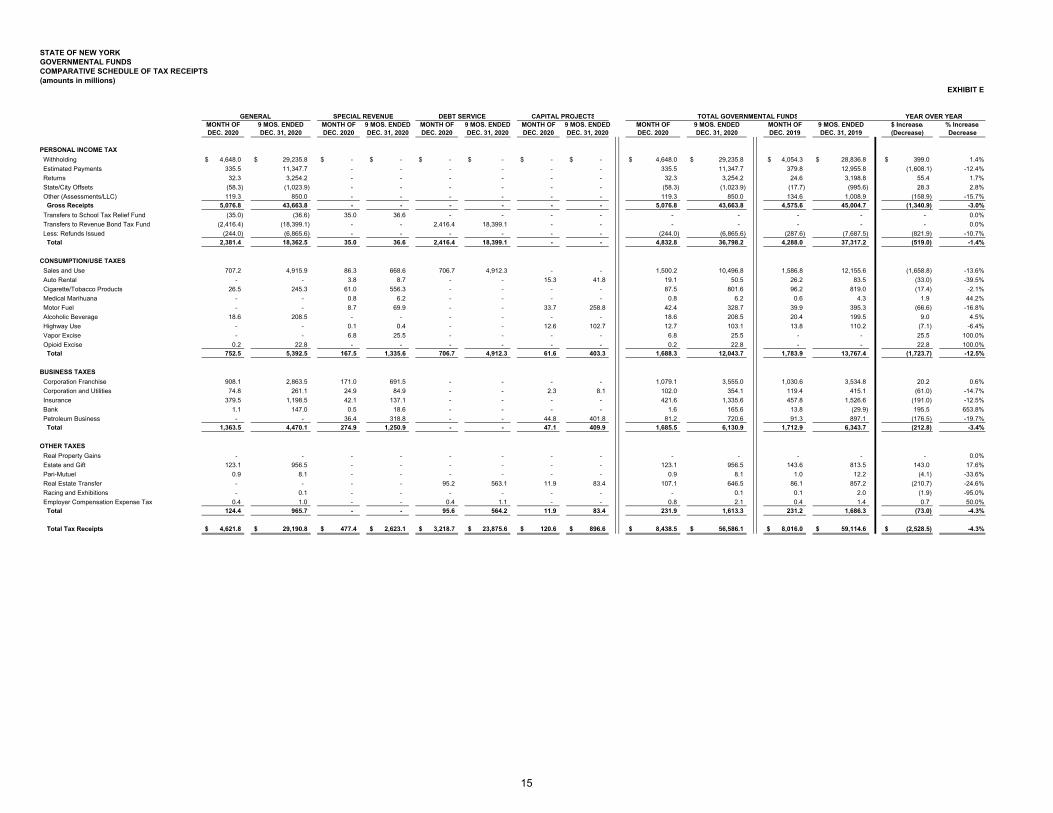
STATE OF NEW YORKGOVERNMENTAL FUNDSCOMPARATIVE SCHEDULE OF TAX RECEIPTS (amounts in millions)
EXHIBIT E
GENERAL SPECIAL REVENUE DEBT SERVICE CAPITAL PROJECTS TOTAL GOVERNMENTAL FUNDS YEAR OVER YEARMONTH OF 9 MOS. ENDED MONTH OF 9 MOS. ENDED MONTH OF 9 MOS. ENDED MONTH OF 9 MOS. ENDED MONTH OF 9 MOS. ENDED MONTH OF 9 MOS. ENDED $ Increase/ % Increase/DEC. 2020 DEC. 31, 2020 DEC. 2020 DEC. 31, 2020 DEC. 2020 DEC. 31, 2020 DEC. 2020 DEC. 31, 2020 DEC. 2020 DEC. 31, 2020 DEC. 2019 DEC. 31, 2019 (Decrease) Decrease
PERSONAL INCOME TAX Withholding 4,648.0$ 29,235.8$ -$ -$ -$ -$ -$ -$ 4,648.0$ 29,235.8$ 4,054.3$ 28,836.8$ 399.0$ 1.4% Estimated Payments 335.5 11,347.7 - - - - - - 335.5 11,347.7 379.8 12,955.8 (1,608.1) -12.4% Returns 32.3 3,254.2 - - - - - - 32.3 3,254.2 24.6 3,198.8 55.4 1.7% State/City Offsets (58.3) (1,023.9) - - - - - - (58.3) (1,023.9) (17.7) (995.6) 28.3 2.8% Other (Assessments/LLC) 119.3 850.0 - - - - - - 119.3 850.0 134.6 1,008.9 (158.9) -15.7% Gross Receipts 5,076.8 43,663.8 - - - - - - 5,076.8 43,663.8 4,575.6 45,004.7 (1,340.9) -3.0% Transfers to School Tax Relief Fund (35.0) (36.6) 35.0 36.6 - - - - - - - - - 0.0% Transfers to Revenue Bond Tax Fund (2,416.4) (18,399.1) - - 2,416.4 18,399.1 - - - - - - - 0.0% Less: Refunds Issued (244.0) (6,865.6) - - - - - - (244.0) (6,865.6) (287.6) (7,687.5) (821.9) -10.7% Total 2,381.4 18,362.5 35.0 36.6 2,416.4 18,399.1 - - 4,832.8 36,798.2 4,288.0 37,317.2 (519.0) -1.4%
CONSUMPTION/USE TAXES Sales and Use 707.2 4,915.9 86.3 668.6 706.7 4,912.3 - - 1,500.2 10,496.8 1,586.8 12,155.6 (1,658.8) -13.6% Auto Rental - - 3.8 8.7 - - 15.3 41.8 19.1 50.5 26.2 83.5 (33.0) -39.5% Cigarette/Tobacco Products 26.5 245.3 61.0 556.3 - - - - 87.5 801.6 96.2 819.0 (17.4) -2.1% Medical Marihuana - - 0.8 6.2 - - - - 0.8 6.2 0.6 4.3 1.9 44.2% Motor Fuel - - 8.7 69.9 - - 33.7 258.8 42.4 328.7 39.9 395.3 (66.6) -16.8% Alcoholic Beverage 18.6 208.5 - - - - - - 18.6 208.5 20.4 199.5 9.0 4.5% Highway Use - - 0.1 0.4 - - 12.6 102.7 12.7 103.1 13.8 110.2 (7.1) -6.4% Vapor Excise - - 6.8 25.5 - - - - 6.8 25.5 - - 25.5 100.0% Opioid Excise 0.2 22.8 - - - - - - 0.2 22.8 - - 22.8 100.0% Total 752.5 5,392.5 167.5 1,335.6 706.7 4,912.3 61.6 403.3 1,688.3 12,043.7 1,783.9 13,767.4 (1,723.7) -12.5%
BUSINESS TAXES Corporation Franchise 908.1 2,863.5 171.0 691.5 - - - - 1,079.1 3,555.0 1,030.6 3,534.8 20.2 0.6% Corporation and Utilities 74.8 261.1 24.9 84.9 - - 2.3 8.1 102.0 354.1 119.4 415.1 (61.0) -14.7% Insurance 379.5 1,198.5 42.1 137.1 - - - - 421.6 1,335.6 457.8 1,526.6 (191.0) -12.5% Bank 1.1 147.0 0.5 18.6 - - - - 1.6 165.6 13.8 (29.9) 195.5 653.8% Petroleum Business - - 36.4 318.8 - - 44.8 401.8 81.2 720.6 91.3 897.1 (176.5) -19.7% Total 1,363.5 4,470.1 274.9 1,250.9 - - 47.1 409.9 1,685.5 6,130.9 1,712.9 6,343.7 (212.8) -3.4%
OTHER TAXES Real Property Gains - - - - - - - - - - - - - 0.0% Estate and Gift 123.1 956.5 - - - - - - 123.1 956.5 143.6 813.5 143.0 17.6% Pari-Mutuel 0.9 8.1 - - - - - - 0.9 8.1 1.0 12.2 (4.1) -33.6% Real Estate Transfer - - - - 95.2 563.1 11.9 83.4 107.1 646.5 86.1 857.2 (210.7) -24.6% Racing and Exhibitions - 0.1 - - - - - - - 0.1 0.1 2.0 (1.9) -95.0% Employer Compensation Expense Tax 0.4 1.0 - - 0.4 1.1 - - 0.8 2.1 0.4 1.4 0.7 50.0% Total 124.4 965.7 - - 95.6 564.2 11.9 83.4 231.9 1,613.3 231.2 1,686.3 (73.0) -4.3%
Total Tax Receipts 4,621.8$ 29,190.8$ 477.4$ 2,623.1$ 3,218.7$ 23,875.6$ 120.6$ 896.6$ 8,438.5$ 56,586.1$ 8,016.0$ 59,114.6$ (2,528.5)$ -4.3%
15

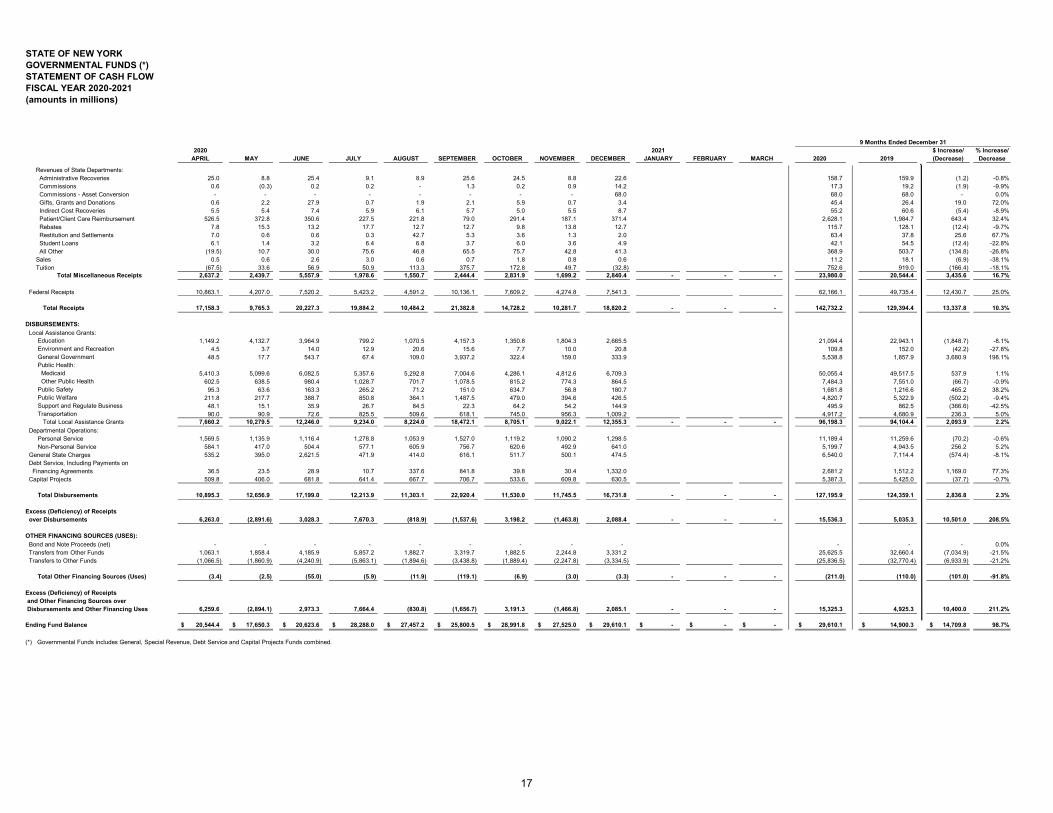
STATE OF NEW YORKGOVERNMENTAL FUNDS (*)
STATEMENT OF CASH FLOW FISCAL YEAR 2020-2021 (amounts in millions)
2020 2021 $ Increase/ % Increase/APRIL MAY JUNE JULY AUGUST SEPTEMBER OCTOBER NOVEMBER DECEMBER JANUARY FEBRUARY MARCH 2020 2019 (Decrease) Decrease
Beginning Fund Balance 14,284.8$ 20,544.4$ 17,650.3$ 20,623.6$ 28,288.0$ 27,457.2$ 25,800.5$ 28,991.8$ 27,525.0$ 14,284.8$ 9,975.0$ 4,309.8$ 43.2%
RECEIPTS: Taxes: Personal Income Tax: Withholdings 3,187.3 2,928.3 3,096.3 3,400.3 2,876.6 3,147.2 2,919.5 3,032.3 4,648.0 29,235.8 28,836.8 399.0 1.4% Estimated Payments 211.6 70.9 1,493.0 6,329.0 121.3 2,510.0 176.8 99.6 335.5 11,347.7 12,955.8 (1,608.1) -12.4% Returns 339.1 124.7 260.9 1,765.1 69.3 83.4 528.0 51.4 32.3 3,254.2 3,198.8 55.4 1.7% State/City Offsets (69.8) (39.8) (58.4) (187.0) (28.1) (71.7) (444.9) (65.9) (58.3) (1,023.9) (995.6) 28.3 2.8% Other (Assessments/LLC) 107.4 60.1 63.0 103.1 75.0 97.9 133.3 90.9 119.3 850.0 1,008.9 (158.9) -15.7% Gross Receipts 3,775.6 3,144.2 4,854.8 11,410.5 3,114.1 5,766.8 3,312.7 3,208.3 5,076.8 - - - 43,663.8 45,004.7 (1,340.9) -3.0% Transfers to School Tax Relief Fund - - - - - - - - - - - - 0.0% Transfers to Revenue Bond Tax Fund - - - - - - - - - - - - 0.0% Refunds Issued (1,709.4) (945.0) (486.3) (1,179.8) (391.1) (495.4) (781.1) (633.5) (244.0) (6,865.6) (7,687.5) (821.9) -10.7% Total Personal Income Tax 2,066.2 2,199.2 4,368.5 10,230.7 2,723.0 5,271.4 2,531.6 2,574.8 4,832.8 - - - 36,798.2 37,317.2 (519.0) -1.4% Consumption/Use Taxes: Sales and Use 869.4 790.8 1,210.0 1,132.4 1,146.4 1,540.2 1,140.6 1,166.8 1,500.2 10,496.8 12,155.6 (1,658.8) -13.6% Auto Rental 0.5 (1.4) 13.5 2.1 2.1 14.5 0.1 - 19.1 50.5 83.5 (33.0) -39.5% Cigarette/Tobacco Products 98.8 74.0 86.1 97.8 87.0 103.4 81.0 86.0 87.5 801.6 819.0 (17.4) -2.1% Medical Marijuana 0.5 0.6 0.7 0.6 0.8 0.7 0.8 0.7 0.8 6.2 4.3 1.9 44.2% Motor Fuel 30.3 21.4 31.5 39.7 42.5 41.6 39.6 39.7 42.4 328.7 395.3 (66.6) -16.8% Alcoholic Beverage 26.7 21.4 22.8 26.0 23.1 23.3 23.7 22.9 18.6 208.5 199.5 9.0 4.5% Highway Use 11.6 8.9 12.4 12.4 10.3 12.7 10.6 11.5 12.7 103.1 110.2 (7.1) -6.4% Vapor Excise - 0.1 11.7 (0.4) (0.1) 7.4 - - 6.8 25.5 - 25.5 100.0% Opioid Excise 7.2 - - 8.9 - 0.3 6.1 0.1 0.2 22.8 - 22.8 100.0% Total Consumption/Use Taxes 1,045.0 915.8 1,388.7 1,319.5 1,312.1 1,744.1 1,302.5 1,327.7 1,688.3 - - - 12,043.7 13,767.4 (1,723.7) -12.5% Business Taxes: Corporation Franchise 254.4 (134.7) 557.5 563.2 29.7 1,000.7 115.0 90.1 1,079.1 3,555.0 3,534.8 20.2 0.6% Corporation and Utilities 15.6 (11.0) 94.9 33.3 2.3 106.3 10.2 0.5 102.0 354.1 415.1 (61.0) -14.7% Insurance 70.2 6.5 364.0 33.3 16.0 391.7 23.1 9.2 421.6 1,335.6 1,526.6 (191.0) -12.5% Bank 7.4 2.6 91.8 0.7 46.5 15.3 0.4 (0.7) 1.6 165.6 (29.9) 195.5 653.8% Petroleum Business 68.3 39.8 85.7 87.9 87.0 98.4 89.5 82.8 81.2 720.6 897.1 (176.5) -19.7% Total Business Taxes 415.9 (96.8) 1,193.9 718.4 181.5 1,612.4 238.2 181.9 1,685.5 - - - 6,130.9 6,343.7 (212.8) -3.4% Other Taxes: Real Property Gains - - - - - - - - - - - - 0.0% Estate and Gift 72.7 52.0 147.3 147.7 55.8 91.3 135.1 131.5 123.1 956.5 813.5 143.0 17.6% Pari-Mutuel 0.7 0.2 0.8 1.0 1.4 0.7 1.6 0.8 0.9 8.1 12.2 (4.1) -33.6% Real Estate Transfer 57.2 48.4 49.8 64.9 68.3 82.2 77.8 90.8 107.1 646.5 857.2 (210.7) -24.6% Racing and Exhibitions 0.1 - - - - - - - - 0.1 2.0 (1.9) -95.0% Employer Compensation Expense Tax 0.2 (0.2) 0.2 0.2 0.2 0.2 0.3 0.2 0.8 2.1 1.4 0.7 50.0% Total Other Taxes 130.9 100.4 198.1 213.8 125.7 174.4 214.8 223.3 231.9 - - - 1,613.3 1,686.3 (73.0) -4.3%
Total Taxes 3,658.0 3,118.6 7,149.2 12,482.4 4,342.3 8,802.3 4,287.1 4,307.7 8,438.5 - - - 56,586.1 59,114.6 (2,528.5) -4.3%
Miscellaneous Receipts: Abandoned Property: Abandoned Property 1.6 0.7 0.8 0.9 25.9 86.0 11.4 215.9 31.4 374.6 295.1 79.5 26.9% Bottle Bill 0.7 0.3 20.6 18.4 0.1 43.2 2.1 0.7 21.4 107.5 95.0 12.5 13.2% Assessments: Business 54.6 66.0 88.0 78.5 48.6 72.7 97.6 19.0 97.4 622.4 668.6 (46.2) -6.9% Medical Care 571.2 466.8 506.1 442.6 463.6 520.0 509.0 477.1 507.2 4,463.6 4,825.6 (362.0) -7.5% Public Utilities 0.1 - 0.4 4.4 0.4 45.4 (10.1) (1.6) 0.7 39.7 44.0 (4.3) -9.8% Other - 0.1 - - - - - 0.1 - 0.2 0.7 (0.5) -71.4% Fees, Licenses and Permits: Alcohol Beverage Control Licensing 2.2 2.9 2.9 4.9 4.8 5.4 5.0 3.8 3.0 34.9 57.1 (22.2) -38.9% Audit Fees - - 0.1 0.2 0.7 0.7 0.1 0.3 0.1 2.2 2.6 (0.4) -15.4% Business/Professional: 69.0 71.9 116.0 55.6 55.3 128.6 66.5 47.1 114.5 724.5 757.7 (33.2) -4.4% Civil 4.3 3.3 5.5 3.1 88.8 (9.8) 14.6 33.4 28.5 171.7 220.5 (48.8) -22.1% Criminal 0.6 0.4 0.2 1.6 - 0.2 0.5 0.1 0.2 3.8 6.2 (2.4) -38.7% Motor Vehicle (29.8) - 187.3 200.9 103.6 128.9 105.0 114.2 114.4 924.5 1,020.3 (95.8) -9.4% Recreational/Consumer 43.0 - 36.6 34.2 43.3 155.0 85.3 60.7 57.8 515.9 671.7 (155.8) -23.2% Fines, Penalties and Forfeitures 100.9 233.7 18.3 201.3 6.9 16.3 80.1 154.8 11.0 823.3 1,281.6 (458.3) -35.8% Gaming: Casino - - - 20.8 - 8.0 33.4 10.0 10.2 82.4 210.6 (128.2) -60.9% Lottery 157.0 142.1 173.8 202.2 195.9 199.3 168.3 171.0 215.6 1,625.2 1,832.8 (207.6) -11.3% Video Lottery - 0.6 - (0.4) - 33.8 59.6 54.2 58.0 205.8 709.7 (503.9) -71.0% Interest Earnings 32.9 18.2 9.2 5.2 6.7 6.2 5.8 5.9 5.9 96.0 337.9 (241.9) -71.6% Receipts from Public Authorities: Bond Proceeds 1,122.1 1,019.1 3,842.4 269.9 32.4 384.7 895.8 1.0 982.3 8,549.7 3,023.7 5,526.0 182.8% Cost Recovery Assessments - - - - - - 8.9 - - 8.9 52.7 (43.8) -83.1% Issuance Fees 0.5 1.4 25.5 24.7 - 1.8 30.2 0.5 21.6 106.2 53.7 52.5 97.8% Non Bond Related 9.0 0.3 0.5 4.3 2.3 0.1 0.8 - 28.6 45.9 107.0 (61.1) -57.1% Receipts from Municipalities 9.3 2.5 3.9 3.8 2.0 4.7 3.5 3.5 5.1 38.3 62.2 (23.9) -38.4% Rentals (4.6) (41.7) 1.8 4.2 7.8 35.9 61.8 12.5 8.5 86.2 227.4 (141.2) -62.1%
9 Months Ended December 31
16
STATE OF NEW YORKGOVERNMENTAL FUNDS (*)
STATEMENT OF CASH FLOW FISCAL YEAR 2020-2021 (amounts in millions)
2020 2021 $ Increase/ % Increase/APRIL MAY JUNE JULY AUGUST SEPTEMBER OCTOBER NOVEMBER DECEMBER JANUARY FEBRUARY MARCH 2020 2019 (Decrease) Decrease
9 Months Ended December 31
Revenues of State Departments: Administrative Recoveries 25.0 8.8 25.4 9.1 8.9 25.6 24.5 8.8 22.6 158.7 159.9 (1.2) -0.8% Commissions 0.6 (0.3) 0.2 0.2 - 1.3 0.2 0.9 14.2 17.3 19.2 (1.9) -9.9% Commissions - Asset Conversion - - - - - - - - 68.0 68.0 68.0 - 0.0% Gifts, Grants and Donations 0.6 2.2 27.9 0.7 1.9 2.1 5.9 0.7 3.4 45.4 26.4 19.0 72.0% Indirect Cost Recoveries 5.5 5.4 7.4 5.9 6.1 5.7 5.0 5.5 8.7 55.2 60.6 (5.4) -8.9% Patient/Client Care Reimbursement 526.5 372.8 350.6 227.5 221.8 79.0 291.4 187.1 371.4 2,628.1 1,984.7 643.4 32.4% Rebates 7.8 15.3 13.2 17.7 12.7 12.7 9.8 13.8 12.7 115.7 128.1 (12.4) -9.7% Restitution and Settlements 7.0 0.6 0.6 0.3 42.7 5.3 3.6 1.3 2.0 63.4 37.8 25.6 67.7% Student Loans 6.1 1.4 3.2 6.4 6.8 3.7 6.0 3.6 4.9 42.1 54.5 (12.4) -22.8% All Other (19.5) 10.7 30.0 75.6 46.8 65.5 75.7 42.8 41.3 368.9 503.7 (134.8) -26.8% Sales 0.5 0.6 2.6 3.0 0.6 0.7 1.8 0.8 0.6 11.2 18.1 (6.9) -38.1% Tuition (67.5) 33.6 56.9 50.9 113.3 375.7 172.8 49.7 (32.8) 752.6 919.0 (166.4) -18.1% Total Miscellaneous Receipts 2,637.2 2,439.7 5,557.9 1,978.6 1,550.7 2,444.4 2,831.9 1,699.2 2,840.4 - - - 23,980.0 20,544.4 3,435.6 16.7%
Federal Receipts 10,863.1 4,207.0 7,520.2 5,423.2 4,591.2 10,136.1 7,609.2 4,274.8 7,541.3 62,166.1 49,735.4 12,430.7 25.0%
Total Receipts 17,158.3 9,765.3 20,227.3 19,884.2 10,484.2 21,382.8 14,728.2 10,281.7 18,820.2 - - - 142,732.2 129,394.4 13,337.8 10.3%
DISBURSEMENTS: Local Assistance Grants: Education 1,149.2 4,132.7 3,964.9 799.2 1,070.5 4,157.3 1,350.8 1,804.3 2,665.5 21,094.4 22,943.1 (1,848.7) -8.1% Environment and Recreation 4.5 3.7 14.0 12.9 20.6 15.6 7.7 10.0 20.8 109.8 152.0 (42.2) -27.8% General Government 48.5 17.7 543.7 67.4 109.0 3,937.2 322.4 159.0 333.9 5,538.8 1,857.9 3,680.9 198.1% Public Health: Medicaid 5,410.3 5,099.6 6,082.5 5,357.6 5,292.8 7,004.6 4,286.1 4,812.6 6,709.3 50,055.4 49,517.5 537.9 1.1% Other Public Health 602.5 638.5 980.4 1,028.7 701.7 1,078.5 815.2 774.3 864.5 7,484.3 7,551.0 (66.7) -0.9% Public Safety 95.3 63.6 163.3 265.2 71.2 151.0 634.7 56.8 180.7 1,681.8 1,216.6 465.2 38.2% Public Welfare 211.8 217.7 388.7 850.8 364.1 1,487.5 479.0 394.6 426.5 4,820.7 5,322.9 (502.2) -9.4% Support and Regulate Business 48.1 15.1 35.9 26.7 84.5 22.3 64.2 54.2 144.9 495.9 862.5 (366.6) -42.5% Transportation 90.0 90.9 72.6 825.5 509.6 618.1 745.0 956.3 1,009.2 4,917.2 4,680.9 236.3 5.0% Total Local Assistance Grants 7,660.2 10,279.5 12,246.0 9,234.0 8,224.0 18,472.1 8,705.1 9,022.1 12,355.3 - - - 96,198.3 94,104.4 2,093.9 2.2% Departmental Operations: Personal Service 1,569.5 1,135.9 1,116.4 1,278.8 1,053.9 1,527.0 1,119.2 1,090.2 1,298.5 11,189.4 11,259.6 (70.2) -0.6% Non-Personal Service 584.1 417.0 504.4 577.1 605.9 756.7 620.6 492.9 641.0 5,199.7 4,943.5 256.2 5.2% General State Charges 535.2 395.0 2,621.5 471.9 414.0 616.1 511.7 500.1 474.5 6,540.0 7,114.4 (574.4) -8.1% Debt Service, Including Payments on Financing Agreements 36.5 23.5 28.9 10.7 337.6 841.8 39.8 30.4 1,332.0 2,681.2 1,512.2 1,169.0 77.3% Capital Projects 509.8 406.0 681.8 641.4 667.7 706.7 533.6 609.8 630.5 5,387.3 5,425.0 (37.7) -0.7%
Total Disbursements 10,895.3 12,656.9 17,199.0 12,213.9 11,303.1 22,920.4 11,530.0 11,745.5 16,731.8 - - - 127,195.9 124,359.1 2,836.8 2.3%
Excess (Deficiency) of Receipts over Disbursements 6,263.0 (2,891.6) 3,028.3 7,670.3 (818.9) (1,537.6) 3,198.2 (1,463.8) 2,088.4 - - - 15,536.3 5,035.3 10,501.0 208.5%
OTHER FINANCING SOURCES (USES): Bond and Note Proceeds (net) - - - - - - - - - - - - 0.0% Transfers from Other Funds 1,063.1 1,858.4 4,185.9 5,857.2 1,882.7 3,319.7 1,882.5 2,244.8 3,331.2 25,625.5 32,660.4 (7,034.9) -21.5% Transfers to Other Funds (1,066.5) (1,860.9) (4,240.9) (5,863.1) (1,894.6) (3,438.8) (1,889.4) (2,247.8) (3,334.5) (25,836.5) (32,770.4) (6,933.9) -21.2%
Total Other Financing Sources (Uses) (3.4) (2.5) (55.0) (5.9) (11.9) (119.1) (6.9) (3.0) (3.3) - - - (211.0) (110.0) (101.0) -91.8%
Excess (Deficiency) of Receipts and Other Financing Sources over Disbursements and Other Financing Uses 6,259.6 (2,894.1) 2,973.3 7,664.4 (830.8) (1,656.7) 3,191.3 (1,466.8) 2,085.1 - - - 15,325.3 4,925.3 10,400.0 211.2%
Ending Fund Balance 20,544.4$ 17,650.3$ 20,623.6$ 28,288.0$ 27,457.2$ 25,800.5$ 28,991.8$ 27,525.0$ 29,610.1$ -$ -$ -$ 29,610.1$ 14,900.3$ 14,709.8$ 98.7%
(*) Governmental Funds includes General, Special Revenue, Debt Service and Capital Projects Funds combined.
17
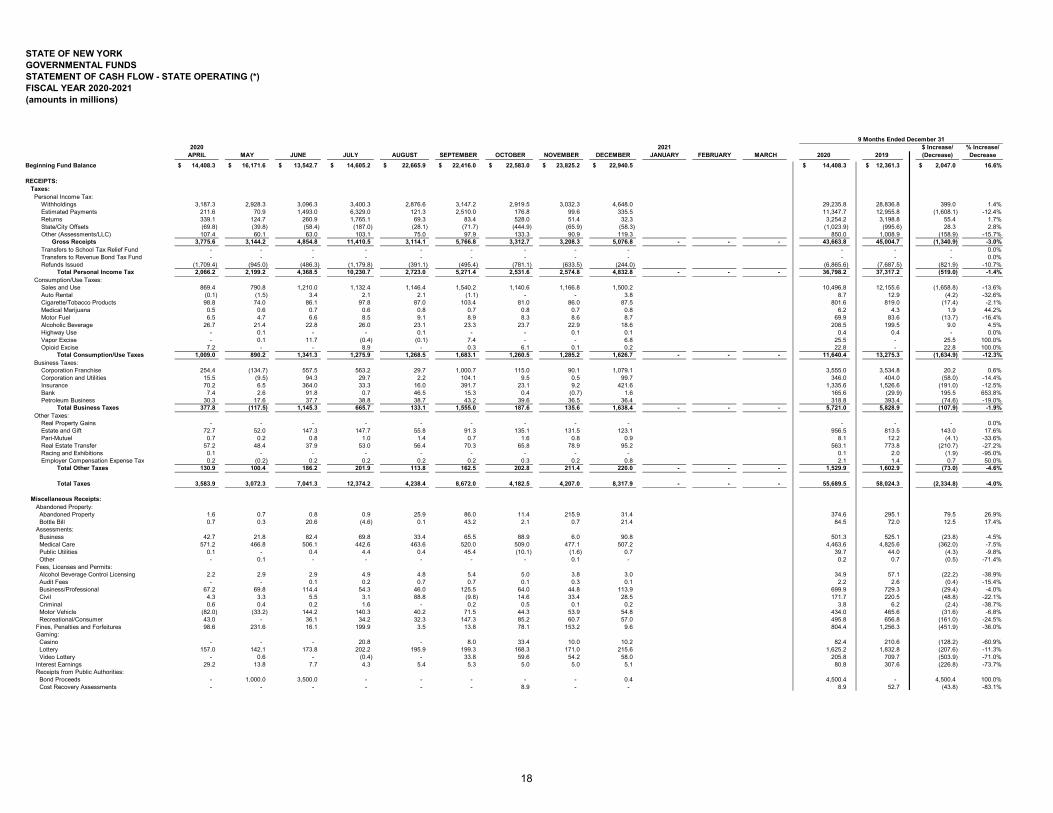
STATE OF NEW YORKGOVERNMENTAL FUNDS
STATEMENT OF CASH FLOW - STATE OPERATING (*)FISCAL YEAR 2020-2021 (amounts in millions)
2020 2021 $ Increase/ % Increase/APRIL MAY JUNE JULY AUGUST SEPTEMBER OCTOBER NOVEMBER DECEMBER JANUARY FEBRUARY MARCH 2020 2019 (Decrease) Decrease
Beginning Fund Balance 14,408.3$ 16,171.6$ 13,542.7$ 14,605.2$ 22,665.9$ 22,416.0$ 22,583.0$ 23,825.2$ 22,940.5$ 14,408.3$ 12,361.3$ 2,047.0$ 16.6%
RECEIPTS: Taxes: Personal Income Tax: Withholdings 3,187.3 2,928.3 3,096.3 3,400.3 2,876.6 3,147.2 2,919.5 3,032.3 4,648.0 29,235.8 28,836.8 399.0 1.4% Estimated Payments 211.6 70.9 1,493.0 6,329.0 121.3 2,510.0 176.8 99.6 335.5 11,347.7 12,955.8 (1,608.1) -12.4% Returns 339.1 124.7 260.9 1,765.1 69.3 83.4 528.0 51.4 32.3 3,254.2 3,198.8 55.4 1.7% State/City Offsets (69.8) (39.8) (58.4) (187.0) (28.1) (71.7) (444.9) (65.9) (58.3) (1,023.9) (995.6) 28.3 2.8% Other (Assessments/LLC) 107.4 60.1 63.0 103.1 75.0 97.9 133.3 90.9 119.3 850.0 1,008.9 (158.9) -15.7% Gross Receipts 3,775.6 3,144.2 4,854.8 11,410.5 3,114.1 5,766.8 3,312.7 3,208.3 5,076.8 - - - 43,663.8 45,004.7 (1,340.9) -3.0% Transfers to School Tax Relief Fund - - - - - - - - - - - - 0.0% Transfers to Revenue Bond Tax Fund - - - - - - - - - - - - 0.0% Refunds Issued (1,709.4) (945.0) (486.3) (1,179.8) (391.1) (495.4) (781.1) (633.5) (244.0) (6,865.6) (7,687.5) (821.9) -10.7% Total Personal Income Tax 2,066.2 2,199.2 4,368.5 10,230.7 2,723.0 5,271.4 2,531.6 2,574.8 4,832.8 - - - 36,798.2 37,317.2 (519.0) -1.4% Consumption/Use Taxes: Sales and Use 869.4 790.8 1,210.0 1,132.4 1,146.4 1,540.2 1,140.6 1,166.8 1,500.2 10,496.8 12,155.6 (1,658.8) -13.6% Auto Rental (0.1) (1.5) 3.4 2.1 2.1 (1.1) - - 3.8 8.7 12.9 (4.2) -32.6% Cigarette/Tobacco Products 98.8 74.0 86.1 97.8 87.0 103.4 81.0 86.0 87.5 801.6 819.0 (17.4) -2.1% Medical Marijuana 0.5 0.6 0.7 0.6 0.8 0.7 0.8 0.7 0.8 6.2 4.3 1.9 44.2% Motor Fuel 6.5 4.7 6.6 8.5 9.1 8.9 8.3 8.6 8.7 69.9 83.6 (13.7) -16.4% Alcoholic Beverage 26.7 21.4 22.8 26.0 23.1 23.3 23.7 22.9 18.6 208.5 199.5 9.0 4.5% Highway Use - 0.1 - - 0.1 - - 0.1 0.1 0.4 0.4 - 0.0% Vapor Excise - 0.1 11.7 (0.4) (0.1) 7.4 - - 6.8 25.5 - 25.5 100.0% Opioid Excise 7.2 - - 8.9 - 0.3 6.1 0.1 0.2 22.8 - 22.8 100.0% Total Consumption/Use Taxes 1,009.0 890.2 1,341.3 1,275.9 1,268.5 1,683.1 1,260.5 1,285.2 1,626.7 - - - 11,640.4 13,275.3 (1,634.9) -12.3% Business Taxes: Corporation Franchise 254.4 (134.7) 557.5 563.2 29.7 1,000.7 115.0 90.1 1,079.1 3,555.0 3,534.8 20.2 0.6% Corporation and Utilities 15.5 (9.5) 94.3 29.7 2.2 104.1 9.5 0.5 99.7 346.0 404.0 (58.0) -14.4% Insurance 70.2 6.5 364.0 33.3 16.0 391.7 23.1 9.2 421.6 1,335.6 1,526.6 (191.0) -12.5% Bank 7.4 2.6 91.8 0.7 46.5 15.3 0.4 (0.7) 1.6 165.6 (29.9) 195.5 653.8% Petroleum Business 30.3 17.6 37.7 38.8 38.7 43.2 39.6 36.5 36.4 318.8 393.4 (74.6) -19.0% Total Business Taxes 377.8 (117.5) 1,145.3 665.7 133.1 1,555.0 187.6 135.6 1,638.4 - - - 5,721.0 5,828.9 (107.9) -1.9% Other Taxes: Real Property Gains - - - - - - - - - - - - 0.0% Estate and Gift 72.7 52.0 147.3 147.7 55.8 91.3 135.1 131.5 123.1 956.5 813.5 143.0 17.6% Pari-Mutuel 0.7 0.2 0.8 1.0 1.4 0.7 1.6 0.8 0.9 8.1 12.2 (4.1) -33.6% Real Estate Transfer 57.2 48.4 37.9 53.0 56.4 70.3 65.8 78.9 95.2 563.1 773.8 (210.7) -27.2% Racing and Exhibitions 0.1 - - - - - - - - 0.1 2.0 (1.9) -95.0% Employer Compensation Expense Tax 0.2 (0.2) 0.2 0.2 0.2 0.2 0.3 0.2 0.8 2.1 1.4 0.7 50.0% Total Other Taxes 130.9 100.4 186.2 201.9 113.8 162.5 202.8 211.4 220.0 - - - 1,529.9 1,602.9 (73.0) -4.6%
Total Taxes 3,583.9 3,072.3 7,041.3 12,374.2 4,238.4 8,672.0 4,182.5 4,207.0 8,317.9 - - - 55,689.5 58,024.3 (2,334.8) -4.0%
Miscellaneous Receipts: Abandoned Property: Abandoned Property 1.6 0.7 0.8 0.9 25.9 86.0 11.4 215.9 31.4 374.6 295.1 79.5 26.9% Bottle Bill 0.7 0.3 20.6 (4.6) 0.1 43.2 2.1 0.7 21.4 84.5 72.0 12.5 17.4% Assessments: Business 42.7 21.8 82.4 69.8 33.4 65.5 88.9 6.0 90.8 501.3 525.1 (23.8) -4.5% Medical Care 571.2 466.8 506.1 442.6 463.6 520.0 509.0 477.1 507.2 4,463.6 4,825.6 (362.0) -7.5% Public Utilities 0.1 - 0.4 4.4 0.4 45.4 (10.1) (1.6) 0.7 39.7 44.0 (4.3) -9.8% Other - 0.1 - - - - - 0.1 - 0.2 0.7 (0.5) -71.4% Fees, Licenses and Permits: Alcohol Beverage Control Licensing 2.2 2.9 2.9 4.9 4.8 5.4 5.0 3.8 3.0 34.9 57.1 (22.2) -38.9% Audit Fees - - 0.1 0.2 0.7 0.7 0.1 0.3 0.1 2.2 2.6 (0.4) -15.4% Business/Professional 67.2 69.8 114.4 54.3 46.0 125.5 64.0 44.8 113.9 699.9 729.3 (29.4) -4.0% Civil 4.3 3.3 5.5 3.1 88.8 (9.8) 14.6 33.4 28.5 171.7 220.5 (48.8) -22.1% Criminal 0.6 0.4 0.2 1.6 - 0.2 0.5 0.1 0.2 3.8 6.2 (2.4) -38.7% Motor Vehicle (82.0) (33.2) 144.2 140.3 40.2 71.5 44.3 53.9 54.8 434.0 465.6 (31.6) -6.8% Recreational/Consumer 43.0 - 36.1 34.2 32.3 147.3 85.2 60.7 57.0 495.8 656.8 (161.0) -24.5% Fines, Penalties and Forfeitures 98.6 231.6 16.1 199.9 3.5 13.8 78.1 153.2 9.6 804.4 1,256.3 (451.9) -36.0% Gaming: Casino - - - 20.8 - 8.0 33.4 10.0 10.2 82.4 210.6 (128.2) -60.9% Lottery 157.0 142.1 173.8 202.2 195.9 199.3 168.3 171.0 215.6 1,625.2 1,832.8 (207.6) -11.3% Video Lottery - 0.6 - (0.4) - 33.8 59.6 54.2 58.0 205.8 709.7 (503.9) -71.0% Interest Earnings 29.2 13.8 7.7 4.3 5.4 5.3 5.0 5.0 5.1 80.8 307.6 (226.8) -73.7% Receipts from Public Authorities: Bond Proceeds - 1,000.0 3,500.0 - - - - - 0.4 4,500.4 - 4,500.4 100.0% Cost Recovery Assessments - - - - - - 8.9 - - 8.9 52.7 (43.8) -83.1%
9 Months Ended December 31
18

STATE OF NEW YORKGOVERNMENTAL FUNDS
STATEMENT OF CASH FLOW - STATE OPERATING (*)FISCAL YEAR 2020-2021 (amounts in millions)
2020 2021 $ Increase/ % Increase/APRIL MAY JUNE JULY AUGUST SEPTEMBER OCTOBER NOVEMBER DECEMBER JANUARY FEBRUARY MARCH 2020 2019 (Decrease) Decrease
9 Months Ended December 31
Issuance Fees 0.5 1.4 25.5 24.7 - 1.8 30.2 0.5 21.6 106.2 53.7 52.5 97.8% Non Bond Related 8.9 0.3 - 4.2 1.8 - 0.4 - 28.2 43.8 57.0 (13.2) -23.2% Receipts from Municipalities 9.3 2.5 3.8 3.8 1.7 4.7 3.4 3.5 5.1 37.8 60.4 (22.6) -37.4% Rentals (5.1) (42.8) (0.3) 2.0 4.0 34.7 61.0 11.6 7.6 72.7 220.4 (147.7) -67.0% Revenues of State Departments: Administrative Recoveries 25.0 8.8 25.4 9.1 8.9 25.6 24.5 8.8 22.6 158.7 159.9 (1.2) -0.8% Commissions 0.6 (0.3) 0.2 0.2 - 1.3 0.2 0.9 14.2 17.3 19.2 (1.9) -9.9% Commissions - Asset Conversion - - - - - - - - 68.0 68.0 68.0 - 0.0% Gifts, Grants and Donations 0.6 1.5 22.1 0.7 0.6 0.5 5.1 0.3 1.7 33.1 6.4 26.7 417.2% Indirect Cost Recoveries 5.5 5.4 7.4 5.9 6.1 5.7 5.0 5.5 8.7 55.2 61.5 (6.3) -10.2% Patient/Client Care Reimbursement 526.5 372.8 350.6 227.5 221.8 79.0 291.4 187.1 371.4 2,628.1 1,984.7 643.4 32.4% Rebates 0.1 6.6 5.7 10.2 5.3 5.0 2.3 6.4 4.8 46.4 53.4 (7.0) -13.1% Restitution and Settlements 3.9 0.4 0.6 0.2 41.8 3.9 0.3 0.9 1.2 53.2 27.0 26.2 97.0% Student Loans 6.1 1.4 3.2 6.4 6.8 3.7 6.0 3.6 4.9 42.1 54.5 (12.4) -22.8% All Other (20.1) 8.6 18.0 75.3 45.5 51.9 70.9 41.5 39.2 330.8 451.3 (120.5) -26.7% Sales 0.5 0.6 2.6 3.0 0.5 0.6 1.8 0.8 0.6 11.0 13.5 (2.5) -18.5% Tuition (67.5) 33.6 56.9 50.9 113.3 375.7 172.8 49.7 (32.8) 752.6 919.0 (166.4) -18.1% Total Miscellaneous Receipts 1,431.2 2,321.8 5,133.0 1,602.6 1,399.1 1,955.2 1,843.6 1,609.7 1,774.9 - - - 19,071.1 16,480.2 2,590.9 15.7%
Federal Receipts - - 4.1 (4.1) 2.5 49.9 12.9 (33.5) 12.5 44.3 55.0 (10.7) -19.5%
Total Receipts 5,015.1 5,394.1 12,178.4 13,972.7 5,640.0 10,677.1 6,039.0 5,783.2 10,105.3 - - - 74,804.9 74,559.5 245.4 0.3%
DISBURSEMENTS: Local Assistance Grants: Education 754.3 4,065.1 3,409.1 563.6 856.2 3,861.8 1,200.2 1,559.5 2,583.1 18,852.9 20,138.1 (1,285.2) -6.4% Environment and Recreation 0.1 0.3 - 0.2 (0.1) 0.4 0.7 0.2 0.3 2.1 3.8 (1.7) -44.7% General Government 16.1 4.6 500.0 20.4 33.6 62.5 77.7 18.1 184.1 917.1 1,106.5 (189.4) -17.1% Public Health: Medicaid 757.7 1,757.8 2,497.4 2,043.9 1,856.5 2,135.5 1,416.5 1,503.7 2,122.7 16,091.7 19,299.6 (3,207.9) -16.6% Other Public Health 93.5 72.8 307.2 486.1 118.0 438.1 249.0 234.8 263.3 2,262.8 2,412.5 (149.7) -6.2% Public Safety 20.9 11.1 4.5 16.9 29.4 34.6 17.3 (6.7) 66.0 194.0 275.1 (81.1) -29.5% Public Welfare 77.0 158.2 61.4 578.1 57.1 426.8 70.3 222.3 168.2 1,819.4 1,839.9 (20.5) -1.1% Support and Regulate Business 4.6 7.1 9.0 5.4 11.0 10.9 9.7 26.2 10.9 94.8 154.9 (60.1) -38.8% Transportation 61.7 41.7 18.5 726.3 357.9 243.1 256.4 446.1 781.3 2,933.0 3,282.3 (349.3) -10.6% Total Local Assistance Grants 1,785.9 6,118.7 6,807.1 4,440.9 3,319.6 7,213.7 3,297.8 4,004.2 6,179.9 - - - 43,167.8 48,512.7 (5,344.9) -11.0% Departmental Operations: Personal Service 1,494.8 1,084.9 955.5 1,114.0 990.1 1,443.0 987.4 976.5 (98.0) 8,948.2 10,771.1 (1,822.9) -16.9% Non-Personal Service 543.3 372.9 335.8 (308.2) 384.5 528.7 432.0 417.2 435.2 3,141.4 3,985.8 (844.4) -21.2% General State Charges 512.5 370.3 2,582.6 388.2 343.3 592.6 434.0 470.8 362.1 6,056.4 6,872.6 (816.2) -11.9% Debt Service, Including Payments on Financing Agreements 36.5 23.5 28.9 10.7 337.6 841.8 39.8 30.4 1,229.8 2,579.0 1,512.2 1,066.8 70.5% Capital Projects - - - - - - - - - - - - 0.0%
Total Disbursements 4,373.0 7,970.3 10,709.9 5,645.6 5,375.1 10,619.8 5,191.0 5,899.1 8,109.0 - - - 63,892.8 71,654.4 (7,761.6) -10.8%
Excess (Deficiency) of Receipts over Disbursements 642.1 (2,576.2) 1,468.5 8,327.1 264.9 57.3 848.0 (115.9) 1,996.3 - - - 10,912.1 2,905.1 8,007.0 275.6%
OTHER FINANCING SOURCES (USES): Transfers from Other Funds (**) 1,939.1 1,674.9 3,796.1 5,367.5 1,326.8 3,217.1 2,037.9 1,382.5 3,217.2 23,959.1 29,739.8 (5,780.7) -19.4% Transfers to Other Funds (**) (817.9) (1,727.6) (4,202.1) (5,633.9) (1,841.6) (3,107.4) (1,643.7) (2,151.3) (3,124.5) (24,250.0) (30,983.0) (6,733.0) -21.7%
Total Other Financing Sources (Uses) 1,121.2 (52.7) (406.0) (266.4) (514.8) 109.7 394.2 (768.8) 92.7 - - - (290.9) (1,243.2) 952.3 76.6%
Excess (Deficiency) of Receipts and Other Financing Sources over Disbursements and Other Financing Uses 1,763.3 (2,628.9) 1,062.5 8,060.7 (249.9) 167.0 1,242.2 (884.7) 2,089.0 - - - 10,621.2 1,661.9 8,959.3 539.1%
Ending Fund Balance 16,171.6$ 13,542.7$ 14,605.2$ 22,665.9$ 22,416.0$ 22,583.0$ 23,825.2$ 22,940.5$ 25,029.5$ -$ -$ -$ 25,029.5$ 14,023.2$ 11,006.3$ 78.5%
(*) State Operating Funds are comprised of the General Fund, State Special Revenue Funds supported by activities from dedicated revenue sources (including operating transfers from Federal funds) and Debt Service Funds. (**) Eliminations between State and Federal Special Revenue Funds are not included.
19
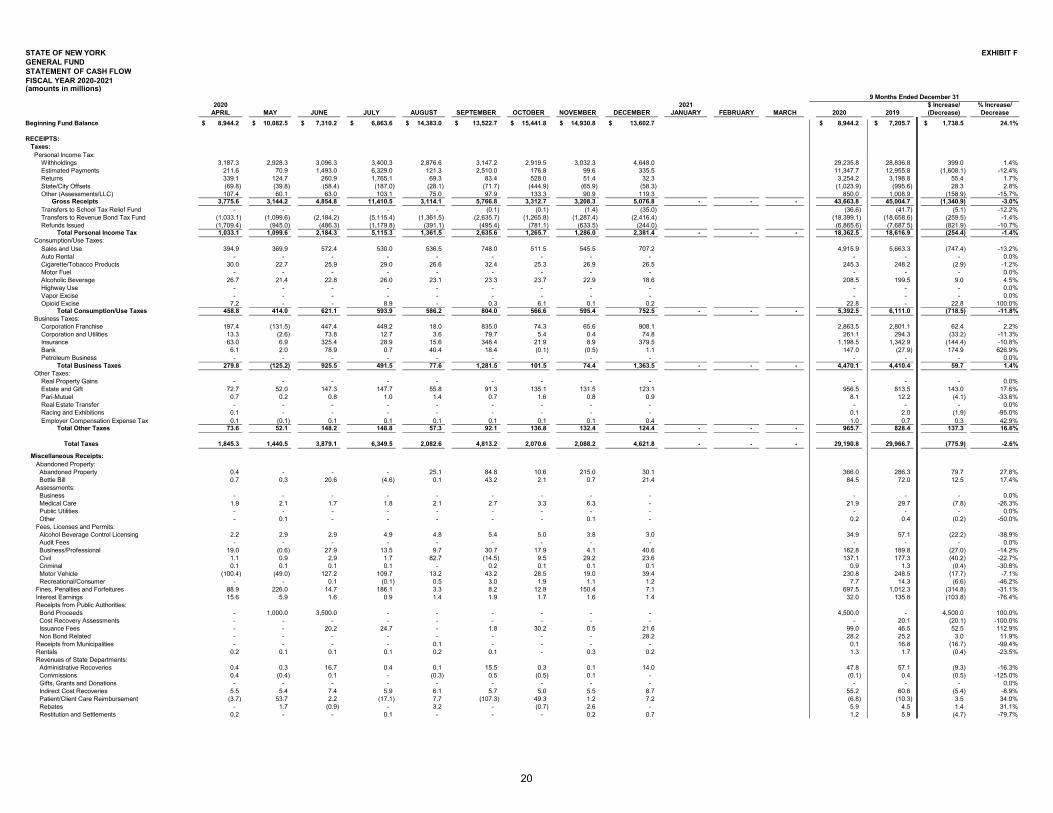
STATE OF NEW YORK EXHIBIT FGENERAL FUND
STATEMENT OF CASH FLOWFISCAL YEAR 2020-2021 (amounts in millions)
2020 2021 $ Increase/ % Increase/APRIL MAY JUNE JULY AUGUST SEPTEMBER OCTOBER NOVEMBER DECEMBER JANUARY FEBRUARY MARCH 2020 2019 (Decrease) Decrease
Beginning Fund Balance 8,944.2$ 10,082.5$ 7,310.2$ 6,863.6$ 14,383.0$ 13,522.7$ 15,441.8$ 14,930.8$ 13,602.7$ 8,944.2$ 7,205.7$ 1,738.5$ 24.1%
RECEIPTS: Taxes: Personal Income Tax: Withholdings 3,187.3 2,928.3 3,096.3 3,400.3 2,876.6 3,147.2 2,919.5 3,032.3 4,648.0 29,235.8 28,836.8 399.0 1.4% Estimated Payments 211.6 70.9 1,493.0 6,329.0 121.3 2,510.0 176.8 99.6 335.5 11,347.7 12,955.8 (1,608.1) -12.4% Returns 339.1 124.7 260.9 1,765.1 69.3 83.4 528.0 51.4 32.3 3,254.2 3,198.8 55.4 1.7% State/City Offsets (69.8) (39.8) (58.4) (187.0) (28.1) (71.7) (444.9) (65.9) (58.3) (1,023.9) (995.6) 28.3 2.8% Other (Assessments/LLC) 107.4 60.1 63.0 103.1 75.0 97.9 133.3 90.9 119.3 850.0 1,008.9 (158.9) -15.7% Gross Receipts 3,775.6 3,144.2 4,854.8 11,410.5 3,114.1 5,766.8 3,312.7 3,208.3 5,076.8 - - - 43,663.8 45,004.7 (1,340.9) -3.0% Transfers to School Tax Relief Fund - - - - - (0.1) (0.1) (1.4) (35.0) (36.6) (41.7) (5.1) -12.2% Transfers to Revenue Bond Tax Fund (1,033.1) (1,099.6) (2,184.2) (5,115.4) (1,361.5) (2,635.7) (1,265.8) (1,287.4) (2,416.4) (18,399.1) (18,658.6) (259.5) -1.4% Refunds Issued (1,709.4) (945.0) (486.3) (1,179.8) (391.1) (495.4) (781.1) (633.5) (244.0) (6,865.6) (7,687.5) (821.9) -10.7% Total Personal Income Tax 1,033.1 1,099.6 2,184.3 5,115.3 1,361.5 2,635.6 1,265.7 1,286.0 2,381.4 - - - 18,362.5 18,616.9 (254.4) -1.4% Consumption/Use Taxes: Sales and Use 394.9 369.9 572.4 530.0 536.5 748.0 511.5 545.5 707.2 4,915.9 5,663.3 (747.4) -13.2% Auto Rental - - - - - - - - - - - - 0.0% Cigarette/Tobacco Products 30.0 22.7 25.9 29.0 26.6 32.4 25.3 26.9 26.5 245.3 248.2 (2.9) -1.2% Motor Fuel - - - - - - - - - - - - 0.0% Alcoholic Beverage 26.7 21.4 22.8 26.0 23.1 23.3 23.7 22.9 18.6 208.5 199.5 9.0 4.5% Highway Use - - - - - - - - - - - - 0.0% Vapor Excise - - - - - - - - - - - - 0.0% Opioid Excise 7.2 - - 8.9 - 0.3 6.1 0.1 0.2 22.8 - 22.8 100.0% Total Consumption/Use Taxes 458.8 414.0 621.1 593.9 586.2 804.0 566.6 595.4 752.5 - - - 5,392.5 6,111.0 (718.5) -11.8% Business Taxes: Corporation Franchise 197.4 (131.5) 447.4 449.2 18.0 835.0 74.3 65.6 908.1 2,863.5 2,801.1 62.4 2.2% Corporation and Utilities 13.3 (2.6) 73.8 12.7 3.6 79.7 5.4 0.4 74.8 261.1 294.3 (33.2) -11.3% Insurance 63.0 6.9 325.4 28.9 15.6 348.4 21.9 8.9 379.5 1,198.5 1,342.9 (144.4) -10.8% Bank 6.1 2.0 78.9 0.7 40.4 18.4 (0.1) (0.5) 1.1 147.0 (27.9) 174.9 626.9% Petroleum Business - - - - - - - - - - - - 0.0% Total Business Taxes 279.8 (125.2) 925.5 491.5 77.6 1,281.5 101.5 74.4 1,363.5 - - - 4,470.1 4,410.4 59.7 1.4% Other Taxes: Real Property Gains - - - - - - - - - - - - 0.0% Estate and Gift 72.7 52.0 147.3 147.7 55.8 91.3 135.1 131.5 123.1 956.5 813.5 143.0 17.6% Pari-Mutuel 0.7 0.2 0.8 1.0 1.4 0.7 1.6 0.8 0.9 8.1 12.2 (4.1) -33.6% Real Estate Transfer - - - - - - - - - - - - 0.0% Racing and Exhibitions 0.1 - - - - - - - - 0.1 2.0 (1.9) -95.0% Employer Compensation Expense Tax 0.1 (0.1) 0.1 0.1 0.1 0.1 0.1 0.1 0.4 1.0 0.7 0.3 42.9% Total Other Taxes 73.6 52.1 148.2 148.8 57.3 92.1 136.8 132.4 124.4 - - - 965.7 828.4 137.3 16.6%
Total Taxes 1,845.3 1,440.5 3,879.1 6,349.5 2,082.6 4,813.2 2,070.6 2,088.2 4,621.8 - - - 29,190.8 29,966.7 (775.9) -2.6%
Miscellaneous Receipts: Abandoned Property: Abandoned Property 0.4 - - - 25.1 84.8 10.6 215.0 30.1 366.0 286.3 79.7 27.8% Bottle Bill 0.7 0.3 20.6 (4.6) 0.1 43.2 2.1 0.7 21.4 84.5 72.0 12.5 17.4% Assessments: Business - - - - - - - - - - - - 0.0% Medical Care 1.9 2.1 1.7 1.8 2.1 2.7 3.3 6.3 - 21.9 29.7 (7.8) -26.3% Public Utilities - - - - - - - - - - - - 0.0% Other - 0.1 - - - - - 0.1 - 0.2 0.4 (0.2) -50.0% Fees, Licenses and Permits: Alcohol Beverage Control Licensing 2.2 2.9 2.9 4.9 4.8 5.4 5.0 3.8 3.0 34.9 57.1 (22.2) -38.9% Audit Fees - - - - - - - - - - - - 0.0% Business/Professional 19.0 (0.6) 27.9 13.5 9.7 30.7 17.9 4.1 40.6 162.8 189.8 (27.0) -14.2% Civil 1.1 0.9 2.9 1.7 82.7 (14.5) 9.5 29.2 23.6 137.1 177.3 (40.2) -22.7% Criminal 0.1 0.1 0.1 0.1 - 0.2 0.1 0.1 0.1 0.9 1.3 (0.4) -30.8% Motor Vehicle (100.4) (49.0) 127.2 109.7 13.2 43.2 28.5 19.0 39.4 230.8 248.5 (17.7) -7.1% Recreational/Consumer - - 0.1 (0.1) 0.5 3.0 1.9 1.1 1.2 7.7 14.3 (6.6) -46.2% Fines, Penalties and Forfeitures 88.9 226.0 14.7 186.1 3.3 8.2 12.8 150.4 7.1 697.5 1,012.3 (314.8) -31.1% Interest Earnings 15.6 5.9 1.6 0.9 1.4 1.9 1.7 1.6 1.4 32.0 135.8 (103.8) -76.4% Receipts from Public Authorities: Bond Proceeds - 1,000.0 3,500.0 - - - - - - 4,500.0 - 4,500.0 100.0% Cost Recovery Assessments - - - - - - - - - - 20.1 (20.1) -100.0% Issuance Fees - - 20.2 24.7 - 1.8 30.2 0.5 21.6 99.0 46.5 52.5 112.9% Non Bond Related - - - - - - - - 28.2 28.2 25.2 3.0 11.9% Receipts from Municipalities - - - - 0.1 - - - - 0.1 16.8 (16.7) -99.4% Rentals 0.2 0.1 0.1 0.1 0.2 0.1 - 0.3 0.2 1.3 1.7 (0.4) -23.5% Revenues of State Departments: Administrative Recoveries 0.4 0.3 16.7 0.4 0.1 15.5 0.3 0.1 14.0 47.8 57.1 (9.3) -16.3% Commissions 0.4 (0.4) 0.1 - (0.3) 0.5 (0.5) 0.1 - (0.1) 0.4 (0.5) -125.0% Gifts, Grants and Donations - - - - - - - - - - - - 0.0% Indirect Cost Recoveries 5.5 5.4 7.4 5.9 6.1 5.7 5.0 5.5 8.7 55.2 60.6 (5.4) -8.9% Patient/Client Care Reimbursement (3.7) 53.7 2.2 (17.1) 7.7 (107.3) 49.3 1.2 7.2 (6.8) (10.3) 3.5 34.0% Rebates - 1.7 (0.9) - 3.2 - (0.7) 2.6 - 5.9 4.5 1.4 31.1% Restitution and Settlements 0.2 - - 0.1 - - - 0.2 0.7 1.2 5.9 (4.7) -79.7%
9 Months Ended December 31
20
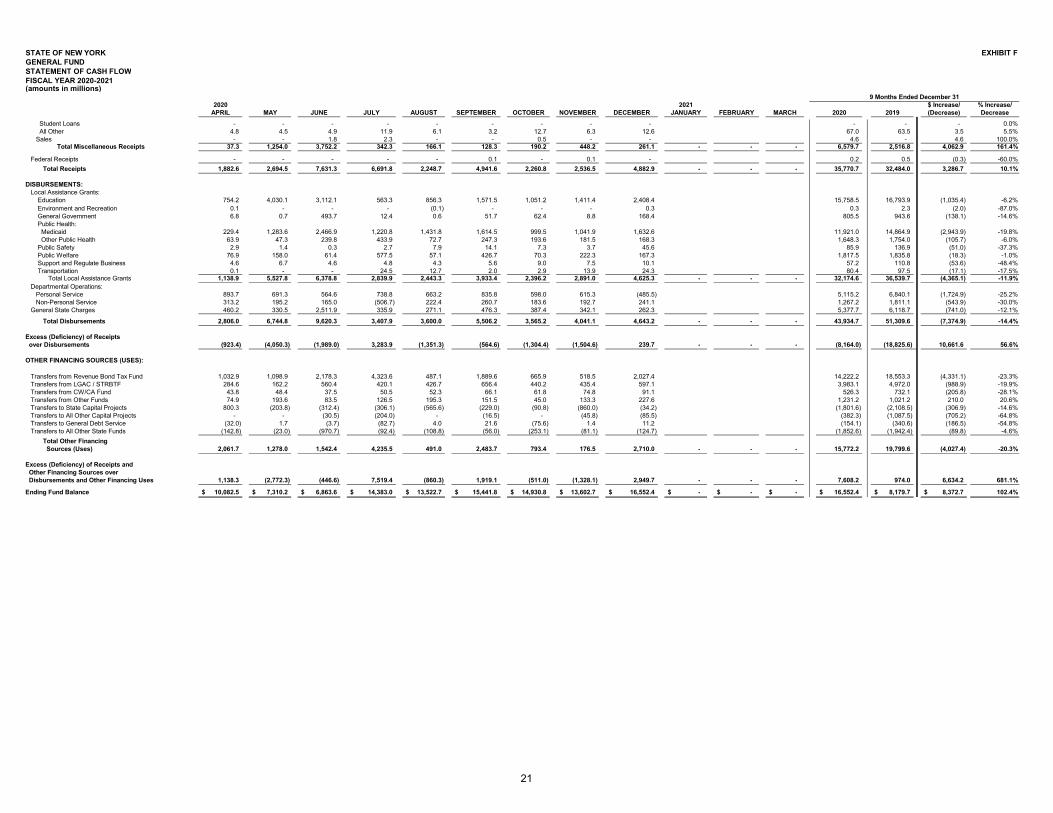
STATE OF NEW YORK EXHIBIT FGENERAL FUND
STATEMENT OF CASH FLOWFISCAL YEAR 2020-2021 (amounts in millions)
2020 2021 $ Increase/ % Increase/APRIL MAY JUNE JULY AUGUST SEPTEMBER OCTOBER NOVEMBER DECEMBER JANUARY FEBRUARY MARCH 2020 2019 (Decrease) Decrease
9 Months Ended December 31
Student Loans - - - - - - - - - - - - 0.0% All Other 4.8 4.5 4.9 11.9 6.1 3.2 12.7 6.3 12.6 67.0 63.5 3.5 5.5% Sales - - 1.8 2.3 - - 0.5 - - 4.6 - 4.6 100.0% Total Miscellaneous Receipts 37.3 1,254.0 3,752.2 342.3 166.1 128.3 190.2 448.2 261.1 - - - 6,579.7 2,516.8 4,062.9 161.4%
Federal Receipts - - - - - 0.1 - 0.1 - 0.2 0.5 (0.3) -60.0% Total Receipts 1,882.6 2,694.5 7,631.3 6,691.8 2,248.7 4,941.6 2,260.8 2,536.5 4,882.9 - - - 35,770.7 32,484.0 3,286.7 10.1%
DISBURSEMENTS: Local Assistance Grants: Education 754.2 4,030.1 3,112.1 563.3 856.3 1,571.5 1,051.2 1,411.4 2,408.4 15,758.5 16,793.9 (1,035.4) -6.2% Environment and Recreation 0.1 - - - (0.1) - - - 0.3 0.3 2.3 (2.0) -87.0% General Government 6.8 0.7 493.7 12.4 0.6 51.7 62.4 8.8 168.4 805.5 943.6 (138.1) -14.6% Public Health: Medicaid 229.4 1,283.6 2,466.9 1,220.8 1,431.8 1,614.5 999.5 1,041.9 1,632.6 11,921.0 14,864.9 (2,943.9) -19.8% Other Public Health 63.9 47.3 239.8 433.9 72.7 247.3 193.6 181.5 168.3 1,648.3 1,754.0 (105.7) -6.0% Public Safety 2.9 1.4 0.3 2.7 7.9 14.1 7.3 3.7 45.6 85.9 136.9 (51.0) -37.3% Public Welfare 76.9 158.0 61.4 577.5 57.1 426.7 70.3 222.3 167.3 1,817.5 1,835.8 (18.3) -1.0% Support and Regulate Business 4.6 6.7 4.6 4.8 4.3 5.6 9.0 7.5 10.1 57.2 110.8 (53.6) -48.4% Transportation 0.1 - - 24.5 12.7 2.0 2.9 13.9 24.3 80.4 97.5 (17.1) -17.5% Total Local Assistance Grants 1,138.9 5,527.8 6,378.8 2,839.9 2,443.3 3,933.4 2,396.2 2,891.0 4,625.3 - - - 32,174.6 36,539.7 (4,365.1) -11.9% Departmental Operations: Personal Service 893.7 691.3 564.6 738.8 663.2 835.8 598.0 615.3 (485.5) 5,115.2 6,840.1 (1,724.9) -25.2% Non-Personal Service 313.2 195.2 165.0 (506.7) 222.4 260.7 183.6 192.7 241.1 1,267.2 1,811.1 (543.9) -30.0% General State Charges 460.2 330.5 2,511.9 335.9 271.1 476.3 387.4 342.1 262.3 5,377.7 6,118.7 (741.0) -12.1%
Total Disbursements 2,806.0 6,744.8 9,620.3 3,407.9 3,600.0 5,506.2 3,565.2 4,041.1 4,643.2 - - - 43,934.7 51,309.6 (7,374.9) -14.4%
Excess (Deficiency) of Receipts over Disbursements (923.4) (4,050.3) (1,989.0) 3,283.9 (1,351.3) (564.6) (1,304.4) (1,504.6) 239.7 - - - (8,164.0) (18,825.6) 10,661.6 56.6%
OTHER FINANCING SOURCES (USES):
Transfers from Revenue Bond Tax Fund 1,032.9 1,098.9 2,178.3 4,323.6 487.1 1,889.6 665.9 518.5 2,027.4 14,222.2 18,553.3 (4,331.1) -23.3% Transfers from LGAC / STRBTF 284.6 162.2 560.4 420.1 426.7 656.4 440.2 435.4 597.1 3,983.1 4,972.0 (988.9) -19.9% Transfers from CW/CA Fund 43.8 48.4 37.5 50.5 52.3 66.1 61.8 74.8 91.1 526.3 732.1 (205.8) -28.1% Transfers from Other Funds 74.9 193.6 83.5 126.5 195.3 151.5 45.0 133.3 227.6 1,231.2 1,021.2 210.0 20.6% Transfers to State Capital Projects 800.3 (203.8) (312.4) (306.1) (565.6) (229.0) (90.8) (860.0) (34.2) (1,801.6) (2,108.5) (306.9) -14.6% Transfers to All Other Capital Projects - - (30.5) (204.0) - (16.5) - (45.8) (85.5) (382.3) (1,087.5) (705.2) -64.8% Transfers to General Debt Service (32.0) 1.7 (3.7) (82.7) 4.0 21.6 (75.6) 1.4 11.2 (154.1) (340.6) (186.5) -54.8% Transfers to All Other State Funds (142.8) (23.0) (970.7) (92.4) (108.8) (56.0) (253.1) (81.1) (124.7) (1,852.6) (1,942.4) (89.8) -4.6% Total Other Financing Sources (Uses) 2,061.7 1,278.0 1,542.4 4,235.5 491.0 2,483.7 793.4 176.5 2,710.0 - - - 15,772.2 19,799.6 (4,027.4) -20.3%
Excess (Deficiency) of Receipts and Other Financing Sources over Disbursements and Other Financing Uses 1,138.3 (2,772.3) (446.6) 7,519.4 (860.3) 1,919.1 (511.0) (1,328.1) 2,949.7 - - - 7,608.2 974.0 6,634.2 681.1%
Ending Fund Balance 10,082.5$ 7,310.2$ 6,863.6$ 14,383.0$ 13,522.7$ 15,441.8$ 14,930.8$ 13,602.7$ 16,552.4$ -$ -$ -$ 16,552.4$ 8,179.7$ 8,372.7$ 102.4%
21
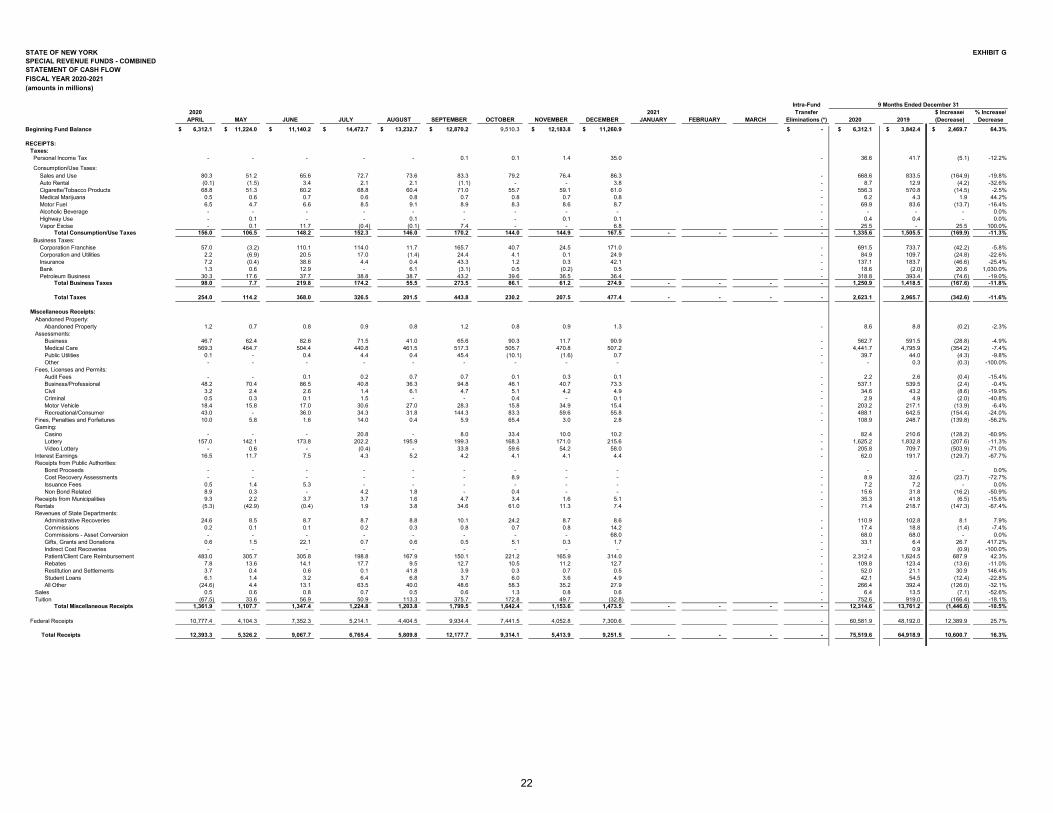
STATE OF NEW YORK EXHIBIT GSPECIAL REVENUE FUNDS - COMBINED STATEMENT OF CASH FLOWFISCAL YEAR 2020-2021 (amounts in millions)
Intra-Fund2020 2021 Transfer $ Increase/ % Increase/
APRIL MAY JUNE JULY AUGUST SEPTEMBER OCTOBER NOVEMBER DECEMBER JANUARY FEBRUARY MARCH Eliminations (*) 2020 2019 (Decrease) DecreaseBeginning Fund Balance 6,312.1$ 11,224.0$ 11,140.2$ 14,472.7$ 13,232.7$ 12,870.2$ 9,510.3 12,183.8$ 11,260.9$ -$ 6,312.1$ 3,842.4$ 2,469.7$ 64.3%
RECEIPTS: Taxes: Personal Income Tax - - - - - 0.1 0.1 1.4 35.0 - 36.6 41.7 (5.1) -12.2% Consumption/Use Taxes: Sales and Use 80.3 51.2 65.6 72.7 73.6 83.3 79.2 76.4 86.3 - 668.6 833.5 (164.9) -19.8% Auto Rental (0.1) (1.5) 3.4 2.1 2.1 (1.1) - - 3.8 - 8.7 12.9 (4.2) -32.6% Cigarette/Tobacco Products 68.8 51.3 60.2 68.8 60.4 71.0 55.7 59.1 61.0 - 556.3 570.8 (14.5) -2.5% Medical Marijuana 0.5 0.6 0.7 0.6 0.8 0.7 0.8 0.7 0.8 - 6.2 4.3 1.9 44.2% Motor Fuel 6.5 4.7 6.6 8.5 9.1 8.9 8.3 8.6 8.7 - 69.9 83.6 (13.7) -16.4% Alcoholic Beverage - - - - - - - - - - - - - 0.0% Highway Use - 0.1 - - 0.1 - - 0.1 0.1 - 0.4 0.4 - 0.0% Vapor Excise - 0.1 11.7 (0.4) (0.1) 7.4 - - 6.8 - 25.5 - 25.5 100.0% Total Consumption/Use Taxes 156.0 106.5 148.2 152.3 146.0 170.2 144.0 144.9 167.5 - - - - 1,335.6 1,505.5 (169.9) -11.3% Business Taxes: Corporation Franchise 57.0 (3.2) 110.1 114.0 11.7 165.7 40.7 24.5 171.0 - 691.5 733.7 (42.2) -5.8% Corporation and Utilities 2.2 (6.9) 20.5 17.0 (1.4) 24.4 4.1 0.1 24.9 - 84.9 109.7 (24.8) -22.6% Insurance 7.2 (0.4) 38.6 4.4 0.4 43.3 1.2 0.3 42.1 - 137.1 183.7 (46.6) -25.4% Bank 1.3 0.6 12.9 - 6.1 (3.1) 0.5 (0.2) 0.5 - 18.6 (2.0) 20.6 1,030.0% Petroleum Business 30.3 17.6 37.7 38.8 38.7 43.2 39.6 36.5 36.4 - 318.8 393.4 (74.6) -19.0% Total Business Taxes 98.0 7.7 219.8 174.2 55.5 273.5 86.1 61.2 274.9 - - - - 1,250.9 1,418.5 (167.6) -11.8%
Total Taxes 254.0 114.2 368.0 326.5 201.5 443.8 230.2 207.5 477.4 - - - - 2,623.1 2,965.7 (342.6) -11.6%
Miscellaneous Receipts: Abandoned Property: Abandoned Property 1.2 0.7 0.8 0.9 0.8 1.2 0.8 0.9 1.3 - 8.6 8.8 (0.2) -2.3% Assessments: Business 46.7 62.4 82.6 71.5 41.0 65.6 90.3 11.7 90.9 - 562.7 591.5 (28.8) -4.9% Medical Care 569.3 464.7 504.4 440.8 461.5 517.3 505.7 470.8 507.2 - 4,441.7 4,795.9 (354.2) -7.4% Public Utilities 0.1 - 0.4 4.4 0.4 45.4 (10.1) (1.6) 0.7 - 39.7 44.0 (4.3) -9.8% Other - - - - - - - - - - - 0.3 (0.3) -100.0% Fees, Licenses and Permits: Audit Fees - - 0.1 0.2 0.7 0.7 0.1 0.3 0.1 - 2.2 2.6 (0.4) -15.4% Business/Professional 48.2 70.4 86.5 40.8 36.3 94.8 46.1 40.7 73.3 - 537.1 539.5 (2.4) -0.4% Civil 3.2 2.4 2.6 1.4 6.1 4.7 5.1 4.2 4.9 - 34.6 43.2 (8.6) -19.9% Criminal 0.5 0.3 0.1 1.5 - - 0.4 - 0.1 - 2.9 4.9 (2.0) -40.8% Motor Vehicle 18.4 15.8 17.0 30.6 27.0 28.3 15.8 34.9 15.4 - 203.2 217.1 (13.9) -6.4% Recreational/Consumer 43.0 - 36.0 34.3 31.8 144.3 83.3 59.6 55.8 - 488.1 642.5 (154.4) -24.0% Fines, Penalties and Forfeitures 10.0 5.8 1.6 14.0 0.4 5.9 65.4 3.0 2.8 - 108.9 248.7 (139.8) -56.2% Gaming: Casino - - - 20.8 - 8.0 33.4 10.0 10.2 - 82.4 210.6 (128.2) -60.9% Lottery 157.0 142.1 173.8 202.2 195.9 199.3 168.3 171.0 215.6 - 1,625.2 1,832.8 (207.6) -11.3% Video Lottery - 0.6 - (0.4) - 33.8 59.6 54.2 58.0 - 205.8 709.7 (503.9) -71.0% Interest Earnings 16.5 11.7 7.5 4.3 5.2 4.2 4.1 4.1 4.4 - 62.0 191.7 (129.7) -67.7% Receipts from Public Authorities: Bond Proceeds - - - - - - - - - - - - - 0.0% Cost Recovery Assessments - - - - - - 8.9 - - - 8.9 32.6 (23.7) -72.7% Issuance Fees 0.5 1.4 5.3 - - - - - - - 7.2 7.2 - 0.0% Non Bond Related 8.9 0.3 - 4.2 1.8 - 0.4 - - - 15.6 31.8 (16.2) -50.9% Receipts from Municipalities 9.3 2.2 3.7 3.7 1.6 4.7 3.4 1.6 5.1 - 35.3 41.8 (6.5) -15.6% Rentals (5.3) (42.9) (0.4) 1.9 3.8 34.6 61.0 11.3 7.4 - 71.4 218.7 (147.3) -67.4% Revenues of State Departments: Administrative Recoveries 24.6 8.5 8.7 8.7 8.8 10.1 24.2 8.7 8.6 - 110.9 102.8 8.1 7.9% Commissions 0.2 0.1 0.1 0.2 0.3 0.8 0.7 0.8 14.2 - 17.4 18.8 (1.4) -7.4% Commissions - Asset Conversion - - - - - - - - 68.0 - 68.0 68.0 - 0.0% Gifts, Grants and Donations 0.6 1.5 22.1 0.7 0.6 0.5 5.1 0.3 1.7 - 33.1 6.4 26.7 417.2% Indirect Cost Recoveries - - - - - - - - - - - 0.9 (0.9) -100.0% Patient/Client Care Reimbursement 483.0 305.7 305.8 198.8 167.9 150.1 221.2 165.9 314.0 - 2,312.4 1,624.5 687.9 42.3% Rebates 7.8 13.6 14.1 17.7 9.5 12.7 10.5 11.2 12.7 - 109.8 123.4 (13.6) -11.0% Restitution and Settlements 3.7 0.4 0.6 0.1 41.8 3.9 0.3 0.7 0.5 - 52.0 21.1 30.9 146.4% Student Loans 6.1 1.4 3.2 6.4 6.8 3.7 6.0 3.6 4.9 - 42.1 54.5 (12.4) -22.8% All Other (24.6) 4.4 13.1 63.5 40.0 48.6 58.3 35.2 27.9 - 266.4 392.4 (126.0) -32.1% Sales 0.5 0.6 0.8 0.7 0.5 0.6 1.3 0.8 0.6 - 6.4 13.5 (7.1) -52.6% Tuition (67.5) 33.6 56.9 50.9 113.3 375.7 172.8 49.7 (32.8) - 752.6 919.0 (166.4) -18.1% Total Miscellaneous Receipts 1,361.9 1,107.7 1,347.4 1,224.8 1,203.8 1,799.5 1,642.4 1,153.6 1,473.5 - - - - 12,314.6 13,761.2 (1,446.6) -10.5%
Federal Receipts 10,777.4 4,104.3 7,352.3 5,214.1 4,404.5 9,934.4 7,441.5 4,052.8 7,300.6 - 60,581.9 48,192.0 12,389.9 25.7%
Total Receipts 12,393.3 5,326.2 9,067.7 6,765.4 5,809.8 12,177.7 9,314.1 5,413.9 9,251.5 - - - - 75,519.6 64,918.9 10,600.7 16.3%
9 Months Ended December 31
22
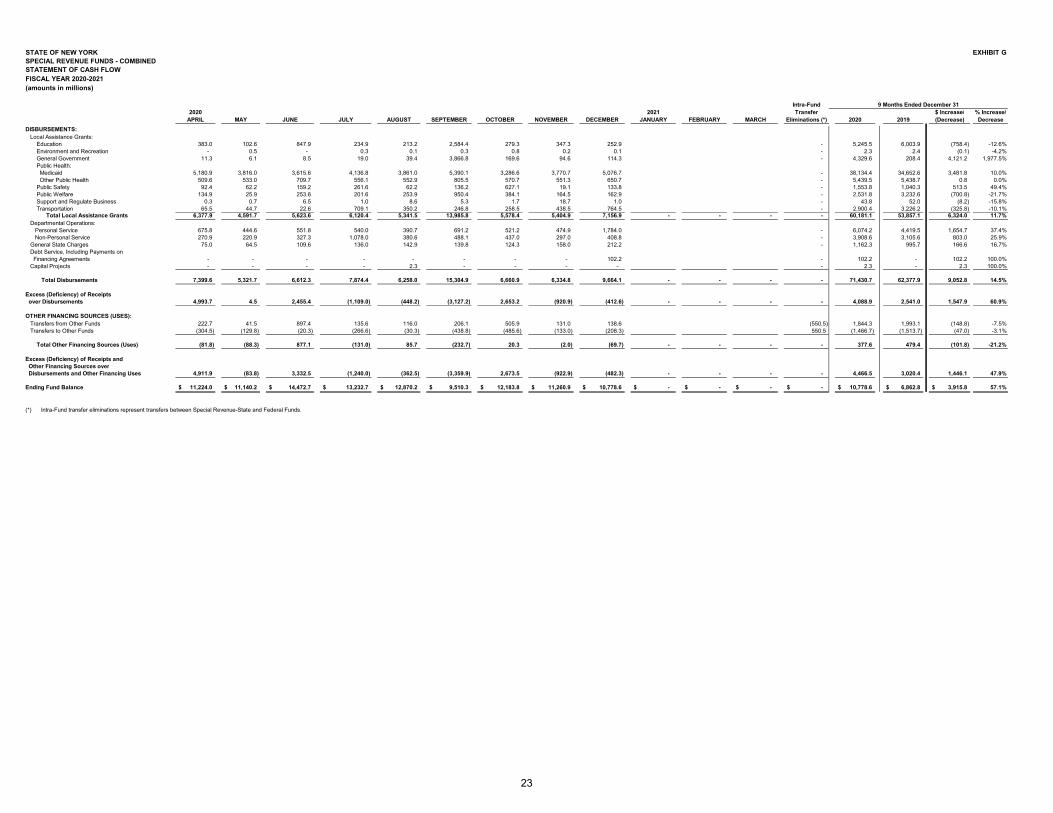
STATE OF NEW YORK EXHIBIT GSPECIAL REVENUE FUNDS - COMBINED STATEMENT OF CASH FLOWFISCAL YEAR 2020-2021 (amounts in millions)
Intra-Fund2020 2021 Transfer $ Increase/ % Increase/
APRIL MAY JUNE JULY AUGUST SEPTEMBER OCTOBER NOVEMBER DECEMBER JANUARY FEBRUARY MARCH Eliminations (*) 2020 2019 (Decrease) Decrease
9 Months Ended December 31
DISBURSEMENTS: Local Assistance Grants: Education 383.0 102.6 847.9 234.9 213.2 2,584.4 279.3 347.3 252.9 - 5,245.5 6,003.9 (758.4) -12.6% Environment and Recreation - 0.5 - 0.3 0.1 0.3 0.8 0.2 0.1 - 2.3 2.4 (0.1) -4.2% General Government 11.3 6.1 8.5 19.0 39.4 3,866.8 169.6 94.6 114.3 - 4,329.6 208.4 4,121.2 1,977.5% Public Health: Medicaid 5,180.9 3,816.0 3,615.6 4,136.8 3,861.0 5,390.1 3,286.6 3,770.7 5,076.7 - 38,134.4 34,652.6 3,481.8 10.0% Other Public Health 509.6 533.0 709.7 556.1 552.9 805.5 570.7 551.3 650.7 - 5,439.5 5,438.7 0.8 0.0% Public Safety 92.4 62.2 159.2 261.6 62.2 136.2 627.1 19.1 133.8 - 1,553.8 1,040.3 513.5 49.4% Public Welfare 134.9 25.9 253.6 201.6 253.9 950.4 384.1 164.5 162.9 - 2,531.8 3,232.6 (700.8) -21.7% Support and Regulate Business 0.3 0.7 6.5 1.0 8.6 5.3 1.7 18.7 1.0 - 43.8 52.0 (8.2) -15.8% Transportation 65.5 44.7 22.6 709.1 350.2 246.8 258.5 438.5 764.5 - 2,900.4 3,226.2 (325.8) -10.1% Total Local Assistance Grants 6,377.9 4,591.7 5,623.6 6,120.4 5,341.5 13,985.8 5,578.4 5,404.9 7,156.9 - - - - 60,181.1 53,857.1 6,324.0 11.7% Departmental Operations: Personal Service 675.8 444.6 551.8 540.0 390.7 691.2 521.2 474.9 1,784.0 - 6,074.2 4,419.5 1,654.7 37.4% Non-Personal Service 270.9 220.9 327.3 1,078.0 380.6 488.1 437.0 297.0 408.8 - 3,908.6 3,105.6 803.0 25.9% General State Charges 75.0 64.5 109.6 136.0 142.9 139.8 124.3 158.0 212.2 - 1,162.3 995.7 166.6 16.7% Debt Service, Including Payments on Financing Agreements - - - - - - - - 102.2 - 102.2 - 102.2 100.0% Capital Projects - - - - 2.3 - - - - - 2.3 - 2.3 100.0%
Total Disbursements 7,399.6 5,321.7 6,612.3 7,874.4 6,258.0 15,304.9 6,660.9 6,334.8 9,664.1 - - - - 71,430.7 62,377.9 9,052.8 14.5%
Excess (Deficiency) of Receipts over Disbursements 4,993.7 4.5 2,455.4 (1,109.0) (448.2) (3,127.2) 2,653.2 (920.9) (412.6) - - - - 4,088.9 2,541.0 1,547.9 60.9%
OTHER FINANCING SOURCES (USES): Transfers from Other Funds 222.7 41.5 897.4 135.6 116.0 206.1 505.9 131.0 138.6 (550.5) 1,844.3 1,993.1 (148.8) -7.5% Transfers to Other Funds (304.5) (129.8) (20.3) (266.6) (30.3) (438.8) (485.6) (133.0) (208.3) 550.5 (1,466.7) (1,513.7) (47.0) -3.1%
Total Other Financing Sources (Uses) (81.8) (88.3) 877.1 (131.0) 85.7 (232.7) 20.3 (2.0) (69.7) - - - - 377.6 479.4 (101.8) -21.2%
Excess (Deficiency) of Receipts and Other Financing Sources over Disbursements and Other Financing Uses 4,911.9 (83.8) 3,332.5 (1,240.0) (362.5) (3,359.9) 2,673.5 (922.9) (482.3) - - - - 4,466.5 3,020.4 1,446.1 47.9%
Ending Fund Balance 11,224.0$ 11,140.2$ 14,472.7$ 13,232.7$ 12,870.2$ 9,510.3$ 12,183.8$ 11,260.9$ 10,778.6$ -$ -$ -$ -$ 10,778.6$ 6,862.8$ 3,915.8$ 57.1%
(*) Intra-Fund transfer eliminations represent transfers between Special Revenue-State and Federal Funds.
23
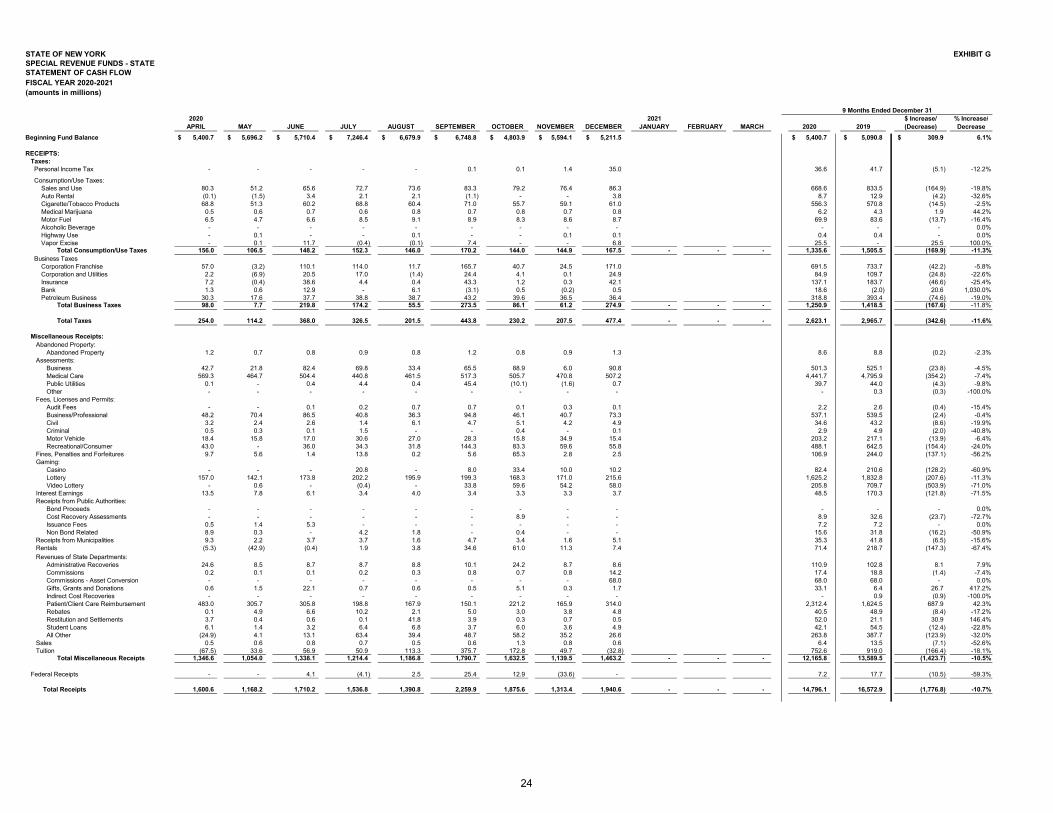
STATE OF NEW YORK EXHIBIT GSPECIAL REVENUE FUNDS - STATESTATEMENT OF CASH FLOWFISCAL YEAR 2020-2021 (amounts in millions)
2020 2021 $ Increase/ % Increase/APRIL MAY JUNE JULY AUGUST SEPTEMBER OCTOBER NOVEMBER DECEMBER JANUARY FEBRUARY MARCH 2020 2019 (Decrease) Decrease
Beginning Fund Balance 5,400.7$ 5,696.2$ 5,710.4$ 7,246.4$ 6,679.9$ 6,748.8$ 4,803.9$ 5,594.1$ 5,211.5$ 5,400.7$ 5,090.8$ 309.9$ 6.1%
RECEIPTS: Taxes: Personal Income Tax - - - - - 0.1 0.1 1.4 35.0 36.6 41.7 (5.1) -12.2% Consumption/Use Taxes: Sales and Use 80.3 51.2 65.6 72.7 73.6 83.3 79.2 76.4 86.3 668.6 833.5 (164.9) -19.8% Auto Rental (0.1) (1.5) 3.4 2.1 2.1 (1.1) - - 3.8 8.7 12.9 (4.2) -32.6% Cigarette/Tobacco Products 68.8 51.3 60.2 68.8 60.4 71.0 55.7 59.1 61.0 556.3 570.8 (14.5) -2.5% Medical Marijuana 0.5 0.6 0.7 0.6 0.8 0.7 0.8 0.7 0.8 6.2 4.3 1.9 44.2% Motor Fuel 6.5 4.7 6.6 8.5 9.1 8.9 8.3 8.6 8.7 69.9 83.6 (13.7) -16.4% Alcoholic Beverage - - - - - - - - - - - - 0.0% Highway Use - 0.1 - - 0.1 - - 0.1 0.1 0.4 0.4 - 0.0% Vapor Excise - 0.1 11.7 (0.4) (0.1) 7.4 - - 6.8 25.5 - 25.5 100.0% Total Consumption/Use Taxes 156.0 106.5 148.2 152.3 146.0 170.2 144.0 144.9 167.5 - - - 1,335.6 1,505.5 (169.9) -11.3% Business Taxes Corporation Franchise 57.0 (3.2) 110.1 114.0 11.7 165.7 40.7 24.5 171.0 691.5 733.7 (42.2) -5.8% Corporation and Utilities 2.2 (6.9) 20.5 17.0 (1.4) 24.4 4.1 0.1 24.9 84.9 109.7 (24.8) -22.6% Insurance 7.2 (0.4) 38.6 4.4 0.4 43.3 1.2 0.3 42.1 137.1 183.7 (46.6) -25.4% Bank 1.3 0.6 12.9 - 6.1 (3.1) 0.5 (0.2) 0.5 18.6 (2.0) 20.6 1,030.0% Petroleum Business 30.3 17.6 37.7 38.8 38.7 43.2 39.6 36.5 36.4 318.8 393.4 (74.6) -19.0% Total Business Taxes 98.0 7.7 219.8 174.2 55.5 273.5 86.1 61.2 274.9 - - - 1,250.9 1,418.5 (167.6) -11.8%
Total Taxes 254.0 114.2 368.0 326.5 201.5 443.8 230.2 207.5 477.4 - - - 2,623.1 2,965.7 (342.6) -11.6%
Miscellaneous Receipts: Abandoned Property: Abandoned Property 1.2 0.7 0.8 0.9 0.8 1.2 0.8 0.9 1.3 8.6 8.8 (0.2) -2.3% Assessments: Business 42.7 21.8 82.4 69.8 33.4 65.5 88.9 6.0 90.8 501.3 525.1 (23.8) -4.5% Medical Care 569.3 464.7 504.4 440.8 461.5 517.3 505.7 470.8 507.2 4,441.7 4,795.9 (354.2) -7.4% Public Utilities 0.1 - 0.4 4.4 0.4 45.4 (10.1) (1.6) 0.7 39.7 44.0 (4.3) -9.8% Other - - - - - - - - - - 0.3 (0.3) -100.0% Fees, Licenses and Permits: Audit Fees - - 0.1 0.2 0.7 0.7 0.1 0.3 0.1 2.2 2.6 (0.4) -15.4% Business/Professional 48.2 70.4 86.5 40.8 36.3 94.8 46.1 40.7 73.3 537.1 539.5 (2.4) -0.4% Civil 3.2 2.4 2.6 1.4 6.1 4.7 5.1 4.2 4.9 34.6 43.2 (8.6) -19.9% Criminal 0.5 0.3 0.1 1.5 - - 0.4 - 0.1 2.9 4.9 (2.0) -40.8% Motor Vehicle 18.4 15.8 17.0 30.6 27.0 28.3 15.8 34.9 15.4 203.2 217.1 (13.9) -6.4% Recreational/Consumer 43.0 - 36.0 34.3 31.8 144.3 83.3 59.6 55.8 488.1 642.5 (154.4) -24.0% Fines, Penalties and Forfeitures 9.7 5.6 1.4 13.8 0.2 5.6 65.3 2.8 2.5 106.9 244.0 (137.1) -56.2% Gaming: Casino - - - 20.8 - 8.0 33.4 10.0 10.2 82.4 210.6 (128.2) -60.9% Lottery 157.0 142.1 173.8 202.2 195.9 199.3 168.3 171.0 215.6 1,625.2 1,832.8 (207.6) -11.3% Video Lottery - 0.6 - (0.4) - 33.8 59.6 54.2 58.0 205.8 709.7 (503.9) -71.0% Interest Earnings 13.5 7.8 6.1 3.4 4.0 3.4 3.3 3.3 3.7 48.5 170.3 (121.8) -71.5% Receipts from Public Authorities: Bond Proceeds - - - - - - - - - - - - 0.0% Cost Recovery Assessments - - - - - - 8.9 - - 8.9 32.6 (23.7) -72.7% Issuance Fees 0.5 1.4 5.3 - - - - - - 7.2 7.2 - 0.0% Non Bond Related 8.9 0.3 - 4.2 1.8 - 0.4 - - 15.6 31.8 (16.2) -50.9% Receipts from Municipalities 9.3 2.2 3.7 3.7 1.6 4.7 3.4 1.6 5.1 35.3 41.8 (6.5) -15.6% Rentals (5.3) (42.9) (0.4) 1.9 3.8 34.6 61.0 11.3 7.4 71.4 218.7 (147.3) -67.4% Revenues of State Departments: Administrative Recoveries 24.6 8.5 8.7 8.7 8.8 10.1 24.2 8.7 8.6 110.9 102.8 8.1 7.9% Commissions 0.2 0.1 0.1 0.2 0.3 0.8 0.7 0.8 14.2 17.4 18.8 (1.4) -7.4% Commissions - Asset Conversion - - - - - - - - 68.0 68.0 68.0 - 0.0% Gifts, Grants and Donations 0.6 1.5 22.1 0.7 0.6 0.5 5.1 0.3 1.7 33.1 6.4 26.7 417.2% Indirect Cost Recoveries - - - - - - - - - - 0.9 (0.9) -100.0% Patient/Client Care Reimbursement 483.0 305.7 305.8 198.8 167.9 150.1 221.2 165.9 314.0 2,312.4 1,624.5 687.9 42.3% Rebates 0.1 4.9 6.6 10.2 2.1 5.0 3.0 3.8 4.8 40.5 48.9 (8.4) -17.2% Restitution and Settlements 3.7 0.4 0.6 0.1 41.8 3.9 0.3 0.7 0.5 52.0 21.1 30.9 146.4% Student Loans 6.1 1.4 3.2 6.4 6.8 3.7 6.0 3.6 4.9 42.1 54.5 (12.4) -22.8% All Other (24.9) 4.1 13.1 63.4 39.4 48.7 58.2 35.2 26.6 263.8 387.7 (123.9) -32.0% Sales 0.5 0.6 0.8 0.7 0.5 0.6 1.3 0.8 0.6 6.4 13.5 (7.1) -52.6% Tuition (67.5) 33.6 56.9 50.9 113.3 375.7 172.8 49.7 (32.8) 752.6 919.0 (166.4) -18.1% Total Miscellaneous Receipts 1,346.6 1,054.0 1,338.1 1,214.4 1,186.8 1,790.7 1,632.5 1,139.5 1,463.2 - - - 12,165.8 13,589.5 (1,423.7) -10.5%
Federal Receipts - - 4.1 (4.1) 2.5 25.4 12.9 (33.6) - 7.2 17.7 (10.5) -59.3%
Total Receipts 1,600.6 1,168.2 1,710.2 1,536.8 1,390.8 2,259.9 1,875.6 1,313.4 1,940.6 - - - 14,796.1 16,572.9 (1,776.8) -10.7%
9 Months Ended December 31
24
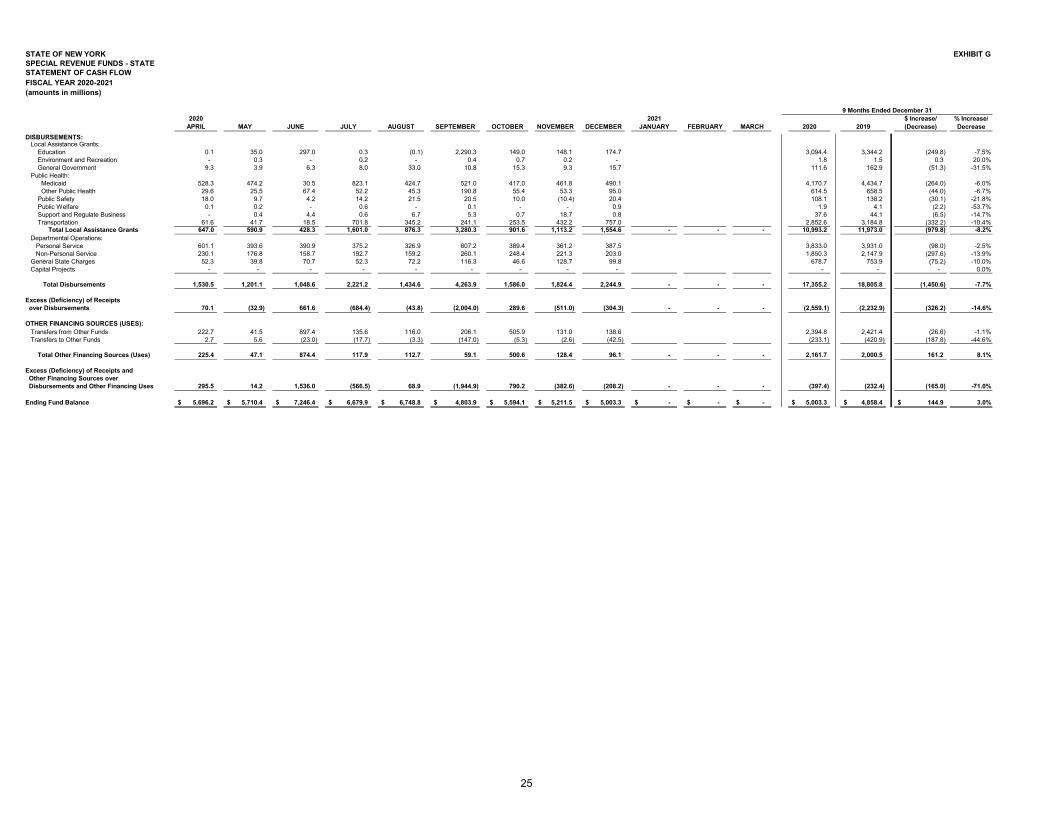
STATE OF NEW YORK EXHIBIT GSPECIAL REVENUE FUNDS - STATESTATEMENT OF CASH FLOWFISCAL YEAR 2020-2021 (amounts in millions)
2020 2021 $ Increase/ % Increase/APRIL MAY JUNE JULY AUGUST SEPTEMBER OCTOBER NOVEMBER DECEMBER JANUARY FEBRUARY MARCH 2020 2019 (Decrease) Decrease
9 Months Ended December 31
DISBURSEMENTS: Local Assistance Grants: Education 0.1 35.0 297.0 0.3 (0.1) 2,290.3 149.0 148.1 174.7 3,094.4 3,344.2 (249.8) -7.5% Environment and Recreation - 0.3 - 0.2 - 0.4 0.7 0.2 - 1.8 1.5 0.3 20.0% General Government 9.3 3.9 6.3 8.0 33.0 10.8 15.3 9.3 15.7 111.6 162.9 (51.3) -31.5% Public Health: Medicaid 528.3 474.2 30.5 823.1 424.7 521.0 417.0 461.8 490.1 4,170.7 4,434.7 (264.0) -6.0% Other Public Health 29.6 25.5 67.4 52.2 45.3 190.8 55.4 53.3 95.0 614.5 658.5 (44.0) -6.7% Public Safety 18.0 9.7 4.2 14.2 21.5 20.5 10.0 (10.4) 20.4 108.1 138.2 (30.1) -21.8% Public Welfare 0.1 0.2 - 0.6 - 0.1 - - 0.9 1.9 4.1 (2.2) -53.7% Support and Regulate Business - 0.4 4.4 0.6 6.7 5.3 0.7 18.7 0.8 37.6 44.1 (6.5) -14.7% Transportation 61.6 41.7 18.5 701.8 345.2 241.1 253.5 432.2 757.0 2,852.6 3,184.8 (332.2) -10.4% Total Local Assistance Grants 647.0 590.9 428.3 1,601.0 876.3 3,280.3 901.6 1,113.2 1,554.6 - - - 10,993.2 11,973.0 (979.8) -8.2% Departmental Operations: Personal Service 601.1 393.6 390.9 375.2 326.9 607.2 389.4 361.2 387.5 3,833.0 3,931.0 (98.0) -2.5% Non-Personal Service 230.1 176.8 158.7 192.7 159.2 260.1 248.4 221.3 203.0 1,850.3 2,147.9 (297.6) -13.9% General State Charges 52.3 39.8 70.7 52.3 72.2 116.3 46.6 128.7 99.8 678.7 753.9 (75.2) -10.0% Capital Projects - - - - - - - - - - - - 0.0%
Total Disbursements 1,530.5 1,201.1 1,048.6 2,221.2 1,434.6 4,263.9 1,586.0 1,824.4 2,244.9 - - - 17,355.2 18,805.8 (1,450.6) -7.7%
Excess (Deficiency) of Receipts over Disbursements 70.1 (32.9) 661.6 (684.4) (43.8) (2,004.0) 289.6 (511.0) (304.3) - - - (2,559.1) (2,232.9) (326.2) -14.6%
OTHER FINANCING SOURCES (USES): Transfers from Other Funds 222.7 41.5 897.4 135.6 116.0 206.1 505.9 131.0 138.6 2,394.8 2,421.4 (26.6) -1.1% Transfers to Other Funds 2.7 5.6 (23.0) (17.7) (3.3) (147.0) (5.3) (2.6) (42.5) (233.1) (420.9) (187.8) -44.6%
Total Other Financing Sources (Uses) 225.4 47.1 874.4 117.9 112.7 59.1 500.6 128.4 96.1 - - - 2,161.7 2,000.5 161.2 8.1%
Excess (Deficiency) of Receipts and Other Financing Sources over Disbursements and Other Financing Uses 295.5 14.2 1,536.0 (566.5) 68.9 (1,944.9) 790.2 (382.6) (208.2) - - - (397.4) (232.4) (165.0) -71.0%
Ending Fund Balance 5,696.2$ 5,710.4$ 7,246.4$ 6,679.9$ 6,748.8$ 4,803.9$ 5,594.1$ 5,211.5$ 5,003.3$ -$ -$ -$ 5,003.3$ 4,858.4$ 144.9$ 3.0%
25
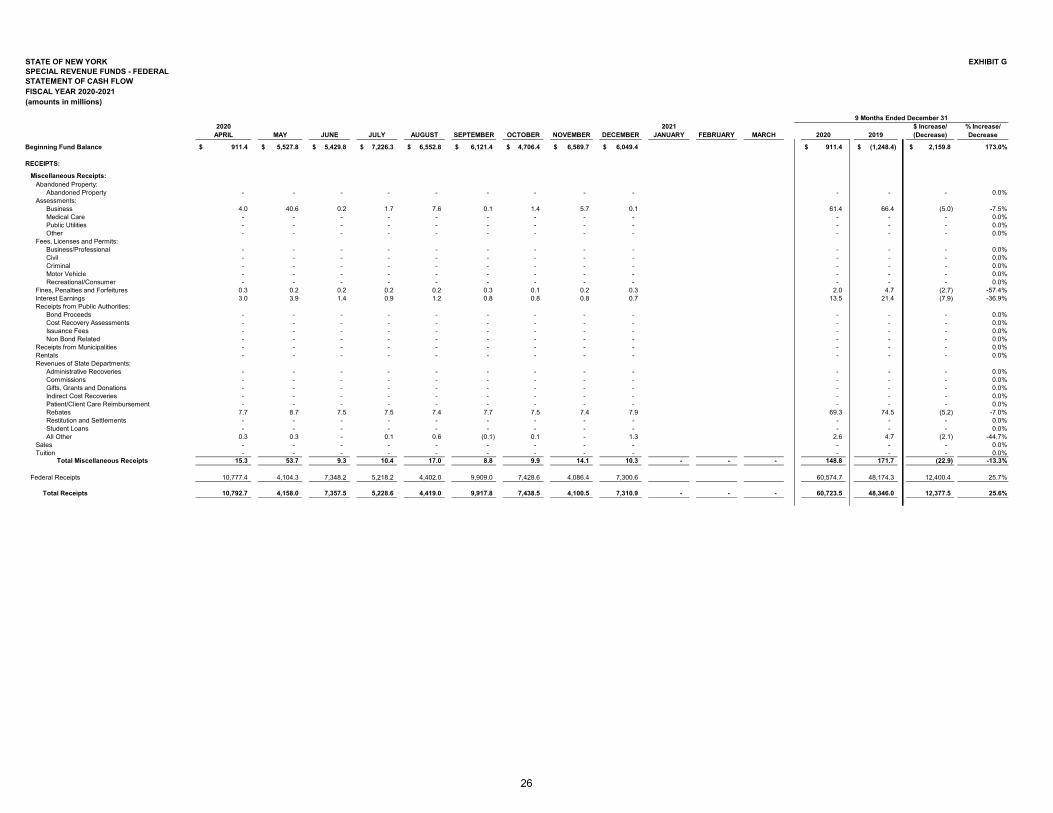
STATE OF NEW YORK EXHIBIT GSPECIAL REVENUE FUNDS - FEDERALSTATEMENT OF CASH FLOWFISCAL YEAR 2020-2021 (amounts in millions)
2020 2021 $ Increase/ % Increase/APRIL MAY JUNE JULY AUGUST SEPTEMBER OCTOBER NOVEMBER DECEMBER JANUARY FEBRUARY MARCH 2020 2019 (Decrease) Decrease
Beginning Fund Balance 911.4$ 5,527.8$ 5,429.8$ 7,226.3$ 6,552.8$ 6,121.4$ 4,706.4$ 6,589.7$ 6,049.4$ 911.4$ (1,248.4)$ 2,159.8$ 173.0%
RECEIPTS:
Miscellaneous Receipts: Abandoned Property: Abandoned Property - - - - - - - - - - - - 0.0% Assessments: Business 4.0 40.6 0.2 1.7 7.6 0.1 1.4 5.7 0.1 61.4 66.4 (5.0) -7.5% Medical Care - - - - - - - - - - - - 0.0% Public Utilities - - - - - - - - - - - - 0.0% Other - - - - - - - - - - - - 0.0% Fees, Licenses and Permits: Business/Professional - - - - - - - - - - - - 0.0% Civil - - - - - - - - - - - - 0.0% Criminal - - - - - - - - - - - - 0.0% Motor Vehicle - - - - - - - - - - - - 0.0% Recreational/Consumer - - - - - - - - - - - - 0.0% Fines, Penalties and Forfeitures 0.3 0.2 0.2 0.2 0.2 0.3 0.1 0.2 0.3 2.0 4.7 (2.7) -57.4% Interest Earnings 3.0 3.9 1.4 0.9 1.2 0.8 0.8 0.8 0.7 13.5 21.4 (7.9) -36.9% Receipts from Public Authorities: Bond Proceeds - - - - - - - - - - - - 0.0% Cost Recovery Assessments - - - - - - - - - - - - 0.0% Issuance Fees - - - - - - - - - - - - 0.0% Non Bond Related - - - - - - - - - - - - 0.0% Receipts from Municipalities - - - - - - - - - - - - 0.0% Rentals - - - - - - - - - - - - 0.0% Revenues of State Departments: Administrative Recoveries - - - - - - - - - - - - 0.0% Commissions - - - - - - - - - - - - 0.0% Gifts, Grants and Donations - - - - - - - - - - - - 0.0% Indirect Cost Recoveries - - - - - - - - - - - - 0.0% Patient/Client Care Reimbursement - - - - - - - - - - - - 0.0% Rebates 7.7 8.7 7.5 7.5 7.4 7.7 7.5 7.4 7.9 69.3 74.5 (5.2) -7.0% Restitution and Settlements - - - - - - - - - - - - 0.0% Student Loans - - - - - - - - - - - - 0.0% All Other 0.3 0.3 - 0.1 0.6 (0.1) 0.1 - 1.3 2.6 4.7 (2.1) -44.7% Sales - - - - - - - - - - - - 0.0% Tuition - - - - - - - - - - - - 0.0% Total Miscellaneous Receipts 15.3 53.7 9.3 10.4 17.0 8.8 9.9 14.1 10.3 - - - 148.8 171.7 (22.9) -13.3%
Federal Receipts 10,777.4 4,104.3 7,348.2 5,218.2 4,402.0 9,909.0 7,428.6 4,086.4 7,300.6 60,574.7 48,174.3 12,400.4 25.7%
Total Receipts 10,792.7 4,158.0 7,357.5 5,228.6 4,419.0 9,917.8 7,438.5 4,100.5 7,310.9 - - - 60,723.5 48,346.0 12,377.5 25.6%
9 Months Ended December 31
26
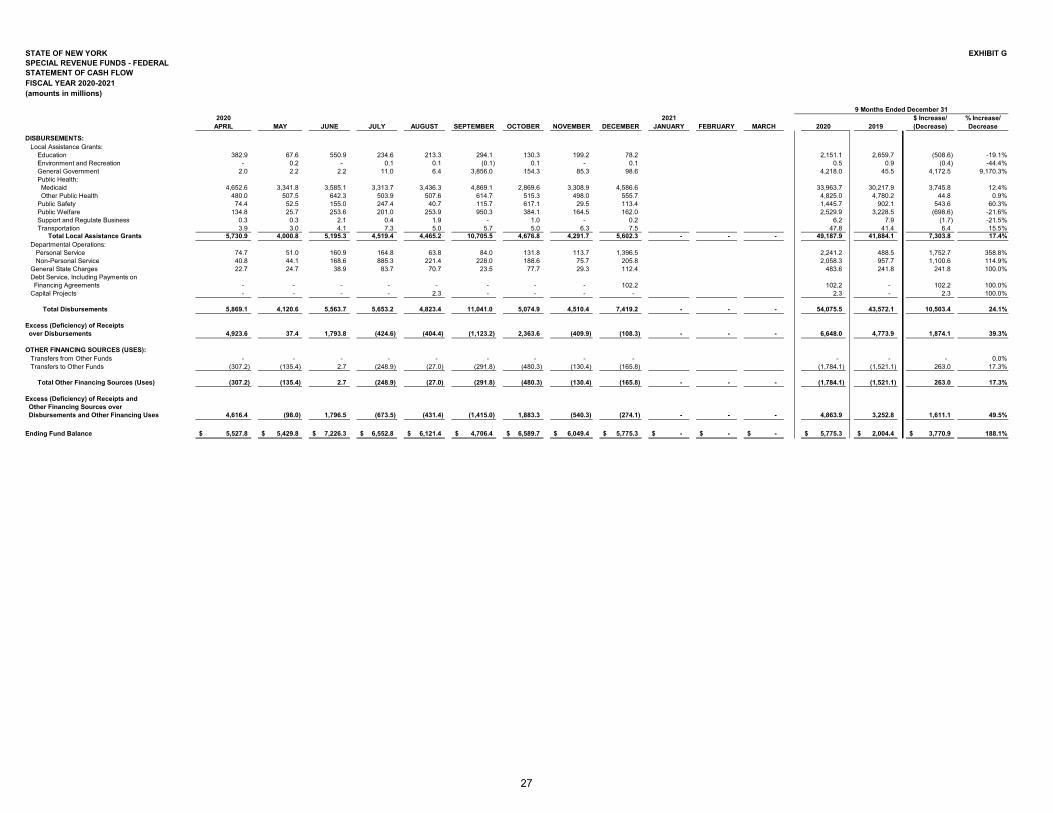
STATE OF NEW YORK EXHIBIT GSPECIAL REVENUE FUNDS - FEDERALSTATEMENT OF CASH FLOWFISCAL YEAR 2020-2021 (amounts in millions)
2020 2021 $ Increase/ % Increase/APRIL MAY JUNE JULY AUGUST SEPTEMBER OCTOBER NOVEMBER DECEMBER JANUARY FEBRUARY MARCH 2020 2019 (Decrease) Decrease
9 Months Ended December 31
DISBURSEMENTS: Local Assistance Grants: Education 382.9 67.6 550.9 234.6 213.3 294.1 130.3 199.2 78.2 2,151.1 2,659.7 (508.6) -19.1% Environment and Recreation - 0.2 - 0.1 0.1 (0.1) 0.1 - 0.1 0.5 0.9 (0.4) -44.4% General Government 2.0 2.2 2.2 11.0 6.4 3,856.0 154.3 85.3 98.6 4,218.0 45.5 4,172.5 9,170.3% Public Health: Medicaid 4,652.6 3,341.8 3,585.1 3,313.7 3,436.3 4,869.1 2,869.6 3,308.9 4,586.6 33,963.7 30,217.9 3,745.8 12.4% Other Public Health 480.0 507.5 642.3 503.9 507.6 614.7 515.3 498.0 555.7 4,825.0 4,780.2 44.8 0.9% Public Safety 74.4 52.5 155.0 247.4 40.7 115.7 617.1 29.5 113.4 1,445.7 902.1 543.6 60.3% Public Welfare 134.8 25.7 253.6 201.0 253.9 950.3 384.1 164.5 162.0 2,529.9 3,228.5 (698.6) -21.6% Support and Regulate Business 0.3 0.3 2.1 0.4 1.9 - 1.0 - 0.2 6.2 7.9 (1.7) -21.5% Transportation 3.9 3.0 4.1 7.3 5.0 5.7 5.0 6.3 7.5 47.8 41.4 6.4 15.5% Total Local Assistance Grants 5,730.9 4,000.8 5,195.3 4,519.4 4,465.2 10,705.5 4,676.8 4,291.7 5,602.3 - - - 49,187.9 41,884.1 7,303.8 17.4% Departmental Operations: Personal Service 74.7 51.0 160.9 164.8 63.8 84.0 131.8 113.7 1,396.5 2,241.2 488.5 1,752.7 358.8% Non-Personal Service 40.8 44.1 168.6 885.3 221.4 228.0 188.6 75.7 205.8 2,058.3 957.7 1,100.6 114.9% General State Charges 22.7 24.7 38.9 83.7 70.7 23.5 77.7 29.3 112.4 483.6 241.8 241.8 100.0% Debt Service, Including Payments on Financing Agreements - - - - - - - - 102.2 102.2 - 102.2 100.0% Capital Projects - - - - 2.3 - - - - 2.3 - 2.3 100.0%
Total Disbursements 5,869.1 4,120.6 5,563.7 5,653.2 4,823.4 11,041.0 5,074.9 4,510.4 7,419.2 - - - 54,075.5 43,572.1 10,503.4 24.1%
Excess (Deficiency) of Receipts over Disbursements 4,923.6 37.4 1,793.8 (424.6) (404.4) (1,123.2) 2,363.6 (409.9) (108.3) - - - 6,648.0 4,773.9 1,874.1 39.3%
OTHER FINANCING SOURCES (USES): Transfers from Other Funds - - - - - - - - - - - - 0.0% Transfers to Other Funds (307.2) (135.4) 2.7 (248.9) (27.0) (291.8) (480.3) (130.4) (165.8) (1,784.1) (1,521.1) 263.0 17.3%
Total Other Financing Sources (Uses) (307.2) (135.4) 2.7 (248.9) (27.0) (291.8) (480.3) (130.4) (165.8) - - - (1,784.1) (1,521.1) 263.0 17.3%
Excess (Deficiency) of Receipts and Other Financing Sources over Disbursements and Other Financing Uses 4,616.4 (98.0) 1,796.5 (673.5) (431.4) (1,415.0) 1,883.3 (540.3) (274.1) - - - 4,863.9 3,252.8 1,611.1 49.5%
Ending Fund Balance 5,527.8$ 5,429.8$ 7,226.3$ 6,552.8$ 6,121.4$ 4,706.4$ 6,589.7$ 6,049.4$ 5,775.3$ -$ -$ -$ 5,775.3$ 2,004.4$ 3,770.9$ 188.1%
27
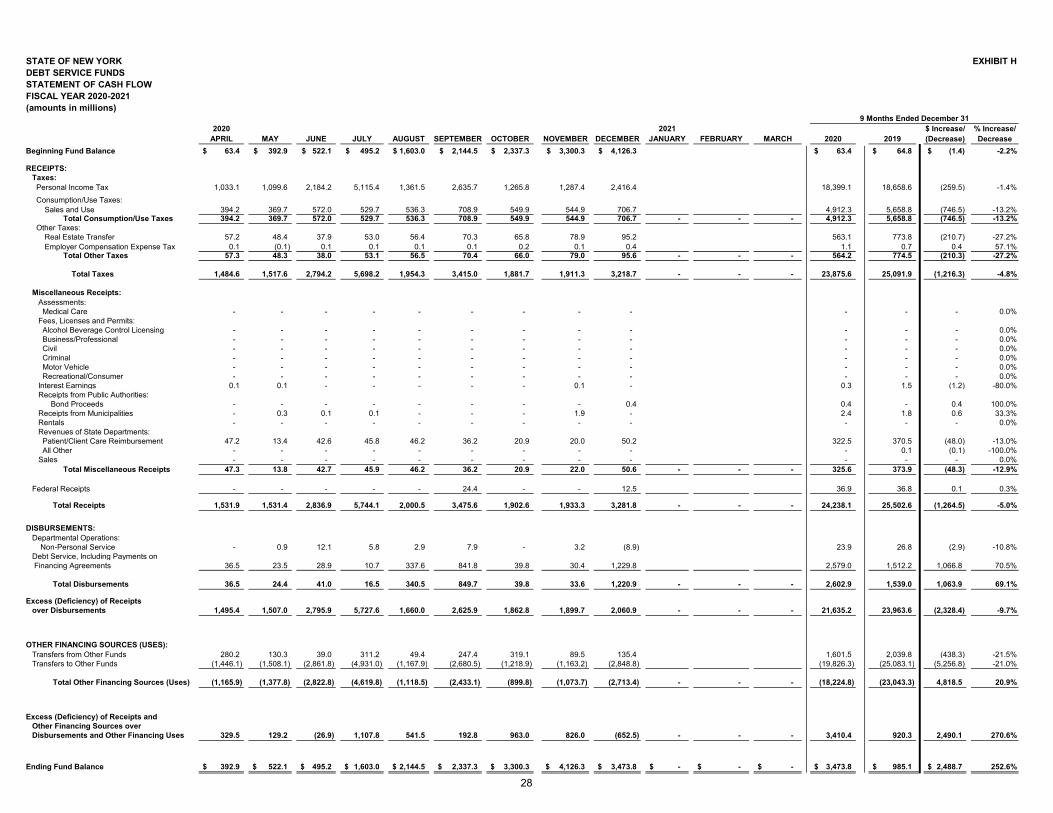
STATE OF NEW YORK EXHIBIT HDEBT SERVICE FUNDSSTATEMENT OF CASH FLOWFISCAL YEAR 2020-2021 (amounts in millions)
2020 2021 $ Increase/ % Increase/APRIL MAY JUNE JULY AUGUST SEPTEMBER OCTOBER NOVEMBER DECEMBER JANUARY FEBRUARY MARCH 2020 2019 (Decrease) Decrease
Beginning Fund Balance 63.4$ 392.9$ 522.1$ 495.2$ 1,603.0$ 2,144.5$ 2,337.3$ 3,300.3$ 4,126.3$ 63.4$ 64.8$ (1.4)$ -2.2%
RECEIPTS: Taxes: Personal Income Tax 1,033.1 1,099.6 2,184.2 5,115.4 1,361.5 2,635.7 1,265.8 1,287.4 2,416.4 18,399.1 18,658.6 (259.5) -1.4% Consumption/Use Taxes: Sales and Use 394.2 369.7 572.0 529.7 536.3 708.9 549.9 544.9 706.7 4,912.3 5,658.8 (746.5) -13.2% Total Consumption/Use Taxes 394.2 369.7 572.0 529.7 536.3 708.9 549.9 544.9 706.7 - - - 4,912.3 5,658.8 (746.5) -13.2% Other Taxes: Real Estate Transfer 57.2 48.4 37.9 53.0 56.4 70.3 65.8 78.9 95.2 563.1 773.8 (210.7) -27.2% Employer Compensation Expense Tax 0.1 (0.1) 0.1 0.1 0.1 0.1 0.2 0.1 0.4 1.1 0.7 0.4 57.1% Total Other Taxes 57.3 48.3 38.0 53.1 56.5 70.4 66.0 79.0 95.6 - - - 564.2 774.5 (210.3) -27.2%
Total Taxes 1,484.6 1,517.6 2,794.2 5,698.2 1,954.3 3,415.0 1,881.7 1,911.3 3,218.7 - - - 23,875.6 25,091.9 (1,216.3) -4.8%
Miscellaneous Receipts: Assessments: Medical Care - - - - - - - - - - - - 0.0% Fees, Licenses and Permits: Alcohol Beverage Control Licensing - - - - - - - - - - - - 0.0% Business/Professional - - - - - - - - - - - - 0.0% Civil - - - - - - - - - - - - 0.0% Criminal - - - - - - - - - - - - 0.0% Motor Vehicle - - - - - - - - - - - - 0.0% Recreational/Consumer - - - - - - - - - - - - 0.0% Interest Earnings 0.1 0.1 - - - - - 0.1 - 0.3 1.5 (1.2) -80.0% Receipts from Public Authorities: Bond Proceeds - - - - - - - - 0.4 0.4 - 0.4 100.0% Receipts from Municipalities - 0.3 0.1 0.1 - - - 1.9 - 2.4 1.8 0.6 33.3% Rentals - - - - - - - - - - - - 0.0% Revenues of State Departments: Patient/Client Care Reimbursement 47.2 13.4 42.6 45.8 46.2 36.2 20.9 20.0 50.2 322.5 370.5 (48.0) -13.0% All Other - - - - - - - - - - 0.1 (0.1) -100.0% Sales - - - - - - - - - - - - 0.0% Total Miscellaneous Receipts 47.3 13.8 42.7 45.9 46.2 36.2 20.9 22.0 50.6 - - - 325.6 373.9 (48.3) -12.9%
Federal Receipts - - - - - 24.4 - - 12.5 36.9 36.8 0.1 0.3%
Total Receipts 1,531.9 1,531.4 2,836.9 5,744.1 2,000.5 3,475.6 1,902.6 1,933.3 3,281.8 - - - 24,238.1 25,502.6 (1,264.5) -5.0%
DISBURSEMENTS: Departmental Operations: Non-Personal Service - 0.9 12.1 5.8 2.9 7.9 - 3.2 (8.9) 23.9 26.8 (2.9) -10.8% Debt Service, Including Payments on Financing Agreements 36.5 23.5 28.9 10.7 337.6 841.8 39.8 30.4 1,229.8 2,579.0 1,512.2 1,066.8 70.5%
Total Disbursements 36.5 24.4 41.0 16.5 340.5 849.7 39.8 33.6 1,220.9 - - - 2,602.9 1,539.0 1,063.9 69.1%
Excess (Deficiency) of Receipts over Disbursements 1,495.4 1,507.0 2,795.9 5,727.6 1,660.0 2,625.9 1,862.8 1,899.7 2,060.9 - - - 21,635.2 23,963.6 (2,328.4) -9.7%
OTHER FINANCING SOURCES (USES): Transfers from Other Funds 280.2 130.3 39.0 311.2 49.4 247.4 319.1 89.5 135.4 1,601.5 2,039.8 (438.3) -21.5% Transfers to Other Funds (1,446.1) (1,508.1) (2,861.8) (4,931.0) (1,167.9) (2,680.5) (1,218.9) (1,163.2) (2,848.8) (19,826.3) (25,083.1) (5,256.8) -21.0%
Total Other Financing Sources (Uses) (1,165.9) (1,377.8) (2,822.8) (4,619.8) (1,118.5) (2,433.1) (899.8) (1,073.7) (2,713.4) - - - (18,224.8) (23,043.3) 4,818.5 20.9%
Excess (Deficiency) of Receipts and Other Financing Sources over Disbursements and Other Financing Uses 329.5 129.2 (26.9) 1,107.8 541.5 192.8 963.0 826.0 (652.5) - - - 3,410.4 920.3 2,490.1 270.6%
Ending Fund Balance 392.9$ 522.1$ 495.2$ 1,603.0$ 2,144.5$ 2,337.3$ 3,300.3$ 4,126.3$ 3,473.8$ -$ -$ -$ 3,473.8$ 985.1$ 2,488.7$ 252.6%
9 Months Ended December 31
28
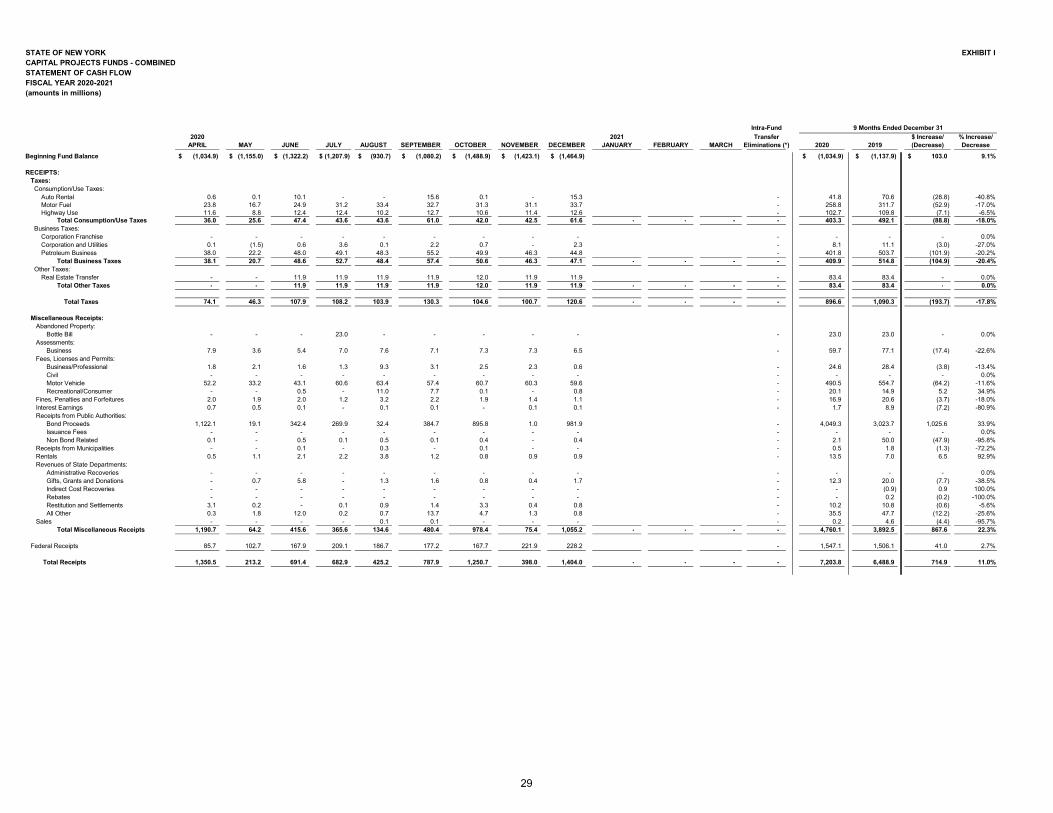
STATE OF NEW YORK EXHIBIT ICAPITAL PROJECTS FUNDS - COMBINED STATEMENT OF CASH FLOW FISCAL YEAR 2020-2021 (amounts in millions)
Intra-Fund2020 2021 Transfer $ Increase/ % Increase/
APRIL MAY JUNE JULY AUGUST SEPTEMBER OCTOBER NOVEMBER DECEMBER JANUARY FEBRUARY MARCH Eliminations (*) 2020 2019 (Decrease) DecreaseBeginning Fund Balance (1,034.9)$ (1,155.0)$ (1,322.2)$ (1,207.9)$ (930.7)$ (1,080.2)$ (1,488.9)$ (1,423.1)$ (1,464.9)$ (1,034.9)$ (1,137.9)$ 103.0$ 9.1%
RECEIPTS: Taxes: Consumption/Use Taxes: Auto Rental 0.6 0.1 10.1 - - 15.6 0.1 - 15.3 - 41.8 70.6 (28.8) -40.8% Motor Fuel 23.8 16.7 24.9 31.2 33.4 32.7 31.3 31.1 33.7 - 258.8 311.7 (52.9) -17.0% Highway Use 11.6 8.8 12.4 12.4 10.2 12.7 10.6 11.4 12.6 - 102.7 109.8 (7.1) -6.5% Total Consumption/Use Taxes 36.0 25.6 47.4 43.6 43.6 61.0 42.0 42.5 61.6 - - - - 403.3 492.1 (88.8) -18.0% Business Taxes: Corporation Franchise - - - - - - - - - - - - - 0.0% Corporation and Utilities 0.1 (1.5) 0.6 3.6 0.1 2.2 0.7 - 2.3 - 8.1 11.1 (3.0) -27.0% Petroleum Business 38.0 22.2 48.0 49.1 48.3 55.2 49.9 46.3 44.8 - 401.8 503.7 (101.9) -20.2% Total Business Taxes 38.1 20.7 48.6 52.7 48.4 57.4 50.6 46.3 47.1 - - - - 409.9 514.8 (104.9) -20.4% Other Taxes: Real Estate Transfer - - 11.9 11.9 11.9 11.9 12.0 11.9 11.9 - 83.4 83.4 - 0.0% Total Other Taxes - - 11.9 11.9 11.9 11.9 12.0 11.9 11.9 - - - - 83.4 83.4 - 0.0%
Total Taxes 74.1 46.3 107.9 108.2 103.9 130.3 104.6 100.7 120.6 - - - - 896.6 1,090.3 (193.7) -17.8%
Miscellaneous Receipts: Abandoned Property: Bottle Bill - - - 23.0 - - - - - - 23.0 23.0 - 0.0% Assessments: Business 7.9 3.6 5.4 7.0 7.6 7.1 7.3 7.3 6.5 - 59.7 77.1 (17.4) -22.6% Fees, Licenses and Permits: Business/Professional 1.8 2.1 1.6 1.3 9.3 3.1 2.5 2.3 0.6 - 24.6 28.4 (3.8) -13.4% Civil - - - - - - - - - - - - - 0.0% Motor Vehicle 52.2 33.2 43.1 60.6 63.4 57.4 60.7 60.3 59.6 - 490.5 554.7 (64.2) -11.6% Recreational/Consumer - - 0.5 - 11.0 7.7 0.1 - 0.8 - 20.1 14.9 5.2 34.9% Fines, Penalties and Forfeitures 2.0 1.9 2.0 1.2 3.2 2.2 1.9 1.4 1.1 - 16.9 20.6 (3.7) -18.0% Interest Earnings 0.7 0.5 0.1 - 0.1 0.1 - 0.1 0.1 - 1.7 8.9 (7.2) -80.9% Receipts from Public Authorities: Bond Proceeds 1,122.1 19.1 342.4 269.9 32.4 384.7 895.8 1.0 981.9 - 4,049.3 3,023.7 1,025.6 33.9% Issuance Fees - - - - - - - - - - - - - 0.0% Non Bond Related 0.1 - 0.5 0.1 0.5 0.1 0.4 - 0.4 - 2.1 50.0 (47.9) -95.8% Receipts from Municipalities - - 0.1 - 0.3 - 0.1 - - - 0.5 1.8 (1.3) -72.2% Rentals 0.5 1.1 2.1 2.2 3.8 1.2 0.8 0.9 0.9 - 13.5 7.0 6.5 92.9% Revenues of State Departments: Administrative Recoveries - - - - - - - - - - - - - 0.0% Gifts, Grants and Donations - 0.7 5.8 - 1.3 1.6 0.8 0.4 1.7 - 12.3 20.0 (7.7) -38.5% Indirect Cost Recoveries - - - - - - - - - - - (0.9) 0.9 100.0% Rebates - - - - - - - - - - - 0.2 (0.2) -100.0% Restitution and Settlements 3.1 0.2 - 0.1 0.9 1.4 3.3 0.4 0.8 - 10.2 10.8 (0.6) -5.6% All Other 0.3 1.8 12.0 0.2 0.7 13.7 4.7 1.3 0.8 - 35.5 47.7 (12.2) -25.6% Sales - - - - 0.1 0.1 - - - - 0.2 4.6 (4.4) -95.7% Total Miscellaneous Receipts 1,190.7 64.2 415.6 365.6 134.6 480.4 978.4 75.4 1,055.2 - - - - 4,760.1 3,892.5 867.6 22.3%
Federal Receipts 85.7 102.7 167.9 209.1 186.7 177.2 167.7 221.9 228.2 - 1,547.1 1,506.1 41.0 2.7%
Total Receipts 1,350.5 213.2 691.4 682.9 425.2 787.9 1,250.7 398.0 1,404.0 - - - - 7,203.8 6,488.9 714.9 11.0%
9 Months Ended December 31
29
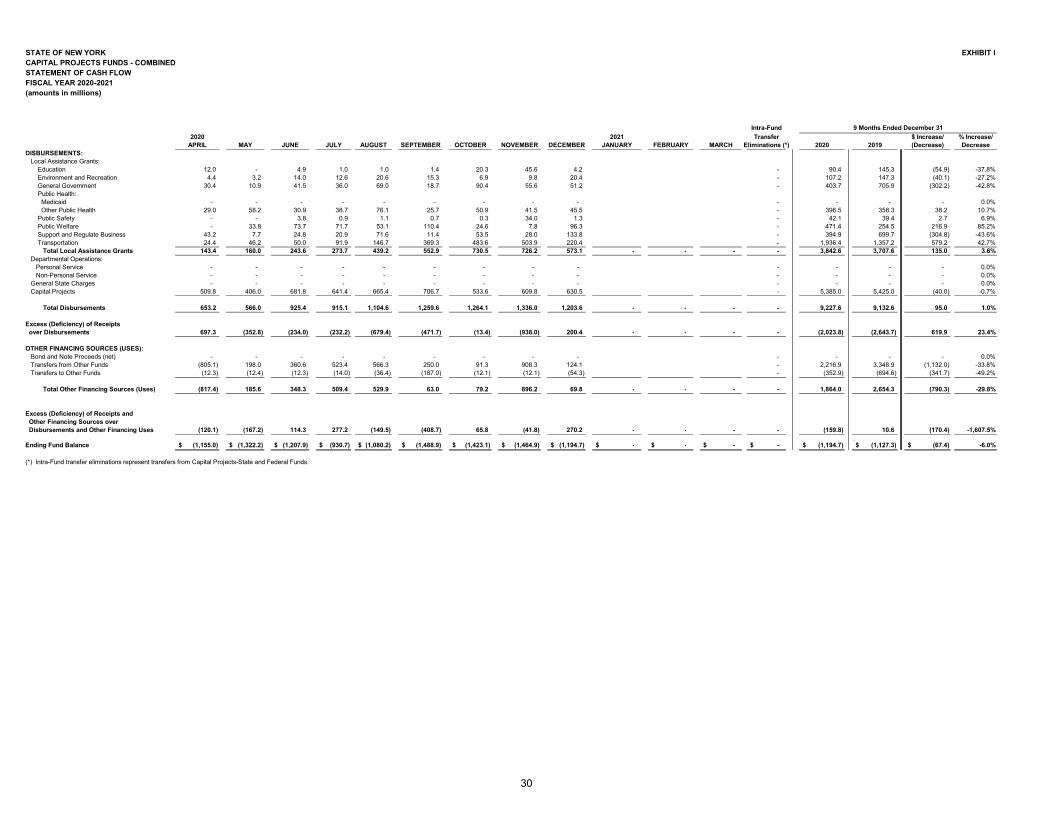
STATE OF NEW YORK EXHIBIT ICAPITAL PROJECTS FUNDS - COMBINED STATEMENT OF CASH FLOW FISCAL YEAR 2020-2021 (amounts in millions)
Intra-Fund2020 2021 Transfer $ Increase/ % Increase/
APRIL MAY JUNE JULY AUGUST SEPTEMBER OCTOBER NOVEMBER DECEMBER JANUARY FEBRUARY MARCH Eliminations (*) 2020 2019 (Decrease) Decrease
9 Months Ended December 31
DISBURSEMENTS: Local Assistance Grants: Education 12.0 - 4.9 1.0 1.0 1.4 20.3 45.6 4.2 - 90.4 145.3 (54.9) -37.8% Environment and Recreation 4.4 3.2 14.0 12.6 20.6 15.3 6.9 9.8 20.4 - 107.2 147.3 (40.1) -27.2% General Government 30.4 10.9 41.5 36.0 69.0 18.7 90.4 55.6 51.2 - 403.7 705.9 (302.2) -42.8% Public Health: Medicaid - - - - - - - - - - - - - 0.0% Other Public Health 29.0 58.2 30.9 38.7 76.1 25.7 50.9 41.5 45.5 - 396.5 358.3 38.2 10.7% Public Safety - - 3.8 0.9 1.1 0.7 0.3 34.0 1.3 - 42.1 39.4 2.7 6.9% Public Welfare - 33.8 73.7 71.7 53.1 110.4 24.6 7.8 96.3 - 471.4 254.5 216.9 85.2% Support and Regulate Business 43.2 7.7 24.8 20.9 71.6 11.4 53.5 28.0 133.8 - 394.9 699.7 (304.8) -43.6% Transportation 24.4 46.2 50.0 91.9 146.7 369.3 483.6 503.9 220.4 - 1,936.4 1,357.2 579.2 42.7% Total Local Assistance Grants 143.4 160.0 243.6 273.7 439.2 552.9 730.5 726.2 573.1 - - - - 3,842.6 3,707.6 135.0 3.6% Departmental Operations: Personal Service - - - - - - - - - - - - - 0.0% Non-Personal Service - - - - - - - - - - - - - 0.0% General State Charges - - - - - - - - - - - - - 0.0% Capital Projects 509.8 406.0 681.8 641.4 665.4 706.7 533.6 609.8 630.5 - 5,385.0 5,425.0 (40.0) -0.7%
Total Disbursements 653.2 566.0 925.4 915.1 1,104.6 1,259.6 1,264.1 1,336.0 1,203.6 - - - - 9,227.6 9,132.6 95.0 1.0%
Excess (Deficiency) of Receipts over Disbursements 697.3 (352.8) (234.0) (232.2) (679.4) (471.7) (13.4) (938.0) 200.4 - - - - (2,023.8) (2,643.7) 619.9 23.4%
OTHER FINANCING SOURCES (USES): Bond and Note Proceeds (net) - - - - - - - - - - - - - 0.0% Transfers from Other Funds (805.1) 198.0 360.6 523.4 566.3 250.0 91.3 908.3 124.1 - 2,216.9 3,348.9 (1,132.0) -33.8% Transfers to Other Funds (12.3) (12.4) (12.3) (14.0) (36.4) (187.0) (12.1) (12.1) (54.3) - (352.9) (694.6) (341.7) -49.2%
Total Other Financing Sources (Uses) (817.4) 185.6 348.3 509.4 529.9 63.0 79.2 896.2 69.8 - - - - 1,864.0 2,654.3 (790.3) -29.8%
Excess (Deficiency) of Receipts and Other Financing Sources over Disbursements and Other Financing Uses (120.1) (167.2) 114.3 277.2 (149.5) (408.7) 65.8 (41.8) 270.2 - - - - (159.8) 10.6 (170.4) -1,607.5% .Ending Fund Balance (1,155.0)$ (1,322.2)$ (1,207.9)$ (930.7)$ (1,080.2)$ (1,488.9)$ (1,423.1)$ (1,464.9)$ (1,194.7)$ -$ -$ -$ -$ (1,194.7)$ (1,127.3)$ (67.4)$ -6.0%
(*) Intra-Fund transfer eliminations represent transfers from Capital Projects-State and Federal Funds.
30
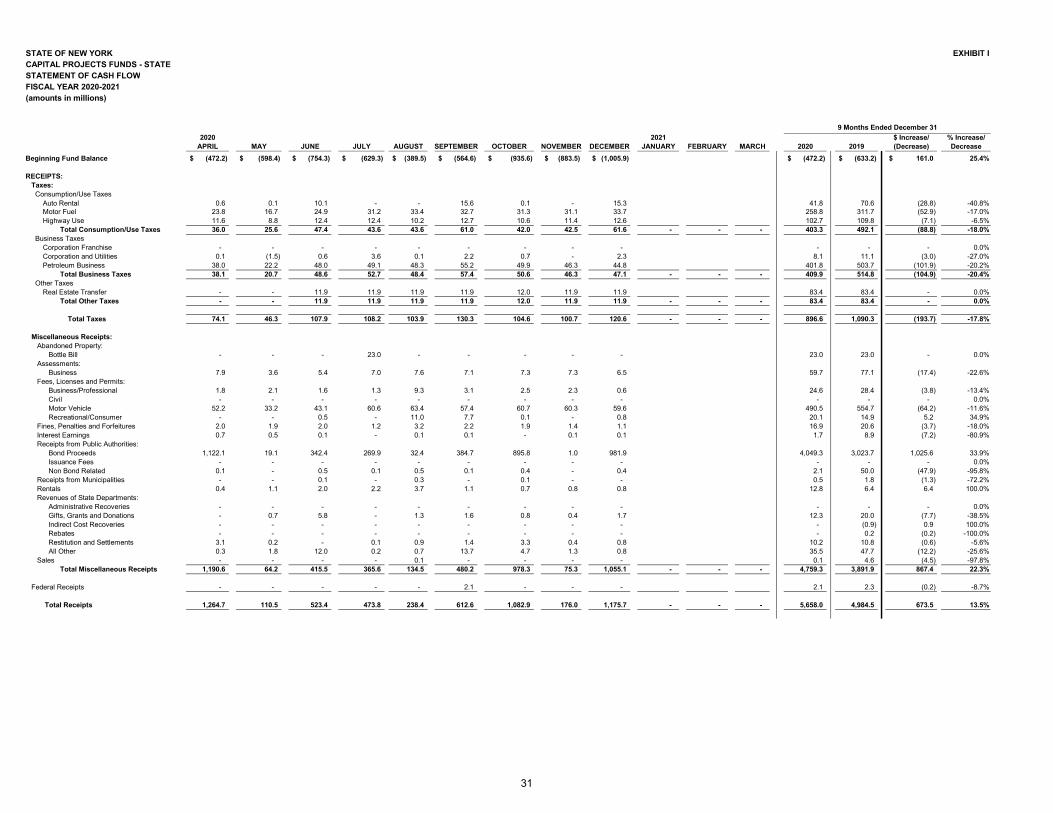
STATE OF NEW YORK EXHIBIT ICAPITAL PROJECTS FUNDS - STATESTATEMENT OF CASH FLOWFISCAL YEAR 2020-2021 (amounts in millions)
2020 2021 $ Increase/ % Increase/APRIL MAY JUNE JULY AUGUST SEPTEMBER OCTOBER NOVEMBER DECEMBER JANUARY FEBRUARY MARCH 2020 2019 (Decrease) Decrease
Beginning Fund Balance (472.2)$ (598.4)$ (754.3)$ (629.3)$ (389.5)$ (564.6)$ (935.6)$ (883.5)$ (1,005.9)$ (472.2)$ (633.2)$ 161.0$ 25.4%
RECEIPTS: Taxes: Consumption/Use Taxes Auto Rental 0.6 0.1 10.1 - - 15.6 0.1 - 15.3 41.8 70.6 (28.8) -40.8% Motor Fuel 23.8 16.7 24.9 31.2 33.4 32.7 31.3 31.1 33.7 258.8 311.7 (52.9) -17.0% Highway Use 11.6 8.8 12.4 12.4 10.2 12.7 10.6 11.4 12.6 102.7 109.8 (7.1) -6.5% Total Consumption/Use Taxes 36.0 25.6 47.4 43.6 43.6 61.0 42.0 42.5 61.6 - - - 403.3 492.1 (88.8) -18.0% Business Taxes Corporation Franchise - - - - - - - - - - - - 0.0% Corporation and Utilities 0.1 (1.5) 0.6 3.6 0.1 2.2 0.7 - 2.3 8.1 11.1 (3.0) -27.0% Petroleum Business 38.0 22.2 48.0 49.1 48.3 55.2 49.9 46.3 44.8 401.8 503.7 (101.9) -20.2% Total Business Taxes 38.1 20.7 48.6 52.7 48.4 57.4 50.6 46.3 47.1 - - - 409.9 514.8 (104.9) -20.4% Other Taxes Real Estate Transfer - - 11.9 11.9 11.9 11.9 12.0 11.9 11.9 83.4 83.4 - 0.0% Total Other Taxes - - 11.9 11.9 11.9 11.9 12.0 11.9 11.9 - - - 83.4 83.4 - 0.0%
Total Taxes 74.1 46.3 107.9 108.2 103.9 130.3 104.6 100.7 120.6 - - - 896.6 1,090.3 (193.7) -17.8%
Miscellaneous Receipts: Abandoned Property: Bottle Bill - - - 23.0 - - - - - 23.0 23.0 - 0.0% Assessments: Business 7.9 3.6 5.4 7.0 7.6 7.1 7.3 7.3 6.5 59.7 77.1 (17.4) -22.6% Fees, Licenses and Permits: Business/Professional 1.8 2.1 1.6 1.3 9.3 3.1 2.5 2.3 0.6 24.6 28.4 (3.8) -13.4% Civil - - - - - - - - - - - - 0.0% Motor Vehicle 52.2 33.2 43.1 60.6 63.4 57.4 60.7 60.3 59.6 490.5 554.7 (64.2) -11.6% Recreational/Consumer - - 0.5 - 11.0 7.7 0.1 - 0.8 20.1 14.9 5.2 34.9% Fines, Penalties and Forfeitures 2.0 1.9 2.0 1.2 3.2 2.2 1.9 1.4 1.1 16.9 20.6 (3.7) -18.0% Interest Earnings 0.7 0.5 0.1 - 0.1 0.1 - 0.1 0.1 1.7 8.9 (7.2) -80.9% Receipts from Public Authorities: Bond Proceeds 1,122.1 19.1 342.4 269.9 32.4 384.7 895.8 1.0 981.9 4,049.3 3,023.7 1,025.6 33.9% Issuance Fees - - - - - - - - - - - - 0.0% Non Bond Related 0.1 - 0.5 0.1 0.5 0.1 0.4 - 0.4 2.1 50.0 (47.9) -95.8% Receipts from Municipalities - - 0.1 - 0.3 - 0.1 - - 0.5 1.8 (1.3) -72.2% Rentals 0.4 1.1 2.0 2.2 3.7 1.1 0.7 0.8 0.8 12.8 6.4 6.4 100.0% Revenues of State Departments: Administrative Recoveries - - - - - - - - - - - - 0.0% Gifts, Grants and Donations - 0.7 5.8 - 1.3 1.6 0.8 0.4 1.7 12.3 20.0 (7.7) -38.5% Indirect Cost Recoveries - - - - - - - - - - (0.9) 0.9 100.0% Rebates - - - - - - - - - - 0.2 (0.2) -100.0% Restitution and Settlements 3.1 0.2 - 0.1 0.9 1.4 3.3 0.4 0.8 10.2 10.8 (0.6) -5.6% All Other 0.3 1.8 12.0 0.2 0.7 13.7 4.7 1.3 0.8 35.5 47.7 (12.2) -25.6% Sales - - - - 0.1 - - - - 0.1 4.6 (4.5) -97.8% Total Miscellaneous Receipts 1,190.6 64.2 415.5 365.6 134.5 480.2 978.3 75.3 1,055.1 - - - 4,759.3 3,891.9 867.4 22.3%
Federal Receipts - - - - - 2.1 - - - 2.1 2.3 (0.2) -8.7%
Total Receipts 1,264.7 110.5 523.4 473.8 238.4 612.6 1,082.9 176.0 1,175.7 - - - 5,658.0 4,984.5 673.5 13.5%
9 Months Ended December 31
31
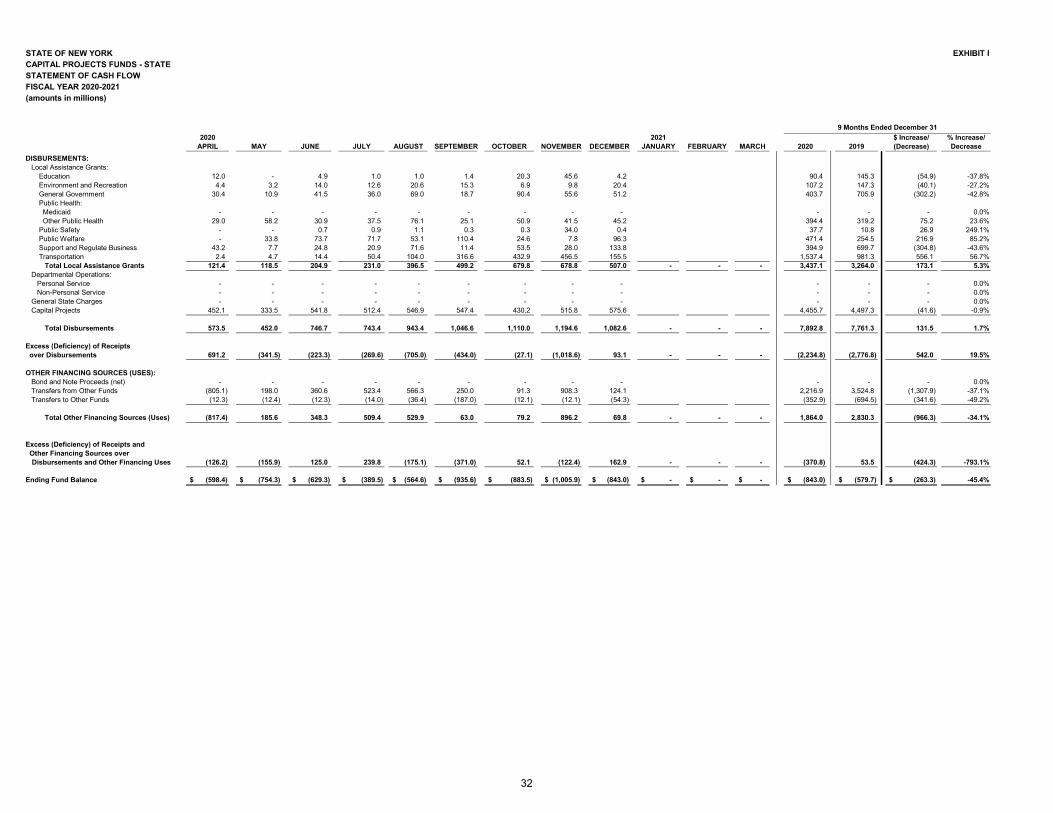
STATE OF NEW YORK EXHIBIT ICAPITAL PROJECTS FUNDS - STATESTATEMENT OF CASH FLOWFISCAL YEAR 2020-2021 (amounts in millions)
2020 2021 $ Increase/ % Increase/APRIL MAY JUNE JULY AUGUST SEPTEMBER OCTOBER NOVEMBER DECEMBER JANUARY FEBRUARY MARCH 2020 2019 (Decrease) Decrease
9 Months Ended December 31
DISBURSEMENTS: Local Assistance Grants: Education 12.0 - 4.9 1.0 1.0 1.4 20.3 45.6 4.2 90.4 145.3 (54.9) -37.8% Environment and Recreation 4.4 3.2 14.0 12.6 20.6 15.3 6.9 9.8 20.4 107.2 147.3 (40.1) -27.2% General Government 30.4 10.9 41.5 36.0 69.0 18.7 90.4 55.6 51.2 403.7 705.9 (302.2) -42.8% Public Health: Medicaid - - - - - - - - - - - - 0.0% Other Public Health 29.0 58.2 30.9 37.5 76.1 25.1 50.9 41.5 45.2 394.4 319.2 75.2 23.6% Public Safety - - 0.7 0.9 1.1 0.3 0.3 34.0 0.4 37.7 10.8 26.9 249.1% Public Welfare - 33.8 73.7 71.7 53.1 110.4 24.6 7.8 96.3 471.4 254.5 216.9 85.2% Support and Regulate Business 43.2 7.7 24.8 20.9 71.6 11.4 53.5 28.0 133.8 394.9 699.7 (304.8) -43.6% Transportation 2.4 4.7 14.4 50.4 104.0 316.6 432.9 456.5 155.5 1,537.4 981.3 556.1 56.7% Total Local Assistance Grants 121.4 118.5 204.9 231.0 396.5 499.2 679.8 678.8 507.0 - - - 3,437.1 3,264.0 173.1 5.3% Departmental Operations: Personal Service - - - - - - - - - - - - 0.0% Non-Personal Service - - - - - - - - - - - - 0.0% General State Charges - - - - - - - - - - - - 0.0% Capital Projects 452.1 333.5 541.8 512.4 546.9 547.4 430.2 515.8 575.6 4,455.7 4,497.3 (41.6) -0.9%
Total Disbursements 573.5 452.0 746.7 743.4 943.4 1,046.6 1,110.0 1,194.6 1,082.6 - - - 7,892.8 7,761.3 131.5 1.7%
Excess (Deficiency) of Receipts over Disbursements 691.2 (341.5) (223.3) (269.6) (705.0) (434.0) (27.1) (1,018.6) 93.1 - - - (2,234.8) (2,776.8) 542.0 19.5%
OTHER FINANCING SOURCES (USES): Bond and Note Proceeds (net) - - - - - - - - - - - - 0.0% Transfers from Other Funds (805.1) 198.0 360.6 523.4 566.3 250.0 91.3 908.3 124.1 2,216.9 3,524.8 (1,307.9) -37.1% Transfers to Other Funds (12.3) (12.4) (12.3) (14.0) (36.4) (187.0) (12.1) (12.1) (54.3) (352.9) (694.5) (341.6) -49.2%
Total Other Financing Sources (Uses) (817.4) 185.6 348.3 509.4 529.9 63.0 79.2 896.2 69.8 - - - 1,864.0 2,830.3 (966.3) -34.1%
Excess (Deficiency) of Receipts and Other Financing Sources over Disbursements and Other Financing Uses (126.2) (155.9) 125.0 239.8 (175.1) (371.0) 52.1 (122.4) 162.9 - - - (370.8) 53.5 (424.3) -793.1%
Ending Fund Balance (598.4)$ (754.3)$ (629.3)$ (389.5)$ (564.6)$ (935.6)$ (883.5)$ (1,005.9)$ (843.0)$ -$ -$ -$ (843.0)$ (579.7)$ (263.3)$ -45.4%
32
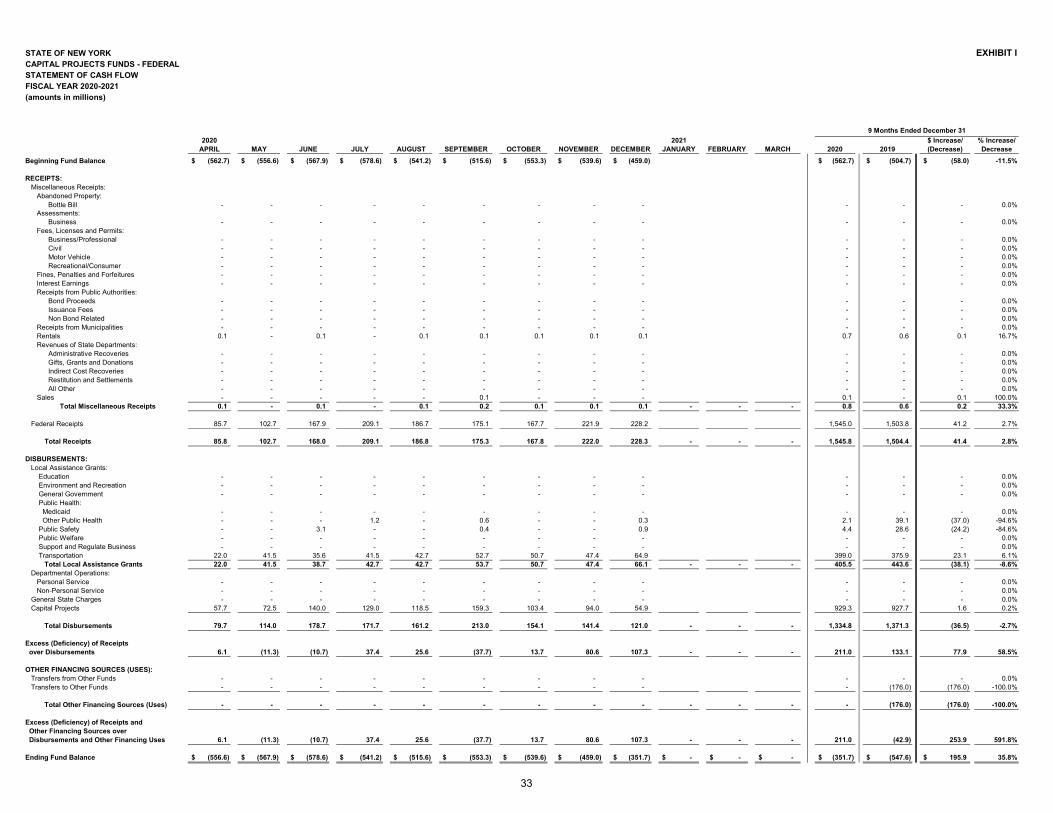
STATE OF NEW YORK EXHIBIT ICAPITAL PROJECTS FUNDS - FEDERALSTATEMENT OF CASH FLOWFISCAL YEAR 2020-2021 (amounts in millions)
2020 2021 $ Increase/ % Increase/APRIL MAY JUNE JULY AUGUST SEPTEMBER OCTOBER NOVEMBER DECEMBER JANUARY FEBRUARY MARCH 2020 2019 (Decrease) Decrease
Beginning Fund Balance (562.7)$ (556.6)$ (567.9)$ (578.6)$ (541.2)$ (515.6)$ (553.3)$ (539.6)$ (459.0)$ (562.7)$ (504.7)$ (58.0)$ -11.5%
RECEIPTS: Miscellaneous Receipts: Abandoned Property: Bottle Bill - - - - - - - - - - - - 0.0% Assessments: Business - - - - - - - - - - - - 0.0% Fees, Licenses and Permits: Business/Professional - - - - - - - - - - - - 0.0% Civil - - - - - - - - - - - - 0.0% Motor Vehicle - - - - - - - - - - - - 0.0% Recreational/Consumer - - - - - - - - - - - - 0.0% Fines, Penalties and Forfeitures - - - - - - - - - - - - 0.0% Interest Earnings - - - - - - - - - - - - 0.0% Receipts from Public Authorities: Bond Proceeds - - - - - - - - - - - - 0.0% Issuance Fees - - - - - - - - - - - - 0.0% Non Bond Related - - - - - - - - - - - - 0.0% Receipts from Municipalities - - - - - - - - - - - - 0.0% Rentals 0.1 - 0.1 - 0.1 0.1 0.1 0.1 0.1 0.7 0.6 0.1 16.7% Revenues of State Departments: Administrative Recoveries - - - - - - - - - - - - 0.0% Gifts, Grants and Donations - - - - - - - - - - - - 0.0% Indirect Cost Recoveries - - - - - - - - - - - - 0.0% Restitution and Settlements - - - - - - - - - - - - 0.0% All Other - - - - - - - - - - - - 0.0% Sales - - - - - 0.1 - - - 0.1 - 0.1 100.0% Total Miscellaneous Receipts 0.1 - 0.1 - 0.1 0.2 0.1 0.1 0.1 - - - 0.8 0.6 0.2 33.3%
Federal Receipts 85.7 102.7 167.9 209.1 186.7 175.1 167.7 221.9 228.2 1,545.0 1,503.8 41.2 2.7%
Total Receipts 85.8 102.7 168.0 209.1 186.8 175.3 167.8 222.0 228.3 - - - 1,545.8 1,504.4 41.4 2.8%
DISBURSEMENTS: Local Assistance Grants: Education - - - - - - - - - - - - 0.0% Environment and Recreation - - - - - - - - - - - - 0.0% General Government - - - - - - - - - - - - 0.0% Public Health: Medicaid - - - - - - - - - - - - 0.0% Other Public Health - - - 1.2 - 0.6 - - 0.3 2.1 39.1 (37.0) -94.6% Public Safety - - 3.1 - - 0.4 - - 0.9 4.4 28.6 (24.2) -84.6% Public Welfare - - - - - - - - - - - - 0.0% Support and Regulate Business - - - - - - - - - - - - 0.0% Transportation 22.0 41.5 35.6 41.5 42.7 52.7 50.7 47.4 64.9 399.0 375.9 23.1 6.1% Total Local Assistance Grants 22.0 41.5 38.7 42.7 42.7 53.7 50.7 47.4 66.1 - - - 405.5 443.6 (38.1) -8.6% Departmental Operations: Personal Service - - - - - - - - - - - - 0.0% Non-Personal Service - - - - - - - - - - - - 0.0% General State Charges - - - - - - - - - - - - 0.0% Capital Projects 57.7 72.5 140.0 129.0 118.5 159.3 103.4 94.0 54.9 929.3 927.7 1.6 0.2%
Total Disbursements 79.7 114.0 178.7 171.7 161.2 213.0 154.1 141.4 121.0 - - - 1,334.8 1,371.3 (36.5) -2.7%
Excess (Deficiency) of Receipts over Disbursements 6.1 (11.3) (10.7) 37.4 25.6 (37.7) 13.7 80.6 107.3 - - - 211.0 133.1 77.9 58.5%
OTHER FINANCING SOURCES (USES): Transfers from Other Funds - - - - - - - - - - - - 0.0% Transfers to Other Funds - - - - - - - - - - (176.0) (176.0) -100.0%
Total Other Financing Sources (Uses) - - - - - - - - - - - - - (176.0) (176.0) -100.0%
Excess (Deficiency) of Receipts and Other Financing Sources over Disbursements and Other Financing Uses 6.1 (11.3) (10.7) 37.4 25.6 (37.7) 13.7 80.6 107.3 - - - 211.0 (42.9) 253.9 591.8%
Ending Fund Balance (556.6)$ (567.9)$ (578.6)$ (541.2)$ (515.6)$ (553.3)$ (539.6)$ (459.0)$ (351.7)$ -$ -$ -$ (351.7)$ (547.6)$ 195.9$ 35.8%
9 Months Ended December 31
33
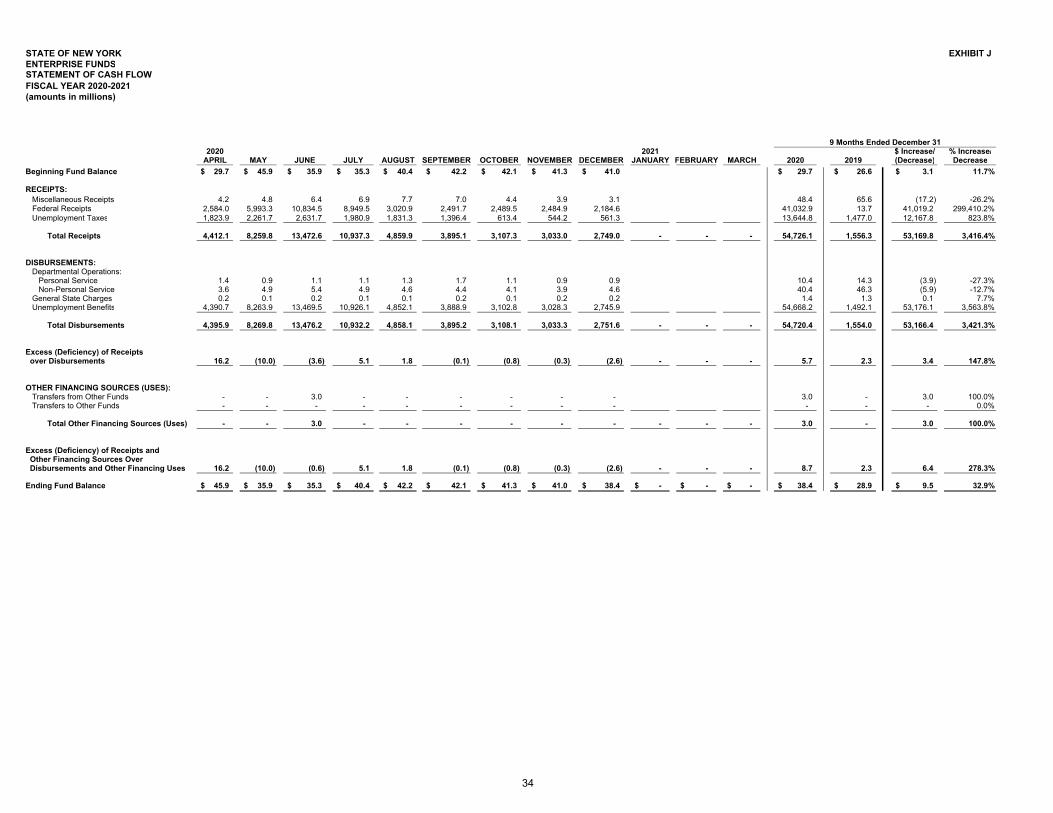
STATE OF NEW YORK EXHIBIT JENTERPRISE FUNDS STATEMENT OF CASH FLOW FISCAL YEAR 2020-2021 (amounts in millions)
2020 2021 $ Increase/ % Increase/APRIL MAY JUNE JULY AUGUST SEPTEMBER OCTOBER NOVEMBER DECEMBER JANUARY FEBRUARY MARCH 2020 2019 (Decrease) Decrease
Beginning Fund Balance 29.7$ 45.9$ 35.9$ 35.3$ 40.4$ 42.2$ 42.1$ 41.3$ 41.0$ 29.7$ 26.6$ 3.1$ 11.7%
RECEIPTS: Miscellaneous Receipts 4.2 4.8 6.4 6.9 7.7 7.0 4.4 3.9 3.1 48.4 65.6 (17.2) -26.2% Federal Receipts 2,584.0 5,993.3 10,834.5 8,949.5 3,020.9 2,491.7 2,489.5 2,484.9 2,184.6 41,032.9 13.7 41,019.2 299,410.2% Unemployment Taxes 1,823.9 2,261.7 2,631.7 1,980.9 1,831.3 1,396.4 613.4 544.2 561.3 13,644.8 1,477.0 12,167.8 823.8%
Total Receipts 4,412.1 8,259.8 13,472.6 10,937.3 4,859.9 3,895.1 3,107.3 3,033.0 2,749.0 - - - 54,726.1 1,556.3 53,169.8 3,416.4%
DISBURSEMENTS: Departmental Operations: Personal Service 1.4 0.9 1.1 1.1 1.3 1.7 1.1 0.9 0.9 10.4 14.3 (3.9) -27.3% Non-Personal Service 3.6 4.9 5.4 4.9 4.6 4.4 4.1 3.9 4.6 40.4 46.3 (5.9) -12.7% General State Charges 0.2 0.1 0.2 0.1 0.1 0.2 0.1 0.2 0.2 1.4 1.3 0.1 7.7% Unemployment Benefits 4,390.7 8,263.9 13,469.5 10,926.1 4,852.1 3,888.9 3,102.8 3,028.3 2,745.9 54,668.2 1,492.1 53,176.1 3,563.8%
Total Disbursements 4,395.9 8,269.8 13,476.2 10,932.2 4,858.1 3,895.2 3,108.1 3,033.3 2,751.6 - - - 54,720.4 1,554.0 53,166.4 3,421.3%
Excess (Deficiency) of Receipts over Disbursements 16.2 (10.0) (3.6) 5.1 1.8 (0.1) (0.8) (0.3) (2.6) - - - 5.7 2.3 3.4 147.8%
OTHER FINANCING SOURCES (USES): Transfers from Other Funds - - 3.0 - - - - - - 3.0 - 3.0 100.0% Transfers to Other Funds - - - - - - - - - - - - 0.0%
Total Other Financing Sources (Uses) - - 3.0 - - - - - - - - - 3.0 - 3.0 100.0%
Excess (Deficiency) of Receipts and Other Financing Sources Over Disbursements and Other Financing Uses 16.2 (10.0) (0.6) 5.1 1.8 (0.1) (0.8) (0.3) (2.6) - - - 8.7 2.3 6.4 278.3%
Ending Fund Balance 45.9$ 35.9$ 35.3$ 40.4$ 42.2$ 42.1$ 41.3$ 41.0$ 38.4$ -$ -$ -$ 38.4$ 28.9$ 9.5$ 32.9%
9 Months Ended December 31
34
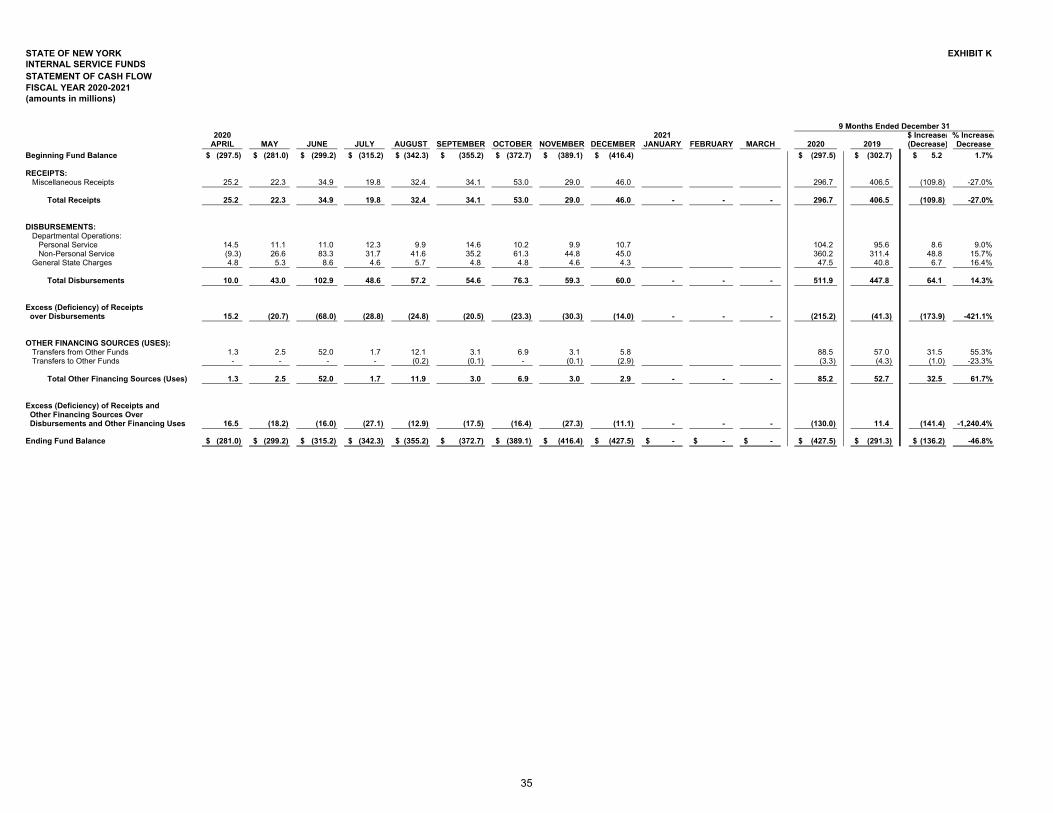
STATE OF NEW YORK EXHIBIT KINTERNAL SERVICE FUNDS STATEMENT OF CASH FLOW FISCAL YEAR 2020-2021 (amounts in millions)
2020 2021 $ Increase/ % Increase/APRIL MAY JUNE JULY AUGUST SEPTEMBER OCTOBER NOVEMBER DECEMBER JANUARY FEBRUARY MARCH 2020 2019 (Decrease) Decrease
Beginning Fund Balance (297.5)$ (281.0)$ (299.2)$ (315.2)$ (342.3)$ (355.2)$ (372.7)$ (389.1)$ (416.4)$ (297.5)$ (302.7)$ 5.2$ 1.7%
RECEIPTS: Miscellaneous Receipts 25.2 22.3 34.9 19.8 32.4 34.1 53.0 29.0 46.0 296.7 406.5 (109.8) -27.0%
Total Receipts 25.2 22.3 34.9 19.8 32.4 34.1 53.0 29.0 46.0 - - - 296.7 406.5 (109.8) -27.0%
DISBURSEMENTS: Departmental Operations: Personal Service 14.5 11.1 11.0 12.3 9.9 14.6 10.2 9.9 10.7 104.2 95.6 8.6 9.0% Non-Personal Service (9.3) 26.6 83.3 31.7 41.6 35.2 61.3 44.8 45.0 360.2 311.4 48.8 15.7% General State Charges 4.8 5.3 8.6 4.6 5.7 4.8 4.8 4.6 4.3 47.5 40.8 6.7 16.4%
Total Disbursements 10.0 43.0 102.9 48.6 57.2 54.6 76.3 59.3 60.0 - - - 511.9 447.8 64.1 14.3%
Excess (Deficiency) of Receipts over Disbursements 15.2 (20.7) (68.0) (28.8) (24.8) (20.5) (23.3) (30.3) (14.0) - - - (215.2) (41.3) (173.9) -421.1%
OTHER FINANCING SOURCES (USES): Transfers from Other Funds 1.3 2.5 52.0 1.7 12.1 3.1 6.9 3.1 5.8 88.5 57.0 31.5 55.3% Transfers to Other Funds - - - - (0.2) (0.1) - (0.1) (2.9) (3.3) (4.3) (1.0) -23.3%
Total Other Financing Sources (Uses) 1.3 2.5 52.0 1.7 11.9 3.0 6.9 3.0 2.9 - - - 85.2 52.7 32.5 61.7%
Excess (Deficiency) of Receipts and Other Financing Sources Over Disbursements and Other Financing Uses 16.5 (18.2) (16.0) (27.1) (12.9) (17.5) (16.4) (27.3) (11.1) - - - (130.0) 11.4 (141.4) -1,240.4%
Ending Fund Balance (281.0)$ (299.2)$ (315.2)$ (342.3)$ (355.2)$ (372.7)$ (389.1)$ (416.4)$ (427.5)$ -$ -$ -$ (427.5)$ (291.3)$ (136.2)$ -46.8%
9 Months Ended December 31
35
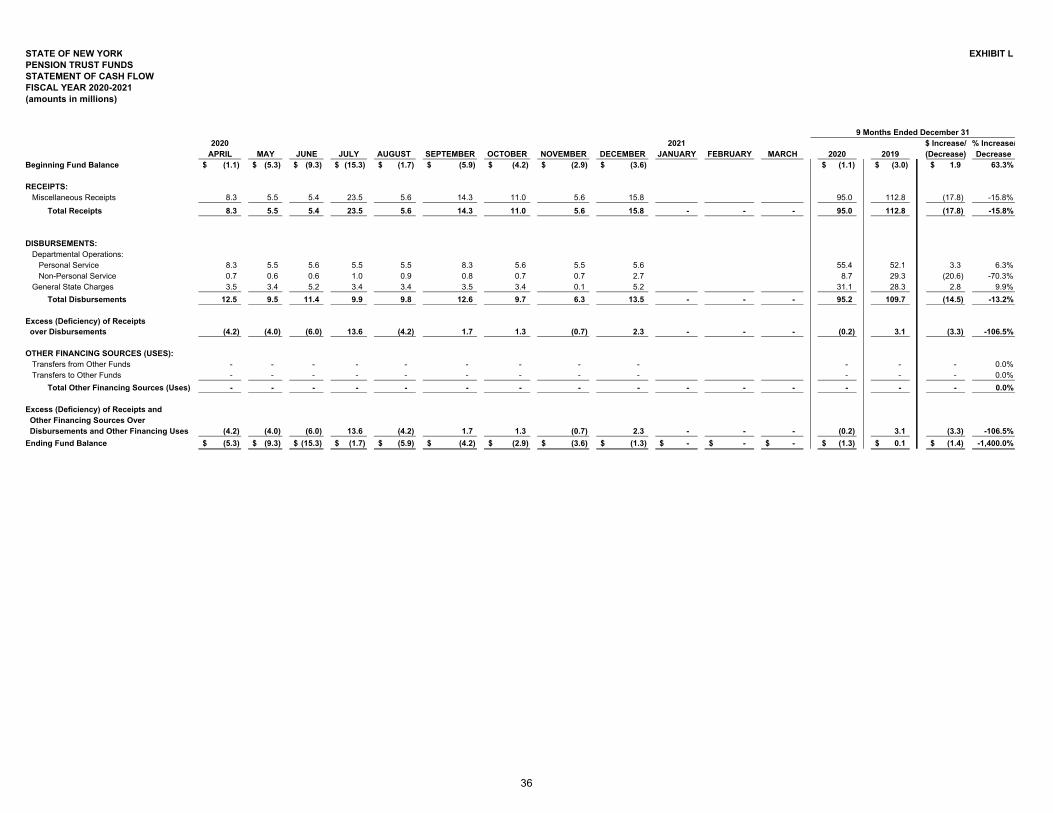
STATE OF NEW YORK EXHIBIT LPENSION TRUST FUNDS STATEMENT OF CASH FLOW FISCAL YEAR 2020-2021 (amounts in millions)
2020 2021 $ Increase/ % Increase/APRIL MAY JUNE JULY AUGUST SEPTEMBER OCTOBER NOVEMBER DECEMBER JANUARY FEBRUARY MARCH 2020 2019 (Decrease) Decrease
Beginning Fund Balance (1.1)$ (5.3)$ (9.3)$ (15.3)$ (1.7)$ (5.9)$ (4.2)$ (2.9)$ (3.6)$ (1.1)$ (3.0)$ 1.9$ 63.3%
RECEIPTS: Miscellaneous Receipts 8.3 5.5 5.4 23.5 5.6 14.3 11.0 5.6 15.8 95.0 112.8 (17.8) -15.8% Total Receipts 8.3 5.5 5.4 23.5 5.6 14.3 11.0 5.6 15.8 - - - 95.0 112.8 (17.8) -15.8%
DISBURSEMENTS: Departmental Operations: Personal Service 8.3 5.5 5.6 5.5 5.5 8.3 5.6 5.5 5.6 55.4 52.1 3.3 6.3% Non-Personal Service 0.7 0.6 0.6 1.0 0.9 0.8 0.7 0.7 2.7 8.7 29.3 (20.6) -70.3% General State Charges 3.5 3.4 5.2 3.4 3.4 3.5 3.4 0.1 5.2 31.1 28.3 2.8 9.9% Total Disbursements 12.5 9.5 11.4 9.9 9.8 12.6 9.7 6.3 13.5 - - - 95.2 109.7 (14.5) -13.2%
Excess (Deficiency) of Receipts over Disbursements (4.2) (4.0) (6.0) 13.6 (4.2) 1.7 1.3 (0.7) 2.3 - - - (0.2) 3.1 (3.3) -106.5%
OTHER FINANCING SOURCES (USES): Transfers from Other Funds - - - - - - - - - - - - 0.0% Transfers to Other Funds - - - - - - - - - - - - 0.0% Total Other Financing Sources (Uses) - - - - - - - - - - - - - - - 0.0%
Excess (Deficiency) of Receipts and Other Financing Sources Over Disbursements and Other Financing Uses (4.2) (4.0) (6.0) 13.6 (4.2) 1.7 1.3 (0.7) 2.3 - - - (0.2) 3.1 (3.3) -106.5%Ending Fund Balance (5.3)$ (9.3)$ (15.3)$ (1.7)$ (5.9)$ (4.2)$ (2.9)$ (3.6)$ (1.3)$ -$ -$ -$ (1.3)$ 0.1$ (1.4)$ -1,400.0%
9 Months Ended December 31
36
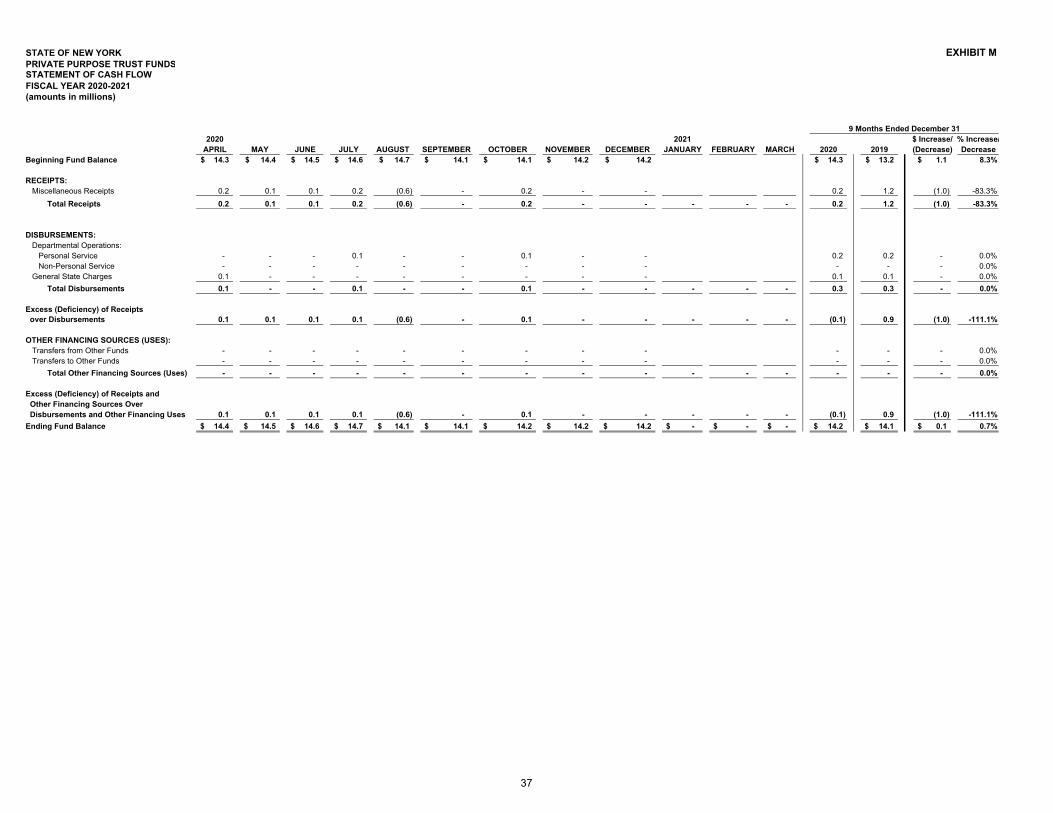
STATE OF NEW YORK EXHIBIT MPRIVATE PURPOSE TRUST FUNDS STATEMENT OF CASH FLOW FISCAL YEAR 2020-2021 (amounts in millions)
2020 2021 $ Increase/ % Increase/APRIL MAY JUNE JULY AUGUST SEPTEMBER OCTOBER NOVEMBER DECEMBER JANUARY FEBRUARY MARCH 2020 2019 (Decrease) Decrease
Beginning Fund Balance 14.3$ 14.4$ 14.5$ 14.6$ 14.7$ 14.1$ 14.1$ 14.2$ 14.2$ 14.3$ 13.2$ 1.1$ 8.3%
RECEIPTS: Miscellaneous Receipts 0.2 0.1 0.1 0.2 (0.6) - 0.2 - - 0.2 1.2 (1.0) -83.3% Total Receipts 0.2 0.1 0.1 0.2 (0.6) - 0.2 - - - - - 0.2 1.2 (1.0) -83.3%
DISBURSEMENTS: Departmental Operations: Personal Service - - - 0.1 - - 0.1 - - 0.2 0.2 - 0.0% Non-Personal Service - - - - - - - - - - - - 0.0% General State Charges 0.1 - - - - - - - - 0.1 0.1 - 0.0% Total Disbursements 0.1 - - 0.1 - - 0.1 - - - - - 0.3 0.3 - 0.0%
Excess (Deficiency) of Receipts over Disbursements 0.1 0.1 0.1 0.1 (0.6) - 0.1 - - - - - (0.1) 0.9 (1.0) -111.1%
OTHER FINANCING SOURCES (USES): Transfers from Other Funds - - - - - - - - - - - - 0.0% Transfers to Other Funds - - - - - - - - - - - - 0.0% Total Other Financing Sources (Uses) - - - - - - - - - - - - - - - 0.0%
Excess (Deficiency) of Receipts and Other Financing Sources Over Disbursements and Other Financing Uses 0.1 0.1 0.1 0.1 (0.6) - 0.1 - - - - - (0.1) 0.9 (1.0) -111.1%Ending Fund Balance 14.4$ 14.5$ 14.6$ 14.7$ 14.1$ 14.1$ 14.2$ 14.2$ 14.2$ -$ -$ -$ 14.2$ 14.1$ 0.1$ 0.7%
9 Months Ended December 31
37
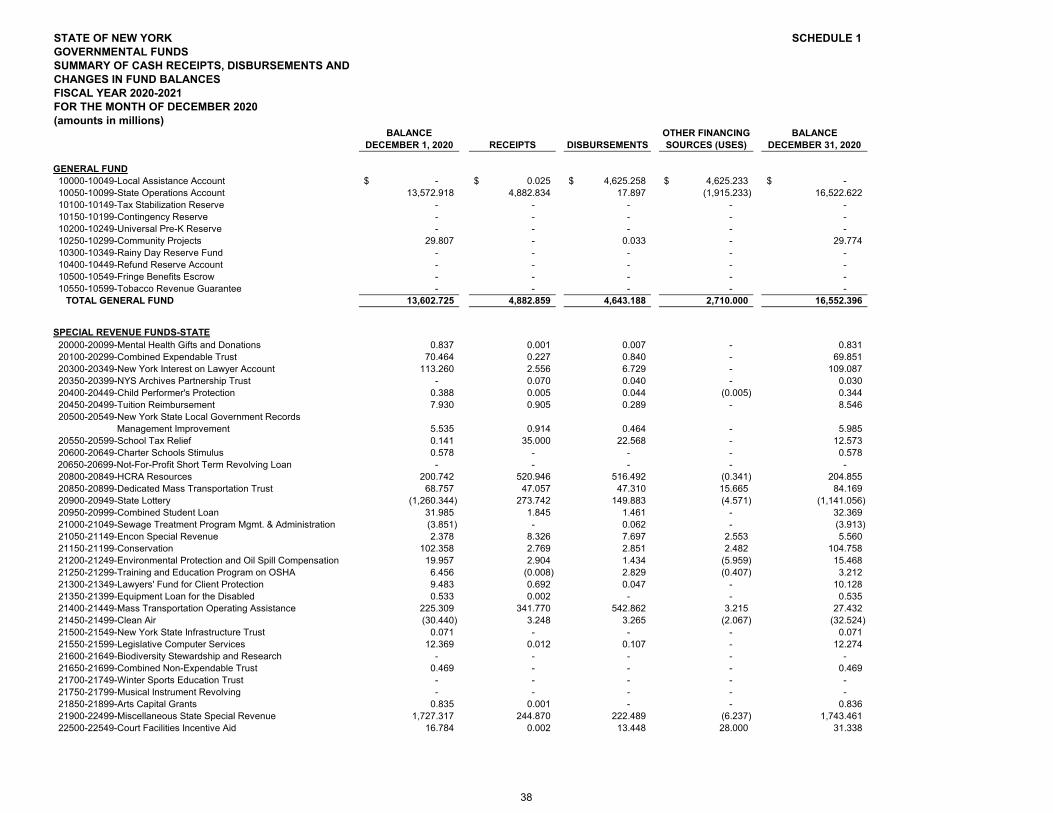
STATE OF NEW YORK SCHEDULE 1GOVERNMENTAL FUNDS
SUMMARY OF CASH RECEIPTS, DISBURSEMENTS AND CHANGES IN FUND BALANCES FISCAL YEAR 2020-2021FOR THE MONTH OF DECEMBER 2020
(amounts in millions) BALANCE OTHER FINANCING BALANCE
DECEMBER 1, 2020 RECEIPTS DISBURSEMENTS SOURCES (USES) DECEMBER 31, 2020
GENERAL FUND 10000-10049-Local Assistance Account -$ 0.025$ 4,625.258$ 4,625.233$ -$ 10050-10099-State Operations Account 13,572.918 4,882.834 17.897 (1,915.233) 16,522.622 10100-10149-Tax Stabilization Reserve - - - - - 10150-10199-Contingency Reserve - - - - - 10200-10249-Universal Pre-K Reserve - - - - - 10250-10299-Community Projects 29.807 - 0.033 - 29.774 10300-10349-Rainy Day Reserve Fund - - - - - 10400-10449-Refund Reserve Account - - - - - 10500-10549-Fringe Benefits Escrow - - - - - 10550-10599-Tobacco Revenue Guarantee - - - - - TOTAL GENERAL FUND 13,602.725 4,882.859 4,643.188 2,710.000 16,552.396
SPECIAL REVENUE FUNDS-STATE 20000-20099-Mental Health Gifts and Donations 0.837 0.001 0.007 - 0.831 20100-20299-Combined Expendable Trust 70.464 0.227 0.840 - 69.851 20300-20349-New York Interest on Lawyer Account 113.260 2.556 6.729 - 109.087 20350-20399-NYS Archives Partnership Trust - 0.070 0.040 - 0.030 20400-20449-Child Performer's Protection 0.388 0.005 0.044 (0.005) 0.344 20450-20499-Tuition Reimbursement 7.930 0.905 0.289 - 8.546 20500-20549-New York State Local Government Records Management Improvement 5.535 0.914 0.464 - 5.985 20550-20599-School Tax Relief 0.141 35.000 22.568 - 12.573 20600-20649-Charter Schools Stimulus 0.578 - - - 0.578
20650-20699-Not-For-Profit Short Term Revolving Loan - - - - - 20800-20849-HCRA Resources 200.742 520.946 516.492 (0.341) 204.855 20850-20899-Dedicated Mass Transportation Trust 68.757 47.057 47.310 15.665 84.169 20900-20949-State Lottery (1,260.344) 273.742 149.883 (4.571) (1,141.056) 20950-20999-Combined Student Loan 31.985 1.845 1.461 - 32.369 21000-21049-Sewage Treatment Program Mgmt. & Administration (3.851) - 0.062 - (3.913) 21050-21149-Encon Special Revenue 2.378 8.326 7.697 2.553 5.560 21150-21199-Conservation 102.358 2.769 2.851 2.482 104.758 21200-21249-Environmental Protection and Oil Spill Compensation 19.957 2.904 1.434 (5.959) 15.468
21250-21299-Training and Education Program on OSHA 6.456 (0.008) 2.829 (0.407) 3.212 21300-21349-Lawyers' Fund for Client Protection 9.483 0.692 0.047 - 10.128 21350-21399-Equipment Loan for the Disabled 0.533 0.002 - - 0.535 21400-21449-Mass Transportation Operating Assistance 225.309 341.770 542.862 3.215 27.432 21450-21499-Clean Air (30.440) 3.248 3.265 (2.067) (32.524) 21500-21549-New York State Infrastructure Trust 0.071 - - - 0.071 21550-21599-Legislative Computer Services 12.369 0.012 0.107 - 12.274 21600-21649-Biodiversity Stewardship and Research - - - - - 21650-21699-Combined Non-Expendable Trust 0.469 - - - 0.469 21700-21749-Winter Sports Education Trust - - - - - 21750-21799-Musical Instrument Revolving - - - - - 21850-21899-Arts Capital Grants 0.835 0.001 - - 0.836 21900-22499-Miscellaneous State Special Revenue 1,727.317 244.870 222.489 (6.237) 1,743.461 22500-22549-Court Facilities Incentive Aid 16.784 0.002 13.448 28.000 31.338
38
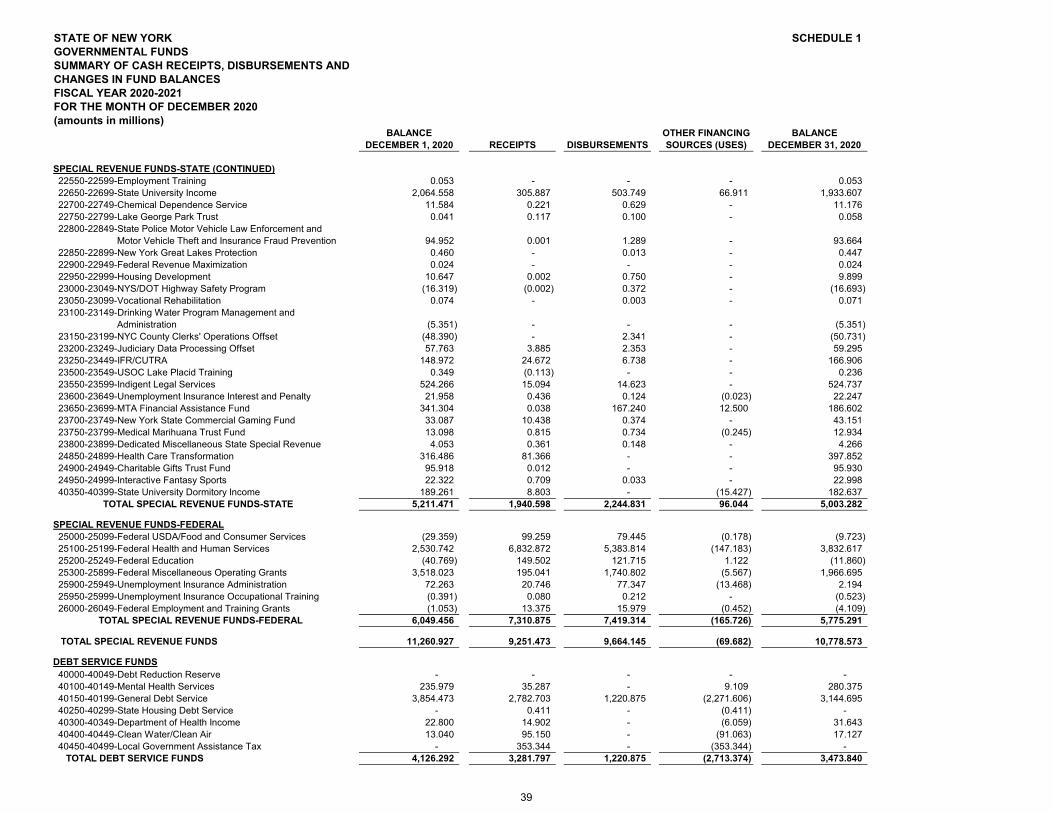
STATE OF NEW YORK SCHEDULE 1GOVERNMENTAL FUNDS
SUMMARY OF CASH RECEIPTS, DISBURSEMENTS AND CHANGES IN FUND BALANCES FISCAL YEAR 2020-2021FOR THE MONTH OF DECEMBER 2020
(amounts in millions) BALANCE OTHER FINANCING BALANCE
DECEMBER 1, 2020 RECEIPTS DISBURSEMENTS SOURCES (USES) DECEMBER 31, 2020
SPECIAL REVENUE FUNDS-STATE (CONTINUED) 22550-22599-Employment Training 0.053 - - - 0.053 22650-22699-State University Income 2,064.558 305.887 503.749 66.911 1,933.607 22700-22749-Chemical Dependence Service 11.584 0.221 0.629 - 11.176 22750-22799-Lake George Park Trust 0.041 0.117 0.100 - 0.058 22800-22849-State Police Motor Vehicle Law Enforcement and Motor Vehicle Theft and Insurance Fraud Prevention 94.952 0.001 1.289 - 93.664 22850-22899-New York Great Lakes Protection 0.460 - 0.013 - 0.447 22900-22949-Federal Revenue Maximization 0.024 - - - 0.024 22950-22999-Housing Development 10.647 0.002 0.750 - 9.899 23000-23049-NYS/DOT Highway Safety Program (16.319) (0.002) 0.372 - (16.693) 23050-23099-Vocational Rehabilitation 0.074 - 0.003 - 0.071 23100-23149-Drinking Water Program Management and Administration (5.351) - - - (5.351) 23150-23199-NYC County Clerks' Operations Offset (48.390) - 2.341 - (50.731) 23200-23249-Judiciary Data Processing Offset 57.763 3.885 2.353 - 59.295 23250-23449-IFR/CUTRA 148.972 24.672 6.738 - 166.906 23500-23549-USOC Lake Placid Training 0.349 (0.113) - - 0.236 23550-23599-Indigent Legal Services 524.266 15.094 14.623 - 524.737 23600-23649-Unemployment Insurance Interest and Penalty 21.958 0.436 0.124 (0.023) 22.247 23650-23699-MTA Financial Assistance Fund 341.304 0.038 167.240 12.500 186.602 23700-23749-New York State Commercial Gaming Fund 33.087 10.438 0.374 - 43.151 23750-23799-Medical Marihuana Trust Fund 13.098 0.815 0.734 (0.245) 12.934 23800-23899-Dedicated Miscellaneous State Special Revenue 4.053 0.361 0.148 - 4.266 24850-24899-Health Care Transformation 316.486 81.366 - - 397.852 24900-24949-Charitable Gifts Trust Fund 95.918 0.012 - - 95.930 24950-24999-Interactive Fantasy Sports 22.322 0.709 0.033 - 22.998 40350-40399-State University Dormitory Income 189.261 8.803 - (15.427) 182.637
TOTAL SPECIAL REVENUE FUNDS-STATE 5,211.471 1,940.598 2,244.831 96.044 5,003.282
SPECIAL REVENUE FUNDS-FEDERAL 25000-25099-Federal USDA/Food and Consumer Services (29.359) 99.259 79.445 (0.178) (9.723) 25100-25199-Federal Health and Human Services 2,530.742 6,832.872 5,383.814 (147.183) 3,832.617 25200-25249-Federal Education (40.769) 149.502 121.715 1.122 (11.860) 25300-25899-Federal Miscellaneous Operating Grants 3,518.023 195.041 1,740.802 (5.567) 1,966.695 25900-25949-Unemployment Insurance Administration 72.263 20.746 77.347 (13.468) 2.194 25950-25999-Unemployment Insurance Occupational Training (0.391) 0.080 0.212 - (0.523) 26000-26049-Federal Employment and Training Grants (1.053) 13.375 15.979 (0.452) (4.109)
TOTAL SPECIAL REVENUE FUNDS-FEDERAL 6,049.456 7,310.875 7,419.314 (165.726) 5,775.291
TOTAL SPECIAL REVENUE FUNDS 11,260.927 9,251.473 9,664.145 (69.682) 10,778.573
DEBT SERVICE FUNDS 40000-40049-Debt Reduction Reserve - - - - - 40100-40149-Mental Health Services 235.979 35.287 - 9.109 280.375 40150-40199-General Debt Service 3,854.473 2,782.703 1,220.875 (2,271.606) 3,144.695 40250-40299-State Housing Debt Service - 0.411 - (0.411) - 40300-40349-Department of Health Income 22.800 14.902 - (6.059) 31.643 40400-40449-Clean Water/Clean Air 13.040 95.150 - (91.063) 17.127 40450-40499-Local Government Assistance Tax - 353.344 - (353.344) - TOTAL DEBT SERVICE FUNDS 4,126.292 3,281.797 1,220.875 (2,713.374) 3,473.840
39
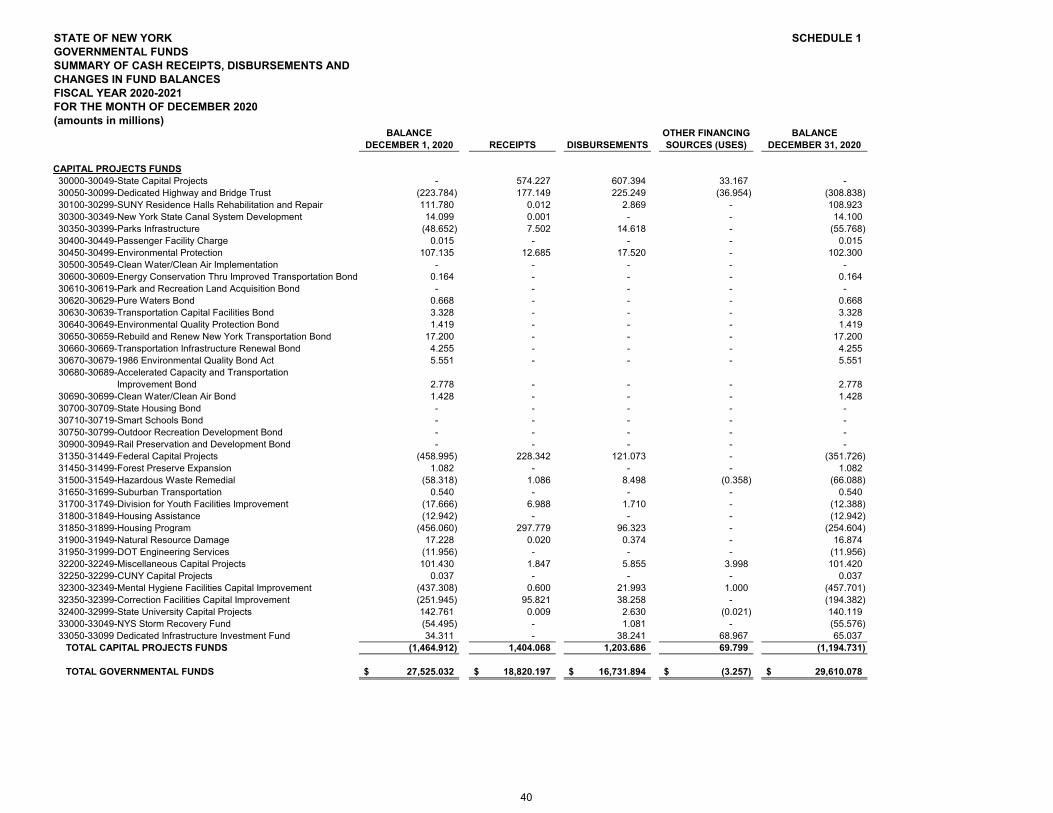
STATE OF NEW YORK SCHEDULE 1GOVERNMENTAL FUNDS
SUMMARY OF CASH RECEIPTS, DISBURSEMENTS AND CHANGES IN FUND BALANCES FISCAL YEAR 2020-2021FOR THE MONTH OF DECEMBER 2020
(amounts in millions) BALANCE OTHER FINANCING BALANCE
DECEMBER 1, 2020 RECEIPTS DISBURSEMENTS SOURCES (USES) DECEMBER 31, 2020
CAPITAL PROJECTS FUNDS 30000-30049-State Capital Projects - 574.227 607.394 33.167 - 30050-30099-Dedicated Highway and Bridge Trust (223.784) 177.149 225.249 (36.954) (308.838) 30100-30299-SUNY Residence Halls Rehabilitation and Repair 111.780 0.012 2.869 - 108.923 30300-30349-New York State Canal System Development 14.099 0.001 - - 14.100 30350-30399-Parks Infrastructure (48.652) 7.502 14.618 - (55.768) 30400-30449-Passenger Facility Charge 0.015 - - - 0.015 30450-30499-Environmental Protection 107.135 12.685 17.520 - 102.300 30500-30549-Clean Water/Clean Air Implementation - - - - - 30600-30609-Energy Conservation Thru Improved Transportation Bond 0.164 - - - 0.164 30610-30619-Park and Recreation Land Acquisition Bond - - - - - 30620-30629-Pure Waters Bond 0.668 - - - 0.668 30630-30639-Transportation Capital Facilities Bond 3.328 - - - 3.328 30640-30649-Environmental Quality Protection Bond 1.419 - - - 1.419 30650-30659-Rebuild and Renew New York Transportation Bond 17.200 - - - 17.200 30660-30669-Transportation Infrastructure Renewal Bond 4.255 - - - 4.255 30670-30679-1986 Environmental Quality Bond Act 5.551 - - - 5.551 30680-30689-Accelerated Capacity and Transportation Improvement Bond 2.778 - - - 2.778 30690-30699-Clean Water/Clean Air Bond 1.428 - - - 1.428 30700-30709-State Housing Bond - - - - - 30710-30719-Smart Schools Bond - - - - - 30750-30799-Outdoor Recreation Development Bond - - - - - 30900-30949-Rail Preservation and Development Bond - - - - - 31350-31449-Federal Capital Projects (458.995) 228.342 121.073 - (351.726) 31450-31499-Forest Preserve Expansion 1.082 - - - 1.082 31500-31549-Hazardous Waste Remedial (58.318) 1.086 8.498 (0.358) (66.088) 31650-31699-Suburban Transportation 0.540 - - - 0.540 31700-31749-Division for Youth Facilities Improvement (17.666) 6.988 1.710 - (12.388) 31800-31849-Housing Assistance (12.942) - - - (12.942) 31850-31899-Housing Program (456.060) 297.779 96.323 - (254.604) 31900-31949-Natural Resource Damage 17.228 0.020 0.374 - 16.874 31950-31999-DOT Engineering Services (11.956) - - - (11.956) 32200-32249-Miscellaneous Capital Projects 101.430 1.847 5.855 3.998 101.420 32250-32299-CUNY Capital Projects 0.037 - - - 0.037 32300-32349-Mental Hygiene Facilities Capital Improvement (437.308) 0.600 21.993 1.000 (457.701) 32350-32399-Correction Facilities Capital Improvement (251.945) 95.821 38.258 - (194.382) 32400-32999-State University Capital Projects 142.761 0.009 2.630 (0.021) 140.119 33000-33049-NYS Storm Recovery Fund (54.495) - 1.081 - (55.576) 33050-33099 Dedicated Infrastructure Investment Fund 34.311 - 38.241 68.967 65.037 TOTAL CAPITAL PROJECTS FUNDS (1,464.912) 1,404.068 1,203.686 69.799 (1,194.731)
TOTAL GOVERNMENTAL FUNDS 27,525.032$ 18,820.197$ 16,731.894$ (3.257)$ 29,610.078$
40
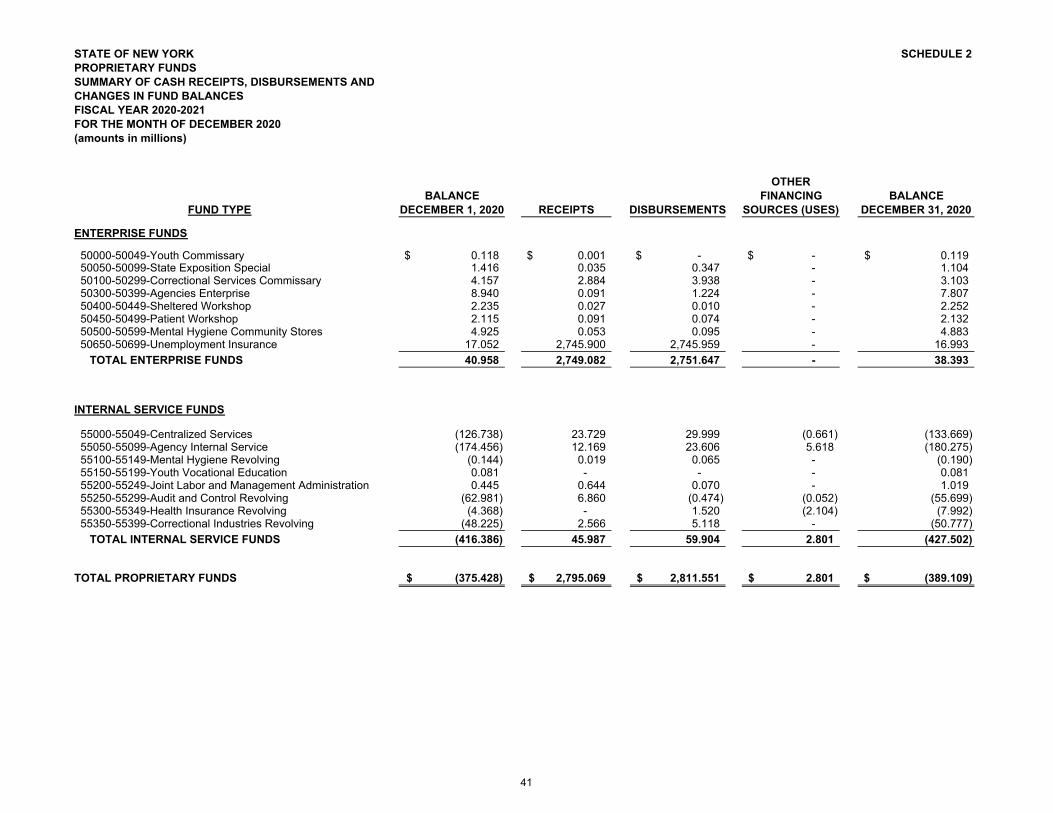
STATE OF NEW YORK SCHEDULE 2PROPRIETARY FUNDSSUMMARY OF CASH RECEIPTS, DISBURSEMENTS ANDCHANGES IN FUND BALANCES FISCAL YEAR 2020-2021FOR THE MONTH OF DECEMBER 2020(amounts in millions)
OTHERBALANCE FINANCING BALANCE
FUND TYPE DECEMBER 1, 2020 RECEIPTS DISBURSEMENTS SOURCES (USES) DECEMBER 31, 2020
ENTERPRISE FUNDS
50000-50049-Youth Commissary 0.118$ 0.001$ -$ -$ 0.119$ 50050-50099-State Exposition Special 1.416 0.035 0.347 - 1.104 50100-50299-Correctional Services Commissary 4.157 2.884 3.938 - 3.103 50300-50399-Agencies Enterprise 8.940 0.091 1.224 - 7.807 50400-50449-Sheltered Workshop 2.235 0.027 0.010 - 2.252 50450-50499-Patient Workshop 2.115 0.091 0.074 - 2.132 50500-50599-Mental Hygiene Community Stores 4.925 0.053 0.095 - 4.883 50650-50699-Unemployment Insurance 17.052 2,745.900 2,745.959 - 16.993 TOTAL ENTERPRISE FUNDS 40.958 2,749.082 2,751.647 - 38.393
INTERNAL SERVICE FUNDS
55000-55049-Centralized Services (126.738) 23.729 29.999 (0.661) (133.669) 55050-55099-Agency Internal Service (174.456) 12.169 23.606 5.618 (180.275) 55100-55149-Mental Hygiene Revolving (0.144) 0.019 0.065 - (0.190) 55150-55199-Youth Vocational Education 0.081 - - - 0.081 55200-55249-Joint Labor and Management Administration 0.445 0.644 0.070 - 1.019 55250-55299-Audit and Control Revolving (62.981) 6.860 (0.474) (0.052) (55.699) 55300-55349-Health Insurance Revolving (4.368) - 1.520 (2.104) (7.992) 55350-55399-Correctional Industries Revolving (48.225) 2.566 5.118 - (50.777) TOTAL INTERNAL SERVICE FUNDS (416.386) 45.987 59.904 2.801 (427.502)
TOTAL PROPRIETARY FUNDS (375.428)$ 2,795.069$ 2,811.551$ 2.801$ (389.109)$
41
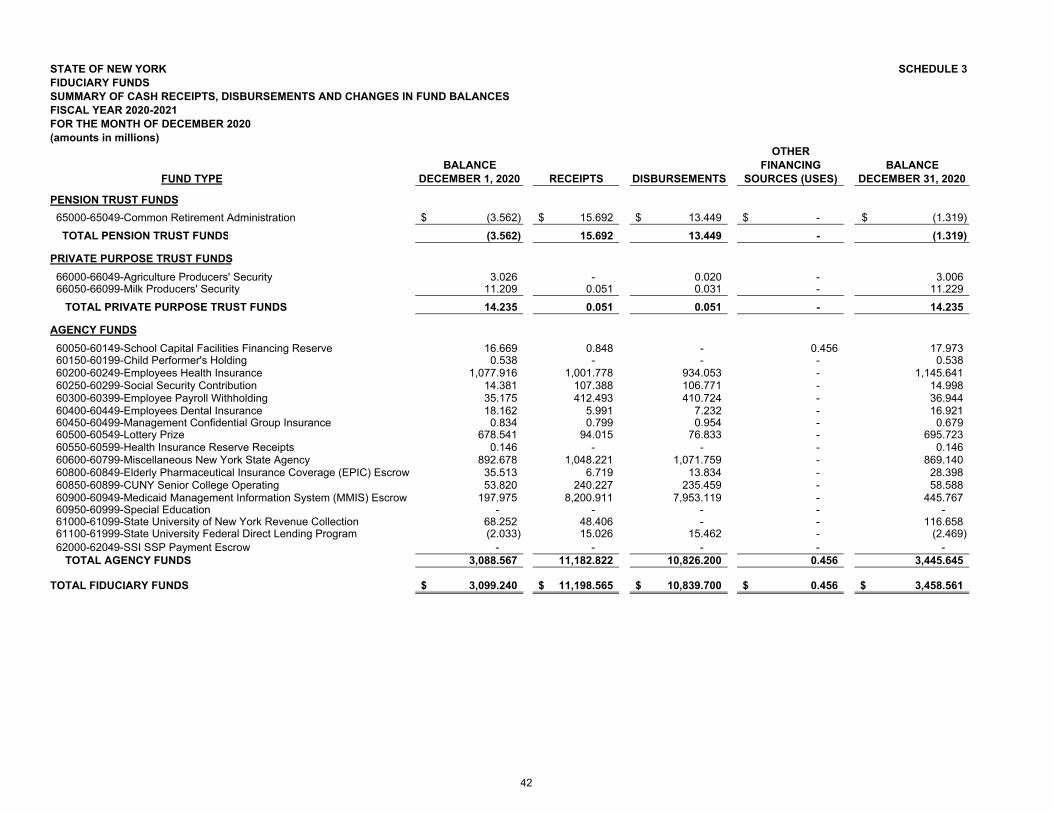
STATE OF NEW YORK SCHEDULE 3FIDUCIARY FUNDSSUMMARY OF CASH RECEIPTS, DISBURSEMENTS AND CHANGES IN FUND BALANCES FISCAL YEAR 2020-2021FOR THE MONTH OF DECEMBER 2020(amounts in millions)
OTHERBALANCE FINANCING BALANCE
FUND TYPE DECEMBER 1, 2020 RECEIPTS DISBURSEMENTS SOURCES (USES) DECEMBER 31, 2020 PENSION TRUST FUNDS 65000-65049-Common Retirement Administration (3.562)$ 15.692$ 13.449$ -$ (1.319)$ TOTAL PENSION TRUST FUNDS (3.562) 15.692 13.449 - (1.319)
PRIVATE PURPOSE TRUST FUNDS 66000-66049-Agriculture Producers' Security 3.026 - 0.020 - 3.006 66050-66099-Milk Producers' Security 11.209 0.051 0.031 - 11.229 TOTAL PRIVATE PURPOSE TRUST FUNDS 14.235 0.051 0.051 - 14.235
AGENCY FUNDS 60050-60149-School Capital Facilities Financing Reserve 16.669 0.848 - 0.456 17.973 60150-60199-Child Performer's Holding 0.538 - - - 0.538 60200-60249-Employees Health Insurance 1,077.916 1,001.778 934.053 - 1,145.641 60250-60299-Social Security Contribution 14.381 107.388 106.771 - 14.998 60300-60399-Employee Payroll Withholding 35.175 412.493 410.724 - 36.944 60400-60449-Employees Dental Insurance 18.162 5.991 7.232 - 16.921 60450-60499-Management Confidential Group Insurance 0.834 0.799 0.954 - 0.679 60500-60549-Lottery Prize 678.541 94.015 76.833 - 695.723 60550-60599-Health Insurance Reserve Receipts 0.146 - - - 0.146 60600-60799-Miscellaneous New York State Agency 892.678 1,048.221 1,071.759 - 869.140 60800-60849-Elderly Pharmaceutical Insurance Coverage (EPIC) Escrow 35.513 6.719 13.834 - 28.398 60850-60899-CUNY Senior College Operating 53.820 240.227 235.459 - 58.588 60900-60949-Medicaid Management Information System (MMIS) Escrow 197.975 8,200.911 7,953.119 - 445.767 60950-60999-Special Education - - - - - 61000-61099-State University of New York Revenue Collection 68.252 48.406 - - 116.658 61100-61999-State University Federal Direct Lending Program (2.033) 15.026 15.462 - (2.469) 62000-62049-SSI SSP Payment Escrow - - - - - TOTAL AGENCY FUNDS 3,088.567 11,182.822 10,826.200 0.456 3,445.645
TOTAL FIDUCIARY FUNDS 3,099.240$ 11,198.565$ 10,839.700$ 0.456$ 3,458.561$
42
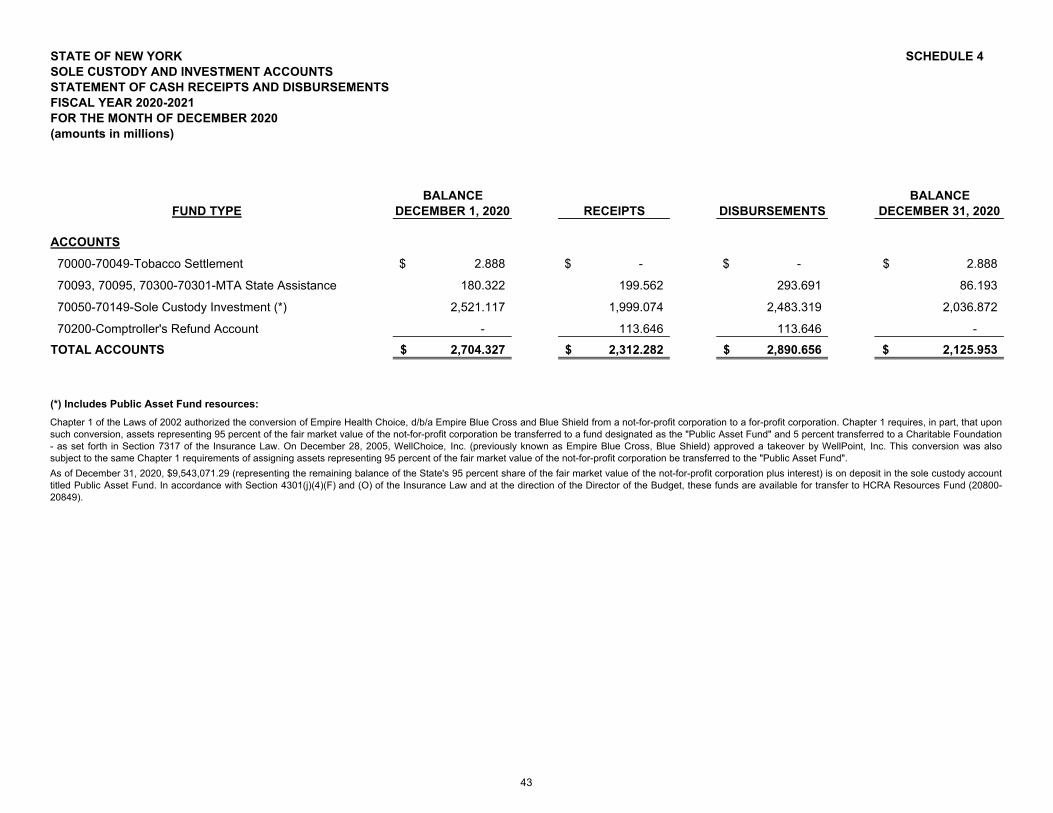
STATE OF NEW YORK SCHEDULE 4SOLE CUSTODY AND INVESTMENT ACCOUNTSSTATEMENT OF CASH RECEIPTS AND DISBURSEMENTS FISCAL YEAR 2020-2021FOR THE MONTH OF DECEMBER 2020(amounts in millions)
BALANCE BALANCEFUND TYPE DECEMBER 1, 2020 RECEIPTS DISBURSEMENTS DECEMBER 31, 2020
ACCOUNTS 70000-70049-Tobacco Settlement 2.888$ -$ -$ 2.888$
70093, 70095, 70300-70301-MTA State Assistance 180.322 199.562 293.691 86.193
70050-70149-Sole Custody Investment (*) 2,521.117 1,999.074 2,483.319 2,036.872
70200-Comptroller's Refund Account - 113.646 113.646 - TOTAL ACCOUNTS 2,704.327$ 2,312.282$ 2,890.656$ 2,125.953$
(*) Includes Public Asset Fund resources:
Chapter 1 of the Laws of 2002 authorized the conversion of Empire Health Choice, d/b/a Empire Blue Cross and Blue Shield from a not-for-profit corporation to a for-profit corporation. Chapter 1 requires, in part, that uponsuch conversion, assets representing 95 percent of the fair market value of the not-for-profit corporation be transferred to a fund designated as the "Public Asset Fund" and 5 percent transferred to a Charitable Foundation- as set forth in Section 7317 of the Insurance Law. On December 28, 2005, WellChoice, Inc. (previously known as Empire Blue Cross, Blue Shield) approved a takeover by WellPoint, Inc. This conversion was alsosubject to the same Chapter 1 requirements of assigning assets representing 95 percent of the fair market value of the not-for-profit corporation be transferred to the "Public Asset Fund". As of December 31, 2020, $9,543,071.29 (representing the remaining balance of the State's 95 percent share of the fair market value of the not-for-profit corporation plus interest) is on deposit in the sole custody accounttitled Public Asset Fund. In accordance with Section 4301(j)(4)(F) and (O) of the Insurance Law and at the direction of the Director of the Budget, these funds are available for transfer to HCRA Resources Fund (20800-20849).
43
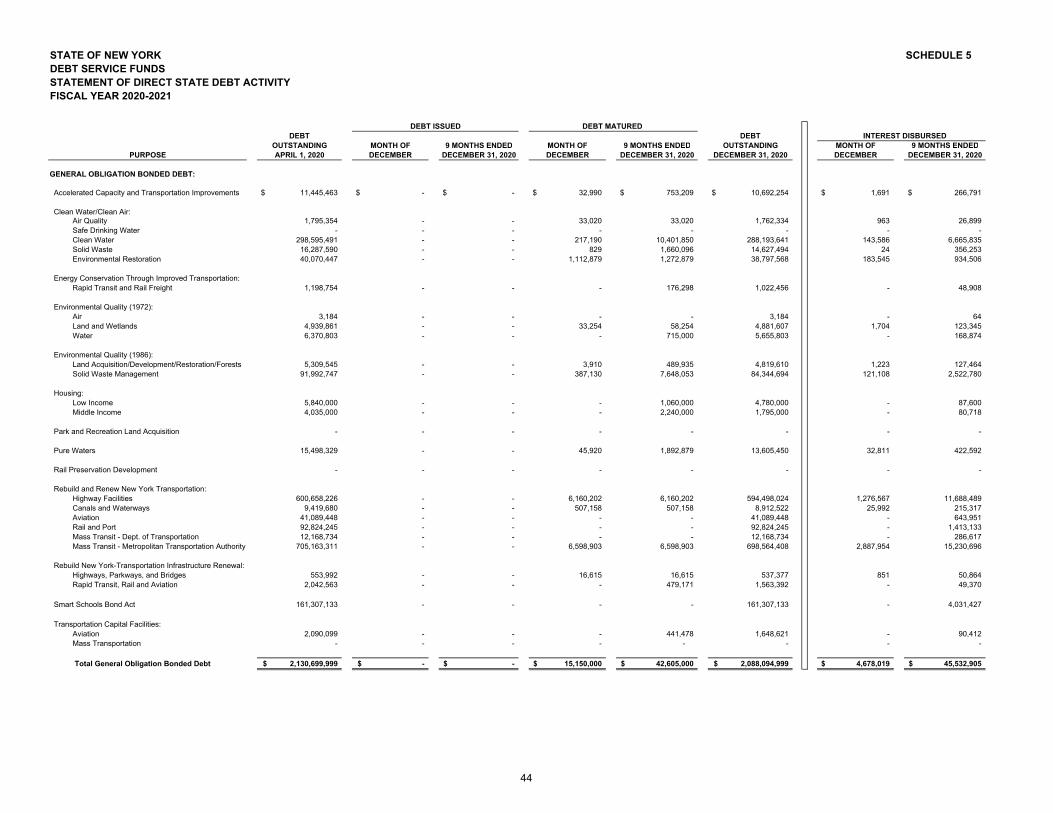
STATE OF NEW YORK SCHEDULE 5DEBT SERVICE FUNDS
STATEMENT OF DIRECT STATE DEBT ACTIVITYFISCAL YEAR 2020-2021
DEBT MATURED DEBT DEBT INTEREST DISBURSED
OUTSTANDING MONTH OF 9 MONTHS ENDED MONTH OF 9 MONTHS ENDED OUTSTANDING MONTH OF 9 MONTHS ENDEDPURPOSE APRIL 1, 2020 DECEMBER DECEMBER 31, 2020 DECEMBER DECEMBER 31, 2020 DECEMBER 31, 2020 DECEMBER DECEMBER 31, 2020
GENERAL OBLIGATION BONDED DEBT:
Accelerated Capacity and Transportation Improvements 11,445,463$ -$ -$ 32,990$ 753,209$ 10,692,254$ 1,691$ 266,791$
Clean Water/Clean Air: Air Quality 1,795,354 - - 33,020 33,020 1,762,334 963 26,899 Safe Drinking Water - - - - - - - - Clean Water 298,595,491 - - 217,190 10,401,850 288,193,641 143,586 6,665,835 Solid Waste 16,287,590 - - 829 1,660,096 14,627,494 24 356,253 Environmental Restoration 40,070,447 - - 1,112,879 1,272,879 38,797,568 183,545 934,506
Energy Conservation Through Improved Transportation: Rapid Transit and Rail Freight 1,198,754 - - - 176,298 1,022,456 - 48,908
Environmental Quality (1972): Air 3,184 - - - - 3,184 - 64 Land and Wetlands 4,939,861 - - 33,254 58,254 4,881,607 1,704 123,345 Water 6,370,803 - - - 715,000 5,655,803 - 168,874
Environmental Quality (1986): Land Acquisition/Development/Restoration/Forests 5,309,545 - - 3,910 489,935 4,819,610 1,223 127,464 Solid Waste Management 91,992,747 - - 387,130 7,648,053 84,344,694 121,108 2,522,780
Housing: Low Income 5,840,000 - - - 1,060,000 4,780,000 - 87,600 Middle Income 4,035,000 - - - 2,240,000 1,795,000 - 80,718
Park and Recreation Land Acquisition - - - - - - - -
Pure Waters 15,498,329 - - 45,920 1,892,879 13,605,450 32,811 422,592
Rail Preservation Development - - - - - - - -
Rebuild and Renew New York Transportation: Highway Facilities 600,658,226 - - 6,160,202 6,160,202 594,498,024 1,276,567 11,688,489 Canals and Waterways 9,419,680 - - 507,158 507,158 8,912,522 25,992 215,317 Aviation 41,089,448 - - - - 41,089,448 - 643,951 Rail and Port 92,824,245 - - - - 92,824,245 - 1,413,133 Mass Transit - Dept. of Transportation 12,168,734 - - - - 12,168,734 - 286,617 Mass Transit - Metropolitan Transportation Authority 705,163,311 - - 6,598,903 6,598,903 698,564,408 2,887,954 15,230,696
Rebuild New York-Transportation Infrastructure Renewal: Highways, Parkways, and Bridges 553,992 - - 16,615 16,615 537,377 851 50,864 Rapid Transit, Rail and Aviation 2,042,563 - - - 479,171 1,563,392 - 49,370
Smart Schools Bond Act 161,307,133 - - - - 161,307,133 - 4,031,427
Transportation Capital Facilities: Aviation 2,090,099 - - - 441,478 1,648,621 - 90,412 Mass Transportation - - - - - - - -
Total General Obligation Bonded Debt 2,130,699,999$ -$ -$ 15,150,000$ 42,605,000$ 2,088,094,999$ 4,678,019$ 45,532,905$
DEBT ISSUED
44
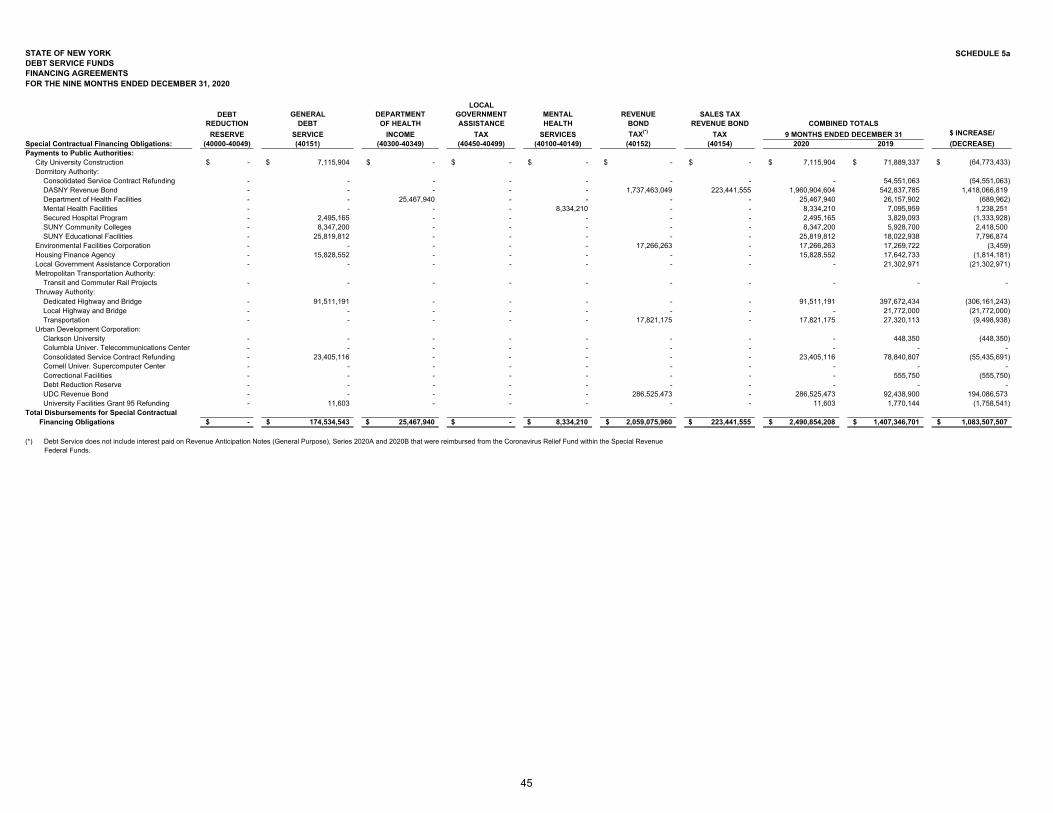
STATE OF NEW YORK SCHEDULE 5aDEBT SERVICE FUNDS FINANCING AGREEMENTSFOR THE NINE MONTHS ENDED DECEMBER 31, 2020
LOCALDEBT GENERAL DEPARTMENT GOVERNMENT MENTAL REVENUE SALES TAX
REDUCTION DEBT OF HEALTH ASSISTANCE HEALTH BOND REVENUE BOND COMBINED TOTALSRESERVE SERVICE INCOME TAX SERVICES TAX(*) TAX 9 MONTHS ENDED DECEMBER 31 $ INCREASE/
Special Contractual Financing Obligations: (40000-40049) (40151) (40300-40349) (40450-40499) (40100-40149) (40152) (40154) 2020 2019 (DECREASE)Payments to Public Authorities: City University Construction -$ 7,115,904$ -$ -$ -$ -$ -$ 7,115,904$ 71,889,337$ (64,773,433)$ Dormitory Authority: Consolidated Service Contract Refunding - - - - - - - - 54,551,063 (54,551,063) DASNY Revenue Bond - - - - - 1,737,463,049 223,441,555 1,960,904,604 542,837,785 1,418,066,819 Department of Health Facilities - - 25,467,940 - - - - 25,467,940 26,157,902 (689,962) Mental Health Facilities - - - - 8,334,210 - - 8,334,210 7,095,959 1,238,251 Secured Hospital Program - 2,495,165 - - - - - 2,495,165 3,829,093 (1,333,928) SUNY Community Colleges - 8,347,200 - - - - - 8,347,200 5,928,700 2,418,500 SUNY Educational Facilities - 25,819,812 - - - - - 25,819,812 18,022,938 7,796,874 Environmental Facilities Corporation - - - - - 17,266,263 - 17,266,263 17,269,722 (3,459) Housing Finance Agency - 15,828,552 - - - - - 15,828,552 17,642,733 (1,814,181) Local Government Assistance Corporation - - - - - - - - 21,302,971 (21,302,971) Metropolitan Transportation Authority: Transit and Commuter Rail Projects - - - - - - - - - - Thruway Authority: Dedicated Highway and Bridge - 91,511,191 - - - - - 91,511,191 397,672,434 (306,161,243) Local Highway and Bridge - - - - - - - - 21,772,000 (21,772,000) Transportation - - - - - 17,821,175 - 17,821,175 27,320,113 (9,498,938) Urban Development Corporation: Clarkson University - - - - - - - - 448,350 (448,350) Columbia Univer. Telecommunications Center - - - - - - - - - - Consolidated Service Contract Refunding - 23,405,116 - - - - - 23,405,116 78,840,807 (55,435,691) Cornell Univer. Supercomputer Center - - - - - - - - - - Correctional Facilities - - - - - - - - 555,750 (555,750) Debt Reduction Reserve - - - - - - - - - - UDC Revenue Bond - - - - - 286,525,473 - 286,525,473 92,438,900 194,086,573 University Facilities Grant 95 Refunding - 11,603 - - - - - 11,603 1,770,144 (1,758,541) Total Disbursements for Special Contractual Financing Obligations -$ 174,534,543$ 25,467,940$ -$ 8,334,210$ 2,059,075,960$ 223,441,555$ 2,490,854,208$ 1,407,346,701$ 1,083,507,507$
(*) Debt Service does not include interest paid on Revenue Anticipation Notes (General Purpose), Series 2020A and 2020B that were reimbursed from the Coronavirus Relief Fund within the Special Revenue Federal Funds.
45
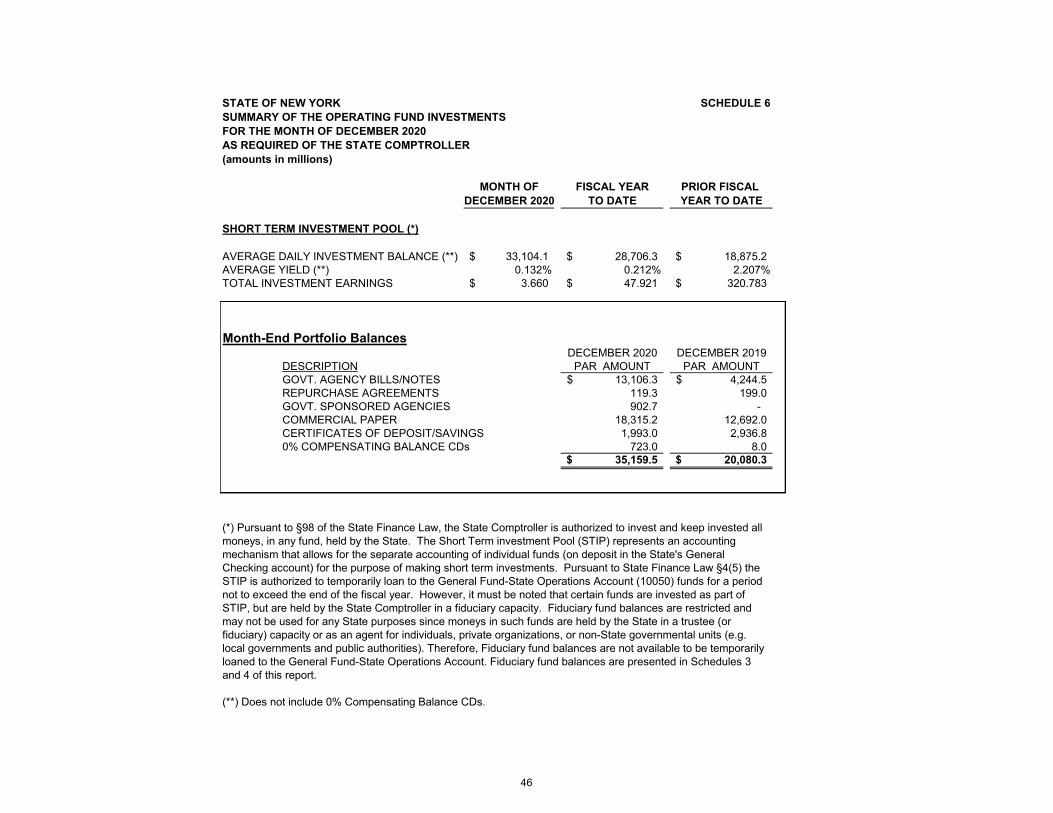
STATE OF NEW YORK SCHEDULE 6SUMMARY OF THE OPERATING FUND INVESTMENTS FOR THE MONTH OF DECEMBER 2020AS REQUIRED OF THE STATE COMPTROLLER(amounts in millions)
MONTH OF FISCAL YEAR PRIOR FISCAL DECEMBER 2020 TO DATE YEAR TO DATE
SHORT TERM INVESTMENT POOL (*)
AVERAGE DAILY INVESTMENT BALANCE (**) 33,104.1$ 28,706.3$ 18,875.2$ AVERAGE YIELD (**) 0.132% 0.212% 2.207%TOTAL INVESTMENT EARNINGS 3.660$ 47.921$ 320.783$
Month-End Portfolio BalancesDECEMBER 2020 DECEMBER 2019
DESCRIPTION PAR AMOUNT PAR AMOUNTGOVT. AGENCY BILLS/NOTES 13,106.3$ 4,244.5$ REPURCHASE AGREEMENTS 119.3 199.0 GOVT. SPONSORED AGENCIES 902.7 - COMMERCIAL PAPER 18,315.2 12,692.0 CERTIFICATES OF DEPOSIT/SAVINGS 1,993.0 2,936.8 0% COMPENSATING BALANCE CDs 723.0 8.0
35,159.5$ 20,080.3$
(**) Does not include 0% Compensating Balance CDs.
(*) Pursuant to §98 of the State Finance Law, the State Comptroller is authorized to invest and keep invested all moneys, in any fund, held by the State. The Short Term investment Pool (STIP) represents an accounting mechanism that allows for the separate accounting of individual funds (on deposit in the State's General Checking account) for the purpose of making short term investments. Pursuant to State Finance Law §4(5) the STIP is authorized to temporarily loan to the General Fund-State Operations Account (10050) funds for a period not to exceed the end of the fiscal year. However, it must be noted that certain funds are invested as part of STIP, but are held by the State Comptroller in a fiduciary capacity. Fiduciary fund balances are restricted and may not be used for any State purposes since moneys in such funds are held by the State in a trustee (or fiduciary) capacity or as an agent for individuals, private organizations, or non-State governmental units (e.g. local governments and public authorities). Therefore, Fiduciary fund balances are not available to be temporarily loaned to the General Fund-State Operations Account. Fiduciary fund balances are presented in Schedules 3 and 4 of this report.
46
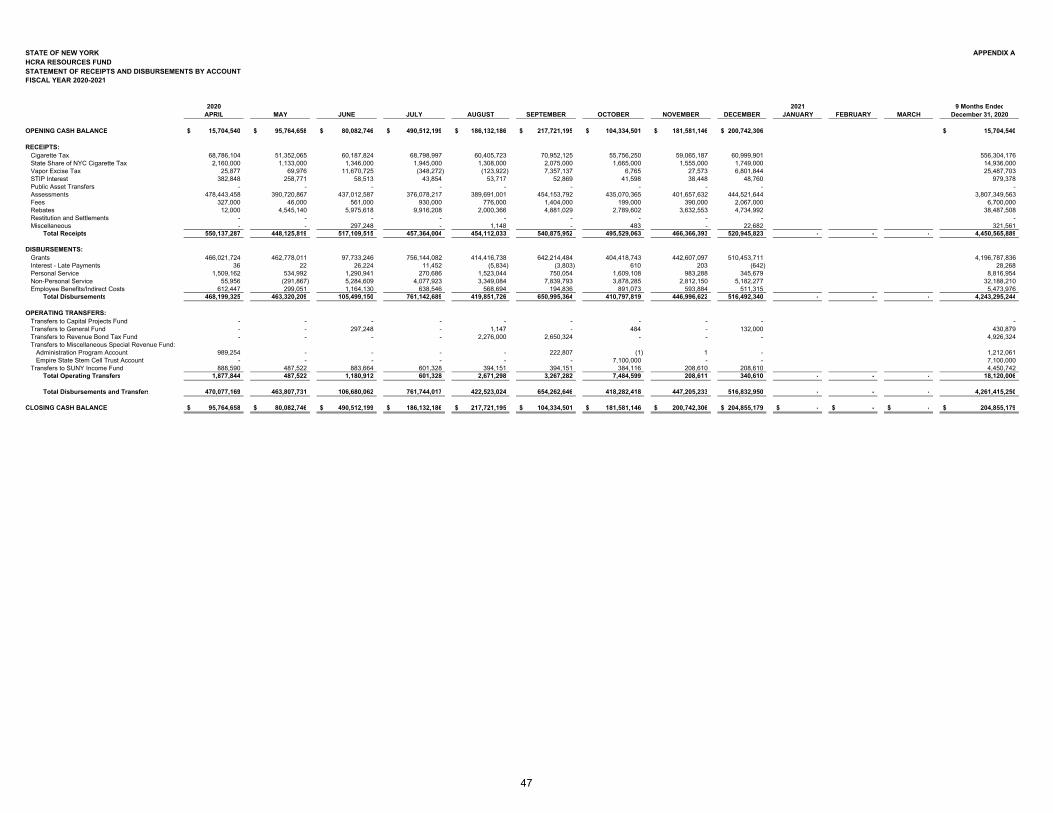
STATE OF NEW YORK APPENDIX AHCRA RESOURCES FUND STATEMENT OF RECEIPTS AND DISBURSEMENTS BY ACCOUNT FISCAL YEAR 2020-2021
2020 2021 9 Months EndedAPRIL MAY JUNE JULY AUGUST SEPTEMBER OCTOBER NOVEMBER DECEMBER JANUARY FEBRUARY MARCH December 31, 2020
OPENING CASH BALANCE 15,704,540$ 95,764,658$ 80,082,746$ 490,512,199$ 186,132,186$ 217,721,195$ 104,334,501$ 181,581,146$ 200,742,306$ 15,704,540$
RECEIPTS: Cigarette Tax 68,786,104 51,352,065 60,187,824 68,798,997 60,405,723 70,952,125 55,756,250 59,065,187 60,999,901 556,304,176 State Share of NYC Cigarette Tax 2,160,000 1,133,000 1,346,000 1,945,000 1,308,000 2,075,000 1,665,000 1,555,000 1,749,000 14,936,000 Vapor Excise Tax 25,877 69,976 11,670,725 (348,272) (123,922) 7,357,137 6,765 27,573 6,801,844 25,487,703 STIP Interest 382,848 258,771 58,513 43,854 53,717 52,869 41,598 38,448 48,760 979,378 Public Asset Transfers - - - - - - - - - - Assessments 478,443,458 390,720,867 437,012,587 376,078,217 389,691,001 454,153,792 435,070,365 401,657,632 444,521,644 3,807,349,563 Fees 327,000 46,000 561,000 930,000 776,000 1,404,000 199,000 390,000 2,067,000 6,700,000 Rebates 12,000 4,545,140 5,975,618 9,916,208 2,000,366 4,881,029 2,789,602 3,632,553 4,734,992 38,487,508 Restitution and Settlements - - - - - - - - - - Miscellaneous - - 297,248 - 1,148 - 483 - 22,682 321,561 Total Receipts 550,137,287 448,125,819 517,109,515 457,364,004 454,112,033 540,875,952 495,529,063 466,366,393 520,945,823 - - - 4,450,565,889
DISBURSEMENTS: Grants 466,021,724 462,778,011 97,733,246 756,144,082 414,416,738 642,214,484 404,418,743 442,607,097 510,453,711 4,196,787,836 Interest - Late Payments 36 22 26,224 11,452 (5,834) (3,803) 610 203 (642) 28,268 Personal Service 1,509,162 534,992 1,290,941 270,686 1,523,044 750,054 1,609,108 983,288 345,679 8,816,954 Non-Personal Service 55,956 (291,867) 5,284,609 4,077,923 3,349,084 7,839,793 3,878,285 2,812,150 5,182,277 32,188,210 Employee Benefits/Indirect Costs 612,447 299,051 1,164,130 638,546 568,694 194,836 891,073 593,884 511,315 5,473,976 Total Disbursements 468,199,325 463,320,209 105,499,150 761,142,689 419,851,726 650,995,364 410,797,819 446,996,622 516,492,340 - - - 4,243,295,244
OPERATING TRANSFERS: Transfers to Capital Projects Fund - - - - - - - - - - Transfers to General Fund - - 297,248 - 1,147 - 484 - 132,000 430,879 Transfers to Revenue Bond Tax Fund - - - - 2,276,000 2,650,324 - - - 4,926,324 Transfers to Miscellaneous Special Revenue Fund: Administration Program Account 989,254 - - - - 222,807 (1) 1 - 1,212,061 Empire State Stem Cell Trust Account - - - - - - 7,100,000 - - 7,100,000 Transfers to SUNY Income Fund 888,590 487,522 883,664 601,328 394,151 394,151 384,116 208,610 208,610 4,450,742 Total Operating Transfers 1,877,844 487,522 1,180,912 601,328 2,671,298 3,267,282 7,484,599 208,611 340,610 - - - 18,120,006
Total Disbursements and Transfers 470,077,169 463,807,731 106,680,062 761,744,017 422,523,024 654,262,646 418,282,418 447,205,233 516,832,950 - - - 4,261,415,250
CLOSING CASH BALANCE 95,764,658$ 80,082,746$ 490,512,199$ 186,132,186$ 217,721,195$ 104,334,501$ 181,581,146$ 200,742,306$ 204,855,179$ -$ -$ -$ 204,855,179$
47
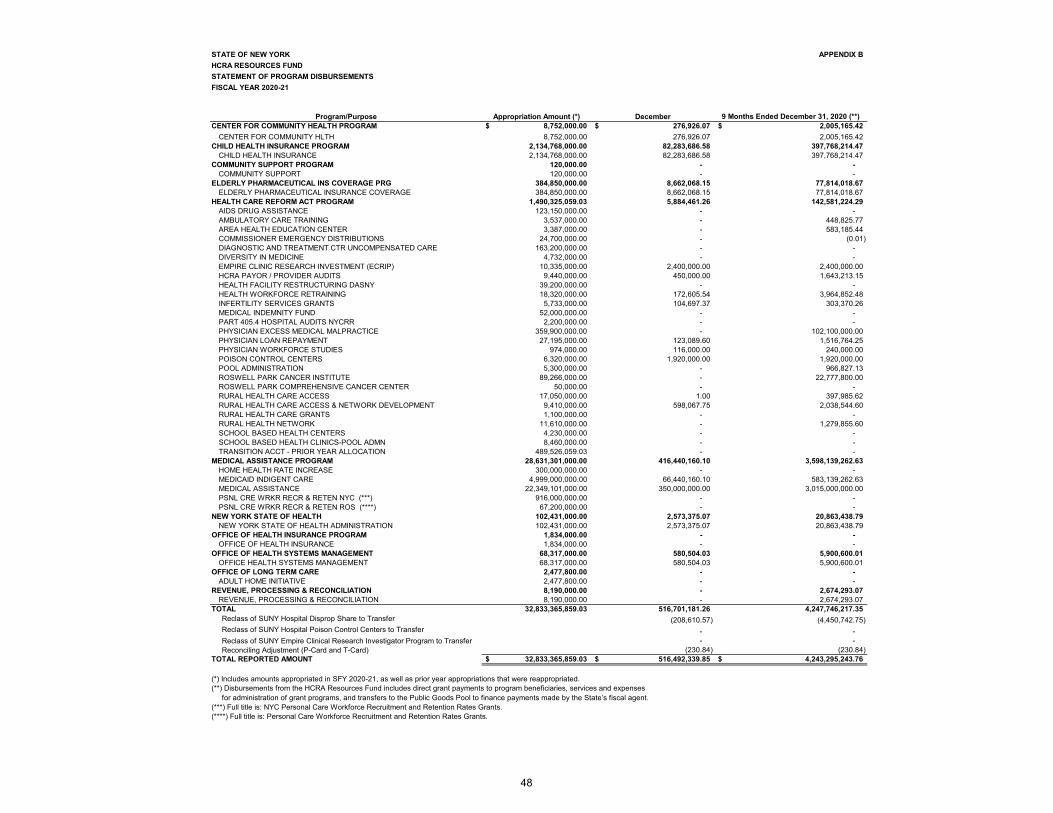
STATE OF NEW YORK APPENDIX BHCRA RESOURCES FUNDSTATEMENT OF PROGRAM DISBURSEMENTS FISCAL YEAR 2020-21
Program/Purpose Appropriation Amount (*) December 9 Months Ended December 31, 2020 (**)CENTER FOR COMMUNITY HEALTH PROGRAM 8,752,000.00$ 276,926.07$ 2,005,165.42$
CENTER FOR COMMUNITY HLTH 8,752,000.00 276,926.07 2,005,165.42 CHILD HEALTH INSURANCE PROGRAM 2,134,768,000.00 82,283,686.58 397,768,214.47
CHILD HEALTH INSURANCE 2,134,768,000.00 82,283,686.58 397,768,214.47 COMMUNITY SUPPORT PROGRAM 120,000.00 - -
COMMUNITY SUPPORT 120,000.00 - - ELDERLY PHARMACEUTICAL INS COVERAGE PRG 384,850,000.00 8,662,068.15 77,814,018.67
ELDERLY PHARMACEUTICAL INSURANCE COVERAGE 384,850,000.00 8,662,068.15 77,814,018.67 HEALTH CARE REFORM ACT PROGRAM 1,490,325,059.03 5,884,461.26 142,581,224.29
AIDS DRUG ASSISTANCE 123,150,000.00 - - AMBULATORY CARE TRAINING 3,537,000.00 - 448,825.77 AREA HEALTH EDUCATION CENTER 3,387,000.00 - 583,185.44 COMMISSIONER EMERGENCY DISTRIBUTIONS 24,700,000.00 - (0.01) DIAGNOSTIC AND TREATMENT CTR UNCOMPENSATED CARE 163,200,000.00 - - DIVERSITY IN MEDICINE 4,732,000.00 - - EMPIRE CLINIC RESEARCH INVESTMENT (ECRIP) 10,335,000.00 2,400,000.00 2,400,000.00 HCRA PAYOR / PROVIDER AUDITS 9,440,000.00 450,000.00 1,643,213.15 HEALTH FACILITY RESTRUCTURING DASNY 39,200,000.00 - - HEALTH WORKFORCE RETRAINING 18,320,000.00 172,605.54 3,964,852.48 INFERTILITY SERVICES GRANTS 5,733,000.00 104,697.37 303,370.26 MEDICAL INDEMNITY FUND 52,000,000.00 - - PART 405.4 HOSPITAL AUDITS NYCRR 2,200,000.00 - - PHYSICIAN EXCESS MEDICAL MALPRACTICE 359,900,000.00 - 102,100,000.00 PHYSICIAN LOAN REPAYMENT 27,195,000.00 123,089.60 1,516,764.25 PHYSICIAN WORKFORCE STUDIES 974,000.00 116,000.00 240,000.00 POISON CONTROL CENTERS 6,320,000.00 1,920,000.00 1,920,000.00 POOL ADMINISTRATION 5,300,000.00 - 966,827.13 ROSWELL PARK CANCER INSTITUTE 89,266,000.00 - 22,777,800.00 ROSWELL PARK COMPREHENSIVE CANCER CENTER 50,000.00 - - RURAL HEALTH CARE ACCESS 17,050,000.00 1.00 397,985.62 RURAL HEALTH CARE ACCESS & NETWORK DEVELOPMENT 9,410,000.00 598,067.75 2,038,544.60 RURAL HEALTH CARE GRANTS 1,100,000.00 - - RURAL HEALTH NETWORK 11,610,000.00 - 1,279,855.60 SCHOOL BASED HEALTH CENTERS 4,230,000.00 - - SCHOOL BASED HEALTH CLINICS-POOL ADMN 8,460,000.00 - - TRANSITION ACCT - PRIOR YEAR ALLOCATION 489,526,059.03 - -
MEDICAL ASSISTANCE PROGRAM 28,631,301,000.00 416,440,160.10 3,598,139,262.63 HOME HEALTH RATE INCREASE 300,000,000.00 - - MEDICAID INDIGENT CARE 4,999,000,000.00 66,440,160.10 583,139,262.63 MEDICAL ASSISTANCE 22,349,101,000.00 350,000,000.00 3,015,000,000.00 PSNL CRE WRKR RECR & RETEN NYC (***) 916,000,000.00 - - PSNL CRE WRKR RECR & RETEN ROS (****) 67,200,000.00 - -
NEW YORK STATE OF HEALTH 102,431,000.00 2,573,375.07 20,863,438.79 NEW YORK STATE OF HEALTH ADMINISTRATION 102,431,000.00 2,573,375.07 20,863,438.79
OFFICE OF HEALTH INSURANCE PROGRAM 1,834,000.00 - - OFFICE OF HEALTH INSURANCE 1,834,000.00 - -
OFFICE OF HEALTH SYSTEMS MANAGEMENT 68,317,000.00 580,504.03 5,900,600.01 OFFICE HEALTH SYSTEMS MANAGEMENT 68,317,000.00 580,504.03 5,900,600.01
OFFICE OF LONG TERM CARE 2,477,800.00 - - ADULT HOME INITIATIVE 2,477,800.00 - -
REVENUE, PROCESSING & RECONCILIATION 8,190,000.00 - 2,674,293.07 REVENUE, PROCESSING & RECONCILIATION 8,190,000.00 - 2,674,293.07
TOTAL 32,833,365,859.03 516,701,181.26 4,247,746,217.35 Reclass of SUNY Hospital Disprop Share to Transfer (208,610.57) (4,450,742.75) Reclass of SUNY Hospital Poison Control Centers to Transfer - - Reclass of SUNY Empire Clinical Research Investigator Program to Transfer - - Reconciling Adjustment (P-Card and T-Card) (230.84) (230.84) TOTAL REPORTED AMOUNT 32,833,365,859.03$ 516,492,339.85$ 4,243,295,243.76$
(*) Includes amounts appropriated in SFY 2020-21, as well as prior year appropriations that were reappropriated. (**) Disbursements from the HCRA Resources Fund includes direct grant payments to program beneficiaries, services and expenses for administration of grant programs, and transfers to the Public Goods Pool to finance payments made by the State’s fiscal agent.(***) Full title is: NYC Personal Care Workforce Recruitment and Retention Rates Grants. (****) Full title is: Personal Care Workforce Recruitment and Retention Rates Grants.
48
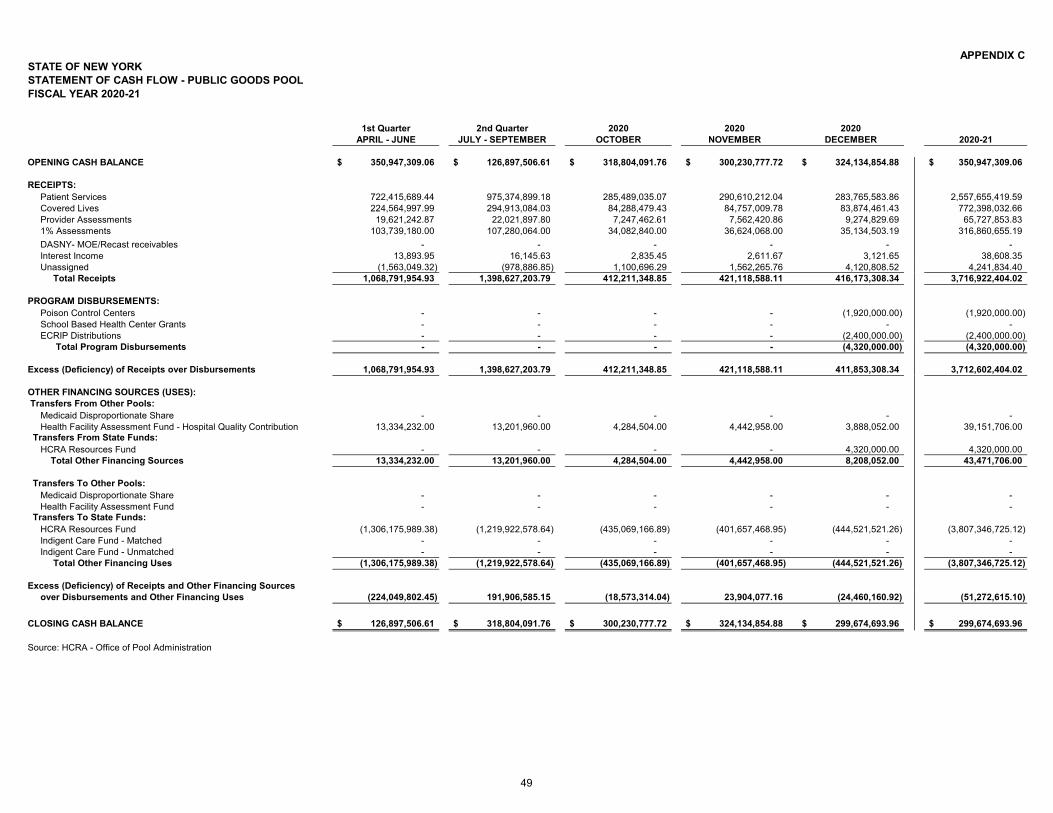
APPENDIX CSTATE OF NEW YORK STATEMENT OF CASH FLOW - PUBLIC GOODS POOLFISCAL YEAR 2020-21
1st Quarter 2nd Quarter 2020 2020 2020APRIL - JUNE JULY - SEPTEMBER OCTOBER NOVEMBER DECEMBER 2020-21
OPENING CASH BALANCE 350,947,309.06$ 126,897,506.61$ 318,804,091.76$ 300,230,777.72$ 324,134,854.88$ 350,947,309.06$
RECEIPTS: Patient Services 722,415,689.44 975,374,899.18 285,489,035.07 290,610,212.04 283,765,583.86 2,557,655,419.59 Covered Lives 224,564,997.99 294,913,084.03 84,288,479.43 84,757,009.78 83,874,461.43 772,398,032.66 Provider Assessments 19,621,242.87 22,021,897.80 7,247,462.61 7,562,420.86 9,274,829.69 65,727,853.83 1% Assessments 103,739,180.00 107,280,064.00 34,082,840.00 36,624,068.00 35,134,503.19 316,860,655.19 DASNY- MOE/Recast receivables - - - - - - Interest Income 13,893.95 16,145.63 2,835.45 2,611.67 3,121.65 38,608.35 Unassigned (1,563,049.32) (978,886.85) 1,100,696.29 1,562,265.76 4,120,808.52 4,241,834.40 Total Receipts 1,068,791,954.93 1,398,627,203.79 412,211,348.85 421,118,588.11 416,173,308.34 3,716,922,404.02
PROGRAM DISBURSEMENTS: Poison Control Centers - - - - (1,920,000.00) (1,920,000.00) School Based Health Center Grants - - - - - - ECRIP Distributions - - - - (2,400,000.00) (2,400,000.00) Total Program Disbursements - - - - (4,320,000.00) (4,320,000.00)
Excess (Deficiency) of Receipts over Disbursements 1,068,791,954.93 1,398,627,203.79 412,211,348.85 421,118,588.11 411,853,308.34 3,712,602,404.02
OTHER FINANCING SOURCES (USES): Transfers From Other Pools: Medicaid Disproportionate Share - - - - - - Health Facility Assessment Fund - Hospital Quality Contribution 13,334,232.00 13,201,960.00 4,284,504.00 4,442,958.00 3,888,052.00 39,151,706.00 Transfers From State Funds: HCRA Resources Fund - - - - 4,320,000.00 4,320,000.00 Total Other Financing Sources 13,334,232.00 13,201,960.00 4,284,504.00 4,442,958.00 8,208,052.00 43,471,706.00
Transfers To Other Pools: Medicaid Disproportionate Share - - - - - - Health Facility Assessment Fund - - - - - - Transfers To State Funds: HCRA Resources Fund (1,306,175,989.38) (1,219,922,578.64) (435,069,166.89) (401,657,468.95) (444,521,521.26) (3,807,346,725.12) Indigent Care Fund - Matched - - - - - - Indigent Care Fund - Unmatched - - - - - - Total Other Financing Uses (1,306,175,989.38) (1,219,922,578.64) (435,069,166.89) (401,657,468.95) (444,521,521.26) (3,807,346,725.12)
Excess (Deficiency) of Receipts and Other Financing Sources over Disbursements and Other Financing Uses (224,049,802.45) 191,906,585.15 (18,573,314.04) 23,904,077.16 (24,460,160.92) (51,272,615.10)
CLOSING CASH BALANCE 126,897,506.61$ 318,804,091.76$ 300,230,777.72$ 324,134,854.88$ 299,674,693.96$ 299,674,693.96$ Source: HCRA - Office of Pool Administration
49
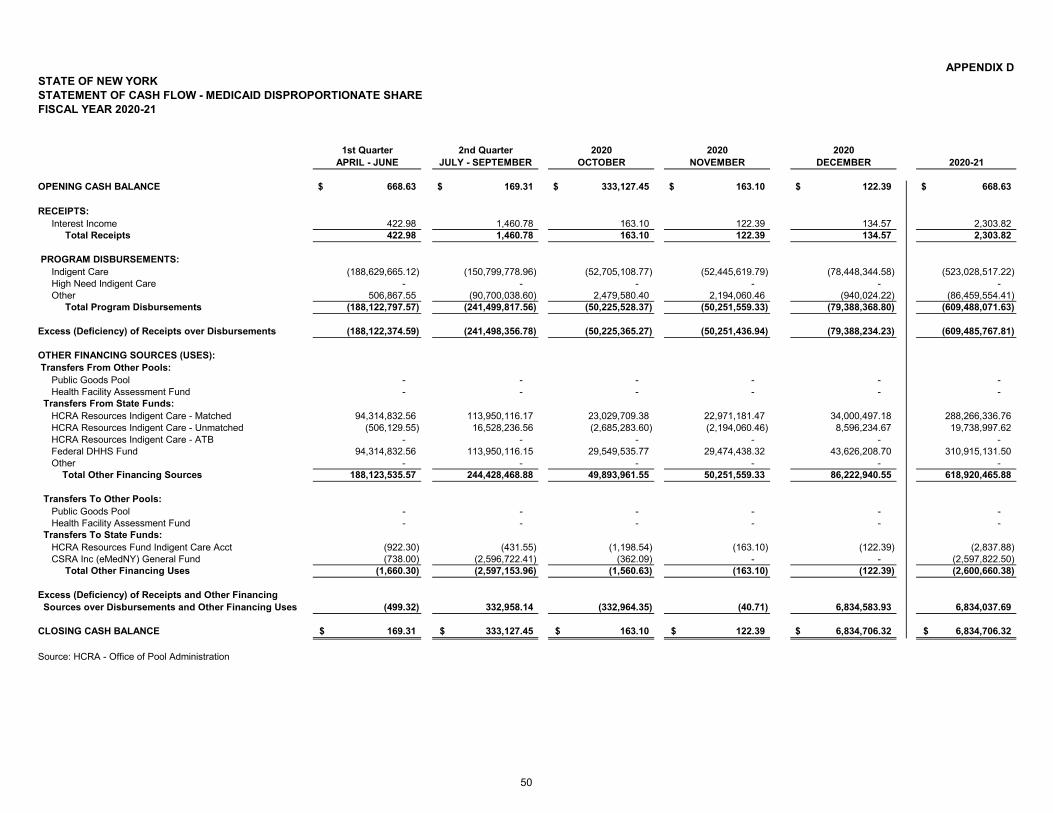
APPENDIX DSTATE OF NEW YORK STATEMENT OF CASH FLOW - MEDICAID DISPROPORTIONATE SHARE FISCAL YEAR 2020-21
1st Quarter 2nd Quarter 2020 2020 2020APRIL - JUNE JULY - SEPTEMBER OCTOBER NOVEMBER DECEMBER 2020-21
OPENING CASH BALANCE 668.63$ 169.31$ 333,127.45$ 163.10$ 122.39$ 668.63$
RECEIPTS: Interest Income 422.98 1,460.78 163.10 122.39 134.57 2,303.82 Total Receipts 422.98 1,460.78 163.10 122.39 134.57 2,303.82
PROGRAM DISBURSEMENTS: Indigent Care (188,629,665.12) (150,799,778.96) (52,705,108.77) (52,445,619.79) (78,448,344.58) (523,028,517.22) High Need Indigent Care - - - - - - Other 506,867.55 (90,700,038.60) 2,479,580.40 2,194,060.46 (940,024.22) (86,459,554.41) Total Program Disbursements (188,122,797.57) (241,499,817.56) (50,225,528.37) (50,251,559.33) (79,388,368.80) (609,488,071.63)
Excess (Deficiency) of Receipts over Disbursements (188,122,374.59) (241,498,356.78) (50,225,365.27) (50,251,436.94) (79,388,234.23) (609,485,767.81)
OTHER FINANCING SOURCES (USES): Transfers From Other Pools: Public Goods Pool - - - - - - Health Facility Assessment Fund - - - - - - Transfers From State Funds: HCRA Resources Indigent Care - Matched 94,314,832.56 113,950,116.17 23,029,709.38 22,971,181.47 34,000,497.18 288,266,336.76 HCRA Resources Indigent Care - Unmatched (506,129.55) 16,528,236.56 (2,685,283.60) (2,194,060.46) 8,596,234.67 19,738,997.62 HCRA Resources Indigent Care - ATB - - - - - - Federal DHHS Fund 94,314,832.56 113,950,116.15 29,549,535.77 29,474,438.32 43,626,208.70 310,915,131.50 Other - - - - - - Total Other Financing Sources 188,123,535.57 244,428,468.88 49,893,961.55 50,251,559.33 86,222,940.55 618,920,465.88
Transfers To Other Pools: Public Goods Pool - - - - - - Health Facility Assessment Fund - - - - - - Transfers To State Funds: HCRA Resources Fund Indigent Care Acct (922.30) (431.55) (1,198.54) (163.10) (122.39) (2,837.88) CSRA Inc (eMedNY) General Fund (738.00) (2,596,722.41) (362.09) - - (2,597,822.50) Total Other Financing Uses (1,660.30) (2,597,153.96) (1,560.63) (163.10) (122.39) (2,600,660.38)
Excess (Deficiency) of Receipts and Other Financing Sources over Disbursements and Other Financing Uses (499.32) 332,958.14 (332,964.35) (40.71) 6,834,583.93 6,834,037.69
CLOSING CASH BALANCE 169.31$ 333,127.45$ 163.10$ 122.39$ 6,834,706.32$ 6,834,706.32$ Source: HCRA - Office of Pool Administration
50
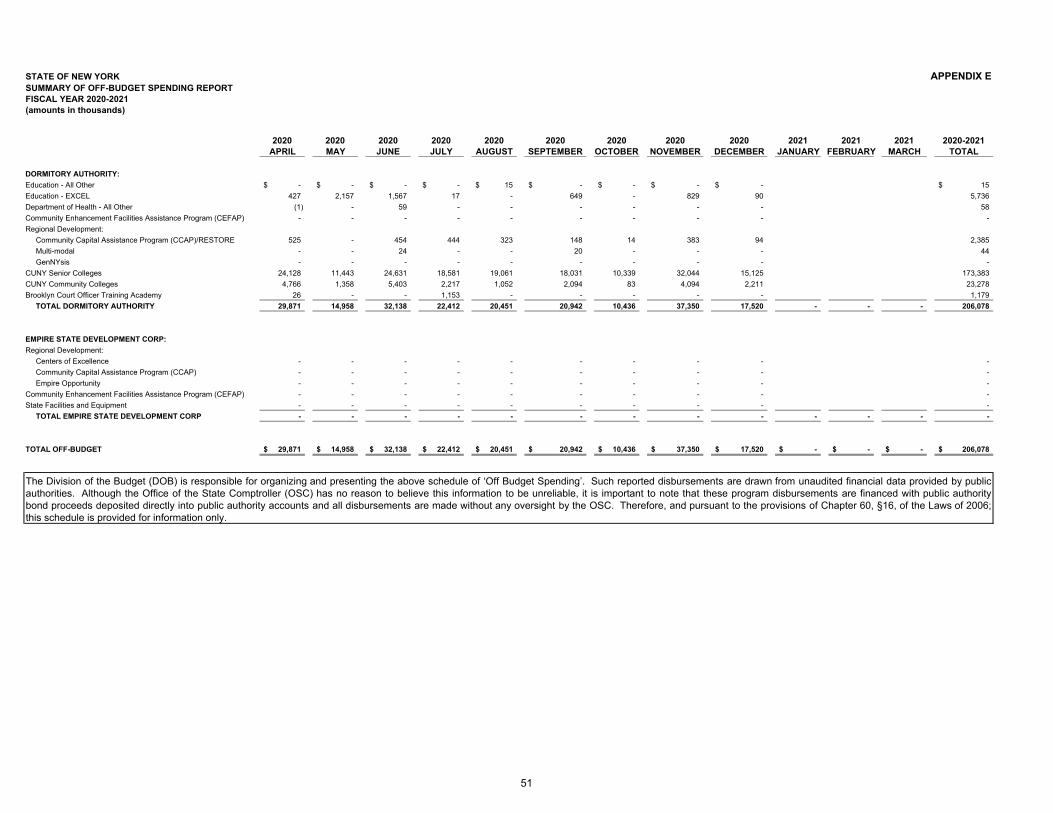
STATE OF NEW YORK APPENDIX ESUMMARY OF OFF-BUDGET SPENDING REPORTFISCAL YEAR 2020-2021(amounts in thousands)
2020 2020 2020 2020 2020 2020 2020 2020 2020 2021 2021 2021 2020-2021APRIL MAY JUNE JULY AUGUST SEPTEMBER OCTOBER NOVEMBER DECEMBER JANUARY FEBRUARY MARCH TOTAL
DORMITORY AUTHORITY:Education - All Other -$ -$ -$ -$ 15$ -$ -$ -$ -$ 15$ Education - EXCEL 427 2,157 1,567 17 - 649 - 829 90 5,736 Department of Health - All Other (1) - 59 - - - - - - 58 Community Enhancement Facilities Assistance Program (CEFAP) - - - - - - - - - - Regional Development: Community Capital Assistance Program (CCAP)/RESTORE 525 - 454 444 323 148 14 383 94 2,385 Multi-modal - - 24 - - 20 - - - 44 GenNYsis - - - - - - - - - - CUNY Senior Colleges 24,128 11,443 24,631 18,581 19,061 18,031 10,339 32,044 15,125 173,383 CUNY Community Colleges 4,766 1,358 5,403 2,217 1,052 2,094 83 4,094 2,211 23,278 Brooklyn Court Officer Training Academy 26 - - 1,153 - - - - - 1,179 TOTAL DORMITORY AUTHORITY 29,871 14,958 32,138 22,412 20,451 20,942 10,436 37,350 17,520 - - - 206,078
EMPIRE STATE DEVELOPMENT CORP:Regional Development: Centers of Excellence - - - - - - - - - - Community Capital Assistance Program (CCAP) - - - - - - - - - - Empire Opportunity - - - - - - - - - - Community Enhancement Facilities Assistance Program (CEFAP) - - - - - - - - - - State Facilities and Equipment - - - - - - - - - - TOTAL EMPIRE STATE DEVELOPMENT CORP - - - - - - - - - - - - -
TOTAL OFF-BUDGET 29,871$ 14,958$ 32,138$ 22,412$ 20,451$ 20,942$ 10,436$ 37,350$ 17,520$ -$ -$ -$ 206,078$
The Division of the Budget (DOB) is responsible for organizing and presenting the above schedule of ‘Off Budget Spending’. Such reported disbursements are drawn from unaudited financial data provided by publicauthorities. Although the Office of the State Comptroller (OSC) has no reason to believe this information to be unreliable, it is important to note that these program disbursements are financed with public authoritybond proceeds deposited directly into public authority accounts and all disbursements are made without any oversight by the OSC. Therefore, and pursuant to the provisions of Chapter 60, §16, of the Laws of 2006;this schedule is provided for information only.
51
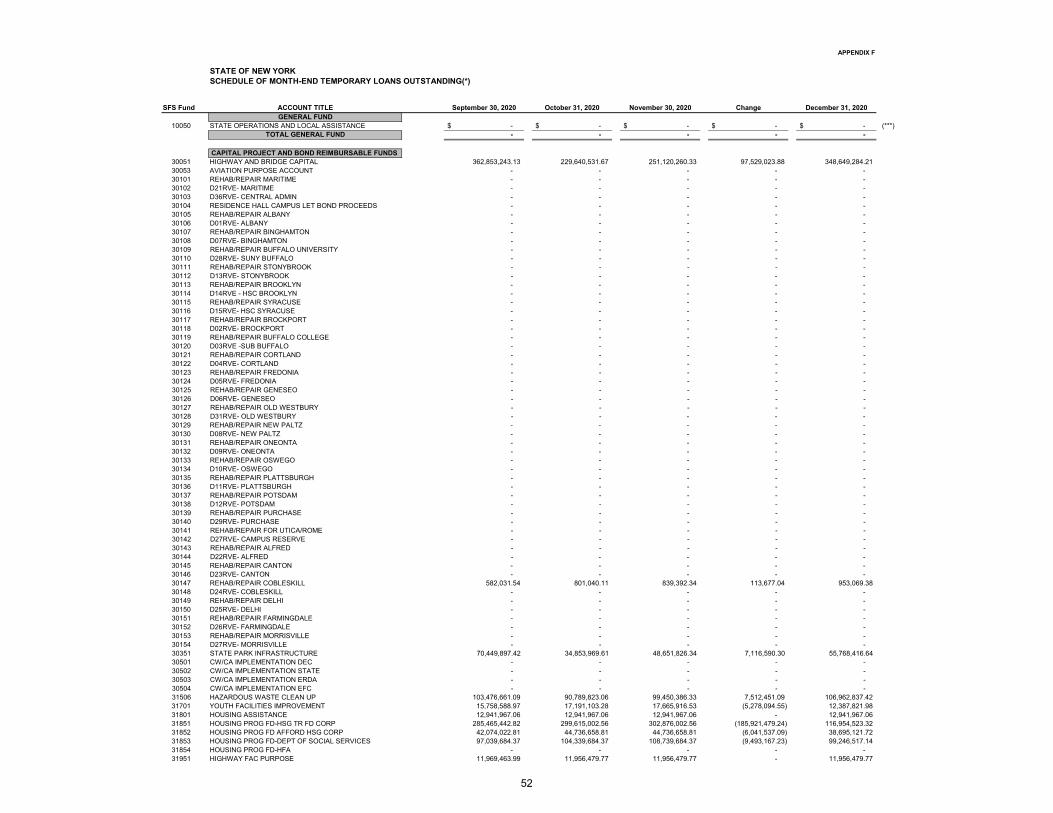
APPENDIX F
STATE OF NEW YORKSCHEDULE OF MONTH-END TEMPORARY LOANS OUTSTANDING(*)
SFS Fund ACCOUNT TITLE September 30, 2020 October 31, 2020 November 30, 2020 Change December 31, 2020GENERAL FUND
10050 STATE OPERATIONS AND LOCAL ASSISTANCE -$ -$ -$ -$ -$ (***)TOTAL GENERAL FUND - - - - -
CAPITAL PROJECT AND BOND REIMBURSABLE FUNDS 30051 HIGHWAY AND BRIDGE CAPITAL 362,853,243.13 229,640,531.67 251,120,260.33 97,529,023.88 348,649,284.21 30053 AVIATION PURPOSE ACCOUNT - - - - - 30101 REHAB/REPAIR MARITIME - - - - - 30102 D21RVE- MARITIME - - - - - 30103 D36RVE- CENTRAL ADMIN - - - - - 30104 RESIDENCE HALL CAMPUS LET BOND PROCEEDS - - - - - 30105 REHAB/REPAIR ALBANY - - - - - 30106 D01RVE- ALBANY - - - - - 30107 REHAB/REPAIR BINGHAMTON - - - - - 30108 D07RVE- BINGHAMTON - - - - - 30109 REHAB/REPAIR BUFFALO UNIVERSITY - - - - - 30110 D28RVE- SUNY BUFFALO - - - - - 30111 REHAB/REPAIR STONYBROOK - - - - - 30112 D13RVE- STONYBROOK - - - - - 30113 REHAB/REPAIR BROOKLYN - - - - - 30114 D14RVE - HSC BROOKLYN - - - - - 30115 REHAB/REPAIR SYRACUSE - - - - - 30116 D15RVE- HSC SYRACUSE - - - - - 30117 REHAB/REPAIR BROCKPORT - - - - - 30118 D02RVE- BROCKPORT - - - - - 30119 REHAB/REPAIR BUFFALO COLLEGE - - - - - 30120 D03RVE -SUB BUFFALO - - - - - 30121 REHAB/REPAIR CORTLAND - - - - - 30122 D04RVE- CORTLAND - - - - - 30123 REHAB/REPAIR FREDONIA - - - - - 30124 D05RVE- FREDONIA - - - - - 30125 REHAB/REPAIR GENESEO - - - - - 30126 D06RVE- GENESEO - - - - - 30127 REHAB/REPAIR OLD WESTBURY - - - - - 30128 D31RVE- OLD WESTBURY - - - - - 30129 REHAB/REPAIR NEW PALTZ - - - - - 30130 D08RVE- NEW PALTZ - - - - - 30131 REHAB/REPAIR ONEONTA - - - - - 30132 D09RVE- ONEONTA - - - - - 30133 REHAB/REPAIR OSWEGO - - - - - 30134 D10RVE- OSWEGO - - - - - 30135 REHAB/REPAIR PLATTSBURGH - - - - - 30136 D11RVE- PLATTSBURGH - - - - - 30137 REHAB/REPAIR POTSDAM - - - - - 30138 D12RVE- POTSDAM - - - - - 30139 REHAB/REPAIR PURCHASE - - - - - 30140 D29RVE- PURCHASE - - - - - 30141 REHAB/REPAIR FOR UTICA/ROME - - - - - 30142 D27RVE- CAMPUS RESERVE - - - - - 30143 REHAB/REPAIR ALFRED - - - - - 30144 D22RVE- ALFRED - - - - - 30145 REHAB/REPAIR CANTON - - - - - 30146 D23RVE- CANTON - - - - - 30147 REHAB/REPAIR COBLESKILL 582,031.54 801,040.11 839,392.34 113,677.04 953,069.38 30148 D24RVE- COBLESKILL - - - - - 30149 REHAB/REPAIR DELHI - - - - - 30150 D25RVE- DELHI - - - - - 30151 REHAB/REPAIR FARMINGDALE - - - - - 30152 D26RVE- FARMINGDALE - - - - - 30153 REHAB/REPAIR MORRISVILLE - - - - - 30154 D27RVE- MORRISVILLE - - - - - 30351 STATE PARK INFRASTRUCTURE 70,449,897.42 34,853,969.61 48,651,826.34 7,116,590.30 55,768,416.64 30501 CW/CA IMPLEMENTATION DEC - - - - - 30502 CW/CA IMPLEMENTATION STATE - - - - - 30503 CW/CA IMPLEMENTATION ERDA - - - - - 30504 CW/CA IMPLEMENTATION EFC - - - - - 31506 HAZARDOUS WASTE CLEAN UP 103,476,661.09 90,789,823.06 99,450,386.33 7,512,451.09 106,962,837.42 31701 YOUTH FACILITIES IMPROVEMENT 15,758,588.97 17,191,103.28 17,665,916.53 (5,278,094.55) 12,387,821.98 31801 HOUSING ASSISTANCE 12,941,967.06 12,941,967.06 12,941,967.06 - 12,941,967.06 31851 HOUSING PROG FD-HSG TR FD CORP 285,465,442.82 299,615,002.56 302,876,002.56 (185,921,479.24) 116,954,523.32 31852 HOUSING PROG FD AFFORD HSG CORP 42,074,022.81 44,736,658.81 44,736,658.81 (6,041,537.09) 38,695,121.72 31853 HOUSING PROG FD-DEPT OF SOCIAL SERVICES 97,039,684.37 104,339,684.37 108,739,684.37 (9,493,167.23) 99,246,517.14 31854 HOUSING PROG FD-HFA - - - - - 31951 HIGHWAY FAC PURPOSE 11,969,463.99 11,956,479.77 11,956,479.77 - 11,956,479.77
52
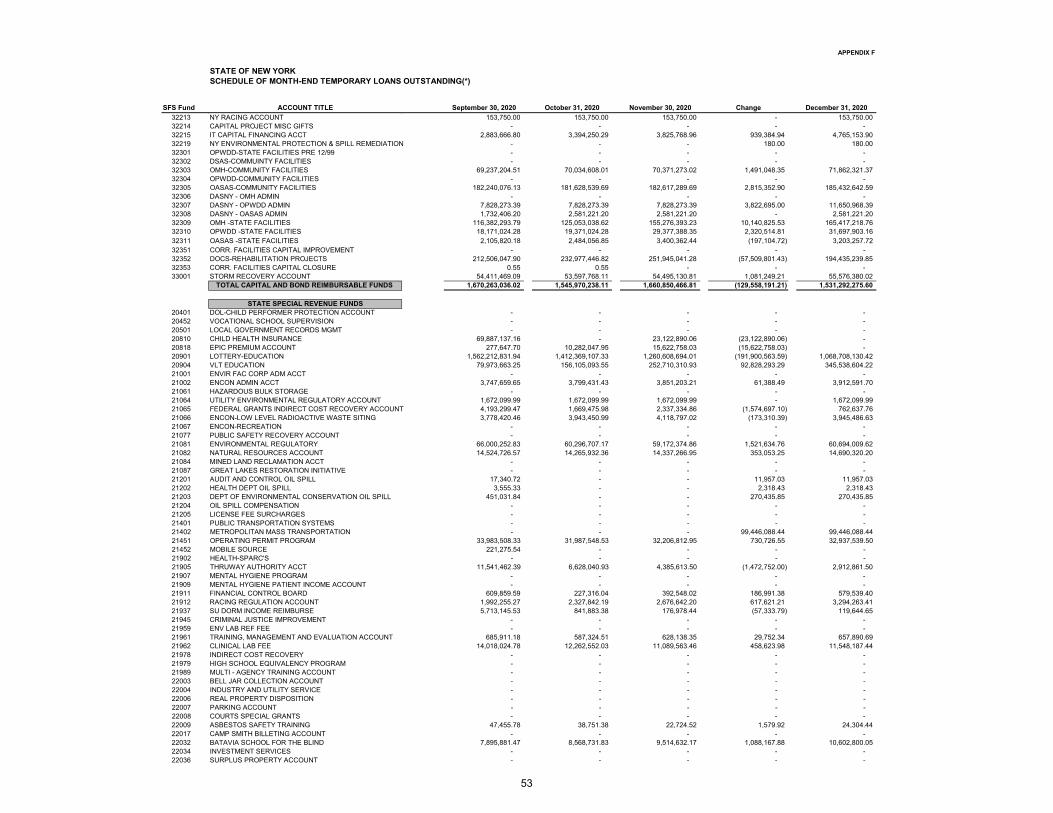
APPENDIX F
STATE OF NEW YORKSCHEDULE OF MONTH-END TEMPORARY LOANS OUTSTANDING(*)
SFS Fund ACCOUNT TITLE September 30, 2020 October 31, 2020 November 30, 2020 Change December 31, 202032213 NY RACING ACCOUNT 153,750.00 153,750.00 153,750.00 - 153,750.00 32214 CAPITAL PROJECT MISC GIFTS - - - - - 32215 IT CAPITAL FINANCING ACCT 2,883,666.80 3,394,250.29 3,825,768.96 939,384.94 4,765,153.90 32219 NY ENVIRONMENTAL PROTECTION & SPILL REMEDIATION - - - 180.00 180.00 32301 OPWDD-STATE FACILITIES PRE 12/99 - - - - - 32302 DSAS-COMMUINTY FACILITIES - - - - - 32303 OMH-COMMUNITY FACILITIES 69,237,204.51 70,034,608.01 70,371,273.02 1,491,048.35 71,862,321.37 32304 OPWDD-COMMUNITY FACILITIES - - - - - 32305 OASAS-COMMUNITY FACILITIES 182,240,076.13 181,628,539.69 182,617,289.69 2,815,352.90 185,432,642.59 32306 DASNY - OMH ADMIN - - - - - 32307 DASNY - OPWDD ADMIN 7,828,273.39 7,828,273.39 7,828,273.39 3,822,695.00 11,650,968.39 32308 DASNY - OASAS ADMIN 1,732,406.20 2,581,221.20 2,581,221.20 - 2,581,221.20 32309 OMH -STATE FACILITIES 116,382,293.79 125,053,038.62 155,276,393.23 10,140,825.53 165,417,218.76 32310 OPWDD -STATE FACILITIES 18,171,024.28 19,371,024.28 29,377,388.35 2,320,514.81 31,697,903.16 32311 OASAS -STATE FACILITIES 2,105,820.18 2,484,056.85 3,400,362.44 (197,104.72) 3,203,257.72 32351 CORR. FACILITIES CAPITAL IMPROVEMENT - - - - - 32352 DOCS-REHABILITATION PROJECTS 212,506,047.90 232,977,446.82 251,945,041.28 (57,509,801.43) 194,435,239.85 32353 CORR. FACILITIES CAPITAL CLOSURE 0.55 0.55 - - - 33001 STORM RECOVERY ACCOUNT 54,411,469.09 53,597,768.11 54,495,130.81 1,081,249.21 55,576,380.02
TOTAL CAPITAL AND BOND REIMBURSABLE FUNDS 1,670,263,036.02 1,545,970,238.11 1,660,850,466.81 (129,558,191.21) 1,531,292,275.60
STATE SPECIAL REVENUE FUNDS20401 DOL-CHILD PERFORMER PROTECTION ACCOUNT - - - - - 20452 VOCATIONAL SCHOOL SUPERVISION - - - - - 20501 LOCAL GOVERNMENT RECORDS MGMT - - - - - 20810 CHILD HEALTH INSURANCE 69,887,137.16 - 23,122,890.06 (23,122,890.06) - 20818 EPIC PREMIUM ACCOUNT 277,647.70 10,282,047.95 15,622,758.03 (15,622,758.03) - 20901 LOTTERY-EDUCATION 1,562,212,831.94 1,412,369,107.33 1,260,608,694.01 (191,900,563.59) 1,068,708,130.42 20904 VLT EDUCATION 79,973,663.25 156,105,093.55 252,710,310.93 92,828,293.29 345,538,604.22 21001 ENVIR FAC CORP ADM ACCT - - - - - 21002 ENCON ADMIN ACCT 3,747,659.65 3,799,431.43 3,851,203.21 61,388.49 3,912,591.70 21061 HAZARDOUS BULK STORAGE - - - - - 21064 UTILITY ENVIRONMENTAL REGULATORY ACCOUNT 1,672,099.99 1,672,099.99 1,672,099.99 - 1,672,099.99 21065 FEDERAL GRANTS INDIRECT COST RECOVERY ACCOUNT 4,193,299.47 1,669,475.98 2,337,334.86 (1,574,697.10) 762,637.76 21066 ENCON-LOW LEVEL RADIOACTIVE WASTE SITING 3,778,420.46 3,943,450.99 4,118,797.02 (173,310.39) 3,945,486.63 21067 ENCON-RECREATION - - - - - 21077 PUBLIC SAFETY RECOVERY ACCOUNT - - - - - 21081 ENVIRONMENTAL REGULATORY 66,000,252.83 60,296,707.17 59,172,374.86 1,521,634.76 60,694,009.62 21082 NATURAL RESOURCES ACCOUNT 14,524,726.57 14,265,932.36 14,337,266.95 353,053.25 14,690,320.20 21084 MINED LAND RECLAMATION ACCT - - - - - 21087 GREAT LAKES RESTORATION INITIATIVE - - - - - 21201 AUDIT AND CONTROL OIL SPILL 17,340.72 - - 11,957.03 11,957.03 21202 HEALTH DEPT OIL SPILL 3,555.33 - - 2,318.43 2,318.43 21203 DEPT OF ENVIRONMENTAL CONSERVATION OIL SPILL 451,031.84 - - 270,435.85 270,435.85 21204 OIL SPILL COMPENSATION - - - - - 21205 LICENSE FEE SURCHARGES - - - - - 21401 PUBLIC TRANSPORTATION SYSTEMS - - - - - 21402 METROPOLITAN MASS TRANSPORTATION - - - 99,446,088.44 99,446,088.44 21451 OPERATING PERMIT PROGRAM 33,983,508.33 31,987,548.53 32,206,812.95 730,726.55 32,937,539.50 21452 MOBILE SOURCE 221,275.54 - - - - 21902 HEALTH-SPARC'S - - - - - 21905 THRUWAY AUTHORITY ACCT 11,541,462.39 6,628,040.93 4,385,613.50 (1,472,752.00) 2,912,861.50 21907 MENTAL HYGIENE PROGRAM - - - - - 21909 MENTAL HYGIENE PATIENT INCOME ACCOUNT - - - - - 21911 FINANCIAL CONTROL BOARD 609,859.59 227,316.04 392,548.02 186,991.38 579,539.40 21912 RACING REGULATION ACCOUNT 1,992,255.27 2,327,842.19 2,676,642.20 617,621.21 3,294,263.41 21937 SU DORM INCOME REIMBURSE 5,713,145.53 841,883.38 176,978.44 (57,333.79) 119,644.65 21945 CRIMINAL JUSTICE IMPROVEMENT - - - - - 21959 ENV LAB REF FEE - - - - - 21961 TRAINING, MANAGEMENT AND EVALUATION ACCOUNT 685,911.18 587,324.51 628,138.35 29,752.34 657,890.69 21962 CLINICAL LAB FEE 14,018,024.78 12,262,552.03 11,089,563.46 458,623.98 11,548,187.44 21978 INDIRECT COST RECOVERY - - - - - 21979 HIGH SCHOOL EQUIVALENCY PROGRAM - - - - - 21989 MULTI - AGENCY TRAINING ACCOUNT - - - - - 22003 BELL JAR COLLECTION ACCOUNT - - - - - 22004 INDUSTRY AND UTILITY SERVICE - - - - - 22006 REAL PROPERTY DISPOSITION - - - - - 22007 PARKING ACCOUNT - - - - - 22008 COURTS SPECIAL GRANTS - - - - - 22009 ASBESTOS SAFETY TRAINING 47,455.78 38,751.38 22,724.52 1,579.92 24,304.44 22017 CAMP SMITH BILLETING ACCOUNT - - - - - 22032 BATAVIA SCHOOL FOR THE BLIND 7,895,881.47 8,568,731.83 9,514,632.17 1,088,167.88 10,602,800.05 22034 INVESTMENT SERVICES - - - - - 22036 SURPLUS PROPERTY ACCOUNT - - - - -
53
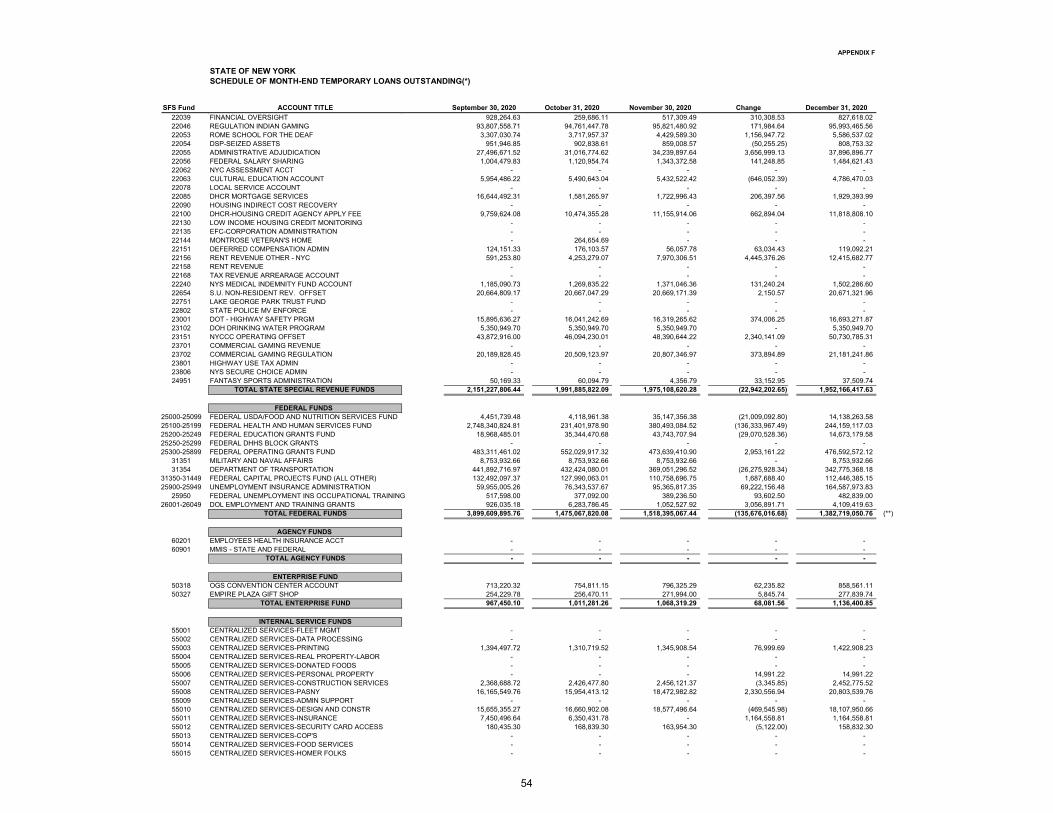
APPENDIX F
STATE OF NEW YORKSCHEDULE OF MONTH-END TEMPORARY LOANS OUTSTANDING(*)
SFS Fund ACCOUNT TITLE September 30, 2020 October 31, 2020 November 30, 2020 Change December 31, 202022039 FINANCIAL OVERSIGHT 928,264.63 259,686.11 517,309.49 310,308.53 827,618.02 22046 REGULATION INDIAN GAMING 93,807,558.71 94,761,447.78 95,821,480.92 171,984.64 95,993,465.56 22053 ROME SCHOOL FOR THE DEAF 3,307,030.74 3,717,957.37 4,429,589.30 1,156,947.72 5,586,537.02 22054 DSP-SEIZED ASSETS 951,946.85 902,838.61 859,008.57 (50,255.25) 808,753.32 22055 ADMINISTRATIVE ADJUDICATION 27,496,671.52 31,016,774.62 34,239,897.64 3,656,999.13 37,896,896.77 22056 FEDERAL SALARY SHARING 1,004,479.83 1,120,954.74 1,343,372.58 141,248.85 1,484,621.43 22062 NYC ASSESSMENT ACCT - - - - - 22063 CULTURAL EDUCATION ACCOUNT 5,954,486.22 5,490,643.04 5,432,522.42 (646,052.39) 4,786,470.03 22078 LOCAL SERVICE ACCOUNT - - - - - 22085 DHCR MORTGAGE SERVICES 16,644,492.31 1,581,265.97 1,722,996.43 206,397.56 1,929,393.99 22090 HOUSING INDIRECT COST RECOVERY - - - - - 22100 DHCR-HOUSING CREDIT AGENCY APPLY FEE 9,759,624.08 10,474,355.28 11,155,914.06 662,894.04 11,818,808.10 22130 LOW INCOME HOUSING CREDIT MONITORING - - - - - 22135 EFC-CORPORATION ADMINISTRATION - - - - - 22144 MONTROSE VETERAN'S HOME - 264,654.69 - - - 22151 DEFERRED COMPENSATION ADMIN 124,151.33 176,103.57 56,057.78 63,034.43 119,092.21 22156 RENT REVENUE OTHER - NYC 591,253.80 4,253,279.07 7,970,306.51 4,445,376.26 12,415,682.77 22158 RENT REVENUE - - - - - 22168 TAX REVENUE ARREARAGE ACCOUNT - - - - - 22240 NYS MEDICAL INDEMNITY FUND ACCOUNT 1,185,090.73 1,269,835.22 1,371,046.36 131,240.24 1,502,286.60 22654 S.U. NON-RESIDENT REV. OFFSET 20,664,809.17 20,667,047.29 20,669,171.39 2,150.57 20,671,321.96 22751 LAKE GEORGE PARK TRUST FUND - - - - - 22802 STATE POLICE MV ENFORCE - - - - - 23001 DOT - HIGHWAY SAFETY PRGM 15,895,636.27 16,041,242.69 16,319,265.62 374,006.25 16,693,271.87 23102 DOH DRINKING WATER PROGRAM 5,350,949.70 5,350,949.70 5,350,949.70 - 5,350,949.70 23151 NYCCC OPERATING OFFSET 43,872,916.00 46,094,230.01 48,390,644.22 2,340,141.09 50,730,785.31 23701 COMMERCIAL GAMING REVENUE - - - - - 23702 COMMERCIAL GAMING REGULATION 20,189,828.45 20,509,123.97 20,807,346.97 373,894.89 21,181,241.86 23801 HIGHWAY USE TAX ADMIN - - - - - 23806 NYS SECURE CHOICE ADMIN - - - - - 24951 FANTASY SPORTS ADMINISTRATION 50,169.33 60,094.79 4,356.79 33,152.95 37,509.74
TOTAL STATE SPECIAL REVENUE FUNDS 2,151,227,806.44 1,991,885,822.09 1,975,108,620.28 (22,942,202.65) 1,952,166,417.63
FEDERAL FUNDS 25000-25099 FEDERAL USDA/FOOD AND NUTRITION SERVICES FUND 4,451,739.48 4,118,961.38 35,147,356.38 (21,009,092.80) 14,138,263.58 25100-25199 FEDERAL HEALTH AND HUMAN SERVICES FUND 2,748,340,824.81 231,401,978.90 380,493,084.52 (136,333,967.49) 244,159,117.03 25200-25249 FEDERAL EDUCATION GRANTS FUND 18,968,485.01 35,344,470.68 43,743,707.94 (29,070,528.36) 14,673,179.58 25250-25299 FEDERAL DHHS BLOCK GRANTS - - - - - 25300-25899 FEDERAL OPERATING GRANTS FUND 483,311,461.02 552,029,917.32 473,639,410.90 2,953,161.22 476,592,572.12
31351 MILITARY AND NAVAL AFFAIRS 8,753,932.66 8,753,932.66 8,753,932.66 - 8,753,932.66 31354 DEPARTMENT OF TRANSPORTATION 441,892,716.97 432,424,080.01 369,051,296.52 (26,275,928.34) 342,775,368.18
31350-31449 FEDERAL CAPITAL PROJECTS FUND (ALL OTHER) 132,492,097.37 127,990,063.01 110,758,696.75 1,687,688.40 112,446,385.15 25900-25949 UNEMPLOYMENT INSURANCE ADMINISTRATION 59,955,005.26 76,343,537.67 95,365,817.35 69,222,156.48 164,587,973.83
25950 FEDERAL UNEMPLOYMENT INS OCCUPATIONAL TRAINING 517,598.00 377,092.00 389,236.50 93,602.50 482,839.00 26001-26049 DOL EMPLOYMENT AND TRAINING GRANTS 926,035.18 6,283,786.45 1,052,527.92 3,056,891.71 4,109,419.63
TOTAL FEDERAL FUNDS 3,899,609,895.76 1,475,067,820.08 1,518,395,067.44 (135,676,016.68) 1,382,719,050.76 (**)
AGENCY FUNDS 60201 EMPLOYEES HEALTH INSURANCE ACCT - - - - - 60901 MMIS - STATE AND FEDERAL - - - - -
TOTAL AGENCY FUNDS - - - - -
ENTERPRISE FUND50318 OGS CONVENTION CENTER ACCOUNT 713,220.32 754,811.15 796,325.29 62,235.82 858,561.11 50327 EMPIRE PLAZA GIFT SHOP 254,229.78 256,470.11 271,994.00 5,845.74 277,839.74
TOTAL ENTERPRISE FUND 967,450.10 1,011,281.26 1,068,319.29 68,081.56 1,136,400.85
INTERNAL SERVICE FUNDS55001 CENTRALIZED SERVICES-FLEET MGMT - - - - - 55002 CENTRALIZED SERVICES-DATA PROCESSING - - - - - 55003 CENTRALIZED SERVICES-PRINTING 1,394,497.72 1,310,719.52 1,345,908.54 76,999.69 1,422,908.23 55004 CENTRALIZED SERVICES-REAL PROPERTY-LABOR - - - - - 55005 CENTRALIZED SERVICES-DONATED FOODS - - - - - 55006 CENTRALIZED SERVICES-PERSONAL PROPERTY - - - 14,991.22 14,991.22 55007 CENTRALIZED SERVICES-CONSTRUCTION SERVICES 2,368,688.72 2,426,477.80 2,456,121.37 (3,345.85) 2,452,775.52 55008 CENTRALIZED SERVICES-PASNY 16,165,549.76 15,954,413.12 18,472,982.82 2,330,556.94 20,803,539.76 55009 CENTRALIZED SERVICES-ADMIN SUPPORT - - - - - 55010 CENTRALIZED SERVICES-DESIGN AND CONSTR 15,655,355.27 16,660,902.08 18,577,496.64 (469,545.98) 18,107,950.66 55011 CENTRALIZED SERVICES-INSURANCE 7,450,496.64 6,350,431.78 - 1,164,558.81 1,164,558.81 55012 CENTRALIZED SERVICES-SECURITY CARD ACCESS 180,435.30 168,839.30 163,954.30 (5,122.00) 158,832.30 55013 CENTRALIZED SERVICES-COP'S - - - - - 55014 CENTRALIZED SERVICES-FOOD SERVICES - - - - - 55015 CENTRALIZED SERVICES-HOMER FOLKS - - - - -
54
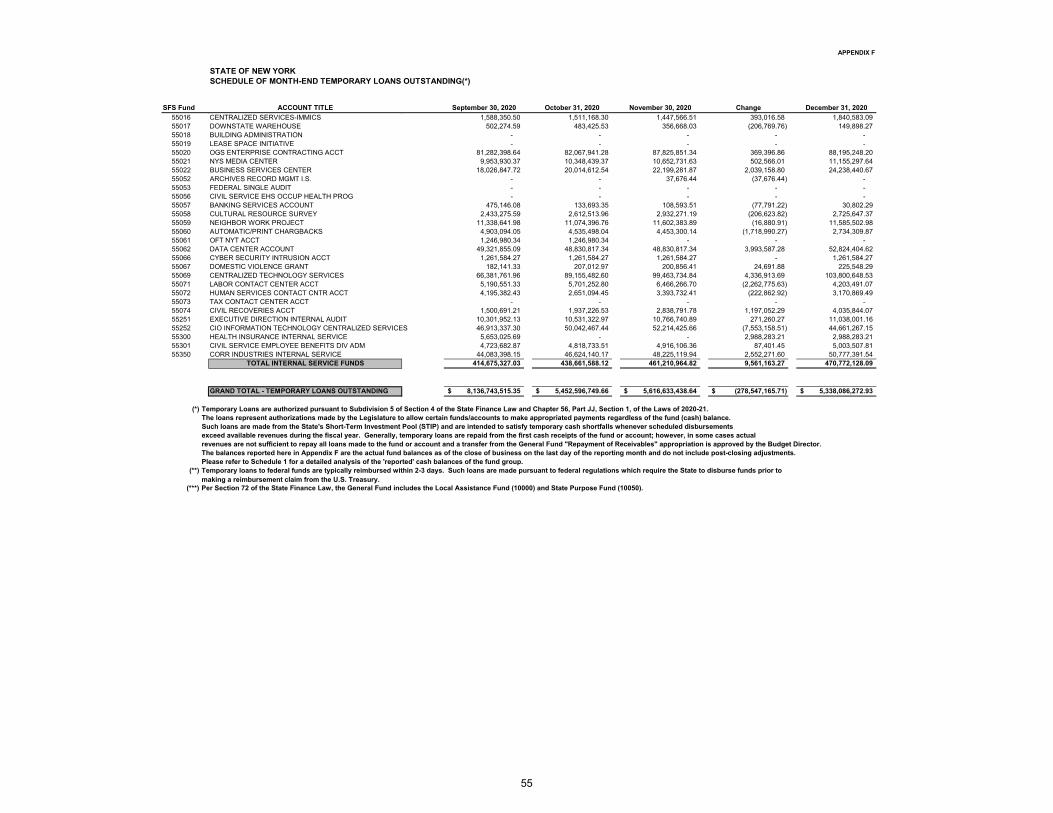
APPENDIX F
STATE OF NEW YORKSCHEDULE OF MONTH-END TEMPORARY LOANS OUTSTANDING(*)
SFS Fund ACCOUNT TITLE September 30, 2020 October 31, 2020 November 30, 2020 Change December 31, 202055016 CENTRALIZED SERVICES-IMMICS 1,588,350.50 1,511,168.30 1,447,566.51 393,016.58 1,840,583.09 55017 DOWNSTATE WAREHOUSE 502,274.59 483,425.53 356,668.03 (206,769.76) 149,898.27 55018 BUILDING ADMINISTRATION - - - - - 55019 LEASE SPACE INITIATIVE - - - - - 55020 OGS ENTERPRISE CONTRACTING ACCT 81,282,398.64 82,067,941.28 87,825,851.34 369,396.86 88,195,248.20 55021 NYS MEDIA CENTER 9,953,930.37 10,348,439.37 10,652,731.63 502,566.01 11,155,297.64 55022 BUSINESS SERVICES CENTER 18,026,847.72 20,014,612.54 22,199,281.87 2,039,158.80 24,238,440.67 55052 ARCHIVES RECORD MGMT I.S. - - 37,676.44 (37,676.44) - 55053 FEDERAL SINGLE AUDIT - - - - - 55056 CIVIL SERVICE EHS OCCUP HEALTH PROG - - - - - 55057 BANKING SERVICES ACCOUNT 475,146.08 133,693.35 108,593.51 (77,791.22) 30,802.29 55058 CULTURAL RESOURCE SURVEY 2,433,275.59 2,612,513.96 2,932,271.19 (206,623.82) 2,725,647.37 55059 NEIGHBOR WORK PROJECT 11,338,641.98 11,074,396.76 11,602,383.89 (16,880.91) 11,585,502.98 55060 AUTOMATIC/PRINT CHARGBACKS 4,903,094.05 4,535,498.04 4,453,300.14 (1,718,990.27) 2,734,309.87 55061 OFT NYT ACCT 1,246,980.34 1,246,980.34 - - - 55062 DATA CENTER ACCOUNT 49,321,855.09 48,830,817.34 48,830,817.34 3,993,587.28 52,824,404.62 55066 CYBER SECURITY INTRUSION ACCT 1,261,584.27 1,261,584.27 1,261,584.27 - 1,261,584.27 55067 DOMESTIC VIOLENCE GRANT 182,141.33 207,012.97 200,856.41 24,691.88 225,548.29 55069 CENTRALIZED TECHNOLOGY SERVICES 66,381,761.96 89,155,482.60 99,463,734.84 4,336,913.69 103,800,648.53 55071 LABOR CONTACT CENTER ACCT 5,190,551.33 5,701,252.80 6,466,266.70 (2,262,775.63) 4,203,491.07 55072 HUMAN SERVICES CONTACT CNTR ACCT 4,195,382.43 2,651,094.45 3,393,732.41 (222,862.92) 3,170,869.49 55073 TAX CONTACT CENTER ACCT - - - - - 55074 CIVIL RECOVERIES ACCT 1,500,691.21 1,937,226.53 2,838,791.78 1,197,052.29 4,035,844.07 55251 EXECUTIVE DIRECTION INTERNAL AUDIT 10,301,952.13 10,531,322.97 10,766,740.89 271,260.27 11,038,001.16 55252 CIO INFORMATION TECHNOLOGY CENTRALIZED SERVICES 46,913,337.30 50,042,467.44 52,214,425.66 (7,553,158.51) 44,661,267.15 55300 HEALTH INSURANCE INTERNAL SERVICE 5,653,025.69 - - 2,988,283.21 2,988,283.21 55301 CIVIL SERVICE EMPLOYEE BENEFITS DIV ADM 4,723,682.87 4,818,733.51 4,916,106.36 87,401.45 5,003,507.81 55350 CORR INDUSTRIES INTERNAL SERVICE 44,083,398.15 46,624,140.17 48,225,119.94 2,552,271.60 50,777,391.54
TOTAL INTERNAL SERVICE FUNDS 414,675,327.03 438,661,588.12 461,210,964.82 9,561,163.27 470,772,128.09
GRAND TOTAL - TEMPORARY LOANS OUTSTANDING 8,136,743,515.35$ 5,452,596,749.66$ 5,616,633,438.64$ (278,547,165.71)$ 5,338,086,272.93$
(*) Temporary Loans are authorized pursuant to Subdivision 5 of Section 4 of the State Finance Law and Chapter 56, Part JJ, Section 1, of the Laws of 2020-21.The loans represent authorizations made by the Legislature to allow certain funds/accounts to make appropriated payments regardless of the fund (cash) balance.Such loans are made from the State's Short-Term Investment Pool (STIP) and are intended to satisfy temporary cash shortfalls whenever scheduled disbursementsexceed available revenues during the fiscal year. Generally, temporary loans are repaid from the first cash receipts of the fund or account; however, in some cases actualrevenues are not sufficient to repay all loans made to the fund or account and a transfer from the General Fund "Repayment of Receivables" appropriation is approved by the Budget Director.The balances reported here in Appendix F are the actual fund balances as of the close of business on the last day of the reporting month and do not include post-closing adjustments.Please refer to Schedule 1 for a detailed analysis of the 'reported' cash balances of the fund group.
(**) Temporary loans to federal funds are typically reimbursed within 2-3 days. Such loans are made pursuant to federal regulations which require the State to disburse funds prior tomaking a reimbursement claim from the U.S. Treasury.
(***) Per Section 72 of the State Finance Law, the General Fund includes the Local Assistance Fund (10000) and State Purpose Fund (10050).
55
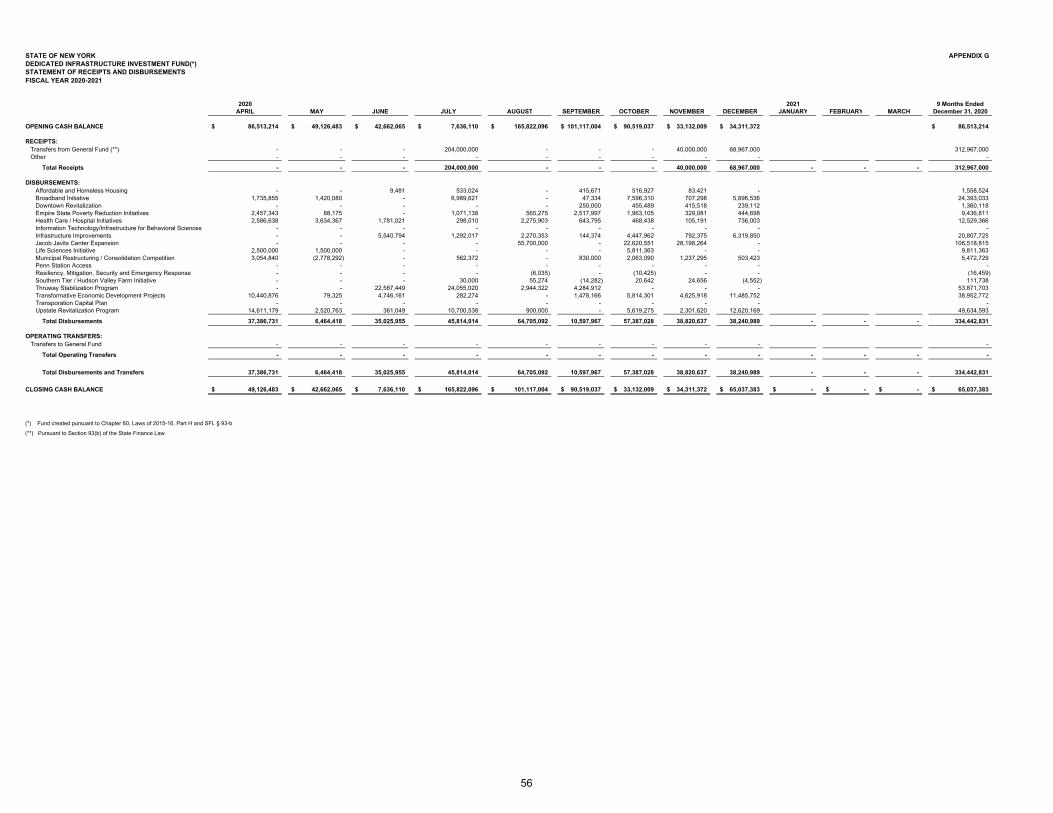
STATE OF NEW YORK APPENDIX GDEDICATED INFRASTRUCTURE INVESTMENT FUND(*) STATEMENT OF RECEIPTS AND DISBURSEMENTS FISCAL YEAR 2020-2021
2020 2021 9 Months EndedAPRIL MAY JUNE JULY AUGUST SEPTEMBER OCTOBER NOVEMBER DECEMBER JANUARY FEBRUARY MARCH December 31, 2020
OPENING CASH BALANCE 86,513,214$ 49,126,483$ 42,662,065$ 7,636,110$ 165,822,096$ 101,117,004$ 90,519,037$ 33,132,009$ 34,311,372$ 86,513,214$
RECEIPTS: Transfers from General Fund (**) - - - 204,000,000 - - - 40,000,000 68,967,000 312,967,000 Other - - - - - - - - - -
Total Receipts - - - 204,000,000 - - - 40,000,000 68,967,000 - - - 312,967,000
DISBURSEMENTS: Affordable and Homeless Housing - - 9,481 533,024 - 415,671 516,927 83,421 - 1,558,524 Broadband Initiative 1,735,855 1,420,080 - 6,989,621 - 47,334 7,596,310 707,298 5,896,536 24,393,033 Downtown Revitalization - - - - - 250,000 455,489 415,518 239,112 1,360,118 Empire State Poverty Reduction Initiatives 2,457,343 88,175 - 1,071,138 565,275 2,517,997 1,963,105 329,081 444,698 9,436,811 Health Care / Hospital Initiatives 2,586,638 3,634,367 1,781,021 298,010 2,275,903 643,795 468,438 105,191 736,003 12,529,366 Information Technology/Infrastructure for Behavioral Sciences - - - - - - - - - - Infrastructure Improvements - - 5,540,794 1,292,017 2,270,353 144,374 4,447,962 792,375 6,319,850 20,807,725 Jacob Javits Center Expansion - - - - 55,700,000 - 22,620,551 28,198,264 - 106,518,815 Life Sciences Initiative 2,500,000 1,500,000 - - - - 5,811,363 - - 9,811,363 Municipal Restructuring / Consolidation Competition 3,054,840 (2,778,292) - 562,372 - 830,000 2,063,090 1,237,295 503,423 5,472,729 Penn Station Access - - - - - - - - - - Resiliency, Mitigation, Security and Emergency Response - - - - (6,035) - (10,425) - - (16,459) Southern Tier / Hudson Valley Farm Initiative - - - 30,000 55,274 (14,282) 20,642 24,656 (4,552) 111,738 Thruway Stabilization Program - - 22,587,449 24,055,020 2,944,322 4,284,912 - - - 53,871,703 Transformative Economic Development Projects 10,440,876 79,325 4,746,161 282,274 - 1,478,166 5,814,301 4,625,918 11,485,752 38,952,772 Transporation Capital Plan - - - - - - - - - - Upstate Revitalization Program 14,611,179 2,520,763 361,049 10,700,538 900,000 - 5,619,275 2,301,620 12,620,169 49,634,593
Total Disbursements 37,386,731 6,464,418 35,025,955 45,814,014 64,705,092 10,597,967 57,387,028 38,820,637 38,240,989 - - - 334,442,831
OPERATING TRANSFERS: Transfers to General Fund - - - - - - - - - -
Total Operating Transfers - - - - - - - - - - - - -
Total Disbursements and Transfers 37,386,731 6,464,418 35,025,955 45,814,014 64,705,092 10,597,967 57,387,028 38,820,637 38,240,989 - - - 334,442,831
CLOSING CASH BALANCE 49,126,483$ 42,662,065$ 7,636,110$ 165,822,096$ 101,117,004$ 90,519,037$ 33,132,009$ 34,311,372$ 65,037,383$ -$ -$ -$ 65,037,383$
(*) Fund created pursuant to Chapter 60, Laws of 2015-16, Part H and SFL § 93-b (**) Pursuant to Section 93(b) of the State Finance Law
56
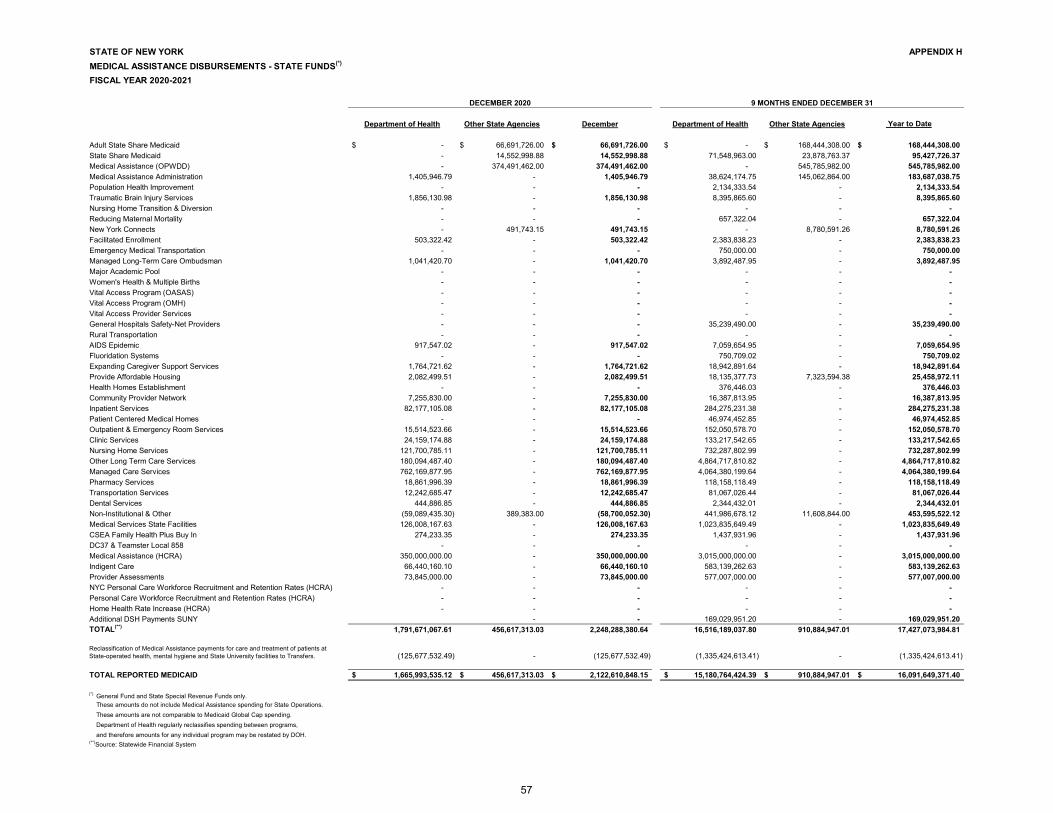
STATE OF NEW YORK APPENDIX HMEDICAL ASSISTANCE DISBURSEMENTS - STATE FUNDS(*)
FISCAL YEAR 2020-2021
Department of Health Other State Agencies December Department of Health Other State Agencies Year to Date
Adult State Share Medicaid -$ 66,691,726.00$ 66,691,726.00$ -$ 168,444,308.00$ 168,444,308.00$ State Share Medicaid - 14,552,998.88 14,552,998.88 71,548,963.00 23,878,763.37 95,427,726.37 Medical Assistance (OPWDD) - 374,491,462.00 374,491,462.00 - 545,785,982.00 545,785,982.00 Medical Assistance Administration 1,405,946.79 - 1,405,946.79 38,624,174.75 145,062,864.00 183,687,038.75 Population Health Improvement - - - 2,134,333.54 - 2,134,333.54 Traumatic Brain Injury Services 1,856,130.98 - 1,856,130.98 8,395,865.60 - 8,395,865.60 Nursing Home Transition & Diversion - - - - - - Reducing Maternal Mortality - - - 657,322.04 - 657,322.04 New York Connects - 491,743.15 491,743.15 - 8,780,591.26 8,780,591.26 Facilitated Enrollment 503,322.42 - 503,322.42 2,383,838.23 - 2,383,838.23 Emergency Medical Transportation - - - 750,000.00 - 750,000.00 Managed Long-Term Care Ombudsman 1,041,420.70 - 1,041,420.70 3,892,487.95 - 3,892,487.95 Major Academic Pool - - - - - - Women's Health & Multiple Births - - - - - - Vital Access Program (OASAS) - - - - - - Vital Access Program (OMH) - - - - - - Vital Access Provider Services - - - - - - General Hospitals Safety-Net Providers - - - 35,239,490.00 - 35,239,490.00 Rural Transportation - - - - - - AIDS Epidemic 917,547.02 - 917,547.02 7,059,654.95 - 7,059,654.95 Fluoridation Systems - - - 750,709.02 - 750,709.02 Expanding Caregiver Support Services 1,764,721.62 - 1,764,721.62 18,942,891.64 - 18,942,891.64 Provide Affordable Housing 2,082,499.51 - 2,082,499.51 18,135,377.73 7,323,594.38 25,458,972.11 Health Homes Establishment - - - 376,446.03 - 376,446.03 Community Provider Network 7,255,830.00 - 7,255,830.00 16,387,813.95 - 16,387,813.95 Inpatient Services 82,177,105.08 - 82,177,105.08 284,275,231.38 - 284,275,231.38 Patient Centered Medical Homes - - - 46,974,452.85 - 46,974,452.85 Outpatient & Emergency Room Services 15,514,523.66 - 15,514,523.66 152,050,578.70 - 152,050,578.70 Clinic Services 24,159,174.88 - 24,159,174.88 133,217,542.65 - 133,217,542.65 Nursing Home Services 121,700,785.11 - 121,700,785.11 732,287,802.99 - 732,287,802.99 Other Long Term Care Services 180,094,487.40 - 180,094,487.40 4,864,717,810.82 - 4,864,717,810.82 Managed Care Services 762,169,877.95 - 762,169,877.95 4,064,380,199.64 - 4,064,380,199.64 Pharmacy Services 18,861,996.39 - 18,861,996.39 118,158,118.49 - 118,158,118.49 Transportation Services 12,242,685.47 - 12,242,685.47 81,067,026.44 - 81,067,026.44 Dental Services 444,886.85 - 444,886.85 2,344,432.01 - 2,344,432.01 Non-Institutional & Other (59,089,435.30) 389,383.00 (58,700,052.30) 441,986,678.12 11,608,844.00 453,595,522.12 Medical Services State Facilities 126,008,167.63 - 126,008,167.63 1,023,835,649.49 - 1,023,835,649.49 CSEA Family Health Plus Buy In 274,233.35 - 274,233.35 1,437,931.96 - 1,437,931.96 DC37 & Teamster Local 858 - - - - - - Medical Assistance (HCRA) 350,000,000.00 - 350,000,000.00 3,015,000,000.00 - 3,015,000,000.00 Indigent Care 66,440,160.10 - 66,440,160.10 583,139,262.63 - 583,139,262.63 Provider Assessments 73,845,000.00 - 73,845,000.00 577,007,000.00 - 577,007,000.00 NYC Personal Care Workforce Recruitment and Retention Rates (HCRA) - - - - - - Personal Care Workforce Recruitment and Retention Rates (HCRA) - - - - - - Home Health Rate Increase (HCRA) - - - - - - Additional DSH Payments SUNY - - 169,029,951.20 - 169,029,951.20 TOTAL(**) 1,791,671,067.61 456,617,313.03 2,248,288,380.64 16,516,189,037.80 910,884,947.01 17,427,073,984.81
Reclassification of Medical Assistance payments for care and treatment of patients at State-operated health, mental hygiene and State University facilities to Transfers. (125,677,532.49) - (125,677,532.49) (1,335,424,613.41) - (1,335,424,613.41)
TOTAL REPORTED MEDICAID 1,665,993,535.12$ 456,617,313.03$ 2,122,610,848.15$ 15,180,764,424.39$ 910,884,947.01$ 16,091,649,371.40$
(*) General Fund and State Special Revenue Funds only. These amounts do not include Medical Assistance spending for State Operations. These amounts are not comparable to Medicaid Global Cap spending. Department of Health regularly reclassifies spending between programs, and therefore amounts for any individual program may be restated by DOH.(**)Source: Statewide Financial System
DECEMBER 2020 9 MONTHS ENDED DECEMBER 31
57
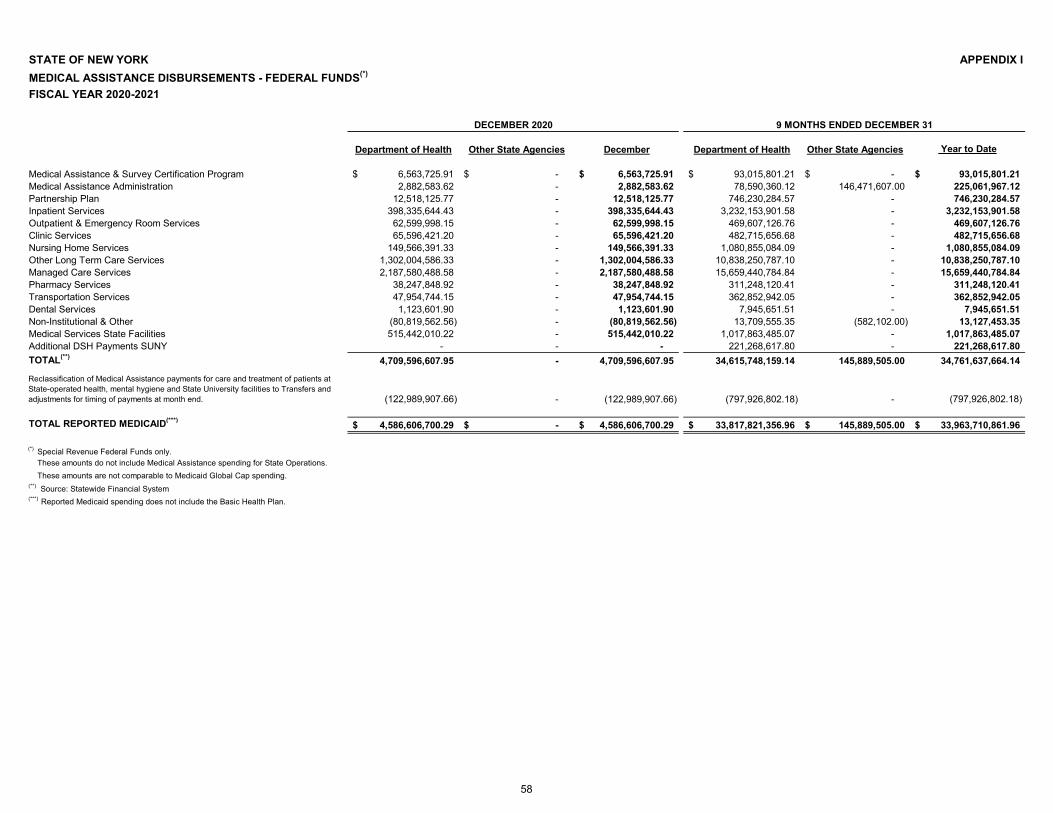
STATE OF NEW YORK APPENDIX IMEDICAL ASSISTANCE DISBURSEMENTS - FEDERAL FUNDS(*)
FISCAL YEAR 2020-2021
Department of Health Other State Agencies December Department of Health Other State Agencies Year to Date
Medical Assistance & Survey Certification Program 6,563,725.91$ -$ 6,563,725.91$ 93,015,801.21$ -$ 93,015,801.21$ Medical Assistance Administration 2,882,583.62 - 2,882,583.62 78,590,360.12 146,471,607.00 225,061,967.12 Partnership Plan 12,518,125.77 - 12,518,125.77 746,230,284.57 - 746,230,284.57 Inpatient Services 398,335,644.43 - 398,335,644.43 3,232,153,901.58 - 3,232,153,901.58 Outpatient & Emergency Room Services 62,599,998.15 - 62,599,998.15 469,607,126.76 - 469,607,126.76 Clinic Services 65,596,421.20 - 65,596,421.20 482,715,656.68 - 482,715,656.68 Nursing Home Services 149,566,391.33 - 149,566,391.33 1,080,855,084.09 - 1,080,855,084.09 Other Long Term Care Services 1,302,004,586.33 - 1,302,004,586.33 10,838,250,787.10 - 10,838,250,787.10 Managed Care Services 2,187,580,488.58 - 2,187,580,488.58 15,659,440,784.84 - 15,659,440,784.84 Pharmacy Services 38,247,848.92 - 38,247,848.92 311,248,120.41 - 311,248,120.41 Transportation Services 47,954,744.15 - 47,954,744.15 362,852,942.05 - 362,852,942.05 Dental Services 1,123,601.90 - 1,123,601.90 7,945,651.51 - 7,945,651.51 Non-Institutional & Other (80,819,562.56) - (80,819,562.56) 13,709,555.35 (582,102.00) 13,127,453.35 Medical Services State Facilities 515,442,010.22 - 515,442,010.22 1,017,863,485.07 - 1,017,863,485.07 Additional DSH Payments SUNY - - - 221,268,617.80 - 221,268,617.80 TOTAL(**) 4,709,596,607.95 - 4,709,596,607.95 34,615,748,159.14 145,889,505.00 34,761,637,664.14
Reclassification of Medical Assistance payments for care and treatment of patients at State-operated health, mental hygiene and State University facilities to Transfers and adjustments for timing of payments at month end. (122,989,907.66) - (122,989,907.66) (797,926,802.18) - (797,926,802.18)
TOTAL REPORTED MEDICAID(***) 4,586,606,700.29$ -$ 4,586,606,700.29$ 33,817,821,356.96$ 145,889,505.00$ 33,963,710,861.96$
(*) Special Revenue Federal Funds only. These amounts do not include Medical Assistance spending for State Operations. These amounts are not comparable to Medicaid Global Cap spending.(**) Source: Statewide Financial System(***) Reported Medicaid spending does not include the Basic Health Plan.
DECEMBER 2020 9 MONTHS ENDED DECEMBER 31
58