Compressors Scale builds up rates prediction Meshabab S. AL-Qahtani.
15
Compressors Scale builds up rates prediction Meshabab S. AL- Qahtani
-
Upload
william-flynn -
Category
Documents
-
view
226 -
download
2
Transcript of Compressors Scale builds up rates prediction Meshabab S. AL-Qahtani.

Compressors Scale builds up rates prediction
Meshabab S. AL-Qahtani

OutlineOutline
Background Background IntroductionIntroduction Triangular Analysis Method (TAM) Triangular Analysis Method (TAM) Results & Discussion Results & Discussion Benefits of Applying (TAM) Benefits of Applying (TAM) Conclusion Conclusion

BackgroundBackground
The The fouling is gradual process which is gradual process which prevalent due to nonvolatile mineral prevalent due to nonvolatile mineral tend to deposit on gas path tend to deposit on gas path component.component.
It is not predictable to see scales It is not predictable to see scales inside operated process compressors.inside operated process compressors.
Fouling is an expensive problem from Fouling is an expensive problem from energy consumption and degradation energy consumption and degradation of downstream process equipment of downstream process equipment effectiveness.effectiveness.
IntroductionIntroduction
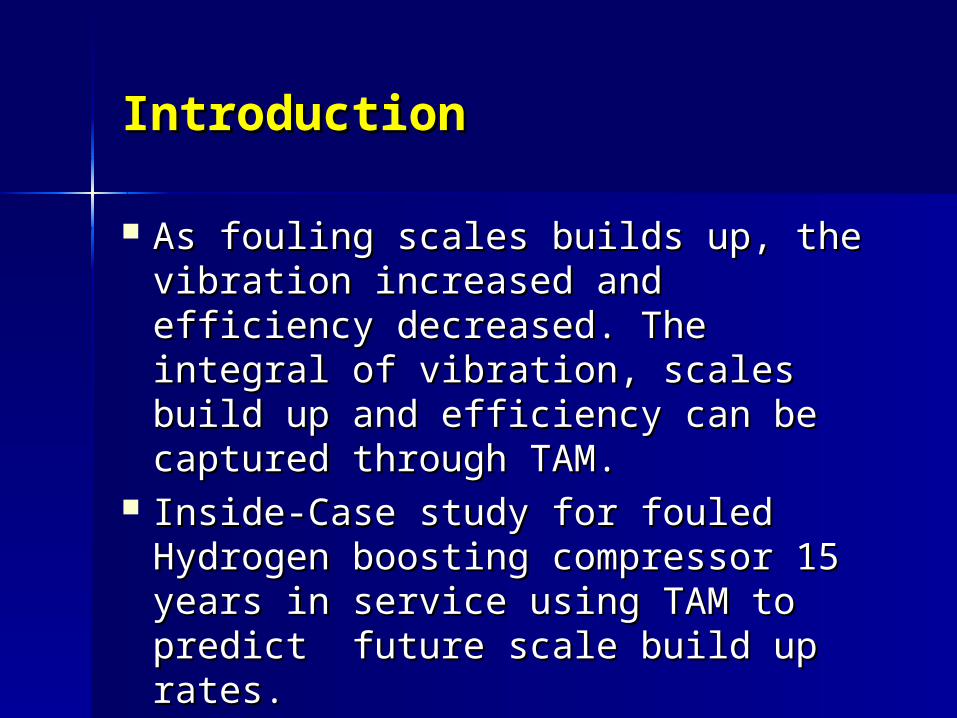
As fouling scales builds up, the As fouling scales builds up, the vibration increased and efficiency vibration increased and efficiency decreased. The integral of vibration, decreased. The integral of vibration, scales build up and efficiency can scales build up and efficiency can be captured through TAM.be captured through TAM.
Inside-Case study for fouled Inside-Case study for fouled Hydrogen boosting compressor 15 Hydrogen boosting compressor 15 years in service using TAM to years in service using TAM to predict future scale build up rates.predict future scale build up rates.

What is TAM ?
TAM is an integration between Vibration, Performance Monitoring historical trends and Scales measurements resulted of graphical liner scales predictions
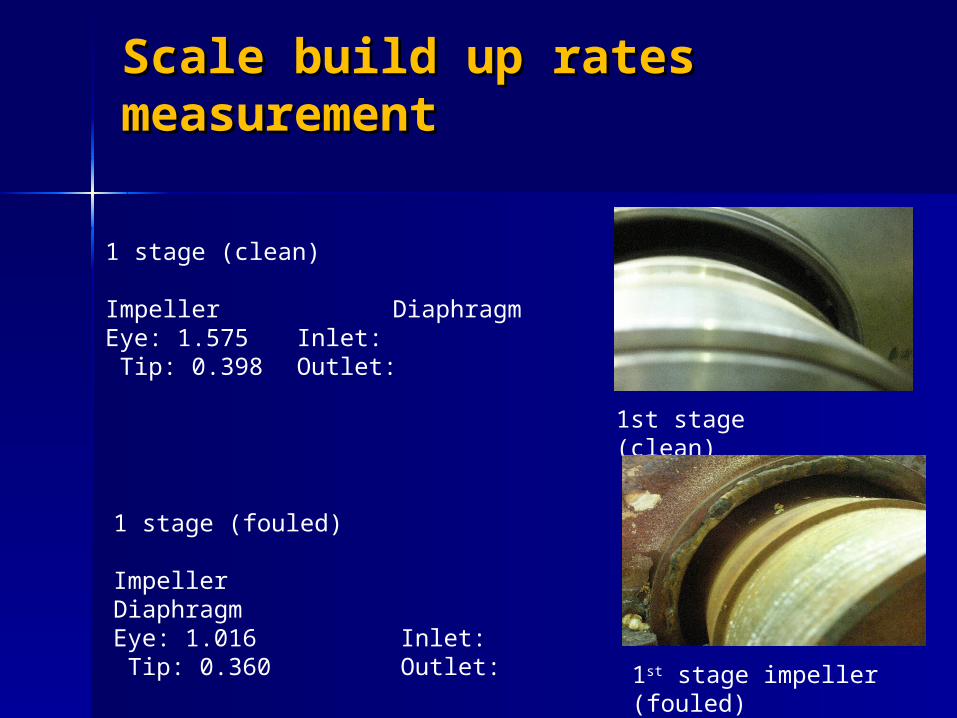
Scale build up rates Scale build up rates measurement measurement
1st stage (clean)
1st stage impeller (fouled)
1 stage (clean)
Impeller DiaphragmEye: 1.575 Inlet: Tip: 0.398 Outlet:
1 stage (fouled)
Impeller DiaphragmEye: 1.016 Inlet: Tip: 0.360 Outlet:

DCS vibrations DCS vibrations MonitoringMonitoring
Vibration at case 1 compressor shows 37 um at fouling before Vibration at case 1 compressor shows 37 um at fouling before shutdown shutdown Other vibration points are high compared to the alarm settings. Other vibration points are high compared to the alarm settings.
After overhauling it was 8 um averaged. After overhauling it was 8 um averaged.
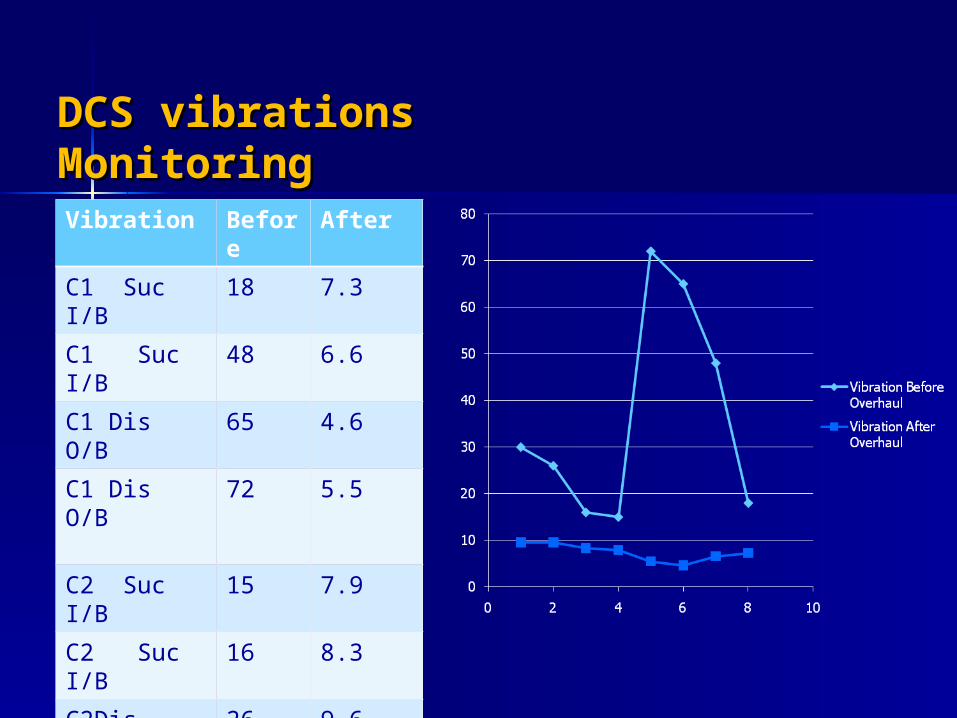
DCS vibrations DCS vibrations MonitoringMonitoringVibration Befor
eAfter
C1 Suc I/B 18 7.3
C1 Suc I/B 48 6.6
C1 Dis O/B
65 4.6
C1 Dis O/B
72 5.5
C2 Suc I/B 15 7.9
C2 Suc I/B 16 8.3
C2Dis O/B
26 9.6
C2 Dis O/B
30 9.6
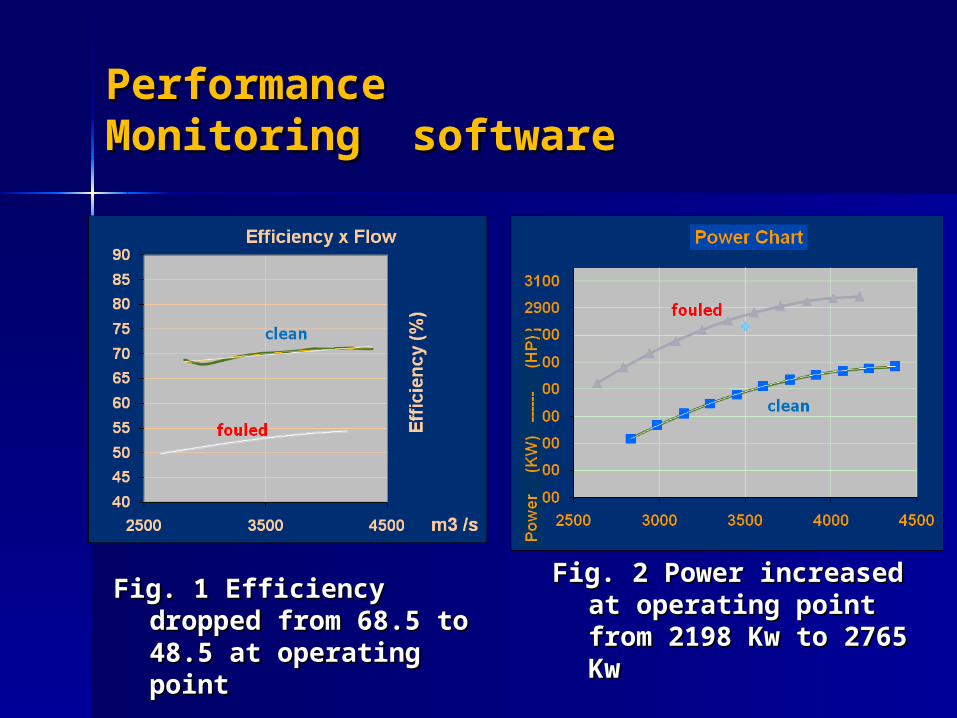
Performance Performance Monitoring softwareMonitoring software
Fig. 2 Power increased Fig. 2 Power increased at operating point at operating point from 2198 Kw to 2765 from 2198 Kw to 2765 Kw Kw
Fig. 1 Efficiency dropped Fig. 1 Efficiency dropped from 68.5 to 48.5 at from 68.5 to 48.5 at operating point operating point
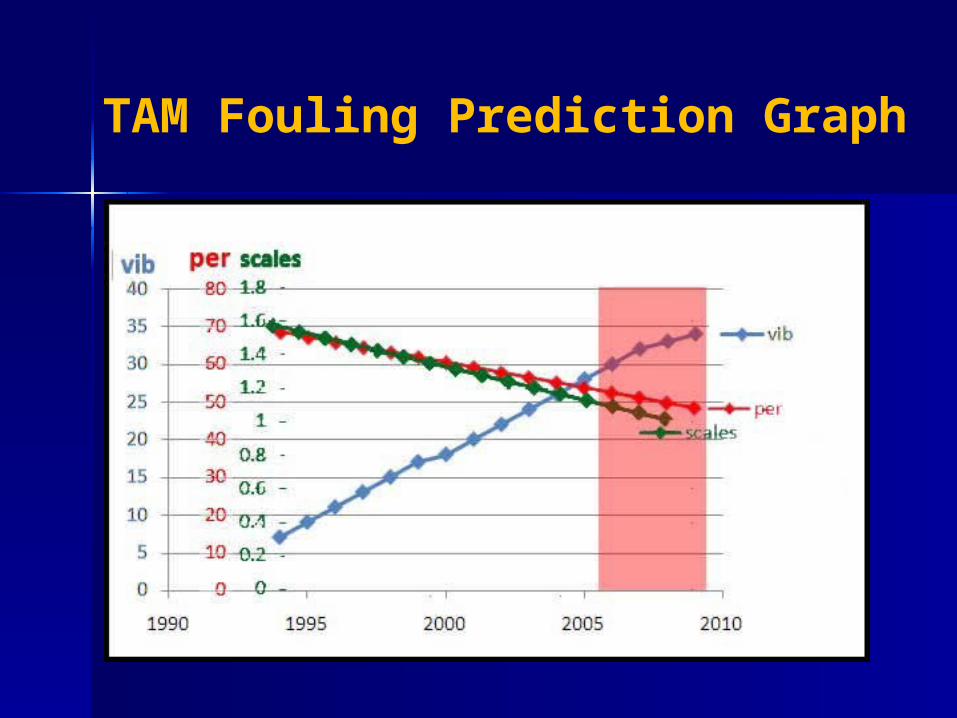
TAM Fouling Prediction Graph

Benefits of Applying (TAM) Benefits of Applying (TAM)
Excellent assessments to predict what scales rates and Excellent assessments to predict what scales rates and magnitude at any time compressor in servicemagnitude at any time compressor in service
Use this triangular analysis as part of Total Productive Use this triangular analysis as part of Total Productive Maintenance (TPM) where shutdown could be predicted Maintenance (TPM) where shutdown could be predicted from performance degradation rates. from performance degradation rates.
Determine the cleaning time for the compressor and Determine the cleaning time for the compressor and validity for upstream solution like inhibitors' in operationvalidity for upstream solution like inhibitors' in operation
Root cause analysis for fouling problems at increased Root cause analysis for fouling problems at increased vibrations. And decreased efficiency. vibrations. And decreased efficiency.
Assess performance degradation at one operating point Assess performance degradation at one operating point which eliminate carrying out field performance testwhich eliminate carrying out field performance test
used as a debottlenecking evaluation for integral used as a debottlenecking evaluation for integral process process
ConclusionConclusion
The accuracy of TAM can improved as assumption The accuracy of TAM can improved as assumption reduced and that depends on data accuracy and reduced and that depends on data accuracy and effective coloration. effective coloration.
Cost avoidance was calculated on the reserve and Cost avoidance was calculated on the reserve and production of downstream process Gasoline production production of downstream process Gasoline production as $ 3.3 MM. energy conservation was calculated with as $ 3.3 MM. energy conservation was calculated with extra power consumption to be around $.2 MM. Total of $ extra power consumption to be around $.2 MM. Total of $ 3.5 MM was expected to be reaped with antifouling and 3.5 MM was expected to be reaped with antifouling and close performance monitoring for these compressors. close performance monitoring for these compressors.
These compressors are in hydrotreating unit were similar These compressors are in hydrotreating unit were similar process are existing and possible implementation could process are existing and possible implementation could result of wide cost reduction for refining result of wide cost reduction for refining
This method will be applicable for critical centrifugal This method will be applicable for critical centrifugal compressors for un-processed gas applications. compressors for un-processed gas applications.

Thank YouThank You

Fouling Fouling

Results & Discussion Results & Discussion
During the overhauling Fouling of solid During the overhauling Fouling of solid NH4SH was deposited in the compressor inlet NH4SH was deposited in the compressor inlet stages and measured against clean stages stages and measured against clean stages (10% volume Reduction). (10% volume Reduction).
The performance program showed decrease The performance program showed decrease in efficiency of the compressor by 20%. in efficiency of the compressor by 20%.
An increase in the 1x vibration of about eight An increase in the 1x vibration of about eight times compared to vibration reading after times compared to vibration reading after cleaning. cleaning.