Compressor: Analytical Approach and Validation Physical...
16
ABSTRACT Global warming is a climate phenomenon with world-wide ecological, economic and social impact which calls for strong measures in reducing automotive fuel consumption and thus CO 2 emissions. In this regard, turbocharging and the associated designing of the air path of the engine are key technologies in elaborating more efficient and downsized engines. Engine performance simulation or development, parameterization and testing of model-based air path control strategies require adequate performance maps characterizing the working behavior of turbochargers. The working behavior is typically identified on test rig which is expensive in terms of costs and time required. Hence, the objective of the research project “virtual Exhaust Gas Turbocharger” (vEGTC) is an alternative approach which considers a physical modeled vEGTC to allow a founded prediction of efficiency, pressure rise as well as pressure losses of an arbitrary turbocharger with known geometry. The model is conceived to use smallest possible number of geometry as well as material parameters. Thus, conventional expensive and time-consuming application processes can be countered and test rig as well as in vehicle measurements can be reduced. Furthermore, the vEGTC model enables the prediction of different turbocharger behavior caused by geometry variations. Within this paper it is shown in which way the radial compressor as a representative modeling component can be described by zero-dimensional equations: in order to simulate the working behavior of the compressor the geometry, the thermodynamic state of the inlet-air and the turbocharger speed are assumed to be known. The loss mechanisms are devised using analytical and semi-empirical loss correlations. In order to validate the compressor efficiency the heat transfer from the turbine to the compressor is considered. Finally, the simulation output is compared to manufacturer maps of three different turbochargers pointing out the reliability of the model. Thus, a comprehensive validation of the vEGTC model is yielded. The object-oriented language Modelica is used for modeling and the simulations are provided by the Dymola solver. INTRODUCTION Driven by the rising emission and mileage requirements the digital control of all relevant engine actuators (e.g. fuel- system and injection, exhaust gas turbocharger with variable turbine geometry) with engine control units (ECUs) was introduced into the automotive market in the 90's. A characteristic feature of these ECUs is highly reusable control algorithms which can be adapted on different car as well as engine concepts by adjusting relevant software parameters. This car-specific parameter adaptation process is called ECU calibration. A next significant development step in engine control was the introduction of model based control strategies, i.e. the calculation of appropriate actuator input signals by solving the relevant physical zero-dimensional steady state equations (e.g. pressure loss over throttle, turbo charger power, mass flows) in real-time. Model based control strategies have less complex parameter structures and thus need less calibration effort while keeping high control accuracy under different operation conditions. Physical Modeling of Automotive Turbocharger Compressor: Analytical Approach and Validation 2011-01-2214 Published 09/13/2011 Mehdi Nakhjiri, Peter Pelz and Berthold Matyschok Technische Universität Darmstadt Lorenz Däubler and Andreas Horn IAV GmbH Copyright © 2011 SAE International doi: 10.4271/2011-01-2214 Gratis copy for Mehdi Nakhjiri Copyright 2011 SAE International E-mailing, copying and internet posting are prohibited Downloaded Wednesday, September 07, 2011 09:01:45 AM
Transcript of Compressor: Analytical Approach and Validation Physical...

ABSTRACTGlobal warming is a climate phenomenon with world-wideecological, economic and social impact which calls for strongmeasures in reducing automotive fuel consumption and thusCO2 emissions. In this regard, turbocharging and theassociated designing of the air path of the engine are keytechnologies in elaborating more efficient and downsizedengines. Engine performance simulation or development,parameterization and testing of model-based air path controlstrategies require adequate performance maps characterizingthe working behavior of turbochargers. The working behavioris typically identified on test rig which is expensive in termsof costs and time required. Hence, the objective of theresearch project “virtual Exhaust Gas Turbocharger”(vEGTC) is an alternative approach which considers aphysical modeled vEGTC to allow a founded prediction ofefficiency, pressure rise as well as pressure losses of anarbitrary turbocharger with known geometry. The model isconceived to use smallest possible number of geometry aswell as material parameters. Thus, conventional expensiveand time-consuming application processes can be counteredand test rig as well as in vehicle measurements can bereduced. Furthermore, the vEGTC model enables theprediction of different turbocharger behavior caused bygeometry variations.
Within this paper it is shown in which way the radialcompressor as a representative modeling component can bedescribed by zero-dimensional equations: in order to simulatethe working behavior of the compressor the geometry, thethermodynamic state of the inlet-air and the turbochargerspeed are assumed to be known. The loss mechanisms are
devised using analytical and semi-empirical loss correlations.In order to validate the compressor efficiency the heattransfer from the turbine to the compressor is considered.Finally, the simulation output is compared to manufacturermaps of three different turbochargers pointing out thereliability of the model. Thus, a comprehensive validation ofthe vEGTC model is yielded. The object-oriented languageModelica is used for modeling and the simulations areprovided by the Dymola solver.
INTRODUCTIONDriven by the rising emission and mileage requirements thedigital control of all relevant engine actuators (e.g. fuel-system and injection, exhaust gas turbocharger with variableturbine geometry) with engine control units (ECUs) wasintroduced into the automotive market in the 90's. Acharacteristic feature of these ECUs is highly reusable controlalgorithms which can be adapted on different car as well asengine concepts by adjusting relevant software parameters.This car-specific parameter adaptation process is called ECUcalibration.
A next significant development step in engine control was theintroduction of model based control strategies, i.e. thecalculation of appropriate actuator input signals by solvingthe relevant physical zero-dimensional steady state equations(e.g. pressure loss over throttle, turbo charger power, massflows) in real-time. Model based control strategies have lesscomplex parameter structures and thus need less calibrationeffort while keeping high control accuracy under differentoperation conditions.
Physical Modeling of Automotive TurbochargerCompressor: Analytical Approach and Validation
2011-01-2214Published
09/13/2011
Mehdi Nakhjiri, Peter Pelz and Berthold MatyschokTechnische Universität Darmstadt
Lorenz Däubler and Andreas HornIAV GmbH
Copyright © 2011 SAE International
doi:10.4271/2011-01-2214
Gratis copy for Mehdi NakhjiriCopyright 2011 SAE International
E-mailing, copying and internet posting are prohibitedDownloaded Wednesday, September 07, 2011 09:01:45 AM
The model based control strategies for turbochargers inautomotive applications are based on the steady-state powerbalance and call for efficiency maps as the main physicalparameter. Test rig and vehicle experiments and thesubsequent offline analysis of the gained measurements is thestandard way for calibrating these maps. An alternativecalibration method is based on EGTC modeling andsimulation. This model based calibration approach addressesthe following main requirements:
• Experiment based calibration of turbocharger efficiencymaps is time consuming and expensive.
• Test rig measurements reflect only a part of the workingrange of turbochargers. The aim is to determine the extendedoperation areas without extrapolation.
• Slight changes in the turbocharger geometry lead tocomplete new test campaigns. With a turbocharger model theexpected changes of efficiency and pressure rise respectivelycaused by geometry changes can be examined.
• Modeling is understanding. ECU engineers gain insight intothermodynamics of turbochargers by modeling the relevantphysical phenomena. This in turn is a key enabler for thedevelopment of new or improved existing control strategies.
The presented simulation approach called virtual ExhaustGas Turbocharger is based on a physical turbocharger modelin order to make computer-aided calibration and parameteradaptation possible. The model is able to predict efficiency,pressure rise as well as pressure losses of an arbitraryturbocharger with known geometry. Thus, model-based airpath control strategies should yield a higher level of accuracyand reliability while testing costs are saved.
Here, the decision is knowingly made to work with physicalmodeling rather than CFD. Thus, the complexity of the modelis significantly reduced which allows easier understanding ofthe connections between the parameters of the model.Additionally, geometry parameters can be varied easily whilein case of CFD any small change in geometry requires thegeneration of a new computational mesh or at least arefinement of the mesh. The calculation of a working pointby physical modeling is much faster than a CFD simulation.The computing time is an essential aspect regarding the real-time capability of the model in hardware in the loopsimulations or on-board applications. So, physical modelingis a trade-off between accuracy and time costs. Therefore, theproposed model is intended for engine performancesimulation or controls modeling but less appropriate forturbomachinery design.
SIMULATION ENVIRONMENTModelica is a modeling language which is primarily appliedfor component-oriented modeling of complex systems andsimulation tasks. One particular feature of Modelica is the
declarative description of the models. The equal sign is not anassignment operator but an equality operator in mathematicalsense. So the equations have no predefined causality. Thisresults in a system of equations which should be neither over-nor under-determined nor singular. Furthermore, Modelicasupports object-oriented programing enhancing themodularity and reusability of the model. For simulation, theModelica code is translated into objects which are thenexercised by an Ordinary Differential Equation ODE or aDifferential Algebraic Equation DAE solver.
In this work, the commercial tool Dymola is deployed as thesimulation environment which is a combination of a user-friendly interface and a solver. Further it provides a graphicaleditor which allows for programing with visual expressions.
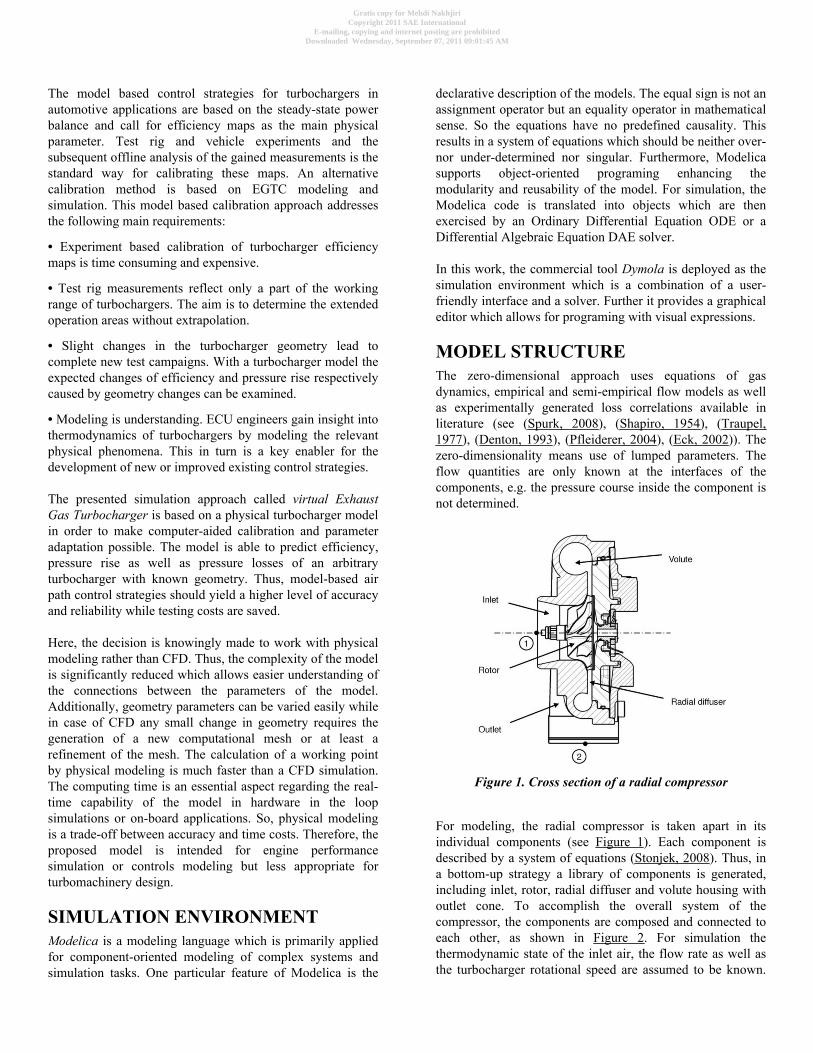
MODEL STRUCTUREThe zero-dimensional approach uses equations of gasdynamics, empirical and semi-empirical flow models as wellas experimentally generated loss correlations available inliterature (see (Spurk, 2008), (Shapiro, 1954), (Traupel,1977), (Denton, 1993), (Pfleiderer, 2004), (Eck, 2002)). Thezero-dimensionality means use of lumped parameters. Theflow quantities are only known at the interfaces of thecomponents, e.g. the pressure course inside the component isnot determined.
Figure 1. Cross section of a radial compressor
For modeling, the radial compressor is taken apart in itsindividual components (see Figure 1). Each component isdescribed by a system of equations (Stonjek, 2008). Thus, ina bottom-up strategy a library of components is generated,including inlet, rotor, radial diffuser and volute housing withoutlet cone. To accomplish the overall system of thecompressor, the components are composed and connected toeach other, as shown in Figure 2. For simulation thethermodynamic state of the inlet air, the flow rate as well asthe turbocharger rotational speed are assumed to be known.
Gratis copy for Mehdi NakhjiriCopyright 2011 SAE International
E-mailing, copying and internet posting are prohibitedDownloaded Wednesday, September 07, 2011 09:01:45 AM

Additionally, the geometry of the compressor is given.According to the main application field of the vEGTC, themodel is conceived to use the smallest possible number ofgeometry parameters as well as material parameters. In thiswork the number of geometry parameters does not exceed 23.A list of geometry parameters is provided in Appendix A.
Figure 2. Compressor Components as partial modelsconnected to an overall system
Considering the steady state flow each component is modeledby linking the balance equations for continuity and energy aswell as the ideal gas law while the ideal change of state isassumed to be isentropic. Additionally, the power supplied tothe flow in the rotor is indicated by Euler's turbine equationwhich is obtained from the balance of angular momentum.
(1)
(2)
(3)
(4)
(5)
Further equations are added for each component taking lossesinto account. The losses are mostly described on the basis ofapproaches proposed in turbomachinery literature. Some ofthem are taken over directly or modified. It is to be noted thatthe application of these loss correlations involvesuncertainties. Loss mechanisms are typically dependent oneach other, though there is a breakdown of losses into profileand endwall losses as well as leakage losses in literature.Another uncertainty is the fact that the specified losscorrelations in literature often apply for the design point anddo not describe the off-design performance.
A useful loss definition is the energy or enthalpy loss whichis equivalent to an entropy loss coefficient or a pressure losscoefficient in incompressible flow, as i.a. proposed byDenton (Denton, 1993). Referring to Figure 3 the enthalpyloss coefficient is described by:
(6)
Since the denominator of Equation 6 represents the dynamicpressure the definition of loss results in a change of enthalpywhich is proportional to the square of the flow velocity.
(7)
In this work losses are considered as enthalpy losses whichdo not contribute to pressure rise. But they result in anenthalpy rise of the air. The overall enthalpy loss isdetermined additively in the model. Thus, Equation 2 can berewritten as ht,2s + Δhloss − ht,1 = w + q, where ht,2s resultsfrom Equation 4. In the following the loss mechanisms areintroduced which are considered in the compressor model.
Figure 3. Enthalpy-entropy diagram for a diffuser;adiabatic compression process
FRICTION LOSSWith respect to the wall shear stress in a flow channel thefriction loss is introduced
(8)
while a constant cross-section of the flow channel, anincompressible medium, a developed flow and steady statebehavior are assumed. As most of the assumptions cannot befulfilled in a real turbocharging process, this definition of thefriction inherently constitutes an uncertainty. For theapplication on the turbocharger the friction factor λ and the
Gratis copy for Mehdi NakhjiriCopyright 2011 SAE International
E-mailing, copying and internet posting are prohibitedDownloaded Wednesday, September 07, 2011 09:01:45 AM

hydraulic diameter Dh are determined at the inlet and outletof each component and are averaged linearly. However, incase of the flow velocity, the square of the velocity isaveraged which represents the average kinetic energy.
The friction loss is considered in this form for the modelingof the components inlet and outlet cone. Further in the volutehousing a modified calculation is performed by using acylindrical coordinate system. Assuming a linear cross-sectional change the friction loss is defined as
(9)
In the rotor and radial diffuser the friction loss modelsinclude further considerations and assumptions which areelaborated in the following.
RotorEquation 8 is also applied for the rotor from the assumptionof blade channels which guide the flow into the radialdiffuser. This is a rough estimate of the rotor friction lossonly, since the twisted blade channel features compressibleswirling flow. Here it is further needed to define an effectivelength of the blade channel the air passes through (due to thespatial course). For this purpose, it is allowed for a maximumand a minimum length while the effective length is assumedto be the average value.
Considering a point on the average streamline at the inlet ofthe blade channel and at the outlet respectively, the linkingvector can be quoted as . The minimum lengthof the blade channel can be introduced as the vector length
while the maximum length is determined by thesum of the coordinates Lmax = |x| + |y| + |z|. It is to note that inthis approach the rotor is treated as shrouded. That is, thehousing wall loss is not determined separately, but isregarded as a part of the blade channel loss.
Further, Shapiro (Shapiro, 1954) indicates that the frictionfactor λ in the rotor is higher than in case of a fully developedpipe flow which is known from the Moody diagram. Thus,the approach inherently underestimates the rotor friction loss.Due to that, the blade channels are considered in full lengthregardless of splitter vanes in order to reduce thisunderestimation.
Radial DiffuserThe friction loss in the radial diffuser is referred to the loss ofangular momentum. Eckert and Schnell (Eckert, 1980)specify the circumferential component of the velocity on anarbitrary radius of the radial diffuser to
(10)
with
(11)
(12)
The circumferential component of the velocity in Equation 10differs from the velocity calculated with the principle ofangular momentum without consideration of loss (i.e.
). This difference can be understood as kineticenergy dissipated by friction which leads to an enthalpy riseof the air.
INCIDENCE LOSSA classical incidence model implies that the circumferentialcomponent of the relative velocity and therefore also a part ofthe kinetic energy is dissipated (NASA-Shock-Loss-Theory).Due to the abrupt change of direction at the rotor inlet, thedifference between the circumferential components of theoptimal inflow and the actual inflow in dependence on theworking point leads to dissipation. The approach is based onempirical studies and can be founded physically referring to(Pfleiderer, 2004)
(13)
(14)
Furthermore, the real circumferential component of therelative velocity wu,i can be determined by means of thevelocity triangle of the working point. Incidence is notconsidered for splitter vanes. The reason is that the flow isguided in correspondence with the curvature of the bladechannel. Thus, the flow direction matches with thegeometrical inflow angle of the splitter vanes. Additionally, itshould be noted that the shock loss theory assumes shock-freeflow at zero angle of incidence while there are also theoriesin literature introducing minimum loss at slightly negativeangle of incidence.
Gratis copy for Mehdi NakhjiriCopyright 2011 SAE International
E-mailing, copying and internet posting are prohibitedDownloaded Wednesday, September 07, 2011 09:01:45 AM

TIP CLEARANCE LOSSThe loss induced by the flow around the blade between thepressure and suction side is considered using the followingempirical correlation
(15)
which is introduced by Traupel (Traupel, 1977) and goesback to Dean (Dean, 1975). The consideration of the tipclearance loss is particularly proposed for large relative gapwidths which is the case in automotive turbochargers. InEquation 15, Bo,Blade stands for the blade height at the outletand is the average gap width while uo is the circumferentialspeed at the outlet.
CARNOT'S SHOCK LOSSIn the radial compressor several components show diffuserbehavior transforming the kinetic energy into pressureenergy. In a diffuser the decrease of velocity together withpressure rise in flow direction can lead to boundary layerseparation. Thus, the flow experiences a smaller effectivecross-sectional increase which does not correspond to theactual channel geometry. As a result a smaller pressure rise isaccomplished. This pressure deficit can be accounted byusing Carnot's shock loss formula for an abrupt change ofcross-section that serves as an ideal poor diffuser (Spurk,2008).
(16)
In the transition from the rotor to the vaneless radial diffuserthe obstruction of the blades is omitted abruptly which allowsfor a Carnot shock loss. In the radial diffuser itself, a Carnotshock loss is applied to the estimation of the decrease of theradial component of the velocity.
The flow enters the volute housing with a large tangentialvelocity component while the outflow velocity into the outletcone is noticeably smaller which is explicitly determined bythe equation of continuity. This dissipative decelerationindicates a loss referring to the Carnot shock loss.
The outlet cone represents a classical diffuser with anaperture angle of less than 10° which is imposed to a Carnotshock loss including an attenuation factor as proposed in(Van den Braembussche, 2006), (Weber, 1986). It is to noticethat in all other cases mentioned above the attenuation factoris assumed to be 1.
The secondary flow losses which take place, inter alia, due tothe redirection of the flow in the blade channel are generally
described by partly dissipation of kinetic energy regarding
both the absolute velocity at the inlet ( ) and the relative
velocity in the rotor channel ( ), see e.g. (Eck,2002). It is to note that explicit values for the attenuationfactors ε are not given in literature (rather intervals). In thiswork the effect of relative velocity is considered in form of aCarnot loss which as well describes a dissipation of thekinetic energy due to deceleration and is smaller than thedifference of kinetic energy between output and input
. Hence, the attenuation factor is left out.The absolute velocity is not considered for the description ofthe secondary flow losses due to insufficient effect on thesimulated characteristics.
SLIP FACTORThe limited number of blades effects the outflow angle whichdiffers from the blade congruent flow angle at the rotor exitresulting in a smaller tangential component of the absolutevelocity of the outflow cu,eff = µcu. This results in a reducedpressure rise considering Euler's turbine equation. Therefore,the slip factor is accounted by
(17)
according to Eckert and Schnell (Eckert, 1980). Due to theCoriolis force and the consequential relative swirl (with a−2Ω revolution to ensure rot in the absolute system)there is a difference in velocity between both sides of theblade channel. Furthermore, the flow involves friction so thatthe processes are affected by the boundary layer whichdevelops differently for the different velocities on both sidesof the blade channel. Thus, the shrinking of the tangentialcomponent of the absolute velocity at the exit is emphasizedso that the effective channel width is set to Heff = 0.8H.
TRAILING EDGE LOSSAs a consequence of flow around the trailing edge of theblades, vortices can arise. The energy consumed by thevortices is identified as dissipation (Bammert, 1966).
(18)
Bammert and Fiedler (Bammert, 1966) and Denton (Denton,1993) propose 0.15 < ε < 0.2. to is the blade pitch at the exitwhile To stands for the blade thickness.
Gratis copy for Mehdi NakhjiriCopyright 2011 SAE International
E-mailing, copying and internet posting are prohibitedDownloaded Wednesday, September 07, 2011 09:01:45 AM

FURTHER LOSS MECHANISMSAt the rotor inlet, the inflow is obstructed by the hub face andthe twisted blades which dissipates energy. In order tocharacterize this loss, the principle of linear momentum isconsidered in a very narrow domain of integration, a so-called control volume including the hub and the leading edgeof the blade. The force acting on the hub is referred to thetotal pressure before the hub though it only applies for thestagnation point at the center of the hub. Considering theequations of continuity, energy and the ideal gas, a system ofequations can be set for the control volume. The resultingchange of enthalpy does not correspond to the isentropicchange of state. The difference can be related to the square ofthe flow velocity representing a loss correlation.
Another loss consideration refers to the volute housing whichcannot exploit the radial component of the velocity of theinflow. This results in kinetic energy dissipation which isintroduced by Van den Braembussche (Van denBraembussche, 2006) as a meridional dump loss. Theapproach goes back to Japikse (Japikse, 1982) and Weber andKoronowski (Weber, 1986).
(19)
CORRECTION FACTORThe loss models introduced above are proposed for modelingunder compressible conditions though they are mostlygenerated for incompressible flow. From the point of view ofmechanical similarity, the relative change of volume due tocompressive forces should be taken into consideration. In thisregard, the Mach number is the relevant factor which ishighly variable in the compression process. Hence, the lossmodels can inherently not describe the compressor flowaccurately so that there is at least a need for a correctionfactor. In this work the enthalpy losses are upgraded with the
multiplicative factor . Considering a straight flow channelwith constant cross section the Bernoulli equation introduces
(20)
(21)
since it applies ρi = ρo in incompressible flow. However, thedensity changes in the compressor. Upgrading enthalpy losswith the proposed correction factor means the enthalpy loss iscomputed with ρo instead of ρi(compare Equation 20 andEquation 23).
(22)
(23)
Considering the definition of speed of sound , the
change of density can be rewritten as . Thus, thecorrection factor is linked to the Mach number:
(24)
The correction factor substantially improves the modelquality, particularly for high circumferential speed.
HEAT TRANSFERWith the loss models so far the compressor performance canbe described adiabatically. However, due to the temperaturegradient between the turbine and the compressor and theresulting heat flow the compressor process is non-adiabatic.According to the first law of thermodynamics the specificamount of heat transferred to/from the compressor isconsidered in Equation 2. At the same time it is allowed foran enthalpy loss Δhheat since the heat deteriorates theefficiency of the compressor. If the heat enters thecompressor before the compression process, more work isrequired to compress the warmer gas which is justified bydiverging isobars in an h-s-diagram, as e.g. shown in Figure3. Otherwise, if the heat enters the compressor after the gas isalready compressed, the compression process will not beaffected directly. Then, the efficiency deterioration goes backto the temperature-based definition of the isentropicefficiency since the gas is additionally heated.
On the one hand heat is exchanged between compressor andturbine, on the other hand between compressor andenvironment. In order to estimate the heat transfer, Bohn etal. (Bohn, 2003) propose a formula using the dimensionlessNusselt number as a function of Reynolds number andturbine inlet temperature. The heat model also accounts fornegative heat transfer, i.e. from the compressor to itsenvironment. This can occur at high compression level sincethe air is heated up through compression. In this paper theheat transfer is modeled according to Bohn et al. while heat isassumed to enter the compressor after the compressionprocess.
SIMULATION RESULTSIn this section simulation results of an automotiveturbocharger are presented using key performance indicators
Gratis copy for Mehdi NakhjiriCopyright 2011 SAE International
E-mailing, copying and internet posting are prohibitedDownloaded Wednesday, September 07, 2011 09:01:45 AM

of the turbomachinery, i.e. the dimensionless parameters
power coefficient the flow coefficient .
Figure 4. Dimensionless aerodynamic characteristics ofa radial compressor
Figure 5. Normalized rotor enthalpy losses illustrated fora single circumferential speed
In Figure 4 the power coefficient λ is plotted versus flowcoefficient φ for an adiabatic process. It can be seen that thepower coefficient increases with the circumferential speedwhich is expected according to scale-up theory. Additionally,the curvature of the characteristics, especially for highercircumferential speeds, points out the pressure deteriorationin consequence of the loss mechanisms. The lossless case ofeach characteristic would exhibit a straight course, followingEuler's turbine equation. In this regard Figure 5 shows theprogression of the rotor enthalpy losses against the flowcoefficient while all quantities of enthalpy losses are
normalized by . The course of the overall enthalpy loss ismainly specified by the incidence which is essential in off-design working range due to quadratic dependency on theflow coefficient. Besides, tip clearance and friction lossesconstitute the main pressure deterioration. The Carnot shockloss shrinks with the flow coefficient which is due to adecreasing deceleration of the flow. The trailing edge loss isonly noticeable close to choking. It should be noted that theloss models cannot all meet the real-world case accurately.Some losses may be overestimated or underestimated.However, the overall loss is assumed to be a balance withoutsubstantial deviation from the real-world scenario.
VALIDATION AND DISCUSSIONIn order to estimate quality and reliability of the compressormodel, a comprehensive validation is performed. For thispurpose three different automotive turbochargers are usedwhile manufacturer maps are applied as reference data. Themanufacturer maps describe non-adiabatic compressorperformance. General geometry parameters of theturbochargers are listed in Table 1.
Model results are displayed as total pressure ratio
and isentropic efficiency versus reduced
volume flow at different circumferentialspeeds in a range of 20000 rpm to 100000 rpm for
Table 1. General geometry parameters of the radial compressors applied for validation
Gratis copy for Mehdi NakhjiriCopyright 2011 SAE International
E-mailing, copying and internet posting are prohibitedDownloaded Wednesday, September 07, 2011 09:01:45 AM

turbocharger I, 50000 rpm to 185000 rpm for turbocharger IIand 75000 rpm to 280000 rpm for turbocharger III.
In Figure 6, Figure 7, Figure 8, Figure 9, Figure 10, Figure 11the simulation results are featured with markers while themanufacturer map is displayed with continuouscharacteristics. In order to demonstrate the range ofvalidation a consistent scale on the diagram axes is used sothat the different working ranges of the applied turbochargerscan be recognized. For each simulated turbocharger it can bestated that the model is able to predict the total pressure ratioreliably in the entire working range of the compressordepicted in the manufacturer map (see Figure 6, Figure 8 andFigure 10). It should be noted that the model can also identifyworking points at circumferential speeds below the minimumspeed indicated in the manufacturer map. Thus, it is possibleto extend the manufacturer map without using extrapolationmethods. The indication of surge is not considered here sincethe compressor surge is dependent upon upstream anddownstream components and bends. Hence, indication ofsurge demands information about test rig geometry.However, a prediction of instability can be achieved using thediffusion factor according to (Rodgers, 1978) which serves asa measure for the rotor load. In literature critical values of 0.6to 0.8 are proposed for the diffusion factor. In this workcritical values of 0.7, 0.65 and 0.6 are identified forturbocharger I to III which are labeled with circles in thediagrams. The critical value can be linked with the size of theturbocharger considering that turbocharger I has the largestrotor and turbocharger III the smallest one. Further, Chokingis considered with regard to Ma = 1.
Figure 6. Total pressure ratio on turbocharger I;simulated (marker) and reference (continuous)
Figure 7. Isentropic efficiency on turbocharger I forselected circumferential speeds; simulated (marker) and
reference (continuous)
For each turbocharger the simulated isentropic efficiency iscompared with the respective manufacturer map. For a betteroverview only four selected characteristics are plotted (seeFigure 7, Figure 9 and Figure 11). Figure 7 introduces theresults for turbocharger I which show good agreementbetween simulation and reference data at highercircumferential speeds. The characteristic 0.2umax at exhibitsmaximum difference. The simulation results for turbochargerII have a lower accuracy; the efficiency is overestimated inthe entire working range. With growing circumferential speedthe difference in the magnitude of efficiency decreases at thecost of accuracy regarding the location of the maxima (seeFigure 9). Agreement with reference data can also berecorded in Figure 11 for turbocharger III which is thesmallest turbocharger considered for validation. It should benoted that the overall characteristic of the efficiency map canbe described for all applied turbochargers, i.e. the non-adiabatic isentropic efficiency is expected to increase with thecircumferential speed and then drop towards maximumspeed.
Gratis copy for Mehdi NakhjiriCopyright 2011 SAE International
E-mailing, copying and internet posting are prohibitedDownloaded Wednesday, September 07, 2011 09:01:45 AM

Figure 8. Total pressure ratio on turbocharger II;simulated (marker) and reference (continuous)
Figure 9. Isentropic efficiency on turbocharger II forselected circumferential speeds; simulated (marker) and
reference (continuous)
In the following some uncertainties referring to simulationand validation are discussed. The geometry parametersentering the compressor model are exposed to uncertaintiessince they are measured and collected manually due to lack ofCAD data. In order to minimize these uncertainties, astereoscopic survey of the geometric parameters is carried out(see Appendix A). Furthermore, the procedure withconsideration of manufacturer maps as reference datainvolves uncertainties since there is no exact informationabout the measuring technique as well as measuring points onthe test rigs, a typical scenario for ECU engineers. That is, thequantities pressure, temperature and flow rate are notmeasured directly at the inlet or outlet of the compressor.Test rigs have given pipe geometries, so that turbochargerscan only be mounted using individual fittings. However, the
measuring points are located in the test rig pipes. As a resultof this, the system boundaries are automatically extended(including duct losses). This issue has to be taken intoaccount when comparing simulation and test rig maps,however the effects are assumed to be moderate.
The discrepancy between the simulated isentropic efficiencyand the reference data can be related to the general enthalpyloss model on the one hand, see Equation 7. Besides themagnitude of efficiency, the location of the optima ofefficiency characteristics is determined by the different lossmechanisms, in particular by the incidence loss. Incidence iscaused by manufacturing tolerances, part/over load operation,inhomogeneous inlet flow and wall boundary layer thoughthe incidence loss model only accounts for part/over loadoperation while assuming a homogeneous inlet flow,regardless of the development of a wall boundary layer andits form. Further, the shock loss theory assumes shock-freeflow at zero angle of incidence. In literature there are alsotheories which introduce minimum loss at slightly negativeangle of incidence. Hence, the shock loss theory mightinherently lead to shifting efficiency maximum towards surgeline with positive angles of attack. Further, the location of theoptimum is also affected by other loss mechanisms shiftingthe optimum from the shock-free flow rate, see Figure 5. Thesimplified loss models, e.g. friction which enters eachcomponent, can lead to a deficient displacement of theoptimum. Additionally, the magnitude of shifting of theoptimum shows dependency on the turbochargercircumferential speed. Further, the difference in slope of theefficiency characteristics in part load can be referred to inletrecirculation. Due to insufficient models in literature,recirculation is, however, disregarded in favor of betterprediction of total pressure ratio. In this connection, theinteraction between recirculation and incidence is importantwhich is rarely addressed in literature. On the other hand themodel for the heat transfer from the turbine to the compressorand from the compressor to the environment can introduceuncertainties. Considering the close correspondence of thesimulated total pressure ratio to the reference data as well asthe more severe discrepancy of the efficiency characteristicsat low circumferential speed the heat model is supposed to beanother significant uncertainty deteriorating the simulationresults for the compressor efficiency (see also Appendix B).
Gratis copy for Mehdi NakhjiriCopyright 2011 SAE International
E-mailing, copying and internet posting are prohibitedDownloaded Wednesday, September 07, 2011 09:01:45 AM
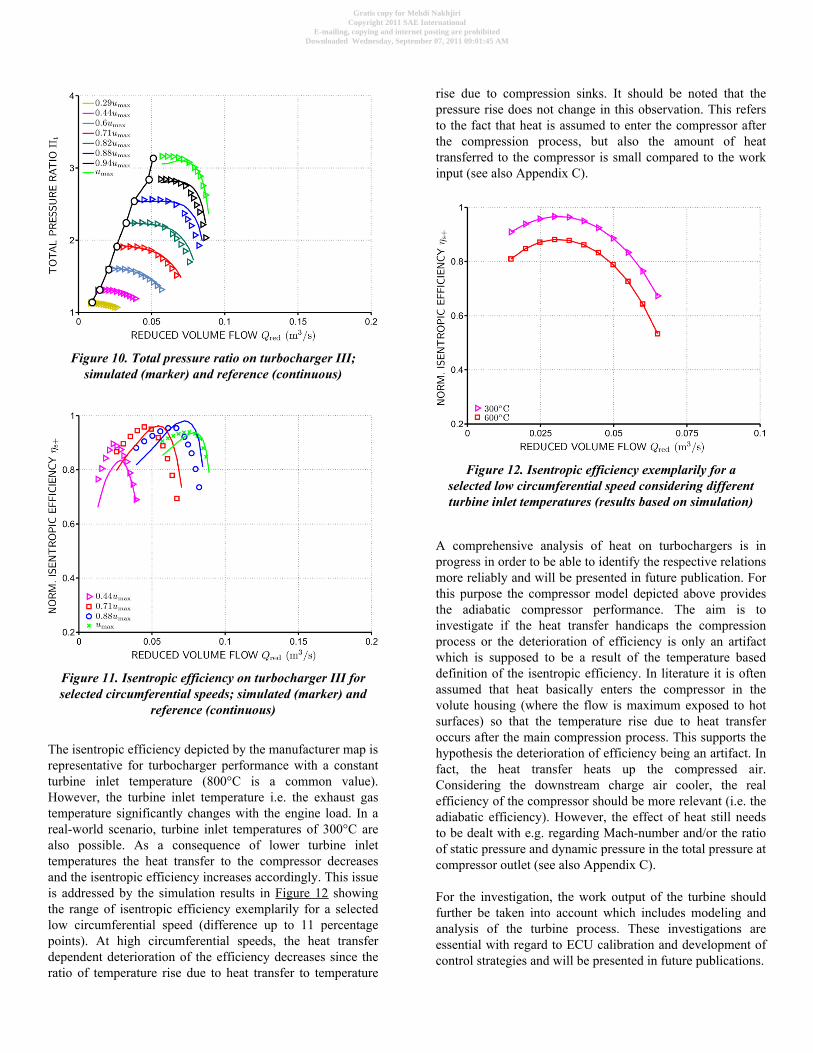
Figure 10. Total pressure ratio on turbocharger III;simulated (marker) and reference (continuous)
Figure 11. Isentropic efficiency on turbocharger III forselected circumferential speeds; simulated (marker) and
reference (continuous)
The isentropic efficiency depicted by the manufacturer map isrepresentative for turbocharger performance with a constantturbine inlet temperature (800°C is a common value).However, the turbine inlet temperature i.e. the exhaust gastemperature significantly changes with the engine load. In areal-world scenario, turbine inlet temperatures of 300°C arealso possible. As a consequence of lower turbine inlettemperatures the heat transfer to the compressor decreasesand the isentropic efficiency increases accordingly. This issueis addressed by the simulation results in Figure 12 showingthe range of isentropic efficiency exemplarily for a selectedlow circumferential speed (difference up to 11 percentagepoints). At high circumferential speeds, the heat transferdependent deterioration of the efficiency decreases since theratio of temperature rise due to heat transfer to temperature
rise due to compression sinks. It should be noted that thepressure rise does not change in this observation. This refersto the fact that heat is assumed to enter the compressor afterthe compression process, but also the amount of heattransferred to the compressor is small compared to the workinput (see also Appendix C).
Figure 12. Isentropic efficiency exemplarily for aselected low circumferential speed considering differentturbine inlet temperatures (results based on simulation)
A comprehensive analysis of heat on turbochargers is inprogress in order to be able to identify the respective relationsmore reliably and will be presented in future publication. Forthis purpose the compressor model depicted above providesthe adiabatic compressor performance. The aim is toinvestigate if the heat transfer handicaps the compressionprocess or the deterioration of efficiency is only an artifactwhich is supposed to be a result of the temperature baseddefinition of the isentropic efficiency. In literature it is oftenassumed that heat basically enters the compressor in thevolute housing (where the flow is maximum exposed to hotsurfaces) so that the temperature rise due to heat transferoccurs after the main compression process. This supports thehypothesis the deterioration of efficiency being an artifact. Infact, the heat transfer heats up the compressed air.Considering the downstream charge air cooler, the realefficiency of the compressor should be more relevant (i.e. theadiabatic efficiency). However, the effect of heat still needsto be dealt with e.g. regarding Mach-number and/or the ratioof static pressure and dynamic pressure in the total pressure atcompressor outlet (see also Appendix C).
For the investigation, the work output of the turbine shouldfurther be taken into account which includes modeling andanalysis of the turbine process. These investigations areessential with regard to ECU calibration and development ofcontrol strategies and will be presented in future publications.
Gratis copy for Mehdi NakhjiriCopyright 2011 SAE International
E-mailing, copying and internet posting are prohibitedDownloaded Wednesday, September 07, 2011 09:01:45 AM

CONCLUSIONIn this paper a physical modeling approach is introduced inorder to identify the steady state performance of a radialcompressor (with regard to pressure rise, pressure losses aswell as isentropic efficiency). The zero-dimensional approachneeds a small number of geometry parameters and materialparameters. Simplicity is a demand regarding computationcosts. For simulation the geometry, the thermodynamic stateof the inlet air and the turbocharger speed are assumed to beknown. Different loss mechanisms are devised usinganalytical and semi-empirical loss correlations, as well as amodel for the exchange of heat. The compressor model canbe applied to different automotive turbochargers without anyindividual adaptation of loss correlations (i.e. withoutparameter variation) which is a requirement placed on themodel. From the point of view of validation simulationresults are compared with measured manufacturer maps. Thevalidation procedure with manufacturer maps is relevantregarding ECU calibration which is generally carried out onthe basis of manufacturer maps. The results of total pressureratio exhibit large consensus with the reference data. Thesimulated isentropic efficiency shows also good agreement,however a lower level of confidence is achieved. This isreferred to the simple loss models like incidence on the onehand and the insufficient heat model on the other hand.Further, it has been shown that the isentropic efficiencyincreases with decreasing turbine inlet temperature while thepressure ratio does not change. Considering the deteriorationof efficiency due to heat being an artifact, the adiabaticefficiency should be indicated as the real efficiency of thecompressor. This issue revalues the simulation results of thecompressor model at low speed. The compressor modeloriginally determines the adiabatic efficiency which iscorrected for a non-adiabatic process using a heat model inorder to achieve comparability with manufacturer maps. As aconsequence, manufacturer efficiency maps should not beused as reference data for ECU calibration at low speed. Thishypothesis will be substantiated with adequate experimentaldata in future publication.
REFERENCESBammert, K. and Fiedler, K. (1966), “Hinterkanten- undReibungsverlust in Turbinenschaufelgittern”, Forschung imIngenieurwesen, Vol. 32, VDI-Duesseldorf, pp.14-18.Bohn, D., Heuer, T. and Kusterer, K. (2003), “ConjugateFlow and Heat Transfer Investigation of a Turbocharger:Part I: Numerical Results”, Proceedings of ASME TurboExpo 2003, GT2003-38445.Dean, R. C. (1975), “The Fluid Dynamic Design of AdvancedCentrifugal Compressors”, Hanover/New Hampshire, CreareTech. Note 185.Denton, J. D. (1993), Loss Mechanisms in Turbomachines,Journal of Turbomachinery, Vol. 115, Cambridge, pp.621-656.
Eck, B. (2002), Ventilatoren, Springer, Berlin.
Eckert, B. and Schnell, E. (1980), Axial- undRadialkompressoren, Springer, Berlin.
Japikse, D. (1982), “Advanced Diffusion Levels inTurbocharger Compressors and Component Matching”,IMechE Proceeding of the first International Conference onTurbocharging and Turbochargers, London.
Pfleiderer, C. and Petermann, H. (2004),Strömungsmaschinen, Springer, Berlin.
Rodgers, C. (1978), “A Diffusion Factor Correlation forCentrifugal Impeller Stalling”, ASME-Paper 78-GT-61.
Shapiro, A. H. (1954), The Dynamics and Thermodynamicsof Compressible Fluid Flow, The Ronald Press Company,New York.
Spurk, J. H. and Aksel, N. (2008), Fluid Mechanics,Springer, Berlin.
Stonjek, S. (2008), Modeling of the Compressor of aTurbocharger, Technische Universität Darmstadt, DiplomaThesis, Darmstadt.
Thesing, J., Bergmann, D., Galanulis, K. and Winter, D.(1999), “Qualitätssicherung und 3D-Digitalisierung mitPhotogrammetrie und Streifenprojektion”, VDI/VDEFachtagung Optische Formerfassung, Berichtsband 70, ISBN3-931381-030-7, pp.63-71.
Traupel, W. (1977), Thermische Turbomaschinen, Springer,Berlin.
Van den Braembussche, R. A. (2006), “Flow and LossMechanisms in Volutes of Centrifugal Pumps”, EducationalNotes RTO-EN-AVT-143, Paper 12.
Weber, R. C. and Koronowski, M. E. (1986), “MeanlinePerformance Prediction of Volutes in CentrifugalCompressors”, ASME-Paper 86-GT-216.
CONTACT INFORMATIONDipl.-Ing. Mehdi NakhjiriChair of Fluid Systems TechnologyTechnische Universität DarmstadtDarmstadt, [email protected]
Prof. Dr.-Ing. Peter F. PelzChair of Fluid Systems TechnologyTechnische Universität DarmstadtDarmstadt, [email protected]
Gratis copy for Mehdi NakhjiriCopyright 2011 SAE International
E-mailing, copying and internet posting are prohibitedDownloaded Wednesday, September 07, 2011 09:01:45 AM

ACKNOWLEDGMENTSThe authors would like to thank the IAV GmbH for financialand technical support and for granting the publication ofconfidential information.
DEFINITIONS/ABBREVIATIONSNomenclatureA
Area
BWidth
cAbsolute velocity
D/DhDiameter; / Hydraulic diameter
fArbitrary function
hSpecific enthalpy
HChannel width
LLenght
MTorque
MaMach number
mMass flow rate
nNumber of blades
pPressure
qSpecific heat
QVolume flow rate
RIdeal gas constant
sSpecific entropy
SAverage gap
tBlade pitch
TTemperature / Blade thickness
vSpecific volume
wRelative velocity / Specific work
ZConstant
Greek symbolsβ
Relative angle
εAttenuation factor
ζLoss coefficient
ηIsentropic efficiency
γIsentropic exponent
Gratis copy for Mehdi NakhjiriCopyright 2011 SAE International
E-mailing, copying and internet posting are prohibitedDownloaded Wednesday, September 07, 2011 09:01:45 AM

λFriction factor / Power coefficient
µSlip factor
ρDensity
ΠPressure ratio
ϕAngle
φFlow coefficient
ΩRotational speed
Subscripts+
Normalized value
effEffective
geoGeometric
iInlet of a component
oOutlet of a component
optOptimal
rRadial component
redReduced
refReference condition
sIsentropic state
tTotal value
uCircumferential component
Gratis copy for Mehdi NakhjiriCopyright 2011 SAE International
E-mailing, copying and internet posting are prohibitedDownloaded Wednesday, September 07, 2011 09:01:45 AM

APPENDIXA - STEREOSCOPIC SURVEY OFGEOMETRYExemplary results of the stereoscopic survey of theturbocharger geometry are illustrated in the following.(Thesing, 1999) delivers more detailed insight into theapproach. Lack of CAD-data is a typical scenario forcalibration engineers. However, accurate geometryinformation is necessary for simulation and can be providedstereoscopically. Suppliers of optical systems provide toolswhich enable to insert centric, parallel or perpendicular linesand surfaces to determine different dimensions as shown inFigure 13 for the Characteristic Diameter of the volute at theoutlet (referring to mean streamline and rotor center). Further,Figure 14 exhibits exemplarily the inlet blade angle of therotor.
Figure 13. Stereoscopic survey of the compressor volutehousing
Figure 14. Stereoscopic survey of the compressor rotor
In the following a list of geometry parameters are providedwhich are applied in the model:
Table 2. Geometry parameters applied in the model
Gratis copy for Mehdi NakhjiriCopyright 2011 SAE International
E-mailing, copying and internet posting are prohibitedDownloaded Wednesday, September 07, 2011 09:01:45 AM

B - HEAT MODEL UNCERTAINTYThe used heat model does not yield sufficient results for allturbocharger types. The heat model improves the efficiencyresults for turbochargers I and III in a certain extent. Thedifference at low speed remains. In case of turbocharger IIthe heat model falsifies the efficiency characteristics almostin the entire speed range. Figure 15 shows the isentropicefficiency of turbocharger II considering an adiabaticprocess,. Compared to Figure 9 the adiabatic characteristicshere show better agreement to the reference data. In Figure 9the efficiencies are of a higher level. The reason is that theheat model outputs negative heat (i.e. heat transfer from thecompressor to the environment) which decreases the airtemperature at compressor outlet. This occurs already at0.44umax. As a result of this the efficiency increases. Hence,the heat model cannot sufficiently describe the heat transferon turbocharger II so that the simulated adiabatic efficiencybetter corresponds to the non-adiabatic reference data, yet.
Figure 15. Isentropic efficiency on turbocharger II forselected circumferential speeds considering an adiabaticprocess; simulated (marker) and reference (continuous)
Gratis copy for Mehdi NakhjiriCopyright 2011 SAE International
E-mailing, copying and internet posting are prohibitedDownloaded Wednesday, September 07, 2011 09:01:45 AM

C - HEAT AND EXERGYHeat is energy. Considering Equation 2, the question arises ifthe heat transferred to the compressor can also carry outuseful work. The second law of thermodynamics, however,introduces that heat always inserts entropy into the system.Though, a fractional amount of heat increases the workingcapacity of the gas, i.e. exergy. For a preliminary estimate,the exergy of the heat is evaluated as the maximum usefulwork possible.
(25)
By definition only a part of the heat can be transformed intoexergy which corresponds to the fractional amount
( ). Hereby Tatm is the ambient temperature while T*is the temperature of the heat reservoir. For a roughcalculation T* is set to turbine inlet temperature. Thus, exergyis overestimated since the more proper source of heat wouldbe the bearing housing or the compressor back face. As aresult, it is assumed that the exergy is at least overestimatedover 30%. Moreover, exergy loss i.e. entropy generation dueto non-ideal process is not considered which again leads tooverestimation.
In Figure 16 the exergy is normalized by and plottedagainst reduced volume flow. The exergy ratio is higher atlow speed where the work input is small.
Figure 16. Exergy estimate on the compressor due totransferred heat
The conclusion is that heat increases the working capacity ofthe air in/after the compression process. The evaluated exergyratio does not exceed 10%. It is object of inquiry what theincreased working capacity, especially at low speed, means tothe compressor which is a work machine (contrary to theturbine). Effects on the Mach-number and/or the ratio ofstatic and dynamic pressure in the total pressure atcompressor outlet are possible.
The Engineering Meetings Board has approved this paper for publication. It hassuccessfully completed SAE's peer review process under the supervision of the sessionorganizer. This process requires a minimum of three (3) reviews by industry experts.
All rights reserved. No part of this publication may be reproduced, stored in aretrieval system, or transmitted, in any form or by any means, electronic, mechanical,photocopying, recording, or otherwise, without the prior written permission of SAE.
ISSN 0148-7191
Positions and opinions advanced in this paper are those of the author(s) and notnecessarily those of SAE. The author is solely responsible for the content of the paper.
SAE Customer Service:Tel: 877-606-7323 (inside USA and Canada)Tel: 724-776-4970 (outside USA)Fax: 724-776-0790Email: [email protected] Web Address: http://www.sae.orgPrinted in USA
Gratis copy for Mehdi NakhjiriCopyright 2011 SAE International
E-mailing, copying and internet posting are prohibitedDownloaded Wednesday, September 07, 2011 09:01:45 AM