COMPRESSION HEAT PUMPS IN ITALY
79
COMPRESSION HEAT PUMPS IN ITALY MARKET – APPLICATIONS – FUTURE DEVELOPMENTS Carmine Casale Aicarr, Refrigeration Committee CoAer, HP Italian Group – Marketing
Transcript of COMPRESSION HEAT PUMPS IN ITALY

COMPRESSION HEAT PUMPS IN ITALYMARKET – APPLICATIONS – FUTURE DEVELOPMENTS
Carmine Casale
Aicarr, Refrigeration Committee
CoAer, HP Italian Group – Marketing

Summary:• Scope
• Aicarr and CoAer – who we are
• HP sectors and common applications in Italy
• 2008 A/C Industry and compression HPs
• Compression HPs – an energy overview
– Air-to-Air
– Air-to-Water
– Water-to Water
• HPs for all-year comfort and energy savings
• conclusions
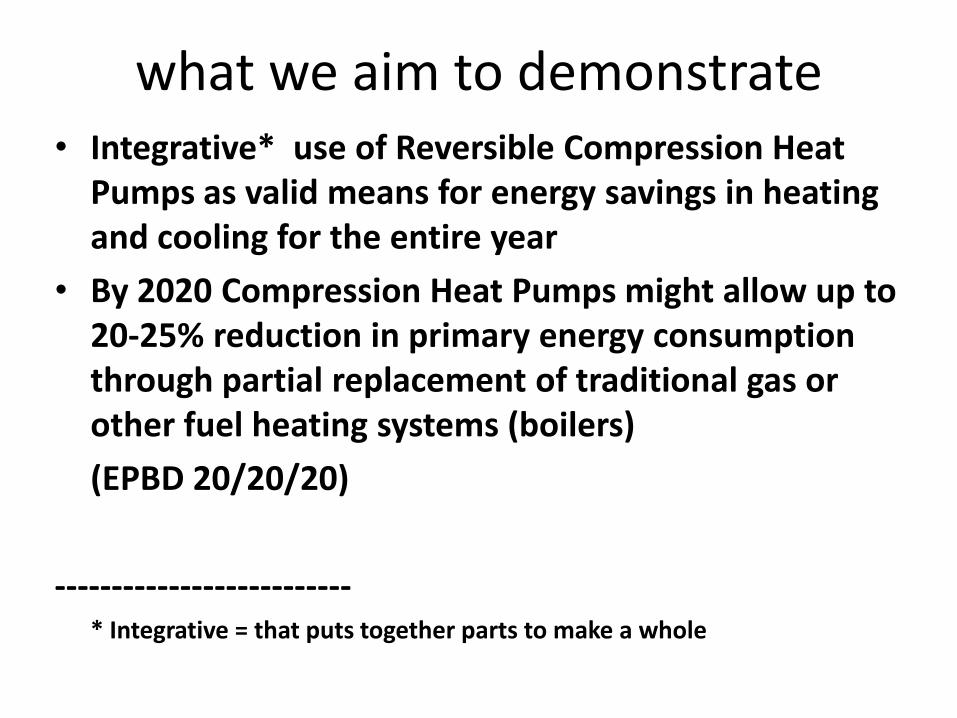
what we aim to demonstrate• Integrative* use of Reversible Compression Heat
Pumps as valid means for energy savings in heating and cooling for the entire year
• By 2020 Compression Heat Pumps might allow up to 20-25% reduction in primary energy consumption through partial replacement of traditional gas or other fuel heating systems (boilers)
(EPBD 20/20/20)
--------------------------* Integrative = that puts together parts to make a whole
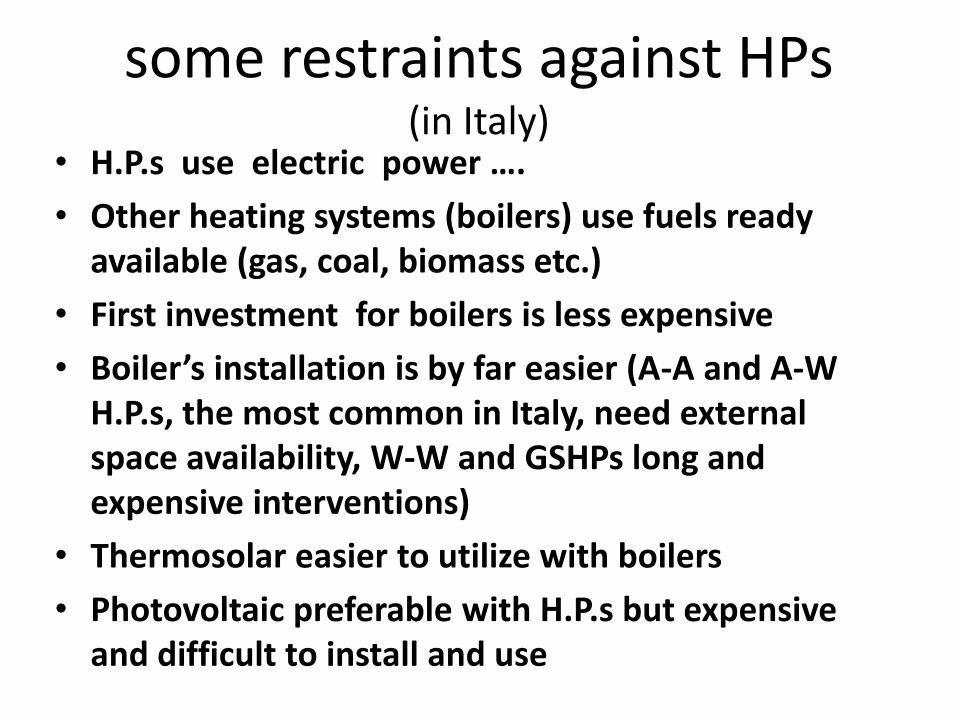
some restraints against HPs(in Italy)
• H.P.s use electric power ….
• Other heating systems (boilers) use fuels ready available (gas, coal, biomass etc.)
• First investment for boilers is less expensive
• Boiler’s installation is by far easier (A-A and A-W H.P.s, the most common in Italy, need external space availability, W-W and GSHPs long and expensive interventions)
• Thermosolar easier to utilize with boilers
• Photovoltaic preferable with H.P.s but expensive and difficult to install and use

AiCARR and CoAer

ASSOCIAZIONE ITALIANA CONDIZIONAMENTO DELL’ARIA, RISCALDAMENTO, REFRIGERAZIONE
• Aicarr is the Italian Association of HVAC&REngineers
• is a cultural society with the objective ofachieving a sustainable comfort through– better environment
– energy savings and
– conscious use of energy resources

• more than 2600 members
– professionals
– designers of equipment and systems
– researchers
– academy
– students

• 1 international convention
• 6 annual congresses
• technical visits and meetings
• HVAC school of excellence
• association’s monthly journal, CDA
• technical books – Collana Aicarr

COSTRUTTORI APPARECCHIATURE E IMPIANTI AERAULICI
• Co.Aer is the Italian Association of HVAC Manufacturers (compression technology)
• 60 associate manufacturers
• represents over 90% of the Italian manufacturing capacity
• federated in ANIMA

• 8 technical working groups– Fans
– Air pollution control systems
– A/C equipment and terminal units
– Liquid chillers
– Self-contained air conditioners
– Air handling units
– Heat exchangers
– Cooling towers

• direct participation to prominent exhibitions
• annual survey and statistics of production, domestic sales, export and import
• participation and contribution to domestic and international standards
• technical overviews and assistance

GRUPPO ITALIANO POMPE DI CALORE, GIPC
• GIPC is a group of manufacturers for the advancement and diffusion of Heat Pumps in Italy including their “annual” utilization
• communications and learning committes
• white book and literature for the diffusion of HPs (download www.pompedicalore.org)
• actions to influence standards and legislation

HP sectors and common applications in Italy

HEAT PUMPS APPLICATION SECTORS
• RESIDENTIAL (AND LIGHT COMMERCIAL)
SPACES INDIVIDUALLY AIR CONDITIONED
– HOMES RESIDENCE – SINGLE ROOM
– SMALL OFFICES –
– SMALL SHOPS – SHOW ROOMS
• INDIVIDUAL AIR CONDITIONERS
• MOSTLY SINGLE SPLIT SYSTEMS
• ALSO MULTI-SPLIT

HEAT PUMPS APPLICATION SECTORS
• COMMERCIAL (institutional and tertiary)
SPACES SIMULTANEOUSLY AIR CONDITIONED
– OFFICE BUILDINGS (institution and private firms)
– HOTELS
– HOSPITALS – NURSING HOMES - RESIDENCE
– LARGE OFFICES IN PRIVATE HOUSES
• CENTRALIZED AIR CONDITIONING SYSTYEMS
• VARIABLE REFRIGERANT FLOW SYSTEMS

HEAT PUMPS APPLICATION SECTORS
• BOTH RLC AND CML APPLICATIONS HAVE SEPARATE SOURCES FOR HEATING AND COOLING
• INDIVIDUAL HOMES OR APARTMENT ROOMS HAVE A RAC AND (USUALLY CENTRALIZED) BOILER FOR HEATING AND DHW
• LARGE BUILDINGS USUALLY HAVE CENTRAL A/C SYSTEM AND SEPARATE CENTRAL BOILER FOR HEATING AND DHW
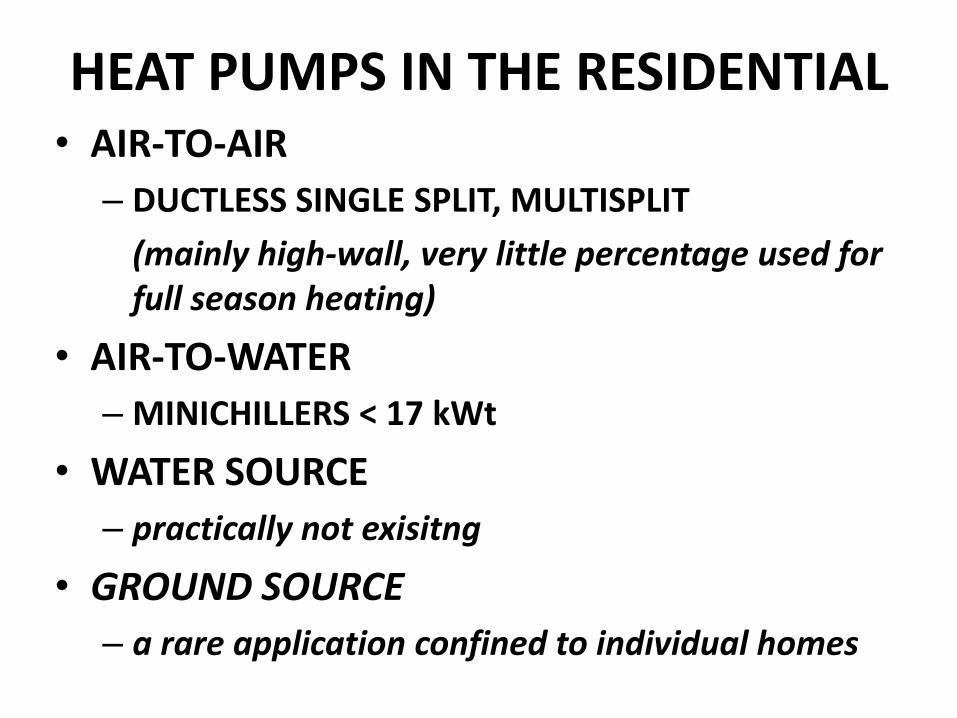
HEAT PUMPS IN THE RESIDENTIAL• AIR-TO-AIR
– DUCTLESS SINGLE SPLIT, MULTISPLIT
(mainly high-wall, very little percentage used for full season heating)
• AIR-TO-WATER
– MINICHILLERS < 17 kWt
• WATER SOURCE
– practically not exisitng
• GROUND SOURCE
– a rare application confined to individual homes

HEAT PUMPS IN THE TERTIARY• AIR-TO-AIR
– DUCTED SINGLE SPLIT, MULTISPLIT, ROOF-TOP, PACKAGED UNITS (mainly vertical split)
– VRF SYSTEMS (in very fast growht)
• AIR-TO-WATER
– MINICHILLERS > 17 kWt, CHILLERS
• WATER-TO-WATER (all types of waters)
– CHILLERS
• GROUND SOURCE
– an application in remarkable development

2008 A/C Industry and HPs

LRC SPLIT SYSTEMS (A-to-A)
96-98%

ROOF-TOP (A-to-A)

AIR COOLED CHILLERS (A-to-W)

WATER COOLED CHILLERS (W-to-W)

MARKET RLC DEALERS OPERATING WITH THEIR OWN BRAND
(participation to 2008 CoAer annual survey - 41)
• AERMEC ARTEL BALTUR BLUE BOX CARRIER CLIMAVENETA CLIVET DAEWOO DAIKIN DE' LONGHI EMMETI FAIR FINTERM GALLETTI FERROLI HAIER A/C HITACHI ITELCO LG McQUAY MERLONI MITSUBISHI ELECTRIC OLIMPIA SPLENDID ORIEME PANASONIC RHOSS RIELLO SAMSUNG SANYO /EUROPE SANYO/ ARGO CLIMA SAUNIER DUVAL TATA TERMAL THERMOCOLD TOSHIBA MULTICLIMA TOYO TOMI TRANE VALLAINT VORTICE
• Total over 100 brands operating in the market
MARKET DEALERS - ROOF-TOP AND PACG.D OPERATING WITH THEIR OWN BRAND
(participation to 2008 CoAer annual survey - 10)
• ACM KAELTE KLIMA BLUE BOX GROUP CLIMAVENETA CLIVET EMICON GALLETTI G.I.HOLDING ITELCO R.C. UNIFLAIR

MARKET DEALERS WATER CHILLERSOPERATING WITH THEIR OWN BRAND
(participation to 2008 CoAer annual survey - 27)
• A2B ACM AERMEC BALTUR BLUE BOX CARRIER CLIMAVENETA CLIVET DAIKIN EMICON EMMETI FINTERM GALLETTI G.I.HOLDING FERROLI IC ITELCO JOHNSON CONTROLS LAMBORGHINI OLOMPIA SPLENDID McQUAY MTA R.C. GROUP RHOSS RIELLO SABIANA SANYO/EUROPE SANYO/ARGOCLIMA SAUNIER DUVAL TATA TECNOCLIMA THERMOCOLD TRANE UNIFLAIR
HPs – a full scale energy overview

ITALY 2008PRIMARY ENERGY CONSUMPTION
FOR COMFORT COOLING AND HEATING
source: CoAer GIPC – White Book September 2008
1 TOE = 42 GJ = 11.63 MWh

ITALY 2008PRIMARY ENERGY CONSUMPTION
FOR COMFORT COOLING AND HEATING
RESIDENTIAL
1 TOE = 42 GJ = 11.63 MWh

ITALY 2008PRIMARY ENERGY CONSUMPTION
FOR COMFORT COOLING AND HEATING
COMMERCIAL (TERTIARY)
1 TOE = 42 GJ = 11.63 MWh

AIR-TO-AIR• DUCTLESS SPLIT (some multisplit)
– RANGE OF CAPACITY: 2 to 7 kWt
– AVERAGE WEIGHTED CAPACITY: 3,5 kWt
– HEATING USAGE : 8%
• DUCTED SINGLE SPLIT + MULTISPLIT
–RANGE OF CAPACITY: 4 to 18 kWt
–AVERAGE WEIGHTED CAPACITY: 7 kWt
–HEATING USAGE: 12%

DUCTLESS SINGLE SPLIT - HPs10 year sale hystory, units

DUCTLESS SINGLE SPLIT - HPs10 year sale hystory, MWt
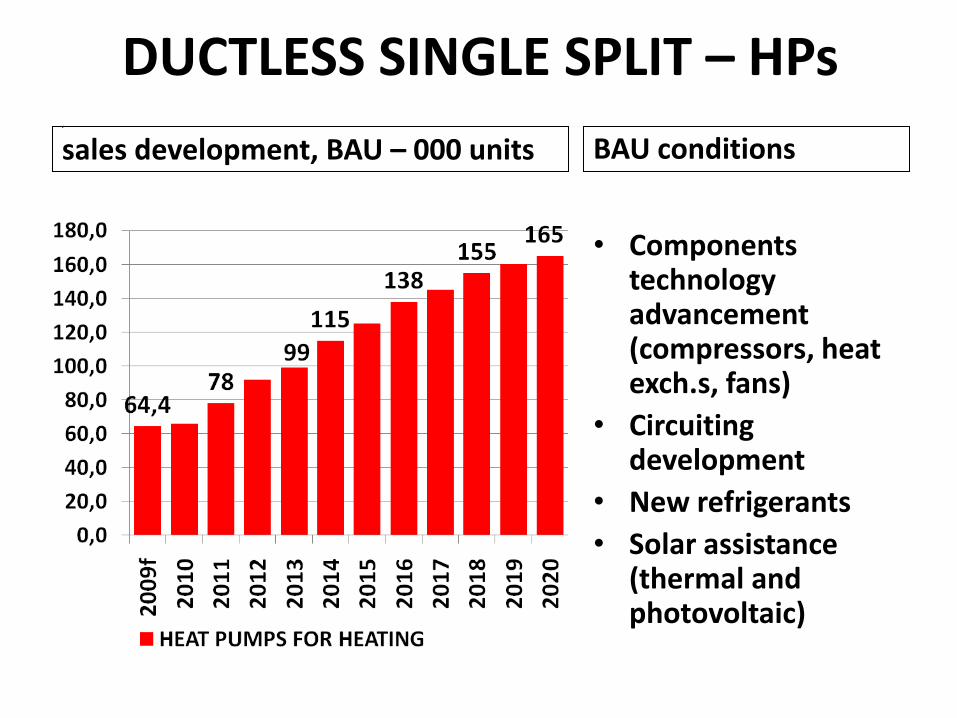
DUCTLESS SINGLE SPLIT – HPs ,
sales development, BAU – 000 units BAU conditions
• Componentstechnologyadvancement(compressors, heatexch.s, fans)
• Circuitingdevelopment
• New refrigerants
• Solar assistance(thermal and photovoltaic)

DUCTLESS SINGLE SPLIT – HPs ,
sales development, BAU – capacity MWt BAU conditions
• Componentstechnologyadvancement(compressors, heatexch.s, fans)
• Circuitingdevelopment
• New refrigerants
• Solar assistance(thermal and photovoltaic)

DUCTLESS SINGLE SPLIT – HPs
STOCK DEVELOPMENT, units STOCK DEVELOPMENT, MWt

DUCTED SINGLE SPLIT + MULTISPLIT10 year sale hystory, units

DUCTED SINGLE SPLIT + MULTISPLIT10 year sale hystory, MWt

DUCTED SINGLE SPLIT + MULTISPLIT,
sales development, BAU – 000 units BAU conditions
• Componentstechnologyadvancement(compressors, heatexch.s, fans)
• Circuitingdevelopment
• New refrigerants
• Solar assistance(thermal and photovoltaic)

DUCTED SINGLE SPLIT + MULTISPLIT,
sales development, BAU – capacity MWt BAU conditions
• Componentstechnologyadvancement(compressors, heatexch.s, fans)
• Circuitingdevelopment
• New refrigerants
• Solar assistance(thermal and photovoltaic)

DUCTED SINGLE SPLIT + MULTISPLIT
STOCK DEVELOPMENT, units STOCK DEVELOPMENT, MWt

AIR-TO-AIR
• ROOF TOP AND PACKAGED UNITS
–RANGE OF CAPACITY: 35 to 250 kWt
–AVERAGE WEIGHTED CAPACITY: 88 kWt
–HEATING USAGE: 75%

ROOF TOP and PACKAGED
10 years sales history, units 10 years sales history, MWt
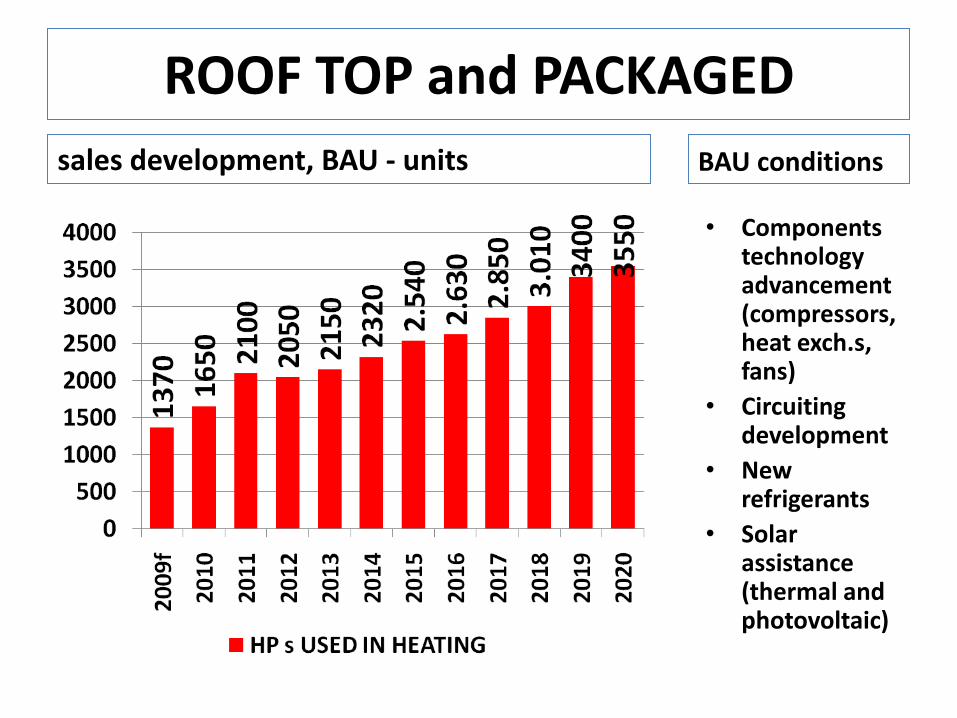
ROOF TOP and PACKAGED
sales development, BAU - units BAU conditions
• Componentstechnologyadvancement(compressors, heat exch.s, fans)
• Circuitingdevelopment
• New refrigerants
• Solarassistance(thermal and photovoltaic)

ROOF TOP and PACKAGED
sales development, BAU – capacity MWt BAU conditions
• Componentstechnologyadvancement(compressors, heat exch.s, fans)
• Circuitingdevelopment
• New refrigerants
• Solarassistance(thermal and photovoltaic)

ROOF TOP and PACKAGED
STOCK DEVELOPMENT, units STOCK DEVELOPMENT, MWt
AIR-TO-WATER
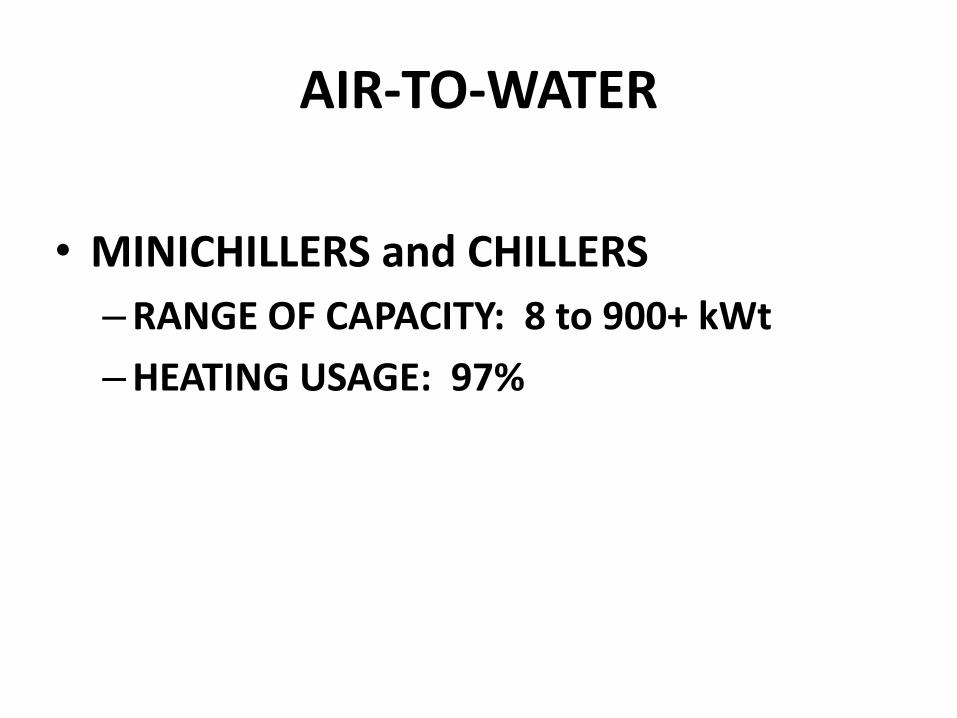
• MINICHILLERS and CHILLERS
–RANGE OF CAPACITY: 8 to 900+ kWt
–HEATING USAGE: 97%

MINICHILLERS AND CHILLERSWEIGHTED AVE CAPACITY
CLASS OF CAPACITY
• < 50 kWt
• 51 – 200 kWt
• 201 – 350 kWt
• 351 – 700 kWt
• > 700 kWt
WEIGHTED AVE CAPACITY
based on the quantity ofunits dispersed in each class
• 18 kWt
• 91 kWt
• 280 kWt
• 507 kWt
• 1120 kWt

A-W HP USED FOR HEATINGMinichillers and Chillers
UNITS < 50 kWt 51 - 200 201 - 350 351 - 700 > 700 kWt total
2000 6.951 1.137 255 93 25 8.425
2001 8.960 1.400 305 119 32 10.816
2002 8.825 1.448 305 118 32 10.728
2003 8.405 1.368 295 112 31 10.211
2004 9.045 1.448 310 121 33 10.993
2005 9.595 1.590 325 128 35 11.673
2006 10.980 1.799 365 147 40 13.330
2007 10.670 1.635 353 141 39 12.838
2008 9.785 1.646 278 132 37 11.878
2009f 9.650 1.540 270 129 35 11.624

A-W HP USED FOR HEATINGMinichillers and Chillers
MWt < 50 kWt 51 - 200 201 - 350 351 - 700 > 700 kWt total
2000 124 104 71 47 28 375
2001 161 127 85 60 36 471
2002 159 132 85 60 36 472
2003 151 124 83 57 34 450
2004 163 135 87 61 37 483
2005 173 145 91 65 39 513
2006 198 164 102 74 45 583
2007 192 149 99 72 43 554
2008 176 150 78 67 41 512
2009f 173 140 76 65 40 494

A-W HP USED FOR HEATINGMinichillers and Chillers
8425 10725 10995 13325 11878
7340 10815 10212 11675 12835

A-W HP USED FOR HEATINGMinichillers and Chillers
327 471 450 513 554
375 472 483 583 512

A-W HP DEVELOPMENT (BAU)MINICHILLERS AND CHILLERS < 50 kWt
units Capacity MWt

A-W HP DEVELOPMENT (BAU)CHILLERS 51 – 200 kWt
units Capacity MWt

A-W HP DEVELOPMENT (BAU)CHILLERS 201 - 350 kWt
units Capacity MWt

A-W HP DEVELOPMENT (BAU)CHILLERS 351 - 700 kWt
units Capacity MWt

A-W HP DEVELOPMENT (BAU)CHILLERS > 700 kWt
units Capacity MWt

W-W HP USED FOR HEATINGMinichillers and Chillers
UNITS < 50 kWt 51 - 200 201 - 350 351 - 700 > 700 kWt total
2000 417 72 8 5 5 507
2001 477 83 10 5 5 580
2002 470 82 10 5 7 574
2003 425 75 9 6 9 524
2004 467 81 10 5 7 569
2005 702 122 15 5 7 851
2006 667 115 14 5 7 808
2007 772 134 17 5 7 935
2008 792 137 17 5 7 958
2009f 802 135 18 6 9 970

W-W HP USED FOR HEATINGMinichillers and Chillers
MWt < 50 kWt 51 - 200 201 - 350 351 - 700 > 700 kWt total
2000 8 7 2 3 6 24
2001 9 8 3 3 6 27
2002 8 7 3 3 8 29
2003 8 7 3 3 10 30
2004 8 7 3 3 8 29
2005 13 11 4 3 8 38
2006 12 11 4 3 8 37
2007 14 12 5 3 8 41
2008 14 12 5 3 8 42
2009f 14 13 6 3 9 45

W-W HP USED FOR HEATINGMinichillers and Chillers
471 580 524 851 935
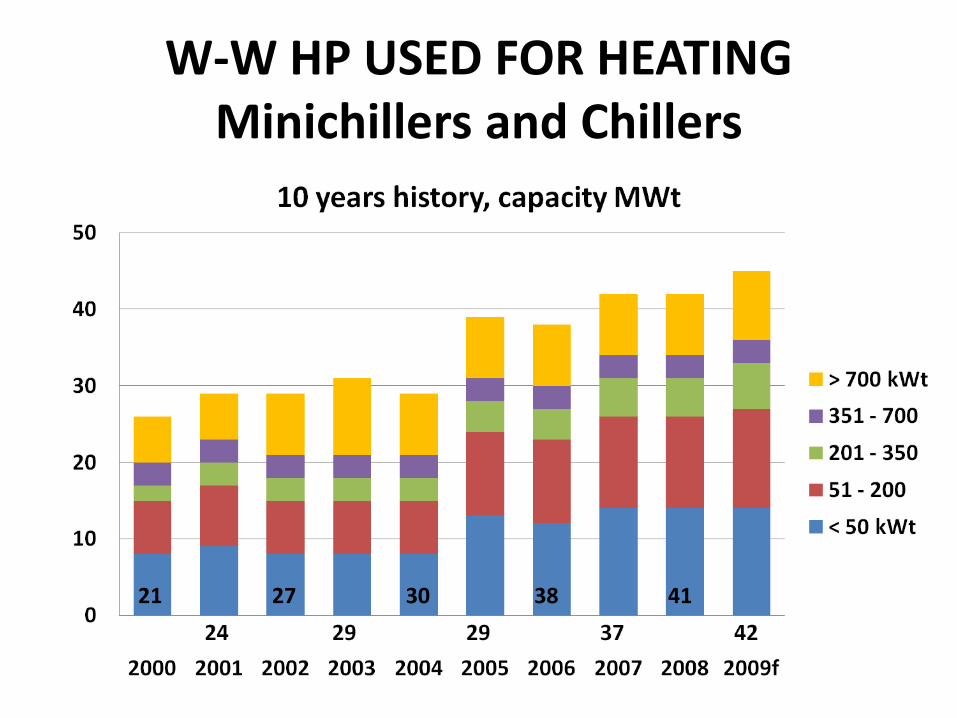
W-W HP USED FOR HEATINGMinichillers and Chillers
21 27 30 38 41

ALL CHILLERS – THERMAL CAPACITYSTOCK DEVELOPMENT, MWt

HPs IN HEATINGTOTAL STOCK CAPACITY, MWt
Boilers nominal capacity
estimated over
467.000 MWt

PRIMARY ENERGY CONSUMPTION
HPs - comfort all the year long
– an efficient tool to save energy

Starting data for 2005 energy situation
• From ENEA and CRESME: total Primary Consumption, stock of apartments
• From associations: stock of equipment (boilers, HP for integral heating, HPs cooling only)
• Unitary PE = total PE/n. of apartments
– For boilers UnPE * boiler eff. = UnSecondaryE
– For HPs UPE * HPCOP / 2.17 (power factor because electric consumption) = UnSeE
• If heating (and cooling) of apartments has been satisfied, it means that absorbed Secondary Energy = Load Demand

Reference year 2005REFERENCE YEAR 2005
Apartments
heated
continuously
19 000 000
Nu
mb
er
of
Ap
art
me
nts
To
tal P
rim
ary
En
erg
y
Co
ns
um
pti
on
Un
ita
ry P
rim
ary
En
erg
y
Co
ns
um
pti
on
Sys
tem
Eff
icie
nc
y
Un
ita
ry S
ec
on
da
ry
En
erg
y /
Lo
ad
De
ma
nd
To
tal L
oa
d
De
ma
nd
TOE TOE TOE TOE
by boilers 18 145 000 21 490 000 1.18 0.67 0.79 14 334 555
with integrated
HPs*
1 500 000 55 500 0.03 3/2,17** 0.04 50 431
TOTAL HEATING 21 545 600 14 384 981
HPs used for
cooling only
5 500 000 575 391 0.10 2.6/2.17** 0.12 678 363
TOTAL COOLING 575 391 678 363
TOTAL
CONSUMPTION
H + C
22 120 891 15 063 344
* HPs are used in special occasion to integrate heating requirement
** HPs not used in heating mode, but only used in cooling mode in summer.

Evoluation to 2020
• Cumulative apartments growth
250,000*15 (2005-2020)=3,750,000
• Apartments totally heated in 2020 = 18,145,000 + 3,750,000 = 21,895,000
• Increase of Cooling demand
11,000,000 apartments vs 5,500,000 with total 8 million individual units

Base situation – Load Demand for 2020
2020 SCENARIO – HEATING DEMANDtype of apartments
heated
apartments Unitary Load
Requirement
Total Load
Requirement
TOE TOE
Stock 2005
with integrated
HP
18 145 000
1 500 000
0.79
(traditional
boilers)
0.03
14 334 550
50 431
New apartments 3 750 000 0.55
(***boilers)
2 073 750
Total apartments 21 895 000
Total Load Requirements 16 458 731

Development at BAU conditions
• A little part of the old boilers (load d. 0.79) are replaced by three star boilers (0.55)
• All new buildings have three star boliers (0.55); a little part (2%) is repalaced by HPs for year round operation
• Additional 5,500,000 apartmenst have HPs operating in cooling mode in summer (11 million dwellings airconditioned)

Heating consumption detailsBAU CONDITIONS
HEATING
Apartments heated
continuously
21 895 000
Nu
mb
er
of
Ap
art
men
ts
Un
ita
ry S
eco
nd
ary
En
erg
y /
Lo
ad
De
ma
nd
To
tal L
oa
d D
em
an
d
To
tal P
rim
ary
En
erg
y
Co
ns
um
pti
on
Un
ita
ry P
rim
ary
En
erg
y C
on
su
mp
tio
n
TOE TOE TOE TOE
by boilers: 21 453 047
existing 17 778 047 0.79 14 105 481 0.95 16 889 145
New (***boilers) 3 675 000 0.55 2 021 250 0.65 2 388 750
total heating by
boilers
16 126 731 19 277 895
by HPs: 442 953
replacing boilers 266 823 0.79 210 000 0.75 200 484
refurbishments 103 797 0.79 82 000 0.46 47 451
new 72 333 0.55 40 000 0.32 22 907
total apartments 21 895 000
Total heating by
HPs
332 000 270 742
TOTAL HEATING 16 458 731 0.12 19 548 637

Cooling consumption and total H+CBAU CONDITIONS
COOLING
Nu
mb
er
of
Ap
art
me
nts
Un
ita
ry S
eco
nd
ary
En
erg
y /
Lo
ad
De
ma
nd
To
tal L
oa
d D
em
an
d
To
tal P
rim
ary
En
erg
y
Co
ns
um
pti
on
Un
ita
ry P
rim
ary
En
erg
y C
on
su
mp
tio
n
Apartments A/C as
of 2005
5 500 000
New apartments 5 500 000
Replacements 0.12 1 774 572 1 172 148
Retrofit 0.12 12 600 10 256
New 0.08 6 300 5 256
TOTAL COOLING 1 793 472 1 187 998
TOTAL HEATING
+ COOLING20 736 634

Development at BAT conditions
• 70% installations with condensation boilers
• 30% installations with HPs on year-round operation (50% in new buildings)

Heating consumption detailsBAT CONDITIONS
HEATING
Apartments heated
continuously
21 895 000
Nu
mb
er
of
Ap
art
me
nts
Un
ita
ry
Se
co
nd
ary
En
erg
y /
Lo
ad
Dem
an
d
To
tal L
oad
Dem
an
d
To
tal P
rim
ary
En
erg
y
Co
ns
um
pti
on
Un
ita
ry P
rim
ary
En
erg
y
Co
ns
um
pti
on
TOE TOE TOE TOE
by boilers: 14 678 000
old systems 3 603 000 0.79 2 864 370 0.90 3 242 700
existing 9 200 000 0.79 7 268 000 0.80 7 360 000
new 1 875 000 0.55* 1 050 000 0.57 1 068 750
total heating by
boilers
11 164 370 11 671 450
by HPs: 7 263 910
replacing boilers 2 763 910 0.79 210 000 0.75 200 484
refurbishments 2 625 000 0.79 82 000 0.46 47 451
new 1 875 000 0.55* 40 000 0.32 22 907
total apartments 21 895 000
Total heating by
HPs
2 294 114 3 195 739
TOTAL HEATING 16 458 731 0.12 14 867 189

Cooling consumption and total H+CBAT CONDITIONS
COOLING
Nu
mb
er
of
Ap
art
men
ts
Un
ita
ry
Se
co
nd
ary
En
erg
y /
Lo
ad
Dem
an
d
To
tal L
oad
Dem
an
d
To
tal P
rim
ary
En
erg
y
Co
ns
um
pti
on
Un
ita
ry P
rim
ary
En
erg
y
Co
ns
um
pti
on
Apartments A/C as
of 2005
5 500 000
New apartments 11 000 000
replacements 11 008 000 0.12 1 320 960 719 130
retrofit 2 625 000 0.12 315 000 239 983
new 3 750 008 0.08 157 500 119 577
TOTAL COOLING 1 793 462 1 087 690
TOTAL HEATING +
COOLING15 945 879
SAVINGS
BAU vs BAT
with annual AC
23%

a simple role of thumb
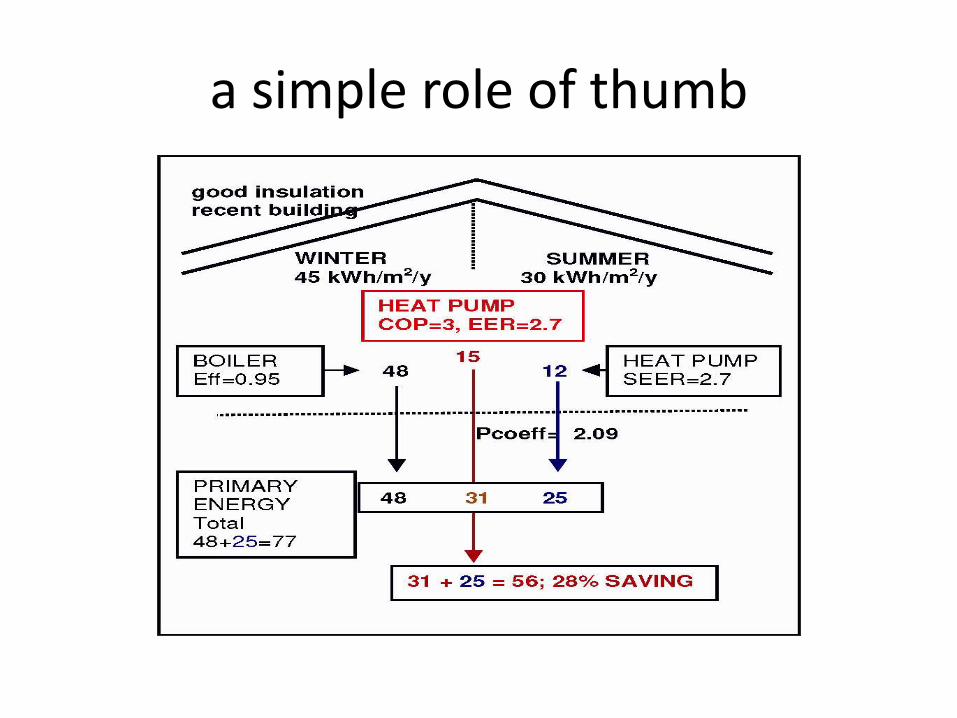
a simple role of thumb

conclusions

conclusions• Italy is a Mediterranean country where both
heating and cooling are requested with high seasonal demand
• The Italian cooling market has a rapid and unrestrainable development (unless forbidden by law)
• Two different systems, one for cooling and one for heating, are not sustainable
• There is a strategic problem regarding the cost of electric power in order to make HPs competitive in the LCA

Thank you for your attention
Carmine Casale
AICARR
CO.AER