Compression Distillation/Urine Processing Assembly (VCD ...
77
NASA/TM—1998–208539 August 1998 Final Report on Life Testing of the Vapor Compression Distillation/Urine Processing Assembly (VCD/UPA) at the Marshall Space Flight Center (1993 to 1997) P. Wieland, C. Hutchens, and D. Long Marshall Space Flight Center, Marshall Space Flight Center, Alabama B. Salyer Ion Electronics, Huntsville, Alabama
Transcript of Compression Distillation/Urine Processing Assembly (VCD ...

NASA/TM—1998–208539
August 1998
National Aeronautics andSpace AdministrationAT01SGeorge C. Marshall Space Flight CenterMarshall Space Flight Center, Alabama35812
Final Report on Life Testing of the VaporCompression Distillation/Urine ProcessingAssembly (VCD/UPA) at the MarshallSpace Flight Center (1993 to 1997)P. Wieland, C. Hutchens, and D. LongMarshall Space Flight Center, Marshall Space Flight Center, Alabama
B. SalyerIon Electronics, Huntsville, Alabama

Since its founding, NASA has been dedicated tothe advancement of aeronautics and spacescience. The NASA Scientific and TechnicalInformation (STI) Program Office plays a keypart in helping NASA maintain this importantrole.
The NASA STI Program Office is operated byLangley Research Center, the lead center forNASA’s scientific and technical information. TheNASA STI Program Office provides access to theNASA STI Database, the largest collection ofaeronautical and space science STI in the world. TheProgram Office is also NASA’s institutionalmechanism for disseminating the results of itsresearch and development activities. These resultsare published by NASA in the NASA STI ReportSeries, which includes the following report types:
• TECHNICAL PUBLICATION. Reports ofcompleted research or a major significant phaseof research that present the results of NASAprograms and include extensive data ortheoretical analysis. Includes compilations ofsignificant scientific and technical data andinformation deemed to be of continuing referencevalue. NASA’s counterpart of peer-reviewedformal professional papers but has less stringentlimitations on manuscript length and extent ofgraphic presentations.
• TECHNICAL MEMORANDUM. Scientific andtechnical findings that are preliminary or ofspecialized interest, e.g., quick release reports,working papers, and bibliographies that containminimal annotation. Does not contain extensiveanalysis.
• CONTRACTOR REPORT. Scientific andtechnical findings by NASA-sponsoredcontractors and grantees.
• CONFERENCE PUBLICATION. Collectedpapers from scientific and technical conferences,symposia, seminars, or other meetings sponsoredor cosponsored by NASA.
• SPECIAL PUBLICATION. Scientific, technical,or historical information from NASA programs,projects, and mission, often concerned withsubjects having substantial public interest.
• TECHNICAL TRANSLATION.English-language translations of foreign scientificand technical material pertinent to NASA’smission.
Specialized services that complement the STIProgram Office’s diverse offerings include creatingcustom thesauri, building customized databases,organizing and publishing research results…evenproviding videos.
For more information about the NASA STI ProgramOffice, see the following:
• Access the NASA STI Program Home Page athttp://www.sti.nasa.gov
• E-mail your question via the Internet [email protected]
• Fax your question to the NASA Access HelpDesk at (301) 621–0134
• Telephone the NASA Access Help Desk at (301)621–0390
• Write to:NASA Access Help DeskNASA Center for AeroSpace Information800 Elkridge Landing RoadLinthicum Heights, MD 21090–2934
The NASA STI Program Office…in Profile
i
NASA/TM—1998–208539
Final Report on Life Testing of the VaporCompression Distillation/Urine ProcessingAssembly (VCD/UPA) at the MarshallSpace Flight Center (1993 to 1997)
August 1998
National Aeronautics andSpace Administration
Marshall Space Flight Center
P. Wieland, C. Hutchens, and D. LongMarshall Space Flight Center, Marshall Space Flight Center, Alabama
B. SalyerIon Electronics, Huntsville, Alabama
ii
Available from:
NASA Center for AeroSpace Information National Technical Information Service800 Elkridge Landing Road 5285 Port Royal RoadLinthicum Heights, MD 21090–2934 Springfield, VA 22161(301) 621–0390 (703) 487–4650
iii
TABLE OF CONTENTS
1. INTRODUCTION AND BACKGROUND OF LIFE TESTING .......................................... 1
2. VCD/UPA PROCESS AND HARDWARE DESCRIPTION ................................................. 2
2.1 VCD Process ............................................................................................................. 2 2.2 Hardware Description and Similarity with the ISS UPA ........................................... 3
2.2.1 VCD Hardware ............................................................................................... 32.2.1.1 Wastewater Storage Assembly ......................................................... 52.2.1.2 Fluids Control Assembly ................................................................. 52.2.1.3 Fluids Pump Assembly .................................................................... 52.2.1.4 Distillation Assembly ....................................................................... 62.2.1.5 Recycle Filter Tank Assembly ......................................................... 72.2.1.6 Pressure Control Assembly .............................................................. 92.2.1.7 Purge Pump Assembly ..................................................................... 9
2.2.1.7.1 Harmonic Drive ........................................................... 102.2.1.8 Instrumentation and Monitoring ...................................................... 11
2.2.2 Flight-like Components.................................................................................... 11 2.3 Upgrades from Previous VCD’s................................................................................. 12
2.3.1 VCD–5 History ................................................................................................ 142.3.2 VCD–5A History .............................................................................................. 14
3. TEST FACILITY DESCRIPTION ......................................................................................... 16
4. TEST DESCRIPTION AND PERFORMANCE .................................................................... 18
4.1 Test Purpose ............................................................................................................... 18 4.2 Operating Procedures ................................................................................................. 18 4.3 Components Tested .................................................................................................... 18 4.4 VCD–5 Testing........................................................................................................... 18
4.4.1 VCD–5 Test Events and Anomalies ................................................................. 214.4.1.1 VCD-5 Troubleshooting .................................................................. 23
4.4.2 VCD–5 Performance During the WRT Stage 10 ............................................. 254.4.2.1 VCD-5 Operation During WRT Stage 10 ........................................ 25
4.4.2.1.1 Software/Firmware Changes ....................................... 274.4.2.1.2 Motor Speed Controller ............................................... 274.4.2.1.3 Vespel® Gear Replacement .......................................... 274.4.2.1.4 Calculation of the Percentage of Solids in the RFTA .. 274.4.2.1.5 High Temperatures and Pressures in the Still .............. 284.4.2.1.6 High Conductivity Alarms ........................................... 324.4.2.1.7 Purge Pump Failure ..................................................... 334.4.2.1.8 Recycle/Filter Tank...................................................... 34

iv
4.4.2.2 VCD–5 Performance........................................................................ 344.4.2.3 VCD–5 Product Water Quality ........................................................ 354.4.2.4 VCD–5 Conclusions and Recommendations from the
WRT Stage 10 ............................................................................... 36 4.5 VCD–5A Testing ........................................................................................................ 37
4.5.1 VCD–5A Test Events and Anomalies .............................................................. 424.5.2 VCD–5A Field Service .................................................................................... 454.5.3 VCD–5A Operation Summary ......................................................................... 524.5.4 Proposed Modifications ................................................................................... 52
5. TEST RESULTS AND LESSONS LEARNED...................................................................... 53
5.1 General Results and Lessons Learned ....................................................................... 53
5.1.1 Variation of Production Rate ............................................................................ 545.1.2 Wastewater Supply ........................................................................................... 555.1.3 Instrumentation and Valve Failures.................................................................. 555.1.4 High Conductivity of Product Water ................................................................ 555.1.5 Materials........................................................................................................... 555.1.6 Leakage ............................................................................................................ 565.1.7 Harmonic Drive Failure ................................................................................... 56
5.2 VCD–5 Test Results ................................................................................................... 565.2.1 Wastewater Supply Tank .................................................................................. 565.2.2 Fluids Pump ..................................................................................................... 565.2.3 Purge Pump ...................................................................................................... 565.2.4 Distillation Assembly ....................................................................................... 575.2.5 Recycle Filter Tank .......................................................................................... 575.2.6 Gas/Water Separator......................................................................................... 57
5.3 VCD–5A Test Results ................................................................................................ 585.3.1 Wastewater Supply Tank .................................................................................. 585.3.2 Fluids Pump ..................................................................................................... 585.3.3 Purge Pump ...................................................................................................... 585.3.4 Distillation Assembly ....................................................................................... 585.3.5 Recycle Filter Tank .......................................................................................... 595.3.6 Gas/Water Separator......................................................................................... 59
6. CONCLUSIONS AND RECOMMENDATIONS .................................................................. 60
6.1 Design ........................................................................................................................ 60 6.2 Quality Control .......................................................................................................... 60 6.3 Materials..................................................................................................................... 61 6.4 Operation .................................................................................................................... 61
7. REFERENCES AND BIBLIOGRAPHY ............................................................................... 62
7.1 References .................................................................................................................. 62 7.2 Bibliography............................................................................................................... 63
v
LIST OF FIGURES
1. Schematic of VCD process ....................................................................................................... 3
2. Photograph of the VCD–5 ........................................................................................................ 4
3. Photograph of the VCD–5A ..................................................................................................... 4
4. Schematic of VCD hardware and instrumentation ................................................................... 5
5. Peristaltic pump design concept and operation ........................................................................ 6
6. VCD distillation assembly schematic ....................................................................................... 7
7. VCD/UPA RFTA disassembled (showing single filter configuration) ..................................... 8
8. VCD/UPA filters (top: 25 µm pore size, bottom: 10 µm pore size) ......................................... 8
9. Purge pump design concept and connections ........................................................................... 9
10. Harmonic Drive ........................................................................................................................ 10
11. ECLS test facility at MSFC ...................................................................................................... 16
12. Schematic of the ECLS test facility at MSFC .......................................................................... 17
13. EEF urinal ................................................................................................................................. 17
14. Gantt chart of VCD–5 operation............................................................................................... 19
15. VCD–5 typical compressor temperature (T1) .......................................................................... 19
16. VCD–5 typical compressor motor current (I1) ......................................................................... 20
17. VCD–5 typical condenser pressure (P1) .................................................................................. 20
18. VCD–5 10 µm pore size filter used during WRT Stage 10 ...................................................... 28
19. VCD–5 compressor outlet temperature (WRT Stage 10 test days 11 and 12).......................... 29
20. VCD–5 condenser pressure (WRT Stage 10 test days 11 and 12) ............................................ 29
21. VCD–5 compressor outlet temperature (WRT Stage 10 test days 40 and 41) ......................... 30
22. VCD–5 condenser pressure (WRT Stage 10 test days 40 and 41) ........................................... 30
23. VCD–5 compressor outlet temperature (WRT Stage 10 test days 68 and 69) ......................... 31
24. VCD–5 condenser pressure (WRT Stage 10 test days 68 and 69) ........................................... 31
25. VCD–5 calculated condenser temperature (WRT Stage 10 test days 68 and 69) .................... 32
26. VCD–5 product water conductivity and pH ............................................................................ 33
27. VCD–5 product water production rate during WRT Stage 10.................................................. 35
28. VCD–5 product water carbon composition during WRT Stage 10 .......................................... 36
29. Gantt chart of VCD–5A operation ............................................................................................ 37
30. VCD–5A typical compressor temperatures (T1) ...................................................................... 38
31. VCD–5A typical motor current (I1) ......................................................................................... 38
vi
32. VCD–5A typical condenser pressures (P1) .............................................................................. 39
33. VCD–5A product water conductivity ....................................................................................... 39
34. VCD–5A 25 µm pore size recycle filter performance .............................................................. 42
35. Facility vacuum connection to the purge and fluids pumps ..................................................... 45
36. VCD–5A current, temperature, and pressure profiles in November 1995 ............................... 46
37. VCD–5A end plate showing light corrosion............................................................................. 47
38. VCD–5A distillation drum spokes showing light corrosion ..................................................... 47
39. VCD–5A wastewater injection tube and product water pickup tube....................................... 48
40. VCD–5A disassembly showing old compressor gears ............................................................. 49
41. VCD–5A compressor temperature (T1) after repairs in January 1996 ..................................... 50
42. VCD–5A compressor motor current (I1), condenser pressure (P1), and
compressor differential pressure (P2) after repairs in January 1996 ....................................... 51
LIST OF TABLES
1. History of the use of Harmonic Drives in VCD’s..................................................................... 11
2. Harmonic Drive operating history (as of May 25, 1993) ......................................................... 11
3. VCD–5 and VCD–5A instrumentation list ............................................................................... 12
4. VCD–5 and VCD–5A flight-like characteristics ...................................................................... 13
5. VCD–5 product water and brine compositions ........................................................................ 21
6. VCD–5 significant events and anomalies ................................................................................. 24
7. VCD–5 key events during WRT Stage 10 ................................................................................ 26
8. VCD–5 inputs and outputs during WRT Stage 10.................................................................... 26
9. VCD–5 recycle/filter tank cleaning/filter replacement during WRT Stage 10 ......................... 34
10. VCD–5 product water quality during WRT Stage 10 ............................................................... 36
11. VCD–5A product water and brine compositions ...................................................................... 40
12. VCD–5A wastewater processed between filter replacements .................................................. 41
13. Purge gas test wastewater processing ....................................................................................... 43
14. VCD–5A significant events and anomalies .............................................................................. 43
15. VCD component lifetimes ........................................................................................................ 53
16. Average processing rate calculations ........................................................................................ 54
LIST OF FIGURES (Continued)
vii
ABBREVIATIONS, ACRONYMS, AND DEFINITIONS
> leads to (as in “T1 high alarm > shutdown”)greater than (as in “K1 > 250 µmho/cm”)
< less than
A amperes of current
alarm (v.) Signifies that a sensor has entered an intolerable operating range and the VCD/UPAwill begin a transition to the shutdown mode automatically.
CHeCS Crew Health Care System
CL1 Sensor that provides information on the solids content of the brine.
Control/Monitor The electronic instrumentation that monitors and controls the subsystem. It consists Instrumentation of a signal conditioner, a controller, and a motor speed controller.
DA distillation assembly—The distillation assembly is a highly integrated mechanicalassembly that enables the evaporation of water from a flowing wastewater stream,provides condensation of water vapor to form product water, and provides liquid/vapor separation in microgravity. The DA consists of the DU, motor and drivecomponents, and ancillary components such as a heat exchanger, sensors, andconnectors.
dc direct current
DU distillation unit—The centrifuge component of the DA, including the compressor.
ECLS Environmental Control and Life Support
ECLSS Environmental Control and Life Support System
EEF End-use Equipment Facility—The room containing exercise equipment, washingfacilities, and a urinal for generating wastewater for processing.
EPROM Erasable Programmable Read Only Memory (computer firmware)
FCA fluids control assembly—The fluids control assembly manages and directs the flowsof waste feed, waste recycle, and product water.
FPA fluids pump assembly—Pumping of wastewater to the distillation assembly andpumping of both concentrated wastewater and product water from the distillationassembly is accomplished by a multipath, single motor fluids pump assembly.
Harmonic Drive the manufacturer of the fluids pump and purge pump drive mechanisms
hr hour(s)
in. inches
ISS International Space Station
ISS UPA VCD that will be used on board the USOS of the ISS

viii
K1 VCD–5 product water conductivity sensor
L1 liquid level sensor in the distillation unit
LSI Life Systems, Inc.—manufacturer of the VCD
µm micrometer or micron
µmho/cm measurement of water conductivity
min minute(s)
mm millimeters
N/A not available
Normal see Operating Modes
Norprene Material of the peristaltic pump tubing, a registered trademark of the NortonPerformance Plastics Corporation.
Operating Modes The four operating states of the VCD/UPA are:Normal—The VCD/UPA recovers water from wastewater.Standby—The VCD/UPA is waiting for sufficient pretreated urine and urinal flushwater to accumulate in the wastewater storage assembly before automaticallytransitioning to the normal mode.Unpowered—The VCD/UPA is unpowered and all sensors and actuators aredeenergized.Shutdown—The VCD/UPA is not receiving or recovering water, all actuators aredeenergized and all sensors are functioning.
PACRATS Payloads and Components Real-time Automated Test System—data acquisitionsystem used during the WRT Stage 10.
PCA pressure control assembly—The primary function of this component is toperiodically purge the distillation assembly of noncondensable gases that enter asdissolved or free gases with the wastewater feed. As noncondensable gases increasein the distillation assembly condenser, the pressure will increase. The pressurecontrol assembly monitors this pressure increase and enables the purge pumpassembly when a purge is, required. The purge pump assembly pumps thenoncondensable gas with steam to pressures above ambient. From there, thenoncondensable gas and steam condensate pass through a membrane gas/waterseparator where product water condensate is recovered from the noncondensable gasand routed back into the product water stream. The noncondensable gases arereleased to the atmosphere.
PDU performance display unit—An element of the test support accessories that simulatesthe higher level command interface to the ECLSS subsystem. It provides an interfaceto enable monitoring of the hardware performance and high level commands.
POST Predevelopment Operations Systems Test
Power Distribu- An element of the test support accessories that provides the interface between the tion and Control facility power and the subsystem.
Assembly

ix
PPA purge pump assembly—The purge pump assembly provides the pumping necessaryto purge noncondensable gases from the distillation assembly condenser toatmosphere.
Q1 sensor measuring the bellows position in the wastewater supply tank
RFTA recycle filter tank assembly—The accumulation and filtering of concentratedwastewater brine is performed in this assembly. In addition, it provides acontainment vessel for storing and transporting the concentrated brine during flighttank resupply.
rpm revolutions per minute
S4 still drum speed sensor
SCATS Systems and Components Automated Test System—computerized data collectionand monitoring system.
Shutdown see Operating Modes
Standby see Operating Modes
Test Support devices that simulate the interfaces to the VCDAccessories
TIC total inorganic carbon
TOC total organic carbon
Unpowered see Operating Modes
UP urine processor
UPA urine processing assembly
USOS United States on-orbit segment of the ISS
VCD/UPA vapor compression distillation/UPA
VCD–5 one of the VCD’s used for life testing (sometimes referred to as the VCD–V)
VCD–5A one of the VCD’s used for life testing (sometimes referred to as the VCD–VA)
Vdc Volts, direct current
Vespel the composition of one of the compressor gears, to provide lubrication, a registeredtrademark of the DuPont Company
warning (v.) signifies that a sensor has entered a range that indicates an unusual operatingcondition that may soon lead to an alarm condition
WP water processor
WRT water recovery test
WSA wastewater storage assembly—Storage of wastewater is performed by thiscomponent. By monitoring the quantity of wastewater in the storage tank, thisassembly will initiate automatic startups and shutdowns of the VCD.

1
TECHNICAL MEMORANDUM
FINAL REPORT ON LIFE TESTING OF THE VAPOR COMPRESSIONDISTILLATION/URINE PROCESSING ASSEMBLY (VCD/UPA)AT THE MARSHALL SPACE FLIGHT CENTER (1993 TO 1997)
1. INTRODUCTION AND BACKGROUND OF LIFE TESTING
Life testing of selected Environmental Control and Life Support System (ECLSS) equipmentbegan in 1992 after it was determined by Marshall Space Flight Center (MSFC) personnel that adequatelife testing was not being conducted by International Space Station (ISS) hardware developers. Testingof qualifiable hardware by Boeing (the prime contractor) would not precede its launch; therefore, itwould not be possible to determine design problems early enough to prevent ISS ECLSS startupdifficulties. Life testing enabled identification of design problems in time to improve the flighthardware. Specific objectives of the life test program were:
“1. To develop a knowledge base for design requirements and criteria which affect logistics andreliability.
2. To minimize hardware development risk by providing long-duration operational histories atspace station operating conditions and making the data obtained during the course of the testimmediately available to the prime contractor and its hardware vendors so that the flightdesign can take advantage of the lessons learned and make the appropriate design changes toensure a highly reliable ECLSS.
3. To determine specific component life characteristics and to understand their failuremechanisms for space station ECLSS hardware designs.”1
The purpose of the Vapor Compression Distillation/Urine Processing Assembly (VCD/UPA) lifetest was to provide for long duration operation of the VCD/UPA at normal ISS operating conditions todetermine the useful life of the hardware, specifically the flight-like components.2 The VCD design hasevolved considerably over the past 20 years. Since it was initially developed, improvements includechanges in the peristaltic fluids pump, improved sensors, modifying the shape of the distillationcentrifuge to a tapered drum, and improvements to the compressor. The materials have been upgraded towithstand the harsh environment inside the assembly, but long-term testing of a complete VCD/UPA(with flight-like components) to determine the life characteristics of mechanical components undersimulated on-orbit conditions had not been done. The VCD/UPA contains mechanical design featureswhich inherently have limited life, such as the peristaltic pumps. The life test was planned so that theVCD/UPA would be tested in the way that it will operate on orbit (with operation for a portion of eachday) rather than running continuously, as the manufacturer (Life Systems, Inc. (LSI)) had done duringprevious testing. The on/off operation presents a more severe condition for the mechanical componentsand, therefore, would reveal design problems not apparent during previous testing.
2
2. VCD/UPA PROCESS AND HARDWARE DESCRIPTION
The VCD/UPA is a phase-change water recovery technology which will reclaim water from urineand other ISS wastewaters. Two VCD/UPA’s were tested, designated the VCD–5 and VCD–5A. Theprocess and hardware are described below.
2.1 VCD Process
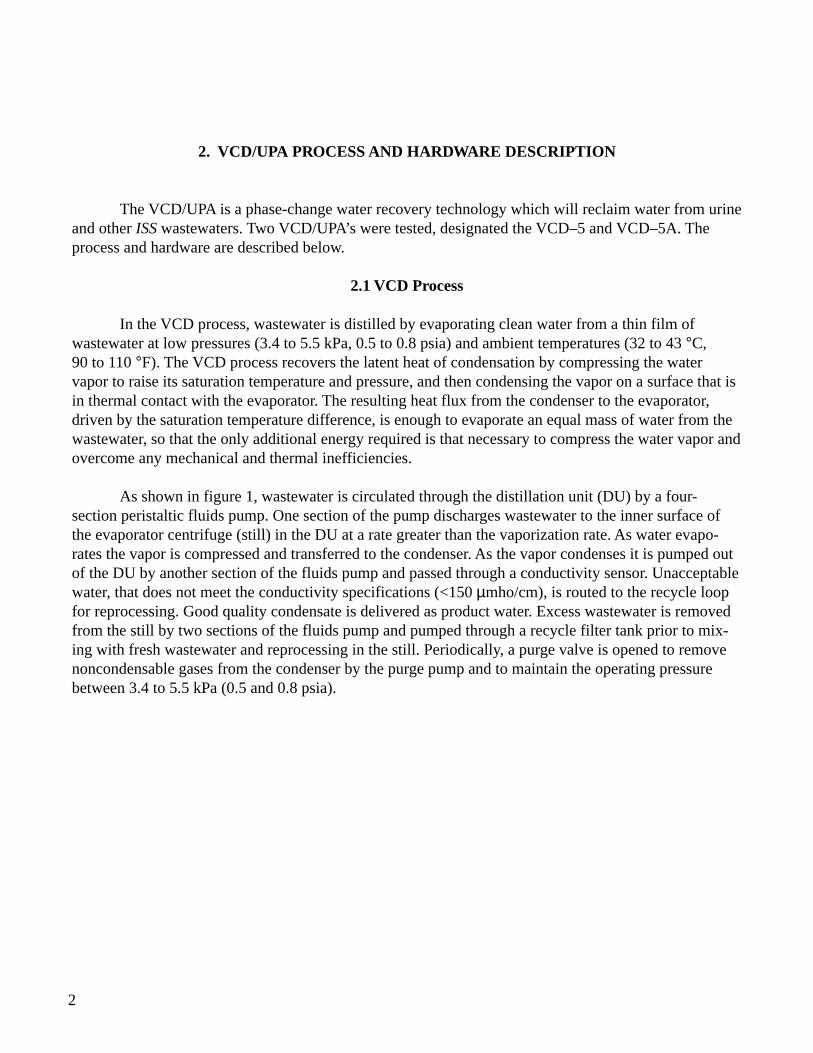
In the VCD process, wastewater is distilled by evaporating clean water from a thin film ofwastewater at low pressures (3.4 to 5.5 kPa, 0.5 to 0.8 psia) and ambient temperatures (32 to 43 °C,90 to 110 °F). The VCD process recovers the latent heat of condensation by compressing the watervapor to raise its saturation temperature and pressure, and then condensing the vapor on a surface that isin thermal contact with the evaporator. The resulting heat flux from the condenser to the evaporator,driven by the saturation temperature difference, is enough to evaporate an equal mass of water from thewastewater, so that the only additional energy required is that necessary to compress the water vapor andovercome any mechanical and thermal inefficiencies.
As shown in figure 1, wastewater is circulated through the distillation unit (DU) by a four-section peristaltic fluids pump. One section of the pump discharges wastewater to the inner surface ofthe evaporator centrifuge (still) in the DU at a rate greater than the vaporization rate. As water evapo-rates the vapor is compressed and transferred to the condenser. As the vapor condenses it is pumped outof the DU by another section of the fluids pump and passed through a conductivity sensor. Unacceptablewater, that does not meet the conductivity specifications (<150 µmho/cm), is routed to the recycle loopfor reprocessing. Good quality condensate is delivered as product water. Excess wastewater is removedfrom the still by two sections of the fluids pump and pumped through a recycle filter tank prior to mix-ing with fresh wastewater and reprocessing in the still. Periodically, a purge valve is opened to removenoncondensable gases from the condenser by the purge pump and to maintain the operating pressurebetween 3.4 to 5.5 kPa (0.5 and 0.8 psia).

3
Figure 1. Schematic of VCD process.
2.2 Hardware Description and Similarity With the ISS UPA
The design of the VCD–5 and VCD–5A hardware is described below and the degree of similarityto the flight VCD/UPA is identified for each component.
2.2.1 VCD Hardware
Photographs of the VCD–5 and VCD–5A are shown in figures 2 and 3. As shown schematicallyin figure 4, the VCD–5 and VCD–5A each consist of a wastewater storage assembly (WSA), a fluidscontrol assembly (FCA), a fluids pump assembly (FPA), a distillation assembly (DA), a recycle filtertank assembly (RFTA), a pressure control assembly (PCA), a purge pump assembly (PPA), and sensorsfor measuring conductivity, temperature, pressure, rotation speed, and electrical current level. Thesecomponents are described below.
RECYCLE FILTER TANK
DISTILLATION UNITMOTOR
PURGE PUMP
WATER SEPARATOR
HEAT EXCHANGER
FLUID PUMP
CONDUCTIVITY SENSOR
From Urinal
Wastewater Storage Tank
reprocess
coolant
c
purge gas to cabin
atmosphere
to Water Processor (via wastewater distribution line)
4
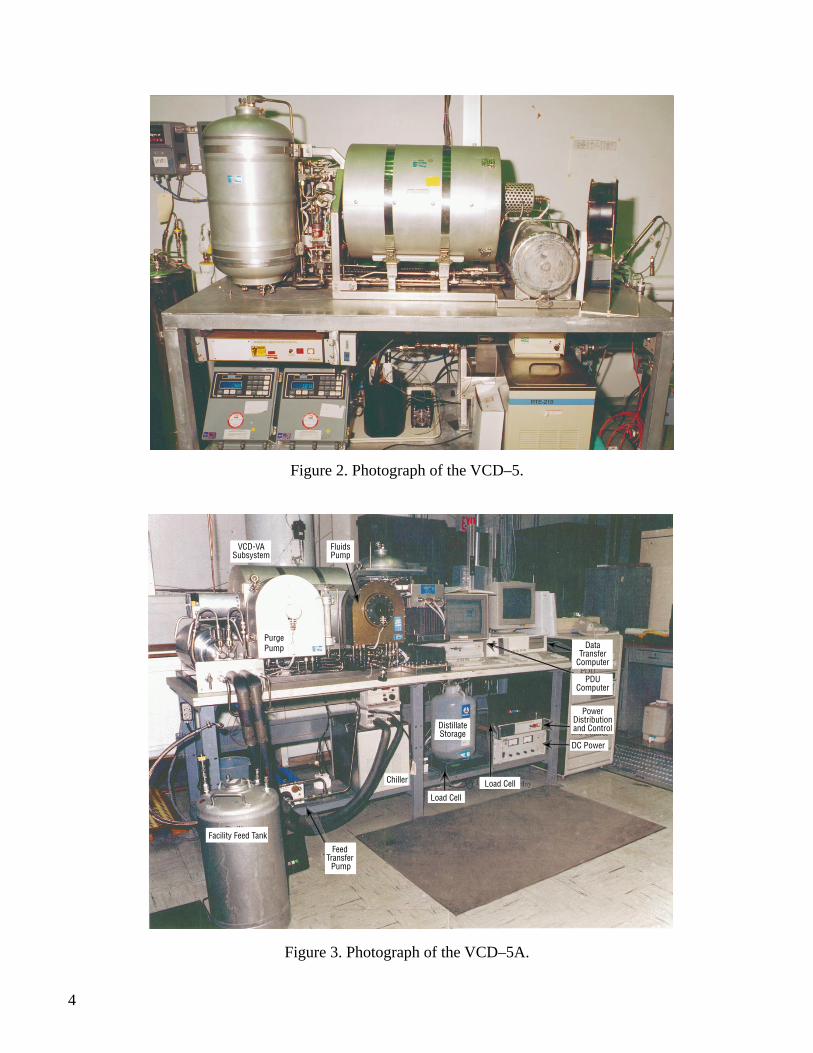
Figure 2. Photograph of the VCD–5.
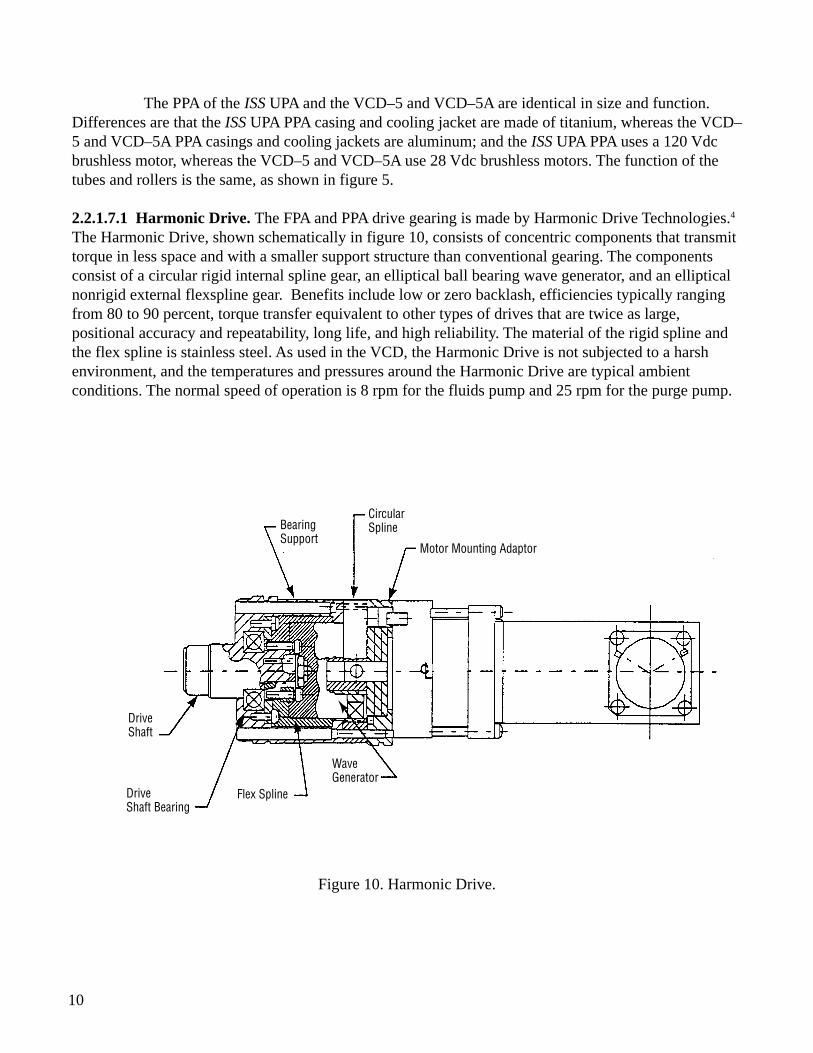
Figure 3. Photograph of the VCD–5A.
Facility Feed Tank
Feed Transfer Pump
Chiller
Load Cell
Load Cell
DC Power
Data Transfer
Computer
PDU Computer
Power Distribution and ControlDistillate
Storage
Purge Pump
Fluids Pump
VCD-VA Subsystem

5
Figure 4. Schematic of VCD hardware and instrumentation.
2.2.1.1 Wastewater Storage Assembly. The WSA includes a titanium bellows tank (TK1) inside a shellin which the quantity of liquid is measured by the position of the bellows. Wastewater stored in this tankreplenishes the wastewater loop as wastewater is injected into the still by the fluids pump. The WSA forthe ISS UPA is a single, integrated mechanical component which incorporates all of the discretecomponents that make up the WSA in the VCD–5 or VCD–5A. The WSA for the ISS UPA has a sealedshell which will act as a containment device if the bellows were to leak. The sealed shell can “breathe”through a doubly redundant Gore-Tex membrane.
2.2.1.2 Fluids Control Assembly. The FCA consists of piping and valves that direct the flow of waterinto and out of the DU, and provides an interface between the fluids pump and the recycle filter tank.The FCA also includes a conductivity sensor, which monitors the conductivity of the distillate, and avalve to direct the distillate to the product water outlet or to the recycle line for reprocessing. The FCAfor the ISS UPA is an integrated mechanical component which incorporates in one housing all of thediscrete components that make up the FCA in the VCD–5 or VCD–5A.
2.2.1.3 Fluids Pump Assembly. The FPA includes a four-section peristaltic fluids pump (PU1), asshown schematically in figures 1 and 4, which continually circulates wastewater through the evaporatorside of the DU (one section supplies wastewater and two sections remove excess wastewater) and therecycle filter tank, and removes the product water from the condenser side of the DU (one section).
T2M1 S1
HX1
Distillation Unit
Coolant In
Legend
Pressure Transducer
P
P
P
P
P
P
P
∆P
P
P
P
P
S
T
T
T
Water Separator
3 Way Valve
Temperature Sensor
Speed Sensor
Solenoid Valve
Pressure Regulator
Pump
Manual Valve
L Liquid Level Sensor
Flex Line
Cooling Coil
Conductivity SensorC
C
Check Valve
Relief Valve
S5
M2 S2
Fluids Control and Pump Assembly
W1 M4TK1
MV 4
Wastewater Storage Assembly
O1
MV3CV1
Pretreated Urine From Urine Collection System
P33
W1 M4
P31
CV2 CV3
P32
LF1MLF
RV2
P41
Recycle Filter Tank AssemblyMV1 TK2 MV2
Recycle Filter Tank
M4 W1 V2 CV4
Product Water
P43
P42
K1
WS1
Condenser Purge
P5
P2
Pressure Control and Pump Assembly
W2 V3
M3 S3 S6
PU2
PU1
LB1
LB
P12CV5
Coolant Out
Distillation AssemblyS4 S L L1 T1
P11
PR1
P13
RV1

6
Having two sections pumping water out of the DU ensures that the outlet capacity is always greater thanthe inlet rate, which avoids flooding the still. A motor drives the fluids pump at 8 rpm through aHarmonic Drive. The tubes of the pump are made of Norprene.
The FPA of the ISS UPA and the VCD–5 and VCD–5A are identical in size and function.Differences are that the ISS UPA FPA housing is made of titanium whereas the VCD–5 and VCD–5AFPA housings are aluminum, and the ISS UPA FPA uses a 120 volts, direct current (Vdc) brushlessmotor, whereas the VCD–5 and VCD–5A use 28-Vdc brushless motors. The major processing functionof the tubes and rollers is the same. Figure 5 shows schematically the design concept and operation of aperistaltic pump. The pump drive is described in section 2.2.1.7.1.
Figure 5. Peristaltic pump design concept and operation.
1
2
3
4
2.2.1.4 Distillation Assembly. The DA, shown schematically in figure 6, includes the DU, which is arotating drum centrifuge. The DU rotates at 185 rpm to spread the incoming wastewater into a thin filmfrom which water can evaporate easily at ambient temperature and reduced pressure (see also section2.1). The water vapor is transferred to the outside of the drum through a compressor, where it condensesas clean water. The DA of the ISS UPA and the VCD–5 and VCD–5A are identical in size and function.The only differences are that the ISS UPA DU is made of titanium, whereas the VCD–5 and VCD–5ADUs are stainless steel, the ISS UPA DA uses a 120 Vdc brushless motor, whereas the VCD–5 andVCD–5A use 28 Vdc brushless motors, and the ISS UPA demister is a nonmetallic membrane-type,whereas the VCD–5 and VCD–5A have steel wool-type demisters. The demister ensures that onlyvaporized water is drawn into the compressor by blocking any droplets of wastewater.

7
Figure 6. VCD distillation assembly schematic.
Rotating Demister Rotating Centrifuge Housing
Magnetic Drive
Distillation UnitMotor
Compressor
High Level Sensor
Evaporator Temp.Sensor
Product Out
EvaporatorPressure Tap
High Level Sensor andEvaporator Temp. Sensor
Recycle Out
Purge Out
Feed In
2.2.1.5 Recycle Filter Tank Assembly. The RFTA includes a 22 L (0.78 ft3) tank with filters to removesolids from the wastewater before it is recirculated through the distillation unit. The tank and filtercomponents are shown disassembled in figure 7. When the brine solids concentration reaches about 25percent in the recycle filter tank, the tank is removed for cleaning and the filters are replaced. Thesefilters are shown in figure 8. The filters used for most of the life testing were dual 25 µm pore size spiralwound filters, with a noncantilevered support (i.e., supported at each end). For testing of the VCD–5during part of the Water Recovery Test (WRT) Stage 10,3 a single flight-like 10 µm pore size pleatedfilter was used, with a cantilevered support, as shown in figure 7. Also, a 30 µm pore size pleated filterwas used during part of the WRT Stage 10 to compare the results. The brine was discarded duringcleaning of the tank. During flight operation the entire tank will be replaced as an orbital replaceableunit (ORU) and the used tank will be returned to Earth for cleaning and filter replacement.

8
Figure 7. VCD/UPA RFTA disassembled (showing single filter configuration).
Figure 8. VCD/UPA filters (top: 25 µm pore size, bottom: 10 µm pore size).
The RFTA for the ISS UPA is an integrated mechanical component which incorporates all of thediscrete components that make up the RFTA’s in the VCD–5 or VCD–5A. Major differences are that theISS UPA RFTA uses a single cantilevered 10 µm filter element while the VCD–5 and VCD–5A use adual noncantilevered 25 µm filter design (except as noted above), and that the ISS UPA tank is made oftitanium, while the VCD–5 and VCD–5A tanks are stainless steel.

9
2.2.1.6 Pressure Control Assembly. The PCA consists of piping and valves to control the pressure inthe still. Also included is a gas/liquid separator (WS1) to remove any water from the purge gases andreturn it to the product waterline. The primary function of the PCA is to periodically purge the DU ofnoncondensable gases that enter as dissolved or free gases with the wastewater feed. As noncondensablegases increase in the DU condenser, the pressure will increase, which will make the compressor workharder and reduce the overall performance. The PCA monitors this pressure increase and activates thePPA when a purge is required. The PPA compresses the noncondensable gas with water vapor to pres-sures above ambient, condensing the water vapor. From there, the noncondensable gas and condensatepass through a membrane gas/water separator where condensate is recovered and routed back into theproduct water stream. The noncondensable gases are released to the atmosphere.
The PCA for the ISS UPA is an integrated mechanical component which incorporates in onehousing all of the discrete components that make up the PCA in the VCD–5 and VCD–5A.
2.2.1.7 Purge Pump Assembly. The PPA is essentially identical with the FPA, consisting of a four-section peristaltic-type purge pump (PU2) which removes gases from the condenser side of the DU andevacuates the casings of the fluids pump and itself. The four sections operate in parallel through inletand outlet manifolds. The only differences with the fluids pump are a cooling jacket around the purgepump and the speed at which the pump operates (25 rpm versus 8 rpm for the fluids pump). Figure 9schematically shows the basic design concept and connections of the PPA. The pump drive is describedin section 2.2.1.7.1. A membrane-type water separator removes condensed water from the purge pumpoutlet stream. The water is combined with the product water from the DU and the air is returned to thecabin atmosphere.
Figure 9. Purge pump design concept and connections.
Coolant�Out Coolant�
In
Cooling Jacket
Inlet Manifold
Purge Line
Casing Connection
Casing Connection
Fluids Pump
Purge PumpDistillation
Unit
Outlet Manifold
Gas/condensate
10
The PPA of the ISS UPA and the VCD–5 and VCD–5A are identical in size and function.Differences are that the ISS UPA PPA casing and cooling jacket are made of titanium, whereas the VCD–5 and VCD–5A PPA casings and cooling jackets are aluminum; and the ISS UPA PPA uses a 120 Vdcbrushless motor, whereas the VCD–5 and VCD–5A use 28 Vdc brushless motors. The function of thetubes and rollers is the same, as shown in figure 5.
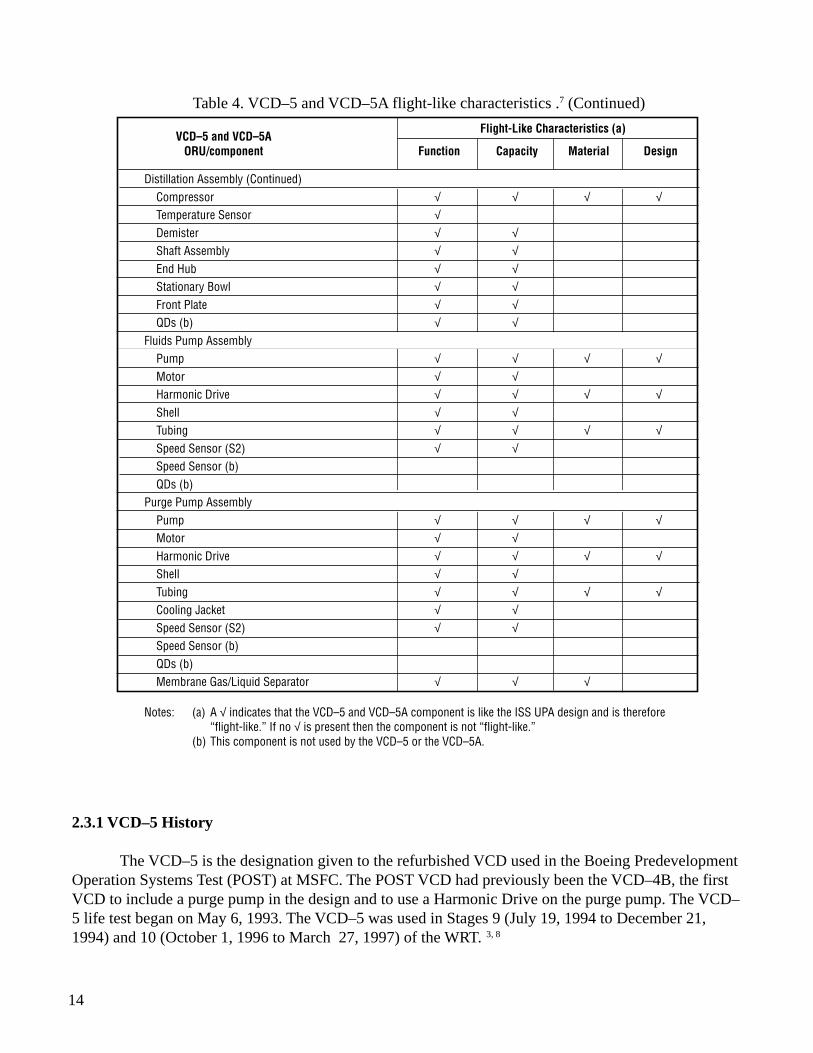
2.2.1.7.1 Harmonic Drive. The FPA and PPA drive gearing is made by Harmonic Drive Technologies.4
The Harmonic Drive, shown schematically in figure 10, consists of concentric components that transmittorque in less space and with a smaller support structure than conventional gearing. The componentsconsist of a circular rigid internal spline gear, an elliptical ball bearing wave generator, and an ellipticalnonrigid external flexspline gear. Benefits include low or zero backlash, efficiencies typically rangingfrom 80 to 90 percent, torque transfer equivalent to other types of drives that are twice as large,positional accuracy and repeatability, long life, and high reliability. The material of the rigid spline andthe flex spline is stainless steel. As used in the VCD, the Harmonic Drive is not subjected to a harshenvironment, and the temperatures and pressures around the Harmonic Drive are typical ambientconditions. The normal speed of operation is 8 rpm for the fluids pump and 25 rpm for the purge pump.
Figure 10. Harmonic Drive.
Bearing Support
Circular Spline
Motor Mounting Adaptor
Wave Generator
Flex SplineDrive Shaft Bearing
Drive Shaft

11
The use of Harmonic Drives in VCD’s is summarized in tables 1 and 2.
Table 1. History of the use of Harmonic Drives in VCD’s.
VCD DesignationHarmonic Drive Use
CommentsFluids Pump Purge Pump
VCD–4 √ Technology Demonstrator VCDVCD–4A √VCD–4B √ √ First VCD to Have a Peristaltic Purge Pump With Harmonic DriveVCD-6 √ √P VCD √ √ Converted From the VCD–4BVCD–5 √ √ Converted From the POST VCDVCD–5A √ √ Converted From the VCD–4
Table 2. Harmonic Drive operating history (as of May 25, 1993).
VCD Designation Harmonic Drive (HDC–1C–100–2) in Fluids Pump Harmonic Drive (HDC–1C–60–2) in Purge Pump
Drive # Run Time, hr (1) No. of Start/Stop Drive # Run Time, hr (2) No. of Start/Stop
VCD–4A 1 8,084 77 - - -2 3,308 43 14,678 63
VCD–5 (3) 1 5,962 92 1 993 29,810VCD–5A (4) 1 1,724 <100 1 127 (6) 3,810
2 362 N/AVCD-6 1 370 50 1 191 (5) 1,850
Notes: (1) Time to failure, unless still operating(2) Calculated based on 2 min per 12 min duty cycle without the startup time(3) Converted from the VCD–4B (5,400 hr as VCD–4B, 562 hr as VCD–5)(4) Converted from the VCD–4 (1,324 hr as VCD–4, 762 hr as VCD–5A)(5) Actual time(6) Based on 762 hr (362 + 400 hr) of operation as the VCD–5A
2.2.1.8 Instrumentation and Monitoring. The instrumentation identified in figure 4 and required tomonitor the operation and performance of the VCD–5 and VCD–5A for life testing is listed in table 3.Data from these instruments were monitored via computer using the Systems and ComponentsAutomated Test System (SCATS),5 and the Payloads and Components Real-time Automated Test System(PACRATS)6 during the WRT Stage 10. The ISS UPA will have similar instrumentation and the sensorswill have redundancy built-in for fault tolerance.
2.2.2 Flight-like Components
The VCD–5 and VCD–5A were flight-like as indicated in table 4. Considering the componentsby ISS UPA ORU, the function, capacity, material, and final design aspects are compared with the ISSUPA. The controller for the VCD–5 and VCD–5A is a 400 Series Life Systems controller. The controllerfor the ISS UPA is the next generation controller, with a new design having additional capabilities,particularly with regard to self-diagnostics, e.g., fault detection and isolation.

12
Table 3. VCD–5 and VCD–5A instrumentation list.
Designation onMeasurement ID DescriptionFigure 4
vcl1 Recycle Filter Tank Concentration (Calculated)I1 vi1 Compressor Motor CurrentK1 vk1 Product Water Conductivity (Triple-Redundant Sensors,
Averaged Value)L1 vl1 Liquid Level Sensor in the Distillation UnitQ1 vq1 Wastewater Supply Tank QuantityP1 vp1 Condenser PressureP2 vp2 Compressor Differential Pressure
vp3 Wastewater Inlet Pressure to the Recycle Filter Tankvp4 Outlet Pressure Of Product Water From the Fluids Pump
P5 vp5 Differential Pressure Across the Gas/Liquid Separatorvqlb Wastewater Supply Quantity Average (lb)vq4 Total Wastewater Processed (Calculated)vq5 Recycle Fill Quantity
S1 vs1 Compressor SpeedS2 vs2 Fluids Pump Motor SpeedS3 vs3 Purge Pump Motor SpeedS4 vs4 Distillation Centrifuge SpeedT1 vt1 Compressor Outlet Temperature
vt2 Coolant Temperaturevt4 Condenser Temperature
Related Facility InstrumentationVT5 Cooled Water Supply TemperatureVT6 Cooled Water Return TemperatureFP01 High Bay PressureFT01 High Bay Temperature
2.3 Upgrades from Previous VCD’s
The VCD–5 and VCD–5A are the designations given to refurbished earlier-generation VCD’s, asindicated in table 2. During development of the ISS ECLSS design, the following additionalrequirements were levied on the UPA and incorporated in the VCD–5 and VCD–5A:
1. Addition of a wastewater storage assembly (Facility wastewater tank used for the VCD–5A)2. Addition of a coolant jacket to the PPA3. Change in software operational aspects, i.e., operating modes, mode transitions, and process
control loops.

13
Table 4. VCD–5 and VCD–5A flight-like characteristics .7
VCD–5 and VCD–5AFlight-Like Characteristics (a)
ORU/component Function Capacity Material Design
Pressure Control Assembly Membrane Separator √ √ √ Pressure Sensors √ √ Valves √ √ Check Valve √ √ Microbial Filter √ QDs (b) Housing (b)Fluids Control Assembly Conductivity Sensor √ √ Pressure Sensor √ √ Relief Valves √ √ Check Valves √ √ Valves √ √ Microbial Check Valve (not on the 5A) √ √ √ QDs (b) Housing (b)Controller Controller √ √Wastewater Storage Assembly Bellows √ √ Position Indicator √ √ √ Shell √ Check Valve √ Isolation Valve (b) QDs (b)Recycle Filter Tank Valves √ √ Filter √ Shell √ QDs (b)Distillation Assembly Distillation Unit √ √ Motor √ Gear √ √ √ √ Magnetic Drive √ √ √ √ Bearings √ √ √ √ Pulleys √ √ √ Insulation √ Heat Exchanger √ √ Plumbing √ Speed Sensor √ Liquid Level Sensor √ √ √
14
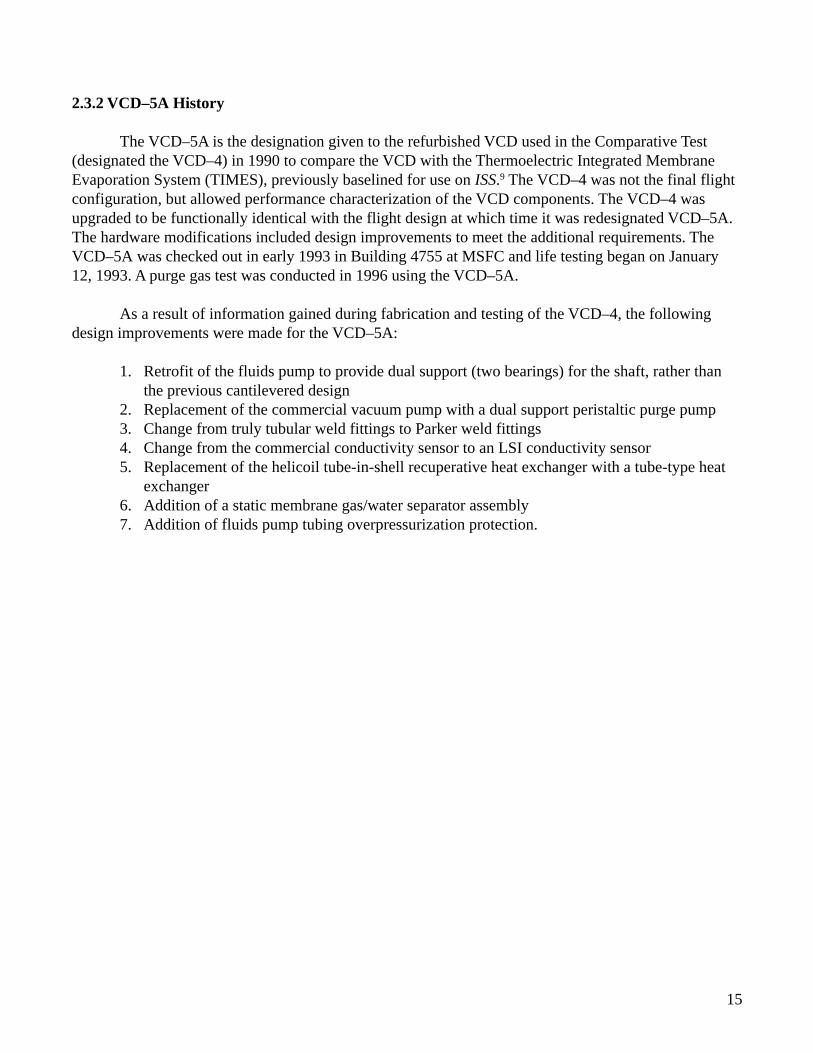
Table 4. VCD–5 and VCD–5A flight-like characteristics .7 (Continued)
2.3.1 VCD–5 History
The VCD–5 is the designation given to the refurbished VCD used in the Boeing PredevelopmentOperation Systems Test (POST) at MSFC. The POST VCD had previously been the VCD–4B, the firstVCD to include a purge pump in the design and to use a Harmonic Drive on the purge pump. The VCD–5 life test began on May 6, 1993. The VCD–5 was used in Stages 9 (July 19, 1994 to December 21,1994) and 10 (October 1, 1996 to March 27, 1997) of the WRT. 3, 8
Distillation Assembly (Continued) Compressor √ √ √ √ Temperature Sensor √ Demister √ √ Shaft Assembly √ √ End Hub √ √ Stationary Bowl √ √ Front Plate √ √ QDs (b) √ √Fluids Pump Assembly Pump √ √ √ √ Motor √ √ Harmonic Drive √ √ √ √ Shell √ √ Tubing √ √ √ √ Speed Sensor (S2) √ √ Speed Sensor (b) QDs (b)Purge Pump Assembly Pump √ √ √ √ Motor √ √ Harmonic Drive √ √ √ √ Shell √ √ Tubing √ √ √ √ Cooling Jacket √ √ Speed Sensor (S2) √ √ Speed Sensor (b) QDs (b) Membrane Gas/Liquid Separator √ √ √
Notes: (a) A √ indicates that the VCD–5 and VCD–5A component is like the ISS UPA design and is therefore“flight-like.” If no √ is present then the component is not “flight-like.”
(b) This component is not used by the VCD–5 or the VCD–5A.
VCD–5 and VCD–5AFlight-Like Characteristics (a)
ORU/component Function Capacity Material Design
15
2.3.2 VCD–5A History
The VCD–5A is the designation given to the refurbished VCD used in the Comparative Test(designated the VCD–4) in 1990 to compare the VCD with the Thermoelectric Integrated MembraneEvaporation System (TIMES), previously baselined for use on ISS.9 The VCD–4 was not the final flightconfiguration, but allowed performance characterization of the VCD components. The VCD–4 wasupgraded to be functionally identical with the flight design at which time it was redesignated VCD–5A.The hardware modifications included design improvements to meet the additional requirements. TheVCD–5A was checked out in early 1993 in Building 4755 at MSFC and life testing began on January12, 1993. A purge gas test was conducted in 1996 using the VCD–5A.
As a result of information gained during fabrication and testing of the VCD–4, the followingdesign improvements were made for the VCD–5A:
1. Retrofit of the fluids pump to provide dual support (two bearings) for the shaft, rather thanthe previous cantilevered design
2. Replacement of the commercial vacuum pump with a dual support peristaltic purge pump3. Change from truly tubular weld fittings to Parker weld fittings4. Change from the commercial conductivity sensor to an LSI conductivity sensor5. Replacement of the helicoil tube-in-shell recuperative heat exchanger with a tube-type heat
exchanger6. Addition of a static membrane gas/water separator assembly7. Addition of fluids pump tubing overpressurization protection.

16
3. TEST FACILITY DESCRIPTION
The VCD/UPA life testing was performed at MSFC in Building 4755, in the ECLS test facilityshown in figures 11 and 12. The test facility provided all necessary utilities and data collection andmonitoring capabilities. The VCD–5 was located next to the End-use Equipment Facility (EEF) and theVCD–5A was located in the northwest corner of the north high bay. Urine was collected in the EEF (asshown in figure 13) and a restroom, and pretreated using Oxone (Oxone is a registered trademark ofthe DuPont Company) and sulfuric acid (in liquid form and, later, in solid tablet form as planned for useon ISS) prior to processing in the VCD–5A. The EEF was designed, built, and integrated with theECLSS WRT to provide wastewater typical of that expected to be produced onboard ISS.8, 10
Figure 11. ECLS test facility at MSFC.

17
Figure 12. Schematic of the ECLS test facility at MSFC.
Figure 13. EEF urinal.
VCD-5A
VCD-5
Life Test Area
Core Module Simulator
Control Room
End-Use Equipment
Facility
Sample Preparation
Wet Chemistry
North High Bay of Building 4755

18
4. TEST DESCRIPTION AND PERFORMANCE
The specific purpose for testing the VCD/UPA, the operating procedures, and summaries of thetesting performance are described below.
4.1 Test Purpose
The purpose of the VCD/UPA life testing was to determine the useful lifetimes of specific compo-nents that were considered to be subject to mechanical wear, and to monitor the processing performanceover an extended period of flight-like operation. Performance was assessed using simulated flight opera-tion conditions, with the exception of microgravity.
4.2 Operating Procedures
The procedures for operating the VCD–5 and VCD–5A were different to evaluate somewhatdifferent aspects of operation. The VCD–5 was activated for two or three cycles each day with reducedrun times to gather data on startup and shutdown effects on the hardware and to accelerate mechanicalwear. Wastewater processing (production rate and quality of product water) was not monitored. When theVCD–5 was incorporated in the WRT Stage 10, the operation was changed to more closely simulate flightoperation times and the production rates and quality of product water were monitored. The VCD–5A wasoperated once each work day with processing run times as expected on-orbit (approximately six hourseach day) and the production rate was monitored to evaluate long-term performance characteristics.
4.3 Components Tested
The specific components of the VCD/UPA that were the subject of the life testing are the wastewa-ter storage tank, peristaltic fluids pump, distillation unit, recycle filter tank, gas/liquid separator, andperistaltic purge pump. These components are described in section 2.
4.4 VCD–5 Testing
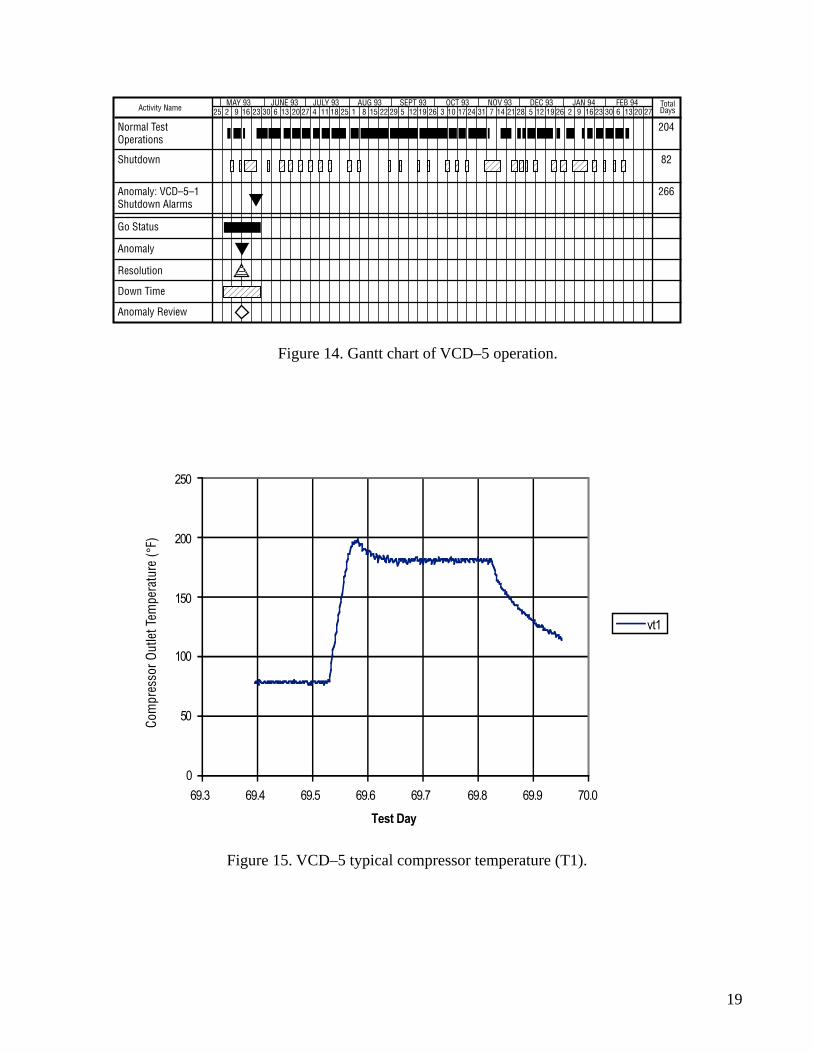
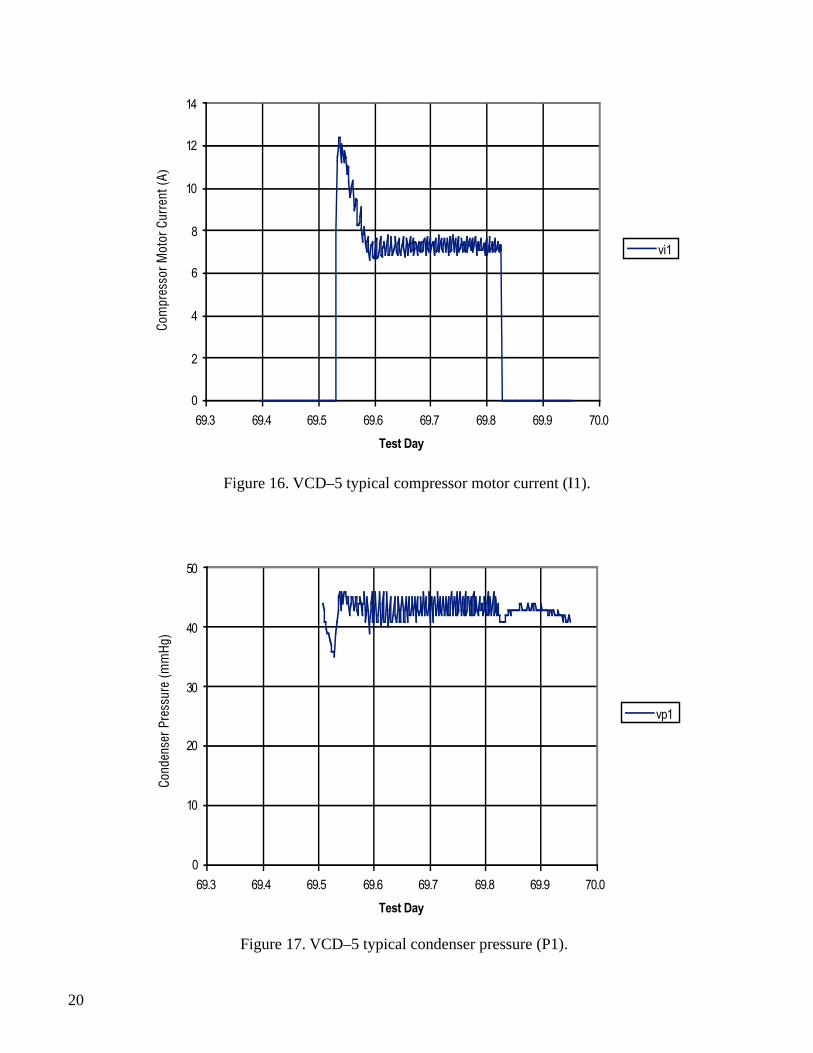
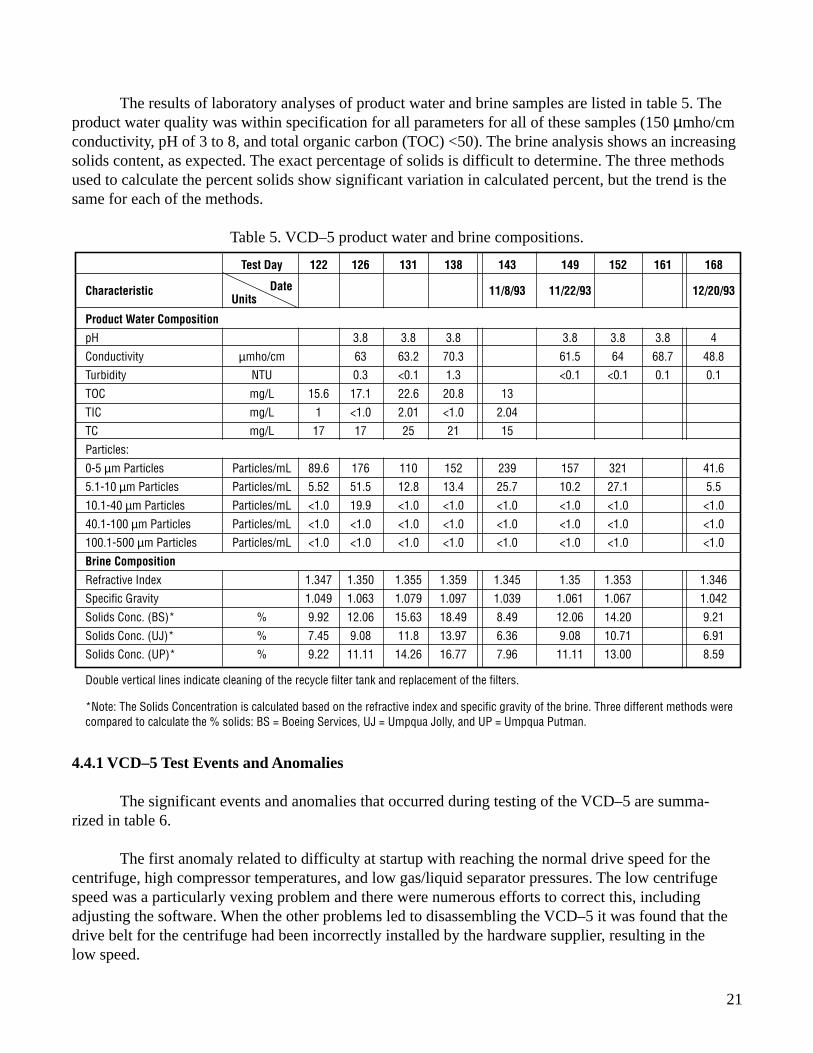
The VCD–5 life test began on May 6, 1993 and ran until February 16, 1994, for a total of 204 testdays. A Gantt chart of the VCD–5 operation during this period is shown in figure 14. Significant testevents and anomalies are described in section 4.4.1. Additional testing was performed during the stage 9and WRT Stage 10.3, 8 The WRT Stage 10 performance of the VCD–5 is described in more detail in sec-tion 4.4.2. Plots of typical operating conditions for the compressor temperature (T1), compressor motorcurrent (I1), and condenser pressure (P1) are shown in figures 15, 16, and 17, respectively. This testingrevealed several problems that can be directly attributed to quality control problems. Most anomalies wererelated to low centrifuge speed, high compressor temperatures, and high condenser pressures. Conditionsthat recurred, but were not listed as “anomalies,” are short-term high product water conductivity andblockage of the gas/liquid separator and pressure regulator with Norprene particles.
19
Figure 14. Gantt chart of VCD–5 operation.
Activity Name
Normal Test Operations
Shutdown
Anomaly: VCD–5–1 Shutdown Alarms
204
82
266
Go Status
Anomaly
Resolution
Down Time
Anomaly Review
Total Days
MAY 93 JUNE 93 JULY 9325 2 9 16 23 30 6 13 20 27 4 11 18 25
AUG 931 8 15 22 29
SEPT 93 OCT 93 NOV 93 DEC 93 JAN 94 FEB 945 12 19 26 10 17 24 313 14 21 287 12 19 265 9 16 23 30 6 13 20 272
�
������������������ � ���������� ���
Figure 15. VCD–5 typical compressor temperature (T1).
Com
pres
sor O
utle
t Tem
pera
ture
(°F)
0
50
100
150
200
250
69.3 69.4 69.5 69.6 69.7 69.8 69.9 70.0
Test Day
C °
vt1
20
Figure 16. VCD–5 typical compressor motor current (I1).
Figure 17. VCD–5 typical condenser pressure (P1).
Com
pres
sor M
otor
Cur
rent
(A)
0
2
4
6
8
10
12
14
69.3 69.4 69.5 69.6 69.7 69.8 69.9 70.0
Test Day
vi1
Cond
ense
r Pre
ssur
e (m
mHg
)
0
10
20
30
40
50
69.3 69.4 69.5 69.6 69.7 69.8 69.9 70.0
Test Day
vp1
21
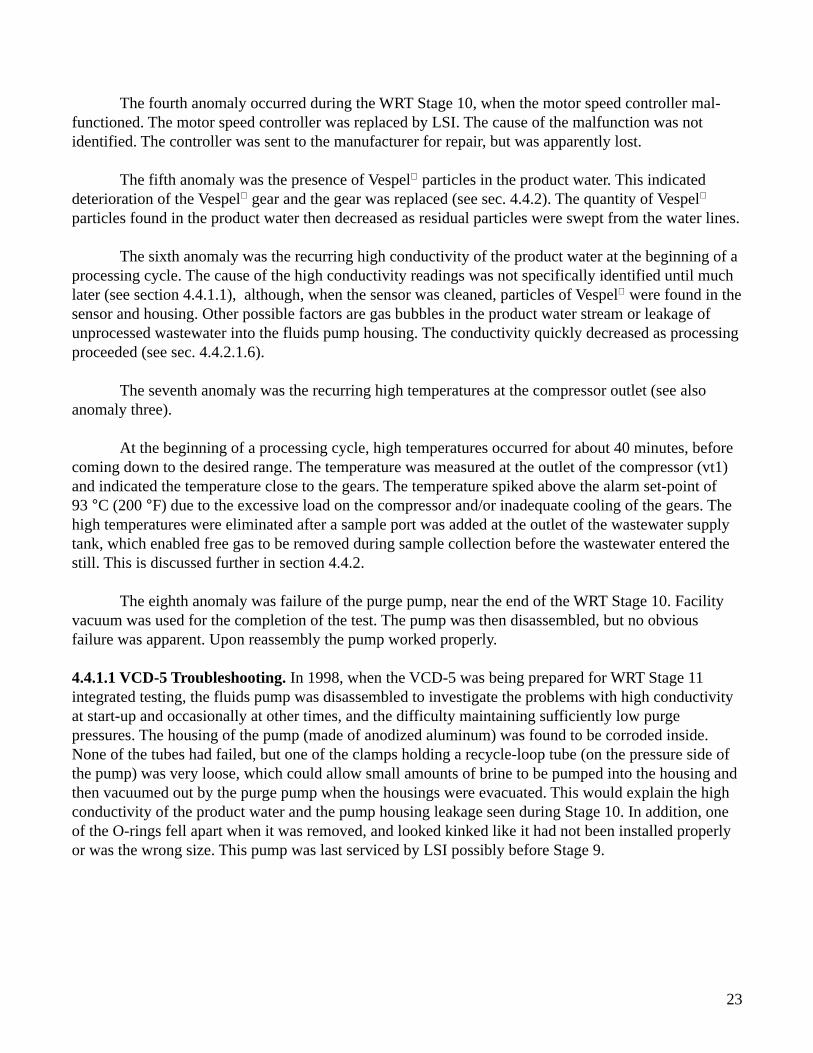
The results of laboratory analyses of product water and brine samples are listed in table 5. Theproduct water quality was within specification for all parameters for all of these samples (150 µmho/cmconductivity, pH of 3 to 8, and total organic carbon (TOC) <50). The brine analysis shows an increasingsolids content, as expected. The exact percentage of solids is difficult to determine. The three methodsused to calculate the percent solids show significant variation in calculated percent, but the trend is thesame for each of the methods.
Table 5. VCD–5 product water and brine compositions.
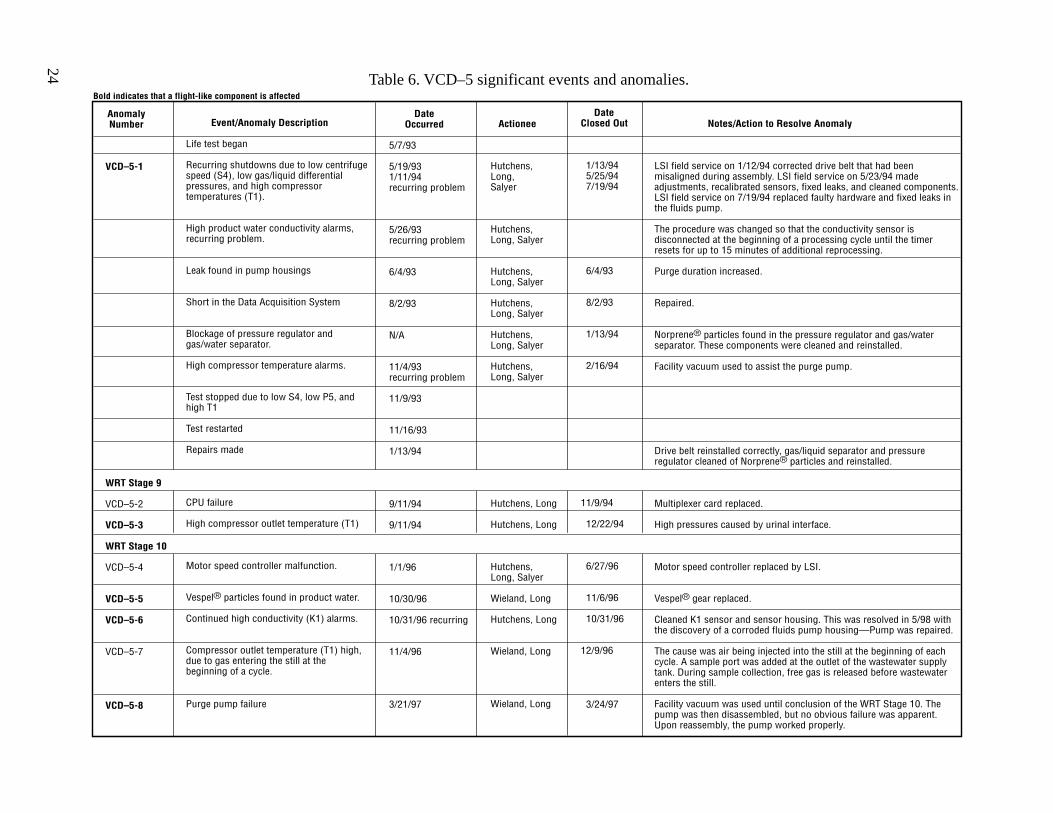
4.4.1 VCD–5 Test Events and Anomalies
The significant events and anomalies that occurred during testing of the VCD–5 are summa-rized in table 6.
The first anomaly related to difficulty at startup with reaching the normal drive speed for thecentrifuge, high compressor temperatures, and low gas/liquid separator pressures. The low centrifugespeed was a particularly vexing problem and there were numerous efforts to correct this, includingadjusting the software. When the other problems led to disassembling the VCD–5 it was found that thedrive belt for the centrifuge had been incorrectly installed by the hardware supplier, resulting in thelow speed.
UnitsDate
Test Day 122 126 131 138 143 149 152 161 168
Characteristic 11/8/93 11/22/93 12/20/93
Product Water Composition
pH 3.8 3.8 3.8 3.8 3.8 3.8 4
Conductivity µmho/cm 63 63.2 70.3 61.5 64 68.7 48.8Turbidity NTU 0.3 <0.1 1.3 <0.1 <0.1 0.1 0.1
TOC mg/L 15.6 17.1 22.6 20.8 13
TIC mg/L 1 <1.0 2.01 <1.0 2.04TC mg/L 17 17 25 21 15
Particles:
0-5 µm Particles Particles/mL 89.6 176 110 152 239 157 321 41.65.1-10 µm Particles Particles/mL 5.52 51.5 12.8 13.4 25.7 10.2 27.1 5.5
10.1-40 µm Particles Particles/mL <1.0 19.9 <1.0 <1.0 <1.0 <1.0 <1.0 <1.0
40.1-100 µm Particles Particles/mL <1.0 <1.0 <1.0 <1.0 <1.0 <1.0 <1.0 <1.0100.1-500 µm Particles Particles/mL <1.0 <1.0 <1.0 <1.0 <1.0 <1.0 <1.0 <1.0
Brine Composition
Refractive Index 1.347 1.350 1.355 1.359 1.345 1.35 1.353 1.346Specific Gravity 1.049 1.063 1.079 1.097 1.039 1.061 1.067 1.042
Solids Conc. (BS)* % 9.92 12.06 15.63 18.49 8.49 12.06 14.20 9.21
Solids Conc. (UJ)* % 7.45 9.08 11.8 13.97 6.36 9.08 10.71 6.91Solids Conc. (UP)* % 9.22 11.11 14.26 16.77 7.96 11.11 13.00 8.59
Double vertical lines indicate cleaning of the recycle filter tank and replacement of the filters.
*Note: The Solids Concentration is calculated based on the refractive index and specific gravity of the brine. Three different methods werecompared to calculate the % solids: BS = Boeing Services, UJ = Umpqua Jolly, and UP = Umpqua Putman.

22
A recurring event was high conductivity of the product water. The procedure was changed toinclude disconnecting the conductivity sensor at the beginning of a processing cycle until the timer resetfor up to 15 min of additional reprocessing. One effect of this is to reduce the performance by reprocess-ing water that meets specification.
Leakage occurred which limited the ability of the purge pump to maintain a vacuum in the still.As a result, the pumping rate could not keep pace with the collection of noncondensable gases in thecondenser. Increasing the duration of the purge helped, but eventually a facility vacuum pump wasneeded to ensure adequate vacuum. One source of leakage was the drive shaft of the pump.
The Data Acquisition System (DAS) was found to have a short, which was repaired the same dayit was found. This did not involve flight-like components.
The pressure regulator and the gas/liquid separator were found to be blocked with particles ofNorprene spalling from the purge pump tubes. These components were cleaned and reinstalled. (Fur-ther investigation of the purge pump tubing problem showed that spalling had occurred in the VCD–5Aas well. See section 4.5.1 for more information.)
High compressor temperature alarms occurred repeatedly during the life test. This was alsorelated to leakage. Use of facility vacuum to assist the purge pump helped to reduce these alarms, but thecombination of problems led to stopping the test on November 9, 1993 until repairs could be made onJanuary 13, 1994. Beginning on test day 20, a fan was used to cool the compressor motor from 66 to42 °C (151 to 108°F) which eliminated high temperature shutdowns. Also, software changes were madeto enable longer purge times since air in the wastewater feed was a factor. Compressor gear wear wasalso a factor and during the repairs the compressor gear backlash was found to be 0.254 to 0.305 mm(0.010 to 0.012 in.) versus 0.076 to 0.102 mm (0.003 to 0.004 in.) when new. This is considered normalwear for a total running time of 7,400 hr, but near the maximum desired backlash. Particles of Vespel
from the compressor gear were also present in the product water due to gear wear.
To prepare the VCD–5 for the WRT Stage 9, the accelerated life test was discontinued on Febru-ary 17, 1994, shortly after the repairs were made (on January 13, 1994) that resolved some of theanomalies. Although the accelerated testing proved valuable, the decision to discontinue it was basedupon the continuing problems with the VCD–5. Repairs were made to correct the remaining problemsbefore continuing the testing (the WRT Stages 9 and 10).
The second anomaly occurred during the WRT Stage 9, when the CPU failed. (This was not aflight-like CPU.) The multiplexer card was replaced and testing continued.
The third anomaly— recurring high compressor outlet temperatures at the beginning of eachprocessing cycle—also occurred during the WRT Stage 9, as well as during previous testing . The causefor this is gravity-related, since any free gas entrained in the wastewater collects at the top of the tank,where the outlet is located. This would not happen on-orbit due to more even distribution of free gasthroughout the wastewater. Thus, at the beginning of a cycle this gas is injected into the still before thewastewater. Since the gas does not provide evaporative cooling, like the wastewater does, the compres-sor temperature increases until wastewater reaches the still.
23
The fourth anomaly occurred during the WRT Stage 10, when the motor speed controller mal-functioned. The motor speed controller was replaced by LSI. The cause of the malfunction was notidentified. The controller was sent to the manufacturer for repair, but was apparently lost.
The fifth anomaly was the presence of Vespel particles in the product water. This indicateddeterioration of the Vespel gear and the gear was replaced (see sec. 4.4.2). The quantity of Vespel
particles found in the product water then decreased as residual particles were swept from the water lines.
The sixth anomaly was the recurring high conductivity of the product water at the beginning of aprocessing cycle. The cause of the high conductivity readings was not specifically identified until muchlater (see section 4.4.1.1), although, when the sensor was cleaned, particles of Vespel were found in thesensor and housing. Other possible factors are gas bubbles in the product water stream or leakage ofunprocessed wastewater into the fluids pump housing. The conductivity quickly decreased as processingproceeded (see sec. 4.4.2.1.6).
The seventh anomaly was the recurring high temperatures at the compressor outlet (see alsoanomaly three).
At the beginning of a processing cycle, high temperatures occurred for about 40 minutes, beforecoming down to the desired range. The temperature was measured at the outlet of the compressor (vt1)and indicated the temperature close to the gears. The temperature spiked above the alarm set-point of93 °C (200 °F) due to the excessive load on the compressor and/or inadequate cooling of the gears. Thehigh temperatures were eliminated after a sample port was added at the outlet of the wastewater supplytank, which enabled free gas to be removed during sample collection before the wastewater entered thestill. This is discussed further in section 4.4.2.
The eighth anomaly was failure of the purge pump, near the end of the WRT Stage 10. Facilityvacuum was used for the completion of the test. The pump was then disassembled, but no obviousfailure was apparent. Upon reassembly the pump worked properly.
4.4.1.1 VCD-5 Troubleshooting. In 1998, when the VCD-5 was being prepared for WRT Stage 11integrated testing, the fluids pump was disassembled to investigate the problems with high conductivityat start-up and occasionally at other times, and the difficulty maintaining sufficiently low purgepressures. The housing of the pump (made of anodized aluminum) was found to be corroded inside.None of the tubes had failed, but one of the clamps holding a recycle-loop tube (on the pressure side ofthe pump) was very loose, which could allow small amounts of brine to be pumped into the housing andthen vacuumed out by the purge pump when the housings were evacuated. This would explain the highconductivity of the product water and the pump housing leakage seen during Stage 10. In addition, oneof the O-rings fell apart when it was removed, and looked kinked like it had not been installed properlyor was the wrong size. This pump was last serviced by LSI possibly before Stage 9.
24 Table 6. VCD–5 significant events and anomalies.
Anomaly Number VCD–5-1 WRT Stage 9 VCD–5-2 VCD–5-3 WRT Stage 10 VCD–5-4 VCD–5-5 VCD–5-6 VCD–5-7 VCD–5-8
Date Occurred 5/7/93 5/19/93 1/11/94 recurring problem 5/26/93 recurring problem 6/4/93 8/2/93 N/A 11/4/93 recurring problem 11/9/93 11/16/93 1/13/94 9/11/94 9/11/94 1/1/96 10/30/96 10/31/96 recurring 11/4/96 3/21/97
Date Closed Out 1/13/94 5/25/94 7/19/94 6/4/93 8/2/93 1/13/94 2/16/94 11/9/94 12/22/94 6/27/96 11/6/96 10/31/96 12/9/96 3/24/97
Notes/Action to Resolve Anomaly LSI field service on 1/12/94 corrected drive belt that had been misaligned during assembly. LSI field service on 5/23/94 made adjustments, recalibrated sensors, fixed leaks, and cleaned components. LSI field service on 7/19/94 replaced faulty hardware and fixed leaks in the fluids pump. The procedure was changed so that the conductivity sensor is disconnected at the beginning of a processing cycle until the timer resets for up to 15 minutes of additional reprocessing. Purge duration increased. Repaired. Norprene® particles found in the pressure regulator and gas/water separator. These components were cleaned and reinstalled. Facility vacuum used to assist the purge pump. Drive belt reinstalled correctly, gas/liquid separator and pressure regulator cleaned of Norprene® particles and reinstalled. Multiplexer card replaced. High pressures caused by urinal interface. Motor speed controller replaced by LSI. Vespel® gear replaced. Cleaned K1 sensor and sensor housing. This was resolved in 5/98 with the discovery of a corroded fluids pump housing—Pump was repaired. The cause was air being injected into the still at the beginning of each cycle. A sample port was added at the outlet of the wastewater supply tank. During sample collection, free gas is released before wastewater enters the still. Facility vacuum was used until conclusion of the WRT Stage 10. The pump was then disassembled, but no obvious failure was apparent. Upon reassembly, the pump worked properly.
Event/Anomaly Description Life test began Recurring shutdowns due to low centrifuge speed (S4), low gas/liquid differential pressures, and high compressor temperatures (T1). High product water conductivity alarms, recurring problem. Leak found in pump housings Short in the Data Acquisition System Blockage of pressure regulator and gas/water separator. High compressor temperature alarms. Test stopped due to low S4, low P5, and high T1 Test restarted Repairs made CPU failure High compressor outlet temperature (T1) Motor speed controller malfunction. Vespel® particles found in product water. Continued high conductivity (K1) alarms. Compressor outlet temperature (T1) high, due to gas entering the still at the beginning of a cycle. Purge pump failure
Actionee Hutchens, Long, Salyer Hutchens, Long, Salyer Hutchens, Long, Salyer Hutchens, Long, Salyer Hutchens, Long, Salyer Hutchens, Long, Salyer Hutchens, Long Hutchens, Long Hutchens, Long, Salyer Wieland, Long Hutchens, Long Wieland, Long Wieland, Long
Bold indicates that a flight-like component is affected
25
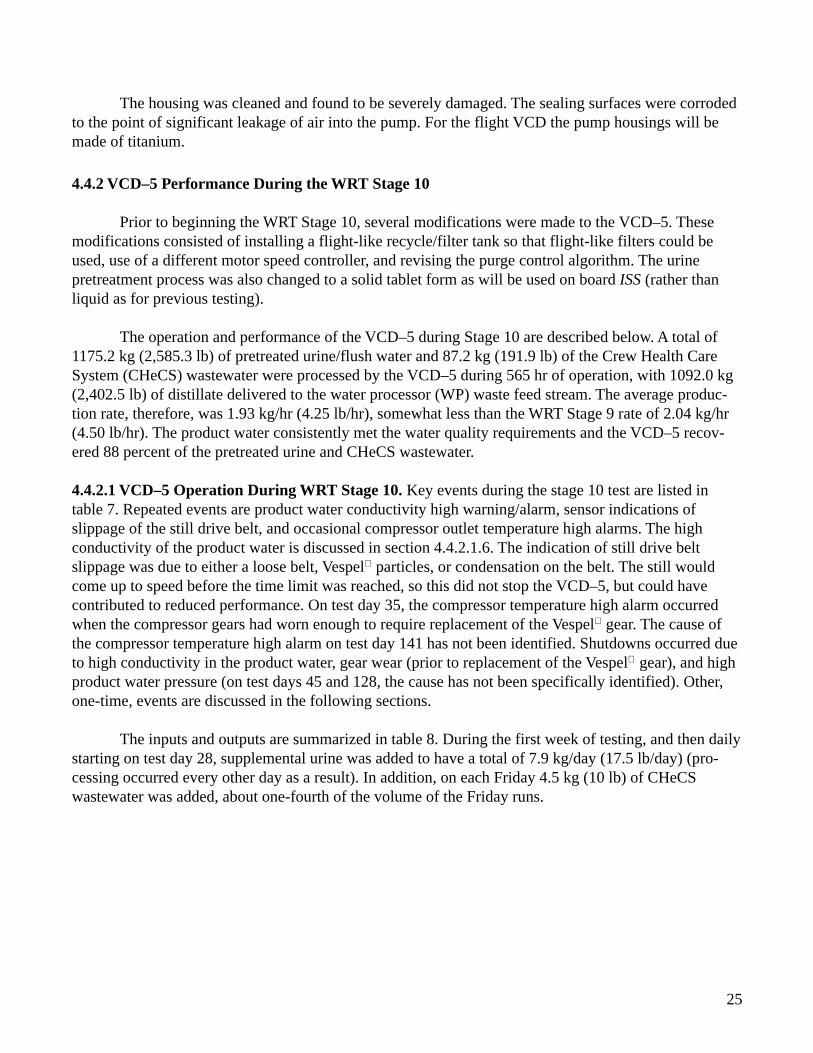
The housing was cleaned and found to be severely damaged. The sealing surfaces were corrodedto the point of significant leakage of air into the pump. For the flight VCD the pump housings will bemade of titanium.
4.4.2 VCD–5 Performance During the WRT Stage 10
Prior to beginning the WRT Stage 10, several modifications were made to the VCD–5. Thesemodifications consisted of installing a flight-like recycle/filter tank so that flight-like filters could beused, use of a different motor speed controller, and revising the purge control algorithm. The urinepretreatment process was also changed to a solid tablet form as will be used on board ISS (rather thanliquid as for previous testing).
The operation and performance of the VCD–5 during Stage 10 are described below. A total of1175.2 kg (2,585.3 lb) of pretreated urine/flush water and 87.2 kg (191.9 lb) of the Crew Health CareSystem (CHeCS) wastewater were processed by the VCD–5 during 565 hr of operation, with 1092.0 kg(2,402.5 lb) of distillate delivered to the water processor (WP) waste feed stream. The average produc-tion rate, therefore, was 1.93 kg/hr (4.25 lb/hr), somewhat less than the WRT Stage 9 rate of 2.04 kg/hr(4.50 lb/hr). The product water consistently met the water quality requirements and the VCD–5 recov-ered 88 percent of the pretreated urine and CHeCS wastewater.
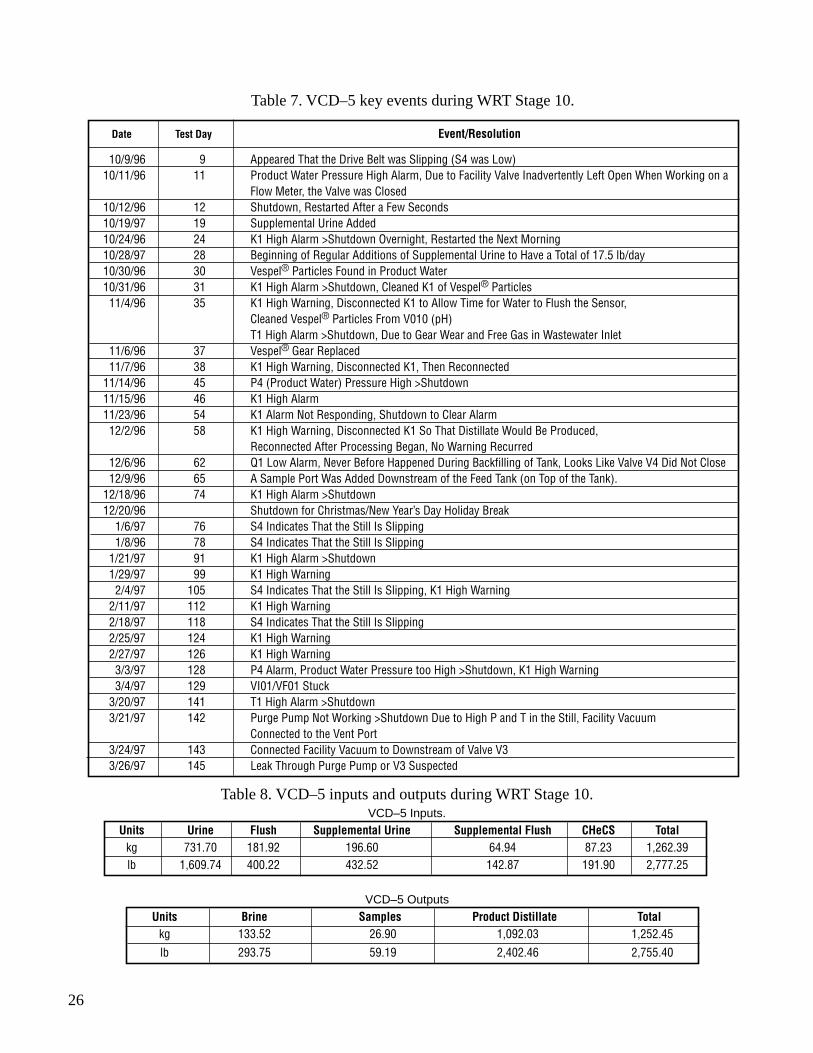
4.4.2.1 VCD–5 Operation During WRT Stage 10. Key events during the stage 10 test are listed intable 7. Repeated events are product water conductivity high warning/alarm, sensor indications ofslippage of the still drive belt, and occasional compressor outlet temperature high alarms. The highconductivity of the product water is discussed in section 4.4.2.1.6. The indication of still drive beltslippage was due to either a loose belt, Vespel particles, or condensation on the belt. The still wouldcome up to speed before the time limit was reached, so this did not stop the VCD–5, but could havecontributed to reduced performance. On test day 35, the compressor temperature high alarm occurredwhen the compressor gears had worn enough to require replacement of the Vespel gear. The cause ofthe compressor temperature high alarm on test day 141 has not been identified. Shutdowns occurred dueto high conductivity in the product water, gear wear (prior to replacement of the Vespel gear), and highproduct water pressure (on test days 45 and 128, the cause has not been specifically identified). Other,one-time, events are discussed in the following sections.
The inputs and outputs are summarized in table 8. During the first week of testing, and then dailystarting on test day 28, supplemental urine was added to have a total of 7.9 kg/day (17.5 lb/day) (pro-cessing occurred every other day as a result). In addition, on each Friday 4.5 kg (10 lb) of CHeCSwastewater was added, about one-fourth of the volume of the Friday runs.
26
Date Test Day Event/Resolution
10/9/96 9 Appeared That the Drive Belt was Slipping (S4 was Low)10/11/96 11 Product Water Pressure High Alarm, Due to Facility Valve Inadvertently Left Open When Working on a
Flow Meter, the Valve was Closed10/12/96 12 Shutdown, Restarted After a Few Seconds10/19/97 19 Supplemental Urine Added10/24/96 24 K1 High Alarm >Shutdown Overnight, Restarted the Next Morning10/28/97 28 Beginning of Regular Additions of Supplemental Urine to Have a Total of 17.5 lb/day10/30/96 30 Vespel® Particles Found in Product Water10/31/96 31 K1 High Alarm >Shutdown, Cleaned K1 of Vespel® Particles11/4/96 35 K1 High Warning, Disconnected K1 to Allow Time for Water to Flush the Sensor,
Cleaned Vespel® Particles From V010 (pH)T1 High Alarm >Shutdown, Due to Gear Wear and Free Gas in Wastewater Inlet
11/6/96 37 Vespel® Gear Replaced11/7/96 38 K1 High Warning, Disconnected K1, Then Reconnected
11/14/96 45 P4 (Product Water) Pressure High >Shutdown11/15/96 46 K1 High Alarm11/23/96 54 K1 Alarm Not Responding, Shutdown to Clear Alarm12/2/96 58 K1 High Warning, Disconnected K1 So That Distillate Would Be Produced,
Reconnected After Processing Began, No Warning Recurred12/6/96 62 Q1 Low Alarm, Never Before Happened During Backfilling of Tank, Looks Like Valve V4 Did Not Close12/9/96 65 A Sample Port Was Added Downstream of the Feed Tank (on Top of the Tank).
12/18/96 74 K1 High Alarm >Shutdown12/20/96 Shutdown for Christmas/New Year’s Day Holiday Break
1/6/97 76 S4 Indicates That the Still Is Slipping1/8/96 78 S4 Indicates That the Still Is Slipping
1/21/97 91 K1 High Alarm >Shutdown1/29/97 99 K1 High Warning
2/4/97 105 S4 Indicates That the Still Is Slipping, K1 High Warning2/11/97 112 K1 High Warning2/18/97 118 S4 Indicates That the Still Is Slipping2/25/97 124 K1 High Warning2/27/97 126 K1 High Warning
3/3/97 128 P4 Alarm, Product Water Pressure too High >Shutdown, K1 High Warning3/4/97 129 VI01/VF01 Stuck
3/20/97 141 T1 High Alarm >Shutdown3/21/97 142 Purge Pump Not Working >Shutdown Due to High P and T in the Still, Facility Vacuum
Connected to the Vent Port3/24/97 143 Connected Facility Vacuum to Downstream of Valve V33/26/97 145 Leak Through Purge Pump or V3 Suspected
Table 8. VCD–5 inputs and outputs during WRT Stage 10.VCD–5 Inputs.
Units Urine Flush Supplemental Urine Supplemental Flush CHeCS Totalkg 731.70 181.92 196.60 64.94 87.23 1,262.39lb 1,609.74 400.22 432.52 142.87 191.90 2,777.25
VCD–5 Outputs
Units Brine Samples Product Distillate Totalkg 133.52 26.90 1,092.03 1,252.45lb 293.75 59.19 2,402.46 2,755.40
Table 7. VCD–5 key events during WRT Stage 10.

27
4.4.2.1.1 Software/Firmware Changes. The computer algorithm that controls the purge pump wasmodified prior to beginning stage 10 to correct the following problems with the purge pump/valvecontrol:
1. During transition from normal to standby, the purge valve closed when it was supposed toremain open.
2. Instead of having a 10 min purge cycle, the purge pump remained on continuously.
These problems were due to software errors and required new Erasable Programmable ReadOnly Memory (EPROM’s). The desired sequence is that at startup the pump housings are purged for10 min, then the still is purged. The controller checks the pressure in the evaporator and stops when thepressure is reduced to the vapor pressure (determined by a curve based on the vapor pressure at thecurrent temperature), then purges for 2 min every 10 min.
As noncondensable gases build up in the still, one effect is that the current draw of the compres-sor increases. When the current reaches 11A, a purge is supposed to be initiated, however, the softwarehad not been changed to ensure that this would happen. New EPROM’s corrected this also, prior tobeginning Stage 10.
4.4.2.1.2 Motor Speed Controller. Prior to beginning the test, it was also found that the rotation speedof the still was about 63 rpm rather than the desired 180 rpm. This was due to the controller telling themotor that no more speed was needed, not because the belt was slipping, although slippage may haveoccurred as well. The compressor was not coming up to speed either, but the speed signal was misinter-preted due to a software error. The motor and controller signals were, apparently, scaled improperly suchthat the motor would never reach the desired speed. The motor speed controller was replaced prior toStage 10 and the new motor controller worked properly.
4.4.2.1.3 Vespel Gear Replacement. Vespel particles began appearing in the product water on testday 29, indicating degradation of the Vespel gear. When the still was disassembled on test day 37 toreplace the gear, rust was found on the hub where L1 feeds through, apparently from the three lockingrings behind the hub. Yellow crystalline deposits were found on the separator plate between the evapora-tor spokes. Vespel dust was “everywhere”, including coating the drive belt. The old gear showed lesswear than expected (there were no chips or broken teeth) but the backlash was 0.279 to 0.533 mm (0.011to 0.021 in.). With the new Vespel gear the backlash was 0.102 to 0.127 mm (0.004 to 0.005 in.). It isestimated that the Vespel gear had about 8,000 hr of operation time, including 7,300 hr of continuousoperation at LSI and 700 hr of start and stop operation at MSFC (WRT Stages 9 and 10).
A filter was added to the product water line to monitor the presence of Vespel particles in thewater. Over time, after replacement of the gear, the amount of Vespel particles in the water diminishedas residual particles were removed and as “wearing in” of the new gear occurred.
4.4.2.1.4 Calculation of the Percentage of Solids in the RFTA. The criteria for determining whento clean the recycle tank and replace the filter was initially based on when the VCD software controllerindicated it was time for replacing the filter, calculated by the amount of wastewater processed. As thesolids concentration increases the filter becomes coated, as shown in figure 18. The amount of

28
wastewater processed was determined by the delta of Q1 (which measures the bellows position in thesupply tank) before and after a processing period. This procedure, however, does not account for waste-water added during a processing period, and so, frequently, more wastewater was processed than wasindicated. One result was that the percentage of solids in the recycle tank exceeded the intended level of25 percent solids when the tank is cleaned. The numbers shown in table 9 (see sec. 4.4.2.1.8) are theCL1 sensor readings, which were below the actual values. This affects the performance, and may havecontributed to a lower production rate, although this same situation existed during stage 9 testing, aswell. (All other testing of the VCD at MSFC was in batch mode, which is not subject to this effect.) Bymanually calculating the amount of wastewater processed, to account for wastewater added during aprocessing cycle, the amount of solids on the filter was decreased. This procedure change was madeon test day 65.
Figure 18. VCD–5 10 µm pore size filter used during WRT Stage 10.
4.4.2.1.5 High Temperatures and Pressures in the Still. As shown in figures 19 and 20, at the begin-ning of a processing cycle, high temperatures and pressures occurred in the still during the first 40 minbefore coming down to the desired ranges. The temperature was measured at the outlet of the compres-sor (vt1) and indicated the temperature close to the gears. The temperature spiked above the alarm set-point of 93 °C (200 °F) due to the excessive load on the compressor and/or inadequate cooling of thegears. The pressure was measured in the condenser (vp1) and reached about 60 mmHg. These sameconditions occurred during previous testing (see the Stage 9 report 8) and were attributed to air in thewastewater tank collecting at the top of the tank, where the outlet is located, and being injected into thestill (in microgravity the air would likely be more evenly distributed throughout the liquid). Therefore,until liquid was injected into the still, no evaporative cooling would occur. The condition of the com-pressor gears was also found to be a factor. After test day 37, when the Vespel gear was replaced, thetemperature and pressure spikes were reduced considerably, to within the desired ranges (as shown infigures 21 and 22). After test day 65, when a sample port (number 19) was added to the top of the feedtank, the temperatures and pressures at startup were reduced further (as shown in figures 23 and 24). Inthe process of collecting samples of the feed mixture, at the beginning of each processing cycle, the airwas purged from the supply line. The transition time required to reach normal operating conditions wasreduced from over 3 hr to under 2 hr, due to replacing the Vespel gear and purging air prior to a pro-cessing run.

29
Figure 19. VCD–5 compressor outlet temperature (WRT Stage 10 test days 11 and 12).
0
50
100
150
200
250
11.0 11.2 11.4 11.6 11.8 12.0 12.2 12.4 12.6
Test Day
d
vt1
Figure 20. VCD–5 condenser pressure (WRT Stage 10 test days 11 and 12).
0
10
20
30
40
50
60
11.0 11.2 11.4 11.6 11.8 12.0 12.2 12.4 12.6
Test Day
H
vp1
Com
pres
sor O
utle
t Tem
pera
ture
(°F)
Cond
ense
r Pre
ssur
e (m
mHg
)

30
Figure 21. VCD–5 compressor outlet temperature (WRT Stage 10 test days 40 and 41).
Figure 22. VCD–5 condenser pressure (WRT Stage 10 test days 40 and 41).
0
50
100
150
200
250
40.40 40.60 40.80 41.00 41.20 41.40
Test Day
vt1
0
10
20
30
40
50
60
40.40 40.60 40.80 41.00 41.20 41.40
Test Day
vp1
Cond
ense
r Pre
ssur
e (m
mHg
)
Com
pres
sor O
utle
t Tem
pera
ture
(°F)

31
Figure 23. VCD–5 compressor outlet temperature (WRT Stage 10 test days 68 and 69).
Figure 24. VCD–5 condenser pressure (WRT stage 10 test days 68 and 69).
0
50
100
150
200
250
68.6 68.8 69.0 69.2 69.4 69.6
Test Day
vt1
0
10
20
30
40
50
60
68.6 68.8 69 69.2 69.4 69.6
Test Day
vp1
Com
pres
sor O
utle
t Tem
pera
ture
(°F)
Cond
ense
r Pre
ssur
e (m
mHg
)

32
Figure 25 shows the condenser temperature (vt4) calculated from the operating pressure (by theVCD software based on saturated steam correlations) during nominal processing of a batch of pretreatedurine. This is typical of the operating temperature curves for the VCD–5.
Figure 25. VCD–5 calculated condenser temperature (WRT Stage 10 test days 68 and 69).
Calc
ulat
ed C
onde
nser
Tem
pera
ture
(°F)
65
70
75
80
85
90
95
100
105
68.6 68.7 68.8 68.9 69 69.1 69.2 69.3 69.4 69.5 69.6
Test Day
d
vt4
4.4.2.1.6 High Conductivity Alarms. During the transition from standby to normal, reprocessing of theproduct water occurs while the pumps and motors are coming up to speed. Then after the fluids pump isup to speed, the product water conductivity sensor (K1) checks the conductivity of the product water andif it meets specification then the reprocessing valve (V2) switches to deliver product water, and within1 to 2 min the transition to normal is completed.
If the water does not meet the specification when the transition to normal occurs then a highconductivity warning is initiated and V2 switches back to reprocessing for up to 15 min. Within the15 min period, if the conductivity of the water drops below 120 µmho/cm for 2 min then V2 cycles toproduct. If the conductivity is still high at the end of the 15 min period then an alarm is initiated andthe VCD shuts down.
Repeatedly, throughout much of the test, at the beginning of a processing cycle K1 would indi-cate high conductivity (>250 µmho/cm) which could lead to shutdown. In order to prevent shutdown,if the water was still above specification near the end of the 15 min period, K1 was disconnected (whichsends a reading of 0) which caused V2 to cycle to product. K1 was then reconnected within a few sec.Upon reconnection, K1 indicated high conductivity and V2 cycled back to reprocessing for another
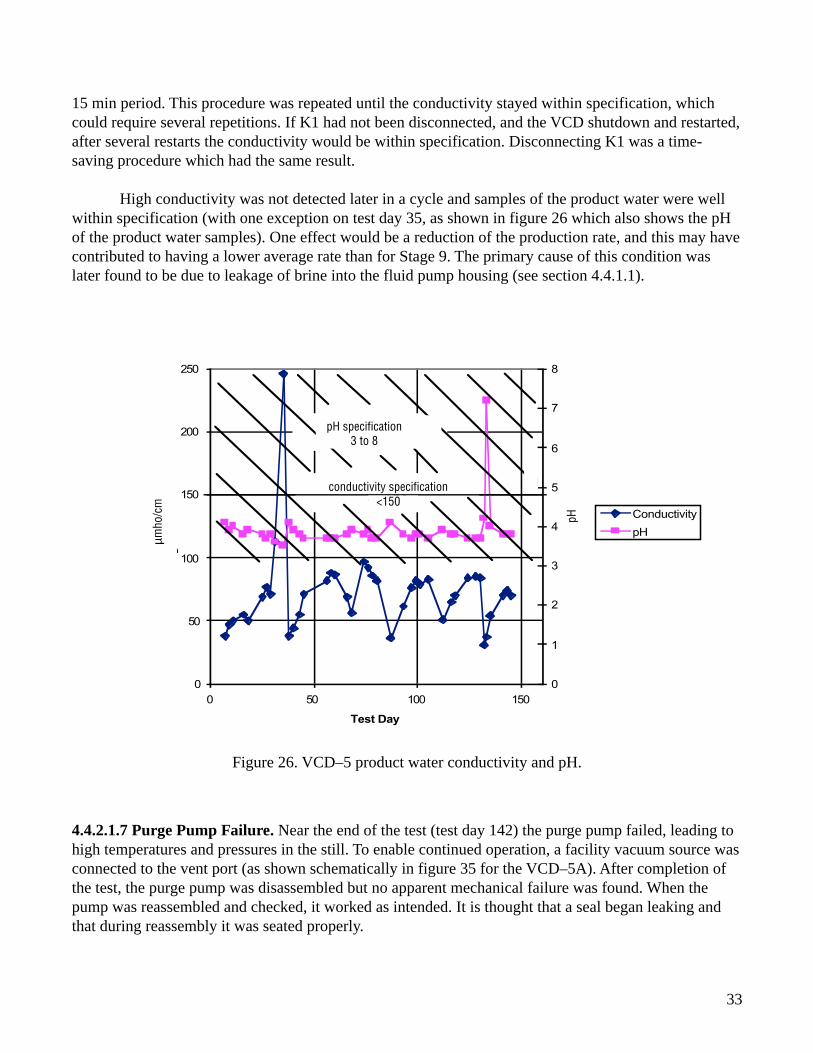
33
15 min period. This procedure was repeated until the conductivity stayed within specification, whichcould require several repetitions. If K1 had not been disconnected, and the VCD shutdown and restarted,after several restarts the conductivity would be within specification. Disconnecting K1 was a time-saving procedure which had the same result.
High conductivity was not detected later in a cycle and samples of the product water were wellwithin specification (with one exception on test day 35, as shown in figure 26 which also shows the pHof the product water samples). One effect would be a reduction of the production rate, and this may havecontributed to having a lower average rate than for Stage 9. The primary cause of this condition waslater found to be due to leakage of brine into the fluid pump housing (see section 4.4.1.1).
Figure 26. VCD–5 product water conductivity and pH.
pH
0
50
100
150
200
250
0 50 100 150
Test Day
m
ho
0
1
2
3
4
5
6
7
8
Conductivity
pH
pH specification3 to 8
conductivity specificatio< 150
µmho
/cm
pH
pH specification3 to 8
conductivity specification<150
4.4.2.1.7 Purge Pump Failure. Near the end of the test (test day 142) the purge pump failed, leading tohigh temperatures and pressures in the still. To enable continued operation, a facility vacuum source wasconnected to the vent port (as shown schematically in figure 35 for the VCD–5A). After completion ofthe test, the purge pump was disassembled but no apparent mechanical failure was found. When thepump was reassembled and checked, it worked as intended. It is thought that a seal began leaking andthat during reassembly it was seated properly.

34
4.4.2.1.8 Recycle/Filter Tank. After cleaning of the recycle tank and replacement of the filter, it takestwo cycles of the wastewater supply tank (fill and drain) to fill the recycle tank before processing isinitiated. The recycle/filter tank cleanings and filter replacements are listed in table 9. The filters usedduring WRT Stage 10 were: single 10 µm pore size Osmonics Flotrex pleated filter (flight-like) usedinitially, single 30 µm pleated filter (used two times), and double 25 µm spiral wound filter. Initially the10 µm filters were used, until December 5, 1996 when a 30 µm filter was installed in order to determinewhether there was a significant difference in performance of the different filters. For the last processingcycle, two 25 µm filters were used (the same type as used on all previous VCD testing at MSFC prior tostage 10), also to compare the performance. No significant difference in water processing rate or qualitywas apparent. The conditions of the filters showed variation, but this was true even when the same typefilters were used. The reasons for this variation may be related to different amounts of water processed(related to the method for calculating percentage of solids in the recycle tank, see section 4.4.2.1.4) aswell as the different types of filters used. Further testing is needed to determine the reasons for thisvariability and whether this could pose a problem.
Table 9. VCD–5 recycle/filter tank cleaning/filter replacement during WRT Stage 10.
Test Day
0
35
50
61
84
108
131
Notes
Start of test on 10/1/96 Stopped due to gear wear, not solids buildup in the brine. Removed for inspection and addition of a ∆P sensor and an inlet P transducer, not cleaned, no filter replacement Replaced with 30 µm, tank filling failed, drained tank and reevacuated, V4 did not close which drained the feed tank too low, resulting in Q1 low alarm replacement based on throughput, not Q3 replaced with two 25 µm filters to compare buildup of solids replaced with original single element pleated 10 µm filter
Filter
10 µm
Osmonics Flowtrex
10 µm
not replaced
10 µm
30 µm
30 µm
25 µm (two filters)
Condition
New bottom 3/4 of filter coated with thick brown-red brine, bottom of tank with thick white/yellow sludge 12.7% CL1, tank fluid was dark and the filter was dark (no solids on filter) 24.7% CL1, larger crystals were found in the brine than on 11/4 22.2% CL1, similar condition but not as bad. All slots on plastic sleeve filled with solids. 24.93% CL1, no crystals on filter mount, white crystals on filter 21.4% CL1, light tan tint, some small formations of light brown crystals, no thick brown solids, white solids on bottom of tank
Date Removed
9/30/96
11/4/96
11/19/96
12/5/96
1/14/97
2/7/97
3/6/97
4.4.2.2 VCD–5 Performance. The VCD–5 production rate is shown in figure 27, which also showswhen the recycle tank cleanings and filter replacements occurred during the test and the type of filterused. Tank cleaning and filter replacement occurred when the throughput of urine to the VCD–5 reachedapproximately 182 kg (400 lb). The VCD–5 averaged 1.93 kg/hr (4.25 lb/hr) during the test, below the

35
specified processing rate of 2.04 kg/hr (4.5 lb/hr) for the ISS, which was achieved during Stage 9 testing.The production rates were determined by dividing the amount of water processed in a batch by thenumber of hours the VCD–5 was in operation. The duration of operation includes the transition periodsfrom standby to normal operation (which may take an hour or more) and from normal to standby (whichtakes from 5 to 10 min), and periods of reprocessing. The production rate decreased over time as thesolids concentration increased in the recycle loop. The rate increased each time the recycle tank wascleaned. The VCD–5 recovered about 88 percent of the pretreated urine and CHeCS wastewater. Thisrecovery rate is similar to previous testing conducted with the VCD–5. Differences in water recovery aregenerally due to the timing of the cleaning of the recycle/filter tank.
Figure 27. VCD–5 product water production rate during WRT Stage 10.
4.4.2.3 VCD–5 Product Water Quality. The water quality specifications and average water quality datafor the VCD–5 distillate are shown in table 10. The TOC, total inorganic carbon (TIC), and total carbonare graphed in figure 28. In general, the water quality was considered nominal for the VCD–5, and waswell within the specified level. The only exception was on test day 35 when the TOC reached 105 mg/L.The reason for this may be related to the mechanical problems experienced on that day due to wear ofthe Vespel gear. As shown in figure 26, the pH and conductivity are well within specification, with theonly exception on test day 35 when the conductivity reached 246 µmho/cm. On test day 133 the pHshowed a spike to 7.2. The reason for this has not been determined. No differences in water quality wereattributed to adding CHeCS water or to the urine pretreatment tablets, although the average conductivitywas about 12 µmho/cm higher than for Stage 9, and higher than the 40 to 60 µmho/cm (occasionallyabove 70) during life testing in 1993 and 1994. Even so, the average conductivity was well below theISS specification of 150 µmho/cm maximum.
0
2
4
6
8
10
12
14
0 20 40 60 80 100 120 140 160
Test Day
lb/h
* recycle/filter tank cleaned
two 25 micron filters
30 micronfilter
10 micronfilter
purge pumpfailure
sample port19 added
Vespel gearreplaced
* * * * * *
10 micronfilter
lb/h
r

36
Figure 28. VCD–5 product water carbon composition during WRT Stage 10.
Table 10. VCD–5 product water quality during WRT stage 10.
Parameter Specification Units Average for Stage 10 # of Samples
Conductivity <150 µmho/cm 72.10 41
pH 3 to 8 pH 3.90 41
Total Organic Carbon <50 mg/L 23.49 41
4.4.2.4 VCD–5 Conclusions and Recommendations from the WRT Stage 10. Overall, the quality ofthe product water was well within the specified levels, increasing confidence in the ability of the VCD toproduce water meeting the required specifications. The production rate (1.93 kg/hr, 4.25 lb/hr) wassomewhat below the specified rate (2.04 kg/hr, 4.50 lb/hr), but the reasons for this may be related to theshutdowns that occurred during processing cycles and additional reprocessing due to high conductivityreadings. The shutdowns were caused by other subsystems being tested (the WP), or by VCD–5anomalies such as the Vespel gear failure and its related problems. The variation in condition of thefilters needs further investigation to determine the reasons for this variability and whether this couldpose a problem during flight operations.
0
20
40
60
80
100
120
0 20 40 60 80 100 120 140 160
Test Day
mg/L
Total C
TIC
TOC
TOC Specification < 50 mg/L

37
4.5 VCD–5A Testing
The VCD–5A life test began on January 12, 1993 and ran until November 9, 1995 (612 test days)with additional testing (Purge Gas Test) after some repairs were made, until April 24, 1996, for a total of665 test days. A Gantt chart of the VCD–5A operation is shown in figure 29. Plots of typical operatingconditions for the compressor temperature (T1), compressor motor current (I1), and condenser pressure(P1) are shown in figures 30, 31, and 32, respectively. The total mass of wastewater/urine processed was5,198 kg (11,449 lb) until November 9, 1995. The overall average production rate was, therefore,1.76 kg/hr (3.87 lb/hr) for 2,960 hours in normal, through November 9, 1995. The quality of the productwater (measured by conductivity as shown in figure 33) was well below the specified limit (150 µmho/cm)except for a few momentary spikes. The conductivity increased until the recycle filter tank was replaced,when it would drop to about 25 µmho/cm. The composition of the product water and the brine are listed intable 11.
Activity Name
Normal Test Operations (Test Days Only)
Shutdown
Anomaly: VCD–5A–1 Flex Spline Failure
Anomaly: VCD–5A–2 Feedline Check Valve
Anomaly: VCD–5A–3 Flex Spline Failure
Anomaly: VCD–5A–4 Purge Pump Failure
Anomaly: VCD–5A–5 Compressor Differential Pressure Sensor (VP2)
Anomaly: VCD–5A–6 Waste Recycle Pressure Sensor (VP2)
Anomaly: VCD–5A–8 Condensor Pressure Sensor (VP1)
Anomaly: VCD–5A–7 Peristatic pump tubing particles
Anomaly: VCD–5A–9 Compressor Gears
665 (Test Days)
117 (Shut
downs)
45
551
90
6
383
343
28
118
74
Go Status
Anomaly
Resolution
Down Time
Anomaly Review
Total Days
1992 1993O N D J F M A M J J A S O N D J F M
1994 1995 1996A M J J S O N DA F M AJ J J AM O N D J F M A M JS
Figure 29. Gantt chart of VCD–5A operation.

38
Figure 30. VCD–5A typical compressor temperatures (T1).
Figure 31. VCD–5A typical motor current (I1).
7 8 9 10 11 1203/18/94 06:40
Calendar Time (hr) Minor Tick = 5 min
03/18/94 12:24
DC Motor Current VI1
Averaged Data10
9
8
7
6
5
4
3
2
1
0
Amps
7 8 9 10 11 1203/18/94 06:40
Calendar Time (hr) Minor Tick = 5 min
03/16/94 12:24
Compres Out Temp VT1
Averaged Data160
150
140
130
120
110
100
90
80
Tem
pera
ture
(˚F)

39
Figure 32. VCD–5A typical condenser pressures (P1).
Figure 33. VCD–5A product water conductivity.
7 8 9 10 11 1203/18/94 06:40
Calendar Time (hr) Minor Tick = 5 min
03/18/94 12:24
Condenser Press VP1
Averaged Data
30
28
26
24
22
20
18
16
150
100
50
00 25 50 75 100 125 150 175
Test Week
Cond
uctiv
ity (µ
mho
/cm
)m
mHg

40
Table 11. VCD–5A product water and brine compositions.
Characteristic
Product Water Composition pH conductivity turbidity TOC TIC TC Particles: 0-5 µm particles 5.1-10 µm particles 10.1-40 µm particles 40.1-100 µm particles Brine composition Refractive Index Specific Gravity Solids Conc. (BS)* Solids Conc. (UJ)* Solids Conc. (UP)*
Test Day
µmho/cm NTU mg/L mg/L mg/L
particles/mL particles/mL particles/mL particles/mL
% % %
87
3.8 70
0.1 22.5 1.11
24
18.4 2.2
<1.0 <1.0
1.363 1.104 21.34 16.15 19.29
92 30
Aug 93
4 43.4 0.1
13.3 <1.0
13
64.5 10
<1.0 <1.0
1.343 1.033 7.07 5.27 6.70
97
3.8 61.6 0.2
18.7 1.67
20
74.2 8.86 <1.0 <1.0
1.352 1.066 13.49 10.17 12.37
104
3.8 72.4 <0.1 24.3 4.71
29
57 3.52 <1.0 <1.0
1.363 1.103 21.34 16.15 19.29
106 20
Sep 93
4 44.4 0.2
14.5 <1.0
15
79.5 7.95 <1.0 <1.0
1.341 1.026 5.64 4.19 5.44
111
4 56.9 0.4
19.1 2.68
23
44.3 4.78 <1.0 <1.0
1.351 1.062 12.78 9.62
11.74
116
3.8 68
<0.1 19.4 2.45
22
63.8 2.9
<1.0 <1.0
1.355 1.075 15.63 11.80 14.26
121
17.7 <1.0
18
47.5 2.92 <1.0 <1.0
1.36 1.093 19.20 14.52 17.40
125 18 Oct 93
4 41.9 0.1
19.7 2.36
22
32 <2.0 <1.0 <1.0
1.338 1.018 3.50 2.56 3.56
130
4 50.2 <0.1 13.6 2.23
16
70.9 5.5
<1.0 <1.0
1.345 1.042 8.49 6.36 7.96
135
3.8 62
0.9 16.1
<1. 0 16
42.9 4.92 <1.0 <1.0
1.351 1.063 12.78 9.62
11.74
140
18.7 1.57
20
54.7 3.55 <1.0 <1.0
1.356 1.084 16.35 12.34 14.88
144 15
Nov 93
4 47.2 <0.1
52.9 3.38 <1.0 <1.0
1.342 1.026 6.35 4.73 6.07
152
3.8 64.7 <0.1
45.9 3.25 <1.0 <1.0
1.353 1.07
14.20 10.71 13.00
162 13
Dec 93
4 44.9 0.1
167
3.9 55.9 0.1
45.1 2.4
<1.0 <1.0
1.349 1.058 11.35 8.54
10.48
149
3.9 61
<0.1
40.4 <2.0 <1.0 <1.0
1.349 1.061 11.35 8.54
10.48
Double vertical lines indicate cleaning of the recycle filter tank and replacement of the filters. * Note: The Solids Concentration is calculated based on the refractive index and specific gravity of the brine. Three different methods were compared to calculate the % solids: BS = Boeing Services, UJ = Umpqua Jolly, and UP = Umpqua Putman.
Date Units

41
Wastewater WastewaterDate Test Day Elapsed Days
Processed (kg) Processed (lb)
2/4/93 16 16 161.90 356.602/26/93 32 16 165.08 363.623/18/93 45 13 147.40 324.667/15/93 59 14 147.36 324.588/4/93 73 14 174.35 384.03
8/25/93 89 16 167.23 368.359/17/93 104 15 160.17 352.79
10/18/93 124 20 168.38 370.8811/10/93 142 18 163.59 360.32
12/7/93 157 15 167.88 369.781/6/94 177 20 164.48 362.302/4/94 197 2 180.99 398.663/7/94 218 20 171.99 378.834/7/94 239 21 159.51 351.35
5/16/94 266 27 143.26 315.546/23/94 292 26 148.22 326.488/3/94 319 27 167.67 369.329/9/94 340 21 173.99 383.23
10/16/94 364 26 171.68 378.1611/22/94 392 26 151.19 333.01
1/24/95 424 32 159.93 352.272/24/95 446 22 135.36 298.153/22/95 465 19 150.26 330.965/8/95 485 20 137.76 303.436/6/95 506 21 160.06 352.56
6/26/95 520 14 109.91 242.097/19/95 534 14 89.29 196.68,
stopped early touse brine for ersatz testing
8/21/95 556 22 157.99 348.009/14/95 573 17 105.01 231.31
10/23/95 599 26 196.02 431.76
The recycle filter replacements and the amounts of water processed through each filter are shownin table 12 and plotted in figure 34. The average lifetime of the filters was 20.3 days of operation.The duration of operation of the VCD–5A through November 9, 1995 was:
Total hours powered 21,650Hours in Shutdown 816Hours in Normal 2,960Hours in Standby 17,027Hours in Transition 847Hours on the still motor 3,107Hours on the fluids pump 3,076Hours on the purge pump 1,285
An additional 459 kg (1,011 lb) of wastewater was processed through April 24, 1996 (including thePurge Gas Test).
Table 12. VCD–5A wastewater processed between filter replacements.
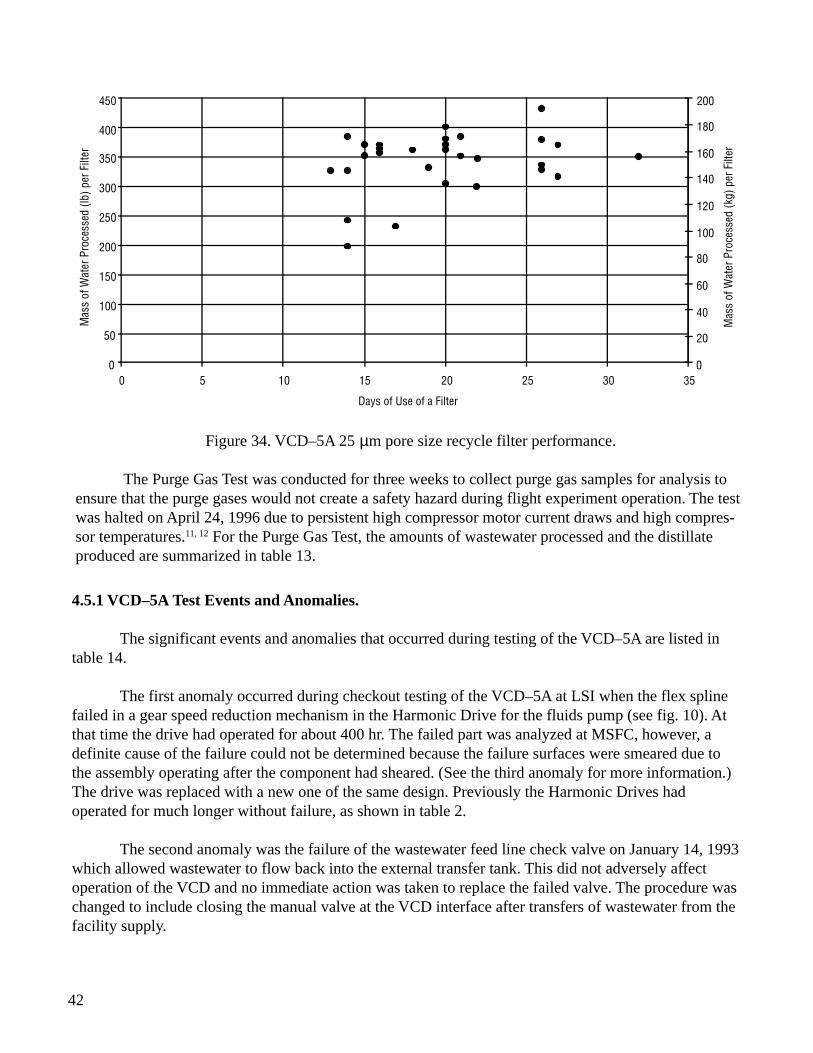
42
4.5.1 VCD–5A Test Events and Anomalies.
The significant events and anomalies that occurred during testing of the VCD–5A are listed intable 14.
The first anomaly occurred during checkout testing of the VCD–5A at LSI when the flex splinefailed in a gear speed reduction mechanism in the Harmonic Drive for the fluids pump (see fig. 10). Atthat time the drive had operated for about 400 hr. The failed part was analyzed at MSFC, however, adefinite cause of the failure could not be determined because the failure surfaces were smeared due tothe assembly operating after the component had sheared. (See the third anomaly for more information.)The drive was replaced with a new one of the same design. Previously the Harmonic Drives hadoperated for much longer without failure, as shown in table 2.
The second anomaly was the failure of the wastewater feed line check valve on January 14, 1993which allowed wastewater to flow back into the external transfer tank. This did not adversely affectoperation of the VCD and no immediate action was taken to replace the failed valve. The procedure waschanged to include closing the manual valve at the VCD interface after transfers of wastewater from thefacility supply.
Figure 34. VCD–5A 25 µm pore size recycle filter performance.
The Purge Gas Test was conducted for three weeks to collect purge gas samples for analysis toensure that the purge gases would not create a safety hazard during flight experiment operation. The testwas halted on April 24, 1996 due to persistent high compressor motor current draws and high compres-sor temperatures.11, 12 For the Purge Gas Test, the amounts of wastewater processed and the distillateproduced are summarized in table 13.
0
50
100
150
200
250
300
350
400
450
0 5 10 15 20 25 30 35
Days of Use of a Filter
Mas
s of
Wat
er P
roce
ssed
(lb)
per
Filt
er
0
20
40
60
80
100
120
140
160
180
200
Mas
s of
Wat
er P
roce
ssed
(kg)
per
Filt
er
43
Table 13. Purge gas test wastewater processing.
Test Day Urine Processed kg (lb) Distillate Produced kg (lb) % Recovery
1 Batch 1
12.11
(26.68)
12.55 (27.65)
103.6
1 Batch 2
12.21
(26.90)
11.37 (25.05)
93.1
2
20.22 (44.54)
18.89
(41.60)
93.4
3
25.03 (55.13)
23.70
(52.20)
94.7
4
11.71 (25.79)
10.79
(23.77)
92.2
5
16.91 (37.25)
15.89
(35.00)
94.0
6
12.31 (27.12)
11.42
(25.16)
92.8
7
10.31 (22.71)
9.53
(20.99)
92.4
8
9.11 (20.06)
7.97
(17.56)
87.5
9
6.29 (13.85)
6.17
(13.64)
98.5
10
5.61 (12.35)
5.08
(11.20)
90.7
11
6.01 (13.23)
5.49
(12.10)
91.5
12
5.71 (12.57)
5.06
(11.14)
88.6
13
5.91 (13.01)
5.42
(11.93)
91.7
Total
159.44 (351.19)
149.36
(328.99)
93.7
Event/Anomaly Description Fluids pump stopped due to harmonic drive failure. Test started Feed line check valve allows back flow into the external transfer tank. Harmonic drive failure. Purge pump failure. Compressor differential pressure sensor (P2) failure. Waste recycle pressure sensor (P3) failure. Peristaltic purge pump tubing particles. Condenser pressure sensor (VP1) failure. High T1, high T2, high K1, and water coming out purge line. (Compressor gears worn out after 4831 hours of operation.) Facility vacuum used to assist the purge pump during Purge Gas Testing. Compressor and still will not rotate.
Date Occurred
10/20/92 1/12/93 1/14/93 3/30/93 6/25/93 7/2/93 8/9/93 1/11/94 8/26/94 11/9/95 6/27/96
Actionee Hutchens, Long, Salyer Hutchens, Long, Salyer Hutchens, Long, Salyer Hutchens, Long, Salyer Hutchens, Long, Salyer Hutchens, Long, Salyer Hutchens, Long, Salyer Hutchens, Long, Salyer Wieland, Long, Salyer Wieland, Long, Salyer
12/17/92 7/19/94 6/24/93 7/1/93 7/9/93 7/19/94 2/8/94 12/21/94 1/19/96 7/31/97
Action to Resolve Anomaly Harmonic drive replaced. Cause not determined. Procedure change to close valve after wastewater transfer. Determined misalignment caused failure. Failed electronics in the signal conditioner were replaced. No action required since the sensor is not critical to data evaluation and is not included in the flight configuration. Flight-like sensor installed. New material resistant to corrosive environment that caused initial failure. An inspection will be made periodically to monitor buildup of material. Replaced with sensor made of Hastelloy C. Replaced compressor gears and the drive o-ring. Compressor and still bearings rebuilt in-house by MSFC personnel.
Anomaly Number
VCD-5A-1 VCD-5A-2 VCD-5A-3 VCD-5A-4 VCD-5A-5 VCD-5A-6 VCD-5A-7 VCD-5A-8 VCD-5A-9 VCD-5A-10
Date Closed Out
Bold indicates that a flight-like component is affectedTable 14. VCD–5A significant events and anomalies.

44
The third anomaly was another failure of the fluids pump, after 51 days of testing at 362 hr ofoperation. The failure was similar to that which occurred during checkout at LSI. A flex spline in the Har-monic Drive of the fluids pump failed in both cases. The exhaustive 3-month investigation which followeddetermined that the failures resulted from a slight horizontal misalignment (0.127 mm (0.005 in.)) intro-duced into the pump drive shaft during its assembly at the hardware supplier. The manufacturer (HarmonicDrive Technologies) said that misalignment of the spline could overstress it and lead to fatigue failure. Thepotential for this problem may have been introduced into the pump during retrofit at the hardware vendor(to support the drive shaft at both ends, see sec. 2.3.2 about the retrofit), since during previous testing whenthe pump drive shaft was a cantilever design the Harmonic Drive operated for a much longer period of time.The vendor has implemented use of a new alignment jig during hardware assembly to ensure proper align-ment. This jig will be used for flight hardware assembly. The pump was sent back to the supplier, the partreplaced, and the misalignment corrected. Testing resumed on June 25, 1993, but the purge pump did notreceive power, due to the fourth anomaly.
The fourth anomaly was failure of the purge pump electronics. This problem was traced to a failedpower converter and capacitor on the purge pump controller card. These items were replaced and testingresumed on July 2, 1993. This failure did not affect any flight-like components.
The fifth anomaly occurred when the VCD–5A was restarted on July 2, 1993 and the compressordifferential pressure sensor (P2) was nonfunctional. No actions were taken since the P2 sensor is not criticalto data evaluation and is not included in the flight configuration.
The sixth anomaly was failure of the waste recycle pressure sensor (P3) on August 9, 1993. Thissensor is flight-like in function (although the flight sensor will be somewhat different). LSI provided atemporary replacement sensor so the failed sensor could be analyzed. The temporary sensor was installedon August 30, 1993. Even without the P3 sensor, system backup features would allow operation of theVCD–5A.
The seventh anomaly was related to the Norprene tubing used in the peristaltic purge pump. Thispump uses the same tubing as the fluids pump although it pumps a two-phase mixture which is mostly gas.This application was found to cause spalling of the Norprene which resulted in clogging of the gas/liquidseparator with Norprene particles. The initial resolution suggested by the hardware supplier was to add afilter downstream of the pump to prevent gas/liquid separator clogging. An inspection of the air/waterseparator was made every 30 days to avoid buildup of particles.
The eighth anomaly was failure of the condenser pressure sensor (P1). This sensor was replacedwith a sensor made of Hastelloy C, a high nickel, molybdenum, and chromium alloy that is more resistantto corrosion.
The ninth anomaly involved high temperature alarms and liquid coming out of the purge line. TheVCD–5A was deactivated until repairs could be made by LSI. The operating time on the compressor gearsand the drive belt was estimated to be 4,831 hr including time before the Life Test began. The compressorgears and the centrifuge drive belt were found to be worn and were replaced. This anomaly and field serviceis discussed further in section 4.5.2.

45
The tenth anomaly was failure of the compressor and centrifuge to rotate due to worncompressor and still bearings. More torque was required than the motor generated. The compressor andstill bearings were rebuilt by MSFC personnel.
Facility vacuum was used to assist the purge pump when leakage exceeded the pump capacity toadequately evacuate the pump housings and purge the condenser. The facility vacuum was connected asshown in figure 35.
During test days 613 through 665 the VCD–5A processed 460.0 kg (1,011.3 lb) of waste feedaveraging about 3.6 lb/hr. The recycle filter tank was replaced on test days 626 and 651.
4.5.2 VCD–5A Field Service
Beginning on September 25, 1995 there were alarms and shutdowns due to high compressortemperatures. On November 9, 1995 (test day 612), testing was halted due to continued degradationeven with the facility vacuum assisting, indicated by gradually increasing temperatures and current load,leading to shutdown. The symptoms at that time were:
1. Excessive noise from the compressor2. High current loads—From the normal 6 to 7A the current increased to 10 to 12A with a startup
spike up to 19A (see fig. 36)3. Compressor temperatures increased from the normal 77 °C (170 °F) to >93 °C (200 °F). This
appears to stem from the high operating pressure inside the distillation unit (see fig. 36)4. Slippage of the centrifuge during startup was occurring more frequently.
Coolant�Out
Coolant�In
Cooling Jacket
Inlet Manifold
Purge Line
Casing Connection
Casing Connection
Fluids Pump
Purge PumpDistillation
Assembly
Outlet Manifold
Facility Vacuum
Cold Trap
Gas/condensate
Figure 35. Facility vacuum connection to the purge and fluids pumps.

46
Also, moisture was still found in the moisture trap in the facility vacuum line which indicatedleakage of ambient air into the pump housing or through the pump tubing.
Figure 36. VCD–5A current, temperature, and pressure profiles in November 1995.
A field service was arranged to correct the problems. Due to a government furlough, the fieldservice was postponed until January 16, 1996. Prior to disassembly, a pressure check was performed thatshowed no leakage into the still. The VCD–5A was then transitioned to normal mode. A loud noise camefrom the VCD–5A and the compressor motor drew excessive current (17A). The VCD–5A was switchedoff and disassembled.
The following conditions were noted upon disassembly of the VCD–5A:
• An O-ring seal was missing between the condenser end plate and the drum. However, there wasno indication of liquid leakage, so the metal-to-metal contact apparently provided an adequateseal.
• Some slight corrosion was evident between the condenser end plate and the drum spokes, asshown in figures 37 and 38.
0
50
100
150
200
250
11/9/9512:00 AM
11/9/952:24 AM
11/9/954:48 AM
11/9/957:12 AM
11/9/959:36 AM
11/9/9512:00 PM
11/9/952:24 PM
11/9/954:48 PM
11/9/957:12 PM
11/9/959:36 PM
11/10/9512:00 AM
Time
Tem
per
atu
re (
°F)
or
Pre
ssu
re (
mm
Hg
A)
0
2
4
6
8
10
12
14
16
18
20
Cu
rren
t (A
)
VP1 (mmHgA)
VT1 (°F)
VI1 (amps)
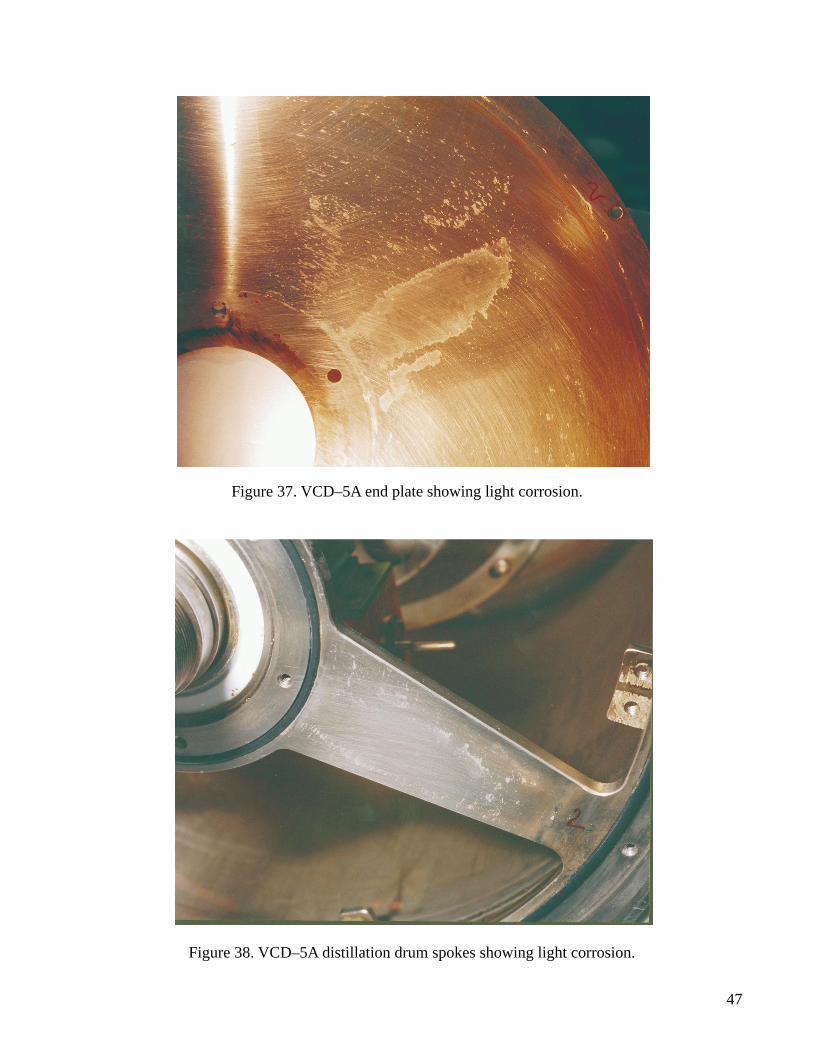
47
Figure 37. VCD–5A end plate showing light corrosion.
Figure 38. VCD–5A distillation drum spokes showing light corrosion.

48
• The wastewater injection tube had a small “blob” of solids (3.2 to 6.4 mm (1/8 to 1/4 in.) thick)around the end of the tube, as shown in figure 39. The opening of the injection tube was notrestricted. This material was hard and was removed as a “chunk.”
Figure 39. VCD–5A wastewater injection tube and product water pickup tube.
• The compressor gears showed wear, with a gap of 0.330 to 0.419 mm (0.013 to 0.0165 in.)rather than the desired 0.152 mm (0.006 in.), but there were no chips or missing teeth. Therewas a coating of Vespel lubricant dust on components of the compressor, as shown in figure 40.Examination under a microscope also showed metallic particles on the Vespel gear. Therecorded time of use for this set of gears is 4,831 hr of cyclic operation. The established life limitfor these gears is 12,000 hr of continuous operation. The condition of the gears indicated thatthey had reached the end of their useful life.
product water pickup tube
wastewater injection tube

49
Figure 40. VCD–5A disassembly showing old compressor gears.
• The centrifuge drive belt from the compressor to the drum was stretched about 14 percent. Therecorded time of use for this drive belt is 4,831 hr, and the condition indicated it had reached theend of its useful life.
New compressor gears were installed and aligned. The backlash gap measured between 0.102and 0.152 mm (0.004 and 0.006 in.). The VCD–5A was then reassembled. On January 17, 1996, theVCD–5A was transitioned to normal mode. The VCD–5A ran well for 30 min and was returned tostandby mode. The motor current (I1) was still slightly high at 13A. The VCD–5A was left in standbyovernight to detect any significant pressure leaks. On January 18, 1996, the measured overnight pressureleakage was only slight (from 37 to 47 mmHg). A second test run was performed for about an hour withno degradation in performance. Again, I1 was slightly elevated at 13A. The VCD–5A was disassembledand a new centrifuge drive belt installed. The compressor gears looked good and the backlash gapremained the same. The VCD–5A was reassembled and restarted. After running for about an hour, I1jumped from 10A to 18A and the VCD–5A alarmed to shutdown mode. No specific cause could befound, but it was thought to be at least partly due to the VCD–5A having been dried out when it wasdisassembled (dry air doesn’t remove as much heat from the compressor as moist air) or too high

50
pressure in the still, which makes the compressor work harder, therefore increasing the current load andoperating temperature. The VCD–5A was restarted, and after 3 hr another jump in I1 caused a shutdown.The VCD–5A was again restarted and ran well the rest of the evening (5 hr). The VCD–5A ran wellagain on January 19, 1996 for 3.5 hr. I1 stayed around 8A.
However, after a period of no operation (such as over a weekend), the unusual behavior was repeatedand shutdown occurred about one hour after startup on the following Monday. When the unit wasrestarted, again, it operated normally and on subsequent days during the week operation was normal. OnMonday of test week 159, January 22, 1996, the condenser pressure increased to 54 mmHg and theVCD–5A required additional power to bring the pressure down to normal operating conditions (32 to 45mmHg). I1 started at 15A and after 15 min dropped to 12.6 A. I1 then jumped to 18A after 45 min innormal and an alarm caused a shutdown. The VCD–5A was immediately restarted and ran nominallywith I1 remaining around 8A. The VCD–5A ran nominally for the remainder of the week, as shown infigures 41 and 42.
Figure 41. VCD–5A compressor temperature (T1) after repairs in January 1996.
6 0
8 0
1 0 0
1 2 0
1 4 0
1 6 0
1 8 0
2 0 0
1/22 6:00 1/22 9:00 1/22 12:00 1/22 15:00 1/22 18:0
DATE
VT1 (°F)
Tem
pera
ture
(°F)
VT1 (°F)
1/22 9:00 1/22 12:00 1/22 15:001/22 6:00 1/22 18:00Date
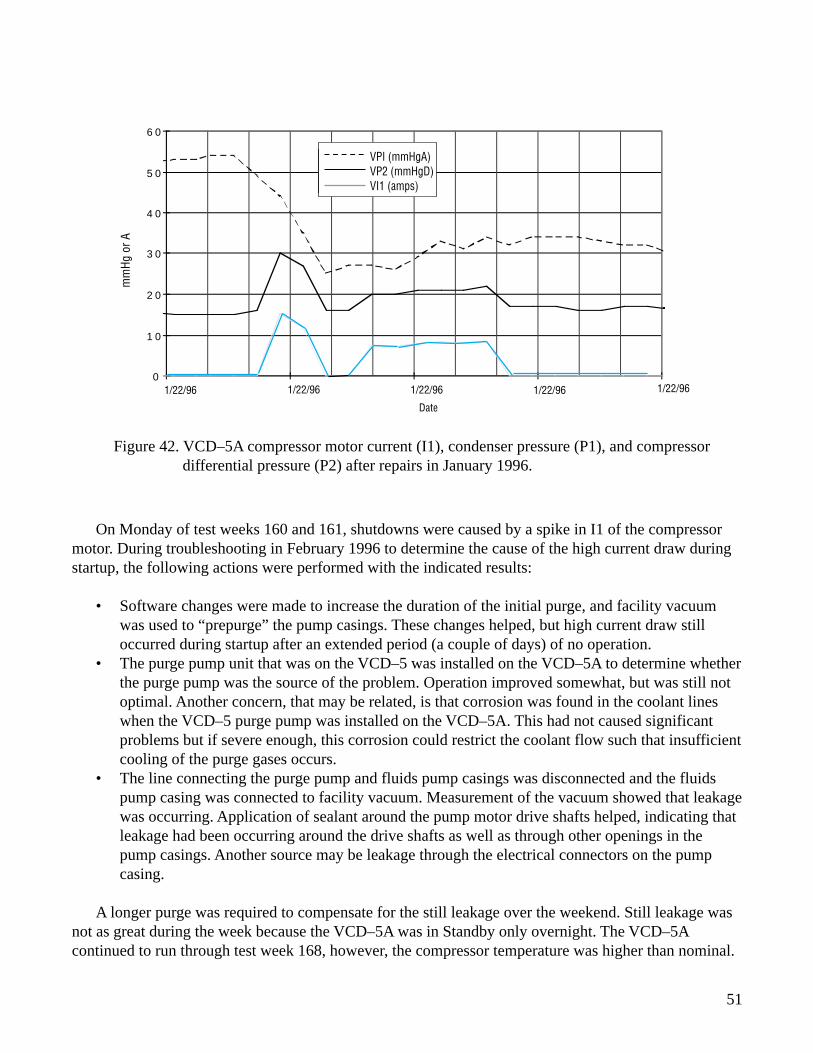
51
Figure 42. VCD–5A compressor motor current (I1), condenser pressure (P1), and compressordifferential pressure (P2) after repairs in January 1996.
0
1 0
2 0
3 0
4 0
5 0
6 0
1 / 2 2 / 9 6 1 / 2 2 / 9 6 1 / 2 2 / 9 6 1 / 2 2 / 9 6 1 / 2 2 / 9
DATE
VP1 (mmHgA)VP2 (mmHgD)VI1 (amps)
On Monday of test weeks 160 and 161, shutdowns were caused by a spike in I1 of the compressormotor. During troubleshooting in February 1996 to determine the cause of the high current draw duringstartup, the following actions were performed with the indicated results:
• Software changes were made to increase the duration of the initial purge, and facility vacuumwas used to “prepurge” the pump casings. These changes helped, but high current draw stilloccurred during startup after an extended period (a couple of days) of no operation.
• The purge pump unit that was on the VCD–5 was installed on the VCD–5A to determine whetherthe purge pump was the source of the problem. Operation improved somewhat, but was still notoptimal. Another concern, that may be related, is that corrosion was found in the coolant lineswhen the VCD–5 purge pump was installed on the VCD–5A. This had not caused significantproblems but if severe enough, this corrosion could restrict the coolant flow such that insufficientcooling of the purge gases occurs.
• The line connecting the purge pump and fluids pump casings was disconnected and the fluidspump casing was connected to facility vacuum. Measurement of the vacuum showed that leakagewas occurring. Application of sealant around the pump motor drive shafts helped, indicating thatleakage had been occurring around the drive shafts as well as through other openings in thepump casings. Another source may be leakage through the electrical connectors on the pumpcasing.
A longer purge was required to compensate for the still leakage over the weekend. Still leakage wasnot as great during the week because the VCD–5A was in Standby only overnight. The VCD–5Acontinued to run through test week 168, however, the compressor temperature was higher than nominal.
VPI (mmHgA) VP2 (mmHgD) VI1 (amps)
1/22/96 1/22/96 1/22/961/22/96 1/22/96
Date
mm
Hg o
r A

52
4.5.3 VCD–5A Operation Summary
From mid-1993 to late-1995 performance was essentially nominal. The problems that did occur wereeasily corrected.
From November 9, 1995 to the end of testing, startup and operation were increasingly assisted byfacility vacuum due to increasing leakage. The compressor gears installed in January 1996 initiallysolved the high compressor temperature (T1) problem. However, as the VCD–5A life test continued,problems developed with high motor current draw (I1) and high compressor temperatures (T1). Leakagein the VCD–5A was greater than could be compensated for by using the facility vacuum. Except forstartup on Mondays, when the VCD–5A had not operated for 2 days, the VCD–5A could have runwithout the facility vacuum, but purge periods would have been longer, so the facility vacuum was usedwhenever the VCD–5A was running. That the weekend downtime created a problem indicates a leakinto the still or pump housings which raised the internal pressure too high for the purge pump toovercome. Life testing of the VCD–5A was halted after completion of the Purge Gas Test onApril 24, 1996.
4.5.4 Proposed Modifications
To address the problems experienced with the VCD–5A, the following modifications have beenfunded in FY98:
• Modify the pump drive shaft seals to make them flight-like (fluids pump and purge pump).• Replace the tubing in the purge pump.• Replace the demister with a flight design (not related to the problems described above).• Replace the recycle/filter tank with a flight design (not related to the problems described above).
In addition, the purge algorithm or setpoints may need to be modified and this modificationimplemented in the ISS VCD/UPA.
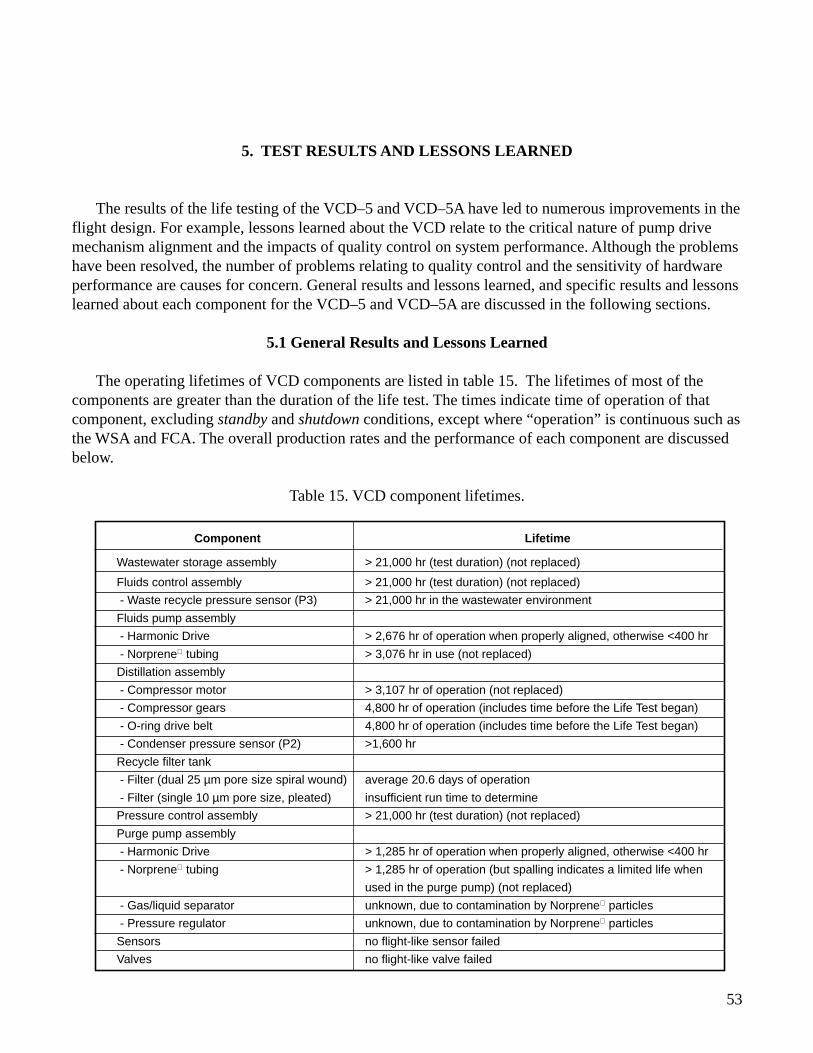
53
5. TEST RESULTS AND LESSONS LEARNED
The results of the life testing of the VCD–5 and VCD–5A have led to numerous improvements in theflight design. For example, lessons learned about the VCD relate to the critical nature of pump drivemechanism alignment and the impacts of quality control on system performance. Although the problemshave been resolved, the number of problems relating to quality control and the sensitivity of hardwareperformance are causes for concern. General results and lessons learned, and specific results and lessonslearned about each component for the VCD–5 and VCD–5A are discussed in the following sections.
5.1 General Results and Lessons Learned
The operating lifetimes of VCD components are listed in table 15. The lifetimes of most of thecomponents are greater than the duration of the life test. The times indicate time of operation of thatcomponent, excluding standby and shutdown conditions, except where “operation” is continuous such asthe WSA and FCA. The overall production rates and the performance of each component are discussedbelow.
Table 15. VCD component lifetimes.
Component Lifetime
Wastewater storage assembly > 21,000 hr (test duration) (not replaced)
Fluids control assembly > 21,000 hr (test duration) (not replaced)
- Waste recycle pressure sensor (P3) > 21,000 hr in the wastewater environment
Fluids pump assembly
- Harmonic Drive > 2,676 hr of operation when properly aligned, otherwise <400 hr
- Norprene tubing > 3,076 hr in use (not replaced)
Distillation assembly
- Compressor motor > 3,107 hr of operation (not replaced)
- Compressor gears 4,800 hr of operation (includes time before the Life Test began)
- O-ring drive belt 4,800 hr of operation (includes time before the Life Test began)
- Condenser pressure sensor (P2) >1,600 hr
Recycle filter tank
- Filter (dual 25 µm pore size spiral wound) average 20.6 days of operation
- Filter (single 10 µm pore size, pleated) insufficient run time to determine
Pressure control assembly > 21,000 hr (test duration) (not replaced)
Purge pump assembly
- Harmonic Drive > 1,285 hr of operation when properly aligned, otherwise <400 hr
- Norprene tubing > 1,285 hr of operation (but spalling indicates a limited life when
used in the purge pump) (not replaced)
- Gas/liquid separator unknown, due to contamination by Norprene particles
- Pressure regulator unknown, due to contamination by Norprene particles
Sensors no flight-like sensor failed
Valves no flight-like valve failed

54
5.1.1 Variation of Production Rate
The calculated average production rates of the VCD/UPA’s that have been tested at MSFC haveshown significant variation, ranging from 1.48 to 2.04 kg/hr (3.25 to 4.50 lb/hr). The reasons for thisvariation relate to:
• Hardware variability due to differences in pump performance, quality control, etc.• Operational variability due to shutdowns, component failures, facility variability, etc.• Methods for calculating the production rate.
Regarding the calculation methods, during the course of testing VCD/UPA’s at MSFC, the data hasbeen recorded in different manners for different tests. The single largest variable has been the transitiontime from standby to normal and from normal to standby. For some testing, transition times were notseparately recorded, resulting in apparently reduced production rates. The duration of the transitiontimes also has varied considerably due to hardware condition and operation procedures. Thoroughlyevacuating the purge pump and fluids pump casings reduces the transition durations, thereby increasingthe effective processing rate when transition periods are used in calculating the processing rate.
Another factor is calculating the production rate using the product water versus using the inputwastewater. When input wastewater is used for the calculation the processing rate is higher, obviously,than when the product distillate is used.
The effects of using different methods to calculate the processing rate are shown in table 16. While itis likely that the production rate of the VCD–5 was greater than the production rate of the VCD–5A, dueto the variability in transition durations the calculated production rates shown in the table cannot bedirectly compared. This was not realized for all testing and the normal operating duration was notalways recorded. To ensure accurate comparison of different test runs, the same procedures forcalculating the production rate must be used. It is recommended that input wastewater mass, productdistillate mass, and the time in normal be recorded and used in the calculations for future testing andoperation.
Table 16. Average processing rate calculations.
VCD–5 VCD–5ADuring WRT Stage 10 Jan. 12, 1993—Nov. 9, 1996
Input Wastewater Mass 1,262.4 kg (2,777.3 lb) 5,198 kg (11,449 lb)
Product Distillate Mass 1,092.0 kg (2,402.5 lb) NA
Duration of Operation
Including Transition 565 hr 3,807 hr
Normal Only NA 2,960 hr
Production Rate
Wastewater ÷ Normal NA 1.76 kg/hr (3.87 lb/hr)
Wastewater ÷ (Normal + Transition) 2.23 kg/hr (4.91 lb/hr) 1.37 kg/hr (3.01 lb/hr)
Distillate ÷ Normal NA NA
Distillate ÷ (Normal + Transition) 1.93 kg/hr (4.25 lb/hr) NA
NA = not available

55
5.1.2 Wastewater Supply
The check valve between the external wastewater supply tank and the WSA failed early in thetest period for both the VCD–5 and VCD–5A. This valve corresponds to the flight valve between theurinal and the WSA. The cause of the failure was due to insufficient spring constant to keep the springfrom being deformed while being in one position for extended periods. While this spring is not flight-like, it points out an aspect which should be evaluated in the flight valve.
5.1.3 Instrumentation and Valve Failures
During troubleshooting it was found that a capacitor had failed and caused a power converter toalso fail on one of the circuit cards. Both faulty parts were replaced and the repaired circuit card returnedto the signal conditioner.
Valve V3, between the pump housing and the distillation unit, was not opening properly due toincorrect wait timer commands from the EPROM (which had been inadvertently set incorrectly) and theVCD–5A was shutdown. The wait timer was reset to the correct duration.
5.1.4 High Conductivity of Product Water
At startup high conductivity of the product water usually occurs after the still has beenpressurized above the normal operating pressure. This anomaly has not been resolved. Particles from thecompressor Vespel gear were found in the product water of all VCD/UPA’s which may contribute tohigh conductivity readings.
5.1.5 Materials
Particles of Norprene tubing from the purge pump have been found in at least three VCD units(the VCD–5, VCD–5A, and a development VCD/UPA). The life of the purge pump may not be affected,but Norprene particles have clogged the gas/water separator and the pressure regulator, and have beenfound in the product water.
Norprene tubing is intended for use in mostly liquid pumping, while in the VCD/UPA purgepump there is mostly gas in the fluid stream being pumped, which increases mechanical wear anddegradation (spalling). In addition, the manufacturing process can leave particles of tubing materialloosely attached to the internal wall of the tube and flow through the tube will detach the particles.
The problems experienced with the Norprene tubing in the purge pump have resulted in thepossible addition of a filter to the flight design. The life of this filter is being specified to be consistentwith the purge pump assembly to minimize routine maintenance requirements. Although the problemshave been resolved, the number of problems relating to quality control and the sensitivity of hardwareperformance is cause for concern. Degradation of the fluids pump and purge pump Norprene tubingmust be eliminated or controlled in order to avoid premature failure of the gas/water separator, thepressure regulator, valves, and sensors. If a more durable tubing material is not feasible then a filterdownstream of the fluids pump is needed. Cleaning the tubing with high pressure water or gas prior toinstallation will remove existing particles.
56
5.1.6 Leakage
When new, the purge pump tubing may have been capable of removing air that leaked in butover time degraded to the point where it cannot perform adequately even with the assistance of thefacility vacuum. Because of this possibility, it is not known whether the leakage has increased or thecapability of the purge pump to deal with leakage has declined, or both. Samples collected from theVCD–5 purge pump contained bits of material that appear to be the tubing material, indicating spallingof the material which could lead to degradation in performance. In addition, corrosion in the VCD–5fluids pump led to leakage through the housing which was very likely in the a significant factor. Theflight VCD will have pump housings made of titanium.
5.1.7 Harmonic Drive Failure
Lessons learned about the VCD also relate to the critical nature of pump drive mechanismalignment. During previous testing using the Harmonic Drive, this failure did not occur. One designchange that may have affected this was the use of an additional bearing support for the motor instead ofthe previous single-point cantilever attachment, which apparently was more tolerant of misalignment.Although the test hardware misalignment may have resulted from a pump retrofit, the flight design has asimilar drive mechanism alignment requirement. The investigation of failures experienced in the fluidspump has concluded that fatigue caused by a horizontal misalignment was the major contributor and thatwhen such a misalignment occurs, the drive life will not exceed 400 hr. The hardware supplier hasimplemented use of a new alignment jig during hardware assembly to provide proper alignment. This jigwill be used for flight hardware assembly. Although the problem appears to have been solved, thesensitivity of the VCD to such problems indicates a lack of design robustness and a need for closeattention by quality control personnel to prevent such problems during flight unit assembly.
5.2 VCD–5 Test Results
The test results are described below for each component.
5.2.1 Wastewater Supply Tank
No hardware problems were related to the wastewater supply tank. When operating on Earth, anyfree gas in the supply wastewater collects at the top of the tank where the outlet line is located, leadingto high compressor temperature alarms when the gas is injected into the distillation unit.
5.2.2 Fluids Pump
On test day 17 the fluids pump housing and drive shaft seal were found to be leaking, at a rate of15 to 20 mmHg/hr. This leakage reduces the effectiveness of the purge pump for maintaining a suitablevacuum, therefore reducing the processing rate.

57
5.2.3 Purge Pump
Vacuum leakage into the VCD–5 still was higher than expected. When the pressure in the stillcannot be maintained low enough, performance is decreased and a shutdown may occur. The most likelysource was the purge pump drive shaft seal and a purge valve, which seemed to have failed, as well asleakage through the back pressure regulator and fluids pump. These leaks, in combination, caused thepurge pump to lag behind in evacuating the still and not be able to keep the pressure sufficiently low.The resolution was to replace the faulty valve, tighten the pump housing, and change the controlsoftware for the purge algorithm, so the pump stayed on longer during the purge. This change to thesoftware also made it more tolerant of leakage so that a small leak will not cause a dramatic change inpressure. This was successfully tested using a facility pump to assist the purge pump.
The purge algorithm provides a 1 min purge of the pump casing, then a 2 min purge of the still. IfP1 reaches 27 mmHg before 2 min then it repeats another 2 min purge. Double or triple purges indicateleakage of ambient air (noncondensable gases). An initial increase in pressure indicates leakage in thepurge pump.
During investigation of the difficulty for the purge pump to maintain a suitable vacuum it wasfound that the Norprene tubing in the purge pump was spalling. Small pieces of Norprene materialwere found in the back pressure regulator, which prevented proper sealing, and in the gas/waterseparator. This resulted in leakage into the still and blockage of purge gas flow, respectively, andreduced performance. The pressure regulator was cleaned and reinstalled.
5.2.4 Distillation Assembly
During troubleshooting, the VCD–5 was disassembled and the still drive belt was found to havebeen incorrectly installed. This had resulted in numerous low speed alarms. The belt was reinstalledcorrectly and the problems did not recur. It was also found that an O-ring seal had not been installed.Use of a fan to cool the compressor motor, increasing the duration of the purge, installation of a sampleport that also vented free gas from the WSA, and replacement of the Vespel gear all helped to reducethe compressor temperature and eliminate shutdowns and warnings.
5.2.5 Recycle Filter Tank
No problems were found with the operation of the recycle filter tank. Filter replacement and tankcleaning was performed as expected.
5.2.6 Gas/Water Separator
During repairs on January 13, 1994 the gas/water separator was removed and particles ofNorprene tubing material were found inside, blocking the separator inlet and fouling the filter medium.The separator was cleaned and back flushed before being reinstalled. When Norprene particles werefound again later, the gas/water separator was replaced.

58
5.3 VCD–5A Test Results
The test results are described below for each component.
5.3.1 Wastewater Supply Tank
No hardware problems were related to the wastewater supply tank. As with the VCD–5, thepresence of free gas in the wastewater supply tank may have contributed to high compressor temperaturealarms.
5.3.2 Fluids Pump
The fluids pump failed during pretest checkout after about 400 hr of operation due to a shearedflex spline in the Harmonic drive. This drive was replaced prior to beginning the life test, but after 360hr of operation the same failure occurred again. The cause was a slight horizontal misalignment. Thehardware supplier made an alignment jig to ensure accurate installation and the problem did not recur.
Leakage around the pump drive shaft seals was also found to be significant (as for the VCD–5).The flight VCD/UPA will have redesigned seals.
5.3.3 Purge Pump
Norprene tubing particles were shed from the purge pump, as with the VCD–5.
5.3.4 Distillation Assembly
High compressor temperature and low centrifuge speed alarms occurred occasionally beginning367 and 434 days, respectively, into the life test.
The high temperatures were likely due to excess friction in the compressor gears as theyapproached the limit of their recommended lives. Through November 9, 1995, the operating time on thecompressor gears and the drive belt was about 4,831 hr including time before the Life Test began. Thesecomponents were near the end of their design life. Another contributing factor may be free gas in thewastewater feed.
At startup, high conductivity of the product water usually occurs after the still has beenpressurized above the operating pressure. This anomaly has not been resolved. Particles from thecompressor Vespel gear were found in the product water of all VCD/UPA’s which may contribute tohigh conductivity readings.
The metal demister was found to shed tiny slivers of stainless steel (like steel wool) which werefound in the phase separator with the Norprene tubing particles. This has only occurred on one VCDbut may be a generic problem. The slivers were similar to metal taken (easily removed) directly from thedemister inside the distillation unit.

59
When the VCD–5A was disassembled during troubleshooting it was also found that an O-ringseal had not been installed between the stationary bowl and the separator plate (as with the VCD–5).
5.3.5. Recycle Filter Tank
The waste recycle pressure sensor (P3) failed on August 9, 1993 and a temporary sensor wasinstalled on August 30, 1993. The temporary sensor failed on February 1, 1994 and was removed. Thematerials in these sensors could not tolerate the wastewater environment. Both are flight-like in function,but not material. A new, flight-like sensor made of Inconel 718 was installed on July 19, 1994.
A leak was found in the waste recycle relief valve, caused by corrosion of the pipe connectorfittings. The fittings were replaced with identical fittings, flight-like in function only. A vacuum leak testwas performed on the fluids pump assembly and the purge pump housing, and no leaks were found.
The filters lasted an average of 20.62 days each.
5.3.6 Gas/Water Separator
As with the VCD–5, particles of Norprene tubing material were found in the gas/waterseparator, causing as much as 60 percent blockage.

60
6. CONCLUSIONS AND RECOMMENDATIONS
The VCD life test program has successfully met the objectives as stated in section 1.Recommendations concerning the ISS VCD/UPA can be grouped into four categories: design, qualitycontrol, materials, and operation.
6.1 Design
Redesign of the purge pump and fluids pump drive shaft seals is recommended to prevent leakageinto the pump housings. The drive shaft seals have been redesigned for the ISS VCD/UPA. Otherpotential leak sites, such as connectors, should be designed to preclude leakage, and verified to ensureno significant leakage.
Due to the potential for metal slivers to be shed from the stainless steel demister, an alternativedesign is recommended. The demister has been redesigned to be a membrane-type for the ISSVCD/UPA.
Wearing of the Vespel gear in the compressor is expected because the Vespel gear adds lubricationas it wears. However, traces of Vespel were found in the product water, in all operating VCD/UPA’s. Afilter in the product water line is recommended to ensure that the allowable particulate level of theproduct water will not be exceeded.
The wastewater feed tank design, with the outlet at the top, allows free gas to collect and contributeto overheating and other problems during ground testing. This effect would not likely occur in orbitsince any free gas will be distributed in the liquid, but must be considered during ground testing. Unlessthis free gas is removed prior to beginning a processing cycle, high compressor temperatures and highcurrent draws will result when the gas is injected into the distillation unit.
6.2 Quality Control
The Harmonic Drives of the purge and fluids pumps must be properly installed with careful attentionto the drive mechanism alignment.
Care must be taken during assembly to ensure proper installation of components such as thecentrifuge drive belt and O-rings.
61
6.3 Materials
To prevent premature failure of sensors and valves, it is essential that materials be compatible withthe environments where the sensors or valves are located, especially the harsher environments such asthe wastewater recycle lines. It is recommended that long-term material compatibility be verified for allcomponents.
To prevent particles of Norprene tubing from the purge pump from clogging components, it isrecommended that the tubing be cleaned with high pressure water or gas prior to installation to removeany particles present due to the manufacturing process, and that a filter be added downstream of thepurge pump to ensure that any new particles generated do not cause problems.
To prevent corrosion of the fluids pump and purge pump in the event of leakage, the housings will bemade of titanium for the flight VCD.
6.4 Operation
It is very important to thoroughly evacuate the fluids pump and purge pump housings prior toevacuating the still, and to have a sufficient purge duration prior to transitioning to normal operationfrom standby. It is recommended that the purge duration be increased for this reason. This controlchange to increase the duration of purge will be implemented on the ISS VCD/UPA and all currentlyoperating VCD/UPA’s.

62
7. REFERENCES AND BIBLIOGRAPHY
Cited references and other related documents are listed below.
7.1 References
1. Perry, J.L.: “Environmental Control and Life Support System (ECLSS) Life Testing ProgramInterim Report,” memo ED62(27-93), NASA/Marshall Space Flight Center, August 27, 1993.
2. McGriff, Cindy F.: “Space Station Freedom Environmental Control and Life Support System:Urine Processor Assembly (Vapor Compression Distillation) Life Test Plan,” memo ED62(59–92), NASA/Marshall Space Flight Center, May 27, 1992.
3. Carter, D.L., et al: “International Space Station Environmental Control and Life Support SystemPhase III Water Recovery Test Stage 10 Final Report,” Marshall Space Flight Center, in press,1998.
4. “Life Test VCD-VA Flex Spline Failure Anomaly Review Meeting,” Marshall Space FlightCenter, December 4, 1992.
5. Scheidt, J.: “Data Acquisition Software Description and User Guide for Use in the ECLS TestFacilities,” MFOP–FA–ETL–320, Marshall Space Flight Center, October 31, 1986.
6. Dotson, C.: “PACRATS Users Guide,” Marshall Space Flight Center, in press, 1997.
7. Simpson, W.G.: “Flight-Like Hardware for UPA Life Testing,” memo WGS–4–8, Life Systems,Inc., April 7, 1993. This memo details the degree of flight-like characteristics for eachcomponent of the VCD–5 and VCD–5A.
8. Carter, D.L.; Holder, D.W.; and Hutchens, C.F.: “International Space Station EnvironmentalControl and Life Support System Phase III Water Recovery Test Stage 9 Final Report,” NASATechnical Memorandum 108498, Marshall Space Flight Center, September 1995.
9. Carrasquillo, R.L.; Carter, D.L.; Holder, D.W., Jr.; McGriff, C.F.; and Ogle, K.Y.: “Space StationFreedom Environmental Control and Life Support System Regenerative Subsystem Selection,”NASA Technical Memorandum 4340, Marshall Space Flight Center, AL, February 1992.
10. Carter, D.L.: “Protocol For the Participation of Human Research Subjects in the EnvironmentalControl and Life Support System Phase III Test Program: Water Recovery Test Stages 10 & 11,”unnumbered, NASA, Marshall Space Flight Center, ED62/Life Support Systems Branch, August1996.

63
11. Hutchens, Cindy: “Test Plan for the Purge Gas Analysis of the VCD-VA,” internal memo ED62(36–96), Marshall Space Flight Center, May 7, 1996.
12. Long, D.A.; and T.D.: “Vapor Compression Distillation Subsystem (VCD–VA) Gas Purge Test(VGP) Report,” ECLSS/TECH/EL96–003, Marshall Space Flight Center, July 30, 1996.
7.2 Bibliography
Chang, B-J: “Failure Analysis Report of Harmonic Drive,” TR–1305–5, Life Systems, Inc., June 3,1993.
Chiu, Charles Y.; Perry, Jay L.; Salyer, Blaine H.; and Tatara, James D.: “Preliminary Results of NASAECLSS Life Testing,” 24th International Conference on Environmental Systems and 5th EuropeanSymposium on Space Environmental Control Systems, SAE paper number 941463,Friedrichshafen, Germany, June 20–23, 1994.
Chiu, C.; Salyer, B.; and Tatara, J.: “Environmental Control and Life Support Systems, Life TestQuarterly Report #9,” Contract No. NAS8–40369, Ion Electronics, Huntsville, Alabama, October1995.
Chiu, C.; Salyer, B.; and Tatara, J.: “Environmental Control and Life Support Systems, Life TestQuarterly Report #11,” Contract No. NAS8–40369, Ion Electronics, Huntsville, Alabama, February1996.
Chiu, C.; Salyer, B.; and Tatara, J.: “Environmental Control and Life Support Systems, Life TestQuarterly Report #12,” Contract No. NAS8–40369, Ion Electronics, Huntsville, Alabama, May1996.
Hutchens, C.: “Life Systems, Inc. Vapor Compression Distillation Subsystem Technical InterchangeMeeting Trip Report,” memo ED62(17–94), Marshall Space Flight Center, April 13, 1994. Thismemo summarizes the status of the VCD–5 and VCD–5A, specifically regarding the check valvefailure, the presence of Norprene tubing in the pressure regulator and the gas/liquid separator,vacuum leakage in the VCD–5, high conductivity of the product water at the beginning of aprocessing cycle (especially when the still has been pressurized above normal operating pressures),and low production rate of the VCD–5A.
“Life Test VCD–VA Flex-Spline Failure Anomaly Review Meeting,” presentation, December 4, 1992.
McGriff, Cindy F.: “Space Station Freedom Environmental Control and Life Support System: UrineProcessor Assembly (Vapor Compression Distillation) Life Test Plan,” NASA, Marshall SpaceFlight Center, MSFC/ED62, May 1992.
Perry, J. L.; and Ray, C. D.: “Environmental Control and Life Support System Life TestingRequirements Revision A,” memo ED62(107–92), Marshall Space Flight Center, November 17,1992.

64
Perry, J. L., Chiu, C. Y.; Salyer, B. H.; and Tatara, J. D.: “Environmental Control and Life SupportSystem Life Testing Program Status,” memo ED62(45–94), Marshall Space Flight Center,September 27, 1994.
Ray, C. D.: “Space Station Environmental Control and Life Support System Supporting DevelopmentPlan,” memo DA01(ED62–20), April 19, 1994.
Ray, C. D.; and Minton-Summers, S.: compilers, “International Space Station ECLSS Technical TaskAgreement Summary Report,” NASA Technical Memorandum 108508, Marshall Space FlightCenter, May 1996.
Simpson, W. G.: “Response to Technical Questions Relating to the VCD–V (POST unit) and VCD–VAUnits,” memo WGS–5–6, Life Systems, Inc., May 6 ,1993. This memo documents responses toquestions relating to the Harmonic Drive failure, the fluids pump assembly repair, a slow leak intothe distillation unit of the VCD–5, purge duration, and other questions.

65
APPROVAL
FINAL REPORT ON LIFE TESTING OF THE VAPOR COMPRESSIONDISTILLATION/ URINE PROCESSING ASSEMBLY (VCD/UPA)AT THE MARSHALL SPACE FLIGHT CENTER (1993 TO 1997)
P. Wieland, C. Hutchens, D. Long, and B. Salyer
The information in this report has been reviewed for technical content. Review of any informationconcerning Department of Defense or nuclear energy activities or programs has been made by the MSFCSecurity Classification Officer. This report, in its entirety, has been determined to be unclassified.
_________________________________________W.R. HUMPHRIES
DIRECTOR, STRUCTURES AND DYNAMICS LABORATORY

66
REPORT DOCUMENTATION PAGE Form Approved OMB No. 0704-0188
Public reporting burden for this collection of information is estimated to average 1 hour per response, including the time for reviewing instructions, searching existing data sources,gathering and maintaining the data needed, and completing and reviewing the collection of information. Send comments regarding this burden estimate or any other aspect of thiscollection of information, including suggestions for reducing this burden, to Washington Headquarters Services, Directorate for Information Operation and Reports, 1215 JeffersonDavis Highway, Suite 1204, Arlington, VA 22202-4302, and to the Office of Management and Budget, Paperwork Reduction Project (0704-0188), Washington, DC 20503
1. AGENCY USE ONLY (Leave Blank)
17. SECURITY CLASSIFICATION OF REPORT
NSN 7540-01-280-5500 Standard Form 298 (Rev. 2-89)Prescribed by ANSI Std. 239-18298-102
14. SUBJECT TERMS
13. ABSTRACT (Maximum 200 words)
12a. DISTRIBUTION/AVAILABILITY STATEMENT
11. SUPPLEMENTARY NOTES
6. AUTHORS
7. PERFORMING ORGANIZATION NAMES(S) AND ADDRESS(ES) 8. PERFORMING ORGANIZATION REPORT NUMBER
9. SPONSORING/MONITORING AGENCY NAME(S) AND ADDRESS(ES) 10. SPONSORING/MONITORING AGENCY REPORT NUMBER
4. TITLE AND SUBTITLE 5. FUNDING NUMBERS
12b. DISTRIBUTION CODE
18. SECURITY CLASSIFICATION OF THIS PAGE
19. SECURITY CLASSIFICATION OF ABSTRACT
20. LIMITATION OF ABSTRACT
16. PRICE CODE
15. NUMBER OF PAGES
2. REPORT DATE 3. REPORT TYPE AND DATES COVERED
August 1998
Final Report on Life Testing of the Vapor Compression Distillation/Urine Processing Assembly (VCD/UPA) at the Marshall Space Flight Center (1993 to 1997)
P. Wieland, C. Hutchens, D. Long, and B. Salyer*
George C. Marshall Space Flight CenterMarshall Space Flight Center, Alabama 35812
National Aeronautics and Space AdministrationWashington, DC 20546–0001
Unclassified–UnlimitedSubject Category 54Standard Distribution
ECLS, VCD, urine processor, UPA, life support, International Space Station
Unclassified Unclassified Unclassified Unlimited
Wastewater and urine generated on the International Space Station will be processed to recoverpure water using vapor compression distillation (VCD). To verify the long-term reliability andperformance of theVCD Urine Processor Assembly (UPA), life testing was performed at theMarshall Space Flight Center (MSFC) from January 1993 to April 1996. Two UPA’s, the VCD-5and VCD-5A, were tested for 204 days and 665 days, respectively. The compressor gears and the distillation centrifuge drive belt were found to have operating lives of approximately 4,800hours, equivalent to 3.9 years of operation on ISS for a crew of three at an average processingrate of 1.76 kg/h (3.87 lb/h). Precise alignment of the flex-splines of the fluids and purge pump motor drives is essential to avoid premature failure after about 400 hours of operation. Resultsindicate that, with some design and procedural modifications and suitable quality control, therequired performance and operational life can be met with the VCD/UPA.
NASA/TM—1998–208539
M–887
76
A05
Technical Memorandum
Prepared by Structures & Dynamics Laboratory, Science and Engineering Directorate*Ion Electronics, Huntsville, Alabama