COMPREHENSIVE URBAN ROAD TOLL EVALUATION … 4(1)… · COMPREHENSIVE URBAN ROAD TOLL EVALUATION...
21
14 Klumpp M. et al. Comprehensive Urban Road Toll Evaluation System COMPREHENSIVE URBAN ROAD TOLL EVALUATION SYSTEM Matthias Klumpp 1 , Torsten Marner 2 1, 2 Institute for Logistics and Service Management, FOM University of Applied Sciences, Essen, Germany Received 7 October 2013; accepted 5 December 2013 Abstract: Urban road toll systems are increasingly on the political agenda in order to achieve environmental, urban and traffic management as well as financial objectives. Global Navigation Satellite Systems (GNSS) as for example Global Positioning System (GPS) or Galileo may enhance the usability and also financial soundness of city road pricing and shall be included into the overall concept selection process – in spite of relatively high investment costs. As this contribution shows with a comprehensive evaluation scheme, for example GNSS-related toll systems may contribute to improved telematics and road pricing in cities. Keywords: road pricing, telematics, Toll Evaluation System. 1 Corresponding author: [email protected] 1. Introduction Congestion is one of the central problems of inner city traffic and occurs whenever transport demand exceeds road capacity. The consequences are costs in the form of time losses, incremental emissions and accidents with negative welfare impacts (Marner, 2006). As has been well described in economic literature, expanding road capacity is not only prohibitively expensive but creates its own demand and therefore induces further traffic (Downs, 1962). Thus, alternative instruments such as the implementation of user charges are increasingly and controversially discussed in research and politics. On the one hand, road pricing schemes might be economically efficient, if applied properly (Walters, 1961; Rouwendal and Verhoef, 2006). On the other hand, there are several hurdles for urban road pricing concerning politico-economics, equity, technology and cost (Hartwig and Marner, 2006). However, several urban pricing schemes have been introduced, i.e. in London, Stockholm, Durham, Milano, Rome, Valletta, Bergen, Trondheim, Oslo, Melbourne and Toronto. Further cities are considering the implementation of road pricing systems, for example Copenhagen, Budapest, Gothenburg and San Francisco (Schade and Baum, 2007; Börjesson et al., 2012). One of the most prominent examples for urban road pricing is the London Congestion Charge that has been implemented in 2003 as a cordon-based road pricing system. The main objectives of the scheme were the reduction of traffic congestion and the increase of revenues to fund transport improvements. In large parts of the literature the scheme is considered a success, as data from London shows that overall inner-city traffic declined by 16 percent since the introduction of the scheme (Leape, 2006). However, one of the central limitations of the London system is the technology that is using number plate recognition. This lack of modern technology leads to a reduced effectiveness of the toll system. This is due to the fact that the charge does not vary by time-of-day. Data DOI: http://dx.doi.org/10.7708/ijtte.2014.4(1).02 UDC: 625.7:338.49
Transcript of COMPREHENSIVE URBAN ROAD TOLL EVALUATION … 4(1)… · COMPREHENSIVE URBAN ROAD TOLL EVALUATION...

14
Klumpp M. et al. Comprehensive Urban Road Toll Evaluation System
COMPREHENSIVE URBAN ROAD TOLL EVALUATION SYSTEM
Matthias Klumpp1, Torsten Marner2
1, 2 Institute for Logistics and Service Management, FOM University of Applied Sciences, Essen, Germany
Received 7 October 2013; accepted 5 December 2013
Abstract: Urban road toll systems are increasingly on the political agenda in order to achieve environmental, urban and traffic management as well as financial objectives. Global Navigation Satellite Systems (GNSS) as for example Global Positioning System (GPS) or Galileo may enhance the usability and also financial soundness of city road pricing and shall be included into the overall concept selection process – in spite of relatively high investment costs. As this contribution shows with a comprehensive evaluation scheme, for example GNSS-related toll systems may contribute to improved telematics and road pricing in cities.
Keywords: road pricing, telematics, Toll Evaluation System.
1 Corresponding author: [email protected]
1. Introduction
Congestion is one of the central problems of inner city traffic and occurs whenever transport demand exceeds road capacity. The consequences are costs in the form of time losses, incremental emissions and accidents with negative welfare impacts (Marner, 2006). As has been well described in economic literature, expanding road capacity is not only prohibitively expensive but creates its own demand and therefore induces further traffic (Downs, 1962). Thus, alternative instruments such as the implementation of user cha rges a re i ncreasi ng ly a nd controversially discussed in research and politics. On the one hand, road pricing schemes might be economically efficient, if applied properly (Walters, 1961; Rouwendal and Verhoef, 2006). On the other hand, there are several hurdles for urban road pricing concerning politico-economics, equity, technology and cost (Hartwig and Marner, 2006). However, several urban pricing schemes have been introduced, i.e. in London,
Stockholm, Durham, Milano, Rome, Valletta, Bergen, Trondheim, Oslo, Melbourne and Toronto. Further cities are considering the implementation of road pricing systems, for example Copenhagen, Budapest, Gothenburg and San Francisco (Schade and Baum, 2007; Börjesson et al., 2012). One of the most prominent examples for urban road pricing is the London Congestion Charge that has been implemented in 2003 as a cordon-based road pricing system. The main objectives of the scheme were the reduction of traffic congestion and the increase of revenues to fund transport improvements. In large parts of the literature the scheme is considered a success, as data from London shows that overall inner-city traffic declined by 16 percent since the introduction of the scheme (Leape, 2006). However, one of the central limitations of the London system is the technology that is using number plate recognition. This lack of modern technology leads to a reduced effectiveness of the toll system. This is due to the fact that the charge does not vary by time-of-day. Data
DOI: http://dx.doi.org/10.7708/ijtte.2014.4(1).02UDC: 625.7:338.49
15
International Journal for Traffic and Transport Engineering, 2014, 4(1): 14 - 34
from London shows clearly, that the greatest portion of the realized traffic reduction concerns off-peak periods in the afternoon. Traffic volumes pre-charging and today do not differ significantly during main peaks. This leads to a lack of effectiveness of the scheme that is in line with the moderate congestion cost reduction that is measured in London in the last years (Transport for London, 2008; Murray, 2012). These developments are motivated by the f lat rate character of the scheme: If a daily charge is once paid, no incentive for a further minimization of using scarce road space is given. A pricing system based on Global Navigation Satellite Systems (GNSS) allows for increased effectiveness (Cui and Ge, 2003). GNSS-based road pricing might be a fair charging instrument since these systems levy charges dependent on the distance travelled and therefore ref lect a usage-based approach so that congestion cost is exactly incurred by those actors who are responsible. This provides incentives for an efficient use of scarce road space. GNSS-based road pricing systems are able to locate the vehicles within a certain charging area (Klumpp et al., 2011; Zabic, 2011). By this, cumulative distance charging is feasible where charges are determined by the distance driven, the time of the trip and the position of each of the vehicles. Hence, each driver can be charged with an efficient toll and incentives for an adequate use of road space are provided. Therefore, for example by time- or area-sensitive pricing, traffic volumes tend to be shifted away from the morning and evening peaks.
In this research paper, we evaluate a virtual pricing system based on GNSS and show the advantages of introducing GNSS technology in road pricing systems. These advantages are due to the possibility of combining time-based, distance-based and load-dependent
elements. We compare this theoretical system with the effects of three different road pricing systems, the London Congestion Charge, the Stockholm Congestion Charge as an example for a time-based user charge and the San Diego I-15 Hot Lanes as a load-dependent corridor pricing. For the comparison we use our Toll Systems Evaluation Scheme (TSES). However, concerning GNSS it is necessary to reduce system costs and overcome technological barriers. The German motorway truck toll (TollCollect) shows that this approach is feasible since it is the first system to rely on satellite navigation support – though not solely but enhanced by RFID street scanners. This paper uses a SWOT analysis to describe the feasibility of a city toll system based solely on a GNSS application like Galileo. The analysis shows how the system-induced effectiveness is increased and combines the SWOT analysis with an economic investment analysis in order to define break-even values for size and characteristics of such systems. Dependent on system costs (related to area size and complex ity) and the expected number of vehicles the minimum toll payment amount can be identified. This will enhance feasibility checks in many occasions where city toll systems are discussed and a GNSS-based system would be an option for future implementation. Further system designs could use a target costing approach in order to create systems economically feasible in different scenarios and areas in Europe and therefore a total market potential approach for GNSS-based city toll systems can be based on this research calculation.
The paper is composed as follows: In chapter 2 we present a literature overview regarding the theory of urban road pricing; in chapter 3 we analyze the effects of the existing cases of toll systems in London, Stockholm and San Diego. In chapter 4 we introduce the TSES.

16
Klumpp M. et al. Comprehensive Urban Road Toll Evaluation System
Chapter 5 describes and evaluates GNSS-based urban toll systems. Chapter 6 shows a synopsis by comparing the evaluation of all four systems.
2. Literature Review: Road Pricing
2.1. The Standard Model
Urban road pr ic ing ser ves t wo main o b j e c t i v e s : t h e i n t e r n a l i z a t i o n o f externalities caused by urban transport like noise, air pollution, accidents, partly congestion, etc. and the reduction of the demand for transport in congested inner cities (Eisenkopf, 2008). Especially in cities these effects are particularly significant due to the substantial number of people directly affected by these externalities (Marner, 2006). Road tolls are an efficient instrument to achieve both objectives. With an appropriate implementation travel demand can be reduced at any desired time and place, if beneficial. There is a great advantage of such an instrument: if a certain toll is properly implemented, each traveler
finds himself before the free decision to use the tolled road or not. Thus, travelers have an incentive to omit the least beneficial trips. Decisions about occasions, times and places of certain trips are decentralized and taken by well-informed individuals (Fosgerau and van Dender, 2013). Without the toll, there is an undesirable volume of traffic. This is due to the fact, that in this case travelers are not liable for externalities they impose on other road users (by contributing to congestion) or on other persons in inner cities (by causing accidents, noise, air pollution, etc.). With the toll, users do not ignore these marginal effects and all trips with private benefits lower than social costs of the trip are no longer profitable for these users. The demand for transport in congested cities decreases accordingly and efficiently (Eisenkopf, 2008). This is the central idea of the standard analysis that is based on ideas already proposed by Dupuit (1844), Pigou (1920) and Knight (1924) and was first concretely applied to the case of road transport by Vickrey (1955) and Walters (1961). Fig. 1 illustrates the standard model.
Fig. 1. Welfare Effects of Externalities in Road TrafficSource: Fosgerau and van Dender (2013)

17
International Journal for Traffic and Transport Engineering, 2014, 4(1): 14 - 34
In Fig. 1, traffic volume is represented on the horizontal axis and the generalized travel cost (GTC) is documented on the vertical axis. αS shows the supply curve with S as the travel time (in dependence of the traffic volume) and α as the value of travel time. The slope of αS is positive since there is congestion so that travel times increase and therefore GTC rise with each further user. The slope of the demand curve is negative due to lower demand with increasing costs. As all users face identical travel times and values of travel time, the supply curve can be interpreted as an average cost curve. MC represents the marginal social cost that additionally contains the externalities of road traffic such as congestion, noise, air pollution, accidents, etc. (Fosgerau and van Dender, 2013). The travelers decide to take a certain trip, if the benefit of the trip exceeds the cost of travelling. However, in taking this decision, they are not interested in the effects they impose on other actors. This is due to the fact, that they are not liable for these effects. In Fig. 1, the equilibrium volume is a, where – from a private point of view – the cost of the last trip of the user equals the benefit of the last trip. This equilibrium is outlined by the intersection of demand curve and supply curve (b). However, this equilibrium is not efficient since it causes a welfare loss bcd. From the social point of view a lower traffic volume is optimal. An optimal volume occurs at the point of the horizontal axis that corresponds to d, where the marginal benefits that are given by the demand curve equal the marginal social cost. The failure to comply with externalities results in an overexploitation of the regarded road (Fosgerau and van Dender, 2013). An optimal toll τ establishes an incentive for the users not to ignore the externalities they impose on others. With
τ the users face a new supply curve αS + τ, that contains the private costs of driving as well as the external costs. Thus, a social optimal traffic volume will be achieved and the welfare loss bcd does not occur (Marner, 2006; Eisenkopf, 2008; Fosgerau and van Dender, 2013).
2.2. The Bottleneck Model
However, the standard model is a static model a nd ig nores t he dy na m ics of congestion and the importance of trip timing (Vickrey, 1969; Arnott et al., 1993). The static model does not consider that road users might reduce trip times by simply choosing different starting times of their trips and therefore avoid the peak hours. However, travelers do not prefer to change their normal habits. So they care about their starting and arrival times (Fosgerau and van Dender, 2013). Since working times of most of the users are similar, peaks do occur. If the working times could be distributed more evenly over the day, congestion might be mitigated significantly. Travelers, who want to minimize their GTC (that is dependent on travel time, starting times, arrival times, and the cost of earliness or lateness), have to consider these peaks by optimizing their departure times. An equilibrium distribution of departure times is given when no road user can reduce the GTC by changing the departure time. This equilibrium typically includes a bottleneck during the time interval [t0, t1]. This is due to the fact that the preferred arrival time of the user is t*, that lies within the bottleneck interval [t0, t1]. They do not like to be too early at work and they do not like to be late, too. So during the peaks the users face a tradeoff between arriving at t* - facing excessive travel time - and suffering from excessive cost of earliness or lateness. The
18
Klumpp M. et al. Comprehensive Urban Road Toll Evaluation System
bottleneck starts at t0 and dissipates at t1. The first and the last travelers who pass the bottleneck are not confronted with significantly higher travel times, but will be early or late (Fosgerau and van Dender, 2013; Vickrey, 1969). If a static toll is implemented, overall traffic volume will be reduced. However, congestion will not be removed. The bottleneck during the preferred time interval [t0, t1] will remain. The basic idea of the bottleneck model is to eliminate this by introducing a load-dependent toll that contributes to the reduction of peak levels. So the level of charges should be high in peak times, when most of the users prefer to arrive at work. In off-peak times, there is no need for tolls. A time-varying toll is optimal, if it is zero at t0, then increases until the preferred arriving time t*, and then again decreases until t1 (Fosgerau and van Dender, 2013). The average toll equals the optimal static toll. The optimal dynamic toll prevents congestion since it affects the departure times of the road users and ensures that the volume of users that arrive at the bottleneck does not exceed the capacity of the bottleneck (Arnott et al., 1993; De Palma and Fosgerau, 2011). Dynamic toll substitutes waiting times by money cost. This does not increase the user’s utility, because he still faces the same GTC. However, there is an improvement from a social point of view, because waiting times are no longer lost and the toll revenues stay in the system.
3. Review of Existing Cases
We analyze the effects of three different urban road tol l systems: The London Congestion Charge and the Stockholm Congestion Charge as examples for cordon pricing and the San Diego I-15 Hot Lanes as an example for corridor pricing.
3.1. London Congestion Charging
The London Congestion Charge has been introduced in 2003. It is an area license with a f lat rate character. The standard charge that is applied to private cars and commercial vehicles entering the charging zone during the charging time (Monday to Friday, 7.00 am to 6.30 pm), is £ 8 (£ 5 until June 2005). Once the zone is entered, each driver can use the inner city roads without any further charging. The charging zone is known as “Central London”, a 22 square kilometres area that contains the “City of London”, “West End” with its business and entertainment centres, the financial centre, the parliament and further major tourist sites. Inhabitants of Central London receive a 90% discount on the charge. There are certain types of vehicles exempt from charging: bicycles, motorbikes, buses, taxis, cars used by disabled travellers, alternative fuel vehicles, fire fighters, emergency vehicles, etc. The enforcement of the charging is realised by up to 200 video cameras that are installed at every entry point of the charging zone. An automatic number plate recognition technology (ANPR) is used to identify the vehicles and their drivers who are obliged to pay the charge. ANPR is able to identify 70 to 80% of the cars for a single pass. Since the users usually pass several video cameras, the estimated detection rate is up to 90% (Leape, 2006; Eisenkopf, 2008). A western extension of the charging zone (Kensington, Chelsea) that was introduced in February 2007 was stopped in January 2011. In literature, the effects of the London Congestion Charge have been interpreted differently. On the one hand, the initial aims of the system – reduced traffic volume, increased average speed in the city, increased public transport, additional revenues for investments in public

19
International Journal for Traffic and Transport Engineering, 2014, 4(1): 14 - 34
transport (Eisenkopf, 2008) – have been achieved, so that most reactions are positive (e.g. Leape, 2006; Santos and Shaffer, 2004).
Fig. 2 shows the overall reduction in traffic volume between 2002 and 2007. A reduction in total vehicles of 16% can be identified.
Fig. 2. Traffic Entering the Central London Charging Zone 2002-2007Source: Transport for London (2008)
Furthermore, comparisons of costs and revenues by e.g. Bowen (2010) and Transport for London (2008) document a net benefit
of the system. Fig. 3 illustrates that since 2004 revenues of the system do exceed the costs of the system.
Fig. 3. Operating Costs of the London Congestion ChargeSource: Bowen (2010)

20
Klumpp M. et al. Comprehensive Urban Road Toll Evaluation System
Transport for London identi f ies net revenues of £ 137 million for the financial year 2007/08 (Leape, 2006). This is due to total revenues of £ 268 million and total costs of £ 131 million. The costs can be differentiated in operational, publicity and enforcement costs of the scheme (£ 91 million) and other costs like staff costs and costs of traffic management. On the other hand, several authors criticize the effects of the system. Particularly the inefficiency of the system has been at the centre of criticism. Prud’homme and Bocarejo (2005) appreciate the system from a political and technical point of view but from an economic standpoint they describe the system as a “mini-concorde” and reject it due to an unfavorable cost-benefit calculation. Murray (2012) regards the limited technology as the main limitation
of the system. The technology that is limited to number plate recognition, leads to a reduced effectiveness of the toll system. This is dependent on the toll that does not vary by time-of-day. Fig. 4 illustrates that the greatest portion of the realized traffic reduction concerns off-peak periods in the afternoon. Traffic volumes pre-charging and today do not differ significantly during the main peaks. This leads to a lack of effectiveness of the scheme that is in line with the moderate congestion cost reduction that is measured in London in the last years (Transport for London, 2008; Murray, 2012). These developments are motivated by the f lat rate character of the scheme. If the daily charge is once paid, no incentive for a further minimization of using scarce road space is given. An overview on further critique is given by Bowen (2010).
Fig. 4. Traffic Entering the London Charging Zone by Time-of-Day 2002-2007Source: Transport for London (2008)
21
International Journal for Traffic and Transport Engineering, 2014, 4(1): 14 - 34
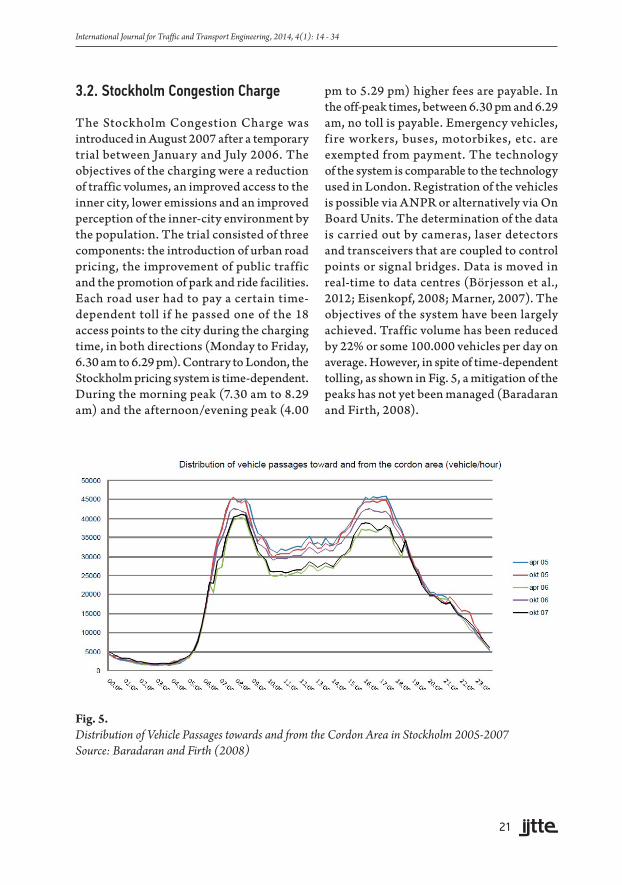
3.2. Stockholm Congestion Charge
The Stockholm Congestion Charge was introduced in August 2007 after a temporary trial between January and July 2006. The objectives of the charging were a reduction of traffic volumes, an improved access to the inner city, lower emissions and an improved perception of the inner-city environment by the population. The trial consisted of three components: the introduction of urban road pricing, the improvement of public traffic and the promotion of park and ride facilities. Each road user had to pay a certain time-dependent toll if he passed one of the 18 access points to the city during the charging time, in both directions (Monday to Friday, 6.30 am to 6.29 pm). Contrary to London, the Stockholm pricing system is time-dependent. During the morning peak (7.30 am to 8.29 am) and the afternoon/evening peak (4.00
pm to 5.29 pm) higher fees are payable. In the off-peak times, between 6.30 pm and 6.29 am, no toll is payable. Emergency vehicles, fire workers, buses, motorbikes, etc. are exempted from payment. The technology of the system is comparable to the technology used in London. Registration of the vehicles is possible via ANPR or alternatively via On Board Units. The determination of the data is carried out by cameras, laser detectors and transceivers that are coupled to control points or signal bridges. Data is moved in real-time to data centres (Börjesson et al., 2012; Eisenkopf, 2008; Marner, 2007). The objectives of the system have been largely achieved. Traffic volume has been reduced by 22% or some 100.000 vehicles per day on average. However, in spite of time-dependent tolling, as shown in Fig. 5, a mitigation of the peaks has not yet been managed (Baradaran and Firth, 2008).
Fig. 5. Distribution of Vehicle Passages towards and from the Cordon Area in Stockholm 2005-2007Source: Baradaran and Firth (2008)

22
Klumpp M. et al. Comprehensive Urban Road Toll Evaluation System
Due to a low quality of technology, no distance-based pricing is available and no
further smoothing of the curve in Fig. 5 is possible.
Fig. 6. Travel Times during Morning Peak for Different Road Classes and Time Periods in StockholmSource: Baradaran and Firth (2008)
Figs. 6 und 7 document travel times during morning and afternoon/evening peaks for different street classes (streets within the pricing zone, radials towards the cordon, radials from cordon, diagonals and outer radials from and towards the cordon) and time periods (peaks before,
during, after the trial 2006 and since the permanent scheme August 2007). A value of 0% documents a free f low of traffic, while a value of 100% equals a situation where a traveler needs the double time as during a free f low (Baradaran and Firth, 2008).
Fig. 7. Travel Times during Afternoon/Evening Peak for Different Road Classes and Time Periods in StockholmSource: Baradaran and Firth (2008)

23
International Journal for Traffic and Transport Engineering, 2014, 4(1): 14 - 34
Similar as in London, cost-benefit analyses document different results of the effects. However, most of the results are positive. Eliasson (2009) for example shows the overall economic benefit of the Stockholm Congestion Charge. In his analysis he identifies a total socioeconomic surplus of 82 million Euro per year, excluding the investment costs. An investigation of Transek (2006) differentiates between the trial and a permanent introduction of the charging scheme. Looking at the trials only, a benefit-cost ratio of just 0.22 arises. In this case, the measure “road pricing system” is to reject from an overall economic point of view. A long-term introduction and usage of the system result in a benefit-cost ratio of 1.5. An isolated examination of the charging (without the massive investments in public traffic) results in a benefit-cost ratio of 4.9.
3.3. I-15 HOT Lanes San Diego
HOT lanes or High Occupancy/Toll Lanes are the best approximation to economic first best pricing so far. Drivers of certain vehicles on specific roads pay a toll that is dependent on the demand. This type of pricing is called congestion pricing. There are one or more uncharged lanes and at least one charged lane, a so called express lane. If there is no congestion on the uncharged lanes, the price of using the express lane is 0. The more congestion arises, the higher is the price of using the express lane (Konishi and
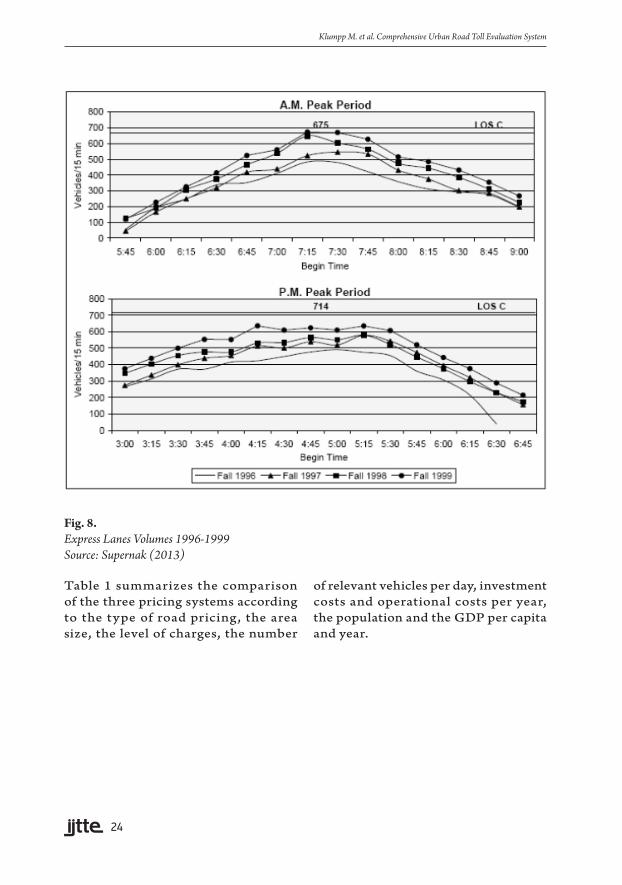
Mun, 2010). I-15 HOT lanes in San Diego were the first road project with dynamic pricing and toll levels within a range of US-$ 0.50 and US-$ 8.00. Congestion is computed by underground sensors that measure the f low rate in dependence of capacity. Every six minutes, the data is actualised to maintain a certain level of service. Potential users of the road or the express lane are informed of the actual toll rates by certain signs so that every traveller can decide whether to use the untolled lanes or the express lane. In case of a breakdown of the untolled lane(s) the price of using the express lane will rise to the maximum of US-$ 8.00 (Murray, 2012). At the I-15 no tolls have to be paid for carpools, vanpools and buses. This is one of the central ideas of the so called HOT lanes. Incentives are given not to drive on your own but to promote carpooling. The daily traffic on I-15 express lanes ranges from some 200.000 to 300.000 vehicles. In 2003, time delays were on average about 30 to 45 minutes. According to simulations in 2020 average delay would have been expanded to 80 to 90 minutes without the express lanes. However, total costs of the system are prohibitively high. The total costs of implementation and improvement of the system are some 1,300 million US-$ (Sandag, 2012). Fig. 8 illustrates the effects at I-15 in San Diego. We can identify a continuous increase of the volumes of the tolled express lanes from 1996 to 1999.
24
Klumpp M. et al. Comprehensive Urban Road Toll Evaluation System
Fig. 8. Express Lanes Volumes 1996-1999Source: Supernak (2013)
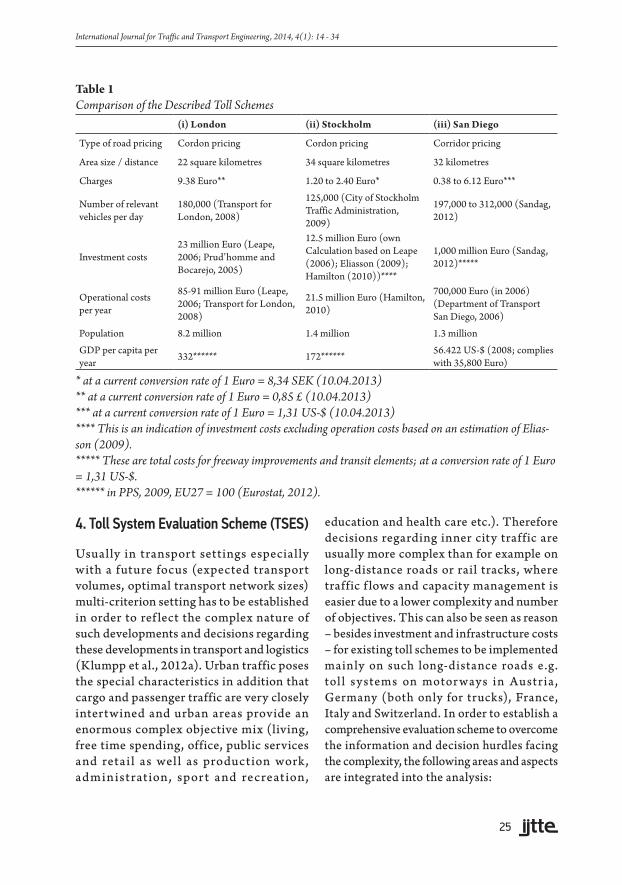
Table 1 summarizes the comparison of the three pricing systems according to the type of road pricing, the area size, the level of charges, the number
of relevant vehicles per day, investment costs and operational costs per year, the population and the GDP per capita and year.
25
International Journal for Traffic and Transport Engineering, 2014, 4(1): 14 - 34
Table 1Comparison of the Described Toll Schemes
(i) London (ii) Stockholm (iii) San Diego
Type of road pricing Cordon pricing Cordon pricing Corridor pricing
Area size / distance 22 square kilometres 34 square kilometres 32 kilometres
Charges 9.38 Euro** 1.20 to 2.40 Euro* 0.38 to 6.12 Euro***
Number of relevant vehicles per day
180,000 (Transport for London, 2008)
125,000 (City of Stockholm Traffic Administration, 2009)
197,000 to 312,000 (Sandag, 2012)
Investment costs 23 million Euro (Leape, 2006; Prud’homme and Bocarejo, 2005)
12.5 million Euro (own Calculation based on Leape (2006); Eliasson (2009); Hamilton (2010))****
1,000 million Euro (Sandag, 2012)*****
Operational costs per year
85-91 million Euro (Leape, 2006; Transport for London, 2008)
21.5 million Euro (Hamilton, 2010)
700,000 Euro (in 2006) (Department of Transport San Diego, 2006)
Population 8.2 million 1.4 million 1.3 million
GDP per capita per year 332****** 172****** 56.422 US-$ (2008; complies
with 35,800 Euro)
* at a current conversion rate of 1 Euro = 8,34 SEK (10.04.2013)** at a current conversion rate of 1 Euro = 0,85 £ (10.04.2013)*** at a current conversion rate of 1 Euro = 1,31 US-$ (10.04.2013)**** This is an indication of investment costs excluding operation costs based on an estimation of Elias-son (2009).***** These are total costs for freeway improvements and transit elements; at a conversion rate of 1 Euro = 1,31 US-$.****** in PPS, 2009, EU27 = 100 (Eurostat, 2012).
4. Toll System Evaluation Scheme (TSES)
Usually in transport settings especially with a future focus (expected transport volumes, optimal transport network sizes) multi-criterion setting has to be established in order to ref lect the complex nature of such developments and decisions regarding these developments in transport and logistics (Klumpp et al., 2012a). Urban traffic poses the special characteristics in addition that cargo and passenger traffic are very closely intertwined and urban areas provide an enormous complex objective mix (living, free time spending, office, public services and retail as well as production work, administration, sport and recreation,
education and health care etc.). Therefore decisions regarding inner city traffic are usually more complex than for example on long-distance roads or rail tracks, where traffic f lows and capacity management is easier due to a lower complexity and number of objectives. This can also be seen as reason – besides investment and infrastructure costs – for existing toll schemes to be implemented mainly on such long-distance roads e.g. tol l systems on motor ways in Austr ia, Germany (both only for trucks), France, Italy and Switzerland. In order to establish a comprehensive evaluation scheme to overcome the information and decision hurdles facing the complexity, the following areas and aspects are integrated into the analysis:

26
Klumpp M. et al. Comprehensive Urban Road Toll Evaluation System
• Transport effectiveness (enhancement or reduction of traffic f low into and out of the city, especially in peak hours);
• Financial effectiveness (invest, running costs, revenue, benefit for traffic projects and modes);
• Information effectiveness (transparency of prices and therefore e.g. congestion and capacity situations);
• Capacity impact (mitigation of traffic
problems and therefore extension of practical transport capacity for city transport);
• Social and business impact (prohibitive and motivation effects on businesses and logistics, exclusion effects and other effects for the population e.g. change of housing values and prices).
These areas of analysis are outlined and compared in Table 2.
Table 2 TSES Areas and Indicators
Evaluation area PSES Description Indicators
Transport effectivenessThe main objectives of toll regimes are traffic reduction and congestion avoidance in line with external effects internalization
I.e. reduction of traffic flows (in/out) in % or reduction of congestion hours absolute or in %
Financial effectivenessA secondary objective of toll schemes is the financial revenue generated (e.g. for infrastructure improvement)
I.e. absolute financial profit (p.a. or total), ROI
Information effectiveness
A theoretical objective of toll schemes is the supply of scarcity information to traffic participants
I.e. increased information trans parency e.g. by share of informed traffic participants
Capacity impact
A further system objective is the enhancement of overall transport effective capacities (average number of road vehicles per day without congestion / delays)
I.e. increased capacity without congestion in %
Social & business impact
Spill-over effects into the overall economy have to be taken into account for businesses (transport costs) as well as for individuals (housing) – and also environmental impacts and costs (pollution, noise)
I.e. added costs for cargo transport per shipment item in %; decrease of housing values or housing costs (rents) in %; decrease of CO2 emissions in %; noise reduction in %
Before applying this evaluation scheme first the concept setup for a GNSS-based city toll system is described for comparison to the existing systems.
4. GNSS-bases Toll Schemes
GNSS systems are implemented in a series of applications and industries, coming from the decade-old developments of military navigation and telematics systems (GPS
system of the United States of America, the Russian GLONASS system and others). For example in cargo transport applications, RFID-technologies in combination with GNSS-based f leet management systems provide real time data about the actual state of logistical processes and are commonly deployed i n re sea rc h a nd prac t ice , mainly in line with general technology and sustainabi l it y improvements and investments (Klumpp et al., 2013a; Klumpp

27
International Journal for Traffic and Transport Engineering, 2014, 4(1): 14 - 34
and Kandel, 2011; Batarlienė and Baublys, 2007). Especially the process interaction of transport and production scheduling are
in the focus of this development (“Industry 4.0”). An exemplary overview is displayed in Fig. 9.
Fig. 9. GNSS-based Transport Schemes for FreightSource: Klumpp et al. (2013b)
For the specif ic area of last-mile tour planning with today existing routing areas the GNSS (GPS) systems have been applied successfully as depicted in Fig. 10. Herein
a truck is ordered and supervised by GPS-based scheduling to cross the existing tour areas in order to deliver delayed shipments from another tour.
Fig. 10. GNSS-based Dynamic Last Mile SchedulingSource: Klumpp et al. (2012b)

28
Klumpp M. et al. Comprehensive Urban Road Toll Evaluation System
Furthermore, addressing the city traffic, already GNSS systems have been tested successfully in order to establish specific areas and city zones as shown in Fig. 11 for Stanford (USA) – though there are technical hurdles from the GNSS signal transmissions
in so-called city “canyons” (Liu et al., 2011; Bazzan et al., 2012). But these problems can be overcome by technical adjustments, be it RFID signaling, vehicle-to-vehicle (V2V) communication or other additions (Shi et al., 2008; Glas et al., 2013).
Fig. 11. GPS and Car LIDAR based City Area Marking in Stanford Source: Levinson et al. (2008)
Moreover, using the GNSS units also enables traffic systems to gather data about actual traffic situations as well as long-term changes in traffic and peak patterns as for example tested by Castro et al. (2012) for the Chinese city of Hangzhou with the GPS receivers of
taxi cabs (Fig. 12). This could also enable city toll systems to mark toll areas with pricing differences in a dynamic way (daily, weekly, week-end, monthly, for yearly seasons) in order to ref lect also long-term driving behaviors.
Fig. 12. Dynamic GPS Traffic Evaluation and Zoning (Hangzhou, 1 Month with 20 Taxis) Source: Castro et al. (2012)

29
International Journal for Traffic and Transport Engineering, 2014, 4(1): 14 - 34
Combing the described existing cordon and corridor pricing concepts, an “area pricing” scheme can be developed according to such traffic and peak patterns. This was for example suggested by Bazzan and Azzi (2012) for Sao Paulo for traffic analysis based on GPS but can easily be transferred to GNSS-based city toll regimes. Fig. 13 shows
the identified main traffic hotspots for Sao Paulo – these could be marked for example for higher charges in a GNSS-based city toll system in order to achieve the desired theoretical objectives as outlined before from economic theory as especially in these areas traffic demand exceeds capacities and congestion problems have to be expected.
Fig. 13. Three Main Peak City Destinations and Traffic Arteries in Sao Paulo Source: Bazzan and Azzi (2012)
The following Table 3 outlines the characteristics of a suggested GNSS-based city toll systems with
first draft investment estimates for such a system with a transfer of existing cost values.

30
Klumpp M. et al. Comprehensive Urban Road Toll Evaluation System
Table 3 Characteristics of a GNSS-based Urban Toll System
(iv) GNSS city toll
Type of road pricing Area pricing
Area size / distance Flexible
Charges (a) Zoning i.e. 1 Euro per entered sub-zone or (b) by distance i.e. 0.05 to 0.25 Euro per travelled kilometre according to traffic situation
Number of vehicles per day
Flexible but with necessary GNSS units – alternatively a manual system of payment has to be established as for example with the German TollCollect system for motorways
Investment costs (a) Estimated system costs 50 million Euro (TollCollect for German motorways 1.000 million Euros) and (b) estimated individual investment costs per car (GNSS units) ~100 Euro per car
Operational costs per year
Estimated 0.03 Euro per driven kilometre (comparison: 25,000 million truck kilometres tolled by TollCollect in Germany with operational costs of 700 million annually for 14,000 kilometres of motorway in Germany)
Population Flexible
5. Conclusion
Finally we implement a comparison of the described existing systems (London, Stockholm and San Diego) and GNSS city toll systems using the suggested TSES system.
As shown in Table 4, a new GNSS city toll scheme would be feasible in order to increase the transport steering and capacity effects as today only in limited areas as the San Diego Hot Lane system. The downside would be an increase in investment costs, but not in
overall financial effectiveness as shown in the investment calculation above. Depending on the defined fees in variable settings, even large financial contributions could be achieved by GNSS urban pricing systems. Especially the until today more or less unknown spill-over effects into business (cargo transport, services) and private society sectors (housing) can be estimated to be lower compared to fixed price and single area systems as the effects occur only f lexibly and dynamically.
Table 4 TSES Comparison of Urban Toll Systems
(i) London (ii) Stock-holm (iii) San Diego (iv) GNSS city toll
Transport effectiveness Low Medium High High
Financial effectiveness High Medium Medium Medium
Information effectiveness Low Medium High High
Capacity impact Very low Low Medium High
Social & business impact Unknown Unknown Unknown / very low (corridor)
Low due to flexibility
31
International Journal for Traffic and Transport Engineering, 2014, 4(1): 14 - 34
As outlined in this article, GNSS-based urban pricing systems can be an interesting solution which has until today been possibly neglected due to high investment costs. But such systems may provide theoretically ideal options for time- and area-dependent variable pricing and may also even themselves be used for traffic measurement and real-time dynamic pricing systems comparable to the San Diego Hot Lane system but without necessary fixed measurement systems within road infrastructure. Therefore the concept of a GNSS urban road pricing has to be labeled feasible and sound, especially as it is also in line with the new traffic concepts called for by the European Union in the 2011 white book for the future. Further research has to explore the options of including existing systems such as the German TollCollect system with already installed services and processes. The major problem can be expected in the private investment costs for integrated GNSS units within private cars – hereby also the option of using private navigation systems as toll units has to be explored and can maybe be strengthened by European standardization efforts. If all cars have a unified European GNSS (Galileo) receiver integrated, many applications and options would arise in toll regimes as well as in traffic f low management and telematics applications as well as V2V communication.
References
Arnott, R.A.; De Palma, A.; Lindsey, R. 1993. A Structural model of peak-period congestion: A traffic bottleneck with elastic demand, American Economic Review, 83(1): 161-179.
Baradaran, S.; Firth, D. 2008. Congestion Tax in Stockholm. An Analysis of Traffic Before, During and After the Trial and Since the Start of the Permanent Scheme. In Ecocity World Summit 2008 Proceedings.
Batarlienė, N.; Baublys, A. 2007. Mobile Solutions in Road Transport, Transport. DOI: http://dx.doi.org/10.1080/16484142.2007.9638097, 22(1): 55-60.
Bazzan, A.L.C.; Amarante, M.B.; Da Costa, F.B. 2012. Management of demand and routing in autonomous personal transportation, Journal of Intelligent Transportation Systems. DOI: http://dx.doi.org/10.1080/15472450.2012.639635, 16(1): 1-11.
Bazzan, A.L.C.; Azzi, G.G. 2012. An Investigation on the Use of Navigation Devices in Smart Transportation Systems. In Proceedings of VIII Simpósio Brasileiro de Sistemas de Informação (SBSI 2012), Trilhas Técnicas: 56-61.
Börjesson, M.; Eliasson, J.; Hugosson, M.B.; Brundell-Freij, K. 2012. The Stockholm congestion charges-5 years on. Effects, acceptability and lessons learnt, Transport Policy. DOI: http://dx.doi.org/10.1016/j.tranpol.2011.11.001, 20(2012): 1-12.
Bowen, D. 2010. The London Congestion Charging Scheme: A Cost-Benefit Analysis, Thesis, Duquesne University, Pittsburgh, Pennsylvania.
Castro, P.S.; Zhang, D.; Li, S. 2012. Urban Traffic Modelling and Prediction Using Large Scale Taxi GPS Traces, Pervasive Computing, Lecture Notes in Computer Science, 7319(2012): 57-72.
City of Stockholm Traffic Administration. 2009. Analysis of Traffic in Stockholm with special focus on the effects of the congestion tax, 2005-2008, Summary, Stockholm.
Cui, Y.; Ge, S.S. 2003. Autonomous Vehicle Positioning With GPS in Urban Canyon Environments, IEEE Transactions on Robotics and Automation. DOI: http://dx.doi.org/10.1109/TRA.2002.807557, 19(1): 15-25.
De Palma, A.; Fosgerau, M. 2011. Dynamic Traffic Modeling. In: De Palma, A.; Lindsey, R.; Quinet, E.; Vickerman, R. (eds.), A Handbook of Transport Economics, Edward Elgar. Great Britain.

32
Klumpp M. et al. Comprehensive Urban Road Toll Evaluation System
Department of Transport. 2006. FasTrak I-15 Express Lanes - I-15, San Diego, CA, HOT Lanes Project.
Downs, A. 1962. The law of peak-hour express-way congestion, Traffic Quarterly, 16(3): 393-409.
Dupuit, J. 1844. On the measurement of the utility of public works, Annales des Ponts et Chaussees, Memoires et Documents, 2, 8: 332-375, translated by Barback, R.H. 1952, International Economic Papers, 2: 83-110.
Eisenkopf, A. 2008. Urban Access Charging – An Efficient Means of Urban Transport Management? In: Discussion Paper 13th ACEA SAG Meeting, May 2008.
Eliasson, J. 2009. A cost-benefit analysis of the Stockholm Congestion Charging System, Transportation Research Part A: Policy and Practice. DOI: http://dx.doi.org/10.1016/j.tra.2008.11.014, 43(4): 468-480.
Eurostat. 2012. Regional GDP per capita in 2009: seven capital regions in the ten first places, STAT 12/38, 13th March 2012.
Fosgerau, M.; Van Dender, K. 2013. Road pricing with complications, Transportation. DOI: http://dx.doi.org/10.1007/s11116-012-9442-5, 40(3): 479-503.
Glas, R.; Belzner, ´H.; Lange, T.; Koller-Matschke, I.; Wisbrun, R. 2013. Seamless Traffic Information in Dynamic Navigation Up to Date. In Proceedings of the FISITA 2012 World Automotive Congress, Lecture Notes in Electrical Engineering. 200(2013): 169-178.
Hamilton, C. 2010. Revisiting the Cost of the Stockholm Congestion Charging Scheme. In: Discussion Paper 2005-5 Prepared for the ITF/OECD Round Table on 4-5 Feb 2010 for Implementing Congestion Charging, Stockholm.
Hartwig, K.H.; Marner, T. 2006. Von der Lkw-Maut zur Pkw-Maut? Vorteile und Hemmnisse. In: Knieps, G. (ed.), 38. Verkehrswissenschaftliches Seminar der Gesel lschaft für Verkehrswissenschaft und Regionalpolitik an der Universität Freiburg e.V.,
Die LK W-Maut a ls erster Schr it t in eine neue Verkehrsinfrastrukturpolitik, Schriftenreihe B der Deutschen Verkehrswissenschaftlichen Gesellschaft e.V., B 292, Freiburg: 91-118.
Klumpp, M.; Bioly, S.; Sandhaus, G. 2012a. Methods, Inputs and Examples for Future Transport Volume Prognosis in Germany. In: Blecker, T.; Kersten, W.; R ingle, C.M. (eds.), Pioneering Supply Chain Design – A Comprehensive Insight into Emerging Trends, Technologies and Applications, Shaker. Germany: 147-159.
Klumpp, M.; Bioly, S.; Zelewski, S. 2013a. Integrating sustainability and technology innovation in logistics management. In: McIntyre, J.R.; Ivanaj, S.; Ivanaj, V. (eds.), Strategies for Sustainable Technologies and Innovations, Edward Elgar. Great Britain. In print.
Klumpp, M.; El Moctar, B.; Kandel, C.; Hitzbleck, K. 2011. GPS Geofencing for Location-based CO2 Calculation within Port Areas. In: Blecker, T.; Jahn, C.; Kersten, W. (eds.), Maritime Logistics in the Global Economy – Current Trends and Approaches, EUL. Germany: 39-55.
Klumpp, M.; Kandel, C. 2011. GPS-Based Real-Time Transport Control for Production Network Scheduling Simulation. In Navais, P.; Machado, J C. Analide, A. Abelha (eds.), The 2011 European Simulation and Modelling Conference, Conference Proceedings October 24-26, 2011 at University of Minho, Guimaraes: 235-239.
Klumpp, M.; Kandel, C.; Wirsing, E. 2013b. Cargo Telematics for Operational Transport Excellence and Strategic Knowledge Management. In: Kreowski, H.J. et al. (eds.), Dynamics in Logistics, Lecture Notes in Logistics, Springer. Berlin: 71-82.
Klumpp, M.; Noche, B.; Kandel, C.; Hohmeier, T. 2012b. Dynamic Scheduling for Logistics Service Providers. In: Delfmann, W.; Wimmer, T. (eds.), Coordinated Autonomous Systems, Hamburg: 124-144.
33
International Journal for Traffic and Transport Engineering, 2014, 4(1): 14 - 34
Knight, F.H. 1924. Some Fallacies in the Interpretation of Social Cost, The Quarterly Journal of Economics. DOI: http://dx.doi.org/10.2307/1884592, 38(4): 582-606.
Konishi, H.; Mun, S. 2010. Carpooling and congestion pricing : HOV and HOT lanes, Regional Science and Urban Economics, 40(4): 173-186.
Leape, J. 2006. The London congestion charge, Journal of Economic Perspectives, 20(4): 157-176.
Levinson, J.; Montemerlo, M.; Thrun, S. 2008. Map-Based Precision Vehicle Localization in Urban Environments. In: Stanford Artificial Intelligence Laboratory Working Paper, Stanford.
Liu, L.; Andris, C.; Ratti, C. 2011. Uncovering cabdrivers’ behavior patterns from their digital traces, Computers, Environment and Urban Systems. DOI: http://dx.doi.org/10.1016/j.compenvurbsys.2010.07.004, 34(6): 541-548.
Marner, T. 2006. Die Modellierung innerstädtischer St au s u nd d ie W i rk u ng s wei se au sge w ä h lter w i r t s c h a f t s p o l i t i s c h e r M a ß n a h m e n – e i n e spieltheoretische Analyse (In German), Zeitschrift für Verkehrswissenschaft 3: 199-225.
Marner, T. 2007. City-Maut in Stockholm – eine politökonomische Analyse, Internationales Verkehrswesen, 59(11): 505-511.
Murray, P. 2012. Congestion pricing for roads: an overview of current best practice, and the economic and transport benefits for government, Public Infrastructure Bulletin, 1(8): Art. 8.
Pigou, A.C. 1920. The Economics of Welfare. Macmillan and Co. Great Britain. 1920.
Prud’homme, R.; Bocarejo, J.P. 2005. The London Congestion Charge: A Tentative Economic Appraisal, Transport Policy. DOI: http://dx.doi.org/10.1016/j.tranpol.2005.03.001, 12(3): 279-287.
Rouwendal, J.; Verhoef, E.T. 2006. Basic economic principles of road pricing: From theory to applications, Transport Policy. DOI: http://dx.doi.org/10.1016/j.tranpol.2005.11.007, 13(2): 106-114.
Sandag. 2012. I-15 Express Lanes – Fact Sheet. San Diego, January 2012.
Santos, G.; Shaffer, B. 2004. Preliminary Results of the London Congestion Charging Scheme, Public Works Management and Policy. DOI: http://dx.doi.org/10.1177/1087724X04268569, 9(2): 164-181.
Schade, J.; Baum, M. 2007. Reactance or acceptance? Reactions towards the introduction of road pricing, Transportation Research Part A: Policy and Practice. DOI: http://dx.doi.org/10.1016/j.tra.2006.05.008, 41(1): 41-48.
Shi, W.; Kong, Q.-J.; Liu, Y. 2008. A GPS/GIS Integrated System for Urban Traffic Flow Analysis. In Proceedings of the 11th International IEEE, Conference on Intelligent Transportation Systems Beijing, October 12-15, 2008, 844-849.
Supernak, J. 2013. Hot Lanes on Interstate 15 in San Diego: Technology, Impacts and Equity Issues. Available from Internet: <http://wiki.umd.edu/lei/images/b/b7/SanDiegoHOT.pdf>.
Transek. 2006. Equity effects of the Stockholm trial, Transek Report 2006, Stockholm.
Transpor t for London. 20 08. Centra l London Congestion Charging Impacts Monitoring, Sixth Annual Report, London.
Vickrey, W.S. 1955. Some Implications of Marginal Cost Pricing of Public Utilities, American Economic Review, Papers and Proceedings, 45(2): 605-620.
Vickrey, W.S. 1969. Congestion theory and transport investment, American Economic Review, 59(2): 251-260.

34
Klumpp M. et al. Comprehensive Urban Road Toll Evaluation System
Walters, A.A. 1961. The theory and measurement of private and social cost of highway congestion, Econometrica, 29(4): 676-699.
Zabic, M. 2011. GNSS-based road charging systems, PhD Thesis, Technical University of Denmark.