
Comprehensive Node Analysis Assures Big … · 3 WHITE PAPER: Comprehensive Node Analysis Assures...
8
WHITE PAPER Comprehensive Node Analysis Assures Big Upstream Gains For DOCSIS 3.0 Channel Bonding
Transcript of Comprehensive Node Analysis Assures Big … · 3 WHITE PAPER: Comprehensive Node Analysis Assures...

WHITE PAPER
Comprehensive Node AnalysisAssures Big Upstream GainsFor DOCSIS 3.0 Channel Bonding

2 WHITE PAPER: Comprehensive Node Analysis Assures Big Upstream Gains
anything less is a shortcut that will incur significant costs when operators have to go back and implement those techniques in response to surging demand and the attendant pressures from competitors who are better able to meet that demand.
Operators today typically operate two or more return channels in the 5–42 MHz (5–62 MHz in Europe), sometimes with some components of DOCSIS 2.0 in use, sometimes not. Even with DOCSIS 2.0 CMTSs installed, all the capacity-enhancing techniques embodied in DOCSIS 2.0 are seldom used.
As a result, upstream channel widths of 1.6 and 3.2 MHz are the norm, with some instances where one of the channels may be as wide as 6.4 MHz. Modulation levels at 16 QAM and 32 QAM are most common, although ever more operators are delivering at least one channel over 64 QAM using DOCSIS 2.0.
But, as operators add more upstream channels, they should bear in mind that, when it comes to bonding channels together for implementation over DOCSIS 3.0, the margins that seemed sufficient for operating these channels independently may not be sufficient to satisfy the expanded dynamic range requirements when bonded channels are in operation simultaneously. This distinction needs to be understood and accounted for in any node characterization process that envisions an eventual move to bonded channels.
More often than not, operators will find that, even if the node analysis shows they can move to four upstream channels under existing conditions, the capacity over those four channels could be significantly increased were the operator to implement the full range of upstream performance enhancement techniques embodied in the two major approaches to signal multiplexing as defined by the
OverviewAs MSOs accelerate implementation of DOCSIS 3.0 in their networks they are coming to recognize there’s a growing need to exploit the benefits of bonded channel technology in the return as well as the forward path.
This is a complex undertaking. In contrast to the experience MSOs have accumulated with the relatively straight-forward downstream bonding procedures of DOCSIS 3.0, bonding on the return raises all the challenges associated with maximizing bandwidth efficiency in the noise-encumbered lower reaches of the RF spectrum. This means operators must carefully analyze their end-to-end return path dynamics across multiple parameters to determine their capacity potential so as to ensure that when they do bond the upstream channels they haven’t left themselves short of optimal results.
This requires a comprehensive, in-depth approach to node characterization that goes well beyond the norms of traditional node performance analysis. The operator must first determine whether there’s sufficient performance margin over the existing optical return in the context of ingress noise, microreflections, link loss over the coax and other metrics to accommodate a four-channel upstream configuration and just what that configuration looks like with respect to maximum channel widths and levels of modulation.
A second level of analysis beyond characterization of existing performance is equally important. Given the extensive benefits to be derived from full utilization of the capacity enhancing specifications of DOCSIS 2.0 operators need to assess what they can achieve with activation of all those capabilities in the context of existing plant conditions. To do
Comprehensive Node AnalysisAssures Big Upstream GainsFor DOCSIS 3.0 Channel Bonding
3 WHITE PAPER: Comprehensive Node Analysis Assures Big Upstream Gains
DOCSIS 2.0 specifications – A-TDMA (Advanced Time Division Multiple Access) and S-CDMA (Synchronous Code Division Multiple Access). In other words, when it comes to getting the most out of the upstream path, bonding alone is not enough.
The fact that most operators have not utilized DOCSIS 2.0 tools to the fullest extent possible has led to some misconceptions as to what can be done to maximize the benefits of DOCSIS 3.0 channel bonding. For example, some people assert that in order to carve out enough channels for four-channel bonding operators must restrict the upstream channel widths to 3.2 MHz per channel. While this might be the case in some cases where amplifier cascades are unusually long or impediments such as microreflections and ingress noise are unusually strong, more often than not operators will find they can support 6.4 MHz channels through greater utilization of DOCSIS 2.0 techniques. Moreover, when fully utilized, these techniques will usually allow operators to employ 64 QAM or at least 32 QAM rather than 16 QAM on the return.
But, again, it’s essential to take into account the dynamic range implications of bonded channel operations, no matter what QAM level is employed. The impact is especially dramatic when it comes to bonding 64 QAM carriers, which is quite different from what will be seen with simultaneous transmissions over bonded 16 QAM channels.
In order to ascertain their true upstream potential, operators must thoroughly analyze all the return path performance metrics that are relevant to the application of each technique in the DOCSIS 2.0 toolkit. In some cases, it will be obvious that simply applying a given technique under existing node conditions will produce the best possible results. In other cases, the measurements will show that with certain adjustments, such as an upgrade in return transmitters or reduction in amplifier cascade, much more can be gained at relatively little expense.
It’s also important to note that the analysis of present performance and of how DOCSIS 2.0 components will impact that performance must take into account all relevant metrics for a comprehensive picture of what is going on, including CM and CMTS transmissions, FEC statistics and CMTS EQ-MER (Equalized Modulation Error Ratio) – which is actually derived from the DEMODULATED Mean Square Error or commonly referred to a SLICER Error), across all carriers. For example, an undesirable FEC result should not be read in isolation without also knowing the power levels at which CMs are operating, since there’s a possibility that result could be rectified if there’s margin to go higher on CM power.
Great care needs to be taken in evaluating the impact of microflections, which increases dramatically with expansion of channel widths from, say, 1.6 MHz to 6.4 MHz. Operators must be able to determine how microreflections impact signal-to-interference ratios and understand at what point for a given QAM level the S/I becomes unacceptably
low and whether the offending microreflection must be equalized or eliminated. One of the major under utilized tools in DOCSIS 2.0 is pre-equalization, which, if used properly, not only can help operators precisely tune equalization to maximize effectiveness against microreflections, it can also help them locate the sources of microreflections.
Motorola has developed a comprehensive node characterization program that allows operators to assess what they can accomplish with implementation of DOCSIS 3.0 under existing conditions and determine what their optimum DOCSIS 3.0 potential would be based on a thorough assessment of the benefits they can derive from application of various DOCSIS 2.0 techniques.
Motorola has applied these advanced methodologies across multiple different vendor solutions in major node characterization projects with more than a dozen Tier 1 MSOs worldwide. The discussion that follows serves to highlight the areas of investigation entailed in this process and the benefits that operators can expect to achieve.
Return Transmitter PerformanceAt the most basic level of performance analysis successful implementation of DOCSIS 3.0 in the return path depends on the operator’s choice of return transmitters. At least half of the HFC nodes in operation around the world use Fabry Perot lasers, often relying on early generation devices that were never designed to work at multiple carrier frequencies.
In some cases operators will find the dynamic range of these return transmitters is too low to support multiple channels for bonding even at the lowest modulation rates and narrowest channel widths. If bonding is to be implemented the operator will have no choice but to replace these lasers with higher performance devices.
In other cases, the FPs will have sufficient dynamic range to be employed on up to four upstream channels but at channel widths and modulation levels that result in significantly less overall capacity than would be the case if better performing lasers were deployed. Specifically, on average, FPs operating at 16 QAM over four 3.2 MHz channels will yield an EQ-MER of 28 dB, providing 6 dB of margin for normal bonded channel operations at 16 QAM, which is more than enough, but only 3 dB of margin for 32 QAM and 0 dB of margin for 64 QAM. Thus, FPs are of no use in bonded 64 QAM channel operations and not a particularly reliable option when it comes to bonding four 3.2 MHz channels.
In contrast Distributed Feedback (DFB) lasers operating over four 3.2 MHz 16 QAM channels will yield an average EQ-MER of 37–39 dB, which equates to 9 dB of performance margin for 64 QAM. That’s ample to support operating over four bonded DOCSIS 3.0 upstream channels. In fact, DFBs can support up to six 64-QAM 6.4 MHz channels, depending on plant conditions.

4 WHITE PAPER: Comprehensive Node Analysis Assures Big Upstream Gains
Of course, other steps beyond changing out lasers can be taken to raise EQ-MER, including minimization of noise ingress, optimizing the dynamic system range of cable modems to keep end-to-end system loss under 48 dB, reduction of amplifier cascades to increase usable bandwidth and elimination of major structural causes of micro-reflections. But the most important factor is the dynamic range of the return laser, and therefore that’s the place to begin in analyzing what the operator’s options are with respect to maximizing the benefits of DOCSIS 3.0.
There are, of course, alternatives to the DFB that also offer higher performance than the basic FP, including Isolated FPs, Enhanced Isolated FPs and high-power DFBs and Digital Return Systems, but here we’ll focus the discussion on the comparative performance parameters of basic FPs and DFBs, as shown in Figure 1. This chart shows the worst case NPR (noise power ratio) over a 9 dB loss link at input signal levels ranging from 5.0–30.0 dBmV.
In calculating EQ-MER, one finds the dynamic range performance of the FP is quite poor even in the most useful operating ranges, registering an EQ-MER of just > 29 dB – only over a 5 dB range and > 25 dB EQ-MER – only over a 15 dB range. In contrast, the DFB delivers much greater performance across a wider range of operations margins:
Operational Window EQ-MER
3 dB > 40 dB
15 dB > 35 dB
24 dB > 30 dB
30 dB > 25 dB
These measurements all assume a return path laser is operating in an Analog Modulation Mode (i.e. AM Modulated)/ As an alternative Motorola offers a means by which the return signals can be converted from analog and multiplexed together digitally at the node, which allows the optical signal to be generated at much higher power than is possible over amplitude modulated lasers. In this case, the DFB operating at higher power performs as follows:
Operational Window EQ-MER
4 dB > 45 dB
15 dB > 40 dB
22 dB > 35 dB
30 dB > 30 dB
Ascertaining the Optical RX Margin for DOCSIS 3.0Beyond understanding these basic characteristics of FP and DFB lasers operators must be able to assess the actual performance parameters of deployed lasers with respect to 2nd and 3rd order non-linearities in order to calculate how much margin they have for adding channels and expanding channel capacity. This is a moving target that varies as the range of input signal levels from cable modems (CMs) varies in conjunction with the addition of new channels, introduction of performance compensating measures in DOCSIS 2.0 and activation of DOCSIS 3.0 modems.
For example, calculations have to take into account the fact that DOCSIS 3.0 CMs can operate at higher power output than earlier generation CMs. And the CMTS controlling the DOCSIS 3.0 CM has to account for how ingress noise and linear impairments in the plant, including microreflections caused by impedance mismatches and by amplitude and group delay distortion from diplex filters, combined with the optical margins is impacted as a system when new channels are added.
Return path laser and optical receiver 2nd and 3rd order distortion are important limiting factors when it comes to assessing what levels of QAM the optical return link will support. Where FPs are concerned, these non-linear impairments can become visible at fairly low levels of input. For example, in a typical result from one recent test Motorola found an FP node was showing 2nd order impairments at 17 dBmV, with 2nd order degradation increasing at a rate of 2 dB for every 1 dB of increase in input above 17 dBmV. In other words the Signal-to-2nd Order Distortion Ratio decreases by 1 dB with every increase of 1 dB signal power.
Impairments from 3rd order distortion are even more damaging when it comes to setting modulation levels. This class of distortion tends to be compressive in nature and thereby impacts the outer points of the DOCSIS-transmitted constellation more significantly than the inner points, whereas 2nd order distortion tends to impact inner and outer points equally. Another reason for 3rd order having a more significant impact than 2nd order distortion is that for every 1 dB increase in power the Signal-to-3rd Order Distortion Ratio deceases by 2 dB.
The ability to take these kinds of distinctions into account in the node characterization process is vital to setting ultimate performance parameters on the bonded upstream channels. In situations where non-linearity is high, the impact on the outer constellation points when transmitting at 64 QAM can be especially damaging at peak usage times.
Worst Case NPR dB Link
50
45
40
35
30
25
20
15
10
NP
R (d
B)
Input Signal Level (dBmV)5 10
Fabry-Perot (FP)
Distributed Feedback (DFB)
15 20 25 30
Return Laser Dynamic Range Capabilities vs. Laser Technology
HFC Node Analysis Methodology for determining DOCSIS 3.0 Capability
Figure 1
5 WHITE PAPER: Comprehensive Node Analysis Assures Big Upstream Gains
The average EQ-MER might show only a marginal impact, because that metric is almost entirely dominated by readings on the inner constellation points, peak EQ-MER could tell a very different story in those brief periods when the outer constellation points are heavily impacted. Thus, in order to gain a full understanding of how non-linearity might be affecting overall performance on a 64 QAM channel, the node analysis should take into account the ratio of average EQ-MER to peak EQ-MER. If that ratio is high, non-linearity is a problem even if the average EQ-MER is acceptable.
There are other factors that can disproportionately affect the outer constellation points to where an average EQ-MER reading will overlook a potential problem. For example, single frequency interference or ingress can be problematic along these lines. Such results are trackable, but they require constellation analysis separate from the average MER readings generated by CMTSs.
Ascertaining how much headroom there is on the optical link to accommodate the range of input power at the node that results from adding channels and DOCSIS 2.0 enhancements requires aggregation of statistics on a per-CM basis. At higher frequencies, especially above 33 MHz, the transmit power required for each CM is a function of the aggregate impact of non-linear distortions, which vary based on how many amplifiers are in cascade between the CM and the node. Moreover, the impact on CM TX power and therefore on the acceptable 2nd and 3rd order tolerance thresholds becomes greater as the order of modulation increases.
It’s also important to recognize the output level range of a CM may be exceeded as a result of the pre equalizer tap loss inserted to correct the signal group delay. Since this primarily affects the upper band edge frequencies, carriers at the low end of the band could have a different level than carriers at the high end of the band. To cite just one example of how complex the characterization process can become, in the instance where the 24-Tap pre-equalizer enabled by DOCSIS 2.0 is employed to overcome the amplitude and group delay distortion caused by in-line amplifier diplex filters, the resulting attenuation of signals requires that CMs transmit at higher powers, which increase with higher carrier frequencies.
Owing to the fact that there is a greater degree of amplitude loss and group delay near the cut-off region of the diplex filter around 36 MHz than there is at lower frequencies, the TX power levels for CMs operating at these frequencies are especially high. In the case of a 6.4 MHz channel, depending upon how many amplifiers are in cascade and what operating frequency the signal is using, the increased power demands can be as high as 3 dB or more.
The Motorola Node Characterization ProgramClearly, determining node characteristics essential to achieving maximum benefits from DOCSIS 3.0 entails a scope of measurement and analysis that most MSOs are not prepared to execute without outside assistance. The methodology developed by Motorola applies to nodes from any equipment vendor, and provides operators with assurance that they will be able to shape their strategies for implementing bonded return channels over DOCSIS 3.0. The Motorola Node Characterization Program is based on the most complete analysis performed in the most cost efficient and non-disruptive way available.
The final system-wide analysis produced through Motorola’s Node Characterization Program relies on field measurements taken at several nodes over a period of days to ensure that a large enough data sample is gathered on all metrics to represent real-world performance on the plant 24/7. Measurements at each node extend over a minimum of 14-hour time frames and are recorded at a rate of at least once per minute.
Motorola employs a wide range of equipment in this process. This includes off-the-shelf components as well as proprietary elements such as a portable BSR-64000 CMTS and battery-operated diagnostic SB-5101 CMs. Indeed, because a DOCSIS analyzer is embedded in the integrated circuit used with the SB-5101 the unit not only can analyze the pre-equalizer coefficients sent from the CMTS; it can perform analysis on feedback from the CMTS on FEC statistics, the EQ-MER return signal level and other DOCSIS registers required for determining the status of the DOCSIS connection.
6 WHITE PAPER: Comprehensive Node Analysis Assures Big Upstream Gains
The ability to quickly connect a portable CMTS at the headend and to avoid having to use installed CMs at the homes of friendly users is essential to successful node characterizations. Insofar as lab tests can’t deal with live node issues like ingress and impulse noise in the context of live traffic, the portable system is the only solution for node characterization that isn’t disruptive to customer service.
In assessing the dynamic range potential of node lasers, the Motorola team performs FFT and EQ-MER measurements on the end-to-end optical RX, including receivers as well as lasers. If FPs are in use, the team can temporarily install a DFB at each location to determine the potential headroom improvement to be obtained with the superior device.
Processes associated with characterizing common path distortion and ingress noise go beyond traditional measurements to analyze the power level of each impairment as it bears on the potential to overdrive the return laser. The analysis not only determines whether there is a serious problem regarding laser dynamic range in the presence of both noise and DOCSIS signals but also the time of day when such problems are most likely to occur.
When it comes to calculating the impact of structural microreflections, the process includes analysis of whether implementation of a DOCSIS 2.0 pre-equalizer on the widest possible channel bandwidth (6.4 MHz) can span and compensate for the amplitude level and round trip delay caused by the structural microflection. The analysis also provides insight into what steps can be taken to eliminate or minimize the effects of a major structural microreflection should the DOCSIS 2.0 pre-equalizer remedy not be sufficient to enable use of 6.4 MHz channels. Motorola provides this internally developed, vendor-agnostic pre-equalizer analytical application free of charge to any customers who want to use it.
In order to obtain a field-based comparative analysis of the improvements to be gained with implementation of DOCSIS 2.0 techniques, Motorola uses the logical channel feature embodied in DOCSIS 2.0 specifications. This feature, which is one of the most important but least appreciated techniques in the DOCSIS 2.0 toolkit, allows operators to deliver
return signals from DOCSIS 2.0 modems using either the A-TDMA or S-CDMA modes over a physical RF channel that’s also used by DOCSIS 1.x modems.
In the case of the Motorola Node Characterization Program, activation of a logical channel using the portable CMTS and CMs provides a way to incrementally measure the impact of each DOCSIS 2.0 technique against DOCSIS 1.x performance in the context of the measured FP and DFB headroom on the optical RX. In the end, operators know precisely what their options are with respect to what can be done with DOCSIS 2.0 under existing conditions versus what might be accomplished with adjustments in conditions to achieve the best return on investment with DOCSIS 3.0.
Maximizing the DOCSIS 2.0/3.0 PotentialWhile some of the techniques in the DOCSIS 2.0 toolkit are in wide use, others have barely been tapped. The attributes of all these techniques have been thoroughly covered in cable technical literature, so there’s no need to go into exhaustive detail here. But it is useful to briefly list them and then to discuss how they might be applied to maximize the total upstream capacity that can be made available for DOCSIS 3.0 channel bonding.
The most widely used techniques are encompassed in the specifications for A-TDMA, but even here there are some that are under utilized. The main attributes include:
• Multiple modulation modes up to 64 QAM – a little used feature that allows operators to maximize available upstream throughput by not having to choose between using carriers where only the highest modulation rate is feasible or going with the lowest common denominator across multiple carriers.
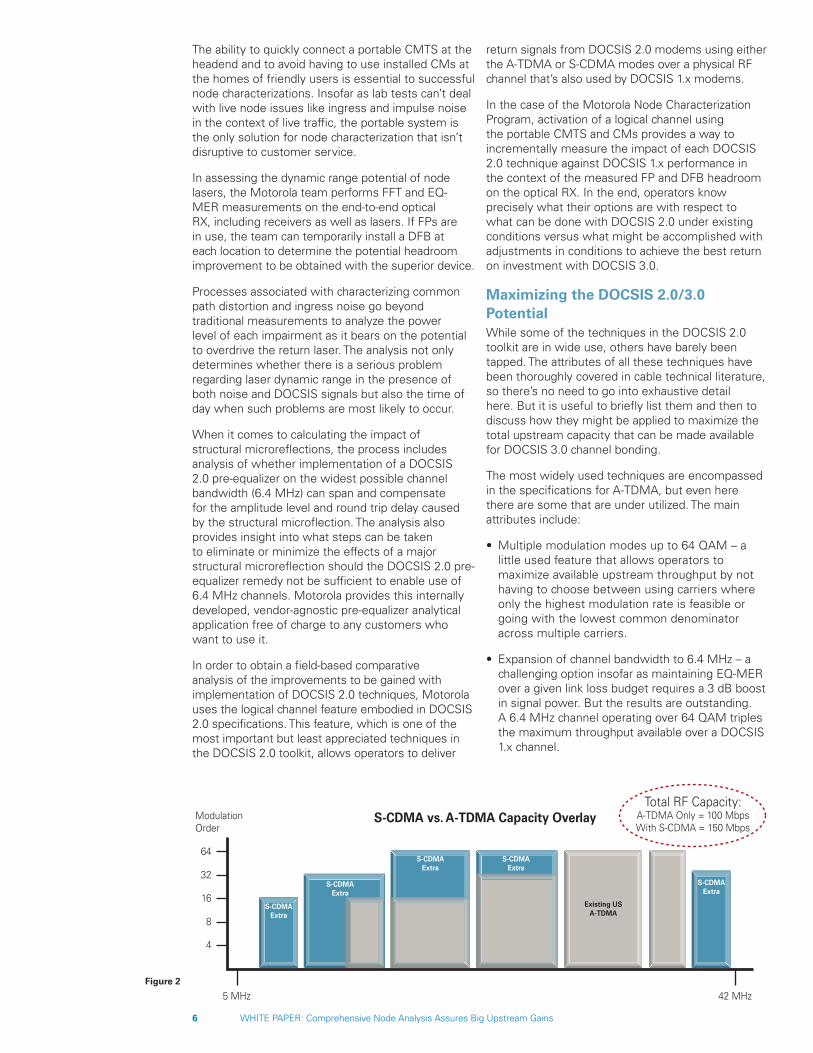
• Expansion of channel bandwidth to 6.4 MHz – a challenging option insofar as maintaining EQ-MER over a given link loss budget requires a 3 dB boost in signal power. But the results are outstanding. A 6.4 MHz channel operating over 64 QAM triples the maximum throughput available over a DOCSIS 1.x channel.
S-CDMAExtra
ModulationOrder
64
32
16
8
4
S-CDMA vs. A-TDMA Capacity OverlayTotal RF Capacity:
A-TDMA Only = 100 MbpsWith S-CDMA = 150 Mbps
S-CDMAExtra
S-CDMAExtra
S-CDMAExtra
S-CDMAExtra
Existing USA-TDMA
5 MHz 42 MHzFigure 2
7 WHITE PAPER: Comprehensive Node Analysis Assures Big Upstream Gains
• Improvements in pre-equalizer to accommodate microreflections – an expansion from 8 to 24 Taps and the asymmetrical positioning of the Main Tap at Tap 8 allows the equalizer to identify and compensate for large spurious burst signals. Improved equalization was also accomplished through a new approach to preamble creation that accelerates equalizer convergence time by approximately 50 percent.
Along with A-TDMA DOCSIS 2.0 affords operators the option to employ S-CDMA either across all channels or on certain channels in parallel with A-TDMA on other channels. S-CDMA brings into play a variety of innovations, including:
• The spreading of symbols out in time by a factor of 128x, thereby narrowing the impact of noise bursts to a limited segment of the aggregate signal from any given modem;
• The option to reduce the number of codes per channel so as to support increased power per code that enable the Cable Operator to more effectively deal with excessive loss (usually in the home) and not sacrifice EQ-MER in dealing with this excessive loss customer. The end result is that the EQ-MER performance is maintained at the expense of that one customer’s throughput as each time the codes are reduced by a factor of two, the throughout is also reduced by a factor of two;
• Active code selection for purposes of optimizing ingress cancellation;
• Code hopping, which allows dynamic selection of transmission codes ensures robust operation of S-CDMA in the presence of both Ingress Noise and Transient Noise conditions.
These capabilities allow operators to add channels near the lower and upper band edges to greatly increase the bandwidth available for DOCSIS 3.0 channel bonding. S-CDMA is especially significant as a means of making spectrum below 15 MHz available for upstream communications.
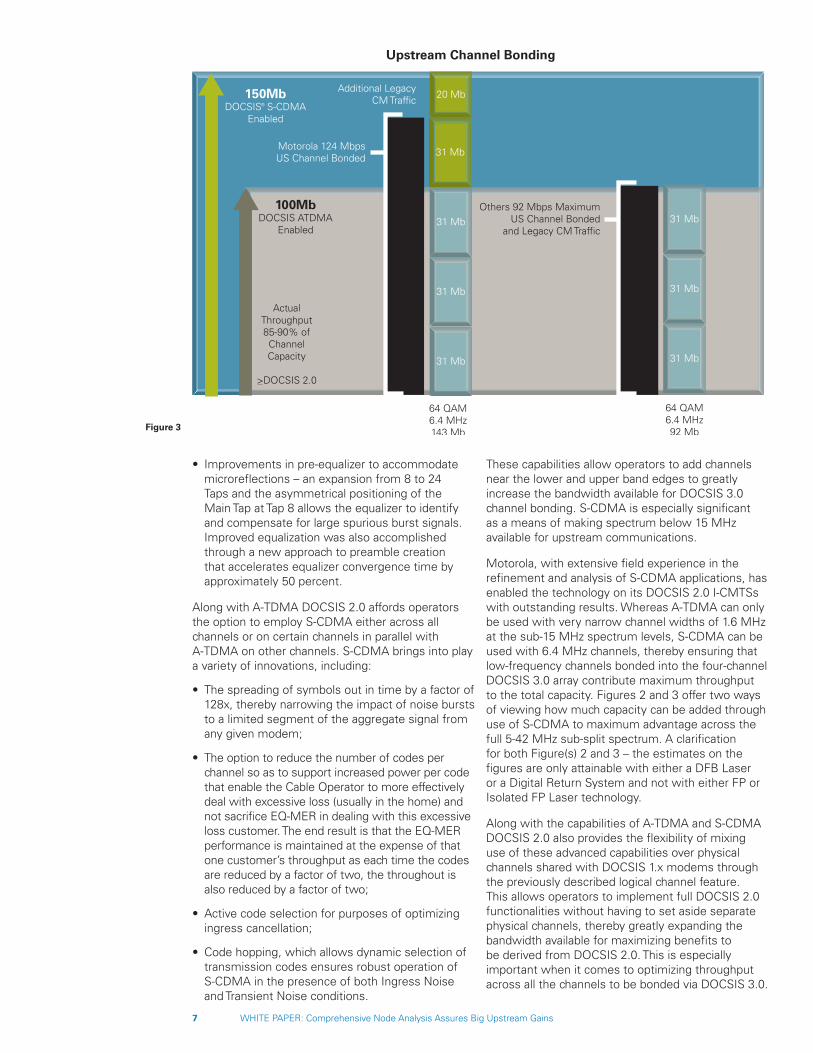
Motorola, with extensive field experience in the refinement and analysis of S-CDMA applications, has enabled the technology on its DOCSIS 2.0 I-CMTSs with outstanding results. Whereas A-TDMA can only be used with very narrow channel widths of 1.6 MHz at the sub-15 MHz spectrum levels, S-CDMA can be used with 6.4 MHz channels, thereby ensuring that low-frequency channels bonded into the four-channel DOCSIS 3.0 array contribute maximum throughput to the total capacity. Figures 2 and 3 offer two ways of viewing how much capacity can be added through use of S-CDMA to maximum advantage across the full 5-42 MHz sub-split spectrum. A clarification for both Figure(s) 2 and 3 – the estimates on the figures are only attainable with either a DFB Laser or a Digital Return System and not with either FP or Isolated FP Laser technology.
Along with the capabilities of A-TDMA and S-CDMA DOCSIS 2.0 also provides the flexibility of mixing use of these advanced capabilities over physical channels shared with DOCSIS 1.x modems through the previously described logical channel feature. This allows operators to implement full DOCSIS 2.0 functionalities without having to set aside separate physical channels, thereby greatly expanding the bandwidth available for maximizing benefits to be derived from DOCSIS 2.0. This is especially important when it comes to optimizing throughput across all the channels to be bonded via DOCSIS 3.0.
Upstream Channel Bonding
31 Mb
31 Mb
31 Mb
31 Mb
20 Mb
31 Mb
31 Mb
31 Mb
150MbDOCSIS S-CDMA
Enabled
®
100MbDOCSIS ATDMA
Enabled
ActualThroughput85-90% ofChannelCapacity
>DOCSIS 2.0
Others 92 Mbps MaximumUS Channel Bonded
and Legacy CM Traffic
64 QAM6.4 MHz143 Mb
64 QAM6.4 MHz92 Mb
Additional Legacy CM Traffic
Motorola 124 MbpsUS Channel Bonded
Figure 3
www.motorola.com
MOTOROLA and the Stylized M Logo are registered in the U.S. Patent and Trademark Office. All other product or service names are the property of their registered owners. © Motorola, Inc. 2010
ConclusionClearly, operators are well advised to implement upstream bonding only after they have put DOCSIS 2.0 to use to achieve the highest possible modulation rates across the broadest possible range of spectrum. But to do so to maximum effect operators must be able to calculate all the characteristics and impairments of a given return path together with the optical overhead and then determine what gains can be achieved through use of 2.0 features.
The node characterization methodologies developed by Motorola allow operators to precisely calculate their options and to determine what, if any enhancements to node performance they want to make in order to maximize the benefits to be attained through channel bonding. In most cases, operators will determine that tapping DOCSIS 2.0 and beyond to the fullest extent possible will expand total throughput to greater than 100 mbps on the return path, ensuring that the service offering enabled by channel bonding will satisfy market requirements well into the future.


![Understanding Node Change Bugs for Distributed Systems · storage service outages for eight hours, due to unexpected node failures [4]. We believe that a comprehensive study of how](https://static.fdocuments.us/doc/165x107/6000added241bf68c73e7fc2/understanding-node-change-bugs-for-distributed-systems-storage-service-outages-for.jpg)


