COMPREHENSIVE MARKET STUDY PROPOSED MIXED-INCOME …
141
ark Knight Frank 2399 Sweet Home Road Amherst, NY 14228 www.ngkf.com COMPREHENSIVE MARKET STUDY PROPOSED MIXED-INCOME FAMILY HOUSING DEVELOPMENT 25 DELAWARE 25 DELAWARE STREET, ALBANY, NEW YORK 12308 Analysis Prepared For (1): Mr. Michael Birkby Project Director Conifer 1000 University Avenue Rochester, NY 14607 Analysis Prepared By: Newmark Knight Frank Valuation & Advisory 2410 North Forest Road Amherst, New York 14068 NKF Job No.: 20-0118566 Date of Report: August 24, 2020 (1) In addition to the client, the intended user of this report includes New York State Homes and Community Renewal (HCR).
Transcript of COMPREHENSIVE MARKET STUDY PROPOSED MIXED-INCOME …
ark Knight Frank
2399 Sweet Home Road
Amherst, NY 14228
www.ngkf.com
COMPREHENSIVE MARKET STUDY PROPOSED MIXED-INCOME FAMILY
HOUSING DEVELOPMENT 25 DELAWARE
25 DELAWARE STREET, ALBANY, NEW YORK 12308
Analysis Prepared For (1):
Mr. Michael Birkby
Project Director
Conifer
1000 University Avenue
Rochester, NY 14607
Analysis Prepared By:
Newmark Knight Frank
Valuation & Advisory
2410 North Forest Road
Amherst, New York 14068
NKF Job No.: 20-0118566
Date of Report: August 24, 2020
(1) In addition to the client, the intended user of this report includes New York State
Homes and Community Renewal (HCR).
Newmark Knight Frank
2410 North Forest Road
Amherst, NY 14068
www.ngkf.com
August 24, 2020 Mr. Michael Birkby
Project Director
Conifer
1000 University Avenue
Rochester, NY 14607
Re: Comprehensive Market Study
Proposed Affordable Housing Development 25 Delaware 25 Delaware & Morris Streets Albany, Albany County, New York
NKF Job No.: 20-0118566
Dear Mr. Birkby:
Newmark Knight Frank (NKF) has completed a Comprehensive Market Study overviewing supply
and demand trends related to the development of a proposed housing project to be built in the
City of Albany, Albany County, New York.
The subject will reflect the new construction of a 4-story elevator building and renovation of an
historic building to create 51 one and two bedroom units that will primarily target the local
workforce and family households. Rents are set at/below 30%, 50%, and 60% of AMI. The
multistory building will have covered parking on the lower level, common laundry and apartments
on the upper floors. The renovated building will offer community space, management office and
bicycle storage with outdoor space and a playground.
The purpose of this study is to establish supply and demand trends and ascertain the need for
housing of this nature, in this section of Albany County. The report has been prepared specifically
for the client of record, but the New York State Department of Homes & Community Renewal
(HCR) has the rights to utilize and rely on the results of the analysis.
Objectives of the Market Study:
The report is being prepared specifically for use by the client in conjunction with their review of the project. The main objectives of the study are:
To demonstrate that enough demand exists for the proposal in the market area.
Demonstrate that the proposed project will not cause any undue economic harm on the
existing rental stock in the market area.
August 24, 2020 Mr. Mike Birkby
iii Newmark Knight Frank
2410 North Forest Road
Amherst, NY 14068
www.ngkf.com
To evaluate the positioning of the subject’s rent structure within the context of the current
market conditions in the area, and evaluate rent advantage.
In regards to the scope of the analysis, the report meets the definition criteria of a Comprehensive
report as required by IRC Section 42 for allocating purposes. The NCHMA guidelines and
definition of a Comprehensive report have been complied with, and we will provide a checklist in
the addendum of the report for review and reference.
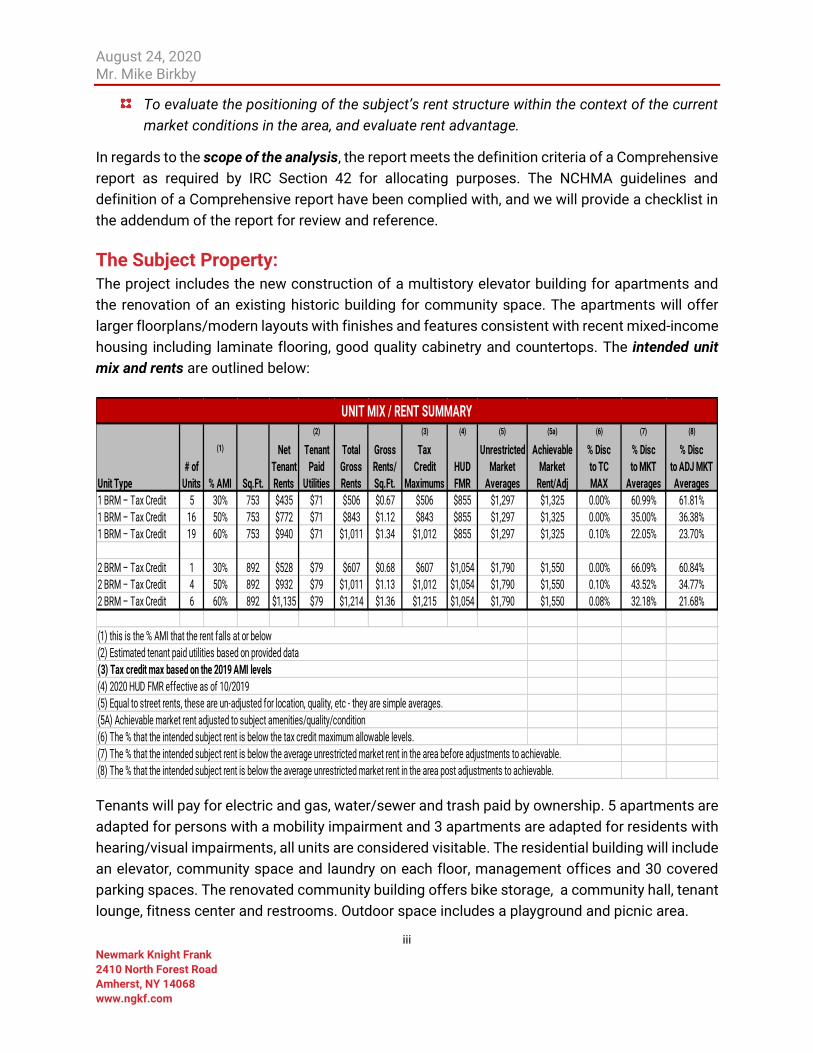
The Subject Property: The project includes the new construction of a multistory elevator building for apartments and
the renovation of an existing historic building for community space. The apartments will offer
larger floorplans/modern layouts with finishes and features consistent with recent mixed-income
housing including laminate flooring, good quality cabinetry and countertops. The intended unit
mix and rents are outlined below:
Tenants will pay for electric and gas, water/sewer and trash paid by ownership. 5 apartments are
adapted for persons with a mobility impairment and 3 apartments are adapted for residents with
hearing/visual impairments, all units are considered visitable. The residential building will include
an elevator, community space and laundry on each floor, management offices and 30 covered
parking spaces. The renovated community building offers bike storage, a community hall, tenant
lounge, fitness center and restrooms. Outdoor space includes a playground and picnic area.
(2) (3) (4) (5) (5a) (6) (7) (8)
(1) Net Tenant Total Gross Tax Unrestricted Achievable % Disc % Disc % Disc
# of Tenant Paid Gross Rents/ Credit HUD Market Market to TC to MKT to ADJ MKT
Unit Type Units % AMI Sq.Ft. Rents Utilities Rents Sq.Ft. Maximums FMR Averages Rent/Adj MAX Averages Averages
1 BRM – Tax Credit 5 30% 753 $435 $71 $506 $0.67 $506 $855 $1,297 $1,325 0.00% 60.99% 61.81%
1 BRM – Tax Credit 16 50% 753 $772 $71 $843 $1.12 $843 $855 $1,297 $1,325 0.00% 35.00% 36.38%
1 BRM – Tax Credit 19 60% 753 $940 $71 $1,011 $1.34 $1,012 $855 $1,297 $1,325 0.10% 22.05% 23.70%
2 BRM – Tax Credit 1 30% 892 $528 $79 $607 $0.68 $607 $1,054 $1,790 $1,550 0.00% 66.09% 60.84%
2 BRM – Tax Credit 4 50% 892 $932 $79 $1,011 $1.13 $1,012 $1,054 $1,790 $1,550 0.10% 43.52% 34.77%
2 BRM – Tax Credit 6 60% 892 $1,135 $79 $1,214 $1.36 $1,215 $1,054 $1,790 $1,550 0.08% 32.18% 21.68%
(7) The % that the intended subject rent is below the average unrestricted market rent in the area before adjustments to achievable.
(8) The % that the intended subject rent is below the average unrestricted market rent in the area post adjustments to achievable.
(6) The % that the intended subject rent is below the tax credit maximum allowable levels.
UNIT MIX / RENT SUMMARY
(4) 2020 HUD FMR effective as of 10/2019
(5) Equal to street rents, these are un-adjusted for location, quality, etc - they are simple averages.
(1) this is the % AMI that the rent falls at or below
(2) Estimated tenant paid utilities based on provided data
(3) Tax credit max based on the 2019 AMI levels
(5A) Achievable market rent adjusted to subject amenities/quality/condition
August 24, 2020 Mr. Mike Birkby
iv Newmark Knight Frank
2410 North Forest Road
Amherst, NY 14068
www.ngkf.com
The Location/Market & Demand Analysis: The subject is within the Park South neighborhood of the city, west of downtown, the New York
State Capitol and Empire State Plaza, directly north of Albany Med and the Stratton VA. The
immediate subject has larger land uses of Washington/Lincoln Parks, Russell Sage College, and
Empire State Plaza among smaller commercial and residential uses. Neighborhoods surrounding
Albany Med have experienced ongoing development related to the medical campus and
associated buildings, in addition to newly developed multifamily projects and renovations to
existing buildings for increased/improved residential offerings.
Property uses in the immediate subject area consist mostly of early 1900s era row house and
mixed-use walkup buildings reflecting a wide range of quality/condition with some reflecting
recent renovations and comparatively higher end apartments, others reflecting more basic
maintenance and some indicating deferred maintenance and vacancy. Affordable multifamily
options include multiple Albany Housing Authority properties including Creighton-Storey, Eagle
Court/Jared Holt, Capital Greens and Capital South. The Lincoln Homes and Steamboat Square
properties to the southeast have been offered by the AHA for mixed-income redevelopment.
The subject neighborhood is highly walkable with a walkscore of 80 indicating most errands can
be accomplished on foot. There is a bus stop at the site that provides multiple routes throughout
the city and provides direct access to the Amtrak station in Rensselaer across the river. Delaware
Avenue serves as a main north-south route in this immediate part of the city, with Madison and
Washington serving as main east-west routes into downtown and connection to I-787.
Commercial services in the immediate area relate to a new higher end grocery store, local
restaurants/retailers on Delaware, a pharmacy, national brand fast food and hotels farther south
on New Scotland. The Times Union Center and the Egg are the largest entertainment and event
venues in the city and coupled with New York State and Albany municipal offices, form a base
employment center for the region. additional employment centers are to the south related to the
hospital, the DMV, NYSOPWDD and the multiple schools/colleges. Additional employment
options are generated by the ongoing redevelopment of existing buildings for new unrestricted
market rate housing at the Kenmore, Abraxas, Columbia Street and Broadway.
The Primary Market Area (PMA) is the area from which the project will draw about 65% to 75% of
its tenant base and includes the entirety of the city given the prime location near ongoing
development and the greatest concentration of employment options in the region. While there is
ongoing development of new affordable housing farther north on Clinton and Central Aves, there
are at least four properties in the AHA portfolio offered for redevelopment and no mixed income
housing outside these newest complexes, so the analysis of the city is supported.
August 24, 2020 Mr. Mike Birkby
v Newmark Knight Frank
2410 North Forest Road
Amherst, NY 14068
www.ngkf.com
The demand methodology will eliminate all existing and pipeline developments in the city and
assess support from are 18-61 renter households only and consider seniors a secondary source
of support. The Demand Analysis uses the typical standard set by HCR which establishes the
income range for the 30%-60% AMI tax credit units with 48% at the low end up to 30% at the high
end. The weighted average capture rate is 0.83% and indicative of strong overall support.
In addition to capture however, there are other variables that are critical to recognize regarding
overall support for the development as intended. In this case, factors that are favorable include:
The support of the project location near the greatest concentration of employment options
in the region at Albany Med/Stratton VA, New York State/Albany offices and multiple
options in the downtown core. The subject neighborhood is highly walkable with a
Walkscore of 88 indicating most errands can be accomplished on foot, and there are
multiple public transportation and highway linkages in the immediate area.
Wait lists for the subject and Albany Housing Authority are extensive with over 5,600
applicants on the master waitlist for 1BR units, and over 3,900 for 2BRs. Waitlists for
Section 8 vouchers are also extensive with the estimated length of time for new vouchers
to be issued reported in terms of years.
43% of renters in the PMA earn less than $30,000, with the poverty ratio in the subject
census tract at 50%, more than double than the city at 24.5%.
The product concept of a multistory elevator building with larger floorplans, good quality
finishes and common area amenities has proven successful in the market and is
consistent with recent developments throughout the city. Recently developed options in
the city are consistent with this product concept with similar amenities so the subject will
offer consistent utility with the newest developments at affordable price points.
The rent advantage for the subject rents compared to market at around 22%-37% for the
50%/60% AMI units. New development has been ongoing in nearby/similar neighborhoods
while rents have been increasing citywide in recent years with new development and
renovation in/around downtown.
Success/support of recent development throughout the city and throughout the Capital
Region with the newest projects on/around Clinton Avenue showing good absorption
rates and tenant retention since opening in the last few years.
Covid-19 Financial and real estate markets are in a state of uncertainty associated with the novel
coronavirus/COVID-19. The outbreak of COVID-19 is a rapidly evolving situation and the effects
on real estate markets are currently unclear. As such, it is difficult to predict the effects both on
August 24, 2020 Mr. Mike Birkby
vi Newmark Knight Frank
2410 North Forest Road
Amherst, NY 14068
www.ngkf.com
a near-term and long-term basis. The results of this study are based on current data from
discussions with property management, developers, lending institutions and equity investors.
There are concerns related to unemployment, and future rent loss from existing tenants that will
be unable to pay/afford rents while they are out of work. There are restrictions on evictions (up
to 120 days), that was extended through August 2020 in New York State, and we expect that once
the country is back to normal operations, landlords and tenants will make arrangements to cover
short term rental loss. Our review of the specific market indicates the following:
• Extensive waitlists at all AHA properties and individually managed tax credit projects.
• Turnover has been limited at the older properties in the PMA.
• Rent thresholds for unrestricted properties have remained static to increased with
ongoing new development and through recent renovations of older properties.
It is important to recognize that this study represents a compilation of data gathered from various
sources, including competitive properties surveyed, local municipal records, interviews with
market participants, town officials and review of secondary demographic data. Although the
sources used are felt to be reliable, it is impossible to thoroughly verify and authenticate all data
utilized. The analysis does not guarantee the data and assumes no liability for errors of a factual
nature, analysis, or judgment provided.
Among the sources utilized and cited throughout this study are the U.S. Census of Population and
Housing, and data gathered by Nielsen/Claritas for application to the HISTA database. Further, it
must be recognized that the recommendations and conclusions provided in this market analysis
are objective opinions based on the data gathered and interpretation of current and prospective
supply and demand variables. Real estate markets are very dynamic in nature and continually
affected by demographic, economic and development changes. The research and analysis was
completed in August 2020 with a site inspection in November 2019. Utilization of this report and
the recommendations conclusions undertaken are reflective of trends at this time.
It should also be recognized that Newmark Knight Frank (NKF) is approved as a market analyst
with HCR. We have reviewed and understand their guidelines and feel that the results of this
analysis are consistent with the recommendations made in Capital Programs Manual and the
Qualified Allocation Plan. The report has been prepared for the specific use of the client for the
proposed project as identified herein. The recommendations and conclusions do not apply to any
other party or proposed development.

August 24, 2020 Mr. Mike Birkby
vii Newmark Knight Frank
2410 North Forest Road
Amherst, NY 14068
www.ngkf.com
Respectfully,
Newmark Knight Frank
David M. Carlon Joseph D. Sievert M. Scott Allen, MAI Senior Vice President Analyst Executive Vice President Analyst Review Analyst
Newmark Knight Frank
2410 North Forest Road
Amherst, NY 14068
www.ngkf.com
NCHMA MEMBER CERTIFICATION
This market study has been prepared by Newmark Knight Frank (NKF) that is a member in good
standing of the National Council of Housing Market Analysts (NCHMA). This study has been
prepared in conformance with the standards adopted by NCHMA for the market analysts’
industry. These standards include the Standard Definitions of Key Terms Used in Market Studies
for Housing Projects, and Model Content Standards for the Content of Market Studies for Housing
Projects. These Standards are designed to enhance the quality of market studies and to make
them easier to prepare, understand, and use by market analysts and by the end users. These
Standards are voluntary only, and no legal responsibility regarding their use is assumed by the
National Council of Housing Market Analysts.
Newmark Knight Frank (NKF) is duly qualified and experienced in providing market analysis for
Housing. The company’s principals participate in the National Council of Housing Market
Analysts (NCHMA) educational and information sharing programs to maintain the highest
professional standards and state-of-the-art knowledge. NKF is an independent market analyst.
No principal or employee of NKF has any financial interest whatsoever in the development for
which this analysis has been undertaken.
While the document specifies “NKF” the certification is always signed by the individual completing
the study and attesting to the certification.
(NOTE: Information on the National Council of Housing Market Analysts may be obtained by
calling 202-939-1750, or by visiting www.housingonline.com/mac/home.htm)
Name: M. Scott Allen, MAI Executive Vice President
Analyst Company: Newmark Knight Frank Date: August 24, 2020
Table of Contents
Newmark Knight Frank
2410 North Forest Road
Amherst, NY 14068
www.ngkf.com
Table of Contents
Cover Letter NCHMA Member Certification
Introduction 1 Scope of the Analysis 1 Assumptions/Conditions of NCHMA: 2
Market Study Documentation for Community Impact Revitalization Scoring 3
Summary of Findings 4 Favorable Market Characteristics 4 Potential Market Concerns 5 Summary of Project Details 6 Summary of Proposed Development 6 Net Demand/Capture 7 Penetration Rates 7 HCR Variables – Community Revitalization Section of QAP 7 Subject Rent Compared to Market 8 Most Comparable Rental Developments 8 Achievable Market Rents 9 Planned/Proposed Complexes 10 Affordable Projects 10 Achievable Tax Credit Rents 10 Maximum Income / Rent Thresholds 11 Market Draw Area 12 Surrounding Property Uses 12 Demographic Summarization 13 Demand Analysis 13 Impact On Existing Subsidized Housing 14 Project Timing / Absorption 14 Conclusions 14
Project Description 15 Quality & Condition 17 Site & Floor Plans 19
Economic Analysis 24 Area Analysis 24 Location / Services Map 39 Immediate Neighborhood 40
Market Area and Demographics 45 HISTA Data/Demographics 45 Market Area Map 46 General Demographics 47 HISTA Data/Demographics 48
Supply Analysis 55 Competitor Map – Affordable 56 Competitor Map – Market 64 Rent Summary 70 Subject Rent Compared to Market 71 Vacancy and Occupancy 71 Achievable Market Rents 71 Analysis of Adjustments: 72 Conclusion – Market Rents 73 Rent Advantage 73 Planned/Proposed Complexes 73 New Affordable Housing: 73 Affordable Projects 74 Achievable Tax Credit Rents 77 Maximum Income / Rent Thresholds 78 Project Timing / Absorption 78 Conclusions 79
Demand Analysis 80 Introduction 80 Capture Rate Summarization / Breakdown 90 Penetration Rates 90 Adapted Units 90
Conclusion 91
Addenda
A. Demand Analysis Glossary B. Additional HISTA Information C. NCHMA Market Study Terminology D. NCHMA Checklist E. Qualifications
Introduction 1
25 Delaware Albany, Albany County, NY
Introduction
Newmark Knight Frank (NKF) has completed a market study outlining supply and demand trends
related to the development of 51 mixed income affordable rental units in the city of Albany, Albany
County, New York. As planned, this will consist of a mix of one and two-bedroom units in a
multistory elevator building on a site west of the downtown core of the city of Albany.
The property will primarily target a family/workforce marketplace, and rents are set at or below
the 30%, 50% and 60% AMI levels.
Our analysis will account for the actual intended rent structure, which includes a range of unit
types and income levels.
Scope of the Analysis Generally, the context of this report will involve three separate and distinct sections including:
The first section of this analysis will provide an overview of the proposed development,
including a description of the project in question, and the demographics of the area that
will influence the facility.
The second portion involves an interpretation of current supply within the market draw
area that will be considered competitive with the proposed development.
The third portion concentrates on demand and the likely absorption for the new project.
Demographics from the Primary Housing Market Area (PMA) will be presented and
discussed in detail. The demand methodology utilized was based on an estimate of
demand from new renter-occupied household growth, but more importantly given area
demographics, based on an estimate of demand from the existing renter-occupied
households in the market areas established. The demand estimates will consider the
ability of area residents to afford the subject units.
Introduction 2
25 Delaware Albany, Albany County, NY
Assumptions/Conditions of NCHMA: No identity or interest exists between NKF and the client identified for this study. We certify that,
to the best of our knowledge and belief, the following apply:
The statements of fact contained in this report are true and correct.
The reported analysis, opinions and conclusions are limited only by the reported
Assumptions and Limiting Conditions, and reflect a personal, professional analysis,
opinions and conclusions.
We have no present or prospective interest in the property that is the subject of this report.
Our compensation is not contingent on an action or event resulting from the analysis,
opinions, or conclusions in, or use of this report.
The analysis, opinions and conclusions were developed, and this report has been prepared
in conformity with the requirements of the parties relying on the demand.
The analysis, opinions and conclusions were developed, and this report has been prepared
in conformity with the requirements of the Code of Professional Ethics and the Standards
of Professional Practice of the Appraisal Institute and the Appraisal Foundation. We have
made a personal inspection of the property in question, and the market area that is the
subject of this report.
The analysis and opinions set forth in the report are specifically generated by the
individual signing the report. The site inspection was completed by Joseph D. Sievert on
November 9, 2019. David M. Carlon and M. Scott Allen are familiar with the site and market
from previous assignments.
Newmark Knight Frank (NFK) is an active member of the National Council of Housing
Market Analysts (NCHMA). This organization is an affiliate of the National Housing &
Rehabilitation Association. The group has pioneered implementation of voluntary
standards and definitions of acceptance for market studies of affordable rental housing
developments. NKF complies with these requirements, and abides by the definitions and
certifications set forth. We have provided a list of definitions in the addendum of the
analysis, together with the Market Study Certification being used by members of this
organization. For additional information we refer the reader of this report to the National
Council’s website at www.housingonline.com.
Market Study Documentation for Community Impact Revitalization Scoring 3
25 Delaware Albany, Albany County, NY
Market Study Documentation for Community Impact Revitalization Scoring
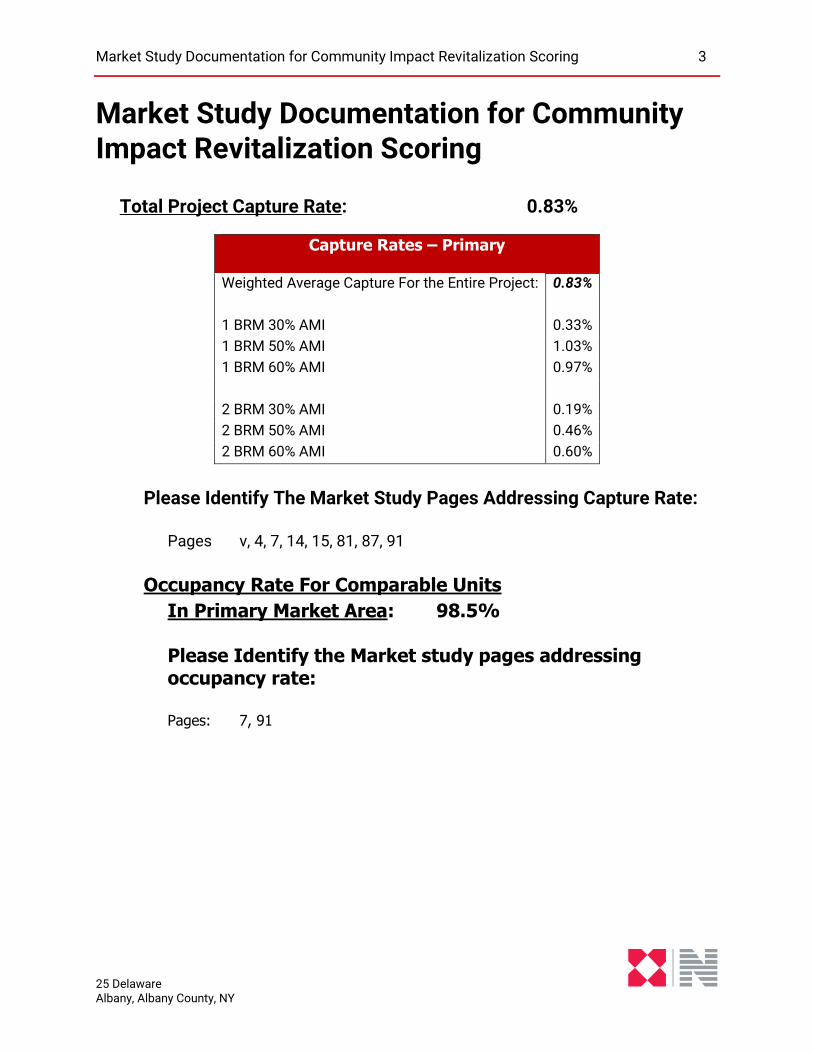
Total Project Capture Rate: 0.83%
Capture Rates – Primary
Weighted Average Capture For the Entire Project: 0.83%
1 BRM 30% AMI 0.33%
1 BRM 50% AMI 1.03%
1 BRM 60% AMI 0.97%
2 BRM 30% AMI 0.19%
2 BRM 50% AMI 0.46%
2 BRM 60% AMI 0.60%
Please Identify The Market Study Pages Addressing Capture Rate:
Pages v, 4, 7, 14, 15, 81, 87, 91
Occupancy Rate For Comparable Units
In Primary Market Area: 98.5% Please Identify the Market study pages addressing occupancy rate: Pages: 7, 91
Summary of Findings 4
25 Delaware Albany, Albany County, NY
Summary of Findings
The Summary of Findings will present a concise analysis of many of the important characteristic
related to this study. On the next couple of pages we will overview favorable market and product
characteristics, and also any potential market or project issues and concerns. Our general
conclusions pertaining to the likelihood of support include:
We are anticipating support for the development as intended, designed and economically
structured. There are many variables that relate to the potential success of an affordable
housing development but some of the key and critical variables to consider here include:
The rent and unit mix which will attract income qualified renter households not living in
affordable housing.
Rent advantage for all unit types when compared to achievable market rent.
Number of income qualified households for all units at established income bands.
Local support for the project; active site plan application and the parcels have been
approved for housing development.
An overview of some of the positive and favorable market/subject characteristics together with
a summarization of potential project/market concerns include the following:
Favorable Market Characteristics
The capture rate resulting from the demand analysis indicates strong project support with
an overall average weighted rate of 0.83% with all individual rates at/below 5%.
In conjunction with the above, the completion of the project will not have any undue
influence on the other affordable housing projects in the area, as there are extensive wait
lists for all affordable apartments in the PMA.
The support of the project location near the greatest concentration of employment options
in the region at Albany Med/Stratton VA, New York State/Albany offices and multiple
options in the downtown core. The subject neighborhood is highly walkable with a
Walkscore of 88 indicating most errands can be accomplished on foot, and there are
multiple public transportation and highway linkages in the immediate area.
Wait lists for the subject and Albany Housing Authority are extensive with over 5,600
applicants on the master waitlist for 1BR units, and over 3,900 for 2BRs. Waitlists for
Section 8 vouchers are also extensive with the estimated length of time for new vouchers
to be issued reported in terms of years.
Summary of Findings 5
25 Delaware Albany, Albany County, NY
43% of renters in the PMA earn less than $30,000, with the poverty ratio in the subject
census tract at 50%, more than double than the city at 24.5%.
The product concept of a multistory elevator building with larger floorplans, good quality
finishes and common area amenities has proven successful in the market and is
consistent with recent developments throughout the city. Recently developed options in
the city are consistent with this product concept with similar amenities so the subject will
offer consistent utility with the newest developments at affordable price points.
The rent advantage for the subject rents compared to market at around 22%-37% for the
50%/60% AMI units. New development has been ongoing in nearby/similar neighborhoods
while rents have been increasing citywide in recent years with new development and
renovation in/around downtown.
Success/support of recent development throughout the city and throughout the Capital
Region with the newest projects on/around Clinton Avenue showing good absorption
rates and tenant retention since opening in the last few years.
Potential Market Concerns
Competitive housing proposals. There is one project under development in the city, the
Swinburne building reportedly marketing for 2020 occupancy. The AHA has offered the
Lincoln Homes, Steamboat Square, North Albany and Ida Yarbrough projects for
redevelopment and may include new units in the project scope.
Other proposals include a second phase of mixed-income development on Clinton Ave
that may be built/funded in the interim and pose competition to the subject along with
multiple proposals in Troy and an under-development family project in Bethlehem.
The strength of the market, which may stimulate other developer interest related to
affordable and market rate housing. The offset here is that there are barriers of entry
including limitations on availability of land/buildings, and the density of development.
The rents are at the maximum levels for the lowest-priced units, much higher than existing
and pipeline competition. While they are achievable compared to market, there is limited
room for increases at the maximum limits.
Summary of Findings 6
25 Delaware Albany, Albany County, NY
Summary of Project Details
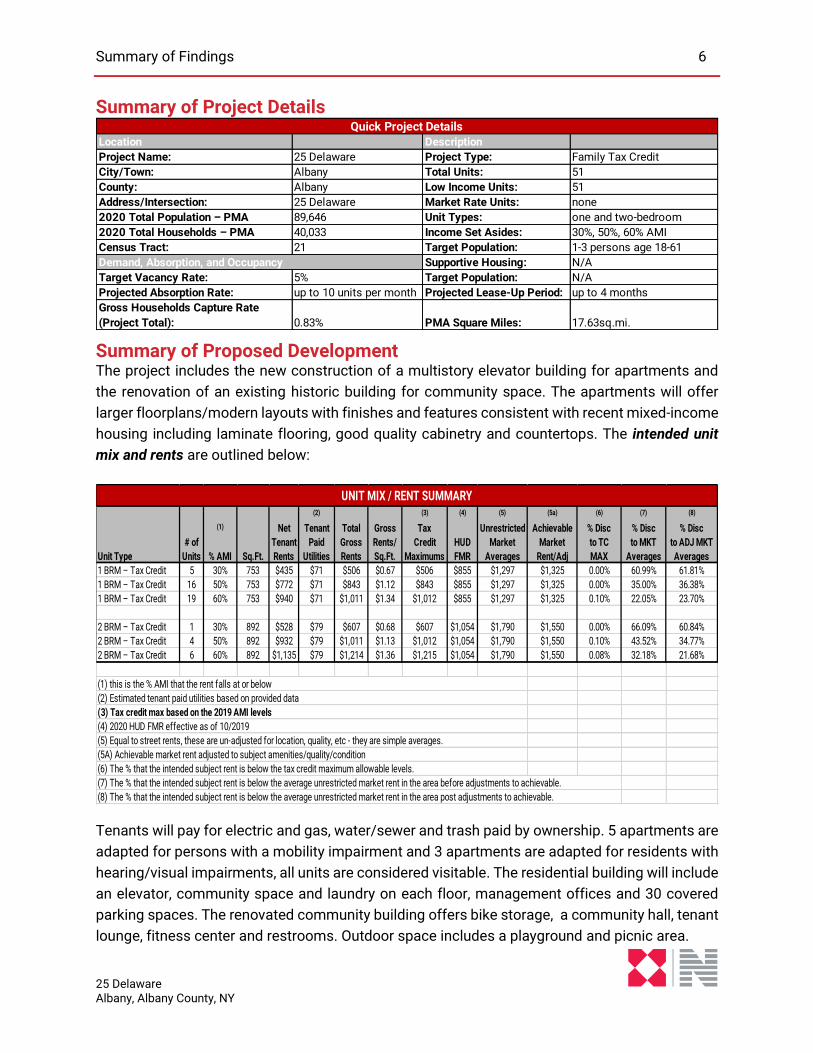
Summary of Proposed Development The project includes the new construction of a multistory elevator building for apartments and
the renovation of an existing historic building for community space. The apartments will offer
larger floorplans/modern layouts with finishes and features consistent with recent mixed-income
housing including laminate flooring, good quality cabinetry and countertops. The intended unit
mix and rents are outlined below:
Tenants will pay for electric and gas, water/sewer and trash paid by ownership. 5 apartments are
adapted for persons with a mobility impairment and 3 apartments are adapted for residents with
hearing/visual impairments, all units are considered visitable. The residential building will include
an elevator, community space and laundry on each floor, management offices and 30 covered
parking spaces. The renovated community building offers bike storage, a community hall, tenant
lounge, fitness center and restrooms. Outdoor space includes a playground and picnic area.
Location Description
Project Name: 25 Delaware Project Type: Family Tax Credit
City/Town: Albany Total Units: 51
County: Albany Low Income Units: 51
Address/Intersection: 25 Delaware Market Rate Units: none
2020 Total Population – PMA 89,646 Unit Types: one and two-bedroom
2020 Total Households – PMA 40,033 Income Set Asides: 30%, 50%, 60% AMI
Census Tract: 21 Target Population: 1-3 persons age 18-61
Demand, Absorption, and Occupancy Supportive Housing: N/A
Target Vacancy Rate: 5% Target Population: N/A
Projected Absorption Rate: up to 10 units per month Projected Lease-Up Period: up to 4 months
Gross Households Capture Rate
(Project Total): 0.83% PMA Square Miles: 17.63sq.mi.
Quick Project Details
(2) (3) (4) (5) (5a) (6) (7) (8)
(1) Net Tenant Total Gross Tax Unrestricted Achievable % Disc % Disc % Disc
# of Tenant Paid Gross Rents/ Credit HUD Market Market to TC to MKT to ADJ MKT
Unit Type Units % AMI Sq.Ft. Rents Utilities Rents Sq.Ft. Maximums FMR Averages Rent/Adj MAX Averages Averages
1 BRM – Tax Credit 5 30% 753 $435 $71 $506 $0.67 $506 $855 $1,297 $1,325 0.00% 60.99% 61.81%
1 BRM – Tax Credit 16 50% 753 $772 $71 $843 $1.12 $843 $855 $1,297 $1,325 0.00% 35.00% 36.38%
1 BRM – Tax Credit 19 60% 753 $940 $71 $1,011 $1.34 $1,012 $855 $1,297 $1,325 0.10% 22.05% 23.70%
2 BRM – Tax Credit 1 30% 892 $528 $79 $607 $0.68 $607 $1,054 $1,790 $1,550 0.00% 66.09% 60.84%
2 BRM – Tax Credit 4 50% 892 $932 $79 $1,011 $1.13 $1,012 $1,054 $1,790 $1,550 0.10% 43.52% 34.77%
2 BRM – Tax Credit 6 60% 892 $1,135 $79 $1,214 $1.36 $1,215 $1,054 $1,790 $1,550 0.08% 32.18% 21.68%
(7) The % that the intended subject rent is below the average unrestricted market rent in the area before adjustments to achievable.
(8) The % that the intended subject rent is below the average unrestricted market rent in the area post adjustments to achievable.
(6) The % that the intended subject rent is below the tax credit maximum allowable levels.
UNIT MIX / RENT SUMMARY
(4) 2020 HUD FMR effective as of 10/2019
(5) Equal to street rents, these are un-adjusted for location, quality, etc - they are simple averages.
(1) this is the % AMI that the rent falls at or below
(2) Estimated tenant paid utilities based on provided data
(3) Tax credit max based on the 2019 AMI levels
(5A) Achievable market rent adjusted to subject amenities/quality/condition
Summary of Findings 7
25 Delaware Albany, Albany County, NY
Net Demand/Capture The demand methodology will eliminate all existing and pipeline developments in the city and
assess support from are 18-61 renter households only and consider seniors a secondary source
of support. The Demand Analysis uses the standard set by HCR which establishes the income
range for the 30%-60% AMI tax credit units with 48% of income at the low end up to 30% at the
high end. The weighted average capture rate is 0.83% and indicative of strong overall support.
Penetration Rates We also analyzed penetration rates which differ from capture in that they account for all units in
the marketplace and demonstrates the capacity of the market to withstand new units. We have
evaluated penetration rates for the different unit types with the following calculations appropriate.
One-bedroom Units: 1,282 units / 8,023 income qualified households = 15.98%
Two-bedroom Units: 1,129 units / 4,581 income qualified households = 24.65%
This penetration rate analysis applies to all deep subsidy units and basically extends income
qualification from zero to the maximum allowable thresholds for the 60% AMI units. It does not
account for individual analysis of tax credit specific income qualification levels.
HCR Variables – Community Revitalization Section of QAP
Vacancy and Occupancy
Our survey indicates a stable market as follows:
Average Market Rate Occupancy: 96% Average Occupancy Affordable Units: 100% Average Occupancy for the Marketplace: 98%
Review of area developments indicates that all competing projects in Albany are currently
operating at or above 90% occupancy levels for stabilized properties with waitlists at all
affordable housing and absorption rates exceeding 10 units per month.
Unmet Demand:
The number of income qualified households per unit type and AMI level is shown below:
One-bedroom Units: 1,530 for 30% units, 1,547 for 50% units, 1,961 for 60% units.
Two-bedroom Units: 525 for 30% units, 872 for 50% units, 997 for 60%
units.
This demonstrates that even after deducting completing affordable units that there are many low-
to-moderate income family households in the PMA not residing in affordable housing, that may
reflect dated physical characteristics and/or a rent overburdened situation.
Summary of Findings 8
25 Delaware Albany, Albany County, NY
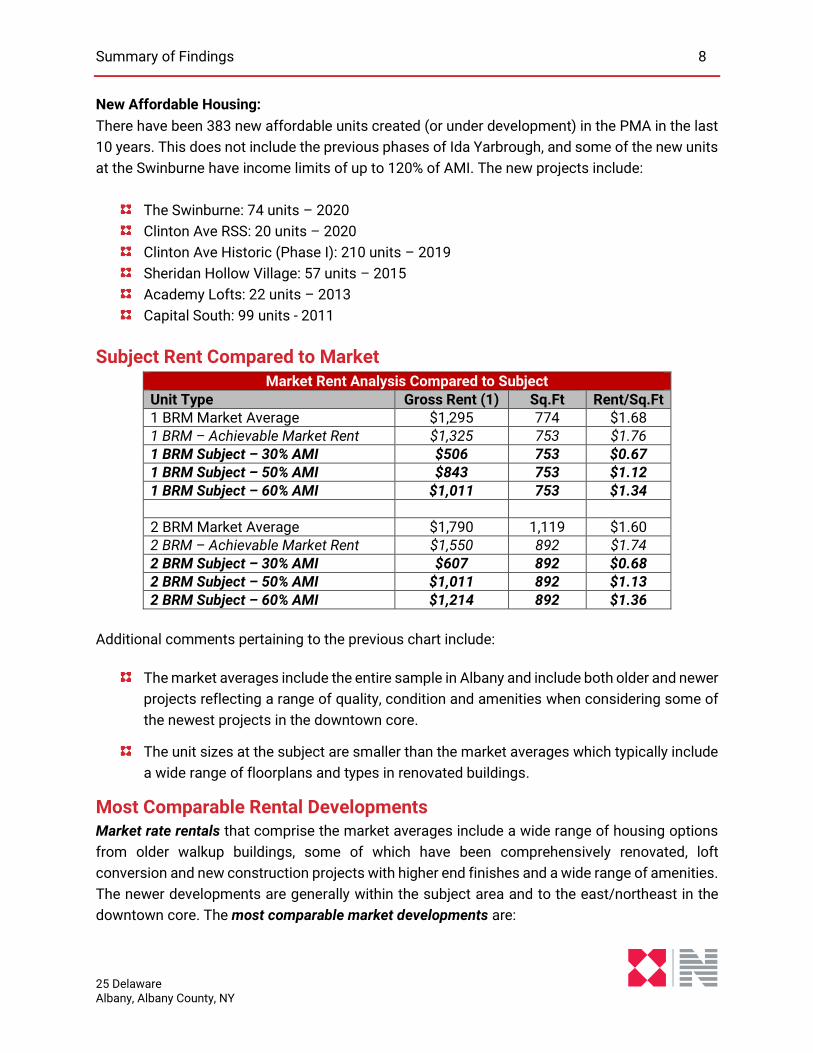
New Affordable Housing:
There have been 383 new affordable units created (or under development) in the PMA in the last
10 years. This does not include the previous phases of Ida Yarbrough, and some of the new units
at the Swinburne have income limits of up to 120% of AMI. The new projects include:
The Swinburne: 74 units – 2020
Clinton Ave RSS: 20 units – 2020
Clinton Ave Historic (Phase I): 210 units – 2019
Sheridan Hollow Village: 57 units – 2015
Academy Lofts: 22 units – 2013
Capital South: 99 units - 2011
Subject Rent Compared to Market Market Rent Analysis Compared to Subject
Unit Type Gross Rent (1) Sq.Ft Rent/Sq.Ft 1 BRM Market Average $1,295 774 $1.68 1 BRM – Achievable Market Rent $1,325 753 $1.76 1 BRM Subject – 30% AMI $506 753 $0.67 1 BRM Subject – 50% AMI $843 753 $1.12
1 BRM Subject – 60% AMI $1,011 753 $1.34 2 BRM Market Average $1,790 1,119 $1.60 2 BRM – Achievable Market Rent $1,550 892 $1.74 2 BRM Subject – 30% AMI $607 892 $0.68 2 BRM Subject – 50% AMI $1,011 892 $1.13 2 BRM Subject – 60% AMI $1,214 892 $1.36
Additional comments pertaining to the previous chart include:
The market averages include the entire sample in Albany and include both older and newer
projects reflecting a range of quality, condition and amenities when considering some of
the newest projects in the downtown core.
The unit sizes at the subject are smaller than the market averages which typically include
a wide range of floorplans and types in renovated buildings.
Most Comparable Rental Developments Market rate rentals that comprise the market averages include a wide range of housing options
from older walkup buildings, some of which have been comprehensively renovated, loft
conversion and new construction projects with higher end finishes and a wide range of amenities.
The newer developments are generally within the subject area and to the east/northeast in the
downtown core. The most comparable market developments are:
Summary of Findings 9
25 Delaware Albany, Albany County, NY
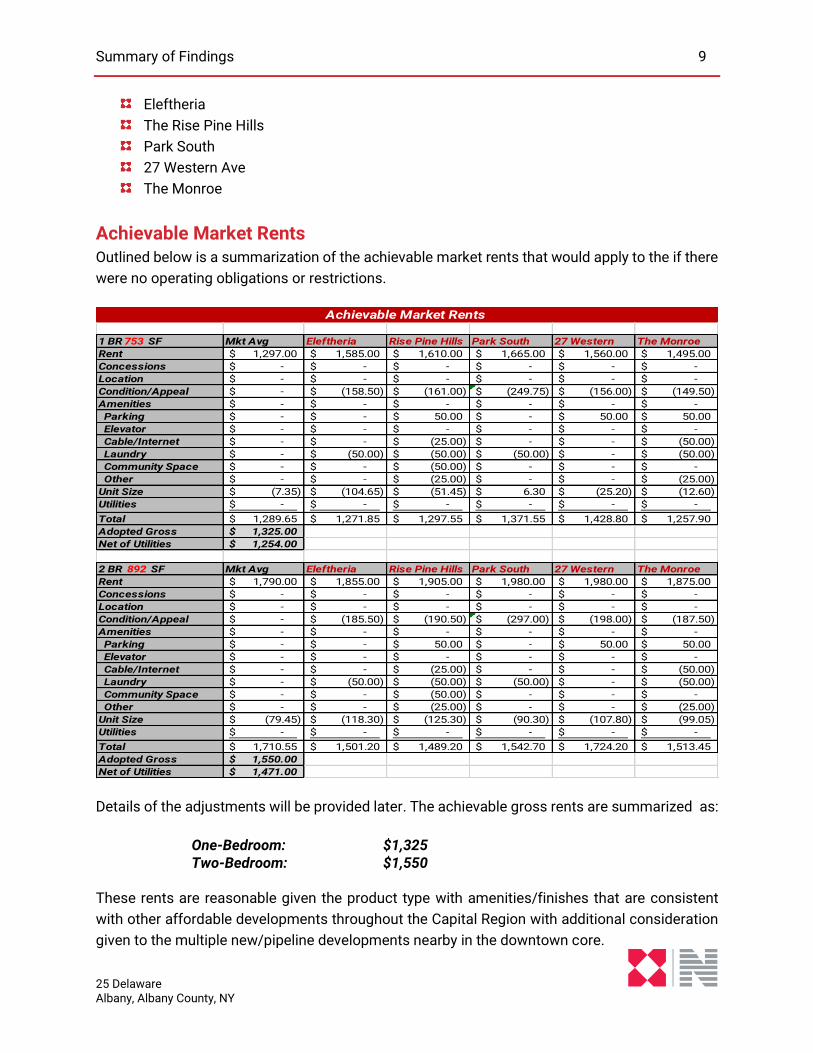
Eleftheria
The Rise Pine Hills
Park South
27 Western Ave
The Monroe
Achievable Market Rents Outlined below is a summarization of the achievable market rents that would apply to the if there
were no operating obligations or restrictions.
Details of the adjustments will be provided later. The achievable gross rents are summarized as:
One-Bedroom: $1,325 Two-Bedroom: $1,550
These rents are reasonable given the product type with amenities/finishes that are consistent
with other affordable developments throughout the Capital Region with additional consideration
given to the multiple new/pipeline developments nearby in the downtown core.
1 BR 753 SF Mkt Avg Eleftheria Rise Pine Hills Park South 27 Western The Monroe
Rent 1,297.00$ 1,585.00$ 1,610.00$ 1,665.00$ 1,560.00$ 1,495.00$
Concessions -$ -$ -$ -$ -$ -$
Location -$ -$ -$ -$ -$ -$
Condition/Appeal -$ (158.50)$ (161.00)$ (249.75)$ (156.00)$ (149.50)$
Amenities -$ -$ -$ -$ -$ -$
Parking -$ -$ 50.00$ -$ 50.00$ 50.00$
Elevator -$ -$ -$ -$ -$ -$
Cable/Internet -$ -$ (25.00)$ -$ -$ (50.00)$
Laundry -$ (50.00)$ (50.00)$ (50.00)$ -$ (50.00)$
Community Space -$ -$ (50.00)$ -$ -$ -$
Other -$ -$ (25.00)$ -$ -$ (25.00)$
Unit Size (7.35)$ (104.65)$ (51.45)$ 6.30$ (25.20)$ (12.60)$
Utilities -$ -$ -$ -$ -$ -$
Total 1,289.65$ 1,271.85$ 1,297.55$ 1,371.55$ 1,428.80$ 1,257.90$
Adopted Gross 1,325.00$
Net of Utilities 1,254.00$
2 BR 892 SF Mkt Avg Eleftheria Rise Pine Hills Park South 27 Western The Monroe
Rent 1,790.00$ 1,855.00$ 1,905.00$ 1,980.00$ 1,980.00$ 1,875.00$
Concessions -$ -$ -$ -$ -$ -$
Location -$ -$ -$ -$ -$ -$
Condition/Appeal -$ (185.50)$ (190.50)$ (297.00)$ (198.00)$ (187.50)$
Amenities -$ -$ -$ -$ -$ -$
Parking -$ -$ 50.00$ -$ 50.00$ 50.00$
Elevator -$ -$ -$ -$ -$ -$
Cable/Internet -$ -$ (25.00)$ -$ -$ (50.00)$
Laundry -$ (50.00)$ (50.00)$ (50.00)$ -$ (50.00)$
Community Space -$ -$ (50.00)$ -$ -$ -$
Other -$ -$ (25.00)$ -$ -$ (25.00)$
Unit Size (79.45)$ (118.30)$ (125.30)$ (90.30)$ (107.80)$ (99.05)$
Utilities -$ -$ -$ -$ -$ -$
Total 1,710.55$ 1,501.20$ 1,489.20$ 1,542.70$ 1,724.20$ 1,513.45$
Adopted Gross 1,550.00$
Net of Utilities 1,471.00$
Achievable Market Rents
Summary of Findings 10
25 Delaware Albany, Albany County, NY
Planned/Proposed Complexes When considering affordable and mixed income family housing that would pose competition for
the subject, there is one project under development; the Swinburne Building farther to the
northwest on Central Ave with 73 mixed-income units reportedly marketing for 2020 occupancy.
Other proposals for mixed-income housing include a renovated building north of downtown on
Broadway with over 120 units, and proposals for redevelopment at the Steamboat Square, Ida
Yarbrough, Albany North and Lincoln Homes properties operated by the Housing Authority that
would include multiple unit types and income tiers if funded. Unrestricted market rate projects
are mostly within the downtown core to the east and include 154 units at 90 State Street, two
projects with over 200 total units on Broadway, the Kenmore with 63 units 46 units at 349
Columbia Street and other new construction buildings on the western end of the city on Fuller
Road and others into Guilderland farther west.
Affordable Projects Affordable complexes in Albany reflect a range of age, quality/condition and relate to deep
subsidy and tax credit developments in high rise and scattered-site multifamily buildings, with
some building conversion projects added to the market in recent years. The most comparable
affordable projects include:
Sheridan Hollow
Swinburne
Ida Yarbrough
Clinton Ave Historic Apartments
Capital South II & III
Knox Street
Historic Pastures/Mansions
Achievable Tax Credit Rents It must be remembered that there are requirements related to the funding used at the time of
development that requires that certain rent thresholds be maintained and in many cases the rents
are set based on the following:
Competitive nature of the funding process in New York State. Preference is given to those
projects that can provide low rent levels in comparison to market and objectives of the
development group to provide affordable housing to the local population.
Competition and review of the competitive set that also considers recent development
trends, AMI levels and changes to AMI.
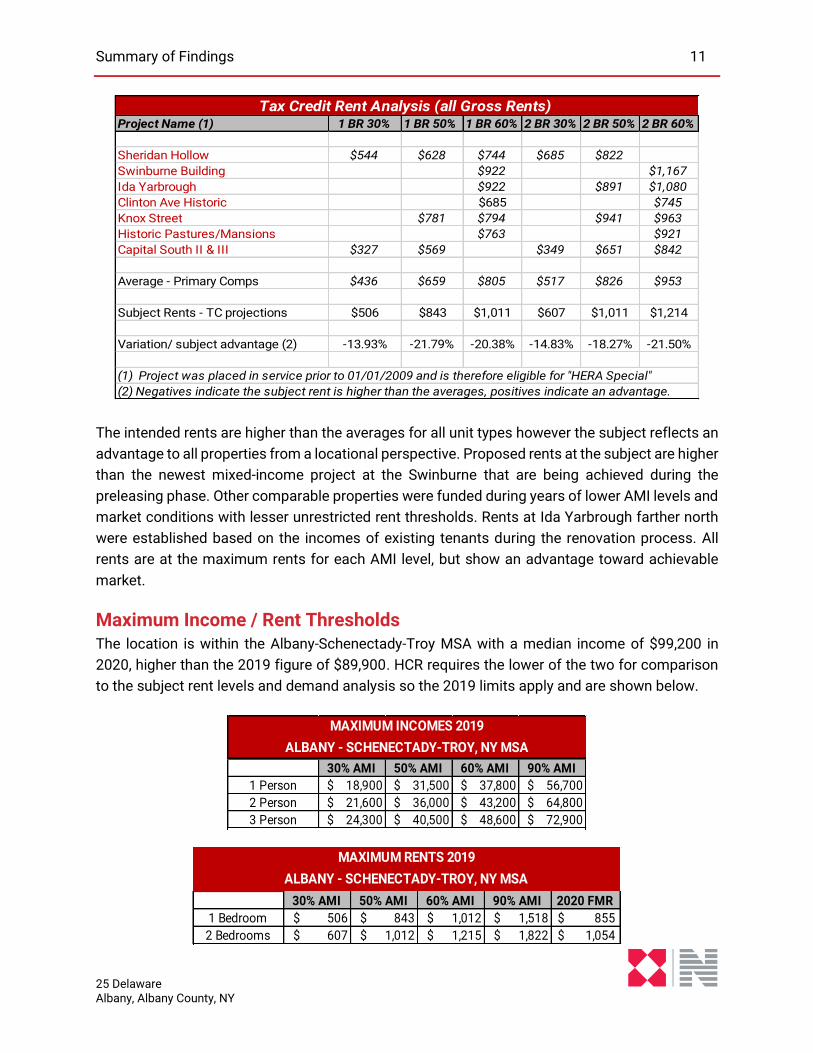
A summary of the tax credit rents in the area are below:
Summary of Findings 11
25 Delaware Albany, Albany County, NY
The intended rents are higher than the averages for all unit types however the subject reflects an
advantage to all properties from a locational perspective. Proposed rents at the subject are higher
than the newest mixed-income project at the Swinburne that are being achieved during the
preleasing phase. Other comparable properties were funded during years of lower AMI levels and
market conditions with lesser unrestricted rent thresholds. Rents at Ida Yarbrough farther north
were established based on the incomes of existing tenants during the renovation process. All
rents are at the maximum rents for each AMI level, but show an advantage toward achievable
market.
Maximum Income / Rent Thresholds The location is within the Albany-Schenectady-Troy MSA with a median income of $99,200 in
2020, higher than the 2019 figure of $89,900. HCR requires the lower of the two for comparison
to the subject rent levels and demand analysis so the 2019 limits apply and are shown below.
Project Name (1) 1 BR 30% 1 BR 50% 1 BR 60% 2 BR 30% 2 BR 50% 2 BR 60%
Sheridan Hollow $544 $628 $744 $685 $822
Swinburne Building $922 $1,167
Ida Yarbrough $922 $891 $1,080
Clinton Ave Historic $685 $745
Knox Street $781 $794 $941 $963
Historic Pastures/Mansions $763 $921
Capital South II & III $327 $569 $349 $651 $842
Average - Primary Comps $436 $659 $805 $517 $826 $953
Subject Rents - TC projections $506 $843 $1,011 $607 $1,011 $1,214
Variation/ subject advantage (2) -13.93% -21.79% -20.38% -14.83% -18.27% -21.50%
(1) Project was placed in service prior to 01/01/2009 and is therefore eligible for "HERA Special"
(2) Negatives indicate the subject rent is higher than the averages, positives indicate an advantage.
Tax Credit Rent Analysis (all Gross Rents)
30% AMI 50% AMI 60% AMI 90% AMI
1 Person $ 18,900 $ 31,500 $ 37,800 $ 56,700
2 Person $ 21,600 $ 36,000 $ 43,200 $ 64,800
3 Person $ 24,300 $ 40,500 $ 48,600 $ 72,900
ALBANY - SCHENECTADY-TROY, NY MSA
MAXIMUM INCOMES 2019
30% AMI 50% AMI 60% AMI 90% AMI 2020 FMR
1 Bedroom $ 506 $ 843 $ 1,012 $ 1,518 $ 855
2 Bedrooms $ 607 $ 1,012 $ 1,215 $ 1,822 $ 1,054
ALBANY - SCHENECTADY-TROY, NY MSA
MAXIMUM RENTS 2019
Summary of Findings 12
25 Delaware Albany, Albany County, NY
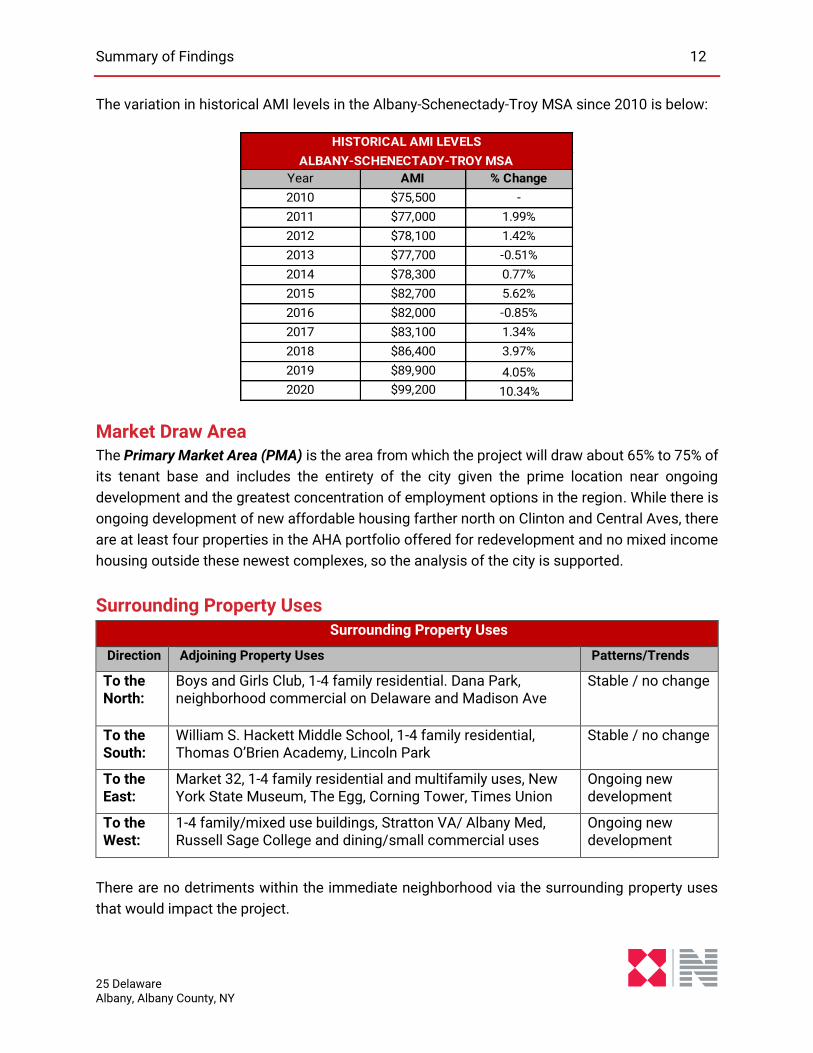
The variation in historical AMI levels in the Albany-Schenectady-Troy MSA since 2010 is below:
Market Draw Area The Primary Market Area (PMA) is the area from which the project will draw about 65% to 75% of
its tenant base and includes the entirety of the city given the prime location near ongoing
development and the greatest concentration of employment options in the region. While there is
ongoing development of new affordable housing farther north on Clinton and Central Aves, there
are at least four properties in the AHA portfolio offered for redevelopment and no mixed income
housing outside these newest complexes, so the analysis of the city is supported.
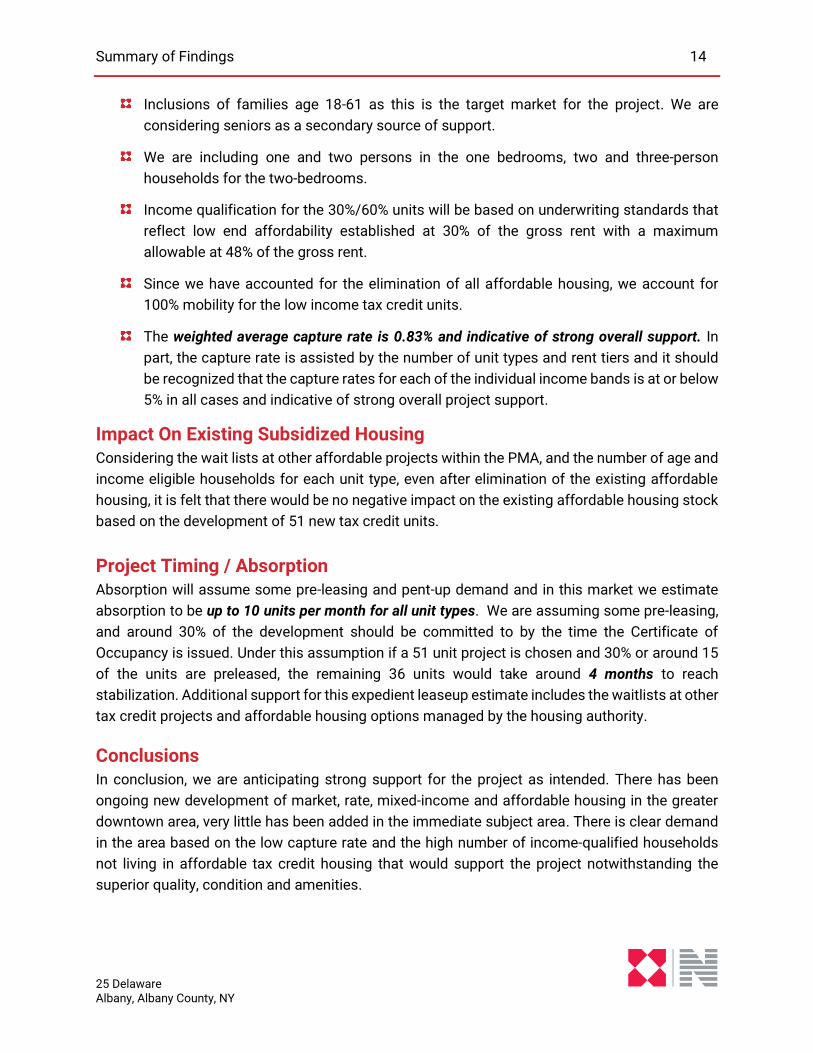
Surrounding Property Uses Surrounding Property Uses
Direction Adjoining Property Uses Patterns/Trends
To the North:
Boys and Girls Club, 1-4 family residential. Dana Park, neighborhood commercial on Delaware and Madison Ave
Stable / no change
To the South:
William S. Hackett Middle School, 1-4 family residential, Thomas O’Brien Academy, Lincoln Park
Stable / no change
To the East:
Market 32, 1-4 family residential and multifamily uses, New York State Museum, The Egg, Corning Tower, Times Union
Ongoing new development
To the West:
1-4 family/mixed use buildings, Stratton VA/ Albany Med, Russell Sage College and dining/small commercial uses
Ongoing new development
There are no detriments within the immediate neighborhood via the surrounding property uses
that would impact the project.
Year AMI % Change
2010 $75,500 -
2011 $77,000 1.99%
2012 $78,100 1.42%
2013 $77,700 -0.51%
2014 $78,300 0.77%
2015 $82,700 5.62%
2016 $82,000 -0.85%
2017 $83,100 1.34%
2018 $86,400 3.97%
2019 $89,900 4.05%
2020 $99,200 10.34%
HISTORICAL AMI LEVELS
ALBANY-SCHENECTADY-TROY MSA
Summary of Findings 13
25 Delaware Albany, Albany County, NY
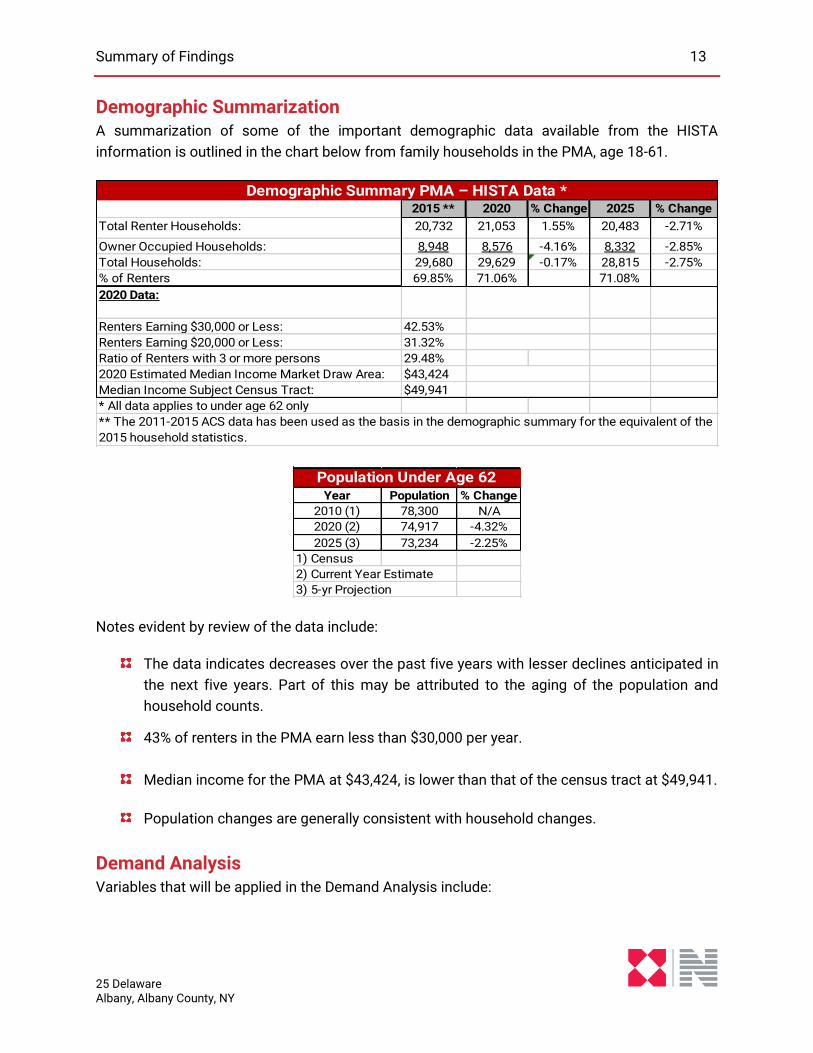
Demographic Summarization A summarization of some of the important demographic data available from the HISTA
information is outlined in the chart below from family households in the PMA, age 18-61.
Notes evident by review of the data include:
The data indicates decreases over the past five years with lesser declines anticipated in
the next five years. Part of this may be attributed to the aging of the population and
household counts.
43% of renters in the PMA earn less than $30,000 per year.
Median income for the PMA at $43,424, is lower than that of the census tract at $49,941.
Population changes are generally consistent with household changes.
Demand Analysis Variables that will be applied in the Demand Analysis include:
2015 ** 2020 % Change 2025 % Change
Total Renter Households: 20,732 21,053 1.55% 20,483 -2.71%
Owner Occupied Households: 8,948 8,576 -4.16% 8,332 -2.85%
Total Households: 29,680 29,629 -0.17% 28,815 -2.75%
% of Renters 69.85% 71.06% 71.08%
Renters Earning $30,000 or Less: 42.53%
Renters Earning $20,000 or Less: 31.32%
Ratio of Renters with 3 or more persons 29.48%
2020 Estimated Median Income Market Draw Area: $43,424
Median Income Subject Census Tract: $49,941
* All data applies to under age 62 only
** The 2011-2015 ACS data has been used as the basis in the demographic summary for the equivalent of the
2015 household statistics.
Demographic Summary PMA – HISTA Data *
2020 Data:
Year Population % Change
2010 (1) 78,300 N/A
2020 (2) 74,917 -4.32%
2025 (3) 73,234 -2.25%
1) Census
2) Current Year Estimate
3) 5-yr Projection
Population Under Age 62
Summary of Findings 14
25 Delaware Albany, Albany County, NY
Inclusions of families age 18-61 as this is the target market for the project. We are
considering seniors as a secondary source of support.
We are including one and two persons in the one bedrooms, two and three-person
households for the two-bedrooms.
Income qualification for the 30%/60% units will be based on underwriting standards that
reflect low end affordability established at 30% of the gross rent with a maximum
allowable at 48% of the gross rent.
Since we have accounted for the elimination of all affordable housing, we account for
100% mobility for the low income tax credit units.
The weighted average capture rate is 0.83% and indicative of strong overall support. In
part, the capture rate is assisted by the number of unit types and rent tiers and it should
be recognized that the capture rates for each of the individual income bands is at or below
5% in all cases and indicative of strong overall project support.
Impact On Existing Subsidized Housing Considering the wait lists at other affordable projects within the PMA, and the number of age and
income eligible households for each unit type, even after elimination of the existing affordable
housing, it is felt that there would be no negative impact on the existing affordable housing stock
based on the development of 51 new tax credit units.
Project Timing / Absorption Absorption will assume some pre-leasing and pent-up demand and in this market we estimate
absorption to be up to 10 units per month for all unit types. We are assuming some pre-leasing,
and around 30% of the development should be committed to by the time the Certificate of
Occupancy is issued. Under this assumption if a 51 unit project is chosen and 30% or around 15
of the units are preleased, the remaining 36 units would take around 4 months to reach
stabilization. Additional support for this expedient leaseup estimate includes the waitlists at other
tax credit projects and affordable housing options managed by the housing authority.
Conclusions In conclusion, we are anticipating strong support for the project as intended. There has been
ongoing new development of market, rate, mixed-income and affordable housing in the greater
downtown area, very little has been added in the immediate subject area. There is clear demand
in the area based on the low capture rate and the high number of income-qualified households
not living in affordable tax credit housing that would support the project notwithstanding the
superior quality, condition and amenities.
Project Description 15
25 Delaware Albany, Albany County, NY
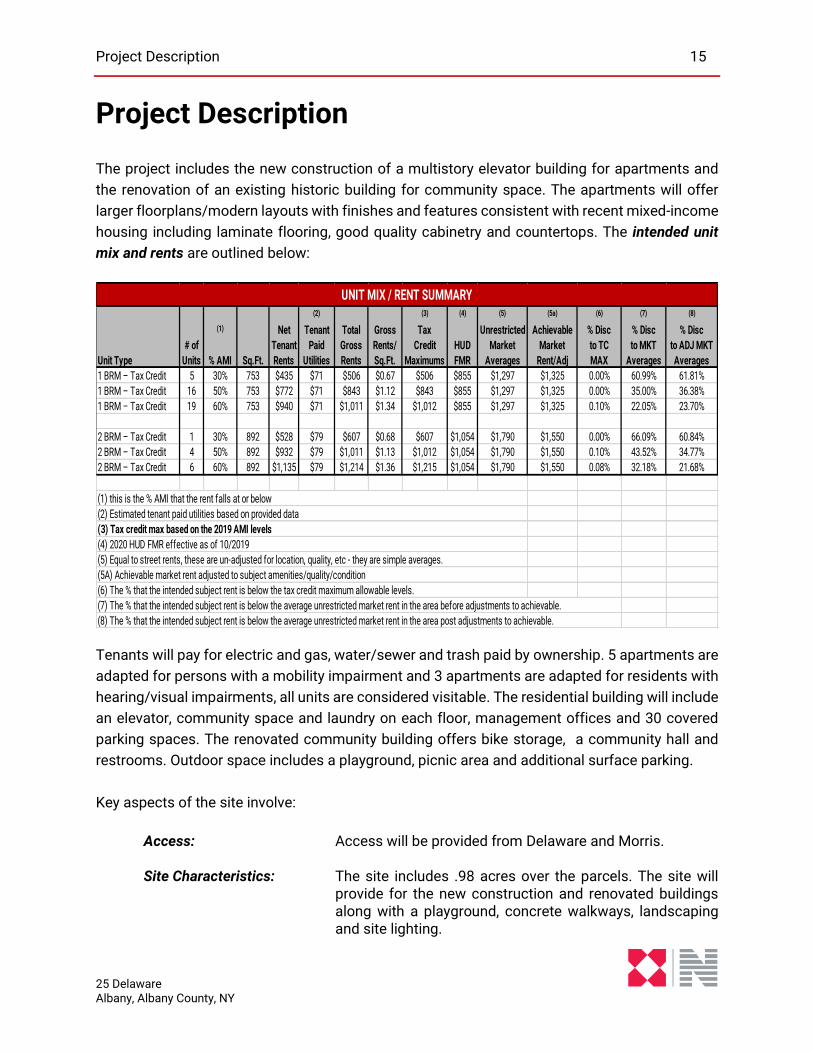
Project Description
The project includes the new construction of a multistory elevator building for apartments and
the renovation of an existing historic building for community space. The apartments will offer
larger floorplans/modern layouts with finishes and features consistent with recent mixed-income
housing including laminate flooring, good quality cabinetry and countertops. The intended unit
mix and rents are outlined below:
Tenants will pay for electric and gas, water/sewer and trash paid by ownership. 5 apartments are
adapted for persons with a mobility impairment and 3 apartments are adapted for residents with
hearing/visual impairments, all units are considered visitable. The residential building will include
an elevator, community space and laundry on each floor, management offices and 30 covered
parking spaces. The renovated community building offers bike storage, a community hall and
restrooms. Outdoor space includes a playground, picnic area and additional surface parking.
Key aspects of the site involve:
Access: Access will be provided from Delaware and Morris.
Site Characteristics: The site includes .98 acres over the parcels. The site will
provide for the new construction and renovated buildings along with a playground, concrete walkways, landscaping and site lighting.
(2) (3) (4) (5) (5a) (6) (7) (8)
(1) Net Tenant Total Gross Tax Unrestricted Achievable % Disc % Disc % Disc
# of Tenant Paid Gross Rents/ Credit HUD Market Market to TC to MKT to ADJ MKT
Unit Type Units % AMI Sq.Ft. Rents Utilities Rents Sq.Ft. Maximums FMR Averages Rent/Adj MAX Averages Averages
1 BRM – Tax Credit 5 30% 753 $435 $71 $506 $0.67 $506 $855 $1,297 $1,325 0.00% 60.99% 61.81%
1 BRM – Tax Credit 16 50% 753 $772 $71 $843 $1.12 $843 $855 $1,297 $1,325 0.00% 35.00% 36.38%
1 BRM – Tax Credit 19 60% 753 $940 $71 $1,011 $1.34 $1,012 $855 $1,297 $1,325 0.10% 22.05% 23.70%
2 BRM – Tax Credit 1 30% 892 $528 $79 $607 $0.68 $607 $1,054 $1,790 $1,550 0.00% 66.09% 60.84%
2 BRM – Tax Credit 4 50% 892 $932 $79 $1,011 $1.13 $1,012 $1,054 $1,790 $1,550 0.10% 43.52% 34.77%
2 BRM – Tax Credit 6 60% 892 $1,135 $79 $1,214 $1.36 $1,215 $1,054 $1,790 $1,550 0.08% 32.18% 21.68%
(7) The % that the intended subject rent is below the average unrestricted market rent in the area before adjustments to achievable.
(8) The % that the intended subject rent is below the average unrestricted market rent in the area post adjustments to achievable.
(6) The % that the intended subject rent is below the tax credit maximum allowable levels.
UNIT MIX / RENT SUMMARY
(4) 2020 HUD FMR effective as of 10/2019
(5) Equal to street rents, these are un-adjusted for location, quality, etc - they are simple averages.
(1) this is the % AMI that the rent falls at or below
(2) Estimated tenant paid utilities based on provided data
(3) Tax credit max based on the 2019 AMI levels
(5A) Achievable market rent adjusted to subject amenities/quality/condition
Project Description 16
25 Delaware Albany, Albany County, NY
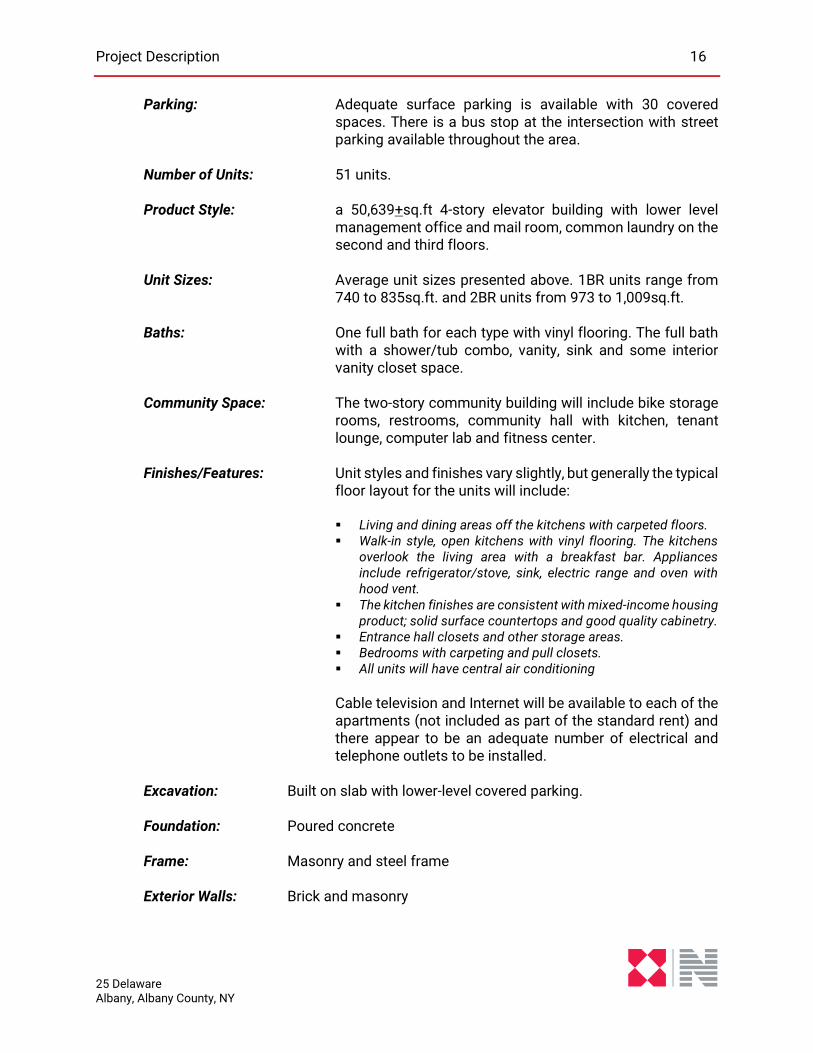
Parking: Adequate surface parking is available with 30 covered spaces. There is a bus stop at the intersection with street parking available throughout the area.
Number of Units: 51 units. Product Style: a 50,639+sq.ft 4-story elevator building with lower level
management office and mail room, common laundry on the second and third floors.
Unit Sizes: Average unit sizes presented above. 1BR units range from 740 to 835sq.ft. and 2BR units from 973 to 1,009sq.ft.
Baths: One full bath for each type with vinyl flooring. The full bath
with a shower/tub combo, vanity, sink and some interior vanity closet space.
Community Space: The two-story community building will include bike storage
rooms, restrooms, community hall with kitchen, tenant lounge, computer lab and fitness center.
Finishes/Features: Unit styles and finishes vary slightly, but generally the typical
floor layout for the units will include:
▪ Living and dining areas off the kitchens with carpeted floors. ▪ Walk-in style, open kitchens with vinyl flooring. The kitchens
overlook the living area with a breakfast bar. Appliances include refrigerator/stove, sink, electric range and oven with hood vent.
▪ The kitchen finishes are consistent with mixed-income housing product; solid surface countertops and good quality cabinetry.
▪ Entrance hall closets and other storage areas. ▪ Bedrooms with carpeting and pull closets. ▪ All units will have central air conditioning
Cable television and Internet will be available to each of the apartments (not included as part of the standard rent) and there appear to be an adequate number of electrical and telephone outlets to be installed.
Excavation: Built on slab with lower-level covered parking. Foundation: Poured concrete Frame: Masonry and steel frame Exterior Walls: Brick and masonry
Project Description 17
25 Delaware Albany, Albany County, NY
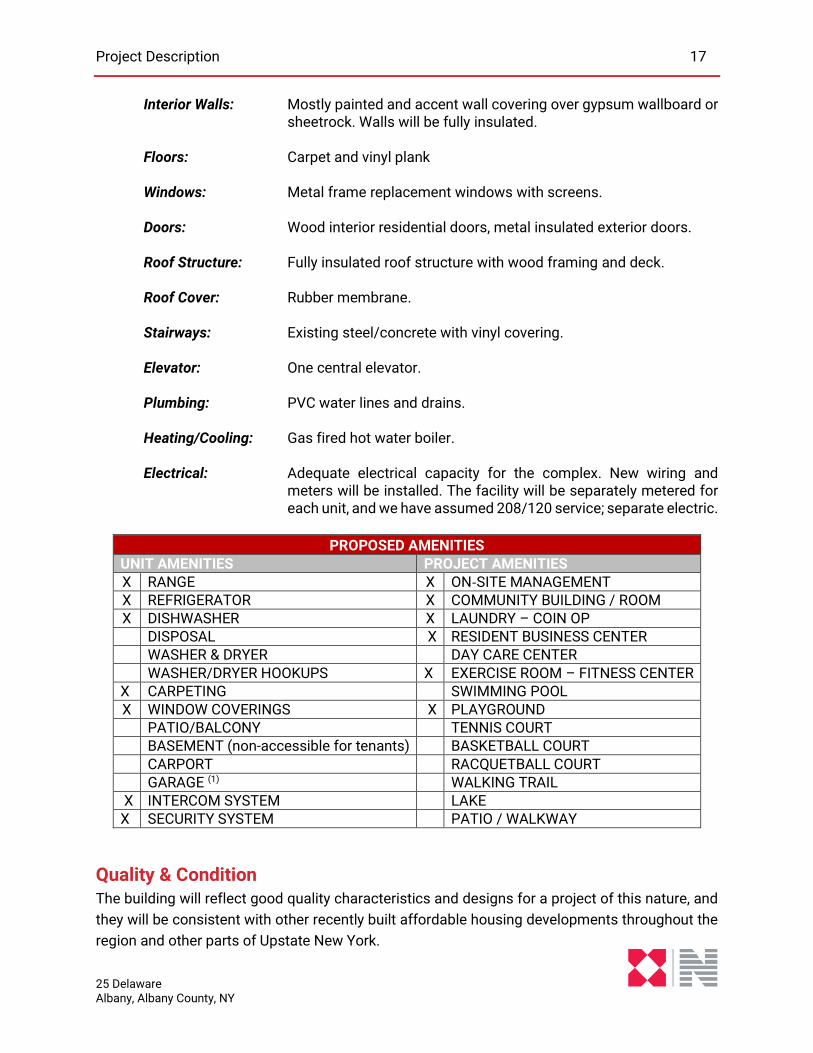
Interior Walls: Mostly painted and accent wall covering over gypsum wallboard or sheetrock. Walls will be fully insulated.
Floors: Carpet and vinyl plank Windows: Metal frame replacement windows with screens. Doors: Wood interior residential doors, metal insulated exterior doors. Roof Structure: Fully insulated roof structure with wood framing and deck. Roof Cover: Rubber membrane. Stairways: Existing steel/concrete with vinyl covering. Elevator: One central elevator. Plumbing: PVC water lines and drains. Heating/Cooling: Gas fired hot water boiler. Electrical: Adequate electrical capacity for the complex. New wiring and
meters will be installed. The facility will be separately metered for each unit, and we have assumed 208/120 service; separate electric.
PROPOSED AMENITIES
UNIT AMENITIES PROJECT AMENITIES X RANGE X ON‐SITE MANAGEMENT X REFRIGERATOR X COMMUNITY BUILDING / ROOM X DISHWASHER X LAUNDRY – COIN OP
DISPOSAL X RESIDENT BUSINESS CENTER
WASHER & DRYER DAY CARE CENTER
WASHER/DRYER HOOKUPS X EXERCISE ROOM – FITNESS CENTER X CARPETING SWIMMING POOL X WINDOW COVERINGS X PLAYGROUND
PATIO/BALCONY TENNIS COURT
BASEMENT (non-accessible for tenants) BASKETBALL COURT
CARPORT RACQUETBALL COURT
GARAGE (1) WALKING TRAIL X INTERCOM SYSTEM LAKE X SECURITY SYSTEM PATIO / WALKWAY
Quality & Condition The building will reflect good quality characteristics and designs for a project of this nature, and
they will be consistent with other recently built affordable housing developments throughout the
region and other parts of Upstate New York.
Project Description 18
25 Delaware Albany, Albany County, NY
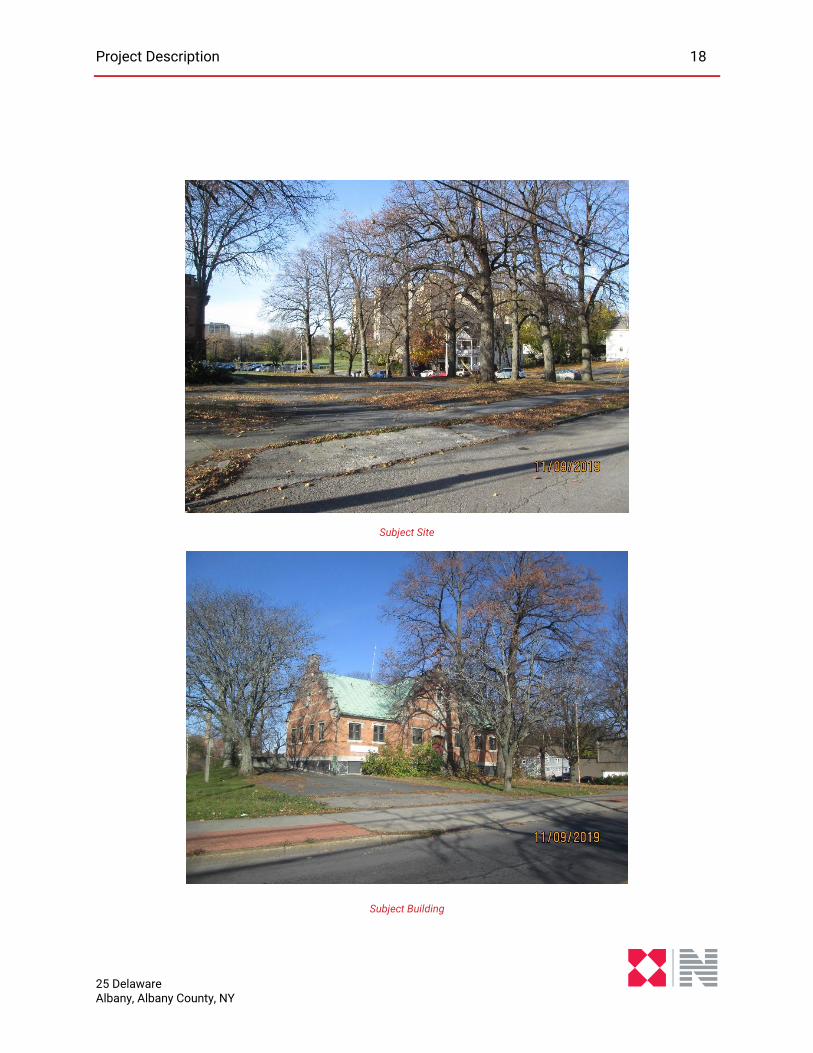
Subject Site
Subject Building
Project Description 19
25 Delaware Albany, Albany County, NY
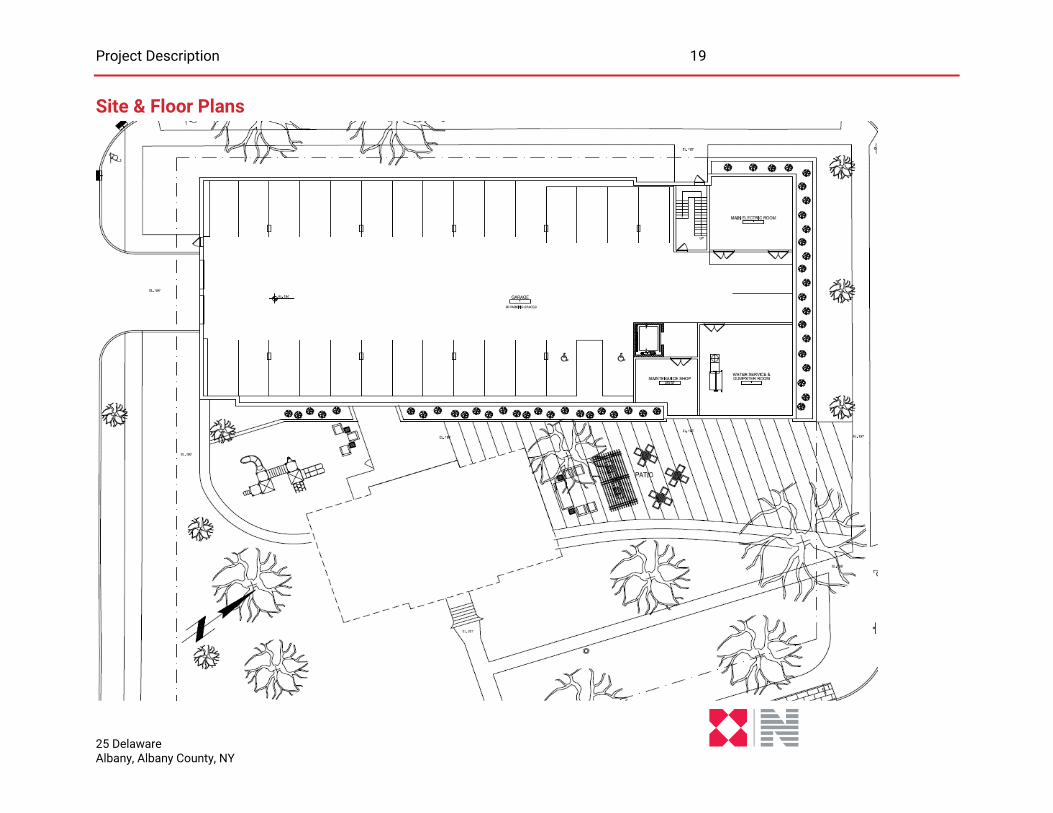
Site & Floor Plans
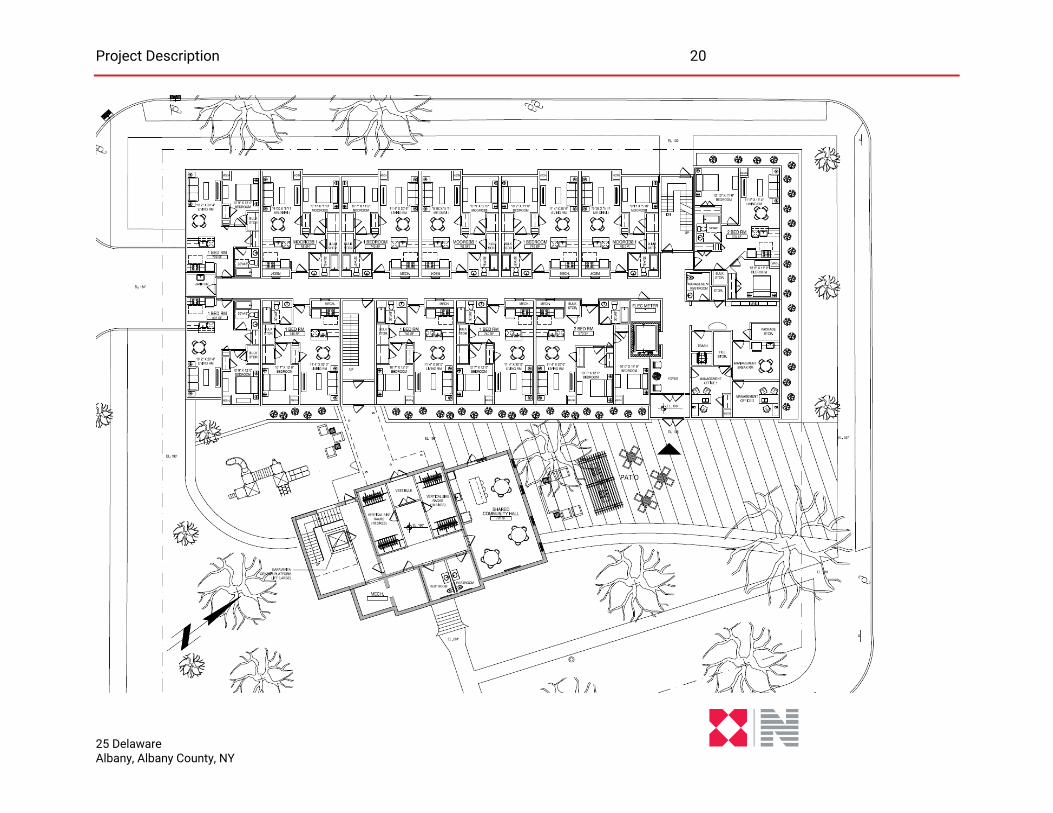
Project Description 20
25 Delaware Albany, Albany County, NY
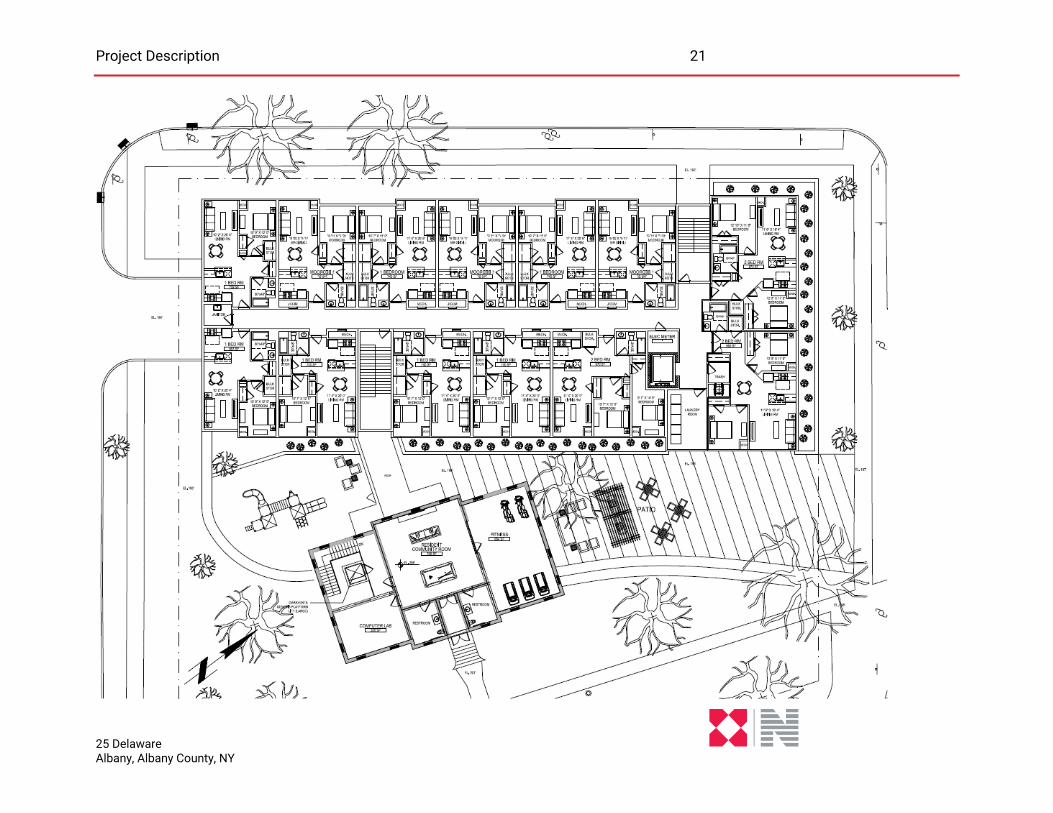
Project Description 21
25 Delaware Albany, Albany County, NY
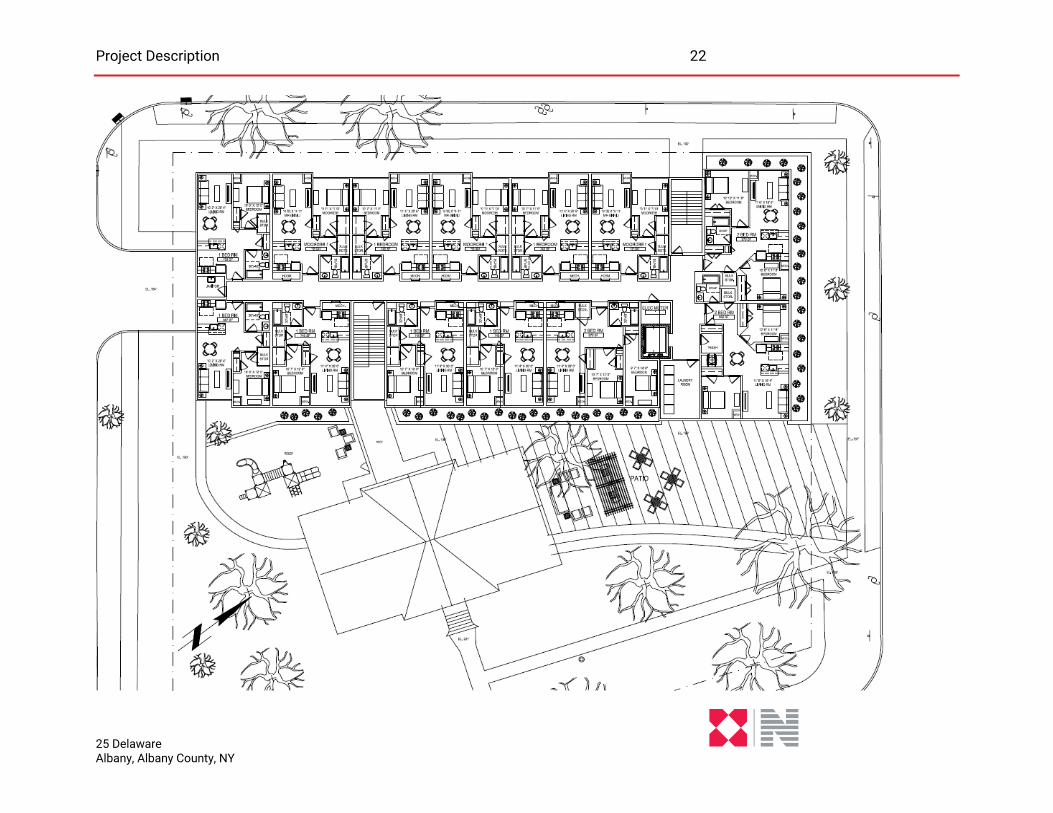
Project Description 22
25 Delaware Albany, Albany County, NY
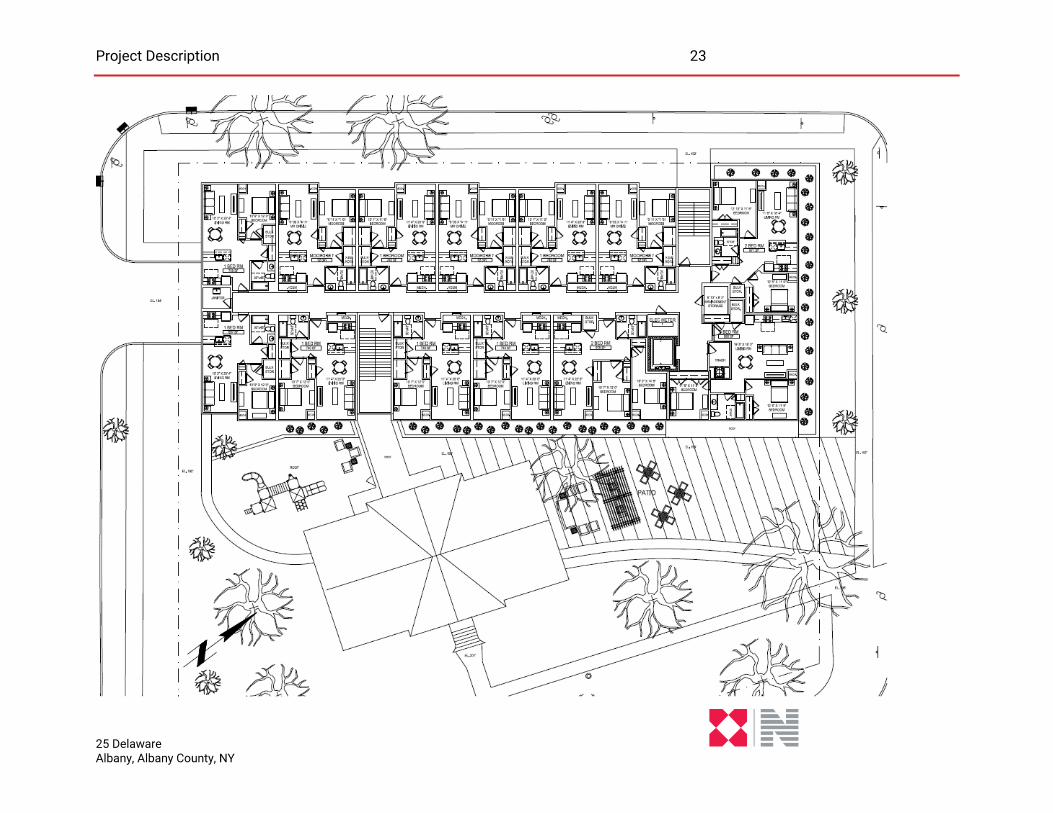
Project Description 23
25 Delaware Albany, Albany County, NY
Economic Analysis 24
25 Delaware Albany, Albany County, NY
Economic Analysis
Area Analysis
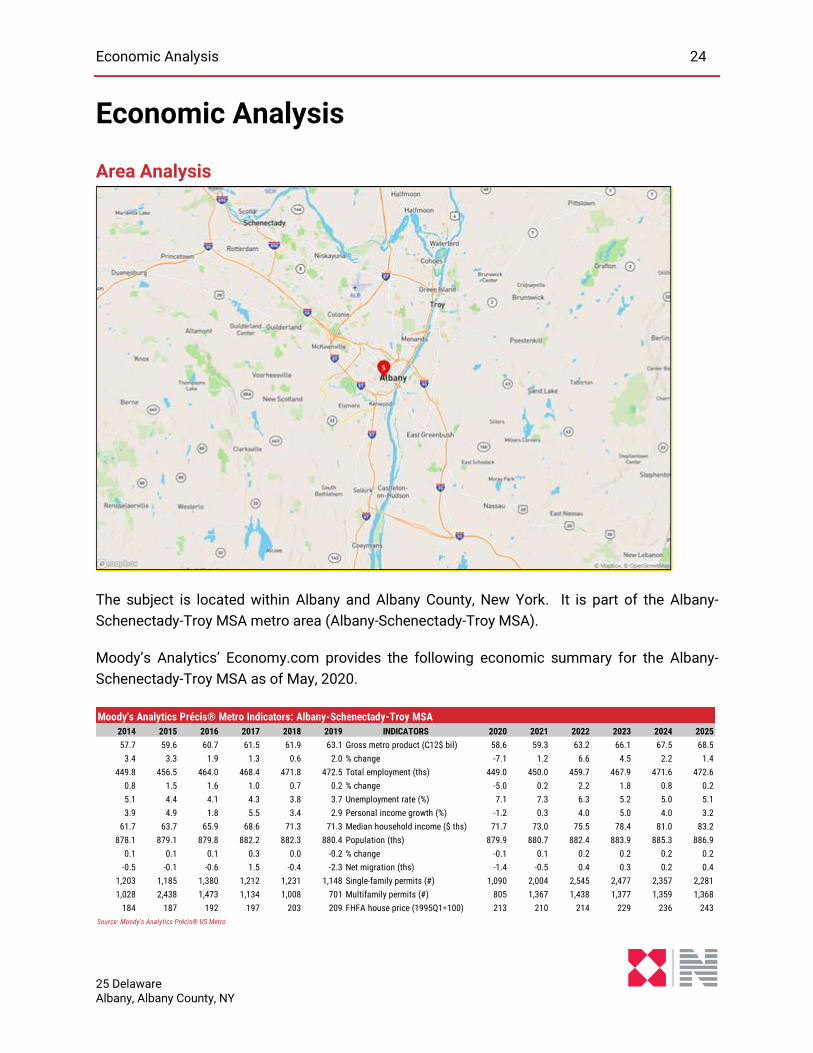
The subject is located within Albany and Albany County, New York. It is part of the Albany-
Schenectady-Troy MSA metro area (Albany-Schenectady-Troy MSA).
Moody’s Analytics’ Economy.com provides the following economic summary for the Albany-
Schenectady-Troy MSA as of May, 2020.
2014 2015 2016 2017 2018 2019 INDICATORS 2020 2021 2022 2023 2024 2025
57.7 59.6 60.7 61.5 61.9 63.1 Gross metro product (C12$ bil) 58.6 59.3 63.2 66.1 67.5 68.5
3.4 3.3 1.9 1.3 0.6 2.0 % change -7.1 1.2 6.6 4.5 2.2 1.4
449.8 456.5 464.0 468.4 471.8 472.5 Total employment (ths) 449.0 450.0 459.7 467.9 471.6 472.6
0.8 1.5 1.6 1.0 0.7 0.2 % change -5.0 0.2 2.2 1.8 0.8 0.2
5.1 4.4 4.1 4.3 3.8 3.7 Unemployment rate (%) 7.1 7.3 6.3 5.2 5.0 5.1
3.9 4.9 1.8 5.5 3.4 2.9 Personal income growth (%) -1.2 0.3 4.0 5.0 4.0 3.2
61.7 63.7 65.9 68.6 71.3 71.3 Median household income ($ ths) 71.7 73.0 75.5 78.4 81.0 83.2
878.1 879.1 879.8 882.2 882.3 880.4 Population (ths) 879.9 880.7 882.4 883.9 885.3 886.9
0.1 0.1 0.1 0.3 0.0 -0.2 % change -0.1 0.1 0.2 0.2 0.2 0.2
-0.5 -0.1 -0.6 1.5 -0.4 -2.3 Net migration (ths) -1.4 -0.5 0.4 0.3 0.2 0.4
1,203 1,185 1,380 1,212 1,231 1,148 Single-family permits (#) 1,090 2,004 2,545 2,477 2,357 2,281
1,028 2,438 1,473 1,134 1,008 701 Multifamily permits (#) 805 1,367 1,438 1,377 1,359 1,368
184 187 192 197 203 209 FHFA house price (1995Q1=100) 213 210 214 229 236 243
Source: Moody's Analytics Précis® US Metro
Moody's Analytics Précis® Metro Indicators: Albany-Schenectady-Troy MSA
Economic Analysis 25
25 Delaware Albany, Albany County, NY
Moody’s summarizes the area’s economic performance in recent months as follows:
Recent Performance
The road has been bumpy for Albany-Schenectady-Troy. Employment finished 2019 on a high
note, but the gains have been unwound with recent losses, including those related to COVID-19
containment measures. Payroll employment in private services contracted by more than 4,000
jobs in March, with the largest job losses concentrated in consumer services. Office-using
services and private goods have held up well through the first quarter. The labor force had a
strong start, expanding at the fastest rate in the last seven years, but the abrupt shift in the
economy in the spring months is likely to change the picture.
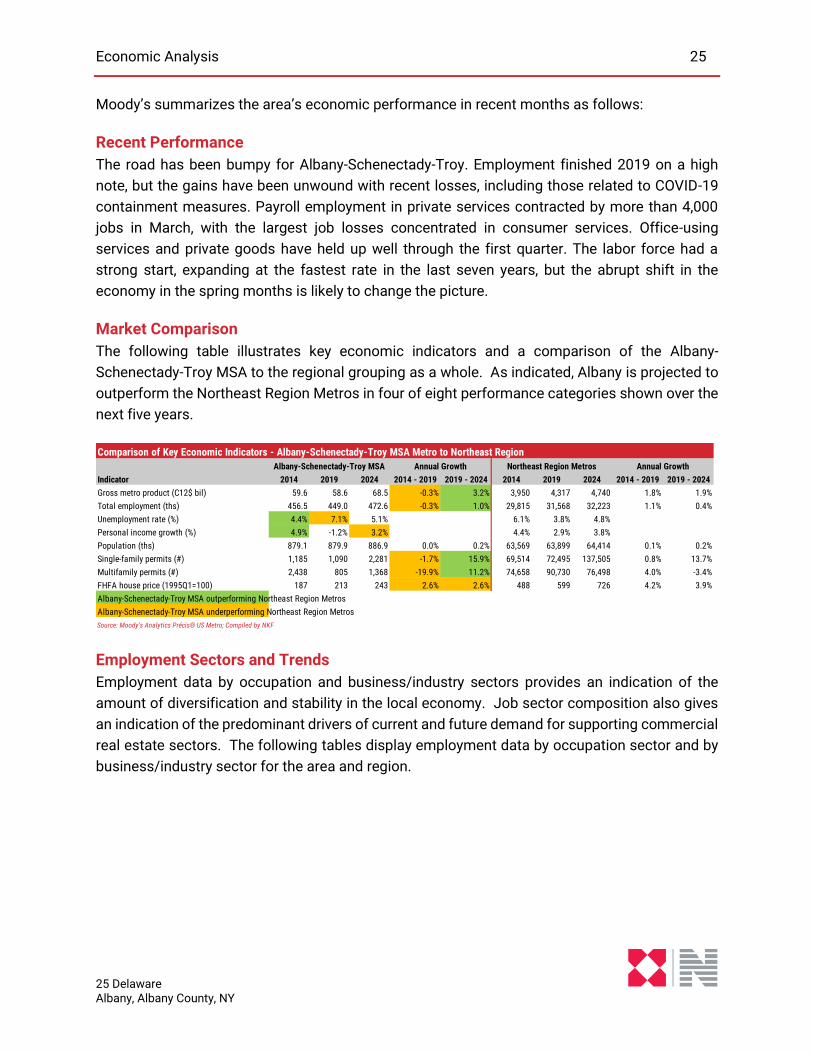
Market Comparison
The following table illustrates key economic indicators and a comparison of the Albany-
Schenectady-Troy MSA to the regional grouping as a whole. As indicated, Albany is projected to
outperform the Northeast Region Metros in four of eight performance categories shown over the
next five years.
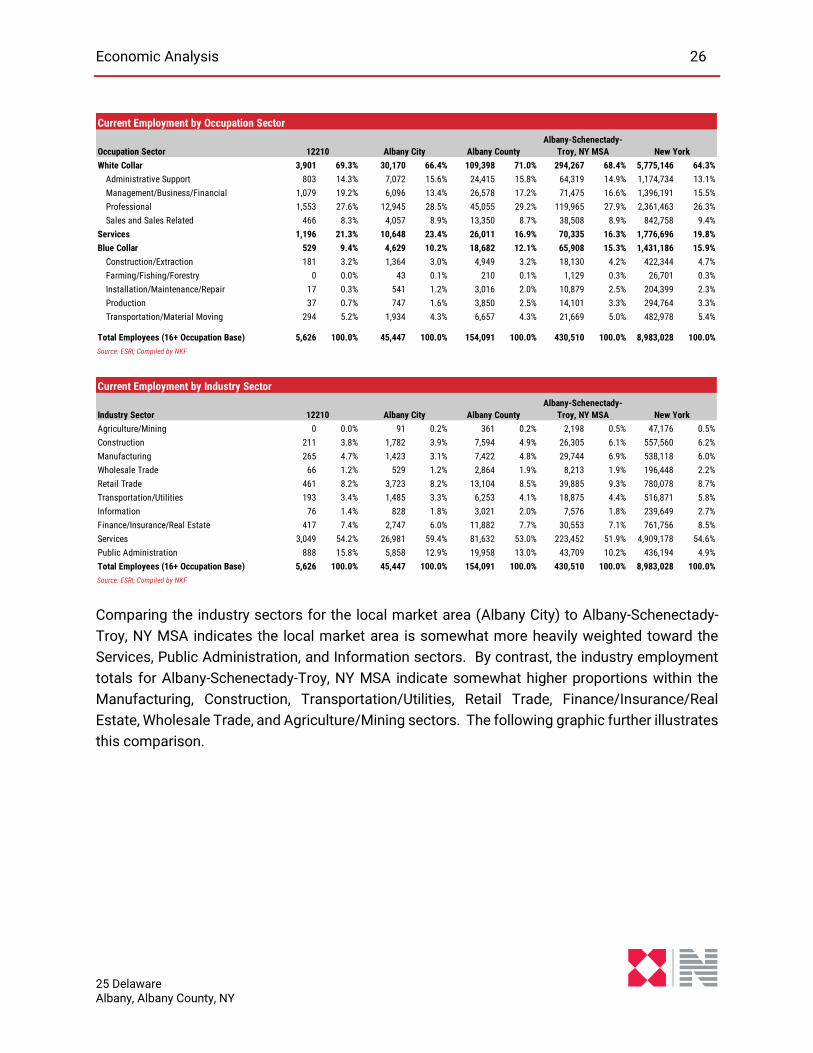
Employment Sectors and Trends
Employment data by occupation and business/industry sectors provides an indication of the
amount of diversification and stability in the local economy. Job sector composition also gives
an indication of the predominant drivers of current and future demand for supporting commercial
real estate sectors. The following tables display employment data by occupation sector and by
business/industry sector for the area and region.
Indicator 2014 2019 2024 2014 - 2019 2019 - 2024 2014 2019 2024 2014 - 2019 2019 - 2024
Gross metro product (C12$ bil) 59.6 58.6 68.5 -0.3% 3.2% 3,950 4,317 4,740 1.8% 1.9%
Total employment (ths) 456.5 449.0 472.6 -0.3% 1.0% 29,815 31,568 32,223 1.1% 0.4%
Unemployment rate (%) 4.4% 7.1% 5.1% 6.1% 3.8% 4.8%
Personal income growth (%) 4.9% -1.2% 3.2% 4.4% 2.9% 3.8%
Population (ths) 879.1 879.9 886.9 0.0% 0.2% 63,569 63,899 64,414 0.1% 0.2%
Single-family permits (#) 1,185 1,090 2,281 -1.7% 15.9% 69,514 72,495 137,505 0.8% 13.7%
Multifamily permits (#) 2,438 805 1,368 -19.9% 11.2% 74,658 90,730 76,498 4.0% -3.4%
FHFA house price (1995Q1=100) 187 213 243 2.6% 2.6% 488 599 726 4.2% 3.9%
Albany-Schenectady-Troy MSA outperforming Northeast Region Metros
Albany-Schenectady-Troy MSA underperforming Northeast Region Metros
Source: Moody's Analytics Précis® US Metro; Compiled by NKF
Albany-Schenectady-Troy MSA Annual Growth Northeast Region Metros
Comparison of Key Economic Indicators - Albany-Schenectady-Troy MSA Metro to Northeast Region
Annual Growth
Economic Analysis 26
25 Delaware Albany, Albany County, NY
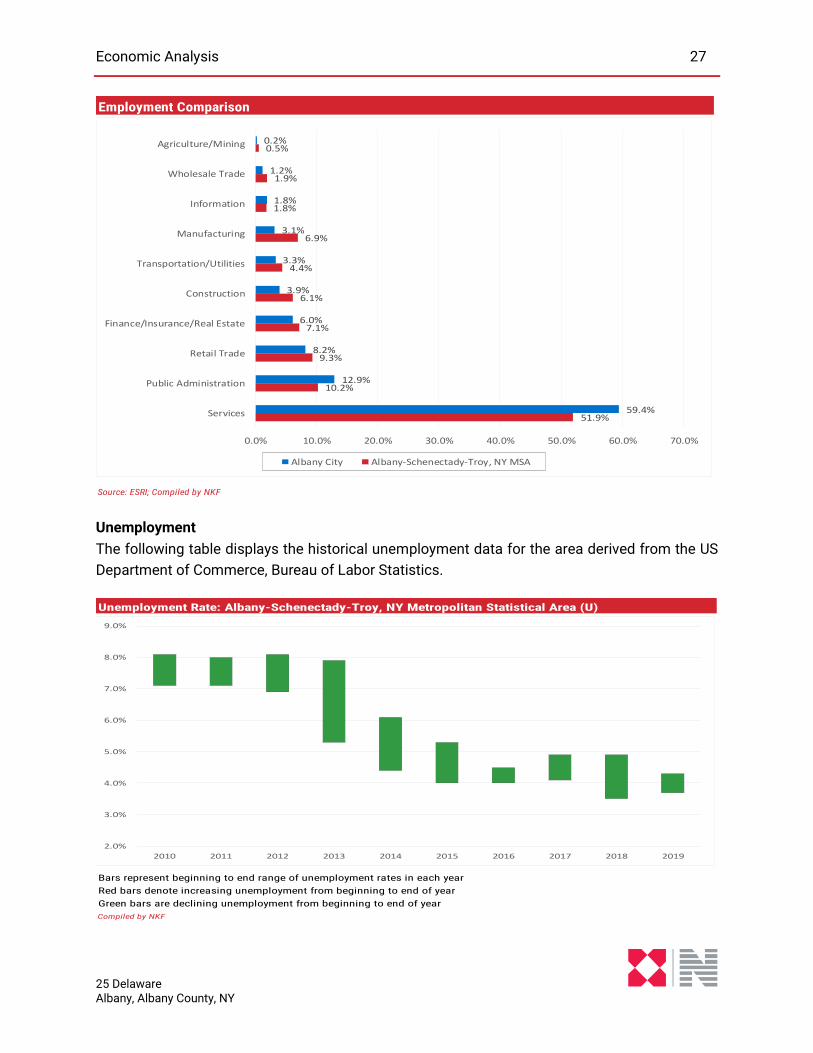
Comparing the industry sectors for the local market area (Albany City) to Albany-Schenectady-
Troy, NY MSA indicates the local market area is somewhat more heavily weighted toward the
Services, Public Administration, and Information sectors. By contrast, the industry employment
totals for Albany-Schenectady-Troy, NY MSA indicate somewhat higher proportions within the
Manufacturing, Construction, Transportation/Utilities, Retail Trade, Finance/Insurance/Real
Estate, Wholesale Trade, and Agriculture/Mining sectors. The following graphic further illustrates
this comparison.
Occupation Sector
White Collar 3,901 69.3% 30,170 66.4% 109,398 71.0% 294,267 68.4% 5,775,146 64.3%
Administrative Support 803 14.3% 7,072 15.6% 24,415 15.8% 64,319 14.9% 1,174,734 13.1%
Management/Business/Financial 1,079 19.2% 6,096 13.4% 26,578 17.2% 71,475 16.6% 1,396,191 15.5%
Professional 1,553 27.6% 12,945 28.5% 45,055 29.2% 119,965 27.9% 2,361,463 26.3%
Sales and Sales Related 466 8.3% 4,057 8.9% 13,350 8.7% 38,508 8.9% 842,758 9.4%
Services 1,196 21.3% 10,648 23.4% 26,011 16.9% 70,335 16.3% 1,776,696 19.8%
Blue Collar 529 9.4% 4,629 10.2% 18,682 12.1% 65,908 15.3% 1,431,186 15.9%
Construction/Extraction 181 3.2% 1,364 3.0% 4,949 3.2% 18,130 4.2% 422,344 4.7%
Farming/Fishing/Forestry 0 0.0% 43 0.1% 210 0.1% 1,129 0.3% 26,701 0.3%
Installation/Maintenance/Repair 17 0.3% 541 1.2% 3,016 2.0% 10,879 2.5% 204,399 2.3%
Production 37 0.7% 747 1.6% 3,850 2.5% 14,101 3.3% 294,764 3.3%
Transportation/Material Moving 294 5.2% 1,934 4.3% 6,657 4.3% 21,669 5.0% 482,978 5.4%
Total Employees (16+ Occupation Base) 5,626 100.0% 45,447 100.0% 154,091 100.0% 430,510 100.0% 8,983,028 100.0%
Source: ESRI; Compiled by NKF
Albany City Albany County
Current Employment by Occupation Sector
New York12210
Albany-Schenectady-
Troy, NY MSA
Industry Sector
Agriculture/Mining 0 0.0% 91 0.2% 361 0.2% 2,198 0.5% 47,176 0.5%
Construction 211 3.8% 1,782 3.9% 7,594 4.9% 26,305 6.1% 557,560 6.2%
Manufacturing 265 4.7% 1,423 3.1% 7,422 4.8% 29,744 6.9% 538,118 6.0%
Wholesale Trade 66 1.2% 529 1.2% 2,864 1.9% 8,213 1.9% 196,448 2.2%
Retail Trade 461 8.2% 3,723 8.2% 13,104 8.5% 39,885 9.3% 780,078 8.7%
Transportation/Utilities 193 3.4% 1,485 3.3% 6,253 4.1% 18,875 4.4% 516,871 5.8%
Information 76 1.4% 828 1.8% 3,021 2.0% 7,576 1.8% 239,649 2.7%
Finance/Insurance/Real Estate 417 7.4% 2,747 6.0% 11,882 7.7% 30,553 7.1% 761,756 8.5%
Services 3,049 54.2% 26,981 59.4% 81,632 53.0% 223,452 51.9% 4,909,178 54.6%
Public Administration 888 15.8% 5,858 12.9% 19,958 13.0% 43,709 10.2% 436,194 4.9%
Total Employees (16+ Occupation Base) 5,626 100.0% 45,447 100.0% 154,091 100.0% 430,510 100.0% 8,983,028 100.0%
Source: ESRI; Compiled by NKF
Current Employment by Industry Sector
12210 Albany City Albany County
Albany-Schenectady-
Troy, NY MSA New York
Economic Analysis 27
25 Delaware Albany, Albany County, NY
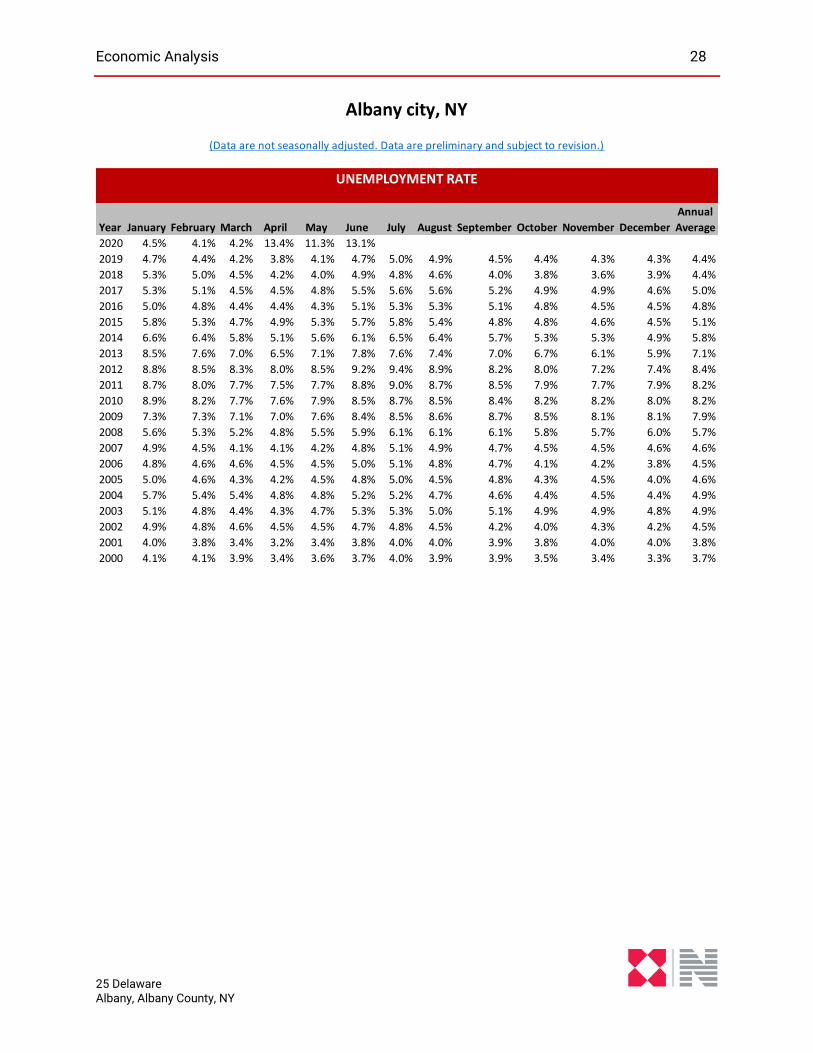
Unemployment
The following table displays the historical unemployment data for the area derived from the US
Department of Commerce, Bureau of Labor Statistics.
Source: ESRI; Compiled by NKF
Employment Comparison
51.9%
10.2%
9.3%
7.1%
6.1%
4.4%
6.9%
1.8%
1.9%
0.5%
59.4%
12.9%
8.2%
6.0%
3.9%
3.3%
3.1%
1.8%
1.2%
0.2%
0.0% 10.0% 20.0% 30.0% 40.0% 50.0% 60.0% 70.0%
Services
Public Administration
Retail Trade
Finance/Insurance/Real Estate
Construction
Transportation/Utilities
Manufacturing
Information
Wholesale Trade
Agriculture/Mining
Albany City Albany-Schenectady-Troy, NY MSA
Bars represent beginning to end range of unemployment rates in each year
Red bars denote increasing unemployment from beginning to end of year
Green bars are declining unemployment from beginning to end of year
Compiled by NKF
Unemployment Rate: Albany-Schenectady-Troy, NY Metropolitan Statistical Area (U)
2.0%
3.0%
4.0%
5.0%
6.0%
7.0%
8.0%
9.0%
2010 2011 2012 2013 2014 2015 2016 2017 2018 2019
Economic Analysis 28
25 Delaware Albany, Albany County, NY
Annual
Average
2020 4.5% 4.1% 4.2% 13.4% 11.3% 13.1%
2019 4.7% 4.4% 4.2% 3.8% 4.1% 4.7% 5.0% 4.9% 4.5% 4.4% 4.3% 4.3% 4.4%
2018 5.3% 5.0% 4.5% 4.2% 4.0% 4.9% 4.8% 4.6% 4.0% 3.8% 3.6% 3.9% 4.4%
2017 5.3% 5.1% 4.5% 4.5% 4.8% 5.5% 5.6% 5.6% 5.2% 4.9% 4.9% 4.6% 5.0%
2016 5.0% 4.8% 4.4% 4.4% 4.3% 5.1% 5.3% 5.3% 5.1% 4.8% 4.5% 4.5% 4.8%
2015 5.8% 5.3% 4.7% 4.9% 5.3% 5.7% 5.8% 5.4% 4.8% 4.8% 4.6% 4.5% 5.1%
2014 6.6% 6.4% 5.8% 5.1% 5.6% 6.1% 6.5% 6.4% 5.7% 5.3% 5.3% 4.9% 5.8%
2013 8.5% 7.6% 7.0% 6.5% 7.1% 7.8% 7.6% 7.4% 7.0% 6.7% 6.1% 5.9% 7.1%
2012 8.8% 8.5% 8.3% 8.0% 8.5% 9.2% 9.4% 8.9% 8.2% 8.0% 7.2% 7.4% 8.4%
2011 8.7% 8.0% 7.7% 7.5% 7.7% 8.8% 9.0% 8.7% 8.5% 7.9% 7.7% 7.9% 8.2%
2010 8.9% 8.2% 7.7% 7.6% 7.9% 8.5% 8.7% 8.5% 8.4% 8.2% 8.2% 8.0% 8.2%
2009 7.3% 7.3% 7.1% 7.0% 7.6% 8.4% 8.5% 8.6% 8.7% 8.5% 8.1% 8.1% 7.9%
2008 5.6% 5.3% 5.2% 4.8% 5.5% 5.9% 6.1% 6.1% 6.1% 5.8% 5.7% 6.0% 5.7%
2007 4.9% 4.5% 4.1% 4.1% 4.2% 4.8% 5.1% 4.9% 4.7% 4.5% 4.5% 4.6% 4.6%
2006 4.8% 4.6% 4.6% 4.5% 4.5% 5.0% 5.1% 4.8% 4.7% 4.1% 4.2% 3.8% 4.5%
2005 5.0% 4.6% 4.3% 4.2% 4.5% 4.8% 5.0% 4.5% 4.8% 4.3% 4.5% 4.0% 4.6%
2004 5.7% 5.4% 5.4% 4.8% 4.8% 5.2% 5.2% 4.7% 4.6% 4.4% 4.5% 4.4% 4.9%
2003 5.1% 4.8% 4.4% 4.3% 4.7% 5.3% 5.3% 5.0% 5.1% 4.9% 4.9% 4.8% 4.9%
2002 4.9% 4.8% 4.6% 4.5% 4.5% 4.7% 4.8% 4.5% 4.2% 4.0% 4.3% 4.2% 4.5%
2001 4.0% 3.8% 3.4% 3.2% 3.4% 3.8% 4.0% 4.0% 3.9% 3.8% 4.0% 4.0% 3.8%
2000 4.1% 4.1% 3.9% 3.4% 3.6% 3.7% 4.0% 3.9% 3.9% 3.5% 3.4% 3.3% 3.7%
Albany city, NY
(Data are not seasonally adjusted. Data are preliminary and subject to revision.)
UNEMPLOYMENT RATE
DecemberJune July August September October NovemberYear January February March April May
Economic Analysis 29
25 Delaware Albany, Albany County, NY
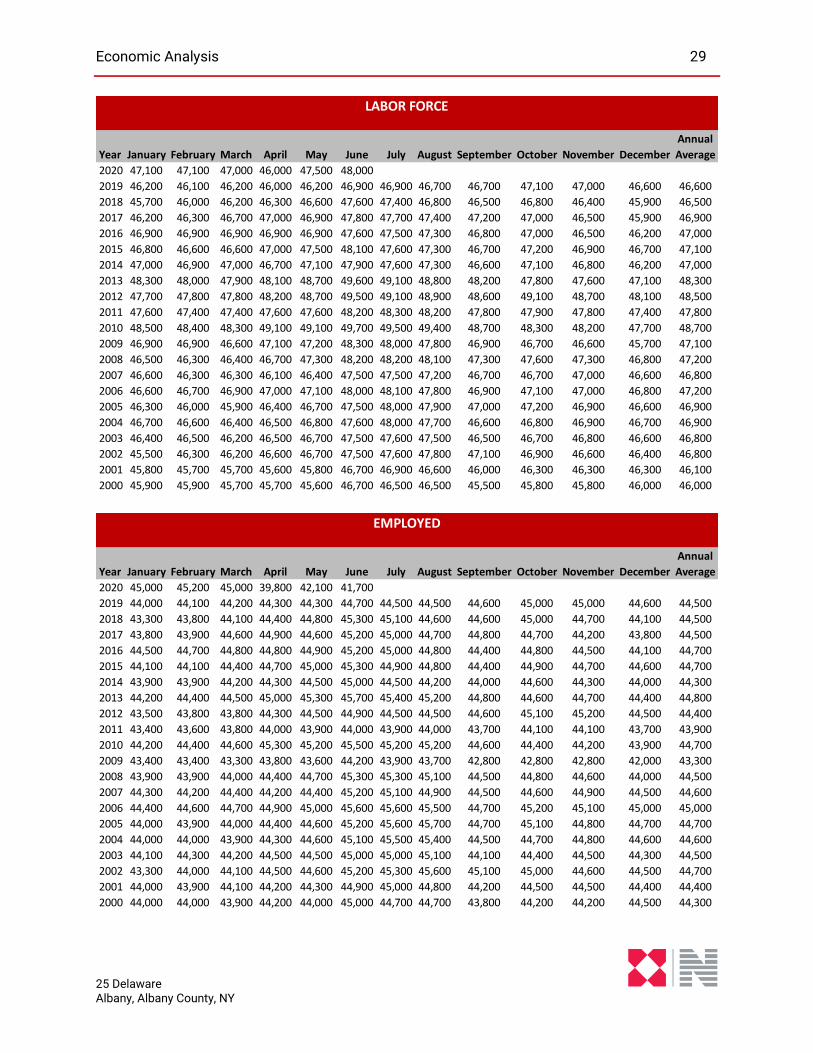
Annual
Average
2020 47,100 47,100 47,000 46,000 47,500 48,000
2019 46,200 46,100 46,200 46,000 46,200 46,900 46,900 46,700 46,700 47,100 47,000 46,600 46,600
2018 45,700 46,000 46,200 46,300 46,600 47,600 47,400 46,800 46,500 46,800 46,400 45,900 46,500
2017 46,200 46,300 46,700 47,000 46,900 47,800 47,700 47,400 47,200 47,000 46,500 45,900 46,900
2016 46,900 46,900 46,900 46,900 46,900 47,600 47,500 47,300 46,800 47,000 46,500 46,200 47,000
2015 46,800 46,600 46,600 47,000 47,500 48,100 47,600 47,300 46,700 47,200 46,900 46,700 47,100
2014 47,000 46,900 47,000 46,700 47,100 47,900 47,600 47,300 46,600 47,100 46,800 46,200 47,000
2013 48,300 48,000 47,900 48,100 48,700 49,600 49,100 48,800 48,200 47,800 47,600 47,100 48,300
2012 47,700 47,800 47,800 48,200 48,700 49,500 49,100 48,900 48,600 49,100 48,700 48,100 48,500
2011 47,600 47,400 47,400 47,600 47,600 48,200 48,300 48,200 47,800 47,900 47,800 47,400 47,800
2010 48,500 48,400 48,300 49,100 49,100 49,700 49,500 49,400 48,700 48,300 48,200 47,700 48,700
2009 46,900 46,900 46,600 47,100 47,200 48,300 48,000 47,800 46,900 46,700 46,600 45,700 47,100
2008 46,500 46,300 46,400 46,700 47,300 48,200 48,200 48,100 47,300 47,600 47,300 46,800 47,200
2007 46,600 46,300 46,300 46,100 46,400 47,500 47,500 47,200 46,700 46,700 47,000 46,600 46,800
2006 46,600 46,700 46,900 47,000 47,100 48,000 48,100 47,800 46,900 47,100 47,000 46,800 47,200
2005 46,300 46,000 45,900 46,400 46,700 47,500 48,000 47,900 47,000 47,200 46,900 46,600 46,900
2004 46,700 46,600 46,400 46,500 46,800 47,600 48,000 47,700 46,600 46,800 46,900 46,700 46,900
2003 46,400 46,500 46,200 46,500 46,700 47,500 47,600 47,500 46,500 46,700 46,800 46,600 46,800
2002 45,500 46,300 46,200 46,600 46,700 47,500 47,600 47,800 47,100 46,900 46,600 46,400 46,800
2001 45,800 45,700 45,700 45,600 45,800 46,700 46,900 46,600 46,000 46,300 46,300 46,300 46,100
2000 45,900 45,900 45,700 45,700 45,600 46,700 46,500 46,500 45,500 45,800 45,800 46,000 46,000
LABOR FORCE
August September October November DecemberYear January February March April May June July
Annual
Average
2020 45,000 45,200 45,000 39,800 42,100 41,700
2019 44,000 44,100 44,200 44,300 44,300 44,700 44,500 44,500 44,600 45,000 45,000 44,600 44,500
2018 43,300 43,800 44,100 44,400 44,800 45,300 45,100 44,600 44,600 45,000 44,700 44,100 44,500
2017 43,800 43,900 44,600 44,900 44,600 45,200 45,000 44,700 44,800 44,700 44,200 43,800 44,500
2016 44,500 44,700 44,800 44,800 44,900 45,200 45,000 44,800 44,400 44,800 44,500 44,100 44,700
2015 44,100 44,100 44,400 44,700 45,000 45,300 44,900 44,800 44,400 44,900 44,700 44,600 44,700
2014 43,900 43,900 44,200 44,300 44,500 45,000 44,500 44,200 44,000 44,600 44,300 44,000 44,300
2013 44,200 44,400 44,500 45,000 45,300 45,700 45,400 45,200 44,800 44,600 44,700 44,400 44,800
2012 43,500 43,800 43,800 44,300 44,500 44,900 44,500 44,500 44,600 45,100 45,200 44,500 44,400
2011 43,400 43,600 43,800 44,000 43,900 44,000 43,900 44,000 43,700 44,100 44,100 43,700 43,900
2010 44,200 44,400 44,600 45,300 45,200 45,500 45,200 45,200 44,600 44,400 44,200 43,900 44,700
2009 43,400 43,400 43,300 43,800 43,600 44,200 43,900 43,700 42,800 42,800 42,800 42,000 43,300
2008 43,900 43,900 44,000 44,400 44,700 45,300 45,300 45,100 44,500 44,800 44,600 44,000 44,500
2007 44,300 44,200 44,400 44,200 44,400 45,200 45,100 44,900 44,500 44,600 44,900 44,500 44,600
2006 44,400 44,600 44,700 44,900 45,000 45,600 45,600 45,500 44,700 45,200 45,100 45,000 45,000
2005 44,000 43,900 44,000 44,400 44,600 45,200 45,600 45,700 44,700 45,100 44,800 44,700 44,700
2004 44,000 44,000 43,900 44,300 44,600 45,100 45,500 45,400 44,500 44,700 44,800 44,600 44,600
2003 44,100 44,300 44,200 44,500 44,500 45,000 45,000 45,100 44,100 44,400 44,500 44,300 44,500
2002 43,300 44,000 44,100 44,500 44,600 45,200 45,300 45,600 45,100 45,000 44,600 44,500 44,700
2001 44,000 43,900 44,100 44,200 44,300 44,900 45,000 44,800 44,200 44,500 44,500 44,400 44,400
2000 44,000 44,000 43,900 44,200 44,000 45,000 44,700 44,700 43,800 44,200 44,200 44,500 44,300
EMPLOYED
DecemberJune July August September October NovemberYear January February March April May
Economic Analysis 30
25 Delaware Albany, Albany County, NY
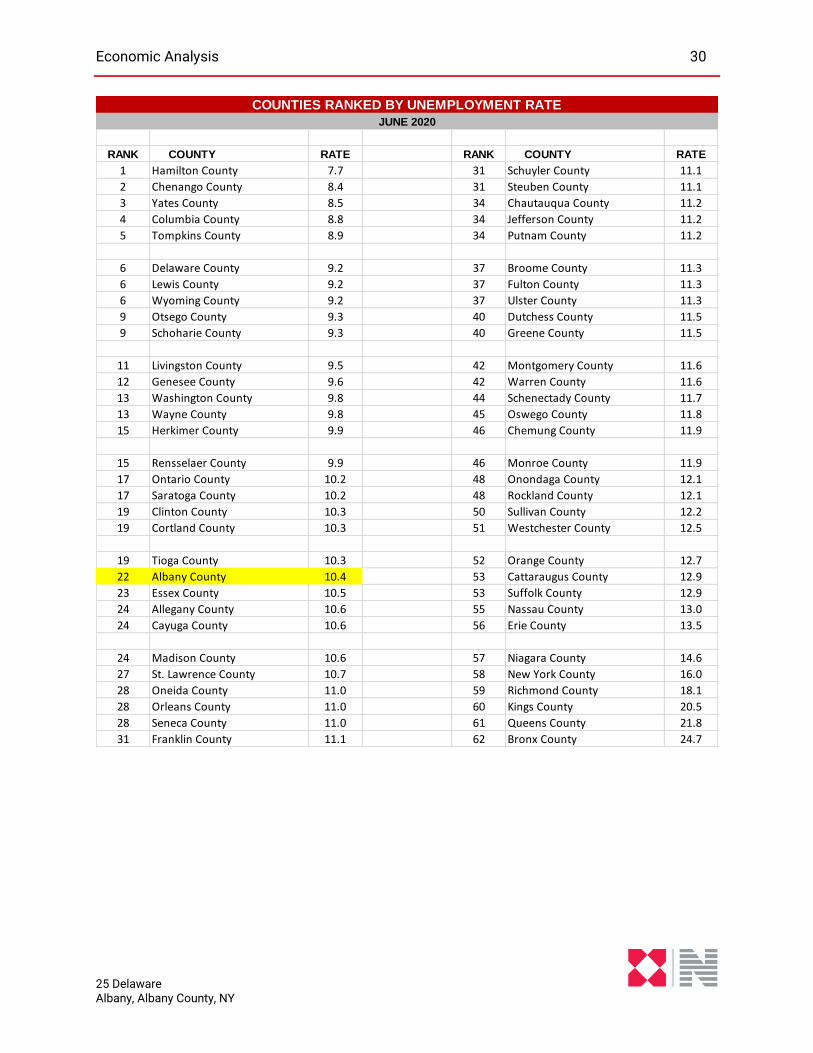
RANK COUNTY RATE RANK COUNTY RATE
1 Hamilton County 7.7 31 Schuyler County 11.1
2 Chenango County 8.4 31 Steuben County 11.1
3 Yates County 8.5 34 Chautauqua County 11.2
4 Columbia County 8.8 34 Jefferson County 11.2
5 Tompkins County 8.9 34 Putnam County 11.2
6 Delaware County 9.2 37 Broome County 11.3
6 Lewis County 9.2 37 Fulton County 11.3
6 Wyoming County 9.2 37 Ulster County 11.3
9 Otsego County 9.3 40 Dutchess County 11.5
9 Schoharie County 9.3 40 Greene County 11.5
11 Livingston County 9.5 42 Montgomery County 11.6
12 Genesee County 9.6 42 Warren County 11.6
13 Washington County 9.8 44 Schenectady County 11.7
13 Wayne County 9.8 45 Oswego County 11.8
15 Herkimer County 9.9 46 Chemung County 11.9
15 Rensselaer County 9.9 46 Monroe County 11.9
17 Ontario County 10.2 48 Onondaga County 12.1
17 Saratoga County 10.2 48 Rockland County 12.1
19 Clinton County 10.3 50 Sullivan County 12.2
19 Cortland County 10.3 51 Westchester County 12.5
19 Tioga County 10.3 52 Orange County 12.7
22 Albany County 10.4 53 Cattaraugus County 12.9
23 Essex County 10.5 53 Suffolk County 12.9
24 Allegany County 10.6 55 Nassau County 13.0
24 Cayuga County 10.6 56 Erie County 13.5
24 Madison County 10.6 57 Niagara County 14.6
27 St. Lawrence County 10.7 58 New York County 16.0
28 Oneida County 11.0 59 Richmond County 18.1
28 Orleans County 11.0 60 Kings County 20.5
28 Seneca County 11.0 61 Queens County 21.8
31 Franklin County 11.1 62 Bronx County 24.7
COUNTIES RANKED BY UNEMPLOYMENT RATE
JUNE 2020
Economic Analysis 31
25 Delaware Albany, Albany County, NY
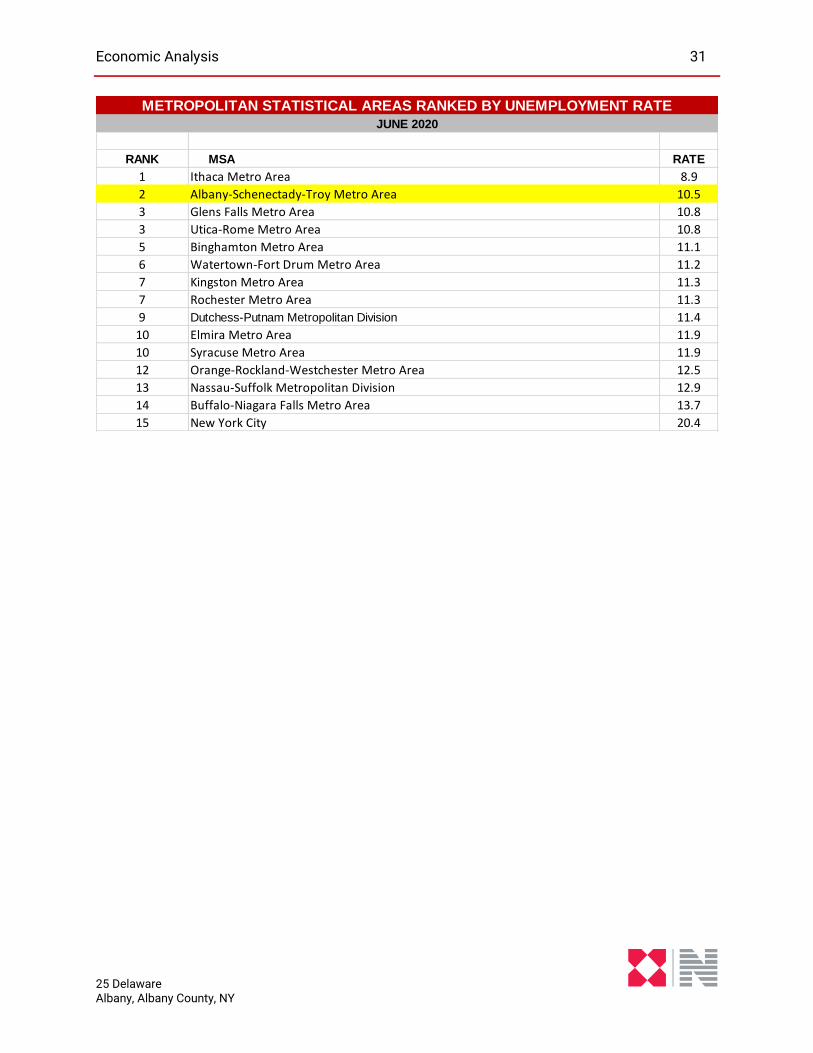
RANK MSA RATE
1 Ithaca Metro Area 8.9
2 Albany-Schenectady-Troy Metro Area 10.5
3 Glens Falls Metro Area 10.8
3 Utica-Rome Metro Area 10.8
5 Binghamton Metro Area 11.1
6 Watertown-Fort Drum Metro Area 11.2
7 Kingston Metro Area 11.3
7 Rochester Metro Area 11.3
9 Dutchess-Putnam Metropolitan Division 11.4
10 Elmira Metro Area 11.9
10 Syracuse Metro Area 11.9
12 Orange-Rockland-Westchester Metro Area 12.5
13 Nassau-Suffolk Metropolitan Division 12.9
14 Buffalo-Niagara Falls Metro Area 13.7
15 New York City 20.4
METROPOLITAN STATISTICAL AREAS RANKED BY UNEMPLOYMENT RATE
JUNE 2020
Economic Analysis 32
25 Delaware Albany, Albany County, NY
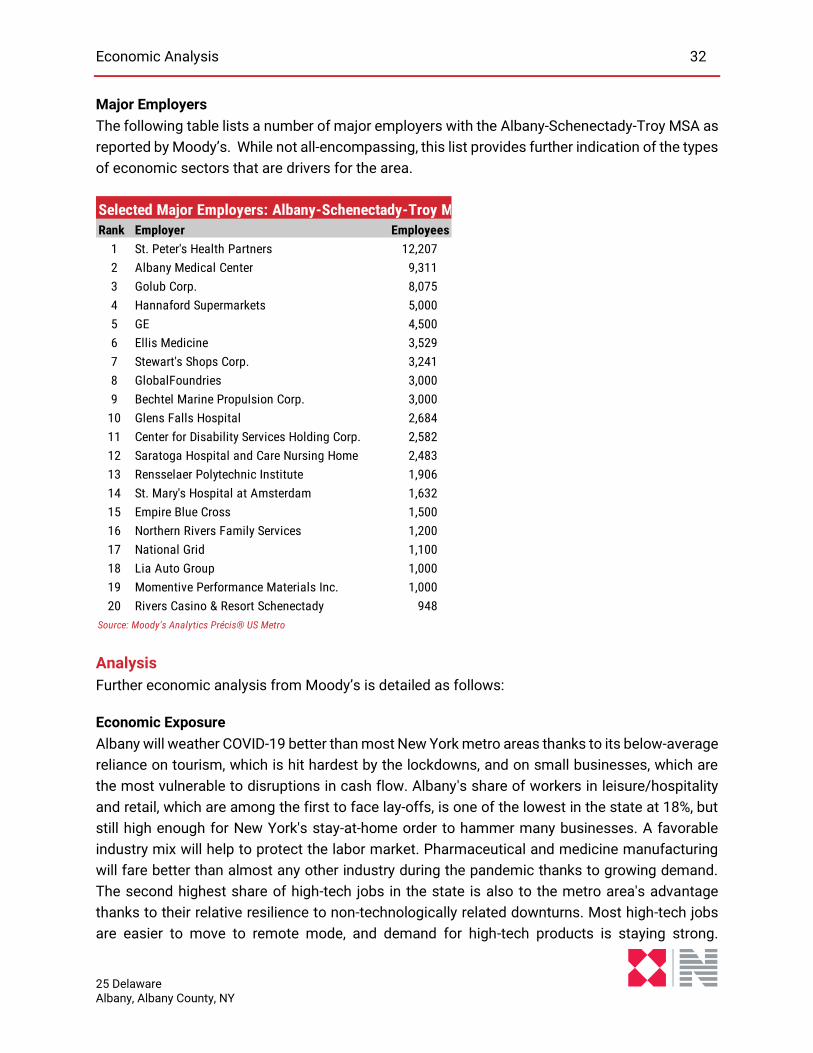
Major Employers
The following table lists a number of major employers with the Albany-Schenectady-Troy MSA as
reported by Moody’s. While not all-encompassing, this list provides further indication of the types
of economic sectors that are drivers for the area.
Analysis
Further economic analysis from Moody’s is detailed as follows:
Economic Exposure
Albany will weather COVID-19 better than most New York metro areas thanks to its below-average
reliance on tourism, which is hit hardest by the lockdowns, and on small businesses, which are
the most vulnerable to disruptions in cash flow. Albany's share of workers in leisure/hospitality
and retail, which are among the first to face layoffs, is one of the lowest in the state at 18%, but
still high enough for New York's stay-at-home order to hammer many businesses. A favorable
industry mix will help to protect the labor market. Pharmaceutical and medicine manufacturing
will fare better than almost any other industry during the pandemic thanks to growing demand.
The second highest share of high-tech jobs in the state is also to the metro area's advantage
thanks to their relative resilience to non-technologically related downturns. Most high-tech jobs
are easier to move to remote mode, and demand for high-tech products is staying strong.
Rank Employer Employees
1 St. Peter's Health Partners 12,207
2 Albany Medical Center 9,311
3 Golub Corp. 8,075
4 Hannaford Supermarkets 5,000
5 GE 4,500
6 Ellis Medicine 3,529
7 Stewart's Shops Corp. 3,241
8 GlobalFoundries 3,000
9 Bechtel Marine Propulsion Corp. 3,000
10 Glens Falls Hospital 2,684
11 Center for Disability Services Holding Corp. 2,582
12 Saratoga Hospital and Care Nursing Home 2,483
13 Rensselaer Polytechnic Institute 1,906
14 St. Mary's Hospital at Amsterdam 1,632
15 Empire Blue Cross 1,500
16 Northern Rivers Family Services 1,200
17 National Grid 1,100
18 Lia Auto Group 1,000
19 Momentive Performance Materials Inc. 1,000
20 Rivers Casino & Resort Schenectady 948
Source: Moody's Analytics Précis® US Metro
Selected Major Employers: Albany-Schenectady-Troy MSA
Economic Analysis 33
25 Delaware Albany, Albany County, NY
Relatively few jobs in higher-value-added industries were lost after the Great Recession, and
employment rebounded faster.
State Capital
The hole in the state budget caused by COVID-19 creates the risk of state government layoffs.
New York state anticipates a tax revenue shortfall of $13.3 billion this fiscal year and $61 billion
over the next four years as the coronavirus outbreak wreaks havoc on the state's economy. After
the Great Recession, in order to keep the budgets balanced, Governor Andrew Cuomo eliminated
around 10% of state jobs, and these huge losses trimmed gains in the private sector. This time,
the Empire State will soon run out of state funds to pay unemployment benefits to New Yorkers
who lost their jobs because of the economic consequences of the pandemic. New York has paid
out $3.1 billion in unemployment benefits from March 9 to April 22, as more than 1.4 million
individuals have submitted claims.
Demographic Downfall
Population losses will make the recovery of consumer-related industries harder. Last year Albany
lost residents compared with a year earlier for the first time since 1998, as domestic out-migration
outweighed gains from natural growth and international in-migration. An outsize share of 45- to
54-year-olds, typically the highest earners, are leaving, which will suppress wage gains. The
population of younger cohorts expanded, and Albany's preserved talent pool, combined with low
business costs, has the potential to attract more high-tech companies after the economic
recovery. All told, fewer residents will reduce tax revenues for local governments and cause
population-dependent industries such as healthcare and construction to underperform.
Demographics
A demographic summary for the defined area is illustrated as follows:
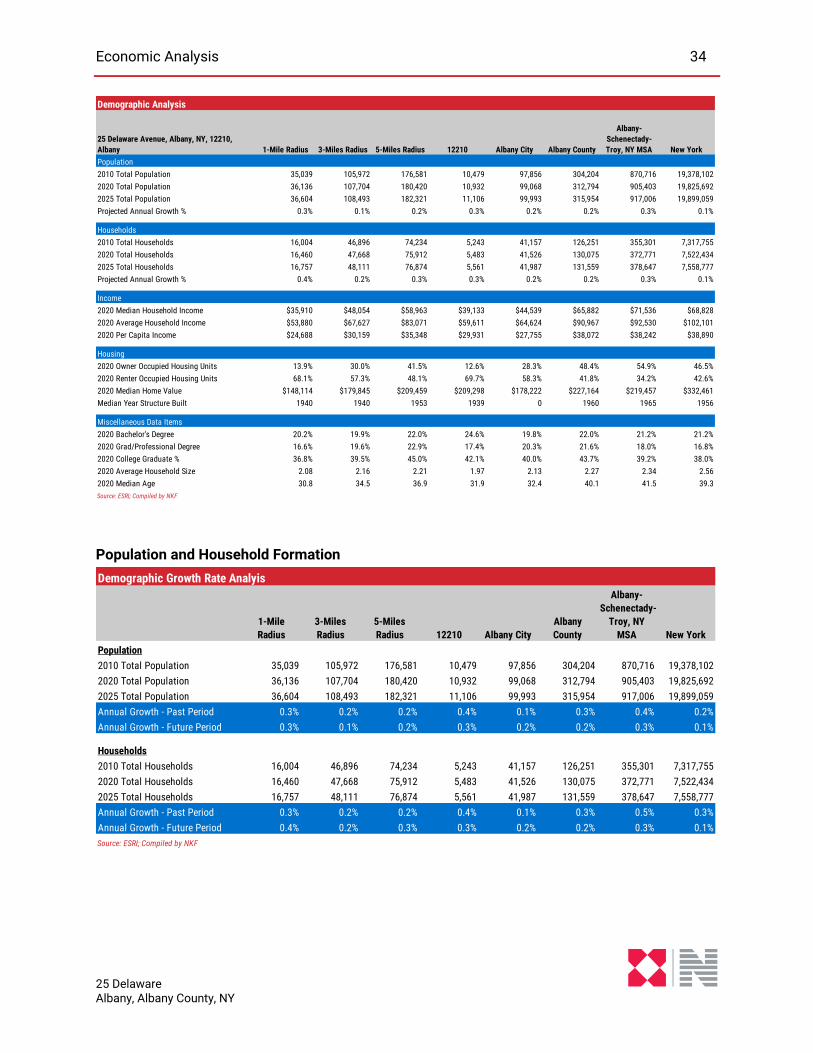
Economic Analysis 34
25 Delaware Albany, Albany County, NY
Population and Household Formation
25 Delaware Avenue, Albany, NY, 12210,
Albany 1-Mile Radius 3-Miles Radius 5-Miles Radius 12210 Albany City Albany County
Albany-
Schenectady-
Troy, NY MSA New York
Population
2010 Total Population 35,039 105,972 176,581 10,479 97,856 304,204 870,716 19,378,102
2020 Total Population 36,136 107,704 180,420 10,932 99,068 312,794 905,403 19,825,692
2025 Total Population 36,604 108,493 182,321 11,106 99,993 315,954 917,006 19,899,059
Projected Annual Growth % 0.3% 0.1% 0.2% 0.3% 0.2% 0.2% 0.3% 0.1%
Households
2010 Total Households 16,004 46,896 74,234 5,243 41,157 126,251 355,301 7,317,755
2020 Total Households 16,460 47,668 75,912 5,483 41,526 130,075 372,771 7,522,434
2025 Total Households 16,757 48,111 76,874 5,561 41,987 131,559 378,647 7,558,777
Projected Annual Growth % 0.4% 0.2% 0.3% 0.3% 0.2% 0.2% 0.3% 0.1%
Income
2020 Median Household Income $35,910 $48,054 $58,963 $39,133 $44,539 $65,882 $71,536 $68,828
2020 Average Household Income $53,880 $67,627 $83,071 $59,611 $64,624 $90,967 $92,530 $102,101
2020 Per Capita Income $24,688 $30,159 $35,348 $29,931 $27,755 $38,072 $38,242 $38,890
Housing
2020 Owner Occupied Housing Units 13.9% 30.0% 41.5% 12.6% 28.3% 48.4% 54.9% 46.5%
2020 Renter Occupied Housing Units 68.1% 57.3% 48.1% 69.7% 58.3% 41.8% 34.2% 42.6%
2020 Median Home Value $148,114 $179,845 $209,459 $209,298 $178,222 $227,164 $219,457 $332,461
Median Year Structure Built 1940 1940 1953 1939 0 1960 1965 1956
Miscellaneous Data Items
2020 Bachelor's Degree 20.2% 19.9% 22.0% 24.6% 19.8% 22.0% 21.2% 21.2%
2020 Grad/Professional Degree 16.6% 19.6% 22.9% 17.4% 20.3% 21.6% 18.0% 16.8%
2020 College Graduate % 36.8% 39.5% 45.0% 42.1% 40.0% 43.7% 39.2% 38.0%
2020 Average Household Size 2.08 2.16 2.21 1.97 2.13 2.27 2.34 2.56
2020 Median Age 30.8 34.5 36.9 31.9 32.4 40.1 41.5 39.3
Source: ESRI; Compiled by NKF
Demographic Analysis
1-Mile
Radius
3-Miles
Radius
5-Miles
Radius 12210 Albany City
Albany
County
Albany-
Schenectady-
Troy, NY
MSA New York
Population
2010 Total Population 35,039 105,972 176,581 10,479 97,856 304,204 870,716 19,378,102
2020 Total Population 36,136 107,704 180,420 10,932 99,068 312,794 905,403 19,825,692
2025 Total Population 36,604 108,493 182,321 11,106 99,993 315,954 917,006 19,899,059
Annual Growth - Past Period 0.3% 0.2% 0.2% 0.4% 0.1% 0.3% 0.4% 0.2%
Annual Growth - Future Period 0.3% 0.1% 0.2% 0.3% 0.2% 0.2% 0.3% 0.1%
Households
2010 Total Households 16,004 46,896 74,234 5,243 41,157 126,251 355,301 7,317,755
2020 Total Households 16,460 47,668 75,912 5,483 41,526 130,075 372,771 7,522,434
2025 Total Households 16,757 48,111 76,874 5,561 41,987 131,559 378,647 7,558,777
Annual Growth - Past Period 0.3% 0.2% 0.2% 0.4% 0.1% 0.3% 0.5% 0.3%
Annual Growth - Future Period 0.4% 0.2% 0.3% 0.3% 0.2% 0.2% 0.3% 0.1%
Source: ESRI; Compiled by NKF
Demographic Growth Rate Analyis
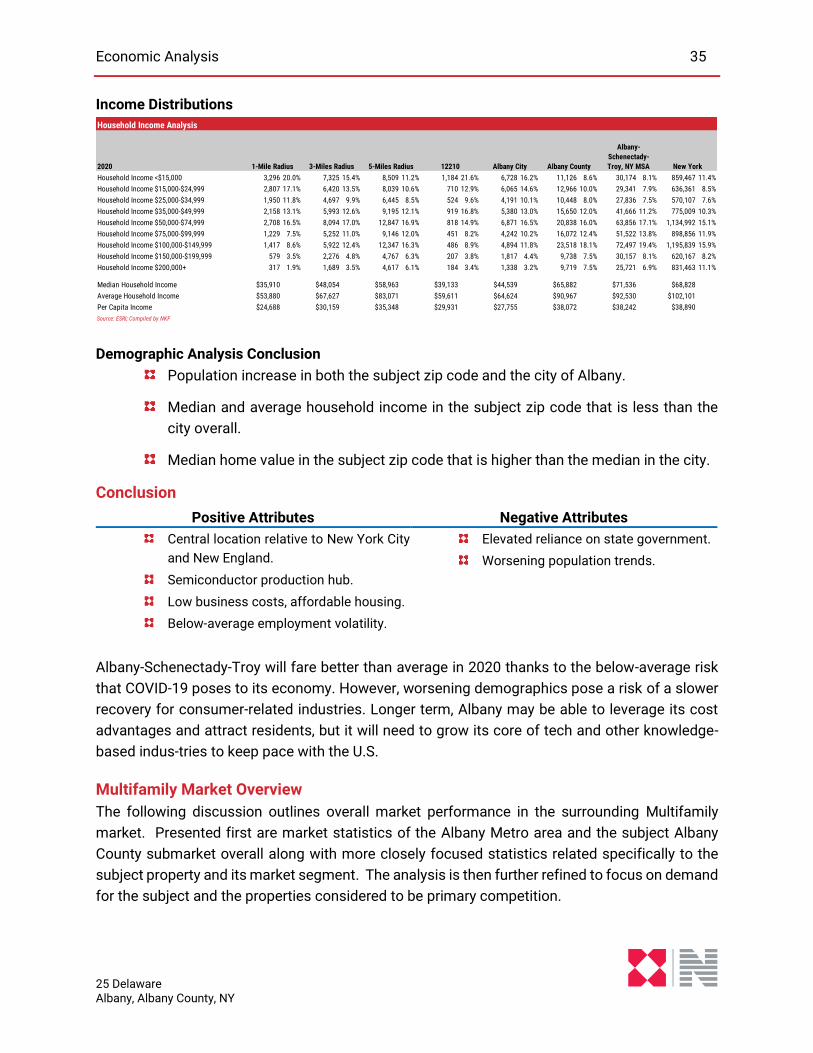
Economic Analysis 35
25 Delaware Albany, Albany County, NY
Income Distributions
Demographic Analysis Conclusion
Population increase in both the subject zip code and the city of Albany.
Median and average household income in the subject zip code that is less than the
city overall.
Median home value in the subject zip code that is higher than the median in the city.
Conclusion
Positive Attributes Negative Attributes
Central location relative to New York City
and New England.
Semiconductor production hub.
Low business costs, affordable housing.
Below-average employment volatility.
Elevated reliance on state government.
Worsening population trends.
Albany-Schenectady-Troy will fare better than average in 2020 thanks to the below-average risk
that COVID-19 poses to its economy. However, worsening demographics pose a risk of a slower
recovery for consumer-related industries. Longer term, Albany may be able to leverage its cost
advantages and attract residents, but it will need to grow its core of tech and other knowledge-
based industries to keep pace with the U.S.
Multifamily Market Overview
The following discussion outlines overall market performance in the surrounding Multifamily
market. Presented first are market statistics of the Albany Metro area and the subject Albany
County submarket overall along with more closely focused statistics related specifically to the
subject property and its market segment. The analysis is then further refined to focus on demand
for the subject and the properties considered to be primary competition.
2020
Household Income <$15,000 3,296 20.0% 7,325 15.4% 8,509 11.2% 1,184 21.6% 6,728 16.2% 11,126 8.6% 30,174 8.1% 859,467 11.4%
Household Income $15,000-$24,999 2,807 17.1% 6,420 13.5% 8,039 10.6% 710 12.9% 6,065 14.6% 12,966 10.0% 29,341 7.9% 636,361 8.5%
Household Income $25,000-$34,999 1,950 11.8% 4,697 9.9% 6,445 8.5% 524 9.6% 4,191 10.1% 10,448 8.0% 27,836 7.5% 570,107 7.6%
Household Income $35,000-$49,999 2,158 13.1% 5,993 12.6% 9,195 12.1% 919 16.8% 5,380 13.0% 15,650 12.0% 41,666 11.2% 775,009 10.3%
Household Income $50,000-$74,999 2,708 16.5% 8,094 17.0% 12,847 16.9% 818 14.9% 6,871 16.5% 20,838 16.0% 63,856 17.1% 1,134,992 15.1%
Household Income $75,000-$99,999 1,229 7.5% 5,252 11.0% 9,146 12.0% 451 8.2% 4,242 10.2% 16,072 12.4% 51,522 13.8% 898,856 11.9%
Household Income $100,000-$149,999 1,417 8.6% 5,922 12.4% 12,347 16.3% 486 8.9% 4,894 11.8% 23,518 18.1% 72,497 19.4% 1,195,839 15.9%
Household Income $150,000-$199,999 579 3.5% 2,276 4.8% 4,767 6.3% 207 3.8% 1,817 4.4% 9,738 7.5% 30,157 8.1% 620,167 8.2%
Household Income $200,000+ 317 1.9% 1,689 3.5% 4,617 6.1% 184 3.4% 1,338 3.2% 9,719 7.5% 25,721 6.9% 831,463 11.1%
Median Household Income $35,910 $48,054 $58,963 $39,133 $44,539 $65,882 $71,536 $68,828
Average Household Income $53,880 $67,627 $83,071 $59,611 $64,624 $90,967 $92,530 $102,101
Per Capita Income $24,688 $30,159 $35,348 $29,931 $27,755 $38,072 $38,242 $38,890
Source: ESRI; Compiled by NKF
Household Income Analysis
1-Mile Radius 3-Miles Radius 5-Miles Radius 12210 Albany City Albany County
Albany-
Schenectady-
Troy, NY MSA New York
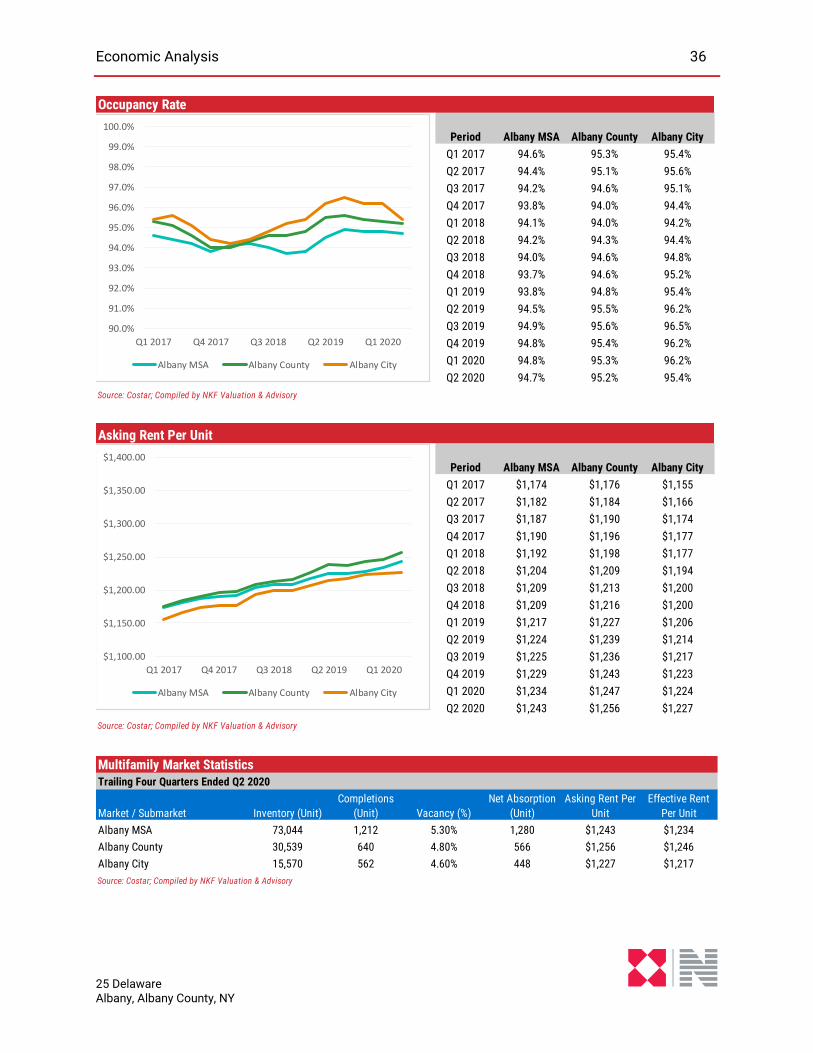
Economic Analysis 36
25 Delaware Albany, Albany County, NY
Period Albany MSA Albany County Albany City
Q1 2017 94.6% 95.3% 95.4%
Q2 2017 94.4% 95.1% 95.6%
Q3 2017 94.2% 94.6% 95.1%
Q4 2017 93.8% 94.0% 94.4%
Q1 2018 94.1% 94.0% 94.2%
Q2 2018 94.2% 94.3% 94.4%
Q3 2018 94.0% 94.6% 94.8%
Q4 2018 93.7% 94.6% 95.2%
Q1 2019 93.8% 94.8% 95.4%
Q2 2019 94.5% 95.5% 96.2%
Q3 2019 94.9% 95.6% 96.5%
Q4 2019 94.8% 95.4% 96.2%
Q1 2020 94.8% 95.3% 96.2%
Q2 2020 94.7% 95.2% 95.4%
Source: Costar; Compiled by NKF Valuation & Advisory
Occupancy Rate
90.0%
91.0%
92.0%
93.0%
94.0%
95.0%
96.0%
97.0%
98.0%
99.0%
100.0%
Q1 2017 Q4 2017 Q3 2018 Q2 2019 Q1 2020
Albany MSA Albany County Albany City
Period Albany MSA Albany County Albany City
Q1 2017 $1,174 $1,176 $1,155
Q2 2017 $1,182 $1,184 $1,166
Q3 2017 $1,187 $1,190 $1,174
Q4 2017 $1,190 $1,196 $1,177
Q1 2018 $1,192 $1,198 $1,177
Q2 2018 $1,204 $1,209 $1,194
Q3 2018 $1,209 $1,213 $1,200
Q4 2018 $1,209 $1,216 $1,200
Q1 2019 $1,217 $1,227 $1,206
Q2 2019 $1,224 $1,239 $1,214
Q3 2019 $1,225 $1,236 $1,217
Q4 2019 $1,229 $1,243 $1,223
Q1 2020 $1,234 $1,247 $1,224
Q2 2020 $1,243 $1,256 $1,227
Source: Costar; Compiled by NKF Valuation & Advisory
Asking Rent Per Unit
$1,100.00
$1,150.00
$1,200.00
$1,250.00
$1,300.00
$1,350.00
$1,400.00
Q1 2017 Q4 2017 Q3 2018 Q2 2019 Q1 2020
Albany MSA Albany County Albany City
Trailing Four Quarters Ended Q2 2020
Market / Submarket Inventory (Unit)
Completions
(Unit) Vacancy (%)
Net Absorption
(Unit)
Asking Rent Per
Unit
Effective Rent
Per Unit
Albany MSA 73,044 1,212 5.30% 1,280 $1,243 $1,234
Albany County 30,539 640 4.80% 566 $1,256 $1,246
Albany City 15,570 562 4.60% 448 $1,227 $1,217
Source: Costar; Compiled by NKF Valuation & Advisory
Multifamily Market Statistics
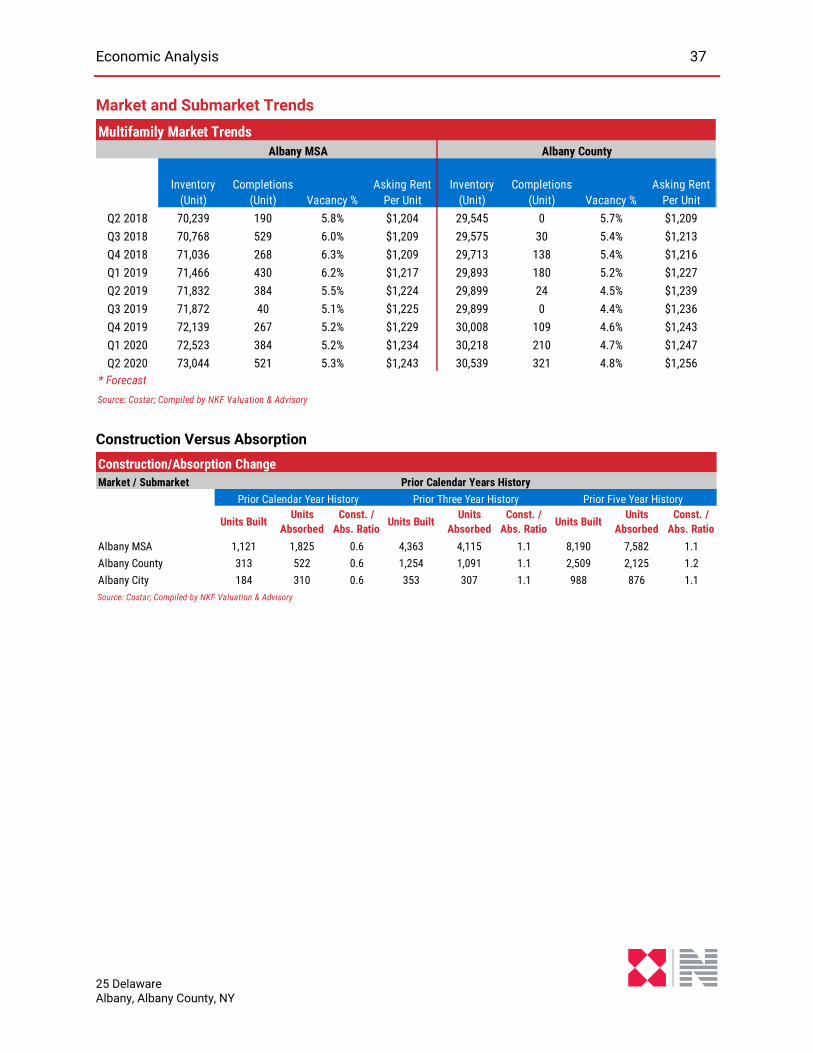
Economic Analysis 37
25 Delaware Albany, Albany County, NY
Market and Submarket Trends
Construction Versus Absorption
Inventory
(Unit)
Completions
(Unit) Vacancy %
Asking Rent
Per Unit
Inventory
(Unit)
Completions
(Unit) Vacancy %
Asking Rent
Per Unit
Q2 2018 70,239 190 5.8% $1,204 29,545 0 5.7% $1,209
Q3 2018 70,768 529 6.0% $1,209 29,575 30 5.4% $1,213
Q4 2018 71,036 268 6.3% $1,209 29,713 138 5.4% $1,216
Q1 2019 71,466 430 6.2% $1,217 29,893 180 5.2% $1,227
Q2 2019 71,832 384 5.5% $1,224 29,899 24 4.5% $1,239
Q3 2019 71,872 40 5.1% $1,225 29,899 0 4.4% $1,236
Q4 2019 72,139 267 5.2% $1,229 30,008 109 4.6% $1,243
Q1 2020 72,523 384 5.2% $1,234 30,218 210 4.7% $1,247
Q2 2020 73,044 521 5.3% $1,243 30,539 321 4.8% $1,256
* Forecast
Source: Costar; Compiled by NKF Valuation & Advisory
Albany MSA Albany County
Multifamily Market Trends
Market / Submarket
Units BuiltUnits
Absorbed
Const. /
Abs. RatioUnits Built
Units
Absorbed
Const. /
Abs. RatioUnits Built
Units
Absorbed
Const. /
Abs. Ratio
Albany MSA 1,121 1,825 0.6 4,363 4,115 1.1 8,190 7,582 1.1
Albany County 313 522 0.6 1,254 1,091 1.1 2,509 2,125 1.2
Albany City 184 310 0.6 353 307 1.1 988 876 1.1
Source: Costar; Compiled by NKF Valuation & Advisory
Prior Calendar Years History
Construction/Absorption Change
Prior Calendar Year History Prior Three Year History Prior Five Year History
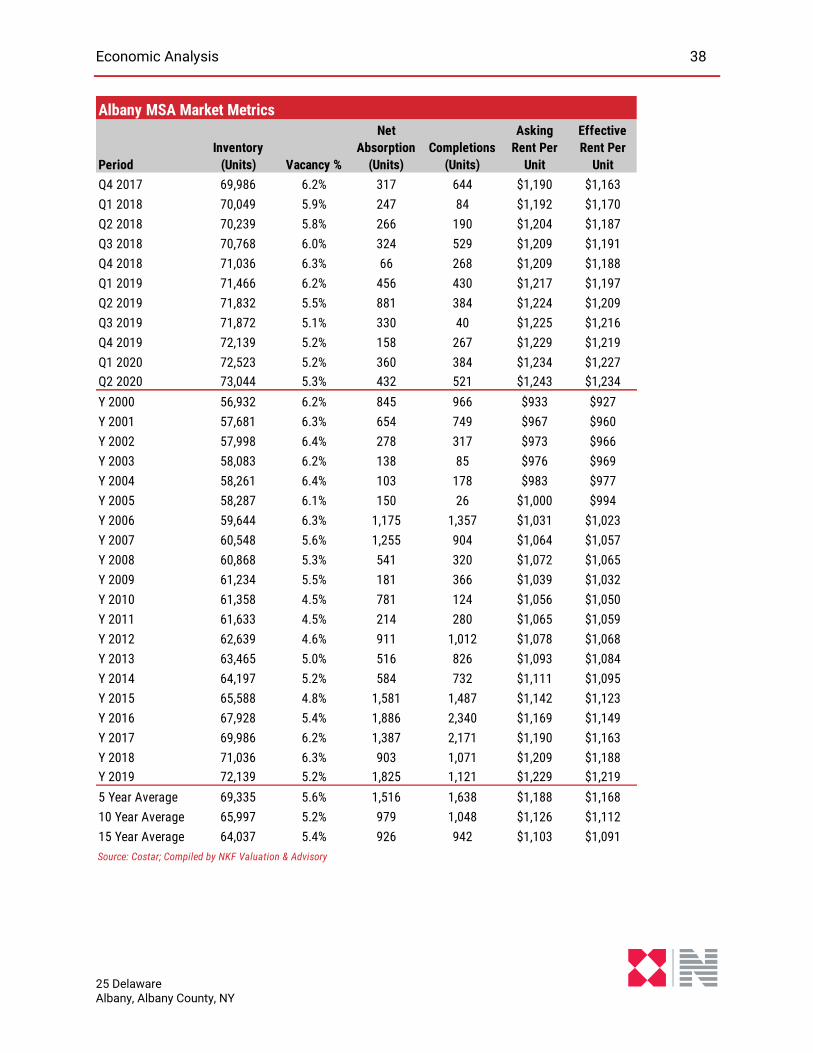
Economic Analysis 38
25 Delaware Albany, Albany County, NY
Albany MSA Market Metrics
Period
Inventory
(Units) Vacancy %
Net
Absorption
(Units)
Completions
(Units)
Asking
Rent Per
Unit
Effective
Rent Per
Unit
Q4 2017 69,986 6.2% 317 644 $1,190 $1,163
Q1 2018 70,049 5.9% 247 84 $1,192 $1,170
Q2 2018 70,239 5.8% 266 190 $1,204 $1,187
Q3 2018 70,768 6.0% 324 529 $1,209 $1,191
Q4 2018 71,036 6.3% 66 268 $1,209 $1,188
Q1 2019 71,466 6.2% 456 430 $1,217 $1,197
Q2 2019 71,832 5.5% 881 384 $1,224 $1,209
Q3 2019 71,872 5.1% 330 40 $1,225 $1,216
Q4 2019 72,139 5.2% 158 267 $1,229 $1,219
Q1 2020 72,523 5.2% 360 384 $1,234 $1,227
Q2 2020 73,044 5.3% 432 521 $1,243 $1,234
Y 2000 56,932 6.2% 845 966 $933 $927
Y 2001 57,681 6.3% 654 749 $967 $960
Y 2002 57,998 6.4% 278 317 $973 $966
Y 2003 58,083 6.2% 138 85 $976 $969
Y 2004 58,261 6.4% 103 178 $983 $977
Y 2005 58,287 6.1% 150 26 $1,000 $994
Y 2006 59,644 6.3% 1,175 1,357 $1,031 $1,023
Y 2007 60,548 5.6% 1,255 904 $1,064 $1,057
Y 2008 60,868 5.3% 541 320 $1,072 $1,065
Y 2009 61,234 5.5% 181 366 $1,039 $1,032
Y 2010 61,358 4.5% 781 124 $1,056 $1,050
Y 2011 61,633 4.5% 214 280 $1,065 $1,059
Y 2012 62,639 4.6% 911 1,012 $1,078 $1,068
Y 2013 63,465 5.0% 516 826 $1,093 $1,084
Y 2014 64,197 5.2% 584 732 $1,111 $1,095
Y 2015 65,588 4.8% 1,581 1,487 $1,142 $1,123
Y 2016 67,928 5.4% 1,886 2,340 $1,169 $1,149
Y 2017 69,986 6.2% 1,387 2,171 $1,190 $1,163
Y 2018 71,036 6.3% 903 1,071 $1,209 $1,188
Y 2019 72,139 5.2% 1,825 1,121 $1,229 $1,219
5 Year Average 69,335 5.6% 1,516 1,638 $1,188 $1,168
10 Year Average 65,997 5.2% 979 1,048 $1,126 $1,112
15 Year Average 64,037 5.4% 926 942 $1,103 $1,091
Source: Costar; Compiled by NKF Valuation & Advisory
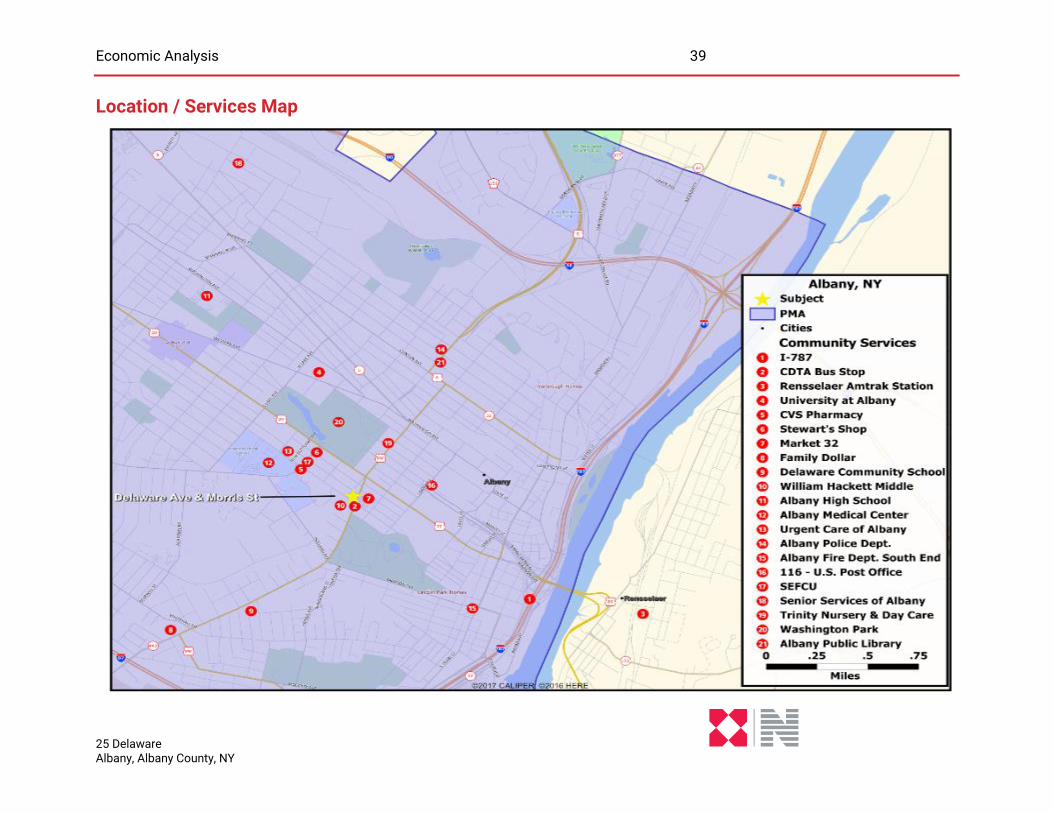
Economic Analysis 39
25 Delaware Albany, Albany County, NY
Location / Services Map
Economic Analysis 40
25 Delaware Albany, Albany County, NY
Immediate Neighborhood The subject is within the Park South neighborhood of the city, west of downtown, the New York
State Capitol and Empire State Plaza, directly north of Albany Med and the Stratton VA. The
immediate subject has larger land uses of Washington/Lincoln Parks, Russell Sage College, and
Empire State Plaza among smaller commercial and residential. Neighborhood boundaries are:
Delaware Avenue to the East
South Lake Avenue to the West
Madison Avenue to the North
Myrtle Avenue to the South.
Surrounding Property Uses
Direction Adjoining Property Uses Patterns/Trends
To the North:
Boys and Girls Club, 1-4 family residential. Dana Park, neighborhood commercial on Delaware and Madison Ave
Stable / no change
To the South:
William S. Hackett Middle School, 1-4 family residential, Thomas O’Brien Academy, Lincoln Park
Stable / no change
To the East:
Market 32, 1-4 family residential and multifamily uses, New York State Museum, The Egg, Corning Tower, Times Union
Ongoing new development
To the West:
1-4 family/mixed use buildings, Stratton VA/ Albany Med, Russell Sage College and dining/small commercial uses
Ongoing new development
Neighborhoods surrounding Albany Med have experienced ongoing development related to the
medical campus and associated buildings, in addition to newly developed multifamily projects
and renovations to existing buildings for increased/improved residential offerings.
Property uses in the immediate subject consist mostly of early 1900s era row house and mixed-
use walkup buildings reflecting a wide range of quality/condition with some reflecting recent
renovations and comparatively higher end apartments, others reflecting more basic maintenance
and some indicating deferred maintenance and vacancy. Affordable multifamily options include
multiple Albany Housing Authority properties including Creighton-Storey, Eagle Court/Jared Holt,
Capital Greens and Capital South. The Lincoln Homes and Steamboat Square properties to the
southeast have been offered by the AHA for mixed-income redevelopment.
The subject neighborhood is highly walkable with a walkscore of 88 indicating most errands can
be accomplished on foot. There is a bus stop at the site that provides multiple routes throughout
the city and provides direct access to the Amtrak station in Rensselaer across the river. Delaware
Avenue serves as a main north-south route in this immediate part of the city, with Madison and
Washington serving as main east-west routes into downtown and connection to I-787.
Economic Analysis 41
25 Delaware Albany, Albany County, NY
Commercial services in the immediate area relate to a new higher end grocery store, local
restaurants/retailers on Delaware, a pharmacy, national brand fast food and hotels farther south
on New Scotland. The Times Union Center and the Egg are the largest entertainment and event
venues in the city and coupled with New York State and Albany municipal offices, form a base
employment center for the region. additional employment centers are to the south related to the
hospital, the DMV, NYSOPWDD and the multiple schools/colleges. Additional employment
options are generated by the ongoing redevelopment of existing buildings for new unrestricted
market rate housing at the Kenmore, Abraxas, Columbia Street and Broadway.
Recreation: Lincoln Park was established as Albany's first public playground in 1900. The park features
Albany's only outdoor non-wading swimming pool, multiple tennis, basketball and handball
courts, playgrounds, ball fields. The youth fitness center includes a gym, weight room, activities
such as wrestling, karate, dance, and cardio. In the winter the park is open for snowshoeing, cross
country skiing and sledding.
Medical Facilities: Albany Medical Center is at 43 New Scotland Avenue farther to the southwest on Delaware. In
addition to these medical centers, there are a wide variety of medical offices available in the area.
Schools
The property is in the Albany City School District and nearby schools include:
Day Care: 230 Green Street
Elementary School: Griffen Elementary, PK-5
Middle School: William S. Hackett Middle, 6-8
High School: Albany High, 9-12
The district is identified as a Difficult Development Area by HCR. The Albany City School District
is ranked 424th (out of 431 public school districts) in the 2019 Upstate New York School District
Rankings by the Business First business journal. The Albany City School District ranks 772nd out
of 810 districts in New York State according to SchoolDigger.com.
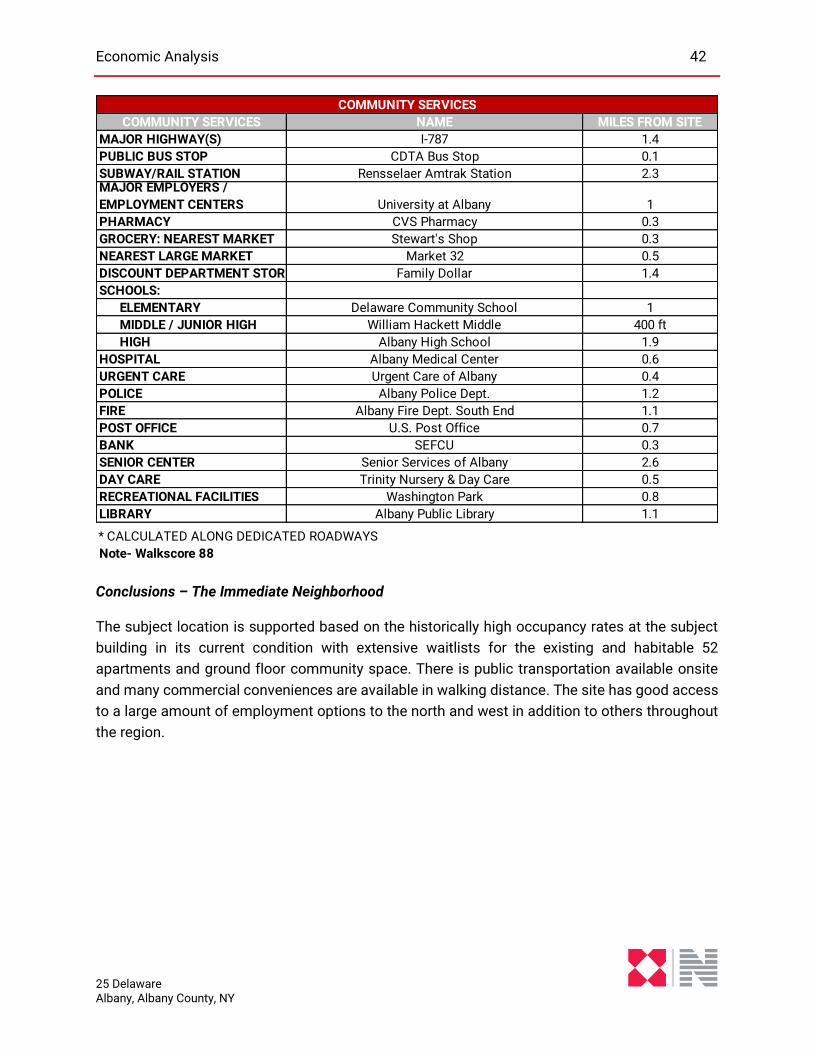
Economic Analysis 42
25 Delaware Albany, Albany County, NY
Conclusions – The Immediate Neighborhood The subject location is supported based on the historically high occupancy rates at the subject
building in its current condition with extensive waitlists for the existing and habitable 52
apartments and ground floor community space. There is public transportation available onsite
and many commercial conveniences are available in walking distance. The site has good access
to a large amount of employment options to the north and west in addition to others throughout
the region.
COMMUNITY SERVICES NAME MILES FROM SITE
MAJOR HIGHWAY(S) I-787 1.4
PUBLIC BUS STOP CDTA Bus Stop 0.1
SUBWAY/RAIL STATION Rensselaer Amtrak Station 2.3MAJOR EMPLOYERS /
EMPLOYMENT CENTERS University at Albany 1
PHARMACY CVS Pharmacy 0.3
GROCERY: NEAREST MARKET Stewart's Shop 0.3
NEAREST LARGE MARKET Market 32 0.5
DISCOUNT DEPARTMENT STORE Family Dollar 1.4
SCHOOLS:
ELEMENTARY Delaware Community School 1
MIDDLE / JUNIOR HIGH William Hackett Middle 400 ft
HIGH Albany High School 1.9
HOSPITAL Albany Medical Center 0.6
URGENT CARE Urgent Care of Albany 0.4
POLICE Albany Police Dept. 1.2
FIRE Albany Fire Dept. South End 1.1
POST OFFICE U.S. Post Office 0.7
BANK SEFCU 0.3
SENIOR CENTER Senior Services of Albany 2.6
DAY CARE Trinity Nursery & Day Care 0.5
RECREATIONAL FACILITIES Washington Park 0.8
LIBRARY Albany Public Library 1.1
* CALCULATED ALONG DEDICATED ROADWAYS
Note- Walkscore 88
COMMUNITY SERVICES
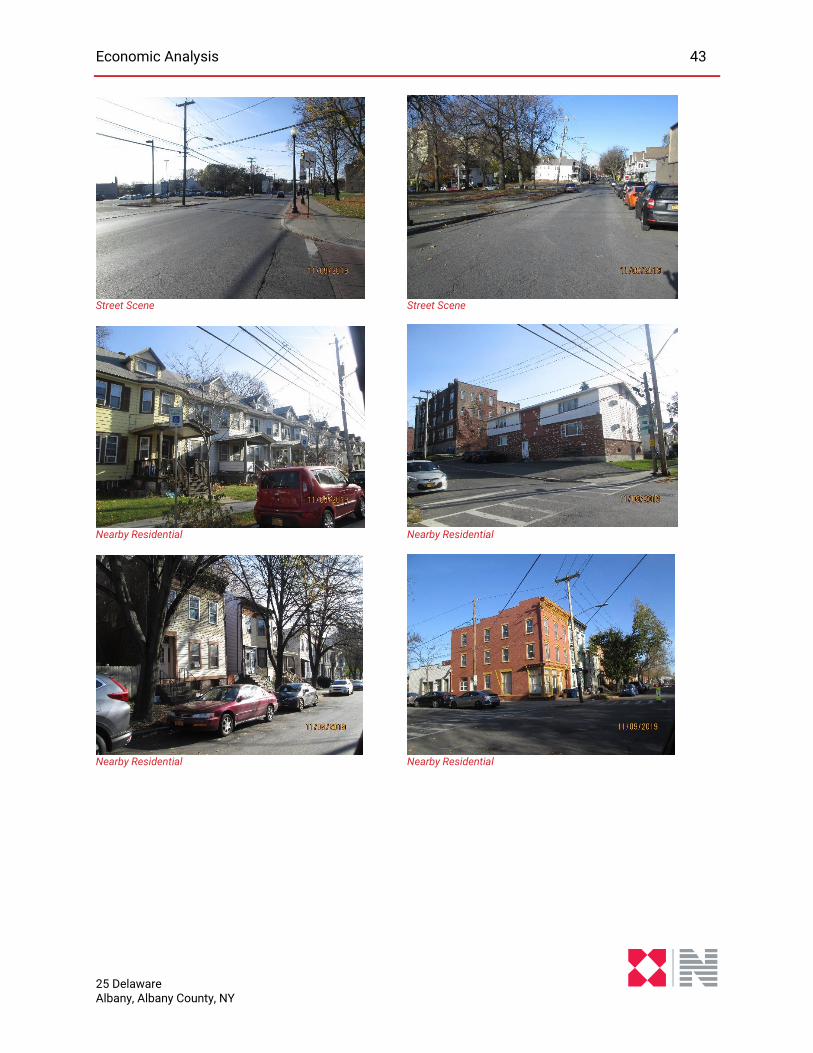
Economic Analysis 43
25 Delaware Albany, Albany County, NY
Street Scene Street Scene
Nearby Residential Nearby Residential
Nearby Residential Nearby Residential
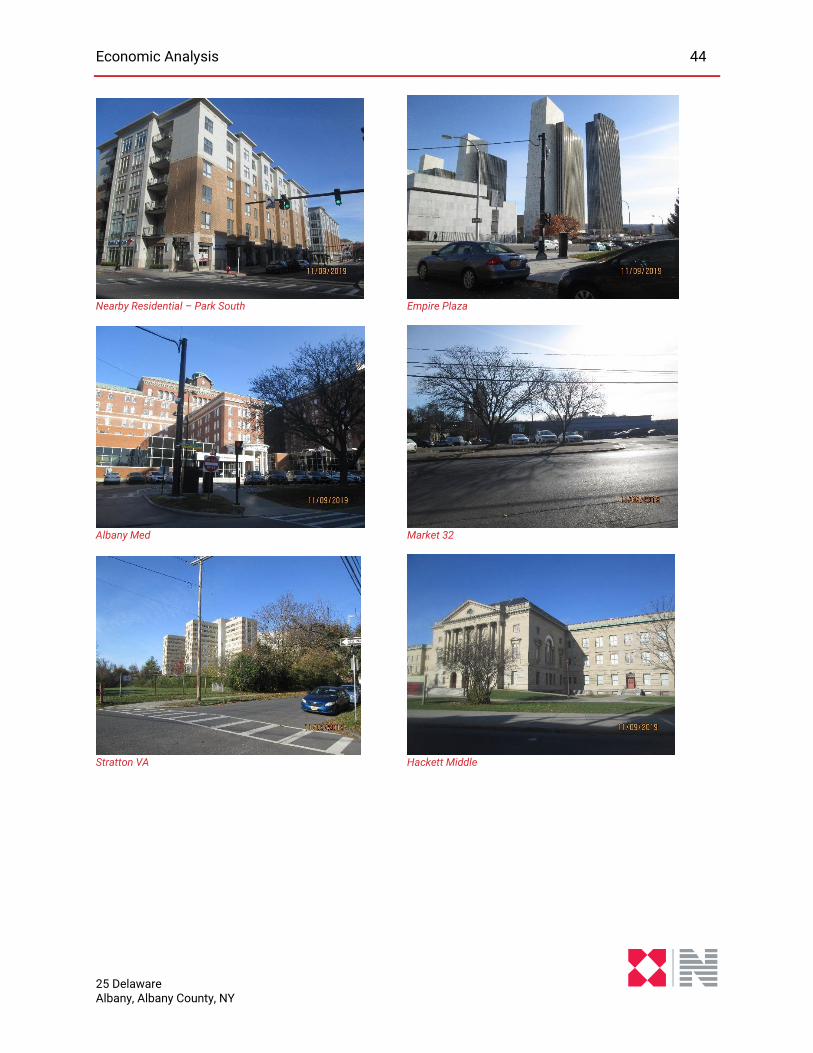
Economic Analysis 44
25 Delaware Albany, Albany County, NY
Nearby Residential – Park South Empire Plaza
Albany Med Market 32
Stratton VA Hackett Middle
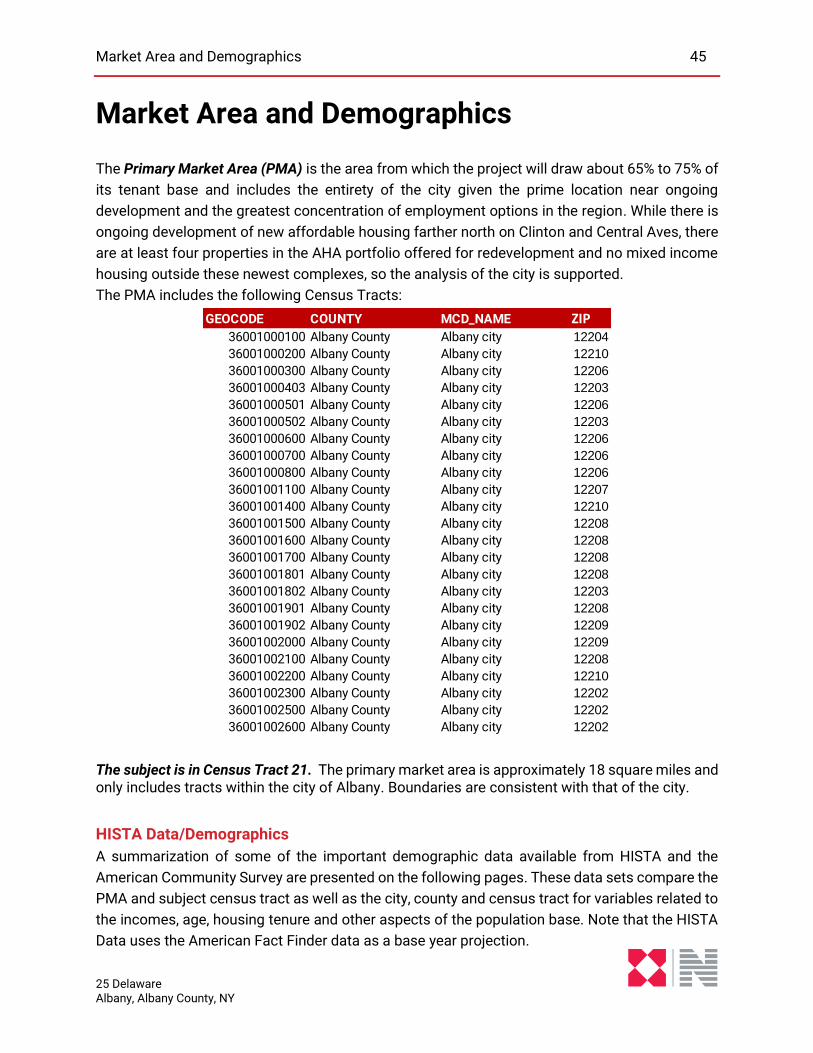
Market Area and Demographics 45
25 Delaware Albany, Albany County, NY
Market Area and Demographics
The Primary Market Area (PMA) is the area from which the project will draw about 65% to 75% of
its tenant base and includes the entirety of the city given the prime location near ongoing
development and the greatest concentration of employment options in the region. While there is
ongoing development of new affordable housing farther north on Clinton and Central Aves, there
are at least four properties in the AHA portfolio offered for redevelopment and no mixed income
housing outside these newest complexes, so the analysis of the city is supported.
The PMA includes the following Census Tracts:
The subject is in Census Tract 21. The primary market area is approximately 18 square miles and only includes tracts within the city of Albany. Boundaries are consistent with that of the city.
HISTA Data/Demographics
A summarization of some of the important demographic data available from HISTA and the
American Community Survey are presented on the following pages. These data sets compare the
PMA and subject census tract as well as the city, county and census tract for variables related to
the incomes, age, housing tenure and other aspects of the population base. Note that the HISTA
Data uses the American Fact Finder data as a base year projection.
GEOCODE COUNTY MCD_NAME ZIP36001000100 Albany County Albany city 12204
36001000200 Albany County Albany city 12210
36001000300 Albany County Albany city 12206
36001000403 Albany County Albany city 12203
36001000501 Albany County Albany city 12206
36001000502 Albany County Albany city 12203
36001000600 Albany County Albany city 12206
36001000700 Albany County Albany city 12206
36001000800 Albany County Albany city 12206
36001001100 Albany County Albany city 12207
36001001400 Albany County Albany city 12210
36001001500 Albany County Albany city 12208
36001001600 Albany County Albany city 12208
36001001700 Albany County Albany city 12208
36001001801 Albany County Albany city 12208
36001001802 Albany County Albany city 12203
36001001901 Albany County Albany city 12208
36001001902 Albany County Albany city 12209
36001002000 Albany County Albany city 12209
36001002100 Albany County Albany city 12208
36001002200 Albany County Albany city 12210
36001002300 Albany County Albany city 12202
36001002500 Albany County Albany city 12202
36001002600 Albany County Albany city 12202
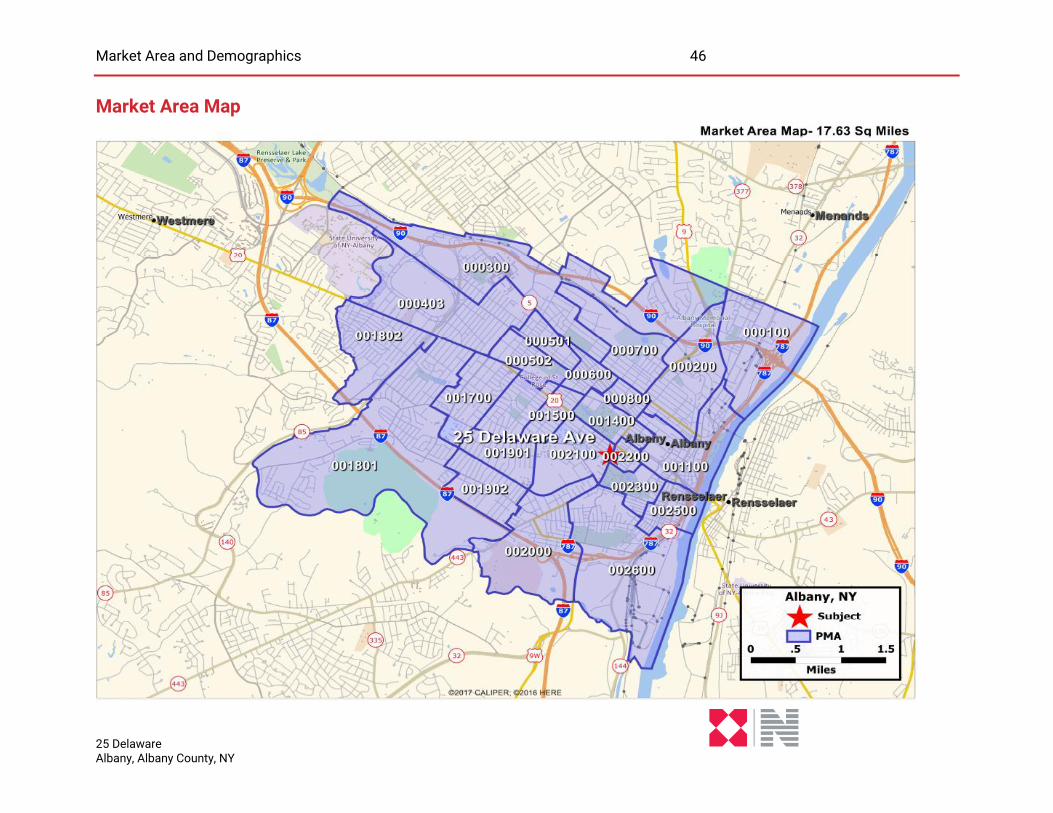
Market Area and Demographics 46
25 Delaware Albany, Albany County, NY
Market Area Map
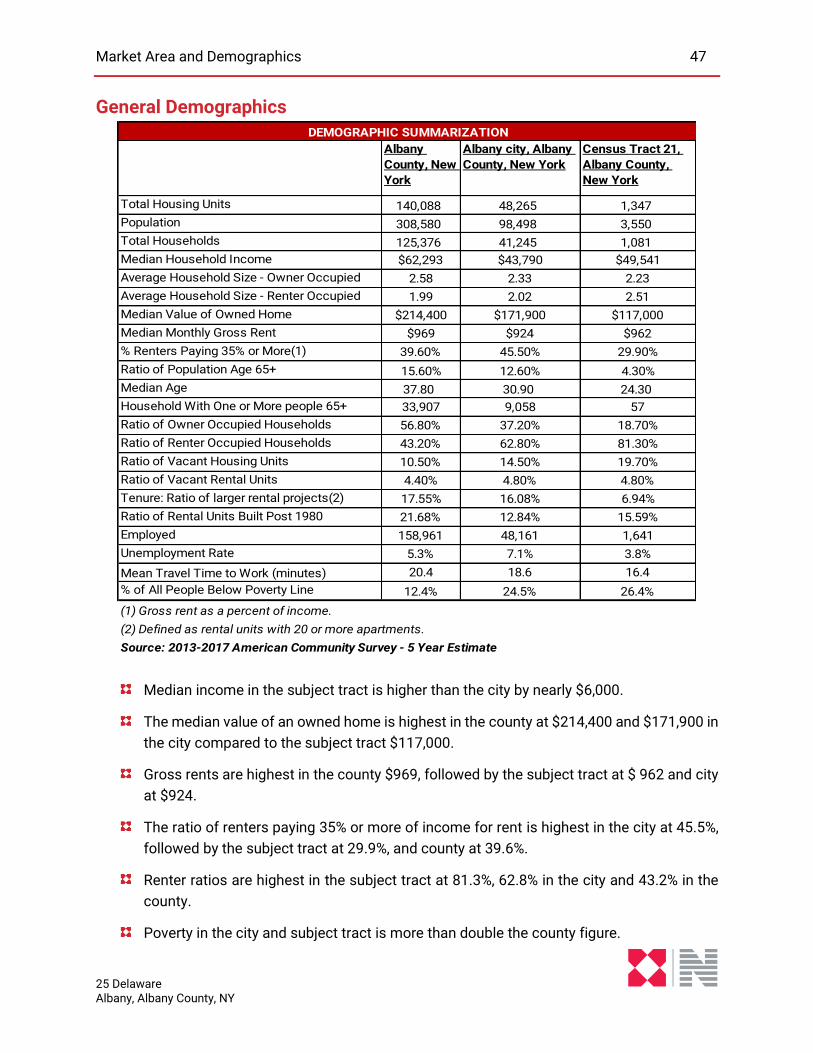
Market Area and Demographics 47
25 Delaware Albany, Albany County, NY
General Demographics
Median income in the subject tract is higher than the city by nearly $6,000.
The median value of an owned home is highest in the county at $214,400 and $171,900 in
the city compared to the subject tract $117,000.
Gross rents are highest in the county $969, followed by the subject tract at $ 962 and city
at $924.
The ratio of renters paying 35% or more of income for rent is highest in the city at 45.5%,
followed by the subject tract at 29.9%, and county at 39.6%.
Renter ratios are highest in the subject tract at 81.3%, 62.8% in the city and 43.2% in the
county.
Poverty in the city and subject tract is more than double the county figure.
Albany
County, New
York
Albany city, Albany
County, New York
Census Tract 21,
Albany County,
New York
Total Housing Units 140,088 48,265 1,347
Population 308,580 98,498 3,550
Total Households 125,376 41,245 1,081
Median Household Income $62,293 $43,790 $49,541
Average Household Size - Owner Occupied 2.58 2.33 2.23
Average Household Size - Renter Occupied 1.99 2.02 2.51
Median Value of Owned Home $214,400 $171,900 $117,000
Median Monthly Gross Rent $969 $924 $962
% Renters Paying 35% or More(1) 39.60% 45.50% 29.90%
Ratio of Population Age 65+ 15.60% 12.60% 4.30%
Median Age 37.80 30.90 24.30
Household With One or More people 65+ 33,907 9,058 57
Ratio of Owner Occupied Households 56.80% 37.20% 18.70%
Ratio of Renter Occupied Households 43.20% 62.80% 81.30%
Ratio of Vacant Housing Units 10.50% 14.50% 19.70%
Ratio of Vacant Rental Units 4.40% 4.80% 4.80%
Tenure: Ratio of larger rental projects(2) 17.55% 16.08% 6.94%
Ratio of Rental Units Built Post 1980 21.68% 12.84% 15.59%
Employed 158,961 48,161 1,641
Unemployment Rate 5.3% 7.1% 3.8%
Mean Travel Time to Work (minutes) 20.4 18.6 16.4
% of All People Below Poverty Line 12.4% 24.5% 26.4%
(1) Gross rent as a percent of income.
(2) Defined as rental units with 20 or more apartments.
Source: 2013-2017 American Community Survey - 5 Year Estimate
DEMOGRAPHIC SUMMARIZATION
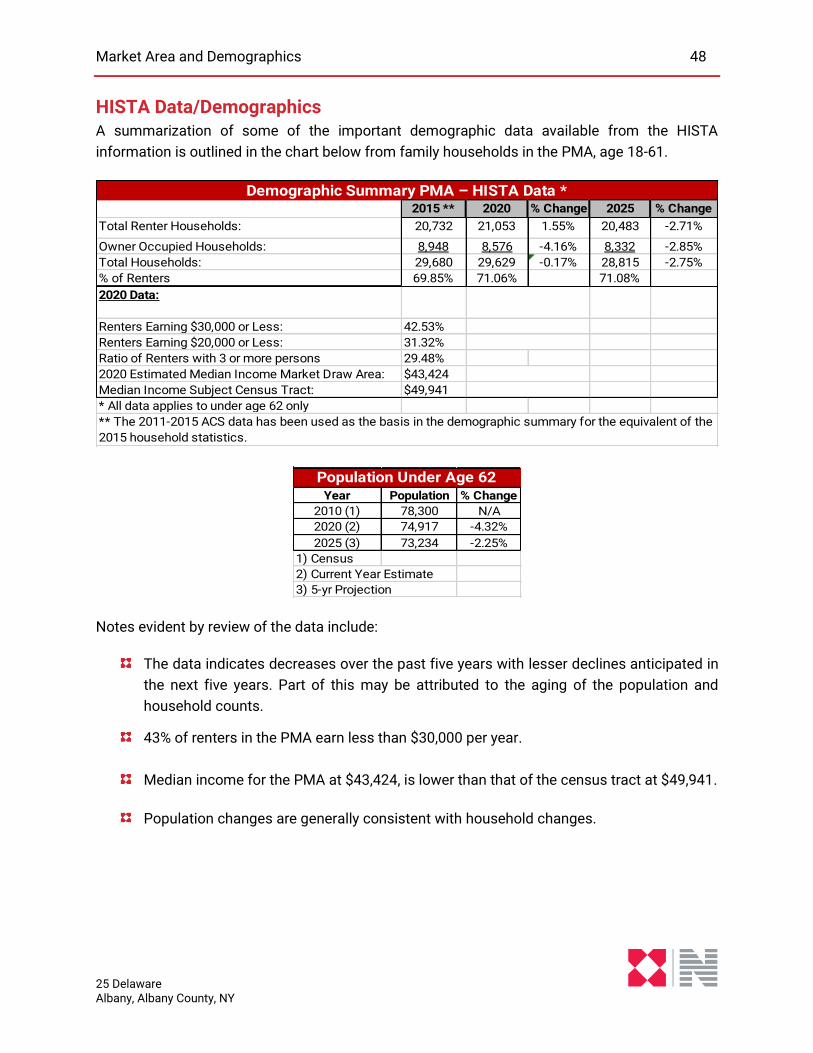
Market Area and Demographics 48
25 Delaware Albany, Albany County, NY
HISTA Data/Demographics A summarization of some of the important demographic data available from the HISTA
information is outlined in the chart below from family households in the PMA, age 18-61.
Notes evident by review of the data include:
The data indicates decreases over the past five years with lesser declines anticipated in
the next five years. Part of this may be attributed to the aging of the population and
household counts.
43% of renters in the PMA earn less than $30,000 per year.
Median income for the PMA at $43,424, is lower than that of the census tract at $49,941.
Population changes are generally consistent with household changes.
2015 ** 2020 % Change 2025 % Change
Total Renter Households: 20,732 21,053 1.55% 20,483 -2.71%
Owner Occupied Households: 8,948 8,576 -4.16% 8,332 -2.85%
Total Households: 29,680 29,629 -0.17% 28,815 -2.75%
% of Renters 69.85% 71.06% 71.08%
Renters Earning $30,000 or Less: 42.53%
Renters Earning $20,000 or Less: 31.32%
Ratio of Renters with 3 or more persons 29.48%
2020 Estimated Median Income Market Draw Area: $43,424
Median Income Subject Census Tract: $49,941
* All data applies to under age 62 only
** The 2011-2015 ACS data has been used as the basis in the demographic summary for the equivalent of the
2015 household statistics.
Demographic Summary PMA – HISTA Data *
2020 Data:
Year Population % Change
2010 (1) 78,300 N/A
2020 (2) 74,917 -4.32%
2025 (3) 73,234 -2.25%
1) Census
2) Current Year Estimate
3) 5-yr Projection
Population Under Age 62
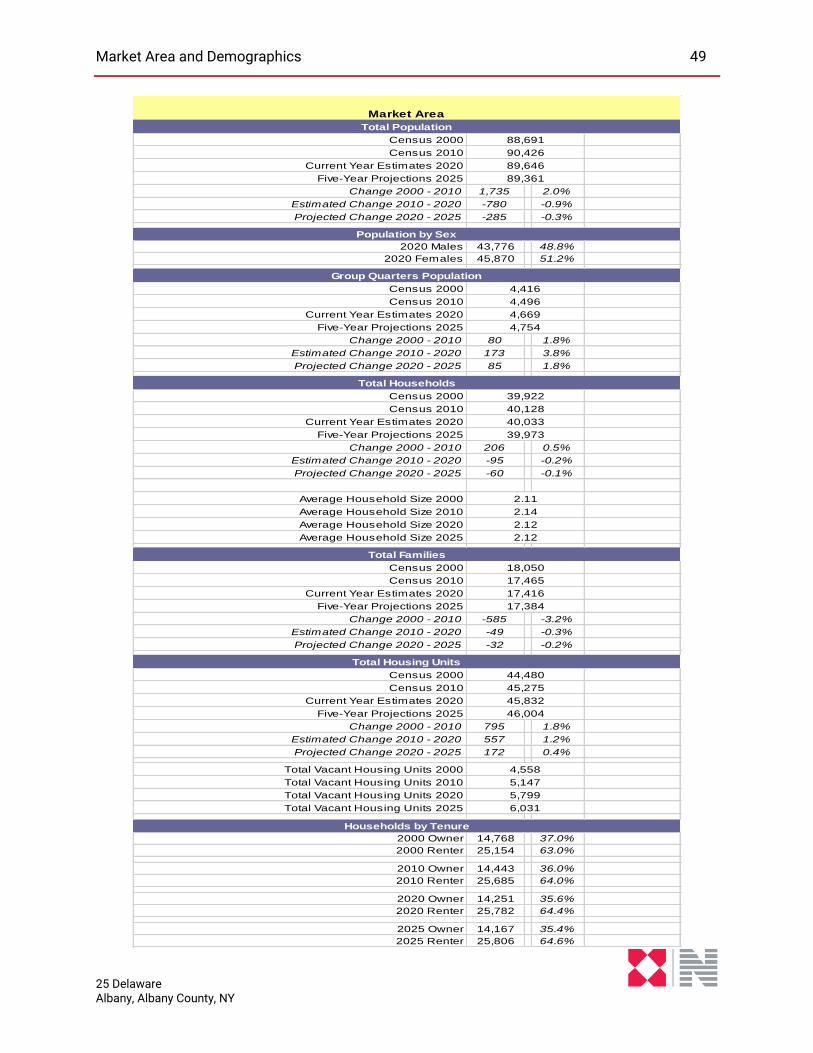
Market Area and Demographics 49
25 Delaware Albany, Albany County, NY
Census 2000
Census 2010
Current Year Estimates 2020
Five-Year Projections 2025
Change 2000 - 2010 1,735 2.0%
Estimated Change 2010 - 2020 -780 -0.9%
Projected Change 2020 - 2025 -285 -0.3%
2020 Males 43,776 48.8%
2020 Females 45,870 51.2%
Census 2000
Census 2010
Current Year Estimates 2020
Five-Year Projections 2025
Change 2000 - 2010 80 1.8%
Estimated Change 2010 - 2020 173 3.8%
Projected Change 2020 - 2025 85 1.8%
Census 2000
Census 2010
Current Year Estimates 2020
Five-Year Projections 2025
Change 2000 - 2010 206 0.5%
Estimated Change 2010 - 2020 -95 -0.2%
Projected Change 2020 - 2025 -60 -0.1%
Average Household Size 2000
Average Household Size 2010
Average Household Size 2020
Average Household Size 2025
Census 2000
Census 2010
Current Year Estimates 2020
Five-Year Projections 2025
Change 2000 - 2010 -585 -3.2%
Estimated Change 2010 - 2020 -49 -0.3%
Projected Change 2020 - 2025 -32 -0.2%
Census 2000
Census 2010
Current Year Estimates 2020
Five-Year Projections 2025
Change 2000 - 2010 795 1.8%
Estimated Change 2010 - 2020 557 1.2%
Projected Change 2020 - 2025 172 0.4%
Total Vacant Housing Units 2000
Total Vacant Housing Units 2010
Total Vacant Housing Units 2020
Total Vacant Housing Units 2025
2000 Owner 14,768 37.0%
2000 Renter 25,154 63.0%
2010 Owner 14,443 36.0%
2010 Renter 25,685 64.0%
2020 Owner 14,251 35.6%
2020 Renter 25,782 64.4%
2025 Owner 14,167 35.4%
2025 Renter 25,806 64.6%
4,754
Market Area
Total Population
88,691
90,426
89,646
89,361
Population by Sex
Group Quarters Population
4,416
4,496
4,669
17,465
Total Households
39,922
40,128
40,033
39,973
2.11
2.14
2.12
2.12
Total Families
18,050
Households by Tenure
17,416
17,384
Total Housing Units
44,480
45,275
45,832
46,004
4,558
5,147
5,799
6,031
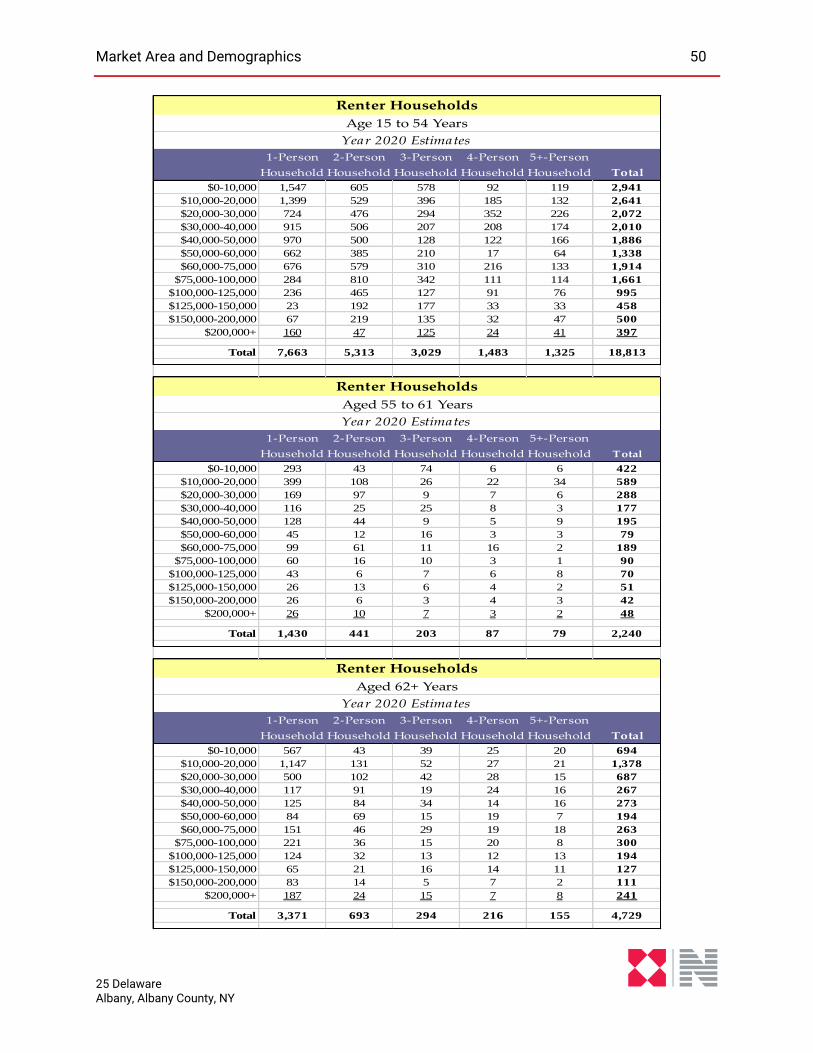
Market Area and Demographics 50
25 Delaware Albany, Albany County, NY
1-Person 2-Person 3-Person 4-Person 5+-Person
Household Household Household Household Household Total
$0-10,000 1,547 605 578 92 119 2,941
$10,000-20,000 1,399 529 396 185 132 2,641
$20,000-30,000 724 476 294 352 226 2,072
$30,000-40,000 915 506 207 208 174 2,010
$40,000-50,000 970 500 128 122 166 1,886
$50,000-60,000 662 385 210 17 64 1,338
$60,000-75,000 676 579 310 216 133 1,914
$75,000-100,000 284 810 342 111 114 1,661
$100,000-125,000 236 465 127 91 76 995
$125,000-150,000 23 192 177 33 33 458
$150,000-200,000 67 219 135 32 47 500
$200,000+ 160 47 125 24 41 397
Total 7,663 5,313 3,029 1,483 1,325 18,813
1-Person 2-Person 3-Person 4-Person 5+-Person
Household Household Household Household Household Total
$0-10,000 293 43 74 6 6 422
$10,000-20,000 399 108 26 22 34 589
$20,000-30,000 169 97 9 7 6 288
$30,000-40,000 116 25 25 8 3 177
$40,000-50,000 128 44 9 5 9 195
$50,000-60,000 45 12 16 3 3 79
$60,000-75,000 99 61 11 16 2 189
$75,000-100,000 60 16 10 3 1 90
$100,000-125,000 43 6 7 6 8 70
$125,000-150,000 26 13 6 4 2 51
$150,000-200,000 26 6 3 4 3 42
$200,000+ 26 10 7 3 2 48
Total 1,430 441 203 87 79 2,240
1-Person 2-Person 3-Person 4-Person 5+-Person
Household Household Household Household Household Total
$0-10,000 567 43 39 25 20 694
$10,000-20,000 1,147 131 52 27 21 1,378
$20,000-30,000 500 102 42 28 15 687
$30,000-40,000 117 91 19 24 16 267
$40,000-50,000 125 84 34 14 16 273
$50,000-60,000 84 69 15 19 7 194
$60,000-75,000 151 46 29 19 18 263
$75,000-100,000 221 36 15 20 8 300
$100,000-125,000 124 32 13 12 13 194
$125,000-150,000 65 21 16 14 11 127
$150,000-200,000 83 14 5 7 2 111
$200,000+ 187 24 15 7 8 241
Total 3,371 693 294 216 155 4,729
Renter Households
Renter Households
Age 15 to 54 Years
Year 2020 Estimates
Aged 55 to 61 Years
Year 2020 Estimates
Renter Households
Aged 62+ Years
Year 2020 Estimates
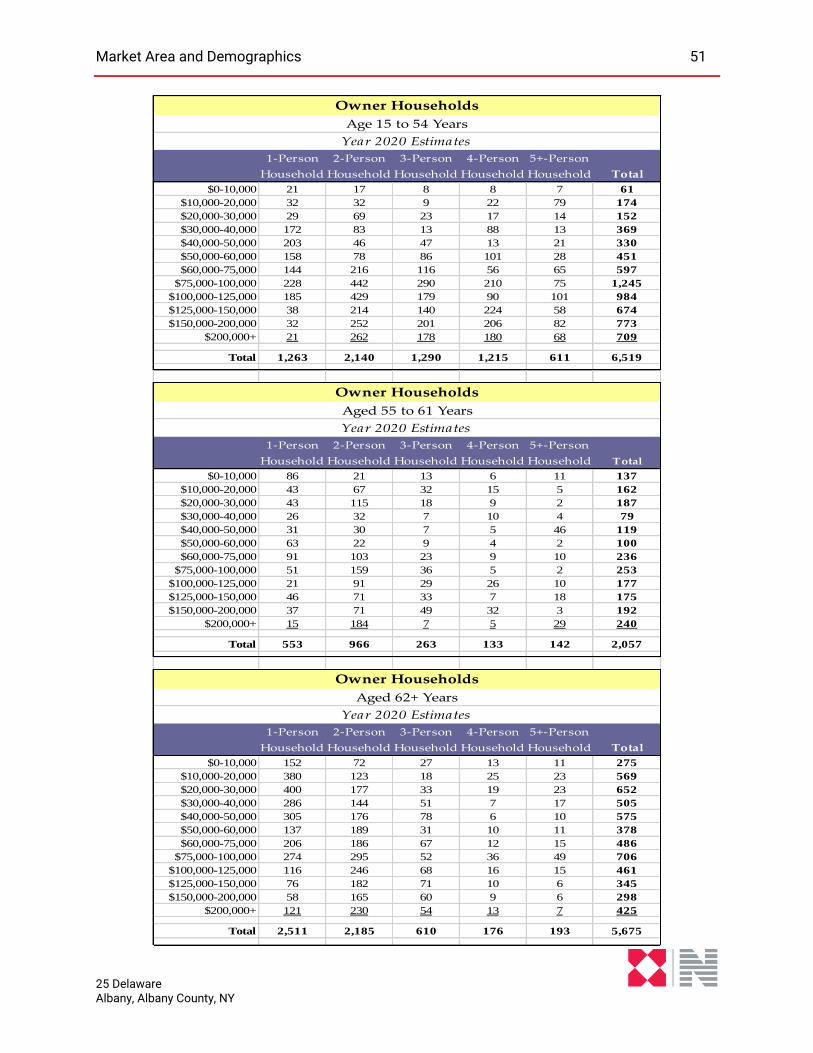
Market Area and Demographics 51
25 Delaware Albany, Albany County, NY
1-Person 2-Person 3-Person 4-Person 5+-Person
Household Household Household Household Household Total
$0-10,000 21 17 8 8 7 61
$10,000-20,000 32 32 9 22 79 174
$20,000-30,000 29 69 23 17 14 152
$30,000-40,000 172 83 13 88 13 369
$40,000-50,000 203 46 47 13 21 330
$50,000-60,000 158 78 86 101 28 451
$60,000-75,000 144 216 116 56 65 597
$75,000-100,000 228 442 290 210 75 1,245
$100,000-125,000 185 429 179 90 101 984
$125,000-150,000 38 214 140 224 58 674
$150,000-200,000 32 252 201 206 82 773
$200,000+ 21 262 178 180 68 709
Total 1,263 2,140 1,290 1,215 611 6,519
1-Person 2-Person 3-Person 4-Person 5+-Person
Household Household Household Household Household Total
$0-10,000 86 21 13 6 11 137
$10,000-20,000 43 67 32 15 5 162
$20,000-30,000 43 115 18 9 2 187
$30,000-40,000 26 32 7 10 4 79
$40,000-50,000 31 30 7 5 46 119
$50,000-60,000 63 22 9 4 2 100
$60,000-75,000 91 103 23 9 10 236
$75,000-100,000 51 159 36 5 2 253
$100,000-125,000 21 91 29 26 10 177
$125,000-150,000 46 71 33 7 18 175
$150,000-200,000 37 71 49 32 3 192
$200,000+ 15 184 7 5 29 240
Total 553 966 263 133 142 2,057
1-Person 2-Person 3-Person 4-Person 5+-Person
Household Household Household Household Household Total
$0-10,000 152 72 27 13 11 275
$10,000-20,000 380 123 18 25 23 569
$20,000-30,000 400 177 33 19 23 652
$30,000-40,000 286 144 51 7 17 505
$40,000-50,000 305 176 78 6 10 575
$50,000-60,000 137 189 31 10 11 378
$60,000-75,000 206 186 67 12 15 486
$75,000-100,000 274 295 52 36 49 706
$100,000-125,000 116 246 68 16 15 461
$125,000-150,000 76 182 71 10 6 345
$150,000-200,000 58 165 60 9 6 298
$200,000+ 121 230 54 13 7 425
Total 2,511 2,185 610 176 193 5,675
Owner Households
Owner Households
Age 15 to 54 Years
Year 2020 Estimates
Aged 55 to 61 Years
Year 2020 Estimates
Owner Households
Aged 62+ Years
Year 2020 Estimates
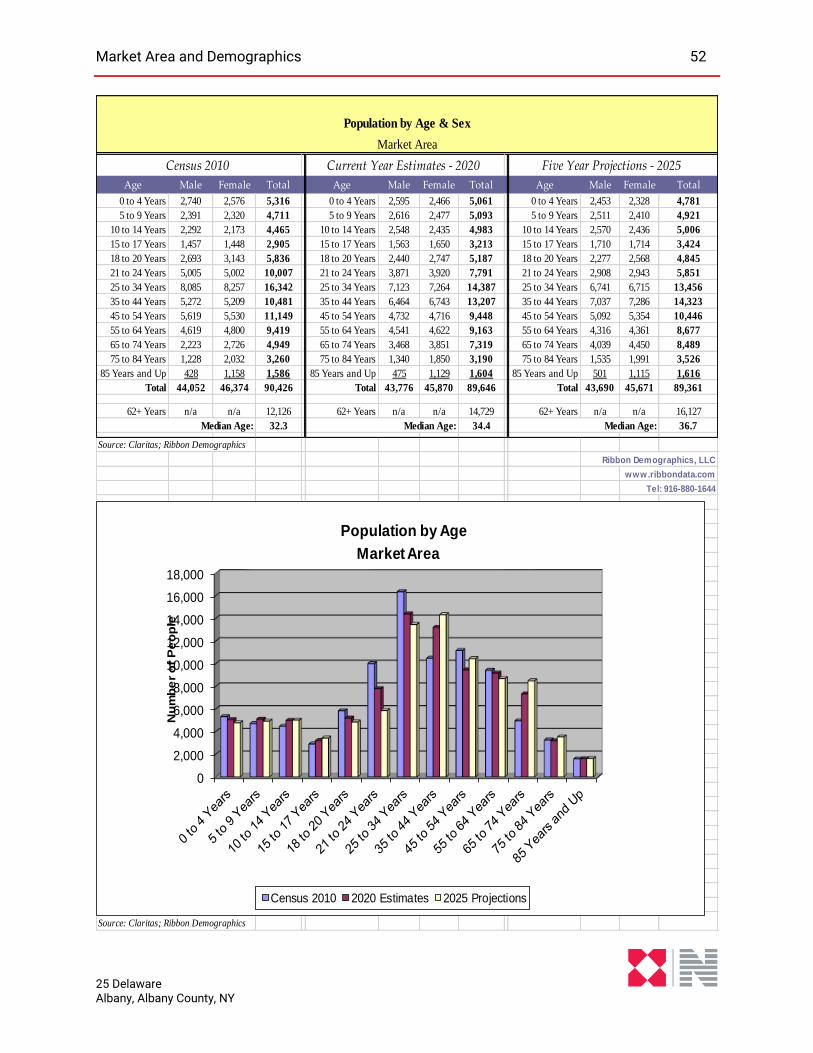
Market Area and Demographics 52
25 Delaware Albany, Albany County, NY
Age Male Female Total Age Male Female Total Age Male Female Total
0 to 4 Years 2,740 2,576 5,316 0 to 4 Years 2,595 2,466 5,061 0 to 4 Years 2,453 2,328 4,781
5 to 9 Years 2,391 2,320 4,711 5 to 9 Years 2,616 2,477 5,093 5 to 9 Years 2,511 2,410 4,921
10 to 14 Years 2,292 2,173 4,465 10 to 14 Years 2,548 2,435 4,983 10 to 14 Years 2,570 2,436 5,006
15 to 17 Years 1,457 1,448 2,905 15 to 17 Years 1,563 1,650 3,213 15 to 17 Years 1,710 1,714 3,424
18 to 20 Years 2,693 3,143 5,836 18 to 20 Years 2,440 2,747 5,187 18 to 20 Years 2,277 2,568 4,845
21 to 24 Years 5,005 5,002 10,007 21 to 24 Years 3,871 3,920 7,791 21 to 24 Years 2,908 2,943 5,851
25 to 34 Years 8,085 8,257 16,342 25 to 34 Years 7,123 7,264 14,387 25 to 34 Years 6,741 6,715 13,456
35 to 44 Years 5,272 5,209 10,481 35 to 44 Years 6,464 6,743 13,207 35 to 44 Years 7,037 7,286 14,323
45 to 54 Years 5,619 5,530 11,149 45 to 54 Years 4,732 4,716 9,448 45 to 54 Years 5,092 5,354 10,446
55 to 64 Years 4,619 4,800 9,419 55 to 64 Years 4,541 4,622 9,163 55 to 64 Years 4,316 4,361 8,677
65 to 74 Years 2,223 2,726 4,949 65 to 74 Years 3,468 3,851 7,319 65 to 74 Years 4,039 4,450 8,489
75 to 84 Years 1,228 2,032 3,260 75 to 84 Years 1,340 1,850 3,190 75 to 84 Years 1,535 1,991 3,526
85 Years and Up 428 1,158 1,586 85 Years and Up 475 1,129 1,604 85 Years and Up 501 1,115 1,616
Total 44,052 46,374 90,426 Total 43,776 45,870 89,646 Total 43,690 45,671 89,361
62+ Years n/a n/a 12,126 62+ Years n/a n/a 14,729 62+ Years n/a n/a 16,127
32.3 34.4 36.7
Source: Claritas; Ribbon Demographics
Ribbon Demographics, LLC
www.ribbondata.com
Tel: 916-880-1644
Source: Claritas; Ribbon Demographics
Population by Age & Sex
Market Area
Census 2010 Current Year Estimates - 2020 Five Year Projections - 2025
Median Age: Median Age: Median Age:
0
2,000
4,000
6,000
8,000
10,000
12,000
14,000
16,000
18,000
Nu
mb
er
of
Pe
op
le
Population by Age
Census 2010 2020 Estimates 2025 Projections
Market Area
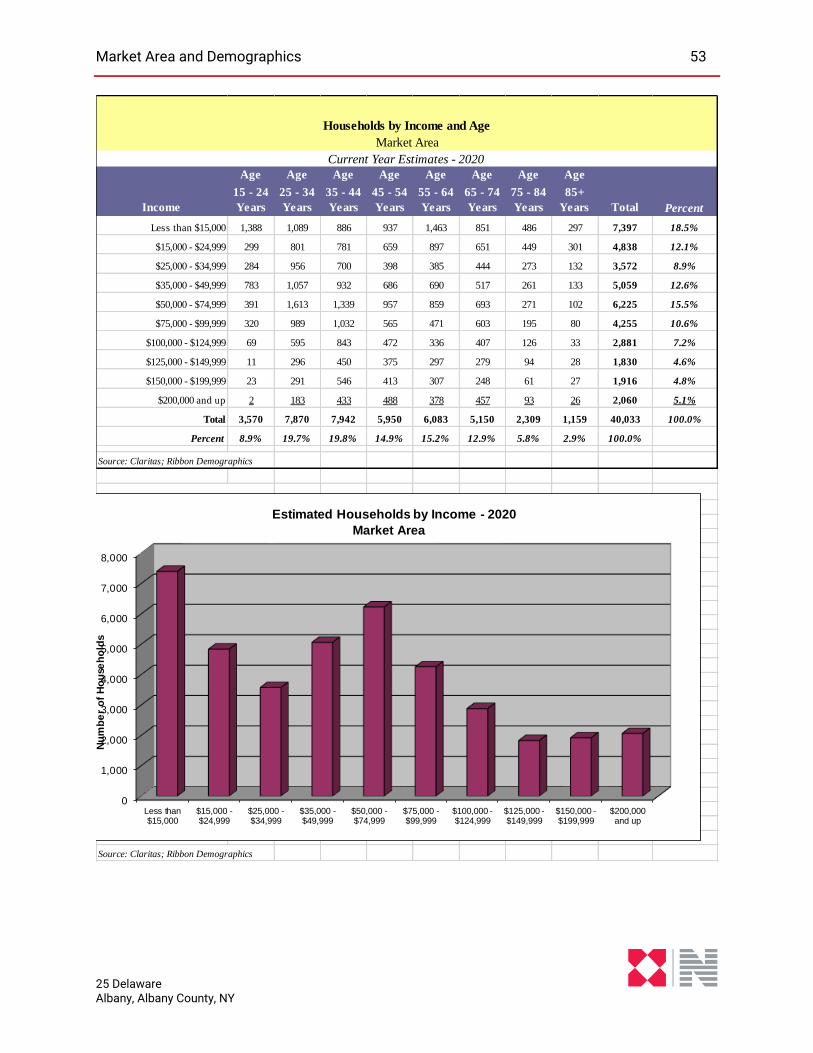
Market Area and Demographics 53
25 Delaware Albany, Albany County, NY
Age Age Age Age Age Age Age Age
Income
15 - 24
Years
25 - 34
Years
35 - 44
Years
45 - 54
Years
55 - 64
Years
65 - 74
Years
75 - 84
Years
85+
Years Total Percent
Less than $15,000 1,388 1,089 886 937 1,463 851 486 297 7,397 18.5%
$15,000 - $24,999 299 801 781 659 897 651 449 301 4,838 12.1%
$25,000 - $34,999 284 956 700 398 385 444 273 132 3,572 8.9%
$35,000 - $49,999 783 1,057 932 686 690 517 261 133 5,059 12.6%
$50,000 - $74,999 391 1,613 1,339 957 859 693 271 102 6,225 15.5%
$75,000 - $99,999 320 989 1,032 565 471 603 195 80 4,255 10.6%
$100,000 - $124,999 69 595 843 472 336 407 126 33 2,881 7.2%
$125,000 - $149,999 11 296 450 375 297 279 94 28 1,830 4.6%
$150,000 - $199,999 23 291 546 413 307 248 61 27 1,916 4.8%
$200,000 and up 2 183 433 488 378 457 93 26 2,060 5.1%
Total 3,570 7,870 7,942 5,950 6,083 5,150 2,309 1,159 40,033 100.0%
Percent 8.9% 19.7% 19.8% 14.9% 15.2% 12.9% 5.8% 2.9% 100.0%
Source: Claritas; Ribbon Demographics
Source: Claritas; Ribbon Demographics
Households by Income and Age
Market Area
Current Year Estimates - 2020
0
1,000
2,000
3,000
4,000
5,000
6,000
7,000
8,000
Less than$15,000
$15,000 -$24,999
$25,000 -$34,999
$35,000 -$49,999
$50,000 -$74,999
$75,000 -$99,999
$100,000 -$124,999
$125,000 -$149,999
$150,000 -$199,999
$200,000and up
Nu
mb
er
of
Ho
use
ho
lds
Estimated Households by Income - 2020
Market Area
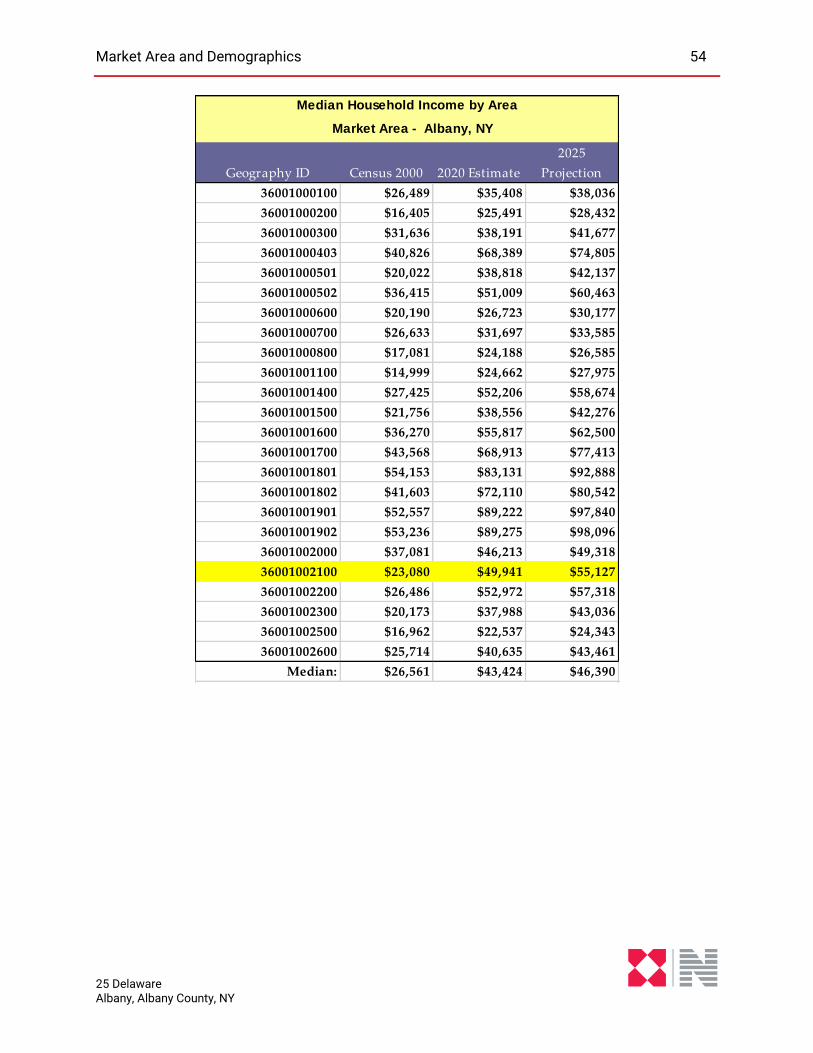
Market Area and Demographics 54
25 Delaware Albany, Albany County, NY
Geography ID Census 2000 2020 Estimate
2025
Projection
36001000100 $26,489 $35,408 $38,036
36001000200 $16,405 $25,491 $28,432
36001000300 $31,636 $38,191 $41,677
36001000403 $40,826 $68,389 $74,805
36001000501 $20,022 $38,818 $42,137
36001000502 $36,415 $51,009 $60,463
36001000600 $20,190 $26,723 $30,177
36001000700 $26,633 $31,697 $33,585
36001000800 $17,081 $24,188 $26,585
36001001100 $14,999 $24,662 $27,975
36001001400 $27,425 $52,206 $58,674
36001001500 $21,756 $38,556 $42,276
36001001600 $36,270 $55,817 $62,500
36001001700 $43,568 $68,913 $77,413
36001001801 $54,153 $83,131 $92,888
36001001802 $41,603 $72,110 $80,542
36001001901 $52,557 $89,222 $97,840
36001001902 $53,236 $89,275 $98,096
36001002000 $37,081 $46,213 $49,318
36001002100 $23,080 $49,941 $55,127
36001002200 $26,486 $52,972 $57,318
36001002300 $20,173 $37,988 $43,036
36001002500 $16,962 $22,537 $24,343
36001002600 $25,714 $40,635 $43,461
Median: $26,561 $43,424 $46,390
Median Household Income by Area
Market Area - Albany, NY
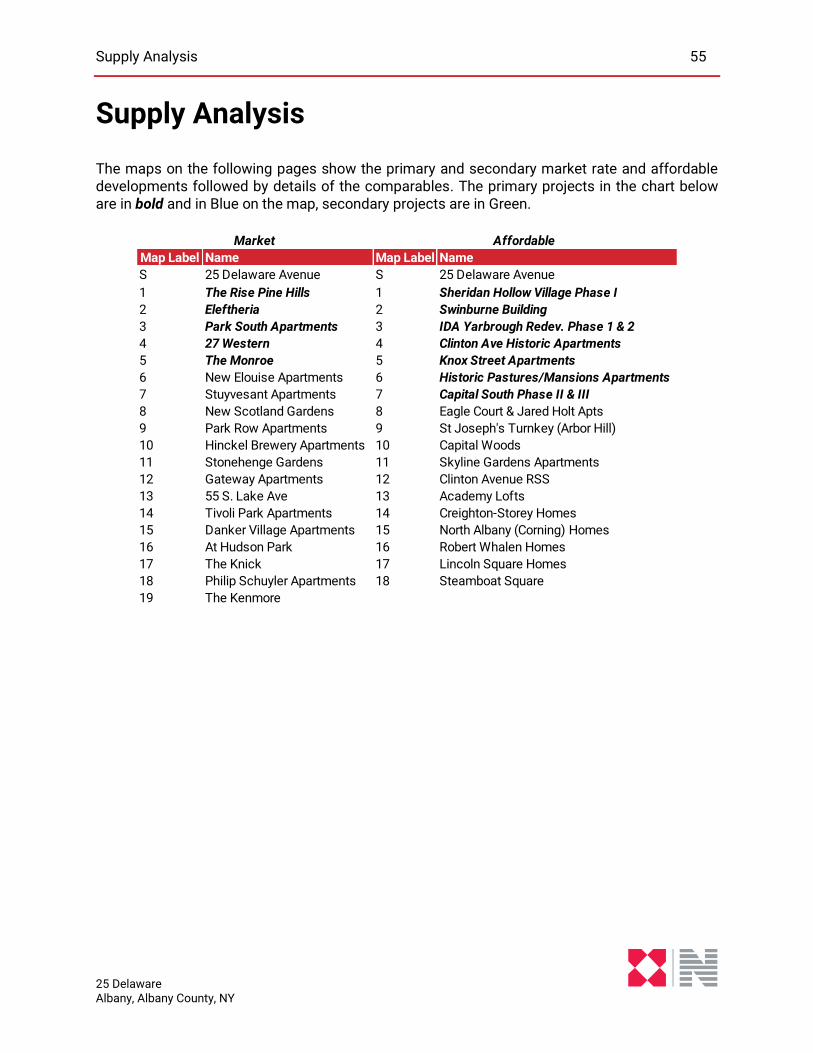
Supply Analysis 55
25 Delaware Albany, Albany County, NY
Supply Analysis
The maps on the following pages show the primary and secondary market rate and affordable developments followed by details of the comparables. The primary projects in the chart below are in bold and in Blue on the map, secondary projects are in Green.
Map Label Name Map Label Name
S 25 Delaware Avenue S 25 Delaware Avenue
1 The Rise Pine Hills 1 Sheridan Hollow Village Phase I
2 Eleftheria 2 Swinburne Building
3 Park South Apartments 3 IDA Yarbrough Redev. Phase 1 & 2
4 27 Western 4 Clinton Ave Historic Apartments
5 The Monroe 5 Knox Street Apartments
6 New Elouise Apartments 6 Historic Pastures/Mansions Apartments
7 Stuyvesant Apartments 7 Capital South Phase II & III
8 New Scotland Gardens 8 Eagle Court & Jared Holt Apts
9 Park Row Apartments 9 St Joseph's Turnkey (Arbor Hill)
10 Hinckel Brewery Apartments 10 Capital Woods
11 Stonehenge Gardens 11 Skyline Gardens Apartments
12 Gateway Apartments 12 Clinton Avenue RSS
13 55 S. Lake Ave 13 Academy Lofts
14 Tivoli Park Apartments 14 Creighton-Storey Homes
15 Danker Village Apartments 15 North Albany (Corning) Homes
16 At Hudson Park 16 Robert Whalen Homes
17 The Knick 17 Lincoln Square Homes
18 Philip Schuyler Apartments 18 Steamboat Square
19 The Kenmore
Market Affordable
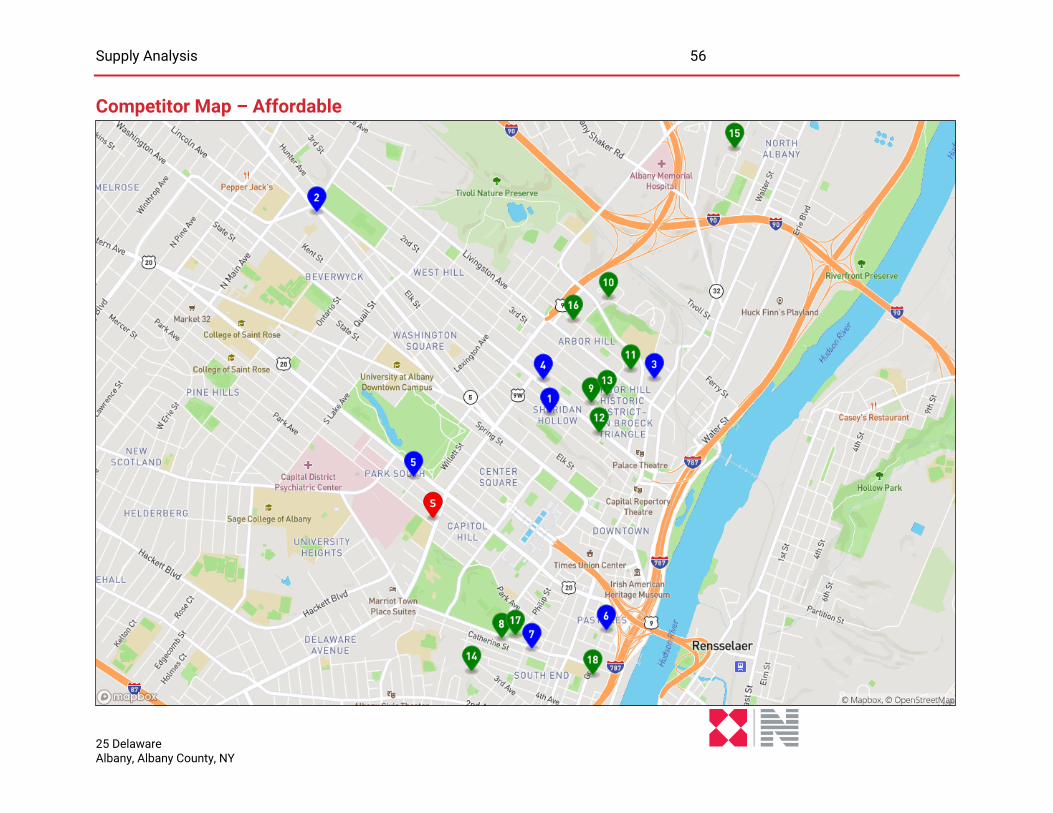
Supply Analysis 56
25 Delaware Albany, Albany County, NY
Competitor Map – Affordable
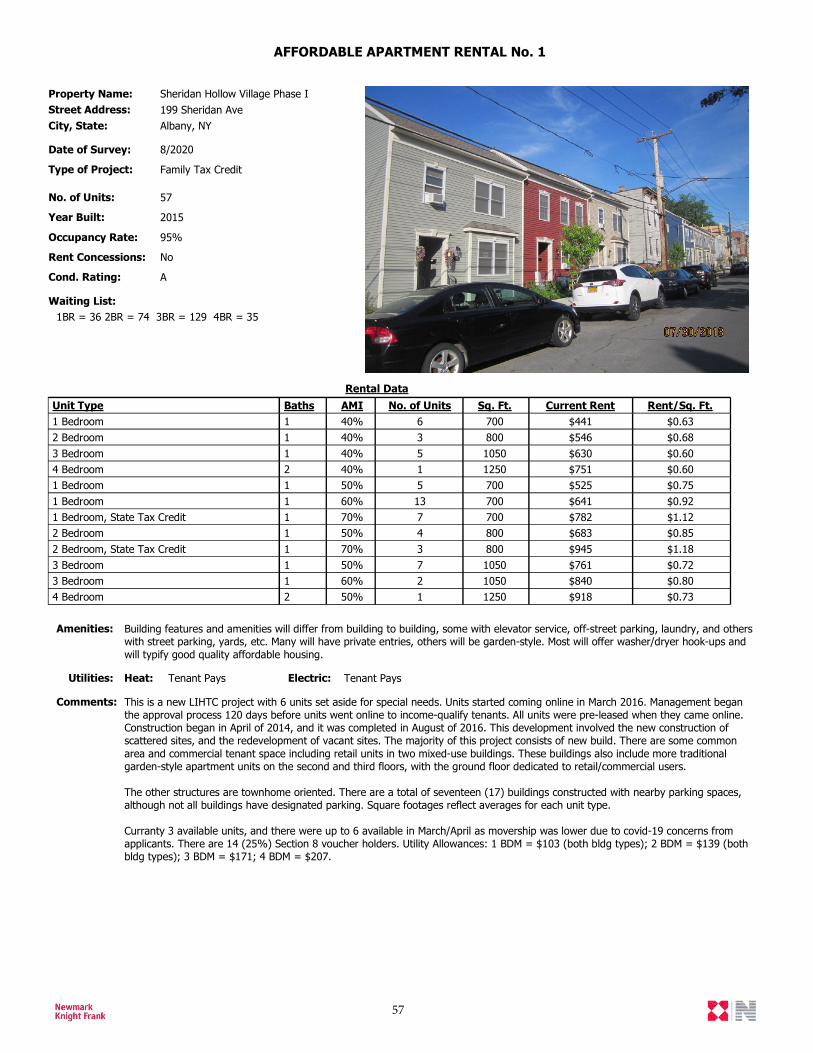
AFFORDABLE APARTMENT RENTAL No. 1
Comments: This is a new LIHTC project with 6 units set aside for special needs. Units started coming online in March 2016. Management began the approval process 120 days before units went online to income-qualify tenants. All units were pre-leased when they came online. Construction began in April of 2014, and it was completed in August of 2016. This development involved the new construction of scattered sites, and the redevelopment of vacant sites. The majority of this project consists of new build. There are some common area and commercial tenant space including retail units in two mixed-use buildings. These buildings also include more traditional garden-style apartment units on the second and third floors, with the ground floor dedicated to retail/commercial users.
The other structures are townhome oriented. There are a total of seventeen (17) buildings constructed with nearby parking spaces, although not all buildings have designated parking. Square footages reflect averages for each unit type.
Curranty 3 available units, and there were up to 6 available in March/April as movership was lower due to covid-19 concerns from applicants. There are 14 (25%) Section 8 voucher holders. Utility Allowances: 1 BDM = $103 (both bldg types); 2 BDM = $139 (both bldg types); 3 BDM = $171; 4 BDM = $207.
Street Address: 199 Sheridan AveCity, State: Albany, NY
Property Name: Sheridan Hollow Village Phase I
Date of Survey: 8/2020
Type of Project: Family Tax Credit
No. of Units: 57
Year Built: 2015
Occupancy Rate: 95%
Amenities: Building features and amenities will differ from building to building, some with elevator service, off-street parking, laundry, and others with street parking, yards, etc. Many will have private entries, others will be garden-style. Most will offer washer/dryer hook-ups and will typify good quality affordable housing.
Heat: Tenant Pays Electric: Tenant PaysUtilities:
Waiting List:1BR = 36 2BR = 74 3BR = 129 4BR = 35
Rent Concessions: No
Cond. Rating: A
Unit Type Baths No. of Units Sq. Ft. Current Rent Rent/Sq. Ft.Rental Data
AMI7001 Bedroom 1 6 $441 $0.6340%8002 Bedroom 1 3 $546 $0.6840%10503 Bedroom 1 5 $630 $0.6040%12504 Bedroom 2 1 $751 $0.6040%7001 Bedroom 1 5 $525 $0.7550%7001 Bedroom 1 13 $641 $0.9260%7001 Bedroom, State Tax Credit 1 7 $782 $1.1270%8002 Bedroom 1 4 $683 $0.8550%8002 Bedroom, State Tax Credit 1 3 $945 $1.1870%10503 Bedroom 1 7 $761 $0.7250%10503 Bedroom 1 2 $840 $0.8060%12504 Bedroom 2 1 $918 $0.7350%
57
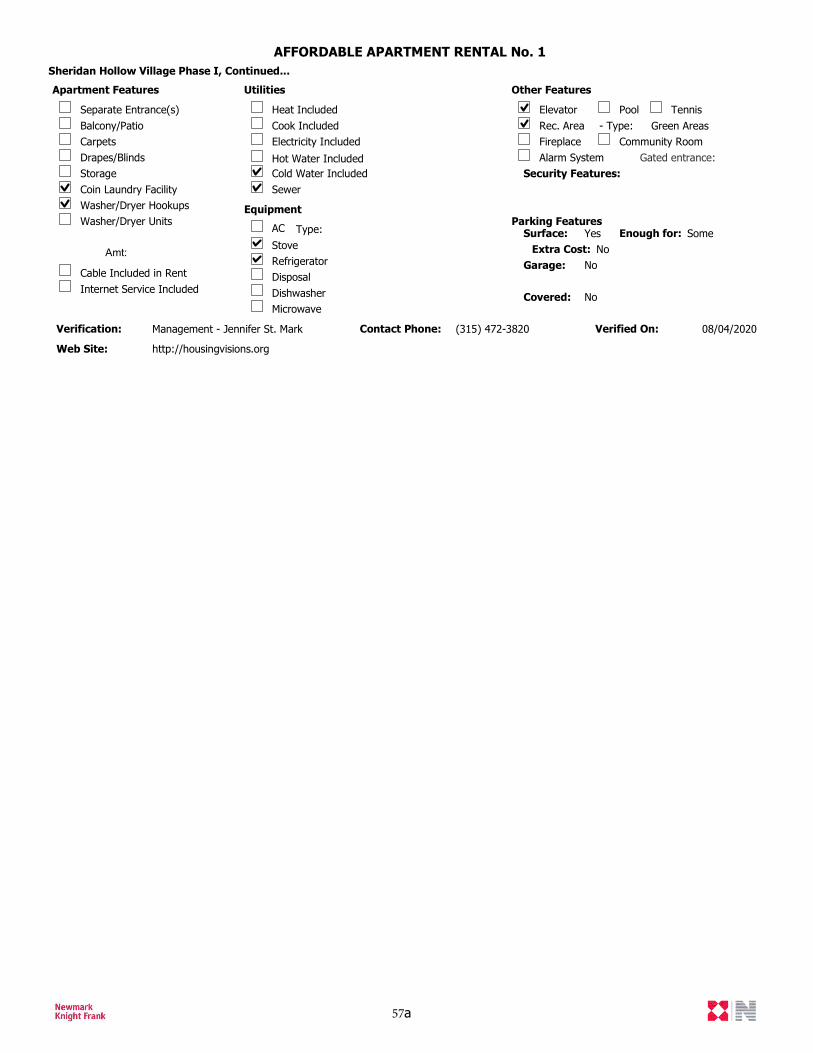
AFFORDABLE APARTMENT RENTAL No. 1Sheridan Hollow Village Phase I, Continued...
Verification: Management - Jennifer St. Mark Verified On: 08/04/2020Contact Phone: (315) 472-3820
Web Site: http://housingvisions.org
Parking Features
Rec. Area - Type: Green AreasCommunity RoomFireplace
Elevator Pool TennisSeparate Entrance(s)Balcony/Patio
Drapes/BlindsStorageCoin Laundry FacilityWasher/Dryer Hookups
Cable Included in Rent
Heat IncludedCook IncludedElectricity Included
AC Type:StoveRefrigeratorDisposalDishwasherMicrowave
Alarm System
Apartment Features Utilities
Equipment
Other Features
Security Features:
Carpets
Washer/Dryer Units
Internet Service Included
Hot Water IncludedCold Water IncludedSewer
Amt:
Surface: Yes Enough for: SomeExtra Cost: No
Garage: No
Covered: No
Gated entrance:
57a
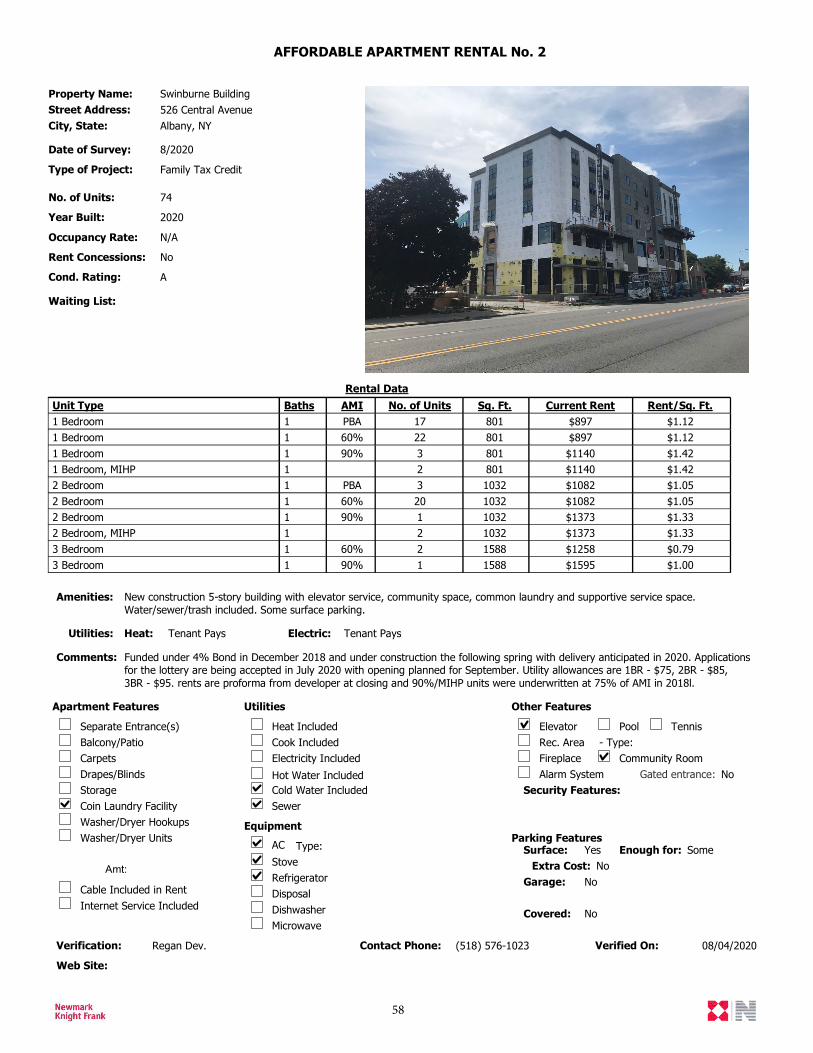
AFFORDABLE APARTMENT RENTAL No. 2
Comments: Funded under 4% Bond in December 2018 and under construction the following spring with delivery anticipated in 2020. Applications for the lottery are being accepted in July 2020 with opening planned for September. Utility allowances are 1BR - $75, 2BR - $85, 3BR - $95. rents are proforma from developer at closing and 90%/MIHP units were underwritten at 75% of AMI in 2018l.
Street Address: 526 Central AvenueCity, State: Albany, NY
Property Name: Swinburne Building
Date of Survey: 8/2020
Type of Project: Family Tax Credit
No. of Units: 74
Year Built: 2020
Occupancy Rate: N/A
Amenities: New construction 5-story building with elevator service, community space, common laundry and supportive service space. Water/sewer/trash included. Some surface parking.
Heat: Tenant Pays Electric: Tenant PaysUtilities:
Waiting List:
Verification: Regan Dev. Verified On: 08/04/2020Contact Phone: (518) 576-1023
Web Site:
Rent Concessions: No
Cond. Rating: A
Unit Type Baths No. of Units Sq. Ft. Current Rent Rent/Sq. Ft.Rental Data
AMI8011 Bedroom 1 17 $897 $1.12PBA8011 Bedroom 1 22 $897 $1.1260%8011 Bedroom 1 3 $1140 $1.4290%8011 Bedroom, MIHP 1 2 $1140 $1.4210322 Bedroom 1 3 $1082 $1.05PBA10322 Bedroom 1 20 $1082 $1.0560%10322 Bedroom 1 1 $1373 $1.3390%10322 Bedroom, MIHP 1 2 $1373 $1.3315883 Bedroom 1 2 $1258 $0.7960%15883 Bedroom 1 1 $1595 $1.0090%
Parking Features
Rec. Area - Type:Community RoomFireplace
Elevator Pool TennisSeparate Entrance(s)Balcony/Patio
Drapes/BlindsStorageCoin Laundry FacilityWasher/Dryer Hookups
Cable Included in Rent
Heat IncludedCook IncludedElectricity Included
AC Type:StoveRefrigeratorDisposalDishwasherMicrowave
Alarm System
Apartment Features Utilities
Equipment
Other Features
Security Features:
Carpets
Washer/Dryer Units
Internet Service Included
Hot Water IncludedCold Water IncludedSewer
Amt:
Surface: Yes Enough for: SomeExtra Cost: No
Garage: No
Covered: No
Gated entrance: No
58
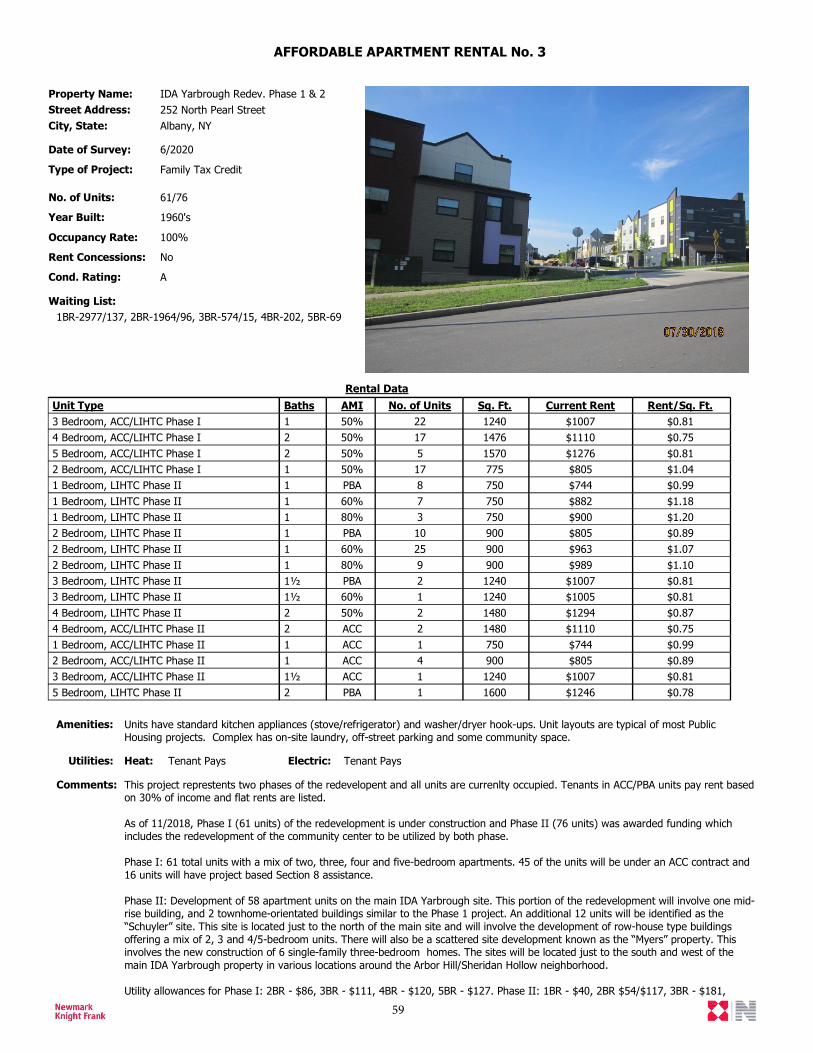
AFFORDABLE APARTMENT RENTAL No. 3
Comments: This project represtents two phases of the redevelopent and all units are currenlty occupied. Tenants in ACC/PBA units pay rent based on 30% of income and flat rents are listed.
As of 11/2018, Phase I (61 units) of the redevelopment is under construction and Phase II (76 units) was awarded funding which includes the redevelopment of the community center to be utilized by both phase.
Phase I: 61 total units with a mix of two, three, four and five-bedroom apartments. 45 of the units will be under an ACC contract and 16 units will have project based Section 8 assistance.
Phase II: Development of 58 apartment units on the main IDA Yarbrough site. This portion of the redevelopment will involve one mid-rise building, and 2 townhome-orientated buildings similar to the Phase 1 project. An additional 12 units will be identified as the “Schuyler” site. This site is located just to the north of the main site and will involve the development of row-house type buildings offering a mix of 2, 3 and 4/5-bedroom units. There will also be a scattered site development known as the “Myers” property. This involves the new construction of 6 single-family three-bedroom homes. The sites will be located just to the south and west of the main IDA Yarbrough property in various locations around the Arbor Hill/Sheridan Hollow neighborhood.
Utility allowances for Phase I: 2BR - $86, 3BR - $111, 4BR - $120, 5BR - $127. Phase II: 1BR - $40, 2BR $54/$117, 3BR - $181,
Street Address: 252 North Pearl StreetCity, State: Albany, NY
Property Name: IDA Yarbrough Redev. Phase 1 & 2
Date of Survey: 6/2020
Type of Project: Family Tax Credit
No. of Units: 61/76
Year Built: 1960's
Occupancy Rate: 100%
Amenities: Units have standard kitchen appliances (stove/refrigerator) and washer/dryer hook-ups. Unit layouts are typical of most Public Housing projects. Complex has on-site laundry, off-street parking and some community space.
Heat: Tenant Pays Electric: Tenant PaysUtilities:
Waiting List:1BR-2977/137, 2BR-1964/96, 3BR-574/15, 4BR-202, 5BR-69
Rent Concessions: No
Cond. Rating: A
Unit Type Baths No. of Units Sq. Ft. Current Rent Rent/Sq. Ft.Rental Data
AMI12403 Bedroom, ACC/LIHTC Phase I 1 22 $1007 $0.8150%14764 Bedroom, ACC/LIHTC Phase I 2 17 $1110 $0.7550%15705 Bedroom, ACC/LIHTC Phase I 2 5 $1276 $0.8150%7752 Bedroom, ACC/LIHTC Phase I 1 17 $805 $1.0450%7501 Bedroom, LIHTC Phase II 1 8 $744 $0.99PBA7501 Bedroom, LIHTC Phase II 1 7 $882 $1.1860%7501 Bedroom, LIHTC Phase II 1 3 $900 $1.2080%9002 Bedroom, LIHTC Phase II 1 10 $805 $0.89PBA9002 Bedroom, LIHTC Phase II 1 25 $963 $1.0760%9002 Bedroom, LIHTC Phase II 1 9 $989 $1.1080%12403 Bedroom, LIHTC Phase II 1½ 2 $1007 $0.81PBA12403 Bedroom, LIHTC Phase II 1½ 1 $1005 $0.8160%14804 Bedroom, LIHTC Phase II 2 2 $1294 $0.8750%14804 Bedroom, ACC/LIHTC Phase II 2 2 $1110 $0.75ACC7501 Bedroom, ACC/LIHTC Phase II 1 1 $744 $0.99ACC9002 Bedroom, ACC/LIHTC Phase II 1 4 $805 $0.89ACC12403 Bedroom, ACC/LIHTC Phase II 1½ 1 $1007 $0.81ACC16005 Bedroom, LIHTC Phase II 2 1 $1246 $0.78PBA
59
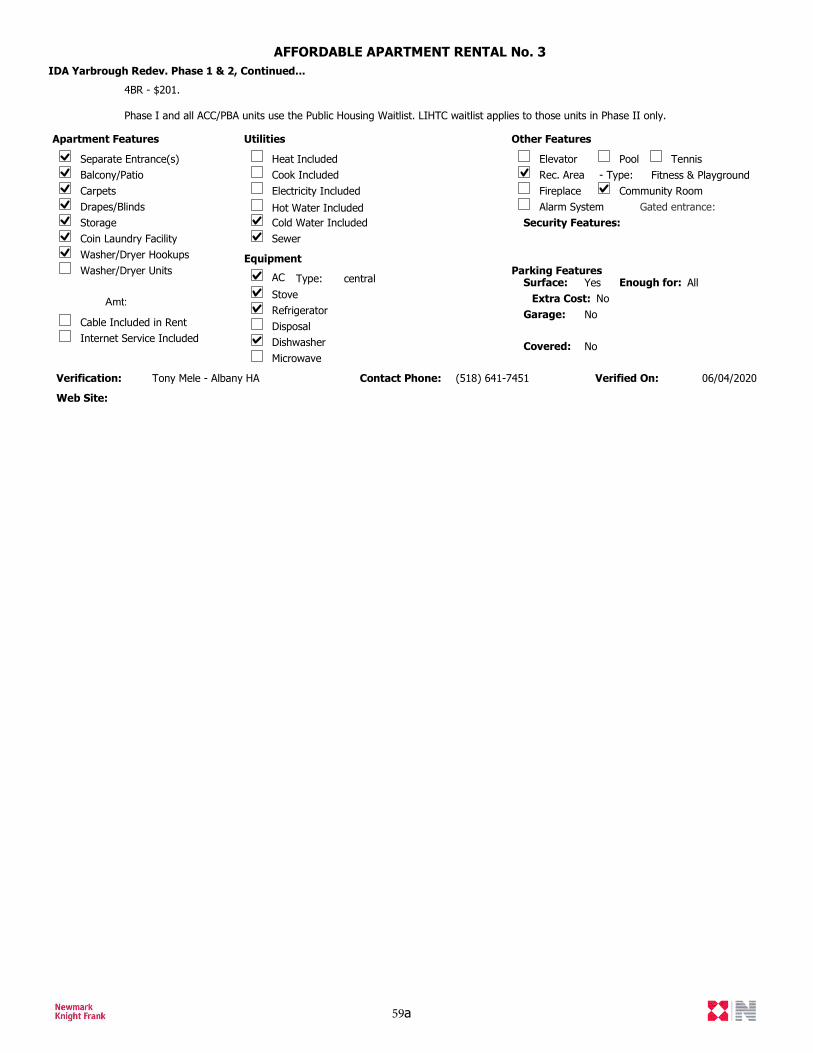
AFFORDABLE APARTMENT RENTAL No. 3IDA Yarbrough Redev. Phase 1 & 2, Continued...
4BR - $201.
Phase I and all ACC/PBA units use the Public Housing Waitlist. LIHTC waitlist applies to those units in Phase II only.
Verification: Tony Mele - Albany HA Verified On: 06/04/2020Contact Phone: (518) 641-7451
Web Site:
Parking Features
Rec. Area - Type: Fitness & PlaygroundCommunity RoomFireplace
Elevator Pool TennisSeparate Entrance(s)Balcony/Patio
Drapes/BlindsStorageCoin Laundry FacilityWasher/Dryer Hookups
Cable Included in Rent
Heat IncludedCook IncludedElectricity Included
AC Type: centralStoveRefrigeratorDisposalDishwasherMicrowave
Alarm System
Apartment Features Utilities
Equipment
Other Features
Security Features:
Carpets
Washer/Dryer Units
Internet Service Included
Hot Water IncludedCold Water IncludedSewer
Amt:
Surface: Yes Enough for: AllExtra Cost: No
Garage: No
Covered: No
Gated entrance:
59a
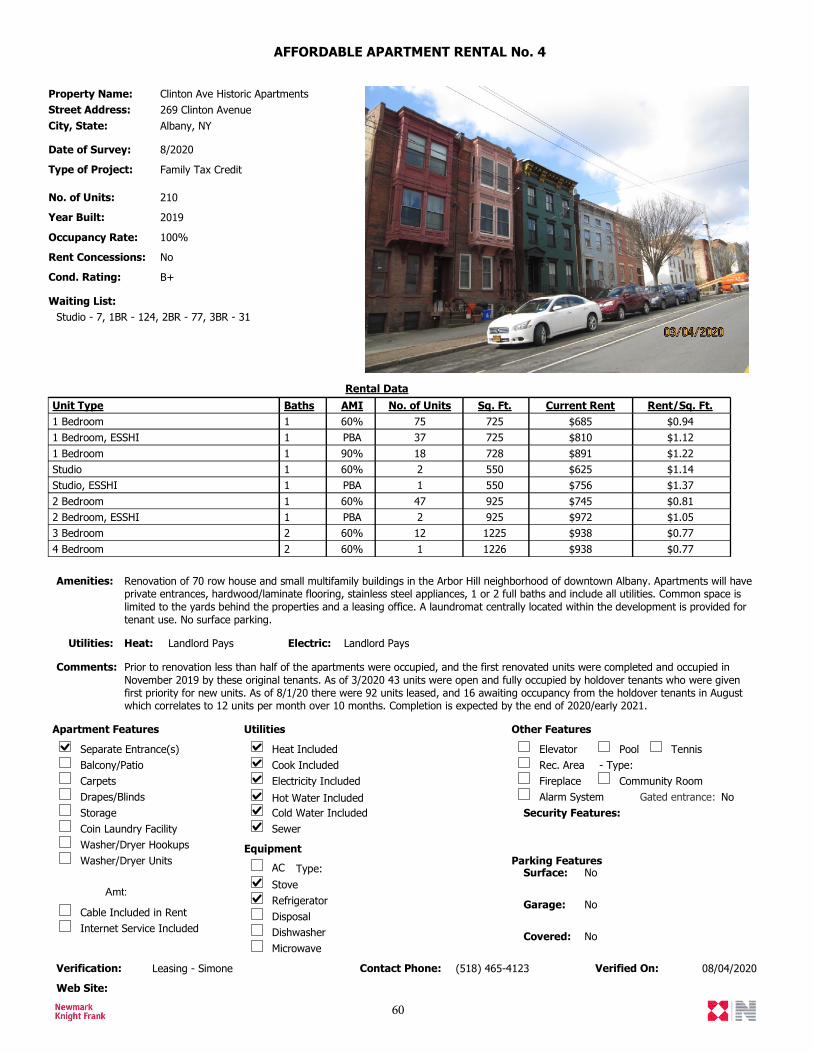
AFFORDABLE APARTMENT RENTAL No. 4
Comments: Prior to renovation less than half of the apartments were occupied, and the first renovated units were completed and occupied in November 2019 by these original tenants. As of 3/2020 43 units were open and fully occupied by holdover tenants who were given first priority for new units. As of 8/1/20 there were 92 units leased, and 16 awaiting occupancy from the holdover tenants in August which correlates to 12 units per month over 10 months. Completion is expected by the end of 2020/early 2021.
Street Address: 269 Clinton AvenueCity, State: Albany, NY
Property Name: Clinton Ave Historic Apartments
Date of Survey: 8/2020
Type of Project: Family Tax Credit
No. of Units: 210
Year Built: 2019
Occupancy Rate: 100%
Amenities: Renovation of 70 row house and small multifamily buildings in the Arbor Hill neighborhood of downtown Albany. Apartments will have private entrances, hardwood/laminate flooring, stainless steel appliances, 1 or 2 full baths and include all utilities. Common space is limited to the yards behind the properties and a leasing office. A laundromat centrally located within the development is provided for tenant use. No surface parking.
Heat: Landlord Pays Electric: Landlord PaysUtilities:
Waiting List:Studio - 7, 1BR - 124, 2BR - 77, 3BR - 31
Verification: Leasing - Simone Verified On: 08/04/2020Contact Phone: (518) 465-4123
Web Site:
Rent Concessions: No
Cond. Rating: B+
Unit Type Baths No. of Units Sq. Ft. Current Rent Rent/Sq. Ft.Rental Data
AMI7251 Bedroom 1 75 $685 $0.9460%7251 Bedroom, ESSHI 1 37 $810 $1.12PBA7281 Bedroom 1 18 $891 $1.2290%550Studio 1 2 $625 $1.1460%550Studio, ESSHI 1 1 $756 $1.37PBA9252 Bedroom 1 47 $745 $0.8160%9252 Bedroom, ESSHI 1 2 $972 $1.05PBA12253 Bedroom 2 12 $938 $0.7760%12264 Bedroom 2 1 $938 $0.7760%
Parking Features
Rec. Area - Type:Community RoomFireplace
Elevator Pool TennisSeparate Entrance(s)Balcony/Patio
Drapes/BlindsStorageCoin Laundry FacilityWasher/Dryer Hookups
Cable Included in Rent
Heat IncludedCook IncludedElectricity Included
AC Type:StoveRefrigeratorDisposalDishwasherMicrowave
Alarm System
Apartment Features Utilities
Equipment
Other Features
Security Features:
Carpets
Washer/Dryer Units
Internet Service Included
Hot Water IncludedCold Water IncludedSewer
Amt:
Surface: No
Garage: No
Covered: No
Gated entrance: No
60
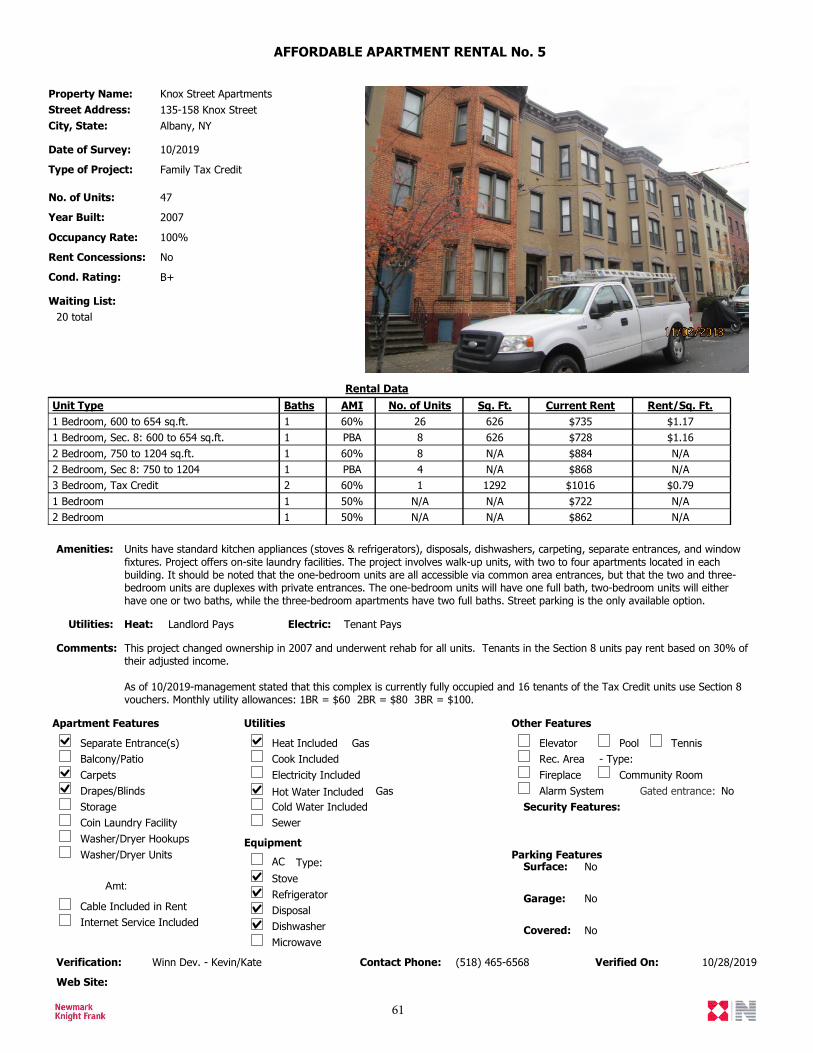
AFFORDABLE APARTMENT RENTAL No. 5
Comments: This project changed ownership in 2007 and underwent rehab for all units. Tenants in the Section 8 units pay rent based on 30% of their adjusted income.
As of 10/2019-management stated that this complex is currently fully occupied and 16 tenants of the Tax Credit units use Section 8 vouchers. Monthly utility allowances: 1BR = $60 2BR = $80 3BR = $100.
Street Address: 135-158 Knox StreetCity, State: Albany, NY
Property Name: Knox Street Apartments
Date of Survey: 10/2019
Type of Project: Family Tax Credit
No. of Units: 47
Year Built: 2007
Occupancy Rate: 100%
Amenities: Units have standard kitchen appliances (stoves & refrigerators), disposals, dishwashers, carpeting, separate entrances, and window fixtures. Project offers on-site laundry facilities. The project involves walk-up units, with two to four apartments located in each building. It should be noted that the one-bedroom units are all accessible via common area entrances, but that the two and three-bedroom units are duplexes with private entrances. The one-bedroom units will have one full bath, two-bedroom units will either have one or two baths, while the three-bedroom apartments have two full baths. Street parking is the only available option.
Heat: Landlord Pays Electric: Tenant PaysUtilities:
Waiting List:20 total
Verification: Winn Dev. - Kevin/Kate Verified On: 10/28/2019Contact Phone: (518) 465-6568
Web Site:
Rent Concessions: No
Cond. Rating: B+
Unit Type Baths No. of Units Sq. Ft. Current Rent Rent/Sq. Ft.Rental Data
AMI6261 Bedroom, 600 to 654 sq.ft. 1 26 $735 $1.1760%6261 Bedroom, Sec. 8: 600 to 654 sq.ft. 1 8 $728 $1.16PBAN/A2 Bedroom, 750 to 1204 sq.ft. 1 8 $884 N/A60%N/A2 Bedroom, Sec 8: 750 to 1204 1 4 $868 N/APBA12923 Bedroom, Tax Credit 2 1 $1016 $0.7960%N/A1 Bedroom 1 N/A $722 N/A50%N/A2 Bedroom 1 N/A $862 N/A50%
Parking Features
Rec. Area - Type:Community RoomFireplace
Elevator Pool TennisSeparate Entrance(s)Balcony/Patio
Drapes/BlindsStorageCoin Laundry FacilityWasher/Dryer Hookups
Cable Included in Rent
Heat IncludedCook IncludedElectricity Included
AC Type:StoveRefrigeratorDisposalDishwasherMicrowave
Alarm System
Apartment Features Utilities
Equipment
Other Features
Gas
GasSecurity Features:
Carpets
Washer/Dryer Units
Internet Service Included
Hot Water IncludedCold Water IncludedSewer
Amt:
Surface: No
Garage: No
Covered: No
Gated entrance: No
61
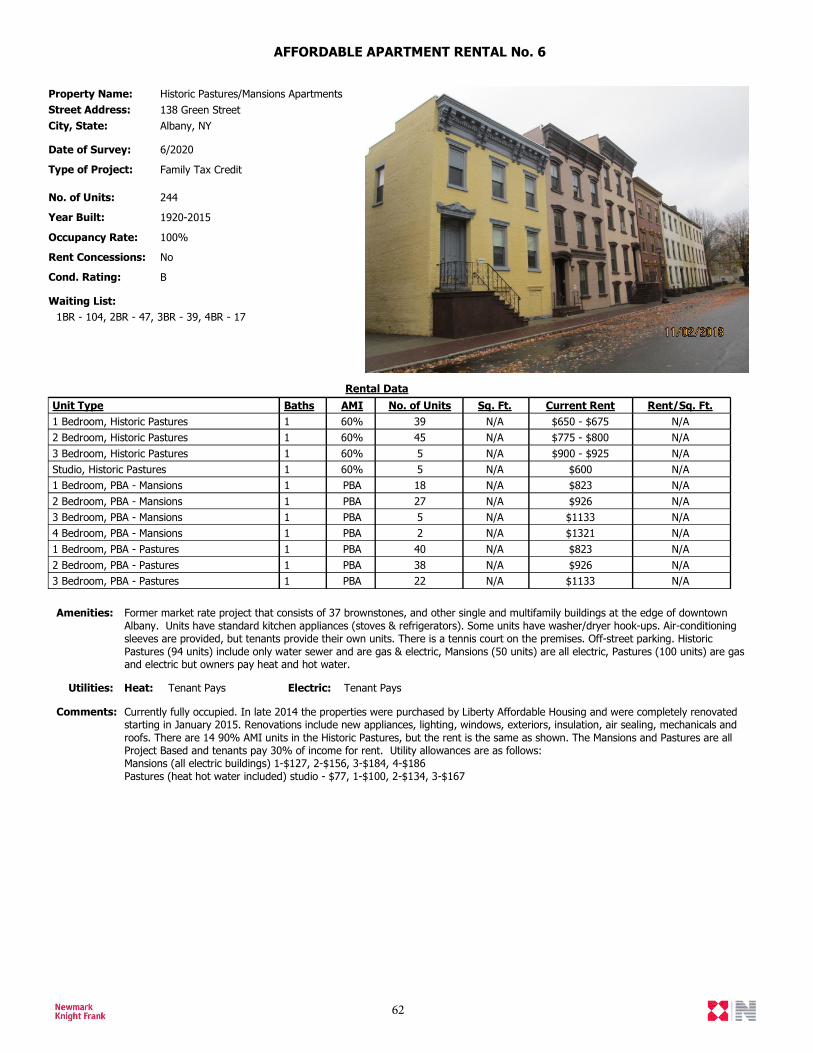
AFFORDABLE APARTMENT RENTAL No. 6
Comments: Currently fully occupied. In late 2014 the properties were purchased by Liberty Affordable Housing and were completely renovated starting in January 2015. Renovations include new appliances, lighting, windows, exteriors, insulation, air sealing, mechanicals and roofs. There are 14 90% AMI units in the Historic Pastures, but the rent is the same as shown. The Mansions and Pastures are all Project Based and tenants pay 30% of income for rent. Utility allowances are as follows:Mansions (all electric buildings) 1-$127, 2-$156, 3-$184, 4-$186Pastures (heat hot water included) studio - $77, 1-$100, 2-$134, 3-$167
Street Address: 138 Green StreetCity, State: Albany, NY
Property Name: Historic Pastures/Mansions Apartments
Date of Survey: 6/2020
Type of Project: Family Tax Credit
No. of Units: 244
Year Built: 1920-2015
Occupancy Rate: 100%
Amenities: Former market rate project that consists of 37 brownstones, and other single and multifamily buildings at the edge of downtown Albany. Units have standard kitchen appliances (stoves & refrigerators). Some units have washer/dryer hook-ups. Air-conditioning sleeves are provided, but tenants provide their own units. There is a tennis court on the premises. Off-street parking. Historic Pastures (94 units) include only water sewer and are gas & electric, Mansions (50 units) are all electric, Pastures (100 units) are gas and electric but owners pay heat and hot water.
Heat: Tenant Pays Electric: Tenant PaysUtilities:
Waiting List:1BR - 104, 2BR - 47, 3BR - 39, 4BR - 17
Rent Concessions: No
Cond. Rating: B
Unit Type Baths No. of Units Sq. Ft. Current Rent Rent/Sq. Ft.Rental Data
AMIN/A1 Bedroom, Historic Pastures 1 39 $650 - $675 N/A60%N/A2 Bedroom, Historic Pastures 1 45 $775 - $800 N/A60%N/A3 Bedroom, Historic Pastures 1 5 $900 - $925 N/A60%N/AStudio, Historic Pastures 1 5 $600 N/A60%N/A1 Bedroom, PBA - Mansions 1 18 $823 N/APBAN/A2 Bedroom, PBA - Mansions 1 27 $926 N/APBAN/A3 Bedroom, PBA - Mansions 1 5 $1133 N/APBAN/A4 Bedroom, PBA - Mansions 1 2 $1321 N/APBAN/A1 Bedroom, PBA - Pastures 1 40 $823 N/APBAN/A2 Bedroom, PBA - Pastures 1 38 $926 N/APBAN/A3 Bedroom, PBA - Pastures 1 22 $1133 N/APBA
62
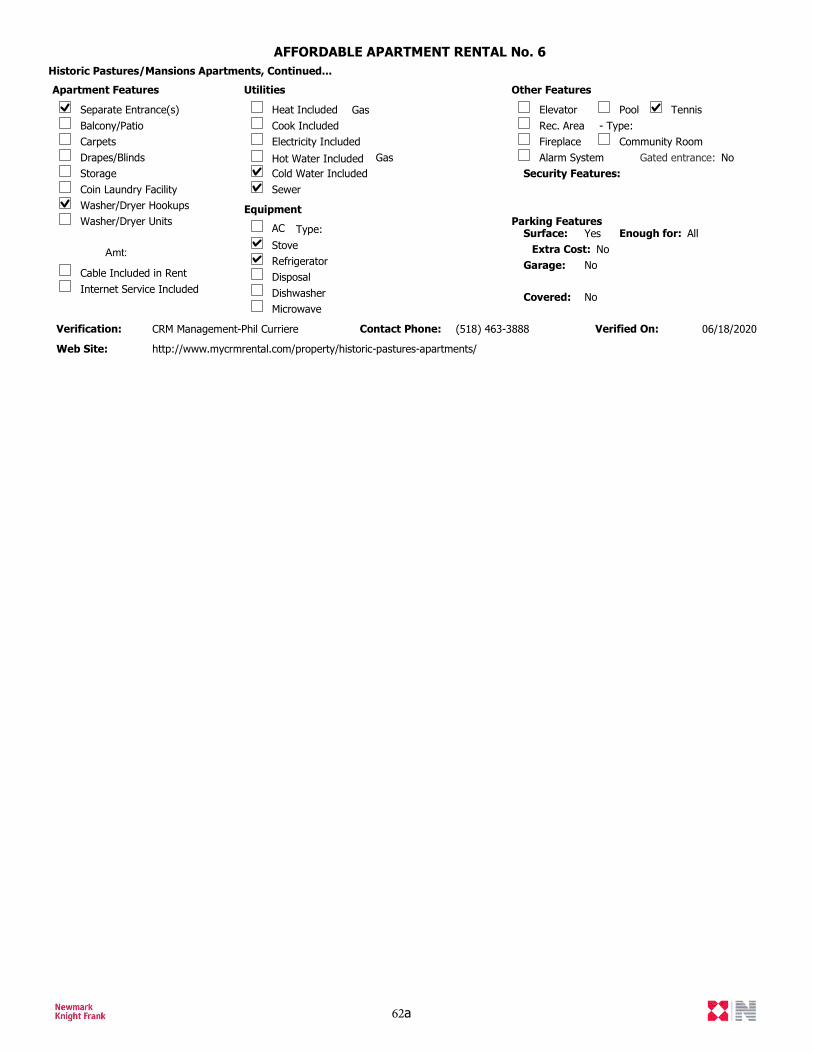
AFFORDABLE APARTMENT RENTAL No. 6Historic Pastures/Mansions Apartments, Continued...
Verification: CRM Management-Phil Curriere Verified On: 06/18/2020Contact Phone: (518) 463-3888
Web Site: http://www.mycrmrental.com/property/historic-pastures-apartments/
Parking Features
Rec. Area - Type:Community RoomFireplace
Elevator Pool TennisSeparate Entrance(s)Balcony/Patio
Drapes/BlindsStorageCoin Laundry FacilityWasher/Dryer Hookups
Cable Included in Rent
Heat IncludedCook IncludedElectricity Included
AC Type:StoveRefrigeratorDisposalDishwasherMicrowave
Alarm System
Apartment Features Utilities
Equipment
Other Features
Gas
GasSecurity Features:
Carpets
Washer/Dryer Units
Internet Service Included
Hot Water IncludedCold Water IncludedSewer
Amt:
Surface: Yes Enough for: AllExtra Cost: No
Garage: No
Covered: No
Gated entrance: No
62a
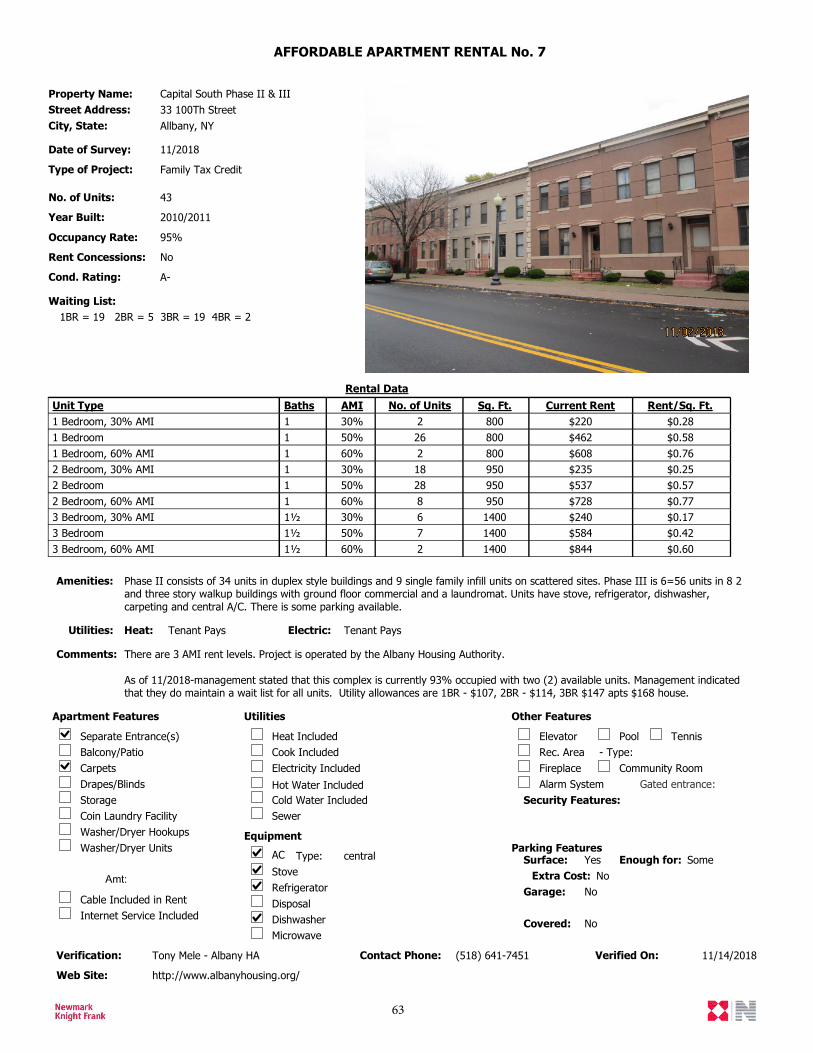
AFFORDABLE APARTMENT RENTAL No. 7
Comments: There are 3 AMI rent levels. Project is operated by the Albany Housing Authority.
As of 11/2018-management stated that this complex is currently 93% occupied with two (2) available units. Management indicated that they do maintain a wait list for all units. Utility allowances are 1BR - $107, 2BR - $114, 3BR $147 apts $168 house.
Street Address: 33 100Th StreetCity, State: Allbany, NY
Property Name: Capital South Phase II & III
Date of Survey: 11/2018
Type of Project: Family Tax Credit
No. of Units: 43
Year Built: 2010/2011
Occupancy Rate: 95%
Amenities: Phase II consists of 34 units in duplex style buildings and 9 single family infill units on scattered sites. Phase III is 6=56 units in 8 2 and three story walkup buildings with ground floor commercial and a laundromat. Units have stove, refrigerator, dishwasher, carpeting and central A/C. There is some parking available.
Heat: Tenant Pays Electric: Tenant PaysUtilities:
Waiting List: 1BR = 19 2BR = 5 3BR = 19 4BR = 2
Verification: Tony Mele - Albany HA Verified On: 11/14/2018Contact Phone: (518) 641-7451
Web Site: http://www.albanyhousing.org/
Rent Concessions: No
Cond. Rating: A-
Unit Type Baths No. of Units Sq. Ft. Current Rent Rent/Sq. Ft.Rental Data
AMI8001 Bedroom, 30% AMI 1 2 $220 $0.2830%8001 Bedroom 1 26 $462 $0.5850%8001 Bedroom, 60% AMI 1 2 $608 $0.7660%9502 Bedroom, 30% AMI 1 18 $235 $0.2530%9502 Bedroom 1 28 $537 $0.5750%9502 Bedroom, 60% AMI 1 8 $728 $0.7760%14003 Bedroom, 30% AMI 1½ 6 $240 $0.1730%14003 Bedroom 1½ 7 $584 $0.4250%14003 Bedroom, 60% AMI 1½ 2 $844 $0.6060%
Parking Features
Rec. Area - Type:Community RoomFireplace
Elevator Pool TennisSeparate Entrance(s)Balcony/Patio
Drapes/BlindsStorageCoin Laundry FacilityWasher/Dryer Hookups
Cable Included in Rent
Heat IncludedCook IncludedElectricity Included
AC Type: centralStoveRefrigeratorDisposalDishwasherMicrowave
Alarm System
Apartment Features Utilities
Equipment
Other Features
Security Features:
Carpets
Washer/Dryer Units
Internet Service Included
Hot Water IncludedCold Water IncludedSewer
Amt:
Surface: Yes Enough for: SomeExtra Cost: No
Garage: No
Covered: No
Gated entrance:
63
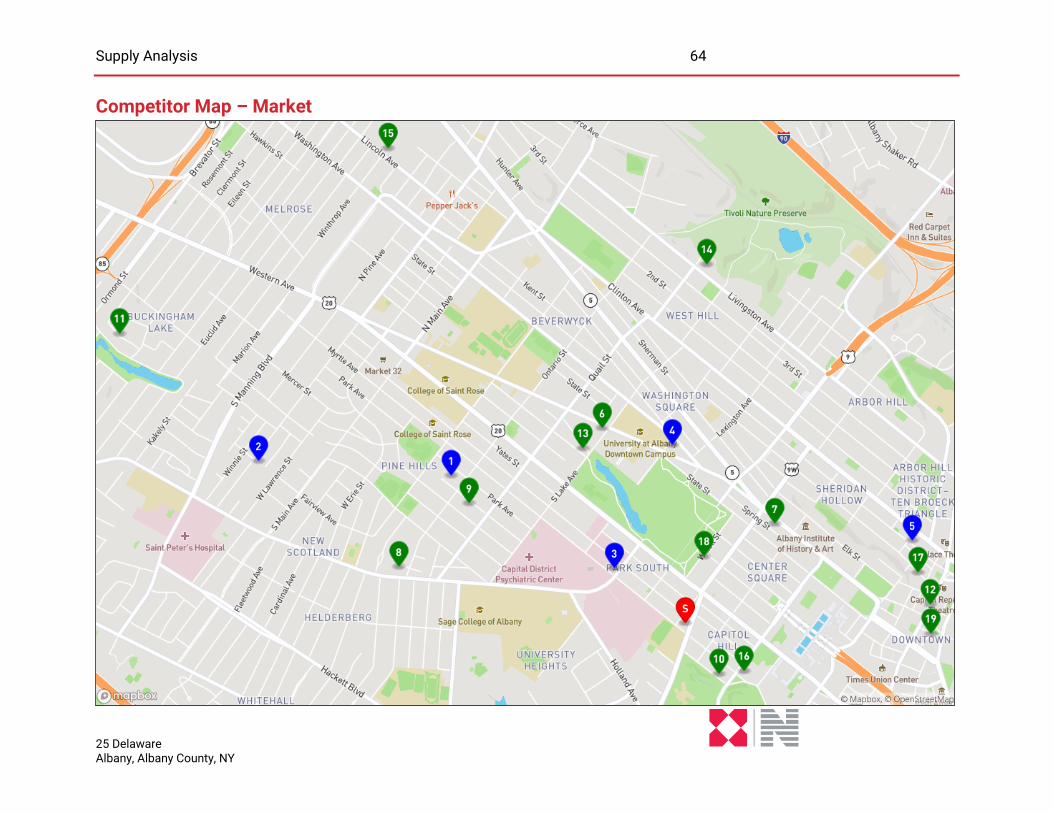
Supply Analysis 64
25 Delaware Albany, Albany County, NY
Competitor Map – Market
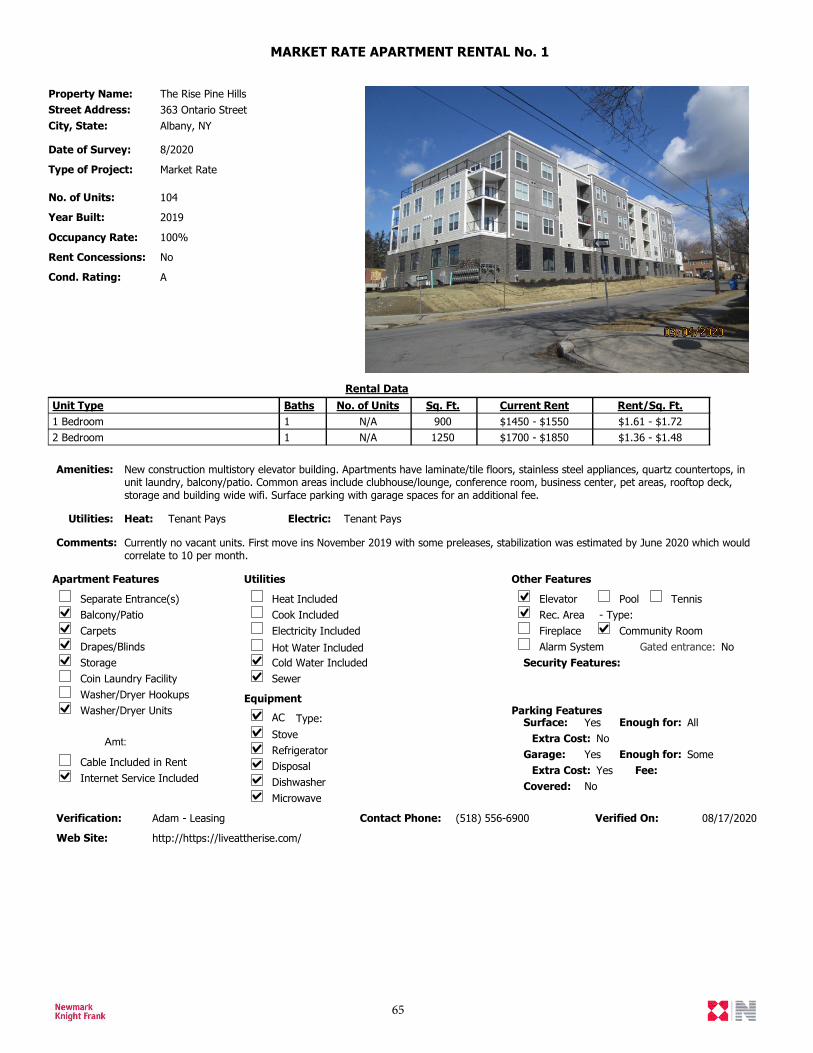
MARKET RATE APARTMENT RENTAL No. 1
Comments: Currently no vacant units. First move ins November 2019 with some preleases, stabilization was estimated by June 2020 which would correlate to 10 per month.
Street Address: 363 Ontario StreetCity, State: Albany, NY
Property Name: The Rise Pine Hills
Date of Survey: 8/2020
Type of Project: Market Rate
No. of Units: 104
Year Built: 2019
Occupancy Rate: 100%
Amenities: New construction multistory elevator building. Apartments have laminate/tile floors, stainless steel appliances, quartz countertops, in unit laundry, balcony/patio. Common areas include clubhouse/lounge, conference room, business center, pet areas, rooftop deck, storage and building wide wifi. Surface parking with garage spaces for an additional fee.
Heat: Tenant Pays Electric: Tenant PaysUtilities:
Verification: Adam - Leasing Verified On: 08/17/2020Contact Phone: (518) 556-6900
Web Site: http://https://liveattherise.com/
Rent Concessions: No
Cond. Rating: A
Unit Type Baths No. of Units Sq. Ft. Current Rent Rent/Sq. Ft.Rental Data
9001 Bedroom 1 N/A $1450 - $1550 $1.61 - $1.7212502 Bedroom 1 N/A $1700 - $1850 $1.36 - $1.48
Parking Features
Rec. Area - Type:Community RoomFireplace
Elevator Pool TennisSeparate Entrance(s)Balcony/Patio
Drapes/BlindsStorageCoin Laundry FacilityWasher/Dryer Hookups
Cable Included in Rent
Heat IncludedCook IncludedElectricity Included
AC Type:StoveRefrigeratorDisposalDishwasherMicrowave
Alarm System
Apartment Features Utilities
Equipment
Other Features
Security Features:
Carpets
Washer/Dryer Units
Internet Service Included
Hot Water IncludedCold Water IncludedSewer
Amt:
Fee:
Surface: Yes Enough for: AllExtra Cost: No
Garage: Yes Enough for: SomeExtra Cost: Yes
Covered: No
Gated entrance: No
65
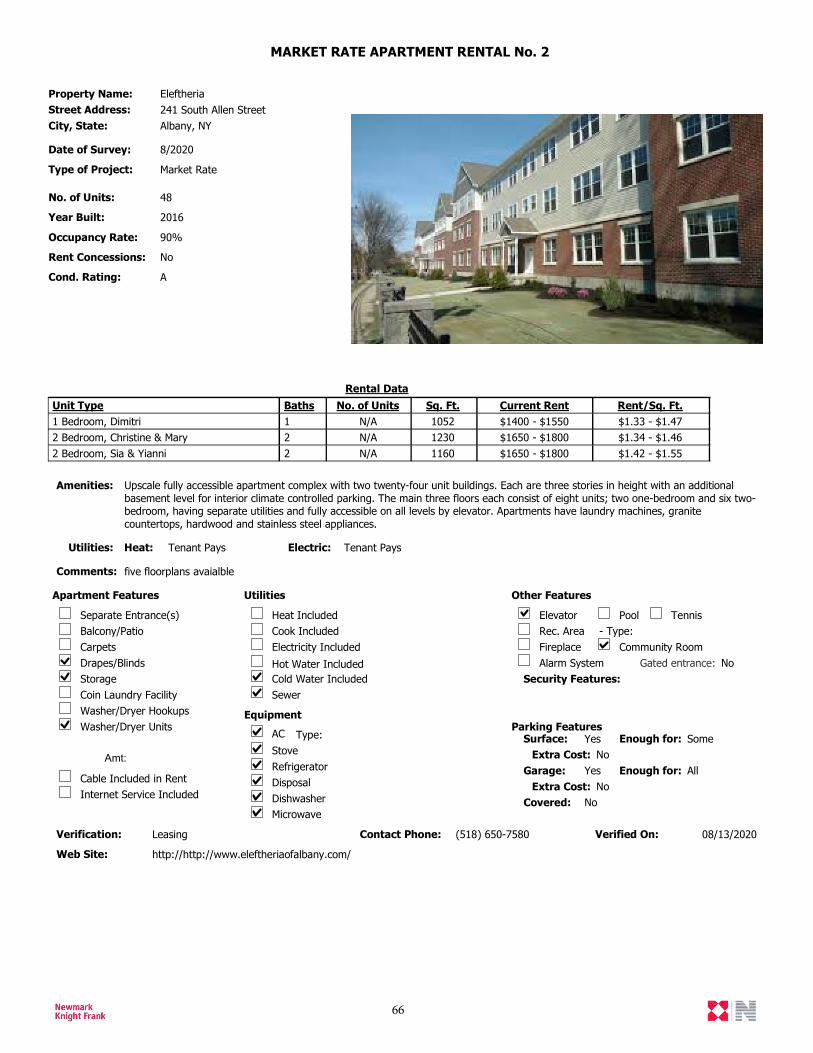
MARKET RATE APARTMENT RENTAL No. 2
Comments: five floorplans avaialble
Street Address: 241 South Allen StreetCity, State: Albany, NY
Property Name: Eleftheria
Date of Survey: 8/2020
Type of Project: Market Rate
No. of Units: 48
Year Built: 2016
Occupancy Rate: 90%
Amenities: Upscale fully accessible apartment complex with two twenty-four unit buildings. Each are three stories in height with an additional basement level for interior climate controlled parking. The main three floors each consist of eight units; two one-bedroom and six two-bedroom, having separate utilities and fully accessible on all levels by elevator. Apartments have laundry machines, granite countertops, hardwood and stainless steel appliances.
Heat: Tenant Pays Electric: Tenant PaysUtilities:
Verification: Leasing Verified On: 08/13/2020Contact Phone: (518) 650-7580
Web Site: http://http://www.eleftheriaofalbany.com/
Rent Concessions: No
Cond. Rating: A
Unit Type Baths No. of Units Sq. Ft. Current Rent Rent/Sq. Ft.Rental Data
10521 Bedroom, Dimitri 1 N/A $1400 - $1550 $1.33 - $1.4712302 Bedroom, Christine & Mary 2 N/A $1650 - $1800 $1.34 - $1.4611602 Bedroom, Sia & Yianni 2 N/A $1650 - $1800 $1.42 - $1.55
Parking Features
Rec. Area - Type:Community RoomFireplace
Elevator Pool TennisSeparate Entrance(s)Balcony/Patio
Drapes/BlindsStorageCoin Laundry FacilityWasher/Dryer Hookups
Cable Included in Rent
Heat IncludedCook IncludedElectricity Included
AC Type:StoveRefrigeratorDisposalDishwasherMicrowave
Alarm System
Apartment Features Utilities
Equipment
Other Features
Security Features:
Carpets
Washer/Dryer Units
Internet Service Included
Hot Water IncludedCold Water IncludedSewer
Amt:
Surface: Yes Enough for: SomeExtra Cost: No
Garage: Yes Enough for: AllExtra Cost: No
Covered: No
Gated entrance: No
66
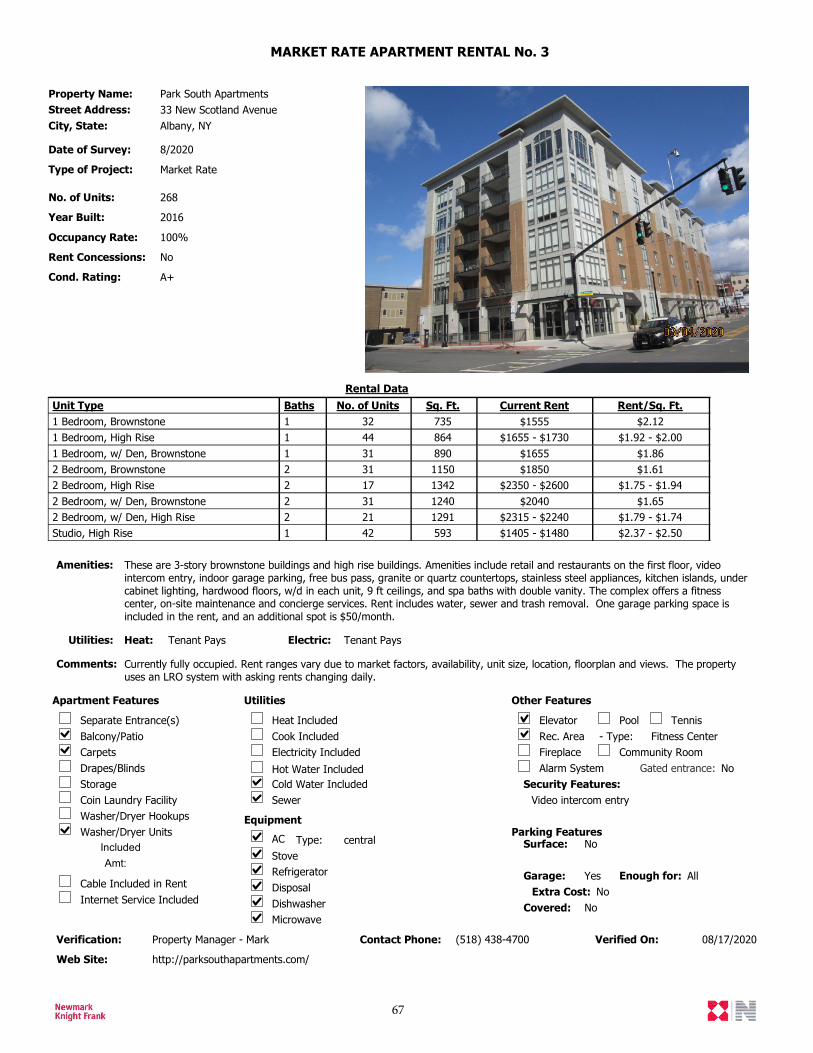
MARKET RATE APARTMENT RENTAL No. 3
Comments: Currently fully occupied. Rent ranges vary due to market factors, availability, unit size, location, floorplan and views. The property uses an LRO system with asking rents changing daily.
Street Address: 33 New Scotland AvenueCity, State: Albany, NY
Property Name: Park South Apartments
Date of Survey: 8/2020
Type of Project: Market Rate
No. of Units: 268
Year Built: 2016
Occupancy Rate: 100%
Amenities: These are 3-story brownstone buildings and high rise buildings. Amenities include retail and restaurants on the first floor, video intercom entry, indoor garage parking, free bus pass, granite or quartz countertops, stainless steel appliances, kitchen islands, under cabinet lighting, hardwood floors, w/d in each unit, 9 ft ceilings, and spa baths with double vanity. The complex offers a fitness center, on-site maintenance and concierge services. Rent includes water, sewer and trash removal. One garage parking space is included in the rent, and an additional spot is $50/month.
Heat: Tenant Pays Electric: Tenant PaysUtilities:
Verification: Property Manager - Mark Verified On: 08/17/2020Contact Phone: (518) 438-4700
Web Site: http://parksouthapartments.com/
Rent Concessions: No
Cond. Rating: A+
Unit Type Baths No. of Units Sq. Ft. Current Rent Rent/Sq. Ft.Rental Data
7351 Bedroom, Brownstone 1 32 $1555 $2.128641 Bedroom, High Rise 1 44 $1655 - $1730 $1.92 - $2.008901 Bedroom, w/ Den, Brownstone 1 31 $1655 $1.8611502 Bedroom, Brownstone 2 31 $1850 $1.6113422 Bedroom, High Rise 2 17 $2350 - $2600 $1.75 - $1.9412402 Bedroom, w/ Den, Brownstone 2 31 $2040 $1.6512912 Bedroom, w/ Den, High Rise 2 21 $2315 - $2240 $1.79 - $1.74593Studio, High Rise 1 42 $1405 - $1480 $2.37 - $2.50
Parking Features
Rec. Area - Type: Fitness CenterCommunity RoomFireplace
Elevator Pool TennisSeparate Entrance(s)Balcony/Patio
Drapes/BlindsStorageCoin Laundry FacilityWasher/Dryer Hookups
Cable Included in Rent
Heat IncludedCook IncludedElectricity Included
AC Type: centralStoveRefrigeratorDisposalDishwasherMicrowave
Alarm System
Apartment Features Utilities
Equipment
Other Features
Security Features:Video intercom entry
Carpets
Washer/Dryer Units
Internet Service Included
Hot Water IncludedCold Water IncludedSewer
IncludedAmt:
Surface: No
Garage: Yes Enough for: AllExtra Cost: No
Covered: No
Gated entrance: No
67
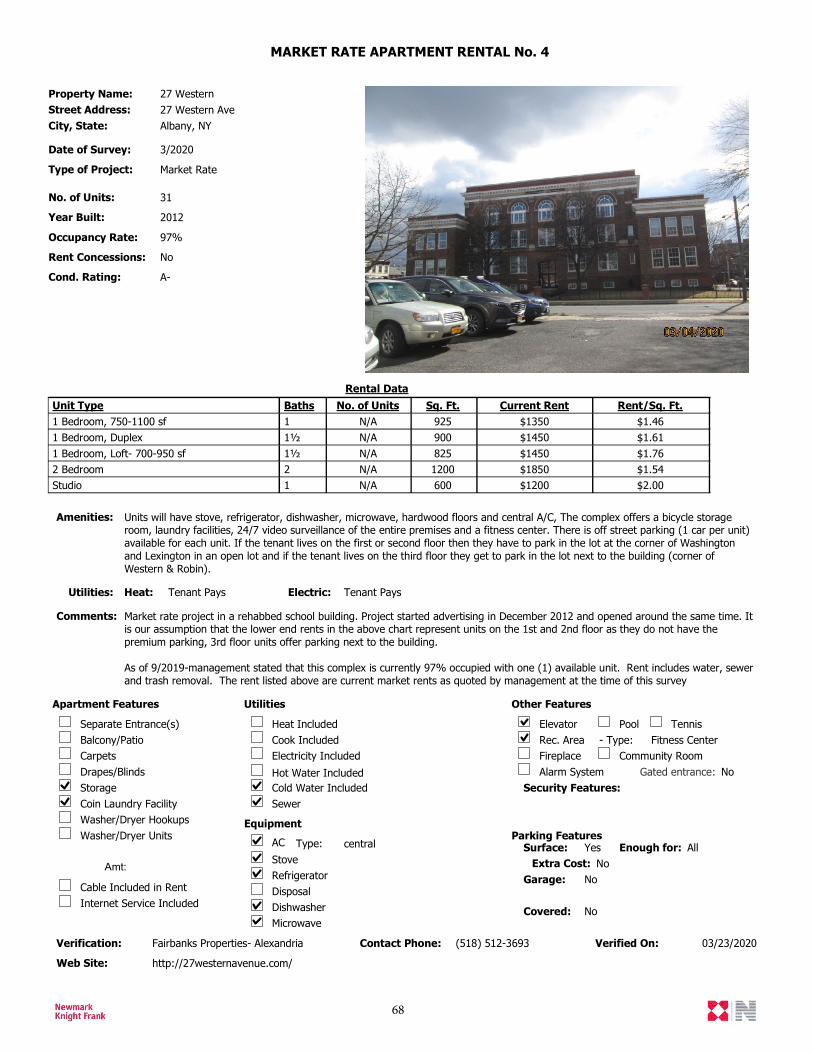
MARKET RATE APARTMENT RENTAL No. 4
Comments: Market rate project in a rehabbed school building. Project started advertising in December 2012 and opened around the same time. It is our assumption that the lower end rents in the above chart represent units on the 1st and 2nd floor as they do not have the premium parking, 3rd floor units offer parking next to the building.
As of 9/2019-management stated that this complex is currently 97% occupied with one (1) available unit. Rent includes water, sewer and trash removal. The rent listed above are current market rents as quoted by management at the time of this survey
Street Address: 27 Western AveCity, State: Albany, NY
Property Name: 27 Western
Date of Survey: 3/2020
Type of Project: Market Rate
No. of Units: 31
Year Built: 2012
Occupancy Rate: 97%
Amenities: Units will have stove, refrigerator, dishwasher, microwave, hardwood floors and central A/C, The complex offers a bicycle storage room, laundry facilities, 24/7 video surveillance of the entire premises and a fitness center. There is off street parking (1 car per unit) available for each unit. If the tenant lives on the first or second floor then they have to park in the lot at the corner of Washington and Lexington in an open lot and if the tenant lives on the third floor they get to park in the lot next to the building (corner of Western & Robin).
Heat: Tenant Pays Electric: Tenant PaysUtilities:
Verification: Fairbanks Properties- Alexandria Verified On: 03/23/2020Contact Phone: (518) 512-3693
Web Site: http://27westernavenue.com/
Rent Concessions: No
Cond. Rating: A-
Unit Type Baths No. of Units Sq. Ft. Current Rent Rent/Sq. Ft.Rental Data
9251 Bedroom, 750-1100 sf 1 N/A $1350 $1.469001 Bedroom, Duplex 1½ N/A $1450 $1.618251 Bedroom, Loft- 700-950 sf 1½ N/A $1450 $1.7612002 Bedroom 2 N/A $1850 $1.54600Studio 1 N/A $1200 $2.00
Parking Features
Rec. Area - Type: Fitness CenterCommunity RoomFireplace
Elevator Pool TennisSeparate Entrance(s)Balcony/Patio
Drapes/BlindsStorageCoin Laundry FacilityWasher/Dryer Hookups
Cable Included in Rent
Heat IncludedCook IncludedElectricity Included
AC Type: centralStoveRefrigeratorDisposalDishwasherMicrowave
Alarm System
Apartment Features Utilities
Equipment
Other Features
Security Features:
Carpets
Washer/Dryer Units
Internet Service Included
Hot Water IncludedCold Water IncludedSewer
Amt:
Surface: Yes Enough for: AllExtra Cost: No
Garage: No
Covered: No
Gated entrance: No
68
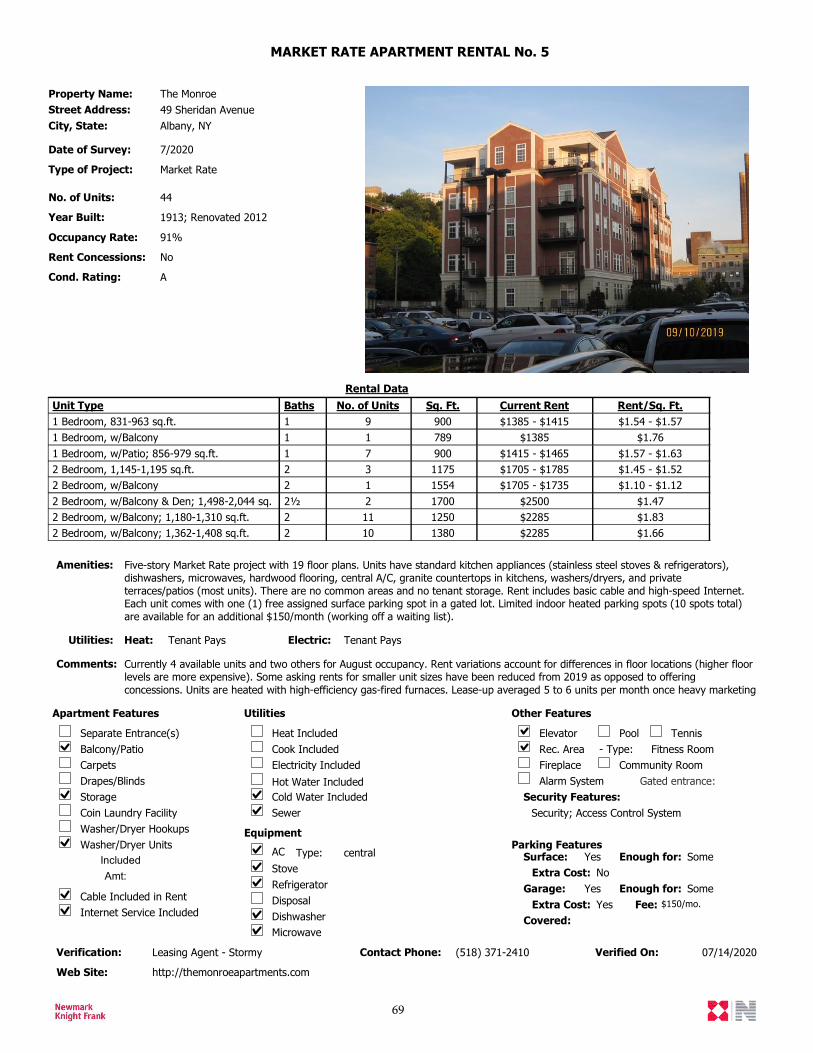
MARKET RATE APARTMENT RENTAL No. 5
Comments: Currently 4 available units and two others for August occupancy. Rent variations account for differences in floor locations (higher floor levels are more expensive). Some asking rents for smaller unit sizes have been reduced from 2019 as opposed to offering concessions. Units are heated with high-efficiency gas-fired furnaces. Lease-up averaged 5 to 6 units per month once heavy marketing
Street Address: 49 Sheridan AvenueCity, State: Albany, NY
Property Name: The Monroe
Date of Survey: 7/2020
Type of Project: Market Rate
No. of Units: 44
Year Built: 1913; Renovated 2012
Occupancy Rate: 91%
Amenities: Five-story Market Rate project with 19 floor plans. Units have standard kitchen appliances (stainless steel stoves & refrigerators), dishwashers, microwaves, hardwood flooring, central A/C, granite countertops in kitchens, washers/dryers, and private terraces/patios (most units). There are no common areas and no tenant storage. Rent includes basic cable and high-speed Internet. Each unit comes with one (1) free assigned surface parking spot in a gated lot. Limited indoor heated parking spots (10 spots total) are available for an additional $150/month (working off a waiting list).
Heat: Tenant Pays Electric: Tenant PaysUtilities:
Verification: Leasing Agent - Stormy Verified On: 07/14/2020Contact Phone: (518) 371-2410
Web Site: http://themonroeapartments.com
Rent Concessions: No
Cond. Rating: A
Unit Type Baths No. of Units Sq. Ft. Current Rent Rent/Sq. Ft.Rental Data
9001 Bedroom, 831-963 sq.ft. 1 9 $1385 - $1415 $1.54 - $1.577891 Bedroom, w/Balcony 1 1 $1385 $1.769001 Bedroom, w/Patio; 856-979 sq.ft. 1 7 $1415 - $1465 $1.57 - $1.6311752 Bedroom, 1,145-1,195 sq.ft. 2 3 $1705 - $1785 $1.45 - $1.5215542 Bedroom, w/Balcony 2 1 $1705 - $1735 $1.10 - $1.1217002 Bedroom, w/Balcony & Den; 1,498-2,044 sq. 2½ 2 $2500 $1.4712502 Bedroom, w/Balcony; 1,180-1,310 sq.ft. 2 11 $2285 $1.8313802 Bedroom, w/Balcony; 1,362-1,408 sq.ft. 2 10 $2285 $1.66
Parking Features
Rec. Area - Type: Fitness RoomCommunity RoomFireplace
Elevator Pool TennisSeparate Entrance(s)Balcony/Patio
Drapes/BlindsStorageCoin Laundry FacilityWasher/Dryer Hookups
Cable Included in Rent
Heat IncludedCook IncludedElectricity Included
AC Type: centralStoveRefrigeratorDisposalDishwasherMicrowave
Alarm System
Apartment Features Utilities
Equipment
Other Features
Security Features:Security; Access Control System
Carpets
Washer/Dryer Units
Internet Service Included
Hot Water IncludedCold Water IncludedSewer
IncludedAmt:
Fee: $150/mo.
Surface: Yes Enough for: SomeExtra Cost: No
Garage: Yes Enough for: SomeExtra Cost: Yes
Covered:
Gated entrance:
69
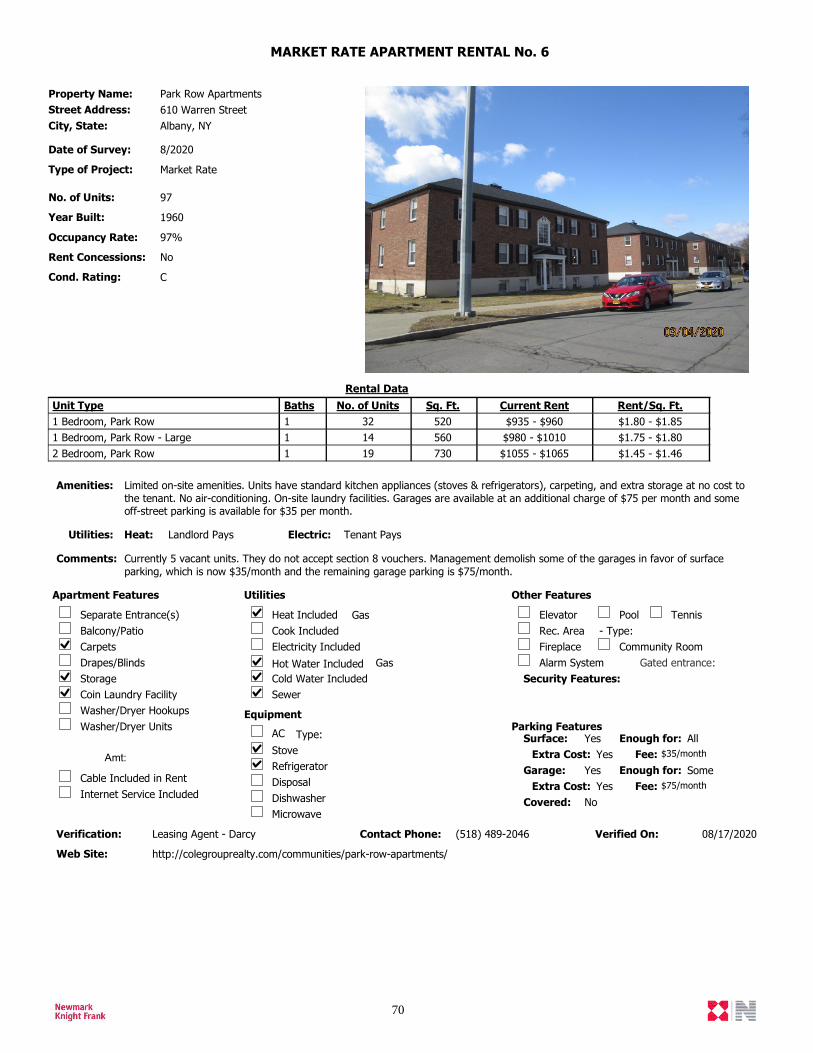
MARKET RATE APARTMENT RENTAL No. 6
Comments: Currently 5 vacant units. They do not accept section 8 vouchers. Management demolish some of the garages in favor of surface parking, which is now $35/month and the remaining garage parking is $75/month.
Street Address: 610 Warren StreetCity, State: Albany, NY
Property Name: Park Row Apartments
Date of Survey: 8/2020
Type of Project: Market Rate
No. of Units: 97
Year Built: 1960
Occupancy Rate: 97%
Amenities: Limited on-site amenities. Units have standard kitchen appliances (stoves & refrigerators), carpeting, and extra storage at no cost to the tenant. No air-conditioning. On-site laundry facilities. Garages are available at an additional charge of $75 per month and some off-street parking is available for $35 per month.
Heat: Landlord Pays Electric: Tenant PaysUtilities:
Verification: Leasing Agent - Darcy Verified On: 08/17/2020Contact Phone: (518) 489-2046
Web Site: http://colegrouprealty.com/communities/park-row-apartments/
Rent Concessions: No
Cond. Rating: C
Unit Type Baths No. of Units Sq. Ft. Current Rent Rent/Sq. Ft.Rental Data
5201 Bedroom, Park Row 1 32 $935 - $960 $1.80 - $1.855601 Bedroom, Park Row - Large 1 14 $980 - $1010 $1.75 - $1.807302 Bedroom, Park Row 1 19 $1055 - $1065 $1.45 - $1.46
Parking Features
Rec. Area - Type:Community RoomFireplace
Elevator Pool TennisSeparate Entrance(s)Balcony/Patio
Drapes/BlindsStorageCoin Laundry FacilityWasher/Dryer Hookups
Cable Included in Rent
Heat IncludedCook IncludedElectricity Included
AC Type:StoveRefrigeratorDisposalDishwasherMicrowave
Alarm System
Apartment Features Utilities
Equipment
Other Features
Gas
GasSecurity Features:
Carpets
Washer/Dryer Units
Internet Service Included
Hot Water IncludedCold Water IncludedSewer
Amt: Fee: $35/month
Fee: $75/month
Surface: Yes Enough for: AllExtra Cost: Yes
Garage: Yes Enough for: SomeExtra Cost: Yes
Covered: No
Gated entrance:
70
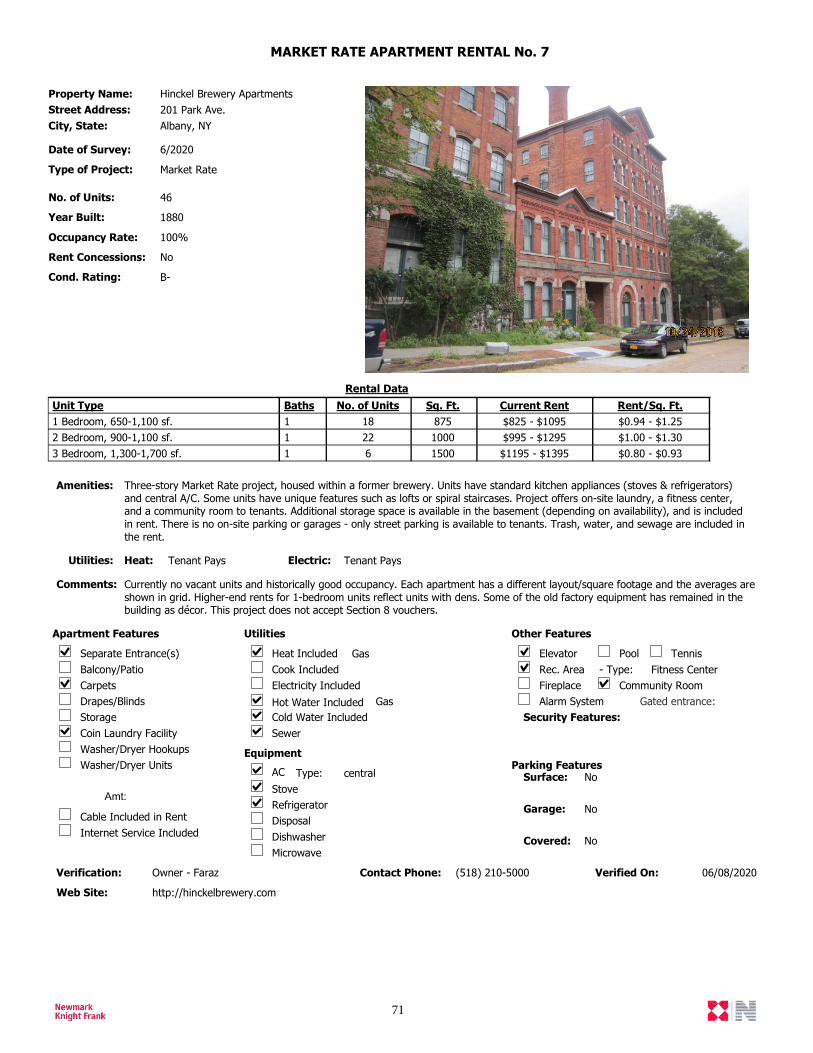
MARKET RATE APARTMENT RENTAL No. 7
Comments: Currently no vacant units and historically good occupancy. Each apartment has a different layout/square footage and the averages are shown in grid. Higher-end rents for 1-bedroom units reflect units with dens. Some of the old factory equipment has remained in the building as décor. This project does not accept Section 8 vouchers.
Street Address: 201 Park Ave.City, State: Albany, NY
Property Name: Hinckel Brewery Apartments
Date of Survey: 6/2020
Type of Project: Market Rate
No. of Units: 46
Year Built: 1880
Occupancy Rate: 100%
Amenities: Three-story Market Rate project, housed within a former brewery. Units have standard kitchen appliances (stoves & refrigerators) and central A/C. Some units have unique features such as lofts or spiral staircases. Project offers on-site laundry, a fitness center, and a community room to tenants. Additional storage space is available in the basement (depending on availability), and is included in rent. There is no on-site parking or garages - only street parking is available to tenants. Trash, water, and sewage are included in the rent.
Heat: Tenant Pays Electric: Tenant PaysUtilities:
Verification: Owner - Faraz Verified On: 06/08/2020Contact Phone: (518) 210-5000
Web Site: http://hinckelbrewery.com
Rent Concessions: No
Cond. Rating: B-
Unit Type Baths No. of Units Sq. Ft. Current Rent Rent/Sq. Ft.Rental Data
8751 Bedroom, 650-1,100 sf. 1 18 $825 - $1095 $0.94 - $1.2510002 Bedroom, 900-1,100 sf. 1 22 $995 - $1295 $1.00 - $1.3015003 Bedroom, 1,300-1,700 sf. 1 6 $1195 - $1395 $0.80 - $0.93
Parking Features
Rec. Area - Type: Fitness CenterCommunity RoomFireplace
Elevator Pool TennisSeparate Entrance(s)Balcony/Patio
Drapes/BlindsStorageCoin Laundry FacilityWasher/Dryer Hookups
Cable Included in Rent
Heat IncludedCook IncludedElectricity Included
AC Type: centralStoveRefrigeratorDisposalDishwasherMicrowave
Alarm System
Apartment Features Utilities
Equipment
Other Features
Gas
GasSecurity Features:
Carpets
Washer/Dryer Units
Internet Service Included
Hot Water IncludedCold Water IncludedSewer
Amt:
Surface: No
Garage: No
Covered: No
Gated entrance:
71
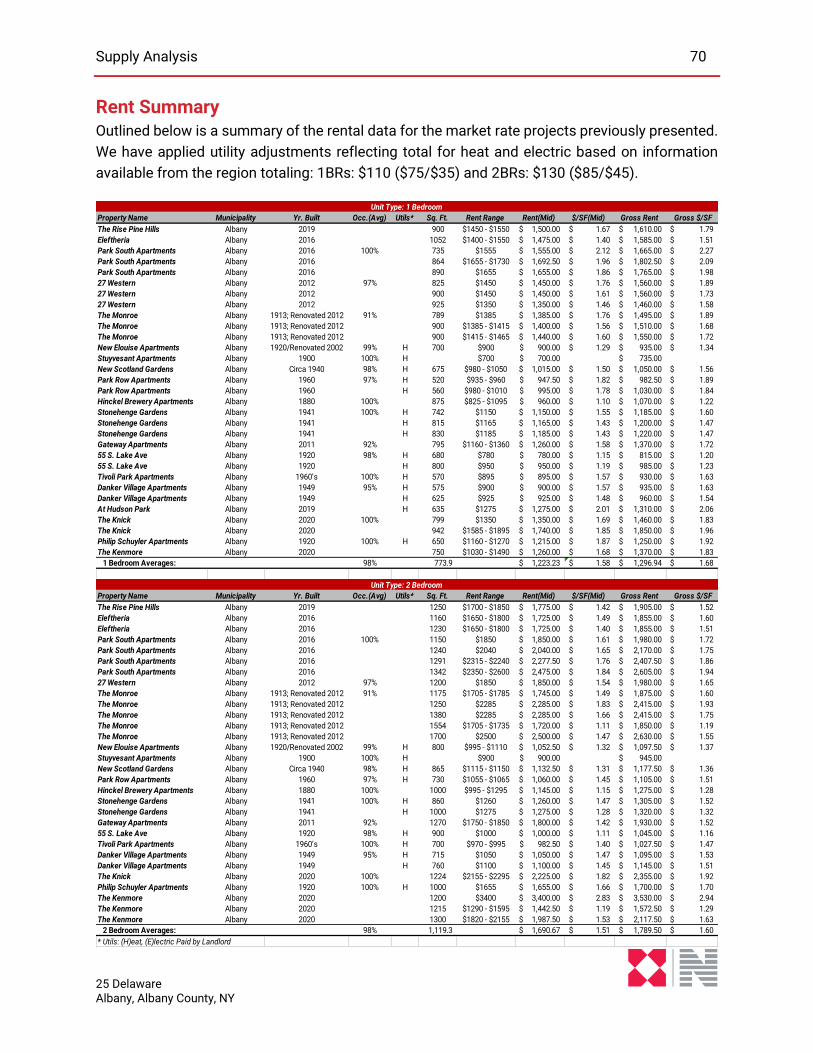
Supply Analysis 70
25 Delaware Albany, Albany County, NY
Rent Summary Outlined below is a summary of the rental data for the market rate projects previously presented.
We have applied utility adjustments reflecting total for heat and electric based on information
available from the region totaling: 1BRs: $110 ($75/$35) and 2BRs: $130 ($85/$45).
Property Name Municipality Yr. Built Occ.(Avg) Utils* Sq. Ft. Rent Range Rent(Mid) $/SF(Mid) Gross Rent Gross $/SF
The Rise Pine Hills Albany 2019 900 $1450 - $1550 1,500.00$ 1.67$ 1,610.00$ 1.79$
Eleftheria Albany 2016 1052 $1400 - $1550 1,475.00$ 1.40$ 1,585.00$ 1.51$
Park South Apartments Albany 2016 100% 735 $1555 1,555.00$ 2.12$ 1,665.00$ 2.27$
Park South Apartments Albany 2016 864 $1655 - $1730 1,692.50$ 1.96$ 1,802.50$ 2.09$
Park South Apartments Albany 2016 890 $1655 1,655.00$ 1.86$ 1,765.00$ 1.98$
27 Western Albany 2012 97% 825 $1450 1,450.00$ 1.76$ 1,560.00$ 1.89$
27 Western Albany 2012 900 $1450 1,450.00$ 1.61$ 1,560.00$ 1.73$
27 Western Albany 2012 925 $1350 1,350.00$ 1.46$ 1,460.00$ 1.58$
The Monroe Albany 1913; Renovated 2012 91% 789 $1385 1,385.00$ 1.76$ 1,495.00$ 1.89$
The Monroe Albany 1913; Renovated 2012 900 $1385 - $1415 1,400.00$ 1.56$ 1,510.00$ 1.68$
The Monroe Albany 1913; Renovated 2012 900 $1415 - $1465 1,440.00$ 1.60$ 1,550.00$ 1.72$
New Elouise Apartments Albany 1920/Renovated 2002 99% H 700 $900 900.00$ 1.29$ 935.00$ 1.34$
Stuyvesant Apartments Albany 1900 100% H $700 700.00$ 735.00$
New Scotland Gardens Albany Circa 1940 98% H 675 $980 - $1050 1,015.00$ 1.50$ 1,050.00$ 1.56$
Park Row Apartments Albany 1960 97% H 520 $935 - $960 947.50$ 1.82$ 982.50$ 1.89$
Park Row Apartments Albany 1960 H 560 $980 - $1010 995.00$ 1.78$ 1,030.00$ 1.84$
Hinckel Brewery Apartments Albany 1880 100% 875 $825 - $1095 960.00$ 1.10$ 1,070.00$ 1.22$
Stonehenge Gardens Albany 1941 100% H 742 $1150 1,150.00$ 1.55$ 1,185.00$ 1.60$
Stonehenge Gardens Albany 1941 H 815 $1165 1,165.00$ 1.43$ 1,200.00$ 1.47$
Stonehenge Gardens Albany 1941 H 830 $1185 1,185.00$ 1.43$ 1,220.00$ 1.47$
Gateway Apartments Albany 2011 92% 795 $1160 - $1360 1,260.00$ 1.58$ 1,370.00$ 1.72$
55 S. Lake Ave Albany 1920 98% H 680 $780 780.00$ 1.15$ 815.00$ 1.20$
55 S. Lake Ave Albany 1920 H 800 $950 950.00$ 1.19$ 985.00$ 1.23$
Tivoli Park Apartments Albany 1960’s 100% H 570 $895 895.00$ 1.57$ 930.00$ 1.63$
Danker Village Apartments Albany 1949 95% H 575 $900 900.00$ 1.57$ 935.00$ 1.63$
Danker Village Apartments Albany 1949 H 625 $925 925.00$ 1.48$ 960.00$ 1.54$
At Hudson Park Albany 2019 H 635 $1275 1,275.00$ 2.01$ 1,310.00$ 2.06$
The Knick Albany 2020 100% 799 $1350 1,350.00$ 1.69$ 1,460.00$ 1.83$
The Knick Albany 2020 942 $1585 - $1895 1,740.00$ 1.85$ 1,850.00$ 1.96$
Philip Schuyler Apartments Albany 1920 100% H 650 $1160 - $1270 1,215.00$ 1.87$ 1,250.00$ 1.92$
The Kenmore Albany 2020 750 $1030 - $1490 1,260.00$ 1.68$ 1,370.00$ 1.83$
1 Bedroom Averages: 98% 773.9 1,223.23$ 1.58$ 1,296.94$ 1.68$
Property Name Municipality Yr. Built Occ.(Avg) Utils* Sq. Ft. Rent Range Rent(Mid) $/SF(Mid) Gross Rent Gross $/SF
The Rise Pine Hills Albany 2019 1250 $1700 - $1850 1,775.00$ 1.42$ 1,905.00$ 1.52$
Eleftheria Albany 2016 1160 $1650 - $1800 1,725.00$ 1.49$ 1,855.00$ 1.60$
Eleftheria Albany 2016 1230 $1650 - $1800 1,725.00$ 1.40$ 1,855.00$ 1.51$
Park South Apartments Albany 2016 100% 1150 $1850 1,850.00$ 1.61$ 1,980.00$ 1.72$
Park South Apartments Albany 2016 1240 $2040 2,040.00$ 1.65$ 2,170.00$ 1.75$
Park South Apartments Albany 2016 1291 $2315 - $2240 2,277.50$ 1.76$ 2,407.50$ 1.86$
Park South Apartments Albany 2016 1342 $2350 - $2600 2,475.00$ 1.84$ 2,605.00$ 1.94$
27 Western Albany 2012 97% 1200 $1850 1,850.00$ 1.54$ 1,980.00$ 1.65$
The Monroe Albany 1913; Renovated 2012 91% 1175 $1705 - $1785 1,745.00$ 1.49$ 1,875.00$ 1.60$
The Monroe Albany 1913; Renovated 2012 1250 $2285 2,285.00$ 1.83$ 2,415.00$ 1.93$
The Monroe Albany 1913; Renovated 2012 1380 $2285 2,285.00$ 1.66$ 2,415.00$ 1.75$
The Monroe Albany 1913; Renovated 2012 1554 $1705 - $1735 1,720.00$ 1.11$ 1,850.00$ 1.19$
The Monroe Albany 1913; Renovated 2012 1700 $2500 2,500.00$ 1.47$ 2,630.00$ 1.55$
New Elouise Apartments Albany 1920/Renovated 2002 99% H 800 $995 - $1110 1,052.50$ 1.32$ 1,097.50$ 1.37$
Stuyvesant Apartments Albany 1900 100% H $900 900.00$ 945.00$
New Scotland Gardens Albany Circa 1940 98% H 865 $1115 - $1150 1,132.50$ 1.31$ 1,177.50$ 1.36$
Park Row Apartments Albany 1960 97% H 730 $1055 - $1065 1,060.00$ 1.45$ 1,105.00$ 1.51$
Hinckel Brewery Apartments Albany 1880 100% 1000 $995 - $1295 1,145.00$ 1.15$ 1,275.00$ 1.28$
Stonehenge Gardens Albany 1941 100% H 860 $1260 1,260.00$ 1.47$ 1,305.00$ 1.52$
Stonehenge Gardens Albany 1941 H 1000 $1275 1,275.00$ 1.28$ 1,320.00$ 1.32$
Gateway Apartments Albany 2011 92% 1270 $1750 - $1850 1,800.00$ 1.42$ 1,930.00$ 1.52$
55 S. Lake Ave Albany 1920 98% H 900 $1000 1,000.00$ 1.11$ 1,045.00$ 1.16$
Tivoli Park Apartments Albany 1960’s 100% H 700 $970 - $995 982.50$ 1.40$ 1,027.50$ 1.47$
Danker Village Apartments Albany 1949 95% H 715 $1050 1,050.00$ 1.47$ 1,095.00$ 1.53$
Danker Village Apartments Albany 1949 H 760 $1100 1,100.00$ 1.45$ 1,145.00$ 1.51$
The Knick Albany 2020 100% 1224 $2155 - $2295 2,225.00$ 1.82$ 2,355.00$ 1.92$
Philip Schuyler Apartments Albany 1920 100% H 1000 $1655 1,655.00$ 1.66$ 1,700.00$ 1.70$
The Kenmore Albany 2020 1200 $3400 3,400.00$ 2.83$ 3,530.00$ 2.94$
The Kenmore Albany 2020 1215 $1290 - $1595 1,442.50$ 1.19$ 1,572.50$ 1.29$
The Kenmore Albany 2020 1300 $1820 - $2155 1,987.50$ 1.53$ 2,117.50$ 1.63$
2 Bedroom Averages: 98% 1,119.3 1,690.67$ 1.51$ 1,789.50$ 1.60$
* Utils: (H)eat, (E)lectric Paid by Landlord
Unit Type: 1 Bedroom
Unit Type: 2 Bedroom
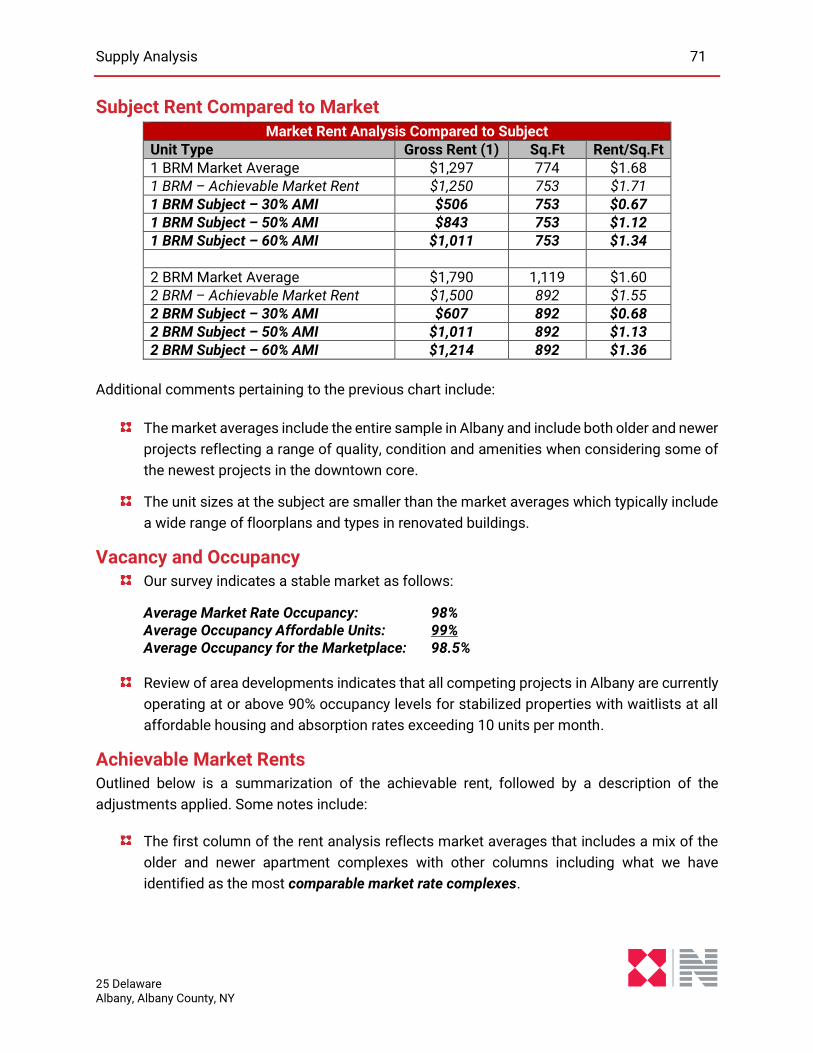
Supply Analysis 71
25 Delaware Albany, Albany County, NY
Subject Rent Compared to Market Market Rent Analysis Compared to Subject
Unit Type Gross Rent (1) Sq.Ft Rent/Sq.Ft 1 BRM Market Average $1,297 774 $1.68 1 BRM – Achievable Market Rent $1,250 753 $1.71 1 BRM Subject – 30% AMI $506 753 $0.67 1 BRM Subject – 50% AMI $843 753 $1.12 1 BRM Subject – 60% AMI $1,011 753 $1.34 2 BRM Market Average $1,790 1,119 $1.60 2 BRM – Achievable Market Rent $1,500 892 $1.55 2 BRM Subject – 30% AMI $607 892 $0.68 2 BRM Subject – 50% AMI $1,011 892 $1.13 2 BRM Subject – 60% AMI $1,214 892 $1.36
Additional comments pertaining to the previous chart include:
The market averages include the entire sample in Albany and include both older and newer
projects reflecting a range of quality, condition and amenities when considering some of
the newest projects in the downtown core.
The unit sizes at the subject are smaller than the market averages which typically include
a wide range of floorplans and types in renovated buildings.
Vacancy and Occupancy Our survey indicates a stable market as follows:
Average Market Rate Occupancy: 98% Average Occupancy Affordable Units: 99% Average Occupancy for the Marketplace: 98.5%
Review of area developments indicates that all competing projects in Albany are currently
operating at or above 90% occupancy levels for stabilized properties with waitlists at all
affordable housing and absorption rates exceeding 10 units per month.
Achievable Market Rents Outlined below is a summarization of the achievable rent, followed by a description of the
adjustments applied. Some notes include:
The first column of the rent analysis reflects market averages that includes a mix of the
older and newer apartment complexes with other columns including what we have
identified as the most comparable market rate complexes.
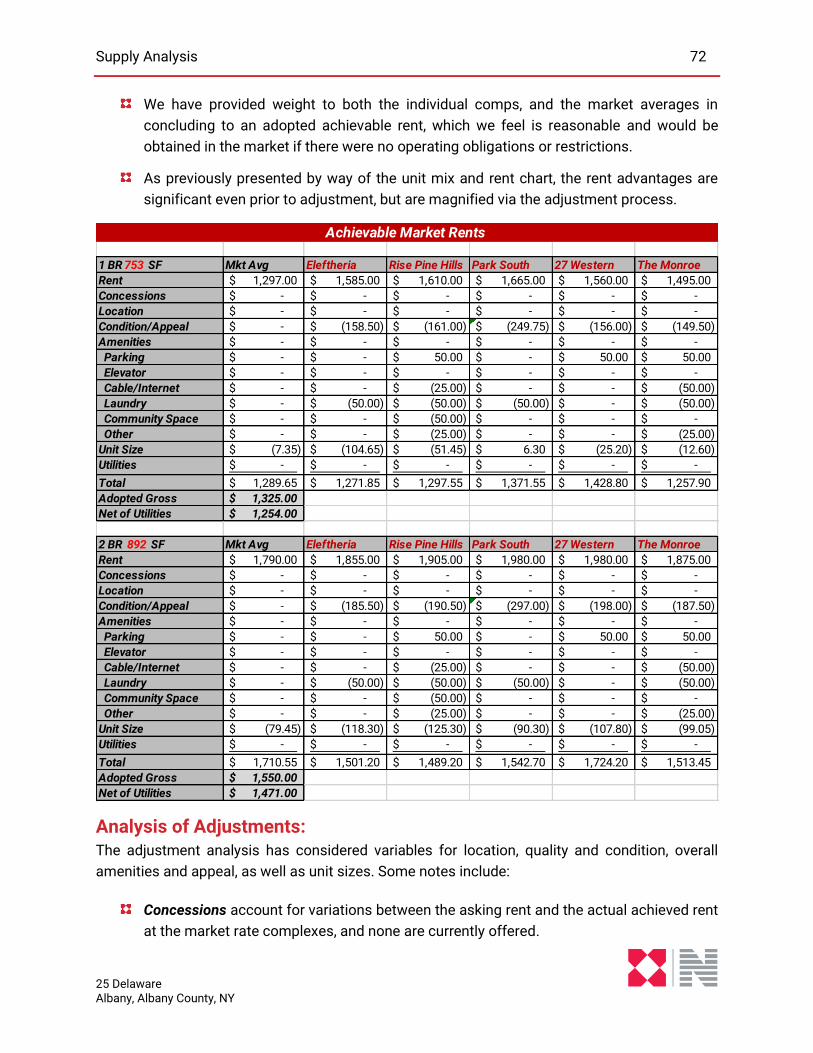
Supply Analysis 72
25 Delaware Albany, Albany County, NY
We have provided weight to both the individual comps, and the market averages in
concluding to an adopted achievable rent, which we feel is reasonable and would be
obtained in the market if there were no operating obligations or restrictions.
As previously presented by way of the unit mix and rent chart, the rent advantages are
significant even prior to adjustment, but are magnified via the adjustment process.
Analysis of Adjustments: The adjustment analysis has considered variables for location, quality and condition, overall
amenities and appeal, as well as unit sizes. Some notes include:
Concessions account for variations between the asking rent and the actual achieved rent
at the market rate complexes, and none are currently offered.
1 BR 753 SF Mkt Avg Eleftheria Rise Pine Hills Park South 27 Western The Monroe
Rent 1,297.00$ 1,585.00$ 1,610.00$ 1,665.00$ 1,560.00$ 1,495.00$
Concessions -$ -$ -$ -$ -$ -$
Location -$ -$ -$ -$ -$ -$
Condition/Appeal -$ (158.50)$ (161.00)$ (249.75)$ (156.00)$ (149.50)$
Amenities -$ -$ -$ -$ -$ -$
Parking -$ -$ 50.00$ -$ 50.00$ 50.00$
Elevator -$ -$ -$ -$ -$ -$
Cable/Internet -$ -$ (25.00)$ -$ -$ (50.00)$
Laundry -$ (50.00)$ (50.00)$ (50.00)$ -$ (50.00)$
Community Space -$ -$ (50.00)$ -$ -$ -$
Other -$ -$ (25.00)$ -$ -$ (25.00)$
Unit Size (7.35)$ (104.65)$ (51.45)$ 6.30$ (25.20)$ (12.60)$
Utilities -$ -$ -$ -$ -$ -$
Total 1,289.65$ 1,271.85$ 1,297.55$ 1,371.55$ 1,428.80$ 1,257.90$
Adopted Gross 1,325.00$
Net of Utilities 1,254.00$
2 BR 892 SF Mkt Avg Eleftheria Rise Pine Hills Park South 27 Western The Monroe
Rent 1,790.00$ 1,855.00$ 1,905.00$ 1,980.00$ 1,980.00$ 1,875.00$
Concessions -$ -$ -$ -$ -$ -$
Location -$ -$ -$ -$ -$ -$
Condition/Appeal -$ (185.50)$ (190.50)$ (297.00)$ (198.00)$ (187.50)$
Amenities -$ -$ -$ -$ -$ -$
Parking -$ -$ 50.00$ -$ 50.00$ 50.00$
Elevator -$ -$ -$ -$ -$ -$
Cable/Internet -$ -$ (25.00)$ -$ -$ (50.00)$
Laundry -$ (50.00)$ (50.00)$ (50.00)$ -$ (50.00)$
Community Space -$ -$ (50.00)$ -$ -$ -$
Other -$ -$ (25.00)$ -$ -$ (25.00)$
Unit Size (79.45)$ (118.30)$ (125.30)$ (90.30)$ (107.80)$ (99.05)$
Utilities -$ -$ -$ -$ -$ -$
Total 1,710.55$ 1,501.20$ 1,489.20$ 1,542.70$ 1,724.20$ 1,513.45$
Adopted Gross 1,550.00$
Net of Utilities 1,471.00$
Achievable Market Rents
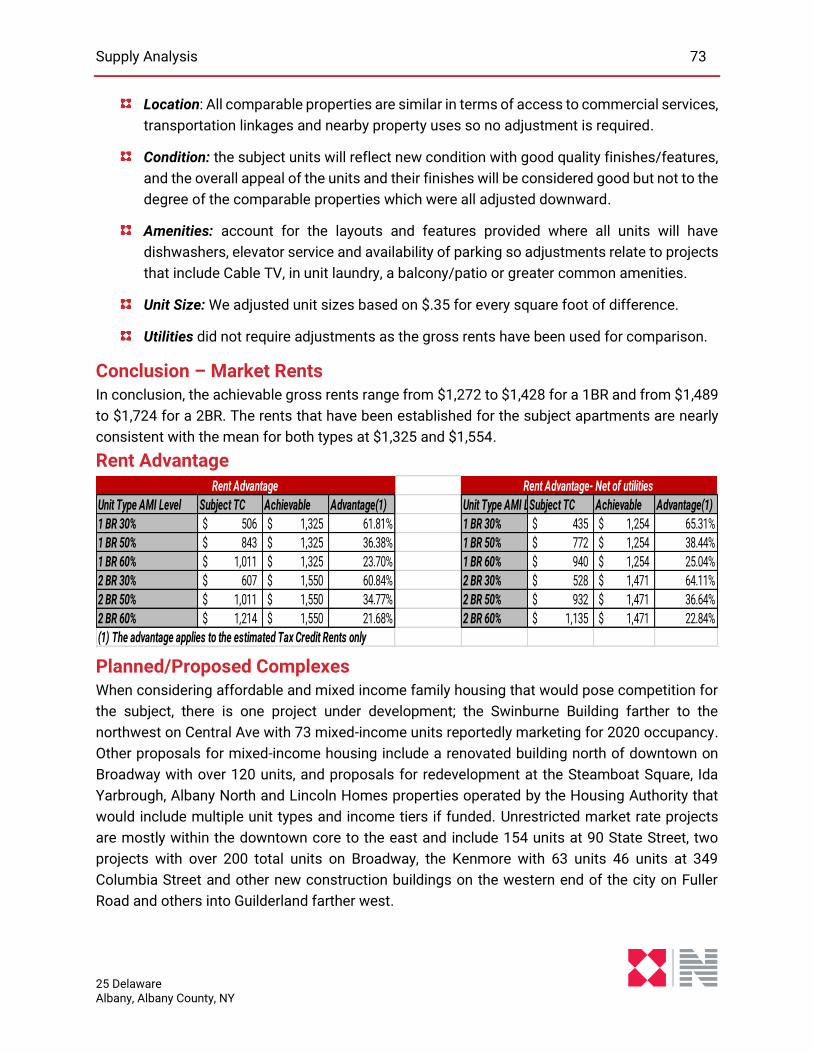
Supply Analysis 73
25 Delaware Albany, Albany County, NY
Location: All comparable properties are similar in terms of access to commercial services,
transportation linkages and nearby property uses so no adjustment is required.
Condition: the subject units will reflect new condition with good quality finishes/features,
and the overall appeal of the units and their finishes will be considered good but not to the
degree of the comparable properties which were all adjusted downward.
Amenities: account for the layouts and features provided where all units will have
dishwashers, elevator service and availability of parking so adjustments relate to projects
that include Cable TV, in unit laundry, a balcony/patio or greater common amenities.
Unit Size: We adjusted unit sizes based on $.35 for every square foot of difference.
Utilities did not require adjustments as the gross rents have been used for comparison.
Conclusion – Market Rents In conclusion, the achievable gross rents range from $1,272 to $1,428 for a 1BR and from $1,489
to $1,724 for a 2BR. The rents that have been established for the subject apartments are nearly
consistent with the mean for both types at $1,325 and $1,554.
Rent Advantage
Planned/Proposed Complexes When considering affordable and mixed income family housing that would pose competition for
the subject, there is one project under development; the Swinburne Building farther to the
northwest on Central Ave with 73 mixed-income units reportedly marketing for 2020 occupancy.
Other proposals for mixed-income housing include a renovated building north of downtown on
Broadway with over 120 units, and proposals for redevelopment at the Steamboat Square, Ida
Yarbrough, Albany North and Lincoln Homes properties operated by the Housing Authority that
would include multiple unit types and income tiers if funded. Unrestricted market rate projects
are mostly within the downtown core to the east and include 154 units at 90 State Street, two
projects with over 200 total units on Broadway, the Kenmore with 63 units 46 units at 349
Columbia Street and other new construction buildings on the western end of the city on Fuller
Road and others into Guilderland farther west.
Unit Type AMI Level Subject TC Achievable Advantage(1) Unit Type AMI LevelSubject TC Achievable Advantage(1)
1 BR 30% 506$ 1,325$ 61.81% 1 BR 30% 435$ 1,254$ 65.31%
1 BR 50% 843$ 1,325$ 36.38% 1 BR 50% 772$ 1,254$ 38.44%
1 BR 60% 1,011$ 1,325$ 23.70% 1 BR 60% 940$ 1,254$ 25.04%
2 BR 30% 607$ 1,550$ 60.84% 2 BR 30% 528$ 1,471$ 64.11%
2 BR 50% 1,011$ 1,550$ 34.77% 2 BR 50% 932$ 1,471$ 36.64%
2 BR 60% 1,214$ 1,550$ 21.68% 2 BR 60% 1,135$ 1,471$ 22.84%
(1) The advantage applies to the estimated Tax Credit Rents only
Rent Advantage Rent Advantage- Net of utilities
Supply Analysis 74
25 Delaware Albany, Albany County, NY
New Affordable Housing: There have been 383 new affordable units created (or under development) in the PMA in the last
10 years. This does not include the previous phases of Ida Yarbrough, and some of the new units
at the Swinburne have income limits of up to 120% of AMI. The new projects include:
The Swinburne: 74 units – 2020
Clinton Ave RSS: 20 units – 2020
Clinton Ave Historic (Phase I): 210 units – 2019
Sheridan Hollow Village: 57 units – 2015
Academy Lofts: 22 units – 2013
Capital South: 99 units - 2011
Affordable Projects Charts on the following pages provide a summary of affordable housing projects in the sample
including the heavier concentration of deep subsidy developments in the area.

Supply Analysis 75
25 Delaware Albany, Albany County, NY
Property Name Municipality Proj. Type AMI Units: Type/Prj† Yr. Built Occ.(Avg) Utils* Sq. Ft. Gross Rent‡ Gross $/SF‡
Sheridan Hollow Village Phase I Albany Family Tax Credit 60% 13 / 57 2015 95% 700 744.00$ 1.06$
Sheridan Hollow Village Phase I Albany Family Tax Credit 40% 6 / 57 2015 700 544.00$ 0.78$
Sheridan Hollow Village Phase I Albany Family Tax Credit 50% 5 / 57 2015 700 628.00$ 0.90$
Sheridan Hollow Village Phase I Albany Family Tax Credit 70% 7 / 57 2015 700 885.00$ 1.26$
Swinburne Building Albany Mixed Income 2 / 74 2020 801 1,215.00$ 1.52$
Swinburne Building Albany Special Needs PBA 17 / 74 2020 801 972.00$ 1.21$
Swinburne Building Albany Family Tax Credit 90% 3 / 74 2020 801 1,215.00$ 1.52$
Swinburne Building Albany Family Tax Credit 60% 22 / 74 2020 801 972.00$ 1.21$
IDA Yarbrough Redev. Phase 1 & 2 Albany Family Tax Credit 60% 7 / 61/76 1960's 100% 750 922.00$ 1.23$
IDA Yarbrough Redev. Phase 1 & 2 Albany Family Tax Credit 80% 3 / 61/76 1960's 750 940.00$ 1.25$
IDA Yarbrough Redev. Phase 1 & 2 Albany Family Tax Credit PBA 8 / 61/76 1960's 750 784.00$ 1.05$
IDA Yarbrough Redev. Phase 1 & 2 Albany Family Tax Credit ACC 1 / 61/76 1960's 750 784.00$ 1.05$
Clinton Ave Historic Apartments Albany Family Tax Credit 60% 75 / 210 2019 100% H E 725 685.00$ 0.94$
Clinton Ave Historic Apartments Albany Special Needs PBA 37 / 210 2019 H E 725 810.00$ 1.12$
Clinton Ave Historic Apartments Albany Family Tax Credit 90% 18 / 210 2019 H E 728 891.00$ 1.22$
Academy Lofts Albany Family Tax Credit 50% 11 / 22 2013 100% 765 709.00$ 0.93$
Knox Street Apartments Albany Family Tax Credit 50% n/a / 47 2007 100% H 781.00$
Knox Street Apartments Albany Family Tax Credit 60% 26 / 47 2007 H 626 794.00$ 1.27$
Knox Street Apartments Albany HUD Sec. 8 PBA 8 / 47 2007 H 626 787.00$ 1.26$
Historic Pastures/Mansions Apartments Albany Family Tax Credit 60% 39 / 244 1920-2015 100% 762.50$
Historic Pastures/Mansions Apartments Albany Family Tax Credit PBA 18 / 244 1920-2015 950.00$
Historic Pastures/Mansions Apartments Albany Family Tax Credit PBA 40 / 244 1920-2015 897.00$
Capital South Phase II & III Allbany Family Tax Credit 60% 2 / 43 2010/2011 95% 800 715.00$ 0.89$
Capital South Phase II & III Allbany Family Tax Credit 50% 26 / 43 2010/2011 800 569.00$ 0.71$
Capital South Phase II & III Allbany Family Tax Credit 30% 2 / 43 2010/2011 800 327.00$ 0.41$
Eagle Court & Jared Holt Apts Albany HUD Sec. 8 PBA 20 / 52 Rehab 2008 96% 640 800.00$ 1.25$
Eagle Court & Jared Holt Apts Albany Family Tax Credit 60% 14 / 52 Rehab 2008 640 760.00$ 1.19$
St Joseph's Turnkey (Arbor Hill) Albany Family Tax Credit n/a / 26 1990 100% 800.00$
Capital Woods Albany Family Tax Credit 60% 26 / 146 1970; Rehab 1999/2000 100% H 670 732.00$ 1.09$
Skyline Gardens Apartments Albany HUD Sec. 8 PBA 31 / 189 1973 100% 593 918.00$ 1.55$
Skyline Gardens Apartments Albany Family Tax Credit 60% 16 / 189 1973 593 705.00$ 1.19$
Clinton Avenue RSS Albany Special Needs PBA 10 / 20 2020 100% 688 705.00$ 1.02$
Clinton Avenue RSS Albany Family Tax Credit 50% 7 / 20 2020 688 705.00$ 1.02$
Creighton-Storey Homes Albany Public Housing - Family 60% 37 / 128 1965/2007 99% H E 700 541.00$ 0.77$
North Albany (Corning) Homes Albany HUD Sec. 8 50% 8 / 160 2002 100% H E 860 698.00$ 0.81$
Robert Whalen Homes Albany Public Housing - Family PBA 5 / 108 1950's 99% H E 659.00$
Lincoln Square Homes Albany Public Housing PBA 123 / 191 1966/1980s 99% H E 659.00$
1 Bedroom Averages: 99% 722.4 782.82$ 1.08$
Unit Type: 1 Bedroom
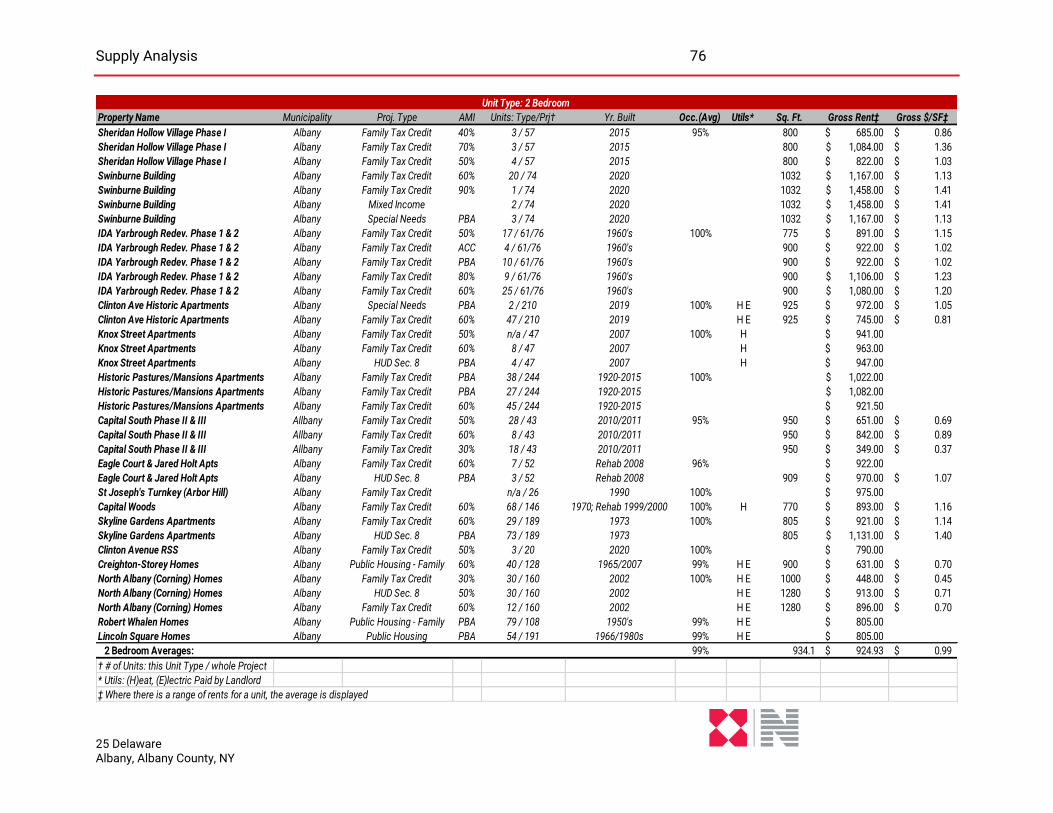
Supply Analysis 76
25 Delaware Albany, Albany County, NY
Property Name Municipality Proj. Type AMI Units: Type/Prj† Yr. Built Occ.(Avg) Utils* Sq. Ft. Gross Rent‡ Gross $/SF‡
Sheridan Hollow Village Phase I Albany Family Tax Credit 40% 3 / 57 2015 95% 800 685.00$ 0.86$
Sheridan Hollow Village Phase I Albany Family Tax Credit 70% 3 / 57 2015 800 1,084.00$ 1.36$
Sheridan Hollow Village Phase I Albany Family Tax Credit 50% 4 / 57 2015 800 822.00$ 1.03$
Swinburne Building Albany Family Tax Credit 60% 20 / 74 2020 1032 1,167.00$ 1.13$
Swinburne Building Albany Family Tax Credit 90% 1 / 74 2020 1032 1,458.00$ 1.41$
Swinburne Building Albany Mixed Income 2 / 74 2020 1032 1,458.00$ 1.41$
Swinburne Building Albany Special Needs PBA 3 / 74 2020 1032 1,167.00$ 1.13$
IDA Yarbrough Redev. Phase 1 & 2 Albany Family Tax Credit 50% 17 / 61/76 1960's 100% 775 891.00$ 1.15$
IDA Yarbrough Redev. Phase 1 & 2 Albany Family Tax Credit ACC 4 / 61/76 1960's 900 922.00$ 1.02$
IDA Yarbrough Redev. Phase 1 & 2 Albany Family Tax Credit PBA 10 / 61/76 1960's 900 922.00$ 1.02$
IDA Yarbrough Redev. Phase 1 & 2 Albany Family Tax Credit 80% 9 / 61/76 1960's 900 1,106.00$ 1.23$
IDA Yarbrough Redev. Phase 1 & 2 Albany Family Tax Credit 60% 25 / 61/76 1960's 900 1,080.00$ 1.20$
Clinton Ave Historic Apartments Albany Special Needs PBA 2 / 210 2019 100% H E 925 972.00$ 1.05$
Clinton Ave Historic Apartments Albany Family Tax Credit 60% 47 / 210 2019 H E 925 745.00$ 0.81$
Knox Street Apartments Albany Family Tax Credit 50% n/a / 47 2007 100% H 941.00$
Knox Street Apartments Albany Family Tax Credit 60% 8 / 47 2007 H 963.00$
Knox Street Apartments Albany HUD Sec. 8 PBA 4 / 47 2007 H 947.00$
Historic Pastures/Mansions Apartments Albany Family Tax Credit PBA 38 / 244 1920-2015 100% 1,022.00$
Historic Pastures/Mansions Apartments Albany Family Tax Credit PBA 27 / 244 1920-2015 1,082.00$
Historic Pastures/Mansions Apartments Albany Family Tax Credit 60% 45 / 244 1920-2015 921.50$
Capital South Phase II & III Allbany Family Tax Credit 50% 28 / 43 2010/2011 95% 950 651.00$ 0.69$
Capital South Phase II & III Allbany Family Tax Credit 60% 8 / 43 2010/2011 950 842.00$ 0.89$
Capital South Phase II & III Allbany Family Tax Credit 30% 18 / 43 2010/2011 950 349.00$ 0.37$
Eagle Court & Jared Holt Apts Albany Family Tax Credit 60% 7 / 52 Rehab 2008 96% 922.00$
Eagle Court & Jared Holt Apts Albany HUD Sec. 8 PBA 3 / 52 Rehab 2008 909 970.00$ 1.07$
St Joseph's Turnkey (Arbor Hill) Albany Family Tax Credit n/a / 26 1990 100% 975.00$
Capital Woods Albany Family Tax Credit 60% 68 / 146 1970; Rehab 1999/2000 100% H 770 893.00$ 1.16$
Skyline Gardens Apartments Albany Family Tax Credit 60% 29 / 189 1973 100% 805 921.00$ 1.14$
Skyline Gardens Apartments Albany HUD Sec. 8 PBA 73 / 189 1973 805 1,131.00$ 1.40$
Clinton Avenue RSS Albany Family Tax Credit 50% 3 / 20 2020 100% 790.00$
Creighton-Storey Homes Albany Public Housing - Family 60% 40 / 128 1965/2007 99% H E 900 631.00$ 0.70$
North Albany (Corning) Homes Albany Family Tax Credit 30% 30 / 160 2002 100% H E 1000 448.00$ 0.45$
North Albany (Corning) Homes Albany HUD Sec. 8 50% 30 / 160 2002 H E 1280 913.00$ 0.71$
North Albany (Corning) Homes Albany Family Tax Credit 60% 12 / 160 2002 H E 1280 896.00$ 0.70$
Robert Whalen Homes Albany Public Housing - Family PBA 79 / 108 1950's 99% H E 805.00$
Lincoln Square Homes Albany Public Housing PBA 54 / 191 1966/1980s 99% H E 805.00$
2 Bedroom Averages: 99% 934.1 924.93$ 0.99$
† # of Units: this Unit Type / whole Project
* Utils: (H)eat, (E)lectric Paid by Landlord
‡ Where there is a range of rents for a unit, the average is displayed
Unit Type: 2 Bedroom
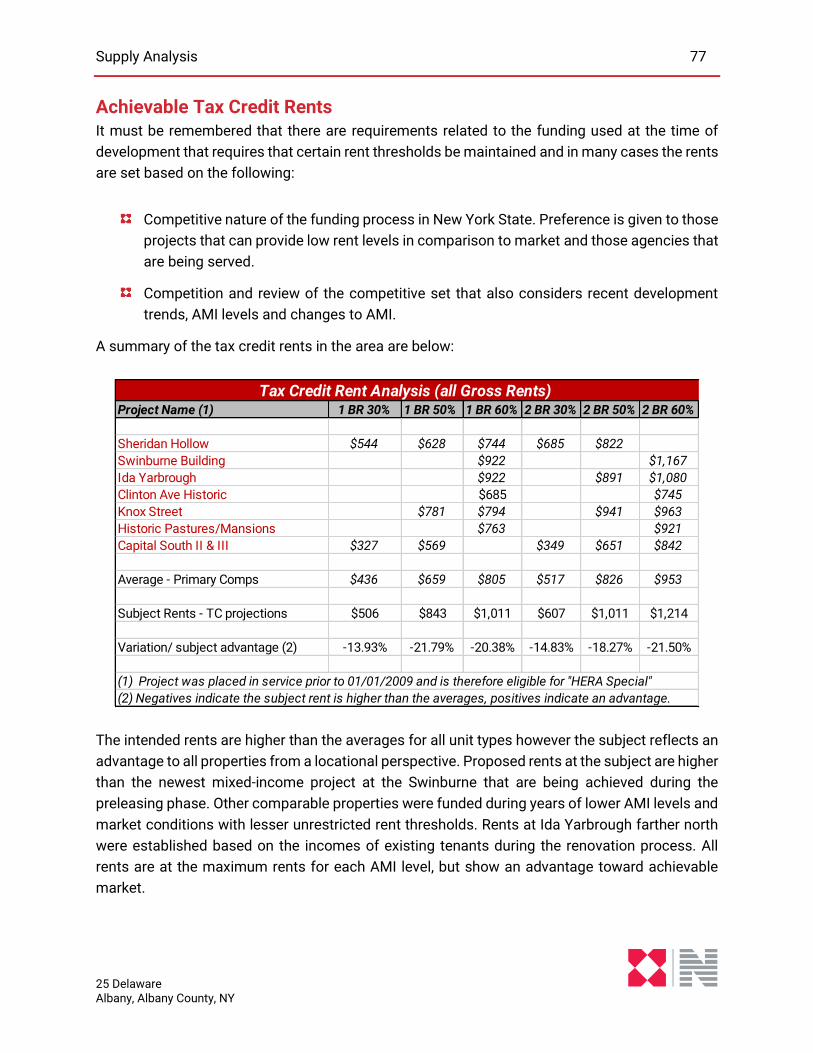
Supply Analysis 77
25 Delaware Albany, Albany County, NY
Achievable Tax Credit Rents It must be remembered that there are requirements related to the funding used at the time of
development that requires that certain rent thresholds be maintained and in many cases the rents
are set based on the following:
Competitive nature of the funding process in New York State. Preference is given to those
projects that can provide low rent levels in comparison to market and those agencies that
are being served.
Competition and review of the competitive set that also considers recent development
trends, AMI levels and changes to AMI.
A summary of the tax credit rents in the area are below:
The intended rents are higher than the averages for all unit types however the subject reflects an
advantage to all properties from a locational perspective. Proposed rents at the subject are higher
than the newest mixed-income project at the Swinburne that are being achieved during the
preleasing phase. Other comparable properties were funded during years of lower AMI levels and
market conditions with lesser unrestricted rent thresholds. Rents at Ida Yarbrough farther north
were established based on the incomes of existing tenants during the renovation process. All
rents are at the maximum rents for each AMI level, but show an advantage toward achievable
market.
Project Name (1) 1 BR 30% 1 BR 50% 1 BR 60% 2 BR 30% 2 BR 50% 2 BR 60%
Sheridan Hollow $544 $628 $744 $685 $822
Swinburne Building $922 $1,167
Ida Yarbrough $922 $891 $1,080
Clinton Ave Historic $685 $745
Knox Street $781 $794 $941 $963
Historic Pastures/Mansions $763 $921
Capital South II & III $327 $569 $349 $651 $842
Average - Primary Comps $436 $659 $805 $517 $826 $953
Subject Rents - TC projections $506 $843 $1,011 $607 $1,011 $1,214
Variation/ subject advantage (2) -13.93% -21.79% -20.38% -14.83% -18.27% -21.50%
(1) Project was placed in service prior to 01/01/2009 and is therefore eligible for "HERA Special"
(2) Negatives indicate the subject rent is higher than the averages, positives indicate an advantage.
Tax Credit Rent Analysis (all Gross Rents)
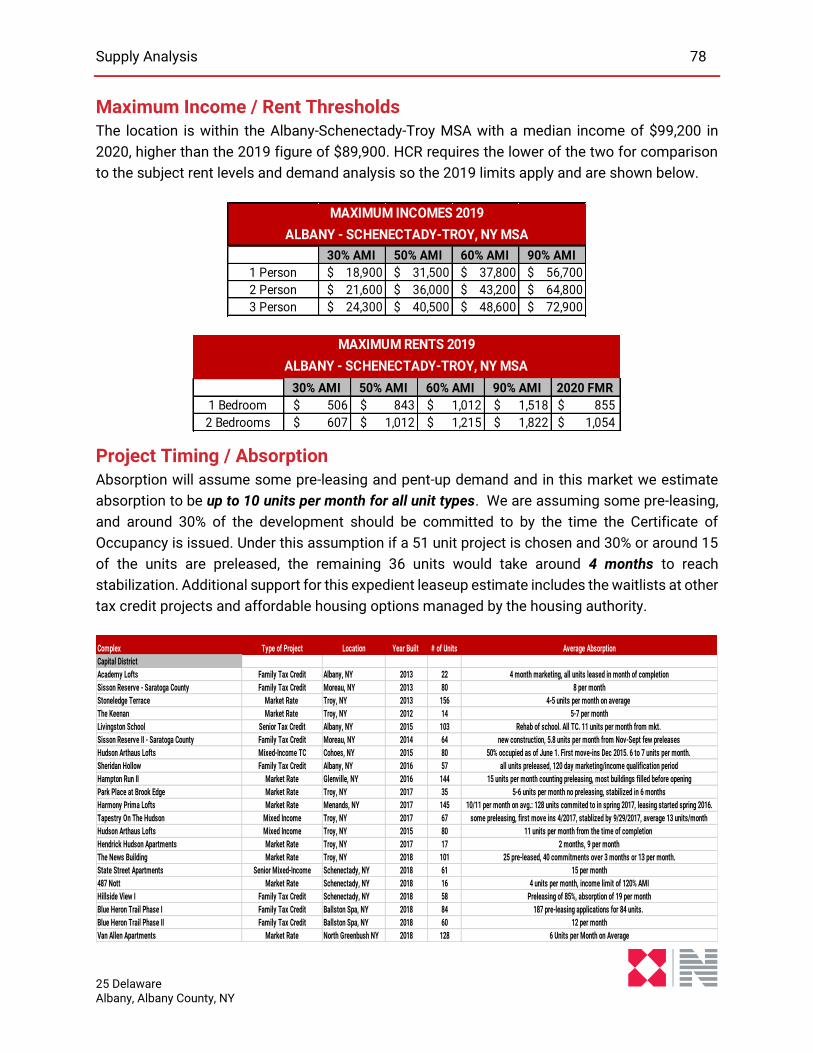
Supply Analysis 78
25 Delaware Albany, Albany County, NY
Maximum Income / Rent Thresholds The location is within the Albany-Schenectady-Troy MSA with a median income of $99,200 in
2020, higher than the 2019 figure of $89,900. HCR requires the lower of the two for comparison
to the subject rent levels and demand analysis so the 2019 limits apply and are shown below.
Project Timing / Absorption Absorption will assume some pre-leasing and pent-up demand and in this market we estimate
absorption to be up to 10 units per month for all unit types. We are assuming some pre-leasing,
and around 30% of the development should be committed to by the time the Certificate of
Occupancy is issued. Under this assumption if a 51 unit project is chosen and 30% or around 15
of the units are preleased, the remaining 36 units would take around 4 months to reach
stabilization. Additional support for this expedient leaseup estimate includes the waitlists at other
tax credit projects and affordable housing options managed by the housing authority.
30% AMI 50% AMI 60% AMI 90% AMI
1 Person $ 18,900 $ 31,500 $ 37,800 $ 56,700
2 Person $ 21,600 $ 36,000 $ 43,200 $ 64,800
3 Person $ 24,300 $ 40,500 $ 48,600 $ 72,900
ALBANY - SCHENECTADY-TROY, NY MSA
MAXIMUM INCOMES 2019
30% AMI 50% AMI 60% AMI 90% AMI 2020 FMR
1 Bedroom $ 506 $ 843 $ 1,012 $ 1,518 $ 855
2 Bedrooms $ 607 $ 1,012 $ 1,215 $ 1,822 $ 1,054
ALBANY - SCHENECTADY-TROY, NY MSA
MAXIMUM RENTS 2019
Complex Type of Project Location Year Built # of Units Average Absorption
Capital District
Academy Lofts Family Tax Credit Albany, NY 2013 22 4 month marketing, all units leased in month of completion
Sisson Reserve - Saratoga County Family Tax Credit Moreau, NY 2013 80 8 per month
Stoneledge Terrace Market Rate Troy, NY 2013 156 4-5 units per month on average
The Keenan Market Rate Troy, NY 2012 14 5-7 per month
Livingston School Senior Tax Credit Albany, NY 2015 103 Rehab of school. All TC. 11 units per month from mkt.
Sisson Reserve II - Saratoga County Family Tax Credit Moreau, NY 2014 64 new construction, 5.8 units per month from Nov-Sept few preleases
Hudson Arthaus Lofts Mixed-Income TC Cohoes, NY 2015 80 50% occupied as of June 1. First move-ins Dec 2015. 6 to 7 units per month.
Sheridan Hollow Family Tax Credit Albany, NY 2016 57 all units preleased, 120 day marketing/income qualification period
Hampton Run II Market Rate Glenville, NY 2016 144 15 units per month counting preleasing, most buildings filled before opening
Park Place at Brook Edge Market Rate Troy, NY 2017 35 5-6 units per month no preleasing, stabilized in 6 months
Harmony Prima Lofts Market Rate Menands, NY 2017 145 10/11 per month on avg.: 128 units commited to in spring 2017, leasing started spring 2016.
Tapestry On The Hudson Mixed Income Troy, NY 2017 67 some preleasing, first move ins 4/2017, stablized by 9/29/2017, average 13 units/month
Hudson Arthaus Lofts Mixed Income Troy, NY 2015 80 11 units per month from the time of completion
Hendrick Hudson Apartments Market Rate Troy, NY 2017 17 2 months, 9 per month
The News Building Market Rate Troy, NY 2018 101 25 pre-leased, 40 commitments over 3 months or 13 per month.
State Street Apartments Senior Mixed-Income Schenectady, NY 2018 61 15 per month
487 Nott Market Rate Schenectady, NY 2018 16 4 units per month, income limit of 120% AMI
Hillside View I Family Tax Credit Schenectady, NY 2018 58 Preleasing of 85%, absorption of 19 per month
Blue Heron Trail Phase I Family Tax Credit Ballston Spa, NY 2018 84 187 pre-leasing applications for 84 units.
Blue Heron Trail Phase II Family Tax Credit Ballston Spa, NY 2018 60 12 per month
Van Allen Apartments Market Rate North Greenbush NY 2018 128 6 Units per Month on Average
Supply Analysis 79
25 Delaware Albany, Albany County, NY
Conclusions The subject rents are set at levels that are appropriate for this neighborhood outside the
downtown core that has good access to employment, commercial services and transportation
linkages in the immediate area.
Demand Analysis 80
25 Delaware Albany, Albany County, NY
Demand Analysis
Introduction The capture rate is defined by NCHMA guidelines as:
“The percentage of age, size, and income qualified renter households in the primary market
area that the property must capture to fill the units. Funding agencies may require
restrictions to the qualified households used in the calculation including age, income, living
in substandard housing, mover-ship and other comparable factors. The Capture Rate is
calculated by dividing the total number of units at the property by the total number of age,
size and income qualified renter households in the primary market area.”
There are many variations of capture analysis and demand modeling, however, and most state
agencies have specific requirements and/or guidelines. Throughout the remainder of the capture
analysis, the following is important to recognize:
Income qualification for the 30%/50%/60% units will be based on underwriting standards
that reflect low end affordability established at 48% of the gross rent with a maximum
allowable at 30% of the gross rent, or the tax credit maximum levels whichever is lower.
The middle income units evaluate support from the 60% AMI maximum to the 90% AMI
limit.
Utilization of HISTA information which is based on 2013-2017 American Fact Finder and
2010 Census data with projections for 2020 and 2025. The HISTA Data will be used as the
primary source for referencing demographics as it breaks out households not only by
tenure and age, but by household size and income in $10,000 increments which are pro-
rated for each type/tier. This data was used for application to the demand model.
We have considered family households ages 18 – 61 for application to the demand as this
is the target market.
As indicated, we will prepare demand modeling that follows NCHMA standards and guidelines
and is a more typical analysis prepared by NKF demonstrating a “net” Demand Model. This
methodology evaluates households after eliminating all existing affordable housing; accordingly,
the assumption can be that these residents are not located in current affordable or comparable
market rate housing situations that reflect family specific developments. This type of analysis is
clearly useful in regards to identifying the prospective impact on existing affordable housing, and
also establishing the need/demand for housing that targets the specific income groups in
question.
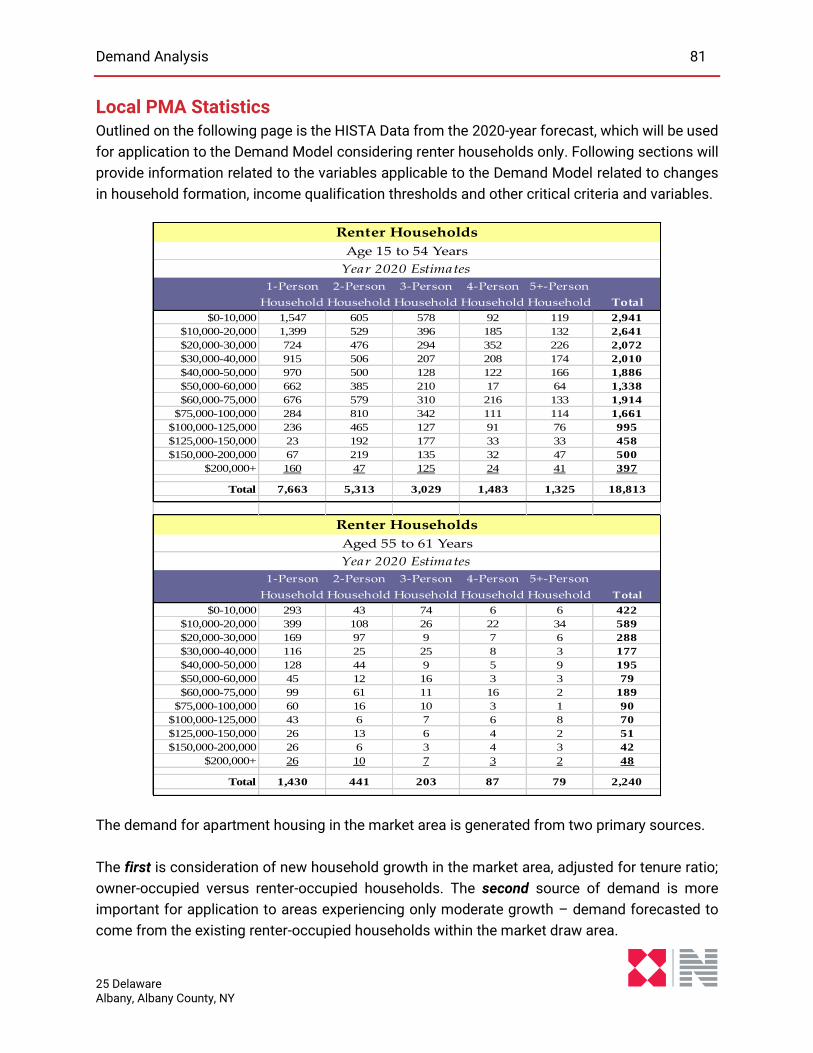
Demand Analysis 81
25 Delaware Albany, Albany County, NY
Local PMA Statistics Outlined on the following page is the HISTA Data from the 2020-year forecast, which will be used
for application to the Demand Model considering renter households only. Following sections will
provide information related to the variables applicable to the Demand Model related to changes
in household formation, income qualification thresholds and other critical criteria and variables.
The demand for apartment housing in the market area is generated from two primary sources.
The first is consideration of new household growth in the market area, adjusted for tenure ratio;
owner-occupied versus renter-occupied households. The second source of demand is more
important for application to areas experiencing only moderate growth – demand forecasted to
come from the existing renter-occupied households within the market draw area.
1-Person 2-Person 3-Person 4-Person 5+-Person
Household Household Household Household Household Total
$0-10,000 1,547 605 578 92 119 2,941
$10,000-20,000 1,399 529 396 185 132 2,641
$20,000-30,000 724 476 294 352 226 2,072
$30,000-40,000 915 506 207 208 174 2,010
$40,000-50,000 970 500 128 122 166 1,886
$50,000-60,000 662 385 210 17 64 1,338
$60,000-75,000 676 579 310 216 133 1,914
$75,000-100,000 284 810 342 111 114 1,661
$100,000-125,000 236 465 127 91 76 995
$125,000-150,000 23 192 177 33 33 458
$150,000-200,000 67 219 135 32 47 500
$200,000+ 160 47 125 24 41 397
Total 7,663 5,313 3,029 1,483 1,325 18,813
1-Person 2-Person 3-Person 4-Person 5+-Person
Household Household Household Household Household Total
$0-10,000 293 43 74 6 6 422
$10,000-20,000 399 108 26 22 34 589
$20,000-30,000 169 97 9 7 6 288
$30,000-40,000 116 25 25 8 3 177
$40,000-50,000 128 44 9 5 9 195
$50,000-60,000 45 12 16 3 3 79
$60,000-75,000 99 61 11 16 2 189
$75,000-100,000 60 16 10 3 1 90
$100,000-125,000 43 6 7 6 8 70
$125,000-150,000 26 13 6 4 2 51
$150,000-200,000 26 6 3 4 3 42
$200,000+ 26 10 7 3 2 48
Total 1,430 441 203 87 79 2,240
Renter Households
Renter Households
Age 15 to 54 Years
Year 2020 Estimates
Aged 55 to 61 Years
Year 2020 Estimates
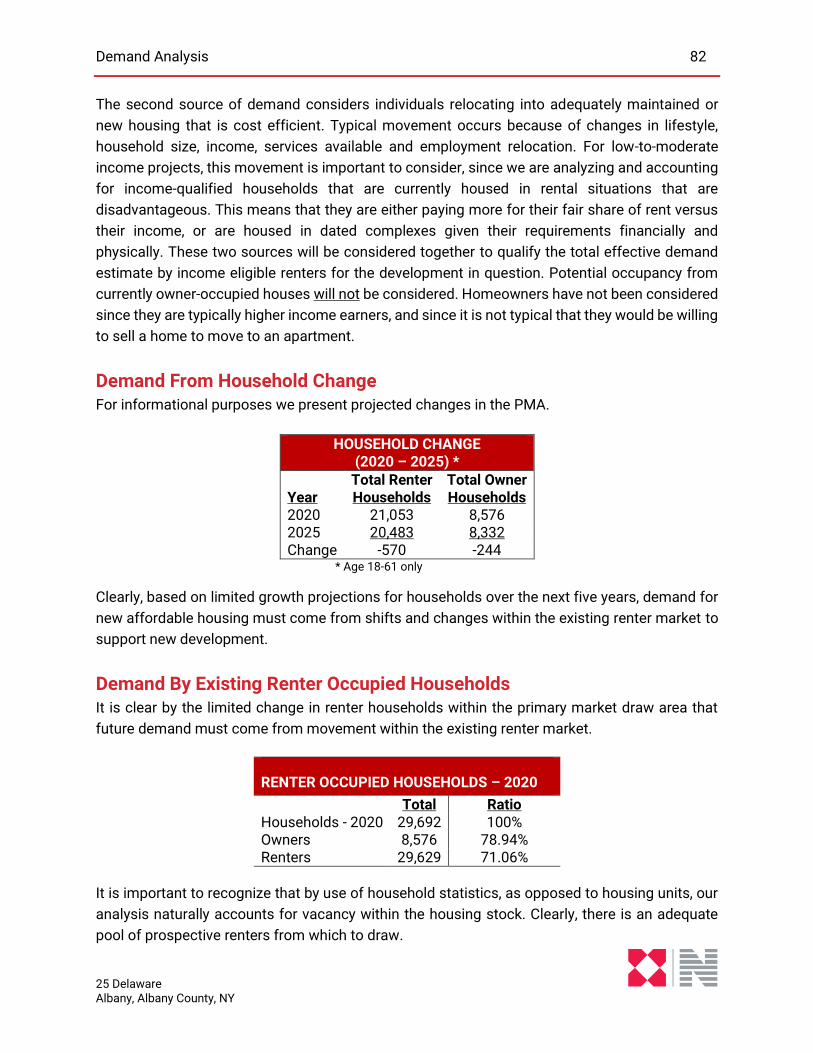
Demand Analysis 82
25 Delaware Albany, Albany County, NY
The second source of demand considers individuals relocating into adequately maintained or
new housing that is cost efficient. Typical movement occurs because of changes in lifestyle,
household size, income, services available and employment relocation. For low-to-moderate
income projects, this movement is important to consider, since we are analyzing and accounting
for income-qualified households that are currently housed in rental situations that are
disadvantageous. This means that they are either paying more for their fair share of rent versus
their income, or are housed in dated complexes given their requirements financially and
physically. These two sources will be considered together to qualify the total effective demand
estimate by income eligible renters for the development in question. Potential occupancy from
currently owner-occupied houses will not be considered. Homeowners have not been considered
since they are typically higher income earners, and since it is not typical that they would be willing
to sell a home to move to an apartment.
Demand From Household Change For informational purposes we present projected changes in the PMA.
HOUSEHOLD CHANGE (2020 – 2025) *
Year
Total Renter Households
Total Owner Households
2020 21,053 8,576 2025 20,483 8,332 Change -570 -244
* Age 18-61 only
Clearly, based on limited growth projections for households over the next five years, demand for
new affordable housing must come from shifts and changes within the existing renter market to
support new development.
Demand By Existing Renter Occupied Households It is clear by the limited change in renter households within the primary market draw area that
future demand must come from movement within the existing renter market.
RENTER OCCUPIED HOUSEHOLDS – 2020
Total Ratio Households - 2020 29,692 100% Owners 8,576 78.94% Renters 29,629 71.06%
It is important to recognize that by use of household statistics, as opposed to housing units, our
analysis naturally accounts for vacancy within the housing stock. Clearly, there is an adequate
pool of prospective renters from which to draw.
Demand Analysis 83
25 Delaware Albany, Albany County, NY
Project Eliminations Prior to applying mobility influences to the existing renter household base, certain deductions
must be applied to equate to a net demand from existing renter households. The following
deductions were made:
Residents in group quarters have not been considered since this segment of the
population is not considered in the demographics outlined.
Conventional apartments were not eliminated, as it is felt that all income-qualified
households in these units would consider occupancy at the subject. When considering
that the development in question will reflect basically new construction at completion, in
an adequate location for family housing, it will be in an advantageous position to attract
low-to-moderate income households compared to area market rate facilities. The general
assumption is that if income qualified low-to-moderate income households currently
reside in market rate projects, then they would likely choose the subject development,
since it is more rent affordable than most of the market rate projects in the area, and
provides new finishes, with sound services.
The largest deduction accounts for elimination of existing subsidized family complexes
within the market draw area, since it is desired that we establish a “net” need analysis that
deducts existing subsidized units. By doing so, we are identifying unsatisfied, income
qualified renter households, who currently reside in unfavorable housing either from a
physical standpoint, or financial standpoint.
A summarization of the deductions applied is below.
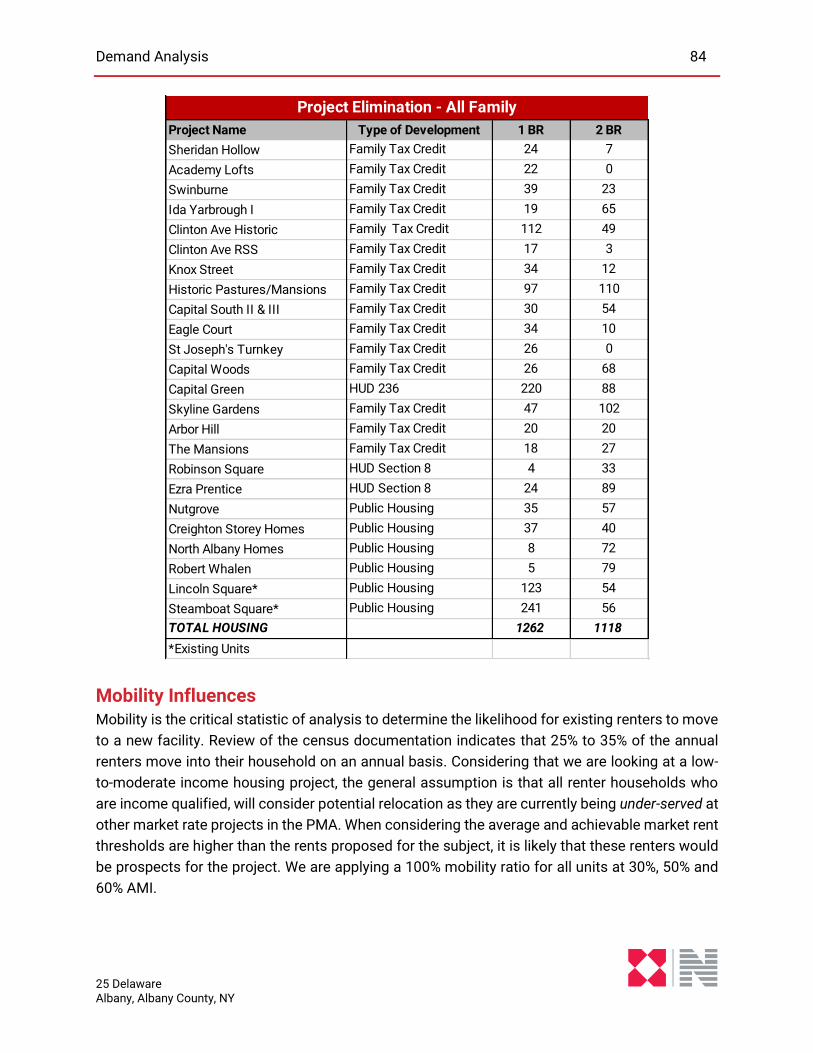
Demand Analysis 84
25 Delaware Albany, Albany County, NY
Mobility Influences Mobility is the critical statistic of analysis to determine the likelihood for existing renters to move
to a new facility. Review of the census documentation indicates that 25% to 35% of the annual
renters move into their household on an annual basis. Considering that we are looking at a low-
to-moderate income housing project, the general assumption is that all renter households who
are income qualified, will consider potential relocation as they are currently being under-served at
other market rate projects in the PMA. When considering the average and achievable market rent
thresholds are higher than the rents proposed for the subject, it is likely that these renters would
be prospects for the project. We are applying a 100% mobility ratio for all units at 30%, 50% and
60% AMI.
Project Name Type of Development 1 BR 2 BR
Sheridan Hollow Family Tax Credit 24 7
Academy Lofts Family Tax Credit 22 0
Swinburne Family Tax Credit 39 23
Ida Yarbrough I Family Tax Credit 19 65
Clinton Ave Historic Family Tax Credit 112 49
Clinton Ave RSS Family Tax Credit 17 3
Knox Street Family Tax Credit 34 12
Historic Pastures/Mansions Family Tax Credit 97 110
Capital South II & III Family Tax Credit 30 54
Eagle Court Family Tax Credit 34 10
St Joseph's Turnkey Family Tax Credit 26 0
Capital Woods Family Tax Credit 26 68
Capital Green HUD 236 220 88
Skyline Gardens Family Tax Credit 47 102
Arbor Hill Family Tax Credit 20 20
The Mansions Family Tax Credit 18 27
Robinson Square HUD Section 8 4 33
Ezra Prentice HUD Section 8 24 89
Nutgrove Public Housing 35 57
Creighton Storey Homes Public Housing 37 40
North Albany Homes Public Housing 8 72
Robert Whalen Public Housing 5 79
Lincoln Square* Public Housing 123 54
Steamboat Square* Public Housing 241 56
TOTAL HOUSING 1262 1118
*Existing Units
Project Elimination - All Family
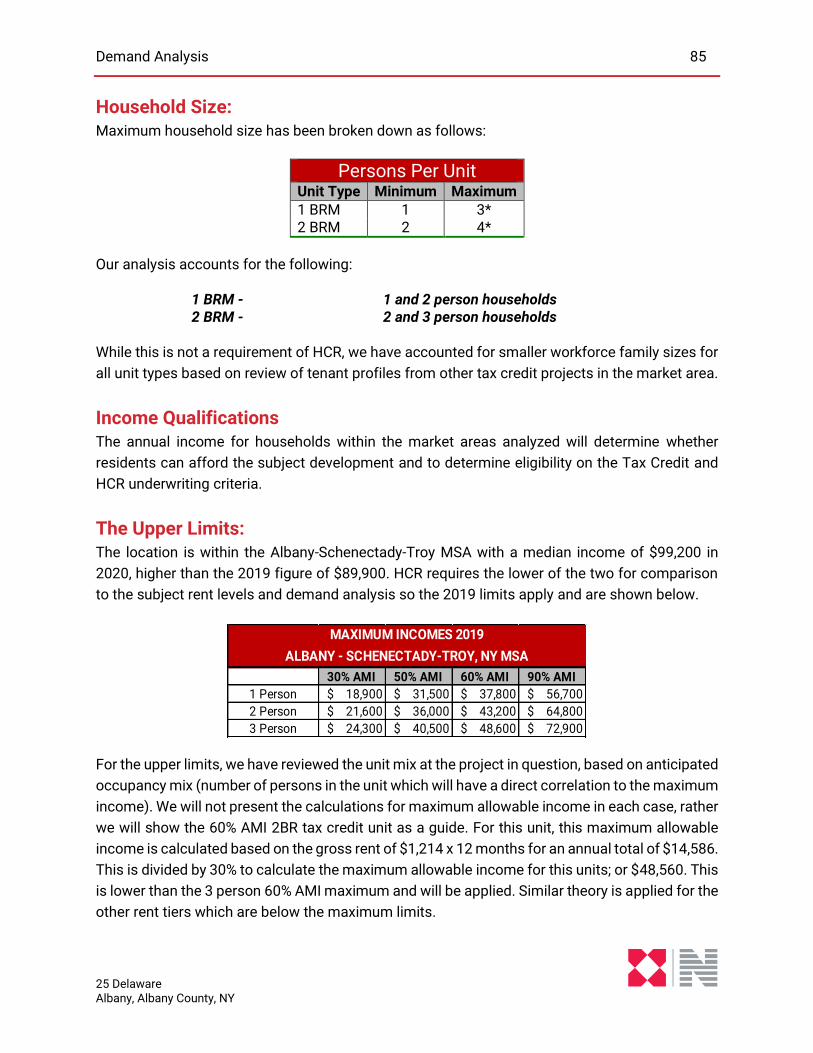
Demand Analysis 85
25 Delaware Albany, Albany County, NY
Household Size: Maximum household size has been broken down as follows:
Persons Per Unit Unit Type Minimum Maximum 1 BRM 1 3* 2 BRM 2 4*
Our analysis accounts for the following:
1 BRM - 1 and 2 person households 2 BRM - 2 and 3 person households
While this is not a requirement of HCR, we have accounted for smaller workforce family sizes for
all unit types based on review of tenant profiles from other tax credit projects in the market area.
Income Qualifications The annual income for households within the market areas analyzed will determine whether
residents can afford the subject development and to determine eligibility on the Tax Credit and
HCR underwriting criteria.
The Upper Limits: The location is within the Albany-Schenectady-Troy MSA with a median income of $99,200 in
2020, higher than the 2019 figure of $89,900. HCR requires the lower of the two for comparison
to the subject rent levels and demand analysis so the 2019 limits apply and are shown below.
For the upper limits, we have reviewed the unit mix at the project in question, based on anticipated
occupancy mix (number of persons in the unit which will have a direct correlation to the maximum
income). We will not present the calculations for maximum allowable income in each case, rather
we will show the 60% AMI 2BR tax credit unit as a guide. For this unit, this maximum allowable
income is calculated based on the gross rent of $1,214 x 12 months for an annual total of $14,586.
This is divided by 30% to calculate the maximum allowable income for this units; or $48,560. This
is lower than the 3 person 60% AMI maximum and will be applied. Similar theory is applied for the
other rent tiers which are below the maximum limits.
30% AMI 50% AMI 60% AMI 90% AMI
1 Person $ 18,900 $ 31,500 $ 37,800 $ 56,700
2 Person $ 21,600 $ 36,000 $ 43,200 $ 64,800
3 Person $ 24,300 $ 40,500 $ 48,600 $ 72,900
ALBANY - SCHENECTADY-TROY, NY MSA
MAXIMUM INCOMES 2019
Demand Analysis 86
25 Delaware Albany, Albany County, NY
The Lower Limits:
For application to the tax credit specific units, we will apply HCR underwriting standards,
which support a total at 48% of the actual rent being charged. For example, the 2BR 60%
unit the gross rent of $1,214 x 12 months for an annual total of $14,586. When divided by
the 48% factor allowable by HCR, this correlates to a total of $30,350.
Conclusions – Income Band Analysis & Demand Model In conclusion, the income bands for each unit type were wide spread given different rent tiers.
The rents range dramatically, thus allowing a wide array of income qualified households for each
unit type. We fully recognize that there is some income overlap for the different unit types, and
household size overlap, so the Alternate Analysis evaluates the tax credit units only from the low
to high end of the applicable bands. To account for overlap in the demand model, we have
weighted the average of each of the different unit types to correlate to a total project capture.
Capture Methodology We have provided a capture rate that applies to each of the different unit types and each of the
different rent tiers. We will then apply a weighted average for application to each of the individual
unit types and establish a weighted average capture for application to the entire development.
This is generally considered a “net” Demand Model and evaluates the number of age and income
qualified households available to the project after eliminating all existing affordable housing in
the market.
Demand Model Glossary: Outlined in the addendum is a glossary that provides additional explanation for the numerical
breakout provided on the demand modeling/analysis presented. We recommend that the reader
refer to the addendum if there are any questions pertaining to the variables presented on the
demand model, which follows.
Note: The income qualification data for the market rate units is applied from the HISTA data and
simply accounts for the total household in the brackets on line item 9 of the demand model.
The demand models is presented on the following page.
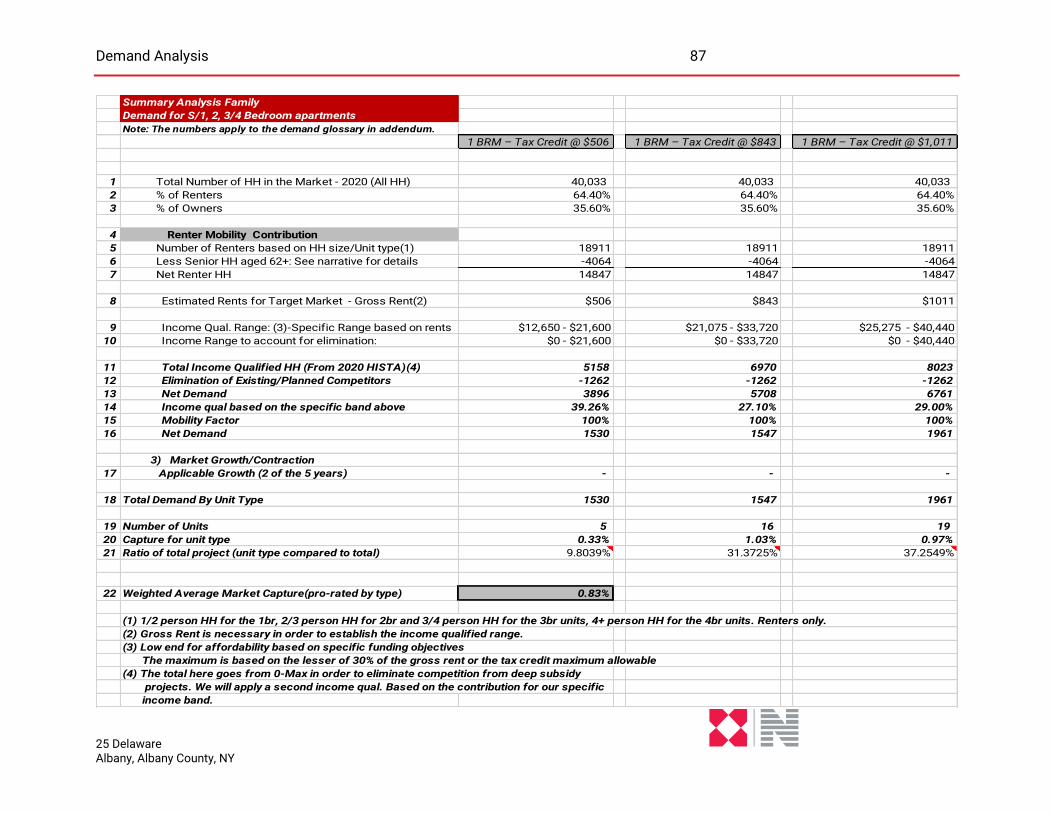
Demand Analysis 87
25 Delaware Albany, Albany County, NY
Summary Analysis Family
Demand for S/1, 2, 3/4 Bedroom apartments
Note: The numbers apply to the demand glossary in addendum.
1 BRM – Tax Credit @ $506 1 BRM – Tax Credit @ $843 1 BRM – Tax Credit @ $1,011
1 Total Number of HH in the Market - 2020 (All HH) 40,033 40,033 40,033
2 % of Renters 64.40% 64.40% 64.40%
3 % of Owners 35.60% 35.60% 35.60%
4 Renter Mobility Contribution
5 Number of Renters based on HH size/Unit type(1) 18911 18911 18911
6 Less Senior HH aged 62+: See narrative for details -4064 -4064 -4064
7 Net Renter HH 14847 14847 14847
8 Estimated Rents for Target Market - Gross Rent(2) $506 $843 $1011
9 Income Qual. Range: (3)-Specific Range based on rents $12,650 - $21,600 $21,075 - $33,720 $25,275 - $40,440
10 Income Range to account for elimination: $0 - $21,600 $0 - $33,720 $0 - $40,440
11 Total Income Qualified HH (From 2020 HISTA)(4) 5158 6970 8023
12 Elimination of Existing/Planned Competitors -1262 -1262 -1262
13 Net Demand 3896 5708 6761
14 Income qual based on the specific band above 39.26% 27.10% 29.00%
15 Mobility Factor 100% 100% 100%
16 Net Demand 1530 1547 1961
3) Market Growth/Contraction
17 Applicable Growth (2 of the 5 years) - - -
18 Total Demand By Unit Type 1530 1547 1961
19 Number of Units 5 16 19
20 Capture for unit type 0.33% 1.03% 0.97%
21 Ratio of total project (unit type compared to total) 9.8039% 31.3725% 37.2549%
22 Weighted Average Market Capture(pro-rated by type) 0.83%
(1) 1/2 person HH for the 1br, 2/3 person HH for 2br and 3/4 person HH for the 3br units, 4+ person HH for the 4br units. Renters only.
(2) Gross Rent is necessary in order to establish the income qualified range.
(3) Low end for affordability based on specific funding objectives
The maximum is based on the lesser of 30% of the gross rent or the tax credit maximum allowable
(4) The total here goes from 0-Max in order to eliminate competition from deep subsidy
projects. We will apply a second income qual. Based on the contribution for our specific
income band.

Demand Analysis 88
25 Delaware Albany, Albany County, NY
Summary Analysis Family
Demand for S/1, 2, 3/4 Bedroom apartments
Note: The numbers apply to the demand glossary in addendum.
2 BRM – Tax Credit @ $607 2 BRM – Tax Credit @ $1,011 2 BRM – Tax Credit @ $1,214
1 Total Number of HH in the Market - 2020 (All HH) 40,033 40,033 40,033
2 % of Renters 64.40% 64.40% 64.40%
3 % of Owners 35.60% 35.60% 35.60%
4 Renter Mobility Contribution
5 Number of Renters based on HH size/Unit type(1) 9973 9973 9973
6 Less Senior HH aged 62+: See narrative for details -987 -987 -987
7 Net Renter HH 8986 8986 8986
8 Estimated Rents for Target Market - Gross Rent(2) $607 $1011 $1214
9 Income Qual. Range: (3)-Specific Range based on rents $15,175 - $24,300 $25,275 - $40,440 $30,350 - $48,560
10 Income Range to account for elimination: $0 - $24,300 $0 - $40,440 $0 - $48,560
11 Total Income Qualified HH (From 2020 HISTA)(4) 2736 4028 4581
12 Elimination of Existing/Planned Competitors -1118 -1118 -1118
13 Net Demand 1618 2910 3463
14 Income qual based on the specific band above 32.46% 29.97% 28.79%
15 Mobility Factor 100% 100% 100%
16 Net Demand 525 872 997
3) Market Growth/Contraction
17 Applicable Growth (2 of the 5 years) - - -
18 Total Demand By Unit Type 525 872 997
19 Number of Units 1 4 6
20 Capture for unit type 0.19% 0.46% 0.60%
21 Ratio of total project (unit type compared to total) 1.9608% 7.8431% 11.7647%
22 Weighted Average Market Capture(pro-rated by type)
(1) 1/2 person HH for the 1br, 2/3 person HH for 2br and 3/4 person HH for the 3br units, 4+ person HH for the 4br units. Renters only.
(2) Gross Rent is necessary in order to establish the income qualified range.
(3) Low end for affordability based on specific funding objectives
The maximum is based on the lesser of 30% of the gross rent or the tax credit maximum allowable
(4) The total here goes from 0-Max in order to eliminate competition from deep subsidy
projects. We will apply a second income qual. Based on the contribution for our specific
income band.
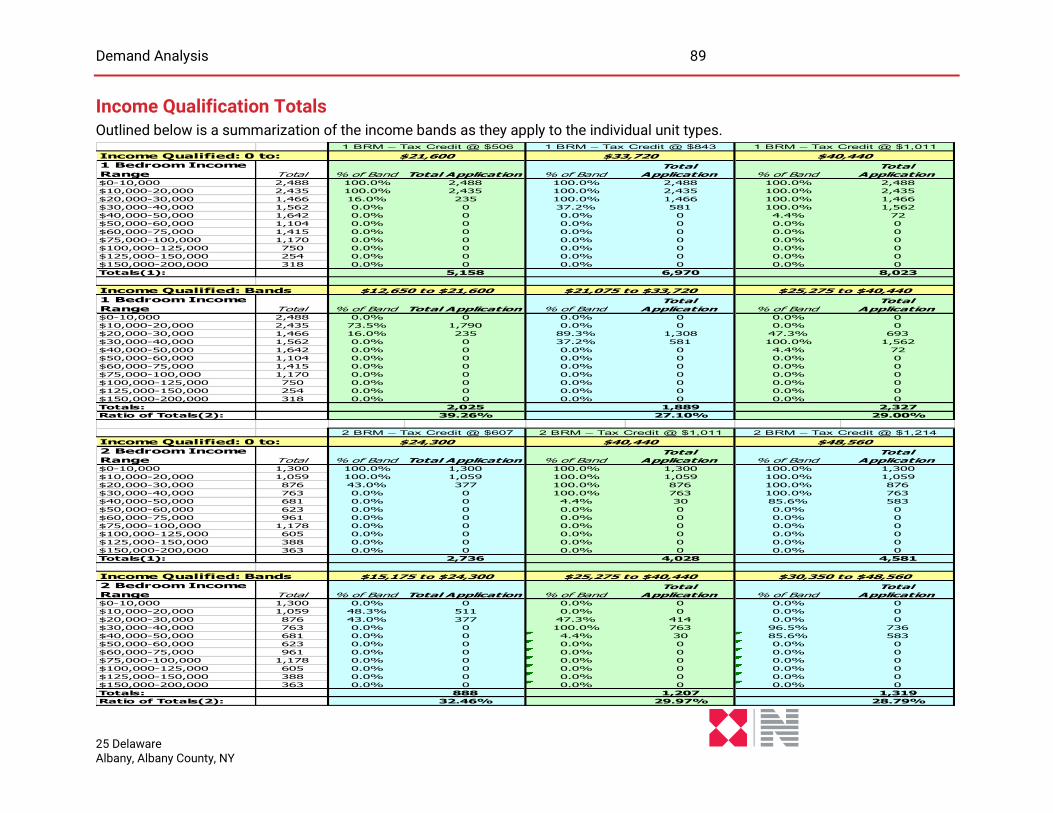
Demand Analysis 89
25 Delaware Albany, Albany County, NY
Income Qualification Totals Outlined below is a summarization of the income bands as they apply to the individual unit types.
Income Qualified: 0 to: $21,600 $33,720 $40,440 $64,800 $01 Bedroom Income
Range Total % of Band Total Application % of BandTotal
Application % of BandTotal
Application % of BandTotal
Application$0-10,000 2,488 100.0% 2,488 100.0% 2,488 100.0% 2,488 100.0% 2,488
$10,000-20,000 2,435 100.0% 2,435 100.0% 2,435 100.0% 2,435 100.0% 2,435
$20,000-30,000 1,466 16.0% 235 100.0% 1,466 100.0% 1,466 100.0% 1,466
$30,000-40,000 1,562 0.0% 0 37.2% 581 100.0% 1,562 100.0% 1,562
$40,000-50,000 1,642 0.0% 0 0.0% 0 4.4% 72 100.0% 1,642
$50,000-60,000 1,104 0.0% 0 0.0% 0 0.0% 0 100.0% 1,104
$60,000-75,000 1,415 0.0% 0 0.0% 0 0.0% 0 32.0% 453
$75,000-100,000 1,170 0.0% 0 0.0% 0 0.0% 0 0.0% 0
$100,000-125,000 750 0.0% 0 0.0% 0 0.0% 0 0.0% 0
$125,000-150,000 254 0.0% 0 0.0% 0 0.0% 0 0.0% 0
$150,000-200,000 318 0.0% 0 0.0% 0 0.0% 0 0.0% 0
Totals(1): 5,158 6,970 8,023 11,150
Income Qualified: Bands $12,650 to $21,600 $21,075 to $33,720 $25,275 to $40,440 $43,200 to $64,800 $0 to $01 Bedroom Income
Range Total % of Band Total Application % of BandTotal
Application % of BandTotal
Application % of BandTotal
Application$0-10,000 2,488 0.0% 0 0.0% 0 0.0% 0 0.0% 0
$10,000-20,000 2,435 73.5% 1,790 0.0% 0 0.0% 0 0.0% 0
$20,000-30,000 1,466 16.0% 235 89.3% 1,308 47.3% 693 0.0% 0
$30,000-40,000 1,562 0.0% 0 37.2% 581 100.0% 1,562 0.0% 0
$40,000-50,000 1,642 0.0% 0 0.0% 0 4.4% 72 68.0% 1,117
$50,000-60,000 1,104 0.0% 0 0.0% 0 0.0% 0 100.0% 1,104
$60,000-75,000 1,415 0.0% 0 0.0% 0 0.0% 0 32.0% 453
$75,000-100,000 1,170 0.0% 0 0.0% 0 0.0% 0 0.0% 0
$100,000-125,000 750 0.0% 0 0.0% 0 0.0% 0 0.0% 0
$125,000-150,000 254 0.0% 0 0.0% 0 0.0% 0 0.0% 0
$150,000-200,000 318 0.0% 0 0.0% 0 0.0% 0 0.0% 0
Totals: 2,025 1,889 2,327 2,674
Ratio of Totals(2): 39.26% 27.10% 29.00% 23.98%
Income Qualified: 0 to: $24,300 $40,440 $48,560 $72,900 $02 Bedroom Income
Range Total % of Band Total Application % of BandTotal
Application % of BandTotal
Application % of BandTotal
Application$0-10,000 1,300 100.0% 1,300 100.0% 1,300 100.0% 1,300 100.0% 1,300
$10,000-20,000 1,059 100.0% 1,059 100.0% 1,059 100.0% 1,059 100.0% 1,059
$20,000-30,000 876 43.0% 377 100.0% 876 100.0% 876 100.0% 876
$30,000-40,000 763 0.0% 0 100.0% 763 100.0% 763 100.0% 763
$40,000-50,000 681 0.0% 0 4.4% 30 85.6% 583 100.0% 681
$50,000-60,000 623 0.0% 0 0.0% 0 0.0% 0 100.0% 623
$60,000-75,000 961 0.0% 0 0.0% 0 0.0% 0 86.0% 826
$75,000-100,000 1,178 0.0% 0 0.0% 0 0.0% 0 0.0% 0
$100,000-125,000 605 0.0% 0 0.0% 0 0.0% 0 0.0% 0
$125,000-150,000 388 0.0% 0 0.0% 0 0.0% 0 0.0% 0
$150,000-200,000 363 0.0% 0 0.0% 0 0.0% 0 0.0% 0
Totals(1): 2,736 4,028 4,581 6,128
Income Qualified: Bands $15,175 to $24,300 $25,275 to $40,440 $30,350 to $48,560 $48,600 to $72,900 $0 to $02 Bedroom Income
Range Total % of Band Total Application % of BandTotal
Application % of BandTotal
Application % of BandTotal
Application$0-10,000 1,300 0.0% 0 0.0% 0 0.0% 0 0.0% 0
$10,000-20,000 1,059 48.3% 511 0.0% 0 0.0% 0 0.0% 0
$20,000-30,000 876 43.0% 377 47.3% 414 0.0% 0 0.0% 0
$30,000-40,000 763 0.0% 0 100.0% 763 96.5% 736 0.0% 0
$40,000-50,000 681 0.0% 0 4.4% 30 85.6% 583 14.0% 95
$50,000-60,000 623 0.0% 0 0.0% 0 0.0% 0 100.0% 623
$60,000-75,000 961 0.0% 0 0.0% 0 0.0% 0 86.0% 826
$75,000-100,000 1,178 0.0% 0 0.0% 0 0.0% 0 0.0% 0
$100,000-125,000 605 0.0% 0 0.0% 0 0.0% 0 0.0% 0
$125,000-150,000 388 0.0% 0 0.0% 0 0.0% 0 0.0% 0
$150,000-200,000 363 0.0% 0 0.0% 0 0.0% 0 0.0% 0
Totals: 888 1,207 1,319 1,544
Ratio of Totals(2): 32.46% 29.97% 28.79% 25.20%
1 BRM – Tax Credit @ $506 1 BRM – Tax Credit @ $843 1 BRM – Tax Credit @ $1,011 1 BRM – Tax Credit @ $1,228
2 BRM – Tax Credit @ $1,4802 BRM – Tax Credit @ $607 2 BRM – Tax Credit @ $1,011 2 BRM – Tax Credit @ $1,214
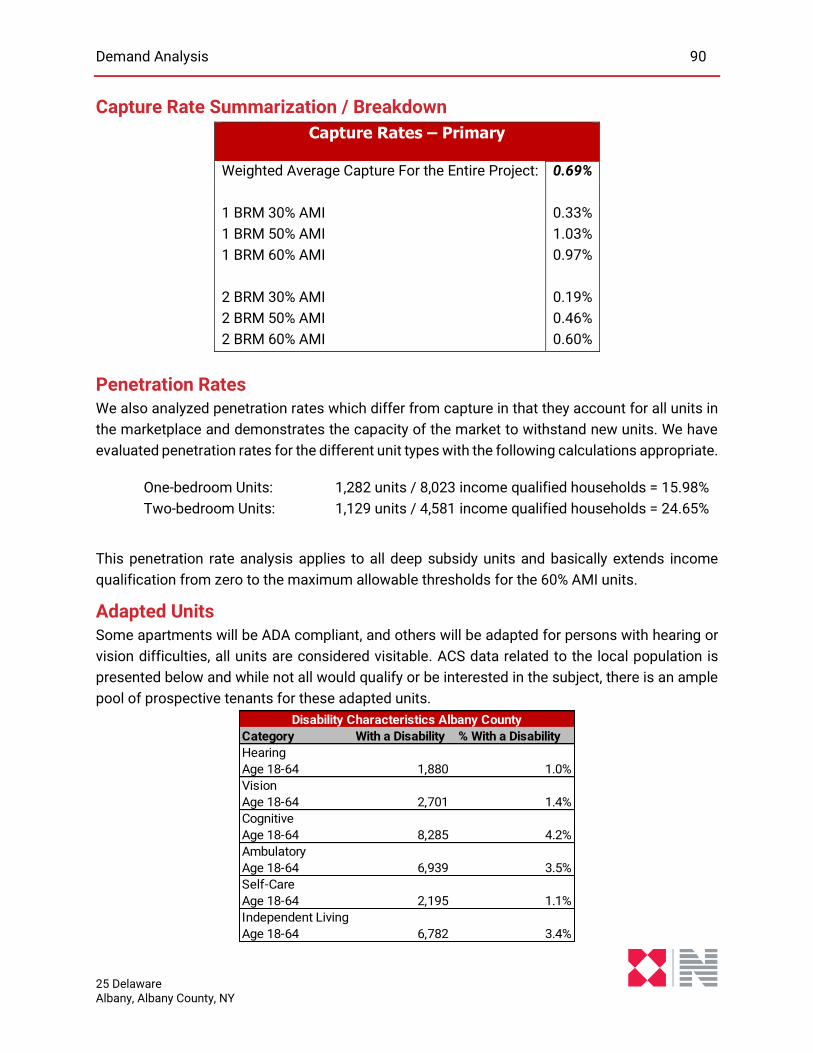
Demand Analysis 90
25 Delaware Albany, Albany County, NY
Capture Rate Summarization / Breakdown
Capture Rates – Primary
Weighted Average Capture For the Entire Project: 0.69%
1 BRM 30% AMI 0.33%
1 BRM 50% AMI 1.03%
1 BRM 60% AMI 0.97%
2 BRM 30% AMI 0.19%
2 BRM 50% AMI 0.46%
2 BRM 60% AMI 0.60%
Penetration Rates We also analyzed penetration rates which differ from capture in that they account for all units in
the marketplace and demonstrates the capacity of the market to withstand new units. We have
evaluated penetration rates for the different unit types with the following calculations appropriate.
One-bedroom Units: 1,282 units / 8,023 income qualified households = 15.98%
Two-bedroom Units: 1,129 units / 4,581 income qualified households = 24.65%
This penetration rate analysis applies to all deep subsidy units and basically extends income
qualification from zero to the maximum allowable thresholds for the 60% AMI units.
Adapted Units Some apartments will be ADA compliant, and others will be adapted for persons with hearing or
vision difficulties, all units are considered visitable. ACS data related to the local population is
presented below and while not all would qualify or be interested in the subject, there is an ample
pool of prospective tenants for these adapted units.
Category With a Disability % With a Disability
Hearing
Age 18-64 1,880 1.0%
Vision
Age 18-64 2,701 1.4%
Cognitive
Age 18-64 8,285 4.2%
Ambulatory
Age 18-64 6,939 3.5%
Self-Care
Age 18-64 2,195 1.1%
Independent Living
Age 18-64 6,782 3.4%
Disability Characteristics Albany County
Addenda
Conclusion
In this case, capture and the net demand analysis reflect an adequate number of income qualified
households in the market to support the deal. Some of the other key factors to consider that do
tend to indicate overall project support and a market advantage for the project include:
The support of the project location near the greatest concentration of employment options
in the region at Albany Med/Stratton VA, New York State/Albany offices and multiple
options in the downtown core. The subject neighborhood is highly walkable with a
Walkscore of 88 indicating most errands can be accomplished on foot, and there are
multiple public transportation and highway linkages in the immediate area.
Wait lists for the subject and Albany Housing Authority are extensive with over 5,600
applicants on the master waitlist for 1BR units, and over 3,900 for 2BRs. Waitlists for
Section 8 vouchers are also extensive with the estimated length of time for new vouchers
to be issued reported in terms of years.
43% of renters in the PMA earn less than $30,000, with the poverty ratio in the subject
census tract at 50%, more than double than the city at 24.5%.
The product concept of a multistory elevator building with larger floorplans, good quality
finishes and common area amenities has proven successful in the market and is
consistent with recent developments throughout the city. Recently developed options in
the city are consistent with this product concept with similar amenities so the subject will
offer consistent utility with the newest developments at affordable price points.
The rent advantage for the subject rents compared to market at around 22%-37% for the
50%/60% AMI units. New development has been ongoing in nearby/similar neighborhoods
while rents have been increasing citywide in recent years with new development and
renovation in/around downtown.
Success/support of recent development throughout the city and throughout the Capital
Region with the newest projects on/around Clinton Avenue showing good absorption
rates and tenant retention since opening in the last few years.

Addenda
Addendum A
Demand Analysis Glossary
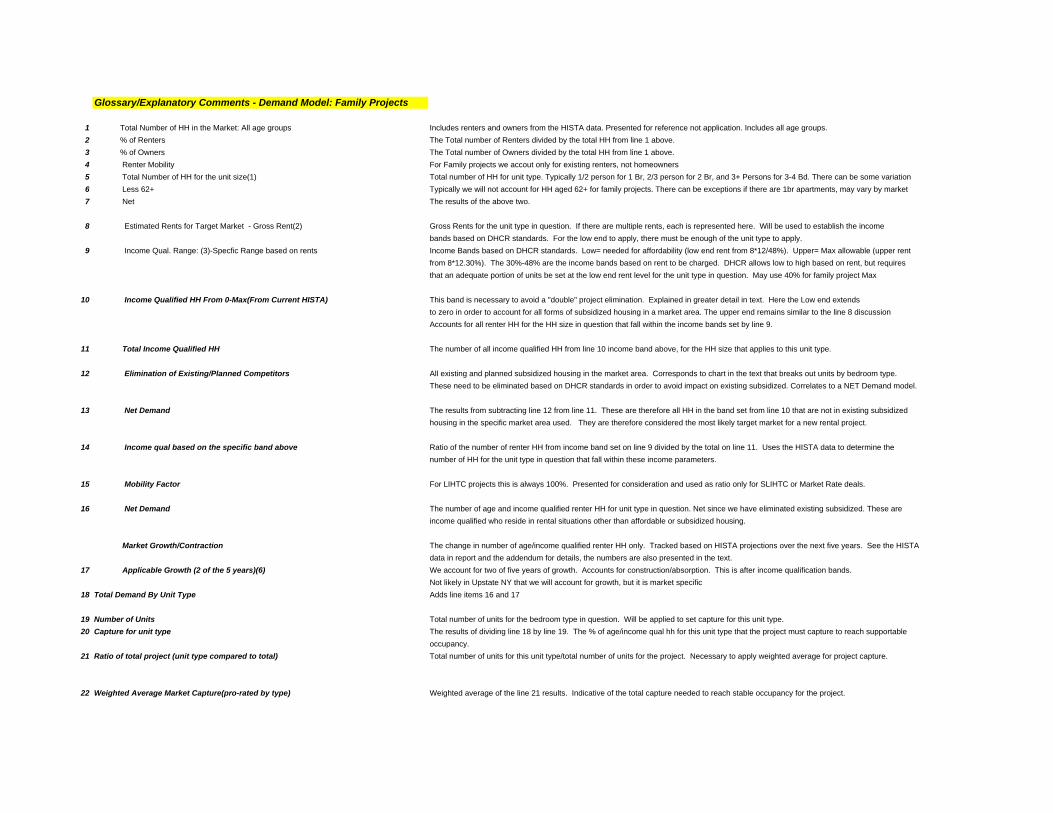
Glossary/Explanatory Comments - Demand Model: Family Projects
1 Total Number of HH in the Market: All age groups Includes renters and owners from the HISTA data. Presented for reference not application. Includes all age groups.
2 % of Renters The Total number of Renters divided by the total HH from line 1 above.
3 % of Owners The Total number of Owners divided by the total HH from line 1 above.
4 Renter Mobility For Family projects we accout only for existing renters, not homeowners
5 Total Number of HH for the unit size(1) Total number of HH for unit type. Typically 1/2 person for 1 Br, 2/3 person for 2 Br, and 3+ Persons for 3-4 Bd. There can be some variation
6 Less 62+ Typically we will not account for HH aged 62+ for family projects. There can be exceptions if there are 1br apartments, may vary by market
7 Net The results of the above two.
8 Estimated Rents for Target Market - Gross Rent(2) Gross Rents for the unit type in question. If there are multiple rents, each is represented here. Will be used to establish the income
bands based on DHCR standards. For the low end to apply, there must be enough of the unit type to apply.
9 Income Qual. Range: (3)-Specfic Range based on rents Income Bands based on DHCR standards. Low= needed for affordability (low end rent from 8*12/48%). Upper= Max allowable (upper rent
from 8*12.30%). The 30%-48% are the income bands based on rent to be charged. DHCR allows low to high based on rent, but requires
that an adequate portion of units be set at the low end rent level for the unit type in question. May use 40% for family project Max
10 Income Qualified HH From 0-Max(From Current HISTA) This band is necessary to avoid a "double" project elimination. Explained in greater detail in text. Here the Low end extends
to zero in order to account for all forms of subsidized housing in a market area. The upper end remains similar to the line 8 discussion
Accounts for all renter HH for the HH size in question that fall within the income bands set by line 9.
11 Total Income Qualified HH The number of all income qualified HH from line 10 income band above, for the HH size that applies to this unit type.
12 Elimination of Existing/Planned Competitors All existing and planned subsidized housing in the market area. Corresponds to chart in the text that breaks out units by bedroom type.
These need to be eliminated based on DHCR standards in order to avoid impact on existing subsidized. Correlates to a NET Demand model.
13 Net Demand The results from subtracting line 12 from line 11. These are therefore all HH in the band set from line 10 that are not in existing subsidized
housing in the specific market area used. They are therefore considered the most likely target market for a new rental project.
14 Income qual based on the specific band above Ratio of the number of renter HH from income band set on line 9 divided by the total on line 11. Uses the HISTA data to determine the
number of HH for the unit type in question that fall within these income parameters.
15 Mobility Factor For LIHTC projects this is always 100%. Presented for consideration and used as ratio only for SLIHTC or Market Rate deals.
16 Net Demand The number of age and income qualified renter HH for unit type in question. Net since we have eliminated existing subsidized. These are
income qualified who reside in rental situations other than affordable or subsidized housing.
Market Growth/Contraction The change in number of age/income qualified renter HH only. Tracked based on HISTA projections over the next five years. See the HISTA
data in report and the addendum for details, the numbers are also presented in the text.
17 Applicable Growth (2 of the 5 years)(6) We account for two of five years of growth. Accounts for construction/absorption. This is after income qualification bands.
Not likely in Upstate NY that we will account for growth, but it is market specific
18 Total Demand By Unit Type Adds line items 16 and 17
19 Number of Units Total number of units for the bedroom type in question. Will be applied to set capture for this unit type.
20 Capture for unit type The results of dividing line 18 by line 19. The % of age/income qual hh for this unit type that the project must capture to reach supportable
occupancy.
21 Ratio of total project (unit type compared to total) Total number of units for this unit type/total number of units for the project. Necessary to apply weighted average for project capture.
22 Weighted Average Market Capture(pro-rated by type) Weighted average of the line 21 results. Indicative of the total capture needed to reach stable occupancy for the project.
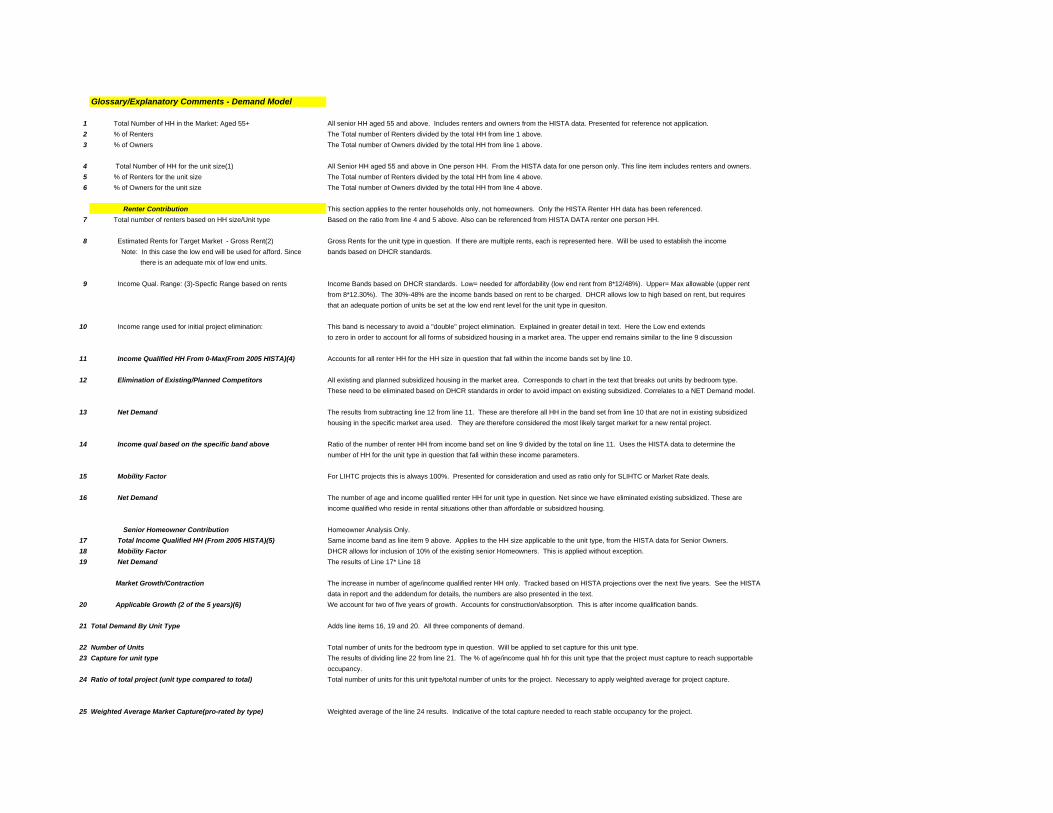
Glossary/Explanatory Comments - Demand Model
1 Total Number of HH in the Market: Aged 55+ All senior HH aged 55 and above. Includes renters and owners from the HISTA data. Presented for reference not application.
2 % of Renters The Total number of Renters divided by the total HH from line 1 above.
3 % of Owners The Total number of Owners divided by the total HH from line 1 above.
4 Total Number of HH for the unit size(1) All Senior HH aged 55 and above in One person HH. From the HISTA data for one person only. This line item includes renters and owners.
5 % of Renters for the unit size The Total number of Renters divided by the total HH from line 4 above.
6 % of Owners for the unit size The Total number of Owners divided by the total HH from line 4 above.
Renter Contribution This section applies to the renter households only, not homeowners. Only the HISTA Renter HH data has been referenced.
7 Total number of renters based on HH size/Unit type Based on the ratio from line 4 and 5 above. Also can be referenced from HISTA DATA renter one person HH.
8 Estimated Rents for Target Market - Gross Rent(2) Gross Rents for the unit type in question. If there are multiple rents, each is represented here. Will be used to establish the income
Note: In this case the low end will be used for afford. Since bands based on DHCR standards.
there is an adequate mix of low end units.
9 Income Qual. Range: (3)-Specfic Range based on rents Income Bands based on DHCR standards. Low= needed for affordability (low end rent from 8*12/48%). Upper= Max allowable (upper rent
from 8*12.30%). The 30%-48% are the income bands based on rent to be charged. DHCR allows low to high based on rent, but requires
that an adequate portion of units be set at the low end rent level for the unit type in quesiton.
10 Income range used for initial project elimination: This band is necessary to avoid a "double" project elimination. Explained in greater detail in text. Here the Low end extends
to zero in order to account for all forms of subsidized housing in a market area. The upper end remains similar to the line 9 discussion
11 Income Qualified HH From 0-Max(From 2005 HISTA)(4) Accounts for all renter HH for the HH size in question that fall within the income bands set by line 10.
12 Elimination of Existing/Planned Competitors All existing and planned subsidized housing in the market area. Corresponds to chart in the text that breaks out units by bedroom type.
These need to be eliminated based on DHCR standards in order to avoid impact on existing subsidized. Correlates to a NET Demand model.
13 Net Demand The results from subtracting line 12 from line 11. These are therefore all HH in the band set from line 10 that are not in existing subsidized
housing in the specific market area used. They are therefore considered the most likely target market for a new rental project.
14 Income qual based on the specific band above Ratio of the number of renter HH from income band set on line 9 divided by the total on line 11. Uses the HISTA data to determine the
number of HH for the unit type in question that fall within these income parameters.
15 Mobility Factor For LIHTC projects this is always 100%. Presented for consideration and used as ratio only for SLIHTC or Market Rate deals.
16 Net Demand The number of age and income qualified renter HH for unit type in question. Net since we have eliminated existing subsidized. These are
income qualified who reside in rental situations other than affordable or subsidized housing.
Senior Homeowner Contribution Homeowner Analysis Only.
17 Total Income Qualified HH (From 2005 HISTA)(5) Same income band as line item 9 above. Applies to the HH size applicable to the unit type, from the HISTA data for Senior Owners.
18 Mobility Factor DHCR allows for inclusion of 10% of the existing senior Homeowners. This is applied without exception.
19 Net Demand The results of Line 17* Line 18
Market Growth/Contraction The increase in number of age/income qualified renter HH only. Tracked based on HISTA projections over the next five years. See the HISTA
data in report and the addendum for details, the numbers are also presented in the text.
20 Applicable Growth (2 of the 5 years)(6) We account for two of five years of growth. Accounts for construction/absorption. This is after income qualification bands.
21 Total Demand By Unit Type Adds line items 16, 19 and 20. All three components of demand.
22 Number of Units Total number of units for the bedroom type in question. Will be applied to set capture for this unit type.
23 Capture for unit type The results of dividing line 22 from line 21. The % of age/income qual hh for this unit type that the project must capture to reach supportable
occupancy.
24 Ratio of total project (unit type compared to total) Total number of units for this unit type/total number of units for the project. Necessary to apply weighted average for project capture.
25 Weighted Average Market Capture(pro-rated by type) Weighted average of the line 24 results. Indicative of the total capture needed to reach stable occupancy for the project.
Addenda
Addendum B
Additional HISTA Information
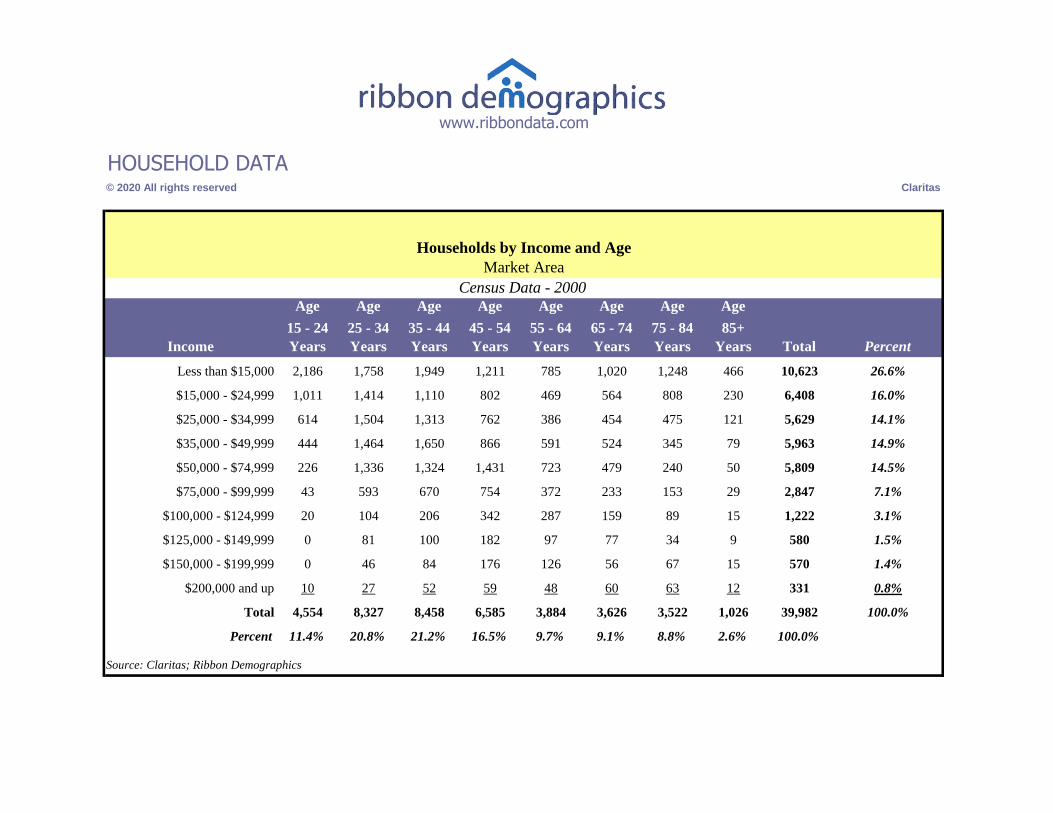
HOUSEHOLD DATA© 2020 All rights reserved Claritas
Age Age Age Age Age Age Age Age
Income
15 - 24
Years
25 - 34
Years
35 - 44
Years
45 - 54
Years
55 - 64
Years
65 - 74
Years
75 - 84
Years
85+
Years Total Percent
Less than $15,000 2,186 1,758 1,949 1,211 785 1,020 1,248 466 10,623 26.6%
$15,000 - $24,999 1,011 1,414 1,110 802 469 564 808 230 6,408 16.0%
$25,000 - $34,999 614 1,504 1,313 762 386 454 475 121 5,629 14.1%
$35,000 - $49,999 444 1,464 1,650 866 591 524 345 79 5,963 14.9%
$50,000 - $74,999 226 1,336 1,324 1,431 723 479 240 50 5,809 14.5%
$75,000 - $99,999 43 593 670 754 372 233 153 29 2,847 7.1%
$100,000 - $124,999 20 104 206 342 287 159 89 15 1,222 3.1%
$125,000 - $149,999 0 81 100 182 97 77 34 9 580 1.5%
$150,000 - $199,999 0 46 84 176 126 56 67 15 570 1.4%
$200,000 and up 10 27 52 59 48 60 63 12 331 0.8%
Total 4,554 8,327 8,458 6,585 3,884 3,626 3,522 1,026 39,982 100.0%
Percent 11.4% 20.8% 21.2% 16.5% 9.7% 9.1% 8.8% 2.6% 100.0%
Source: Claritas; Ribbon Demographics
Census Data - 2000
www.ribbondata.com
Households by Income and Age
Market Area
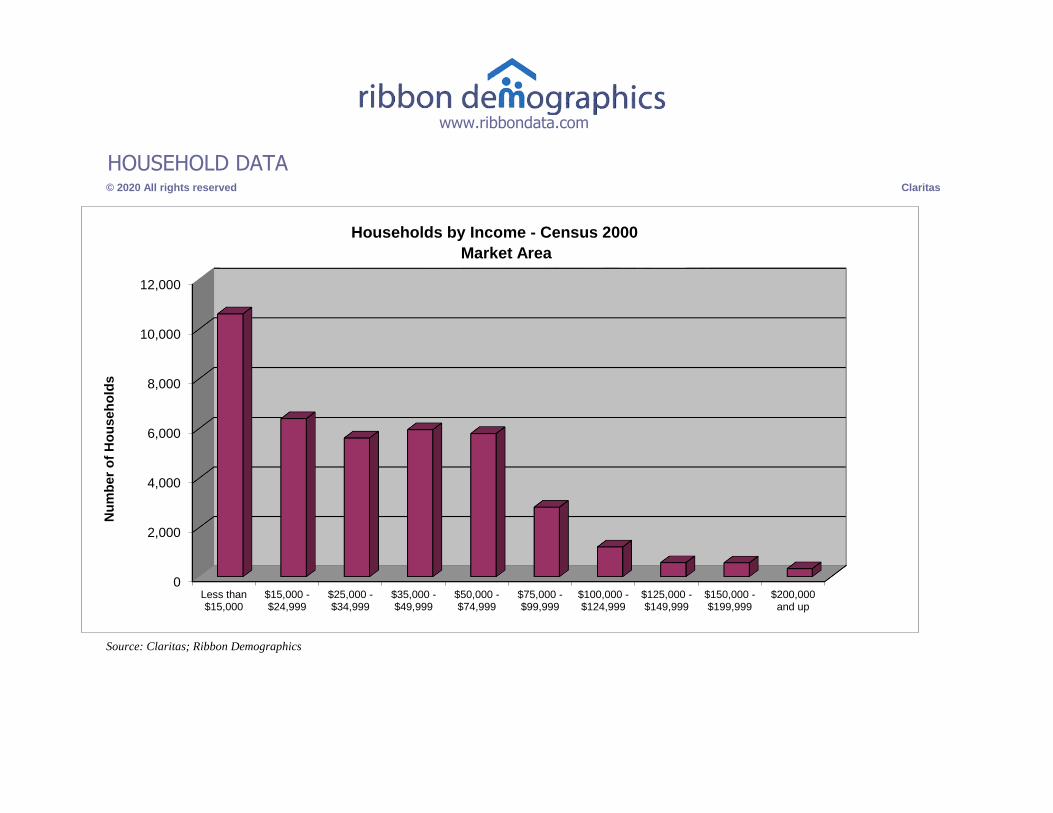
HOUSEHOLD DATA© 2020 All rights reserved Claritas
www.ribbondata.com
Source: Claritas; Ribbon Demographics
0
2,000
4,000
6,000
8,000
10,000
12,000
Less than$15,000
$15,000 -$24,999
$25,000 -$34,999
$35,000 -$49,999
$50,000 -$74,999
$75,000 -$99,999
$100,000 -$124,999
$125,000 -$149,999
$150,000 -$199,999
$200,000and up
Nu
mb
er
of
Ho
useh
old
s
Households by Income - Census 2000
Market Area
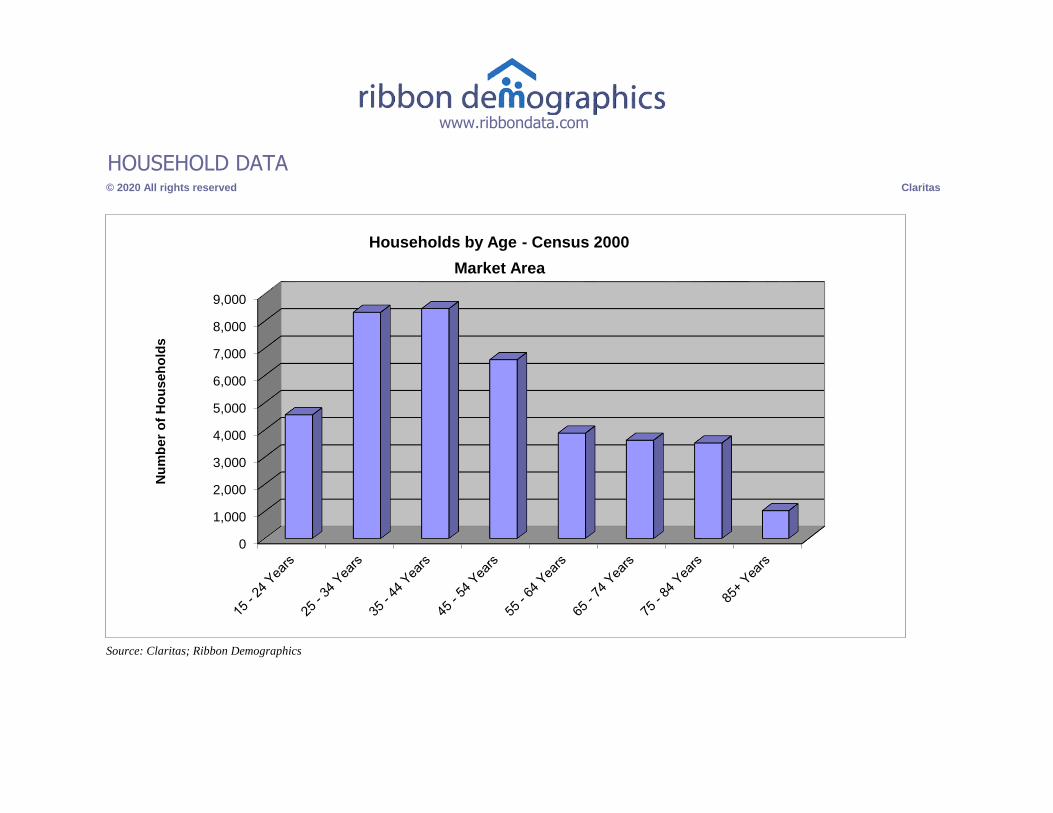
HOUSEHOLD DATA© 2020 All rights reserved Claritas
www.ribbondata.com
Source: Claritas; Ribbon Demographics
0
1,000
2,000
3,000
4,000
5,000
6,000
7,000
8,000
9,000
Nu
mb
er
of
Ho
useh
old
s
Households by Age - Census 2000
Market Area
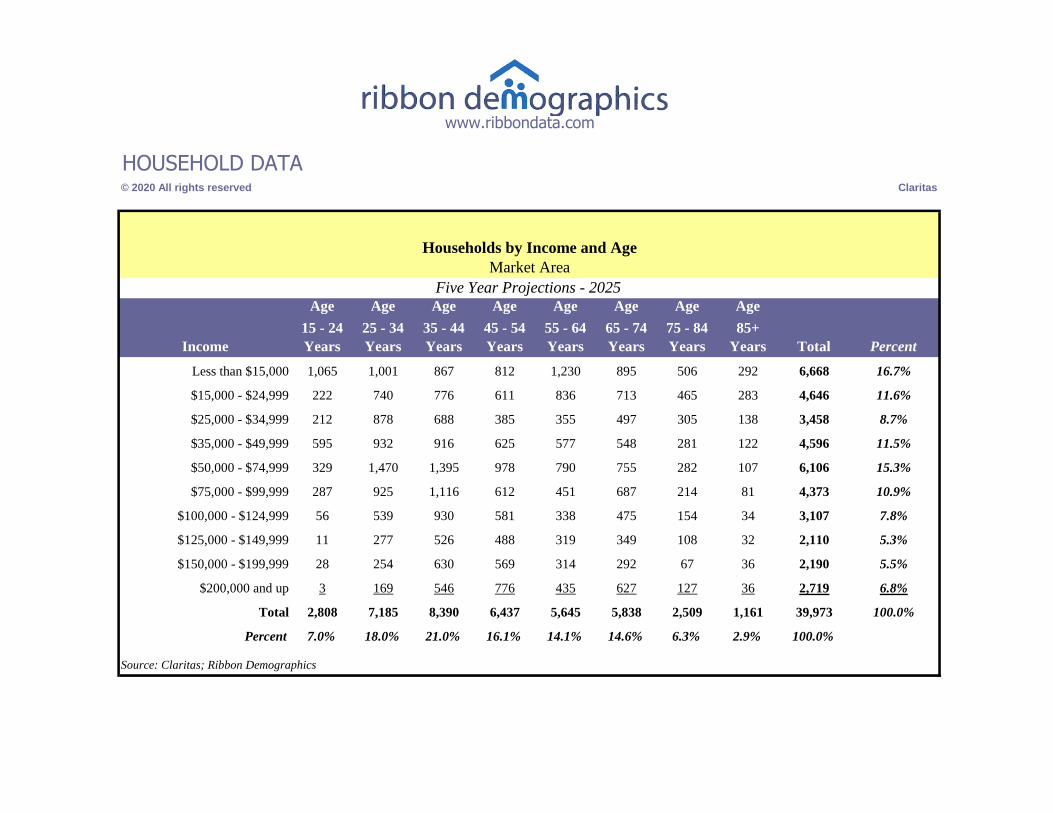
HOUSEHOLD DATA© 2020 All rights reserved Claritas
Age Age Age Age Age Age Age Age
Income
15 - 24
Years
25 - 34
Years
35 - 44
Years
45 - 54
Years
55 - 64
Years
65 - 74
Years
75 - 84
Years
85+
Years Total Percent
Less than $15,000 1,065 1,001 867 812 1,230 895 506 292 6,668 16.7%
$15,000 - $24,999 222 740 776 611 836 713 465 283 4,646 11.6%
$25,000 - $34,999 212 878 688 385 355 497 305 138 3,458 8.7%
$35,000 - $49,999 595 932 916 625 577 548 281 122 4,596 11.5%
$50,000 - $74,999 329 1,470 1,395 978 790 755 282 107 6,106 15.3%
$75,000 - $99,999 287 925 1,116 612 451 687 214 81 4,373 10.9%
$100,000 - $124,999 56 539 930 581 338 475 154 34 3,107 7.8%
$125,000 - $149,999 11 277 526 488 319 349 108 32 2,110 5.3%
$150,000 - $199,999 28 254 630 569 314 292 67 36 2,190 5.5%
$200,000 and up 3 169 546 776 435 627 127 36 2,719 6.8%
Total 2,808 7,185 8,390 6,437 5,645 5,838 2,509 1,161 39,973 100.0%
Percent 7.0% 18.0% 21.0% 16.1% 14.1% 14.6% 6.3% 2.9% 100.0%
Source: Claritas; Ribbon Demographics
Five Year Projections - 2025
www.ribbondata.com
Households by Income and Age
Market Area
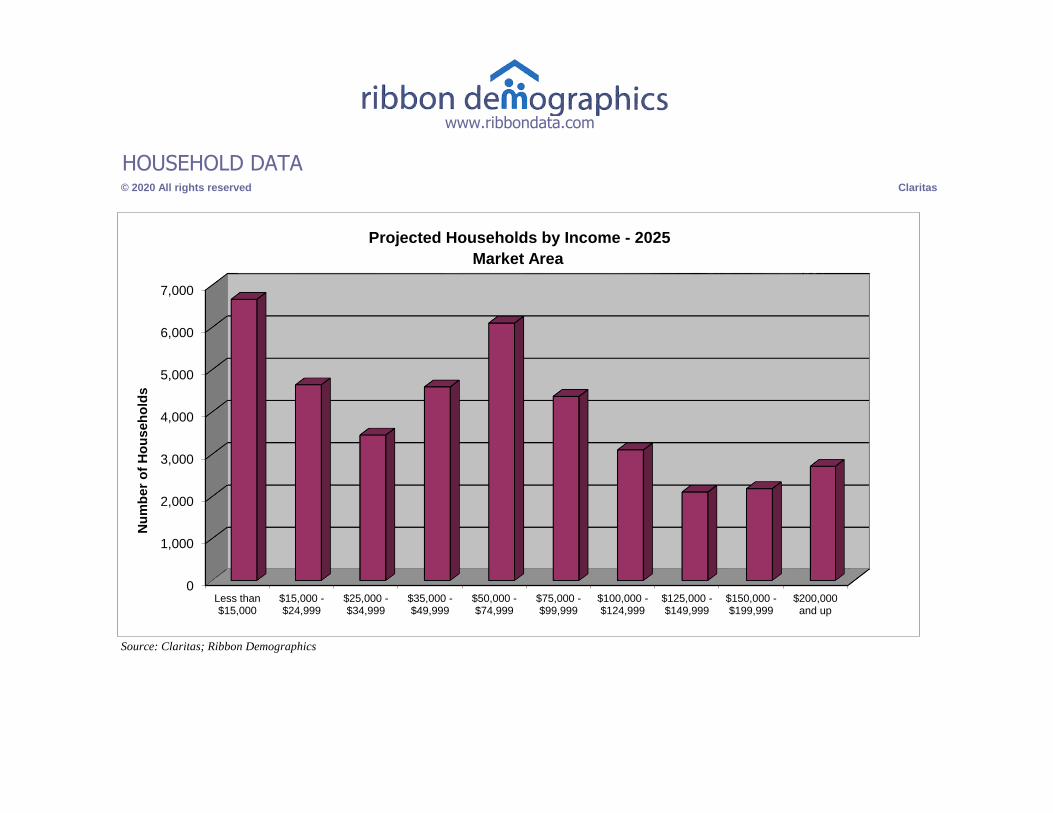
HOUSEHOLD DATA© 2020 All rights reserved Claritas
www.ribbondata.com
Source: Claritas; Ribbon Demographics
0
1,000
2,000
3,000
4,000
5,000
6,000
7,000
Less than$15,000
$15,000 -$24,999
$25,000 -$34,999
$35,000 -$49,999
$50,000 -$74,999
$75,000 -$99,999
$100,000 -$124,999
$125,000 -$149,999
$150,000 -$199,999
$200,000and up
Nu
mb
er
of
Ho
useh
old
s
Projected Households by Income - 2025
Market Area
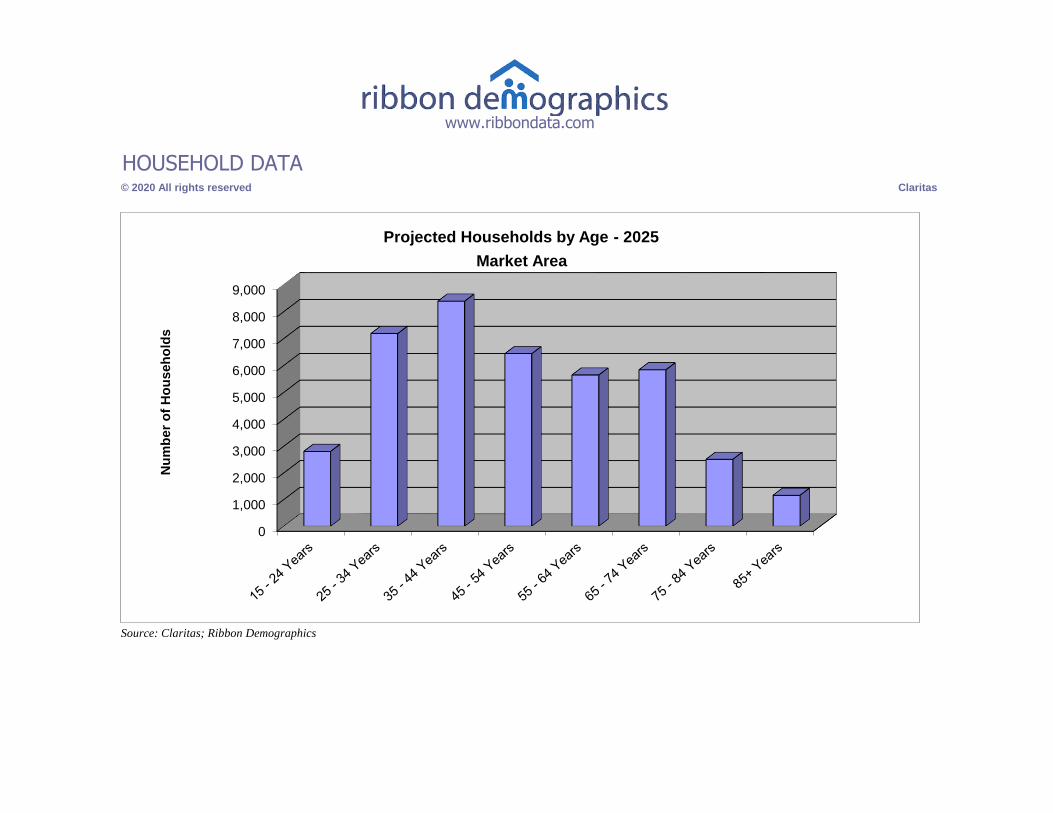
HOUSEHOLD DATA© 2020 All rights reserved Claritas
www.ribbondata.com
Source: Claritas; Ribbon Demographics
0
1,000
2,000
3,000
4,000
5,000
6,000
7,000
8,000
9,000
Nu
mb
er
of
Ho
useh
old
s
Projected Households by Age - 2025
Market Area
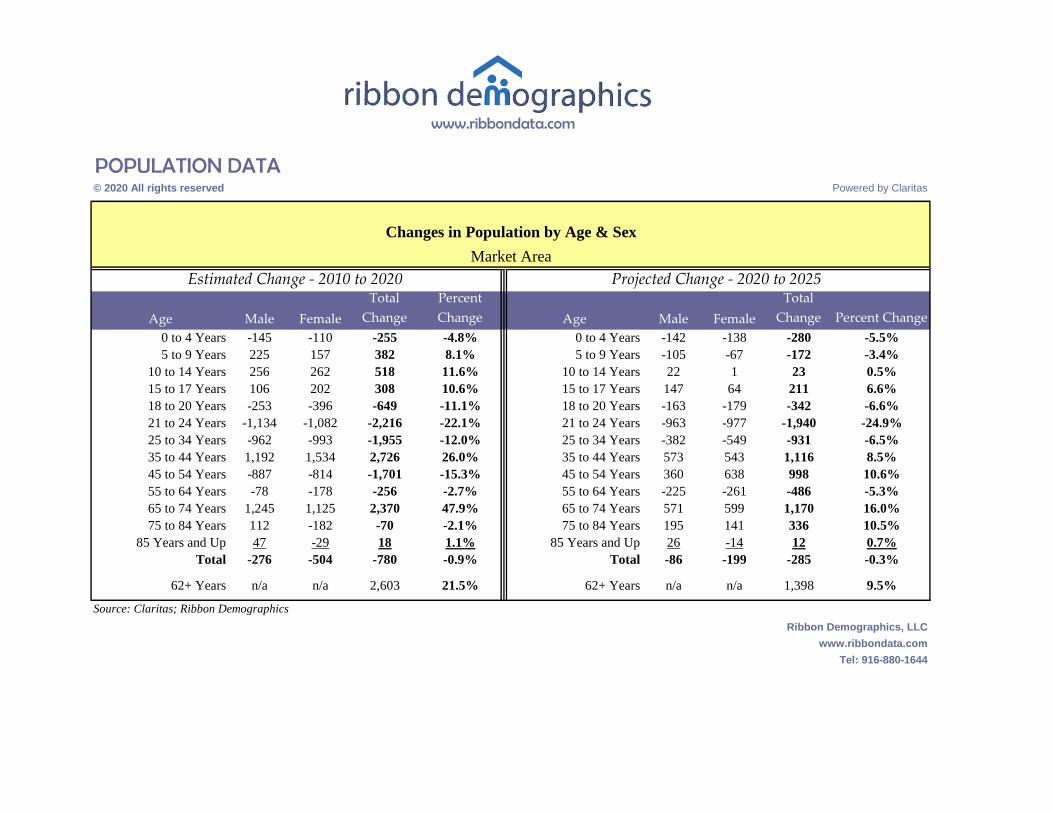
POPULATION DATA© 2020 All rights reserved Powered by Claritas
Age Male Female
Total
Change
Percent
Change Age Male Female
Total
Change Percent Change
0 to 4 Years -145 -110 -255 -4.8% 0 to 4 Years -142 -138 -280 -5.5%
5 to 9 Years 225 157 382 8.1% 5 to 9 Years -105 -67 -172 -3.4%
10 to 14 Years 256 262 518 11.6% 10 to 14 Years 22 1 23 0.5%
15 to 17 Years 106 202 308 10.6% 15 to 17 Years 147 64 211 6.6%
18 to 20 Years -253 -396 -649 -11.1% 18 to 20 Years -163 -179 -342 -6.6%
21 to 24 Years -1,134 -1,082 -2,216 -22.1% 21 to 24 Years -963 -977 -1,940 -24.9%
25 to 34 Years -962 -993 -1,955 -12.0% 25 to 34 Years -382 -549 -931 -6.5%
35 to 44 Years 1,192 1,534 2,726 26.0% 35 to 44 Years 573 543 1,116 8.5%
45 to 54 Years -887 -814 -1,701 -15.3% 45 to 54 Years 360 638 998 10.6%
55 to 64 Years -78 -178 -256 -2.7% 55 to 64 Years -225 -261 -486 -5.3%
65 to 74 Years 1,245 1,125 2,370 47.9% 65 to 74 Years 571 599 1,170 16.0%
75 to 84 Years 112 -182 -70 -2.1% 75 to 84 Years 195 141 336 10.5%
85 Years and Up 47 -29 18 1.1% 85 Years and Up 26 -14 12 0.7%
Total -276 -504 -780 -0.9% Total -86 -199 -285 -0.3%
62+ Years n/a n/a 2,603 21.5% 62+ Years n/a n/a 1,398 9.5%
Source: Claritas; Ribbon Demographics
Ribbon Demographics, LLC
www.ribbondata.com
Tel: 916-880-1644
www.ribbondata.com
Changes in Population by Age & Sex
Market Area
Estimated Change - 2010 to 2020 Projected Change - 2020 to 2025
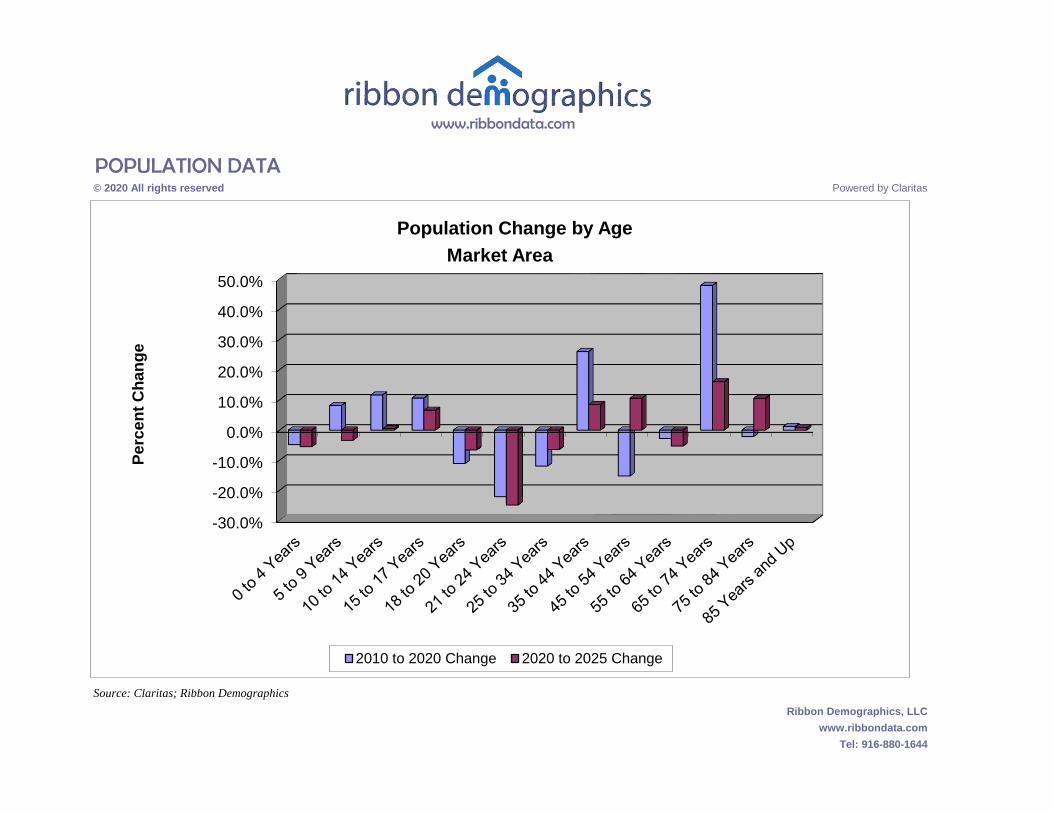
POPULATION DATA© 2020 All rights reserved Powered by Claritas
www.ribbondata.com
Source: Claritas; Ribbon Demographics
Ribbon Demographics, LLC
www.ribbondata.com
Tel: 916-880-1644
-30.0%
-20.0%
-10.0%
0.0%
10.0%
20.0%
30.0%
40.0%
50.0%
Pe
rce
nt
Ch
an
ge
Population Change by Age
2010 to 2020 Change 2020 to 2025 Change
Market Area
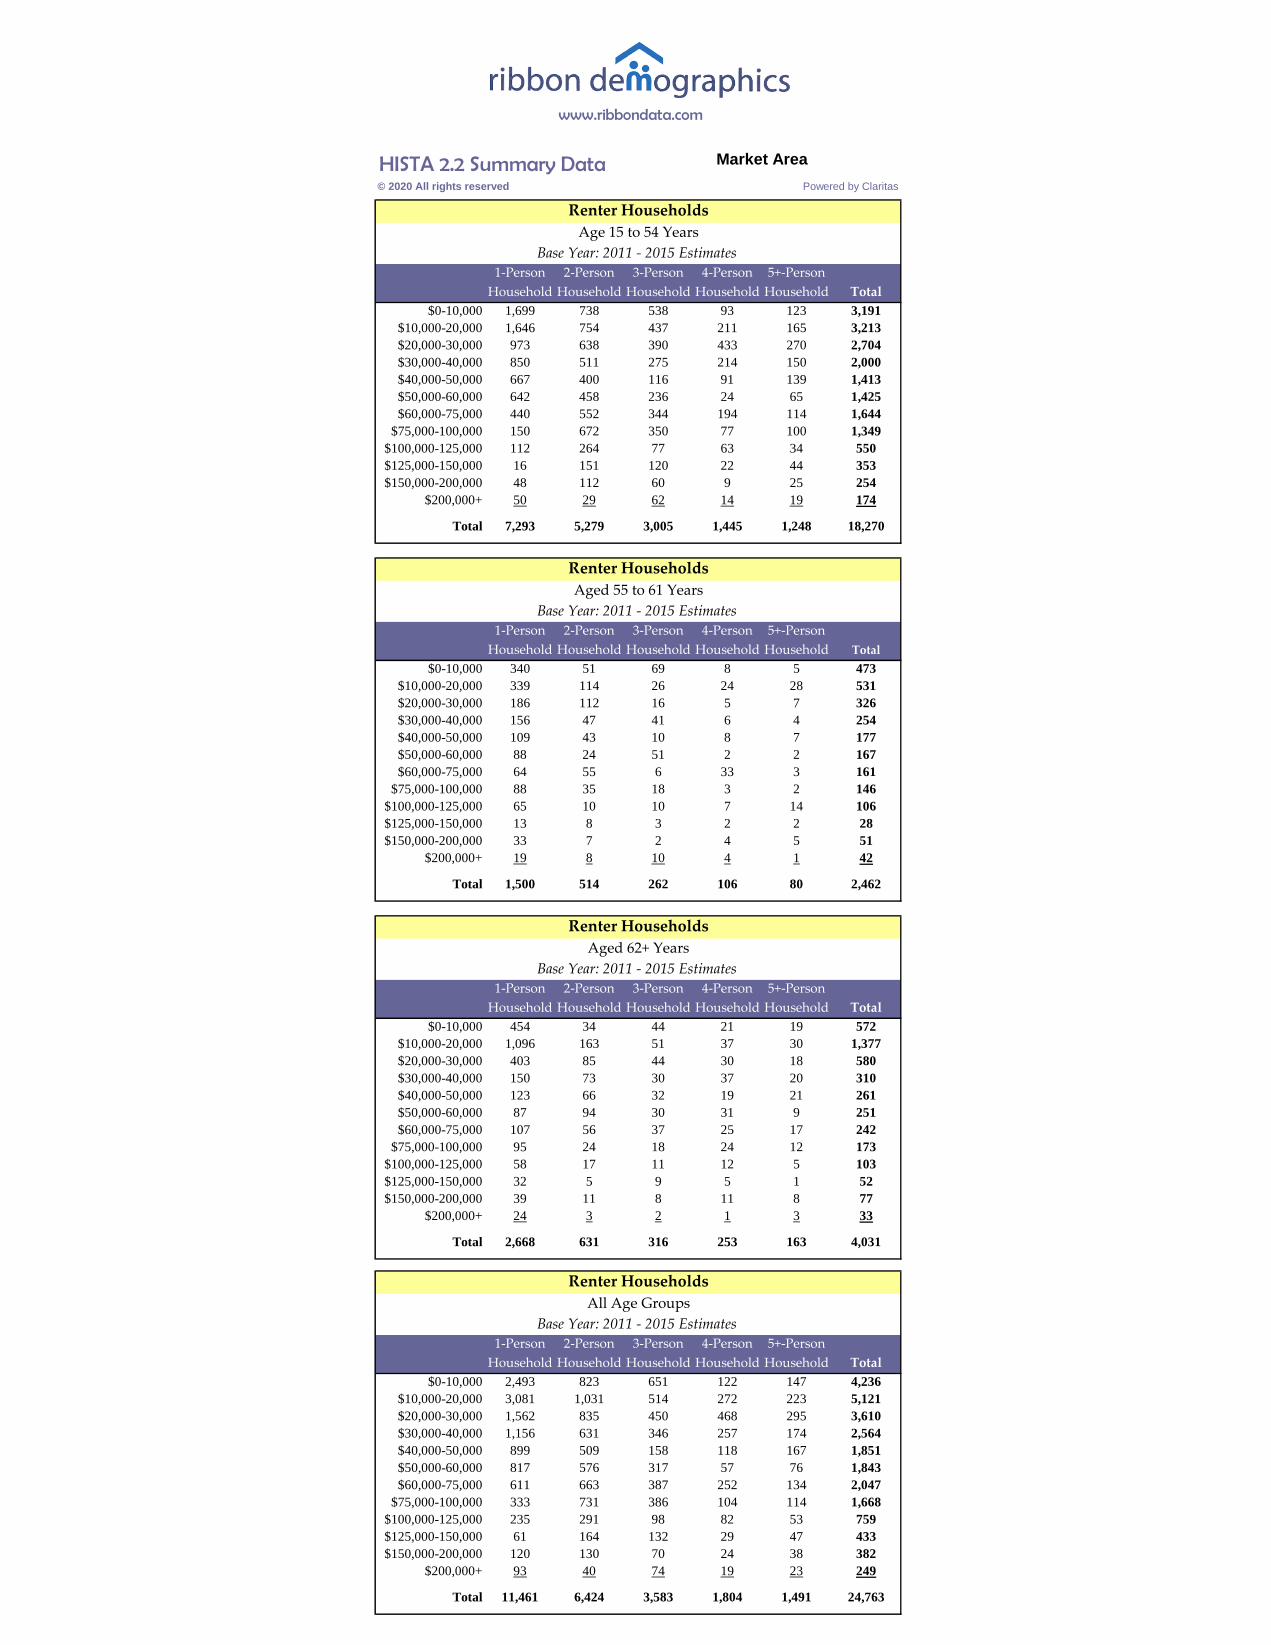
HISTA 2.2 Summary Data© 2020 All rights reserved Powered by Claritas
1-Person 2-Person 3-Person 4-Person 5+-Person
Household Household Household Household Household Total
$0-10,000 1,699 738 538 93 123 3,191
$10,000-20,000 1,646 754 437 211 165 3,213
$20,000-30,000 973 638 390 433 270 2,704
$30,000-40,000 850 511 275 214 150 2,000
$40,000-50,000 667 400 116 91 139 1,413
$50,000-60,000 642 458 236 24 65 1,425
$60,000-75,000 440 552 344 194 114 1,644
$75,000-100,000 150 672 350 77 100 1,349
$100,000-125,000 112 264 77 63 34 550
$125,000-150,000 16 151 120 22 44 353
$150,000-200,000 48 112 60 9 25 254
$200,000+ 50 29 62 14 19 174
Total 7,293 5,279 3,005 1,445 1,248 18,270
1-Person 2-Person 3-Person 4-Person 5+-Person
Household Household Household Household Household Total
$0-10,000 340 51 69 8 5 473
$10,000-20,000 339 114 26 24 28 531
$20,000-30,000 186 112 16 5 7 326
$30,000-40,000 156 47 41 6 4 254
$40,000-50,000 109 43 10 8 7 177
$50,000-60,000 88 24 51 2 2 167
$60,000-75,000 64 55 6 33 3 161
$75,000-100,000 88 35 18 3 2 146
$100,000-125,000 65 10 10 7 14 106
$125,000-150,000 13 8 3 2 2 28
$150,000-200,000 33 7 2 4 5 51
$200,000+ 19 8 10 4 1 42
Total 1,500 514 262 106 80 2,462
1-Person 2-Person 3-Person 4-Person 5+-Person
Household Household Household Household Household Total
$0-10,000 454 34 44 21 19 572
$10,000-20,000 1,096 163 51 37 30 1,377
$20,000-30,000 403 85 44 30 18 580
$30,000-40,000 150 73 30 37 20 310
$40,000-50,000 123 66 32 19 21 261
$50,000-60,000 87 94 30 31 9 251
$60,000-75,000 107 56 37 25 17 242
$75,000-100,000 95 24 18 24 12 173
$100,000-125,000 58 17 11 12 5 103
$125,000-150,000 32 5 9 5 1 52
$150,000-200,000 39 11 8 11 8 77
$200,000+ 24 3 2 1 3 33
Total 2,668 631 316 253 163 4,031
1-Person 2-Person 3-Person 4-Person 5+-Person
Household Household Household Household Household Total
$0-10,000 2,493 823 651 122 147 4,236
$10,000-20,000 3,081 1,031 514 272 223 5,121
$20,000-30,000 1,562 835 450 468 295 3,610
$30,000-40,000 1,156 631 346 257 174 2,564
$40,000-50,000 899 509 158 118 167 1,851
$50,000-60,000 817 576 317 57 76 1,843
$60,000-75,000 611 663 387 252 134 2,047
$75,000-100,000 333 731 386 104 114 1,668
$100,000-125,000 235 291 98 82 53 759
$125,000-150,000 61 164 132 29 47 433
$150,000-200,000 120 130 70 24 38 382
$200,000+ 93 40 74 19 23 249
Total 11,461 6,424 3,583 1,804 1,491 24,763
Renter Households
www.ribbondata.com
Renter Households
Age 15 to 54 Years
Base Year: 2011 - 2015 Estimates
Market Area
All Age Groups
Base Year: 2011 - 2015 Estimates
Aged 55 to 61 Years
Base Year: 2011 - 2015 Estimates
Renter Households
Aged 62+ Years
Base Year: 2011 - 2015 Estimates
Renter Households
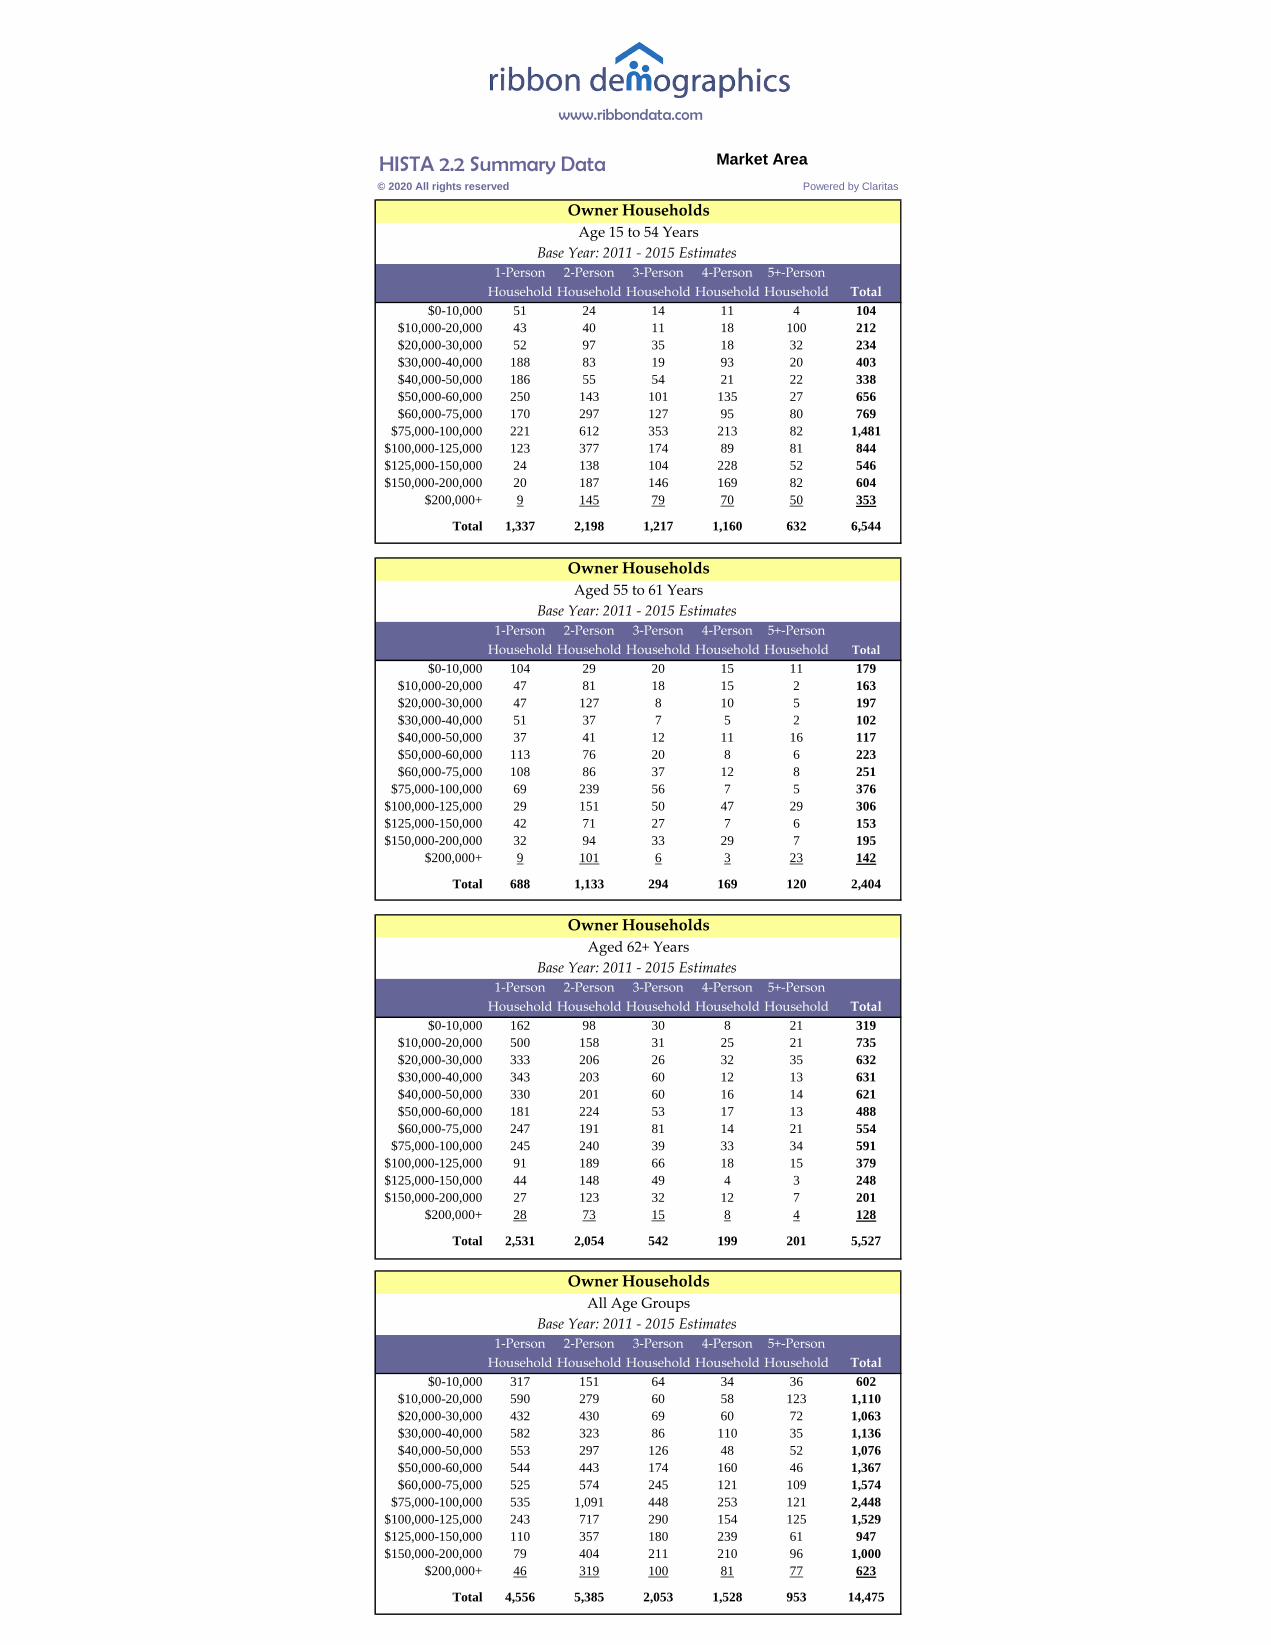
HISTA 2.2 Summary Data© 2020 All rights reserved Powered by Claritas
1-Person 2-Person 3-Person 4-Person 5+-Person
Household Household Household Household Household Total
$0-10,000 51 24 14 11 4 104
$10,000-20,000 43 40 11 18 100 212
$20,000-30,000 52 97 35 18 32 234
$30,000-40,000 188 83 19 93 20 403
$40,000-50,000 186 55 54 21 22 338
$50,000-60,000 250 143 101 135 27 656
$60,000-75,000 170 297 127 95 80 769
$75,000-100,000 221 612 353 213 82 1,481
$100,000-125,000 123 377 174 89 81 844
$125,000-150,000 24 138 104 228 52 546
$150,000-200,000 20 187 146 169 82 604
$200,000+ 9 145 79 70 50 353
Total 1,337 2,198 1,217 1,160 632 6,544
1-Person 2-Person 3-Person 4-Person 5+-Person
Household Household Household Household Household Total
$0-10,000 104 29 20 15 11 179
$10,000-20,000 47 81 18 15 2 163
$20,000-30,000 47 127 8 10 5 197
$30,000-40,000 51 37 7 5 2 102
$40,000-50,000 37 41 12 11 16 117
$50,000-60,000 113 76 20 8 6 223
$60,000-75,000 108 86 37 12 8 251
$75,000-100,000 69 239 56 7 5 376
$100,000-125,000 29 151 50 47 29 306
$125,000-150,000 42 71 27 7 6 153
$150,000-200,000 32 94 33 29 7 195
$200,000+ 9 101 6 3 23 142
Total 688 1,133 294 169 120 2,404
1-Person 2-Person 3-Person 4-Person 5+-Person
Household Household Household Household Household Total
$0-10,000 162 98 30 8 21 319
$10,000-20,000 500 158 31 25 21 735
$20,000-30,000 333 206 26 32 35 632
$30,000-40,000 343 203 60 12 13 631
$40,000-50,000 330 201 60 16 14 621
$50,000-60,000 181 224 53 17 13 488
$60,000-75,000 247 191 81 14 21 554
$75,000-100,000 245 240 39 33 34 591
$100,000-125,000 91 189 66 18 15 379
$125,000-150,000 44 148 49 4 3 248
$150,000-200,000 27 123 32 12 7 201
$200,000+ 28 73 15 8 4 128
Total 2,531 2,054 542 199 201 5,527
1-Person 2-Person 3-Person 4-Person 5+-Person
Household Household Household Household Household Total
$0-10,000 317 151 64 34 36 602
$10,000-20,000 590 279 60 58 123 1,110
$20,000-30,000 432 430 69 60 72 1,063
$30,000-40,000 582 323 86 110 35 1,136
$40,000-50,000 553 297 126 48 52 1,076
$50,000-60,000 544 443 174 160 46 1,367
$60,000-75,000 525 574 245 121 109 1,574
$75,000-100,000 535 1,091 448 253 121 2,448
$100,000-125,000 243 717 290 154 125 1,529
$125,000-150,000 110 357 180 239 61 947
$150,000-200,000 79 404 211 210 96 1,000
$200,000+ 46 319 100 81 77 623
Total 4,556 5,385 2,053 1,528 953 14,475
Owner Households
www.ribbondata.com
Owner Households
Age 15 to 54 Years
Base Year: 2011 - 2015 Estimates
Market Area
All Age Groups
Base Year: 2011 - 2015 Estimates
Aged 55 to 61 Years
Base Year: 2011 - 2015 Estimates
Owner Households
Aged 62+ Years
Base Year: 2011 - 2015 Estimates
Owner Households
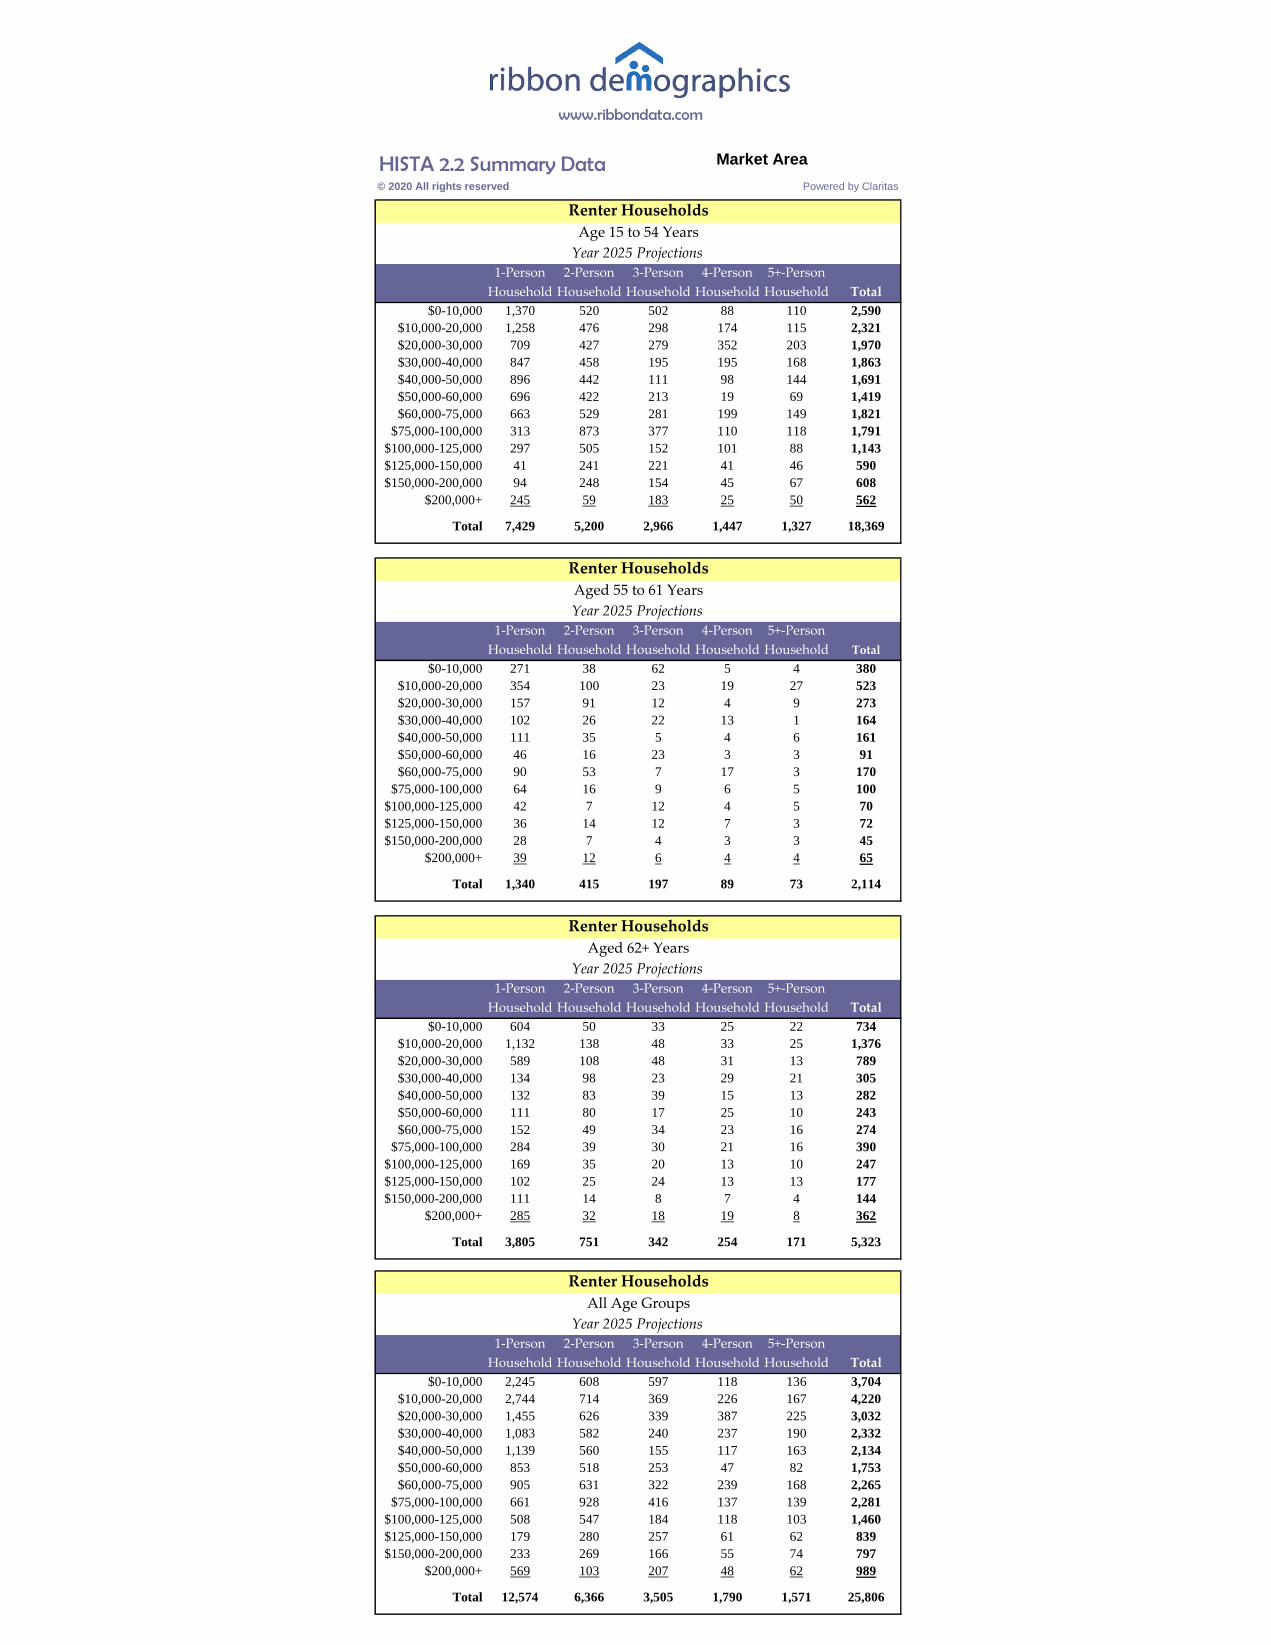
HISTA 2.2 Summary Data© 2020 All rights reserved Powered by Claritas
1-Person 2-Person 3-Person 4-Person 5+-Person
Household Household Household Household Household Total
$0-10,000 1,370 520 502 88 110 2,590
$10,000-20,000 1,258 476 298 174 115 2,321
$20,000-30,000 709 427 279 352 203 1,970
$30,000-40,000 847 458 195 195 168 1,863
$40,000-50,000 896 442 111 98 144 1,691
$50,000-60,000 696 422 213 19 69 1,419
$60,000-75,000 663 529 281 199 149 1,821
$75,000-100,000 313 873 377 110 118 1,791
$100,000-125,000 297 505 152 101 88 1,143
$125,000-150,000 41 241 221 41 46 590
$150,000-200,000 94 248 154 45 67 608
$200,000+ 245 59 183 25 50 562
Total 7,429 5,200 2,966 1,447 1,327 18,369
1-Person 2-Person 3-Person 4-Person 5+-Person
Household Household Household Household Household Total
$0-10,000 271 38 62 5 4 380
$10,000-20,000 354 100 23 19 27 523
$20,000-30,000 157 91 12 4 9 273
$30,000-40,000 102 26 22 13 1 164
$40,000-50,000 111 35 5 4 6 161
$50,000-60,000 46 16 23 3 3 91
$60,000-75,000 90 53 7 17 3 170
$75,000-100,000 64 16 9 6 5 100
$100,000-125,000 42 7 12 4 5 70
$125,000-150,000 36 14 12 7 3 72
$150,000-200,000 28 7 4 3 3 45
$200,000+ 39 12 6 4 4 65
Total 1,340 415 197 89 73 2,114
1-Person 2-Person 3-Person 4-Person 5+-Person
Household Household Household Household Household Total
$0-10,000 604 50 33 25 22 734
$10,000-20,000 1,132 138 48 33 25 1,376
$20,000-30,000 589 108 48 31 13 789
$30,000-40,000 134 98 23 29 21 305
$40,000-50,000 132 83 39 15 13 282
$50,000-60,000 111 80 17 25 10 243
$60,000-75,000 152 49 34 23 16 274
$75,000-100,000 284 39 30 21 16 390
$100,000-125,000 169 35 20 13 10 247
$125,000-150,000 102 25 24 13 13 177
$150,000-200,000 111 14 8 7 4 144
$200,000+ 285 32 18 19 8 362
Total 3,805 751 342 254 171 5,323
1-Person 2-Person 3-Person 4-Person 5+-Person
Household Household Household Household Household Total
$0-10,000 2,245 608 597 118 136 3,704
$10,000-20,000 2,744 714 369 226 167 4,220
$20,000-30,000 1,455 626 339 387 225 3,032
$30,000-40,000 1,083 582 240 237 190 2,332
$40,000-50,000 1,139 560 155 117 163 2,134
$50,000-60,000 853 518 253 47 82 1,753
$60,000-75,000 905 631 322 239 168 2,265
$75,000-100,000 661 928 416 137 139 2,281
$100,000-125,000 508 547 184 118 103 1,460
$125,000-150,000 179 280 257 61 62 839
$150,000-200,000 233 269 166 55 74 797
$200,000+ 569 103 207 48 62 989
Total 12,574 6,366 3,505 1,790 1,571 25,806
Renter Households
www.ribbondata.com
Renter Households
Age 15 to 54 Years
Year 2025 Projections
Market Area
All Age Groups
Year 2025 Projections
Aged 55 to 61 Years
Year 2025 Projections
Renter Households
Aged 62+ Years
Year 2025 Projections
Renter Households
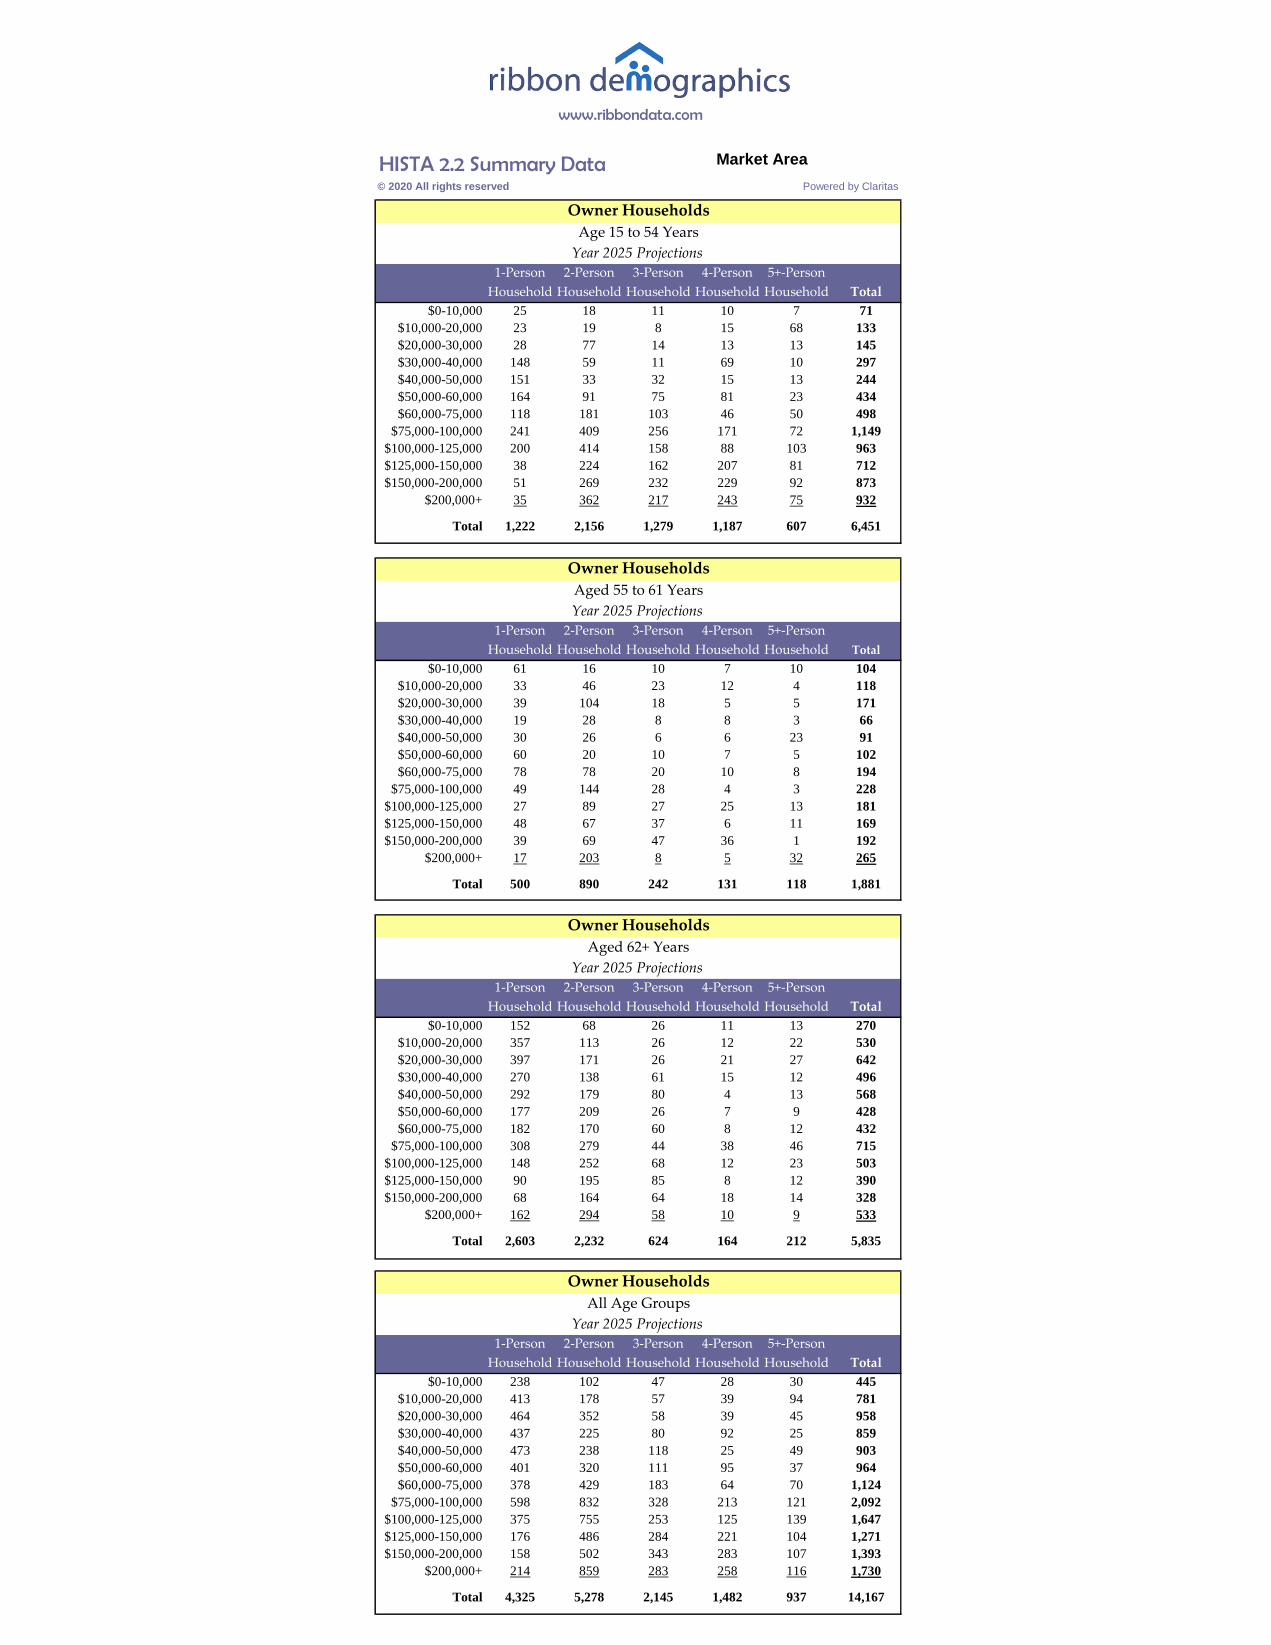
HISTA 2.2 Summary Data© 2020 All rights reserved Powered by Claritas
1-Person 2-Person 3-Person 4-Person 5+-Person
Household Household Household Household Household Total
$0-10,000 25 18 11 10 7 71
$10,000-20,000 23 19 8 15 68 133
$20,000-30,000 28 77 14 13 13 145
$30,000-40,000 148 59 11 69 10 297
$40,000-50,000 151 33 32 15 13 244
$50,000-60,000 164 91 75 81 23 434
$60,000-75,000 118 181 103 46 50 498
$75,000-100,000 241 409 256 171 72 1,149
$100,000-125,000 200 414 158 88 103 963
$125,000-150,000 38 224 162 207 81 712
$150,000-200,000 51 269 232 229 92 873
$200,000+ 35 362 217 243 75 932
Total 1,222 2,156 1,279 1,187 607 6,451
1-Person 2-Person 3-Person 4-Person 5+-Person
Household Household Household Household Household Total
$0-10,000 61 16 10 7 10 104
$10,000-20,000 33 46 23 12 4 118
$20,000-30,000 39 104 18 5 5 171
$30,000-40,000 19 28 8 8 3 66
$40,000-50,000 30 26 6 6 23 91
$50,000-60,000 60 20 10 7 5 102
$60,000-75,000 78 78 20 10 8 194
$75,000-100,000 49 144 28 4 3 228
$100,000-125,000 27 89 27 25 13 181
$125,000-150,000 48 67 37 6 11 169
$150,000-200,000 39 69 47 36 1 192
$200,000+ 17 203 8 5 32 265
Total 500 890 242 131 118 1,881
1-Person 2-Person 3-Person 4-Person 5+-Person
Household Household Household Household Household Total
$0-10,000 152 68 26 11 13 270
$10,000-20,000 357 113 26 12 22 530
$20,000-30,000 397 171 26 21 27 642
$30,000-40,000 270 138 61 15 12 496
$40,000-50,000 292 179 80 4 13 568
$50,000-60,000 177 209 26 7 9 428
$60,000-75,000 182 170 60 8 12 432
$75,000-100,000 308 279 44 38 46 715
$100,000-125,000 148 252 68 12 23 503
$125,000-150,000 90 195 85 8 12 390
$150,000-200,000 68 164 64 18 14 328
$200,000+ 162 294 58 10 9 533
Total 2,603 2,232 624 164 212 5,835
1-Person 2-Person 3-Person 4-Person 5+-Person
Household Household Household Household Household Total
$0-10,000 238 102 47 28 30 445
$10,000-20,000 413 178 57 39 94 781
$20,000-30,000 464 352 58 39 45 958
$30,000-40,000 437 225 80 92 25 859
$40,000-50,000 473 238 118 25 49 903
$50,000-60,000 401 320 111 95 37 964
$60,000-75,000 378 429 183 64 70 1,124
$75,000-100,000 598 832 328 213 121 2,092
$100,000-125,000 375 755 253 125 139 1,647
$125,000-150,000 176 486 284 221 104 1,271
$150,000-200,000 158 502 343 283 107 1,393
$200,000+ 214 859 283 258 116 1,730
Total 4,325 5,278 2,145 1,482 937 14,167
Owner Households
www.ribbondata.com
Owner Households
Age 15 to 54 Years
Year 2025 Projections
Market Area
All Age Groups
Year 2025 Projections
Aged 55 to 61 Years
Year 2025 Projections
Owner Households
Aged 62+ Years
Year 2025 Projections
Owner Households

Addenda
Addendum C
NCHMA Market Study Terminology
1400 16th Street, NW
Suite #420
Washington, DC 20036
P: (202) 939-1750
F: (202) 265-4435
www.housingonline.com
Market Study Terminology
Effective January 1, 2007, all affordable housing market studies performed by NCHMA members incorporate the member certification, market study index, the market study terminology and market study standards. State Housing Finance Agencies and other industry members are welcome to incorporate the information below in their own standards. NCHMA only requests written notification of use.
I. Common Market Study Terms The terms in this section are definitions agreed upon by NCHMA members. Market studies for affordable housing prepared by NCNCHMAHMA members should use these definitions in their studies except where other definitions are specifically identified.
Terminology Definition
Absorption period The period of time necessary for a newly constructed or renovated property to achieve the stabilized level of occupancy. The absorption period begins when the first certificate of occupancy is issued and ends when the last unit to reach the stabilized level of occupancy has a signed lease. Assumes a typical pre-marketing period, prior to the issuance of the certificate of occupancy, of about three to six months. The month that leasing is assumed to begin should accompany all absorption estimates.
Absorption rate The average number of units rented each month during the absorption period.
Acceptable rent burden
The rent-to-income ratio used to qualify tenants for both income-restricted and non-income restricted units. The acceptable rent burden varies depending on the requirements of funding sources, government funding sources, target markets, and local conditions.
Achievable Rents See Market Rent, Achievable Restricted Rent.
Affordable housing Housing affordable to low or very low-income tenants.
Amenity Tangible or intangible benefits offered to a tenant. Typical amenities include on-site recreational facilities, planned programs,
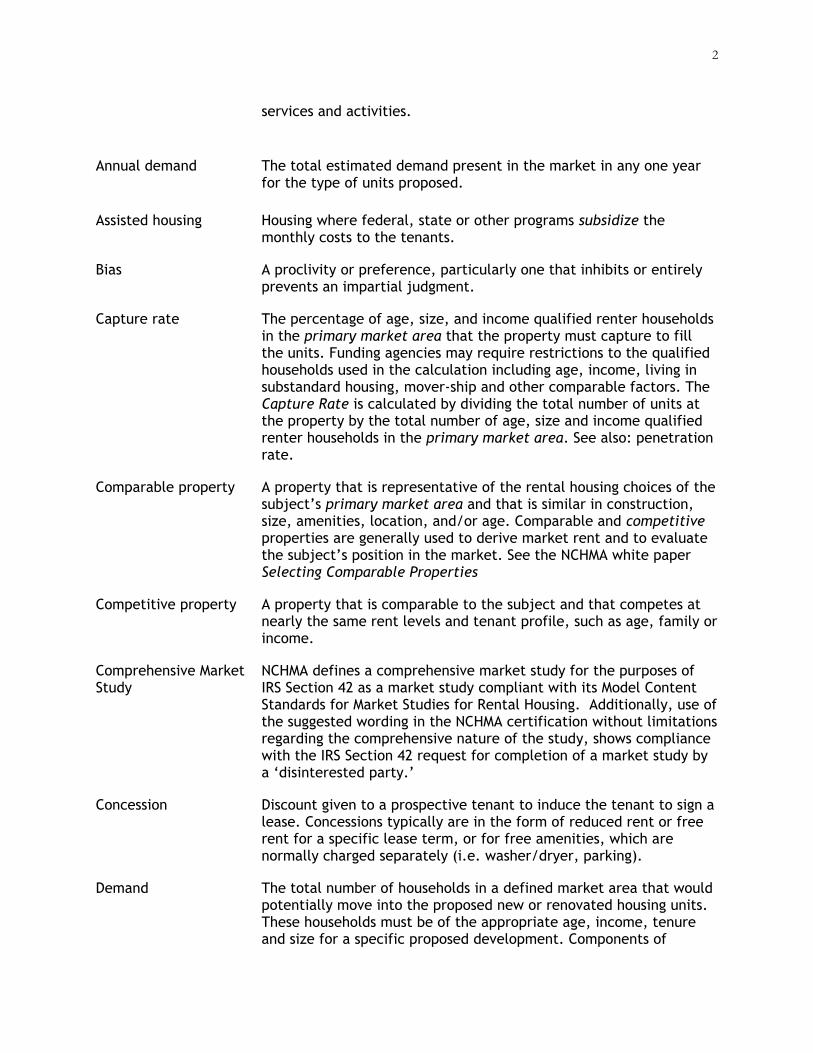
2
services and activities.
Annual demand The total estimated demand present in the market in any one year for the type of units proposed.
Assisted housing Housing where federal, state or other programs subsidize the monthly costs to the tenants.
Bias A proclivity or preference, particularly one that inhibits or entirely prevents an impartial judgment.
Capture rate The percentage of age, size, and income qualified renter households in the primary market area that the property must capture to fill the units. Funding agencies may require restrictions to the qualified households used in the calculation including age, income, living in substandard housing, mover-ship and other comparable factors. The Capture Rate is calculated by dividing the total number of units at the property by the total number of age, size and income qualified renter households in the primary market area. See also: penetration rate.
Comparable property A property that is representative of the rental housing choices of the subject’s primary market area and that is similar in construction, size, amenities, location, and/or age. Comparable and competitive properties are generally used to derive market rent and to evaluate the subject’s position in the market. See the NCHMA white paper Selecting Comparable Properties
Competitive property A property that is comparable to the subject and that competes at nearly the same rent levels and tenant profile, such as age, family or income.
Comprehensive Market Study
NCHMA defines a comprehensive market study for the purposes of IRS Section 42 as a market study compliant with its Model Content Standards for Market Studies for Rental Housing. Additionally, use of the suggested wording in the NCHMA certification without limitations regarding the comprehensive nature of the study, shows compliance with the IRS Section 42 request for completion of a market study by a ‘disinterested party.’
Concession Discount given to a prospective tenant to induce the tenant to sign a lease. Concessions typically are in the form of reduced rent or free rent for a specific lease term, or for free amenities, which are normally charged separately (i.e. washer/dryer, parking).
Demand The total number of households in a defined market area that would potentially move into the proposed new or renovated housing units. These households must be of the appropriate age, income, tenure and size for a specific proposed development. Components of
3
demand vary and can include household growth; turnover, those living in substandard conditions, rent over-burdened households, and demolished housing units. Demand is project specific.
Effective rents Contract rent less concessions.
Household trends Changes in the number of households for a particular area over a specific period of time, which is a function of new household formations (e.g. at marriage or separation), changes in average household size, and net migration.
Income band The range of incomes of households that can afford to pay a specific rent but do not have below any applicable program-specific maximum income limits. The minimum household income typically is based on a defined acceptable rent burden percentage and the maximum typically is pre-defined by specific program requirements or by general market parameters.
Infrastructure Services and facilities including roads, highways, water, sewerage, emergency services, parks and recreation, etc. Infrastructure includes both public and private facilities.
Market advantage The difference, expressed as a percentage, between the estimated market rent for an apartment property without income restrictions and the lesser of (a) the owner’s proposed rents or (b) the maximum rents permitted by the financing program for the same apartment property. (market rent – proposed rent) / market rent * 100
Market analysis A study of real estate market conditions for a specific type of property.
Market area See primary market area.
Market demand The total number of households in a defined market area that would potentially move into any new or renovated housing units. Market demand is not project specific and refers to the universe of tenure appropriate households, independent of income. The components of market demand are similar to those used in determining project-specific demand. A common example of market demand used by HUD’s MAP program, which is based on three years of renter household growth, loss of existing units due to demolition, and market conditions.
Market rent The rent that an apartment, without rent or income restrictions or rent subsidies, would command in the primary market area considering its location, features and amenities. Market rent should be adjusted for concessions and owner paid utilities included in the rent. See the NCHMA publication Calculating Market Rent.
4
Market study A comprehensive study of a specific proposal including a review of the housing market in a defined market area. Project specific market studies are often used by developers, syndicators, and government entities to determine the appropriateness of a proposed development, whereas market specific market studies are used to determine what housing needs, if any, exist within a specific geography. The minimal content of a market study is shown in the NCHMA publication Model Content for Market Studies for Rental Housing.
Marketability The manner in which the subject fits into the market; the relative desirability of a property (for sale or lease) in comparison with similar or competing properties in the area.
Market vacancy rate, economic
Percentage of rent loss due to concessions, vacancies, and non-payment of rent on occupied units.
Market vacancy rate, physical
Average number of apartment units in any market which are unoccupied divided by the total number of apartment units in the same market, excluding units in properties which are in the lease-up stage.
Migration The movement of households into or out of an area, especially a primary market area.
Mixed income property
An apartment property containing (1) both income restricted and unrestricted units or (2) units restricted at two or more income limits (i.e. low income tax credit property with income limits of 30%, 50% and 60%).
Mobility The ease with which people move from one location to another.
Move-up demand An estimate of how many consumers are able and willing to relocate to more expensive or desirable units. Examples: tenants who move from class-C properties to class-B properties, or tenants who move from older tax credit properties to newer tax credit properties-
Multi-family Structures that contain more than two housing units.
Neighborhood An area of a city or town with common demographic and economic features that distinguish it from adjoining areas.
Net rent (also referred to as contract rent or lease rent)
Gross rent less tenant paid utilities.
Penetration rate The percentage of age and income qualified renter households in the primary market area that all existing and proposed properties, to be completed within six months of the subject, and which are competitively priced to the subject that must be captured to
5
achieve the stabilized level of occupancy. Funding agencies may require restrictions to the qualified Households used in the calculation including age, income, living in substandard housing, mover ship and other comparable factors. units in all proposals / households in market * 100 See also: capture rate.
Pent-up demand A market in which there is a scarcity of supply and vacancy rates are very low.
Population trends Changes in population levels for a particular area over a specific period of time—which is a function of the level of births, deaths, and net migration.
Primary market area A geographic area from which a property is expected to draw the majority of its residents. See the NCHMA publication Determining Market Area.
Programmatic rents See restricted rents.
Project based rent assistance
Rental assistance from any source that is allocated to the property or a specific number of units in the property and is available to each income eligible tenant of the property or an assisted unit.
Redevelopment The redesign or rehabilitation of existing properties.
Rent burden Gross rent divided by adjusted monthly household income.
Rent burdened households
Households with rent burden above the level determined by the lender, investor, or public program to be an acceptable rent-to-income ratio.
Restricted rent The rent charged under the restrictions of a specific housing program or subsidy.
Restricted rent, Achievable
The rents that the project can attain taking into account both market conditions and rent in the primary market area and income restrictions.
Saturation The point at which there is no longer demand to support additional units. Saturation usually refers to a particular segment of a specific market.
Secondary market area
The portion of a market area that supplies additional support to an apartment property beyond that provided by the primary market area.
Special needs population
Specific market niche that is typically not catered to in a conventional apartment property. Examples of special needs populations include: substance abusers, visually impaired person or
6
persons with mobility limitations.
Stabilized level of occupancy
The underwritten or actual number of occupied units that a property is expected to maintain after the initial rent-up period, expressed as a percentage of the total units.
Subsidy Monthly income received by a tenant or by an owner on behalf of a tenant to pay the difference between the apartment’s contract rent and the amount paid by the tenant toward rent.
Substandard conditions
Housing conditions that are conventionally considered unacceptable which may be defined in terms of lacking plumbing facilities, one or more major systems not functioning properly, or overcrowded conditions.
Target income band The income band from which the subject property will draw tenants.
Target population The market segment or segments a development will appeal or cater to. State agencies often use target population to refer to various income set asides, elderly v. family, etc.
Tenant paid utilities The cost of utilities (not including cable, telephone, or internet) necessary for the habitation of a dwelling unit, which are paid by the tenant.
Turnover turnover period
1. An estimate of the number of housing units in a market area as a percentage of total housing units in the market area that will likely change occupants in any one year. See also: vacancy period. Housing units with new occupants / housing units * 100 2. The percent of occupants in a given apartment complex that move in one year.
Unmet housing need New units required in the market area to accommodate household growth, homeless people, and households in substandard conditions.
Unrestricted rents Rents that are not subject to restriction.
Unrestricted units Units that are not subject to any income or rent restrictions.
Vacancy period The amount of time that an apartment remains vacant and available for rent.
Vacancy rate- economic vacancy rate - physical
Maximum potential revenue less actual rent revenue divided by maximum potential rent revenue. The number of total habitable units that are vacant divided by the total number of units in the property.
7
II. Other Useful Terms The terms in this section are not defined by NCHMA.
Terminology Definition
Area Median Income (AMI)
100% of the gross median household income for a specific Metropolitan Statistical Area, county or non-metropolitan area established annually by HUD.
Attached housing Two or more dwelling units connected with party walls (e.g. townhouses or flats).
Basic Rent The minimum monthly rent that tenants who do not have rental assistance pay to lease units developed through the USDA-RD Section 515 Program, the HUD Section 236 Program and HUD Section 223(d)(3) Below Market Interest Rate Program. The Basic Rent is calculated as the amount of rent required to operate the property, maintain debt service on a subsidized mortgage with a below-market interest rate, and provide a return on equity to the developer in accordance with the regulatory documents governing the property.
Below Market Interest Rate Program (BMIR)
Program targeted to renters with income not exceeding 80% of area median income by limiting rents based on HUD’s BMIR Program requirements and through the provision of an interest reduction contract to subsidize the market interest rate to a below-market rate. Interest rates are typically subsidized to effective rates of one percent or three percent.
Census Tract A small, relatively permanent statistical subdivision delineated by a local committee of census data users for the purpose of presenting data. Census tract boundaries normally follow visible features, but may follow governmental unit boundaries and other non-visible features; they always nest within counties. They are designed to be relatively homogeneous units with respect to population characteristics, economic status, and living conditions at the time of establishment. Census tracts average about 4,000 inhabitants.
Central Business District (CBD)
The center of commercial activity within a town or city; usually the largest and oldest concentration of such activity.
Community Development Corporation (CDC)
Entrepreneurial institution combining public and private resources to aid in the development of socio-economically disadvantaged areas.
Condominium A form of joint ownership and control of property in which specified volumes of space (for example, apartments) are owned individually while the common elements of the property (for example, outside walls) are owned jointly.
8
Contract Rent 1.The actual monthly rent payable by the tenant, including any rent subsidy paid on behalf of the tenant, to the owner, inclusive of all terms of the lease. (HUD & RD) 2. The monthly rent agreed to between a tenant and a landlord (Census).
Difficult Development Area (DDA)
An area designated by HUD as an area that has high construction, land, and utility costs relative to the Area Median Gross Income. A project located in a DDA and utilizing the Low Income Housing Tax Credit may qualify for up to 130% of eligible basis for the purpose of calculating the Tax Credit allocation.
Detached Housing A freestanding dwelling unit, typically single-family, situated on its own lot.
Elderly or Senior Housing
Housing where (1) all the units in the property are restricted for occupancy by persons 62 years of age or older or (2) at least 80% of the units in each building are restricted for occupancy by Households where at least one Household member is 55 years of age or older and the housing is designed with amenities and facilities designed to meet the needs of senior citizens.
Extremely Low Income Person or Household with income below 30% of Area Median Income adjusted for Household size.
Fair Market Rent (FMR)
The estimates established by HUD of the Gross Rents (Contact Rent plus Tenant Paid Utilities) needed to obtain modest rental units in acceptable condition in a specific county or metropolitan statistical area. HUD generally sets FMR so that 40% of the rental units have rents below the FMR. In rental markets with a shortage of lower priced rental units HUD may approve the use of Fair Market Rents that are as high as the 50th percentile of rents.
Garden Apartments Apartments in low-rise buildings (typically two to four stories) that feature low density, ample open-space around buildings, and on-site parking.
Gross Rent The monthly housing cost to a tenant which equals the Contract Rent provided for in the lease plus the estimated cost of all Tenant Paid Utilities.
High-rise A residential building having more than ten stories.
Household One or more people who occupy a housing unit as their usual place of residence.
Housing Unit House, apartment, mobile home, or group of rooms used as a separate living quarters by a single household.
Housing Choice Voucher (Section 8
Federal rent subsidy program under Section 8 of the U.S. Housing Act, which issues rent vouchers to eligible Households to use in the
9
Program) housing of their choice. The voucher payment subsidizes the difference between the Gross Rent and the tenant’s contribution of 30% of adjusted income, (or 10% of gross income, whichever is greater). In cases where 30% of the tenants’ income is less than the utility allowance, the tenant will receive an assistance payment. In other cases, the tenant is responsible for paying his share of the rent each month.
Housing Finance Agency (HFA)
State or local agencies responsible for financing housing and administering Assisted Housing programs.
HUD Section 8 Program
Federal program that provides project based rental assistance. Under the program HUD contracts directly with the owner for the payment of the difference between the Contract Rent and a specified percentage of tenants’ adjusted income.
HUD Section 202 Program
Federal Program, which provides direct capital assistance (i.e. grant) and operating or rental assistance to finance housing designed for occupancy by elderly households who have income not exceeding 50% of Area Median Income. The program is limited to housing owned by 501(c)(3) nonprofit organizations or by limited partnerships where the sole general partner is a 501(c)(3) nonprofit organization. Units receive HUD project based rental assistance that enables tenants to occupy units at rents based on 30% of tenant income.
HUD Section 811 Program
Federal program, which provides direct capital assistance and operating or rental assistance to finance housing designed for occupancy by persons with disabilities who have income not exceeding 50% of Area Median Income. The program is limited to housing owned by 501(c)(3) nonprofit organizations or by limited partnerships where the sole general partner is a 501(c)(3) nonprofit organization.
HUD Section 236 Program
Federal program which provides interest reduction payments for loans which finance housing targeted to Households with income not exceeding 80% of area median income who pay rent equal to the greater of Basic Rent or 30 percent of their adjusted income. All rents are capped at a HUD approved market rent.
Income Limits Maximum Household income by county or Metropolitan Statistical Area , adjusted for Household size and expressed as a percentage of the Area Median Income for the purpose of establishing an upper limit for eligibility for a specific housing program. Income Limits for federal, state and local rental housing programs typically are established at 30%, 50%, 60% or 80% of AMI. HUD publishes Income Limits each year for 30% median, Very Low Income (50%), and Low-Income (80%), for households with 1 through 8 people.
Low Income Person or Household with gross Household income below 80% of Area Median Income adjusted for Household size.
10
Low Income Housing Tax Credit
A program to generate equity for investment in affordable rental housing authorized pursuant to Section 42 of the Internal Revenue Code, as amended. The program requires that a certain percentage of units built be restricted for occupancy to households earning 60% or less of Area Median Income, and that the rents on these units be restricted accordingly.
Low Rise Building A building with one to three stories
Metropolitan Statistical Area (MSA)
A geographic entity defined by the federal Office of Management and Budget for use by federal statistical agencies, based on the concept of a core area with a large population nucleus, plus adjacent communities having a high degree of economic and social integration with that core. Qualification of an MSA requires the presence of a city with 50,000 or more inhabitants, or the presence of an Urbanized Area (UA) and a total population of at least 100,000 (75,000 in New England). The county or counties containing the largest city and surrounding densely settled territory are central counties of the MSA. Additional outlying counties qualify to be included in the MSA by meeting certain other criteria of metropolitan character, such as a specified minimum population density or percentage of the population that is urban.
Mid-rise A building with four to ten stories.
Moderate Income Person or Household with gross household income between 80 and 120 percent of area median income adjusted for Household size.
Public Housing or Low Income Conventional Public Housing
HUD program administered by local (or regional) Housing Authorities which serves Low- and Very-Low Income Households with rent based on the same formula used for HUD Section 8 assistance.
Qualified Census Tract (QCT)
Any census tract (or equivalent geographic area defined by the Bureau of the Census) in which at least 50% of Households have an income less than 60% of Area Median Income or where the poverty rate is at least 25%. A project located in a QCT and receiving Low Income Housing Tax Credits may qualify for up to 130% of the eligible basis for the purpose of calculating the Tax Credit allocation.
Rural Development (RD) Market Rent
A monthly rent that can be charged for an apartment under a specific USDA-RD housing program, that reflects the agency’s estimate of the rent required to operate the property, maintain debt service on an un-subsidized mortgage and provide an adequate return to the property owner. This rent is the maximum rent that a tenant can pay at an RD Property.
Rural Development (RD) Program (Formerly the Farmers
Federal program which provides low interest loans to finance housing which serves low- and moderate-income persons in rural areas who pay 30 percent of their adjusted income on rent or the basic rent,
11
Home Administration Section 515 Rural Rental Housing Program)
whichever is the higher (but not exceeding the market rent). The Program may include property based rental assistance and interest reduction contracts to write down the interest on the loan to as low as one percent.
Single-Family Housing A dwelling unit, either attached or detached, designed for use by one Household and with direct access to a street. It does not share heating facilities or other essential building facilities with any other dwelling.
State Data Center (SDC)
A state agency or university facility identified by the governor of each state to participate in the Census Bureau’s cooperative network for the dissemination of the census data.
Tenant One who rents real property from another.
Tenure The distinction between owner-occupied and renter-occupied housing units.
Townhouse (or Row House)
Single-family attached residence separated from another by party walls, usually on a narrow lot offering small front and back-yards; also called a row house.
Very Low Income Person or Household whose gross household income does not exceed 50% of Area Median Income adjusted for Household size.
Zoning Classification and regulation of land by local governments according to use categories (zones); often also includes density designations.
Addenda
Addendum D
NCHMA Checklist
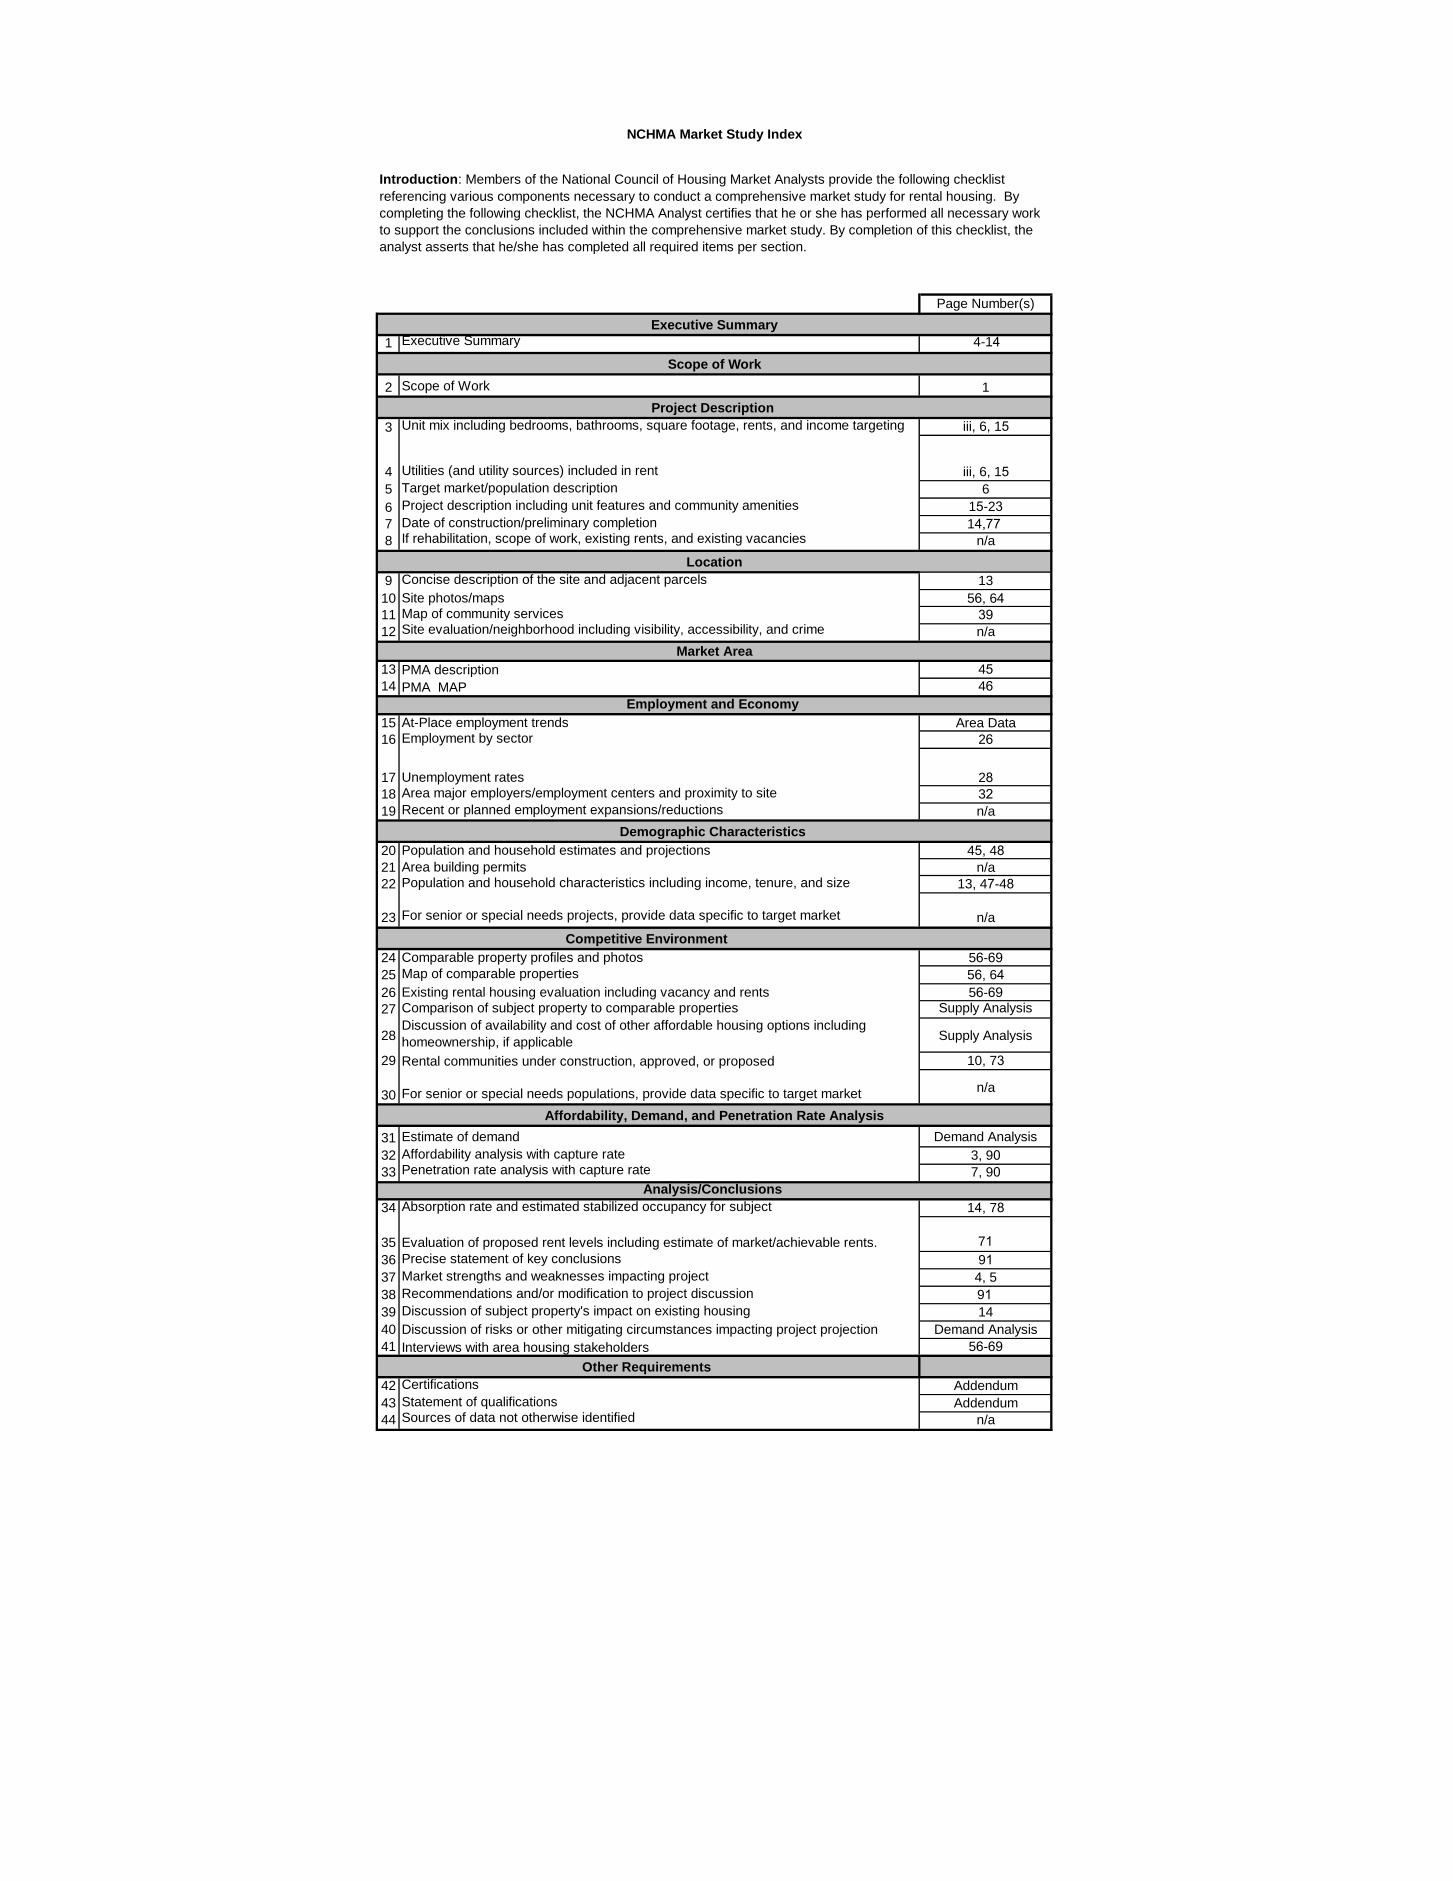
Page Number(s)
Executive Summary
1 Executive Summary 4-14Scope of Work
2 Scope of Work 1
Project Description
3 Unit mix including bedrooms, bathrooms, square footage, rents, and income targeting iii, 6, 15
4 Utilities (and utility sources) included in rent iii, 6, 155 Target market/population description 6
6 Project description including unit features and community amenities 15-237 Date of construction/preliminary completion 14,778 If rehabilitation, scope of work, existing rents, and existing vacancies n/a
Location
9 Concise description of the site and adjacent parcels 13
10 Site photos/maps 56, 6411 Map of community services 3912 Site evaluation/neighborhood including visibility, accessibility, and crime n/a
13 PMA description 4514 PMA MAP 46
Employment and Economy
15 At-Place employment trends Area Data
16 Employment by sector 26
17 Unemployment rates 2818 Area major employers/employment centers and proximity to site 3219 Recent or planned employment expansions/reductions n/a
Demographic Characteristics
20 Population and household estimates and projections 45, 4821 Area building permits n/a
22 Population and household characteristics including income, tenure, and size 13, 47-48
23 For senior or special needs projects, provide data specific to target market n/a
Competitive Environment
24 Comparable property profiles and photos 56-6925 Map of comparable properties 56, 6426 Existing rental housing evaluation including vacancy and rents 56-6927 Comparison of subject property to comparable properties Supply Analysis
28Discussion of availability and cost of other affordable housing options including
homeownership, if applicableSupply Analysis
29 Rental communities under construction, approved, or proposed 10, 73
30 For senior or special needs populations, provide data specific to target market n/a
Affordability, Demand, and Penetration Rate Analysis
31 Estimate of demand Demand Analysis
32 Affordability analysis with capture rate 3, 9033 Penetration rate analysis with capture rate 7, 90
Analysis/Conclusions
34 Absorption rate and estimated stabilized occupancy for subject 14, 78
35 Evaluation of proposed rent levels including estimate of market/achievable rents. 7136 Precise statement of key conclusions 9137 Market strengths and weaknesses impacting project 4, 5
38 Recommendations and/or modification to project discussion 9139 Discussion of subject property's impact on existing housing 14
40 Discussion of risks or other mitigating circumstances impacting project projection Demand Analysis
41 Interviews with area housing stakeholders 56-69
42 Certifications Addendum
43 Statement of qualifications Addendum
44 Sources of data not otherwise identified n/a
Other Requirements
NCHMA Market Study Index
Introduction: Members of the National Council of Housing Market Analysts provide the following checklist
referencing various components necessary to conduct a comprehensive market study for rental housing. By
completing the following checklist, the NCHMA Analyst certifies that he or she has performed all necessary work
to support the conclusions included within the comprehensive market study. By completion of this checklist, the
analyst asserts that he/she has completed all required items per section.
Market Area
Addenda
Addendum E
Qualifications

1
DAVID M. CARLON
Senior Vice President
Newmark Knight Frank
2410 North Forest Road
Suite 204
Amherst, NY 14068
T 716.864.8576
Years of Experience
26 Years
Areas of Specialization
Valuation & Advisory
Market Analysis
Residential Housing
Commercial
Mixed Use
Multifamily
Land
Professional Background
David Carlon joined Newmark Knight Frank Valuation & Advisory in 2019
as a senior vice president in the Buffalo office, where he focuses on
market analysis and appraisal work related to multifamily and residential
housing. A 26-year industry veteran, Mr. Carlon has prepared valuations
and market analyses across a broad range of property types that includes
residential housing, commercial property, low-income housing projects,
apartments, student apartments, historic preservation projects, senior
housing projects, assisted living/nursing homes and vacant land.
Over the course of his career, Mr. Carlon has focused on producing
quality market analyses and appraisal work in a timely manner for
mortgage lenders, corporations, non-profits, tax credit syndicators,
private developers/investors and government entities including Rural
Development and Fannie Mae/Freddie Mac. He also has experience with
feasibility studies, rent studies and litigation support regarding tax
assessment work.
Prior to joining Newmark Knight Frank, Mr. Carlon was an appraiser at
GAR Associates, a commercial real estate and advisory firm established
in 1961. He began his career as a certified general appraiser.
Licenses and Designations
Certified general real property appraiser, state of New York
Education
Mr. Carlon earned his Bachelor of Science degree in accounting and
finance from the University of New Haven and has completed additional
real estate finance, brokerage and appraisal coursework through certified
online learning websites.


JOSEPH D. SIEVERT
Senior Appraiser
Newmark Knight Frank
2410 North Forest Road, Suite 204Amherst, NY 14228
T 716.628.6667
Years of Experience
8 Years
Areas of Specialization
Valuation & Advisory
Market Analysis
Residential Housing
Commercial
Mixed Use
Multifamily
Historic Preservation
Land
Professional Background
Joseph Sievert joined Newmark Knight Frank Valuation & Advisory in
2019 as a senior appraiser in the Buffalo office. Mr. Sievert has
prepared valuations and market analyses across a wide range of
property types including residential housing, low-income housing
projects, apartments, student apartments, historic preservation projects,
senior housing projects, commercial property and vacant land.
Over the course of his career, Mr. Sievert has focused on producing
quality market analyses and appraisal work in a timely manner for
mortgage lenders, corporations, non-profits, tax credit syndicators,
private developers/investors, and government entities including Fannie
Mae/Freddie Mac, HUD and Rural Development. Mr. Sievert has
prepared various consulting reports for municipalities related to
downtown revitalizations, planned unit developments, smart growth
approaches and solutions for vacant property revitalization.
Mr. Sievert started his career in the appraisal field in 2011 and focuses
his work efforts on market analysis and appraisal work related to
multifamily and residential housing. Prior to joining Newmark Knight
Frank, Mr. Sievert was an Analyst at GAR Associates, a commercial
real estate and advisory firm established in 1961.
Licenses and Designations
Appraiser Trainee in New York State
Education
Mr. Sievert earned his Bachelor of Arts degree in Environmental
Studies Public Policy from Hobart College in 2005 and later earned his
Master’s Degree in Regional and Urban Planning at the State University
of New York at Buffalo in 2012.
1

1
M. SCOTT ALLEN, MAI
Executive Vice President
Newmark Knight Frank North Forest Road, Suite 204 Amherst, NY 14068 [email protected] T 716.523.0668
Years of Experience 33 Years
Areas of Specialization
Valuation & Advisory Market Analysis Multifamily Land HUD FHA/MAP LIHTC Appraisals and Market studies
Professional Background
Scott Allen, MAI, joined Newmark Knight Frank Valuation & Advisory in 2019 as executive vice president of the Buffalo office. A 33-year industry veteran, Mr. Allen has prepared valuations and market analyses across a broad range of property types that includes residential housing, low-income housing projects, apartments, student apartments, historic preservation projects, senior housing projects, commercial property and vacant land.
Over the course of his career, Mr. Allen has focused on producing quality market analyses and appraisal work in a timely manner for mortgage lenders, corporations, non-profits, tax credit syndicators, private developers/investors, and government entities including HUD, Rural Development, and Fannie Mae/Freddie Mac.
Mr. Allen began his career as a certified general appraiser and currently focuses his work efforts on market analysis and appraisal work related to multifamily and residential housing. Prior to joining Newmark Knight Frank, Mr. Allen was principal and partner of GAR Associates, a commercial real estate and advisory firm established in 1961.
Professional Affiliations
Member, National Council of Housing Market Analysts (NCHMA)
Board of Directors, National Housing & Rehabilitation Association (NH& RA)
Member, Eastern & Western Lenders Association (HUD Lenders)
Member, New York State Association For Affordable Housing(NYSAFAH)
Licenses and Designations
Designated member, Appraisal Institute (MAI)
Certified general real property appraiser, states of Arizona,Connecticut, Maryland, Massachusetts, New Jersey, New York, NorthCarolina, Pennsylvania, South Carolina, Vermont, and Virginia.
Approved Market Analyst by New York State HCR and ADOH(Arizona Department of Housing)
HUD MAP appraisal and market analysis
Education
Mr. Allen earned his Bachelor of Arts degree in materials and logisticsmanagement from Michigan State University’s College of Business in1986. Mr. Allen is currently certified by the Appraisal Institute’s voluntaryprogram of continuing education for its designated members, and hasbeen an approved instructor for the HUD MAP Underwriting TrainingProgram since 2013.