Comprehensive Housing Market Analysis for › PORTAL › publications › pdf › ... ·...
13
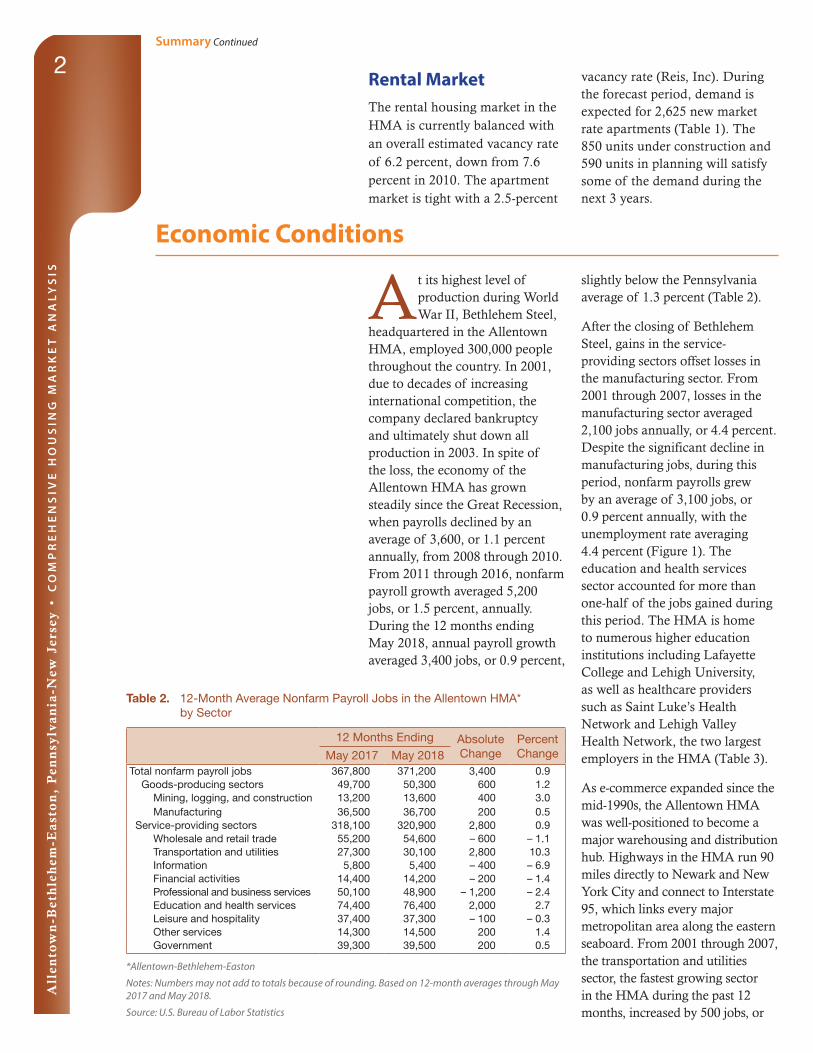
U.S. Department of Housing and Urban Development | Office of Policy Development and Research | As of June 1, 2018 Allentown-Bethlehem-Easton, Pennsylvania-New Jersey C O M P R E H E N S I V E H O U S I N G M A R K E T A N A LY S I S Housing Market Area The Allentown-Bethlehem-Easton Housing Market Area (hereafter, Allentown HMA), coterminous with the Allentown-Bethlehem-Easton, PA-NJ Metropolitan Statistical Area, includes Carbon, Lehigh, and Northampton Counties in Pennsylvania and Warren County in New Jersey. Once home to one of the largest steel manufacturers in America, Bethlehem Steel, it is now one of the largest distribution hubs on the East Coast, located 90 miles east of New York City and 60 miles northwest of Philadelphia. Market Details Summary being the fastest growing at a rate of 10.3 percent during the 12 months ending May 2018. The unemployment rate averaged 4.7 percent during the past 12 months, down from 5.2 percent a year earlier. Average annual nonfarm payroll growth is anticipated to be at 1.0 percent during the 3-year forecast period, with growth expected in each year. Sales Market The sales housing market in the HMA is currently tight. The estimated sales vacancy rate is 1.0 percent, down from 1.8 percent in 2010. During the next 3 years, demand is expected for 3,300 new homes in the HMA (Table 1). The 300 homes currently under construction will satisfy some of the demand. Economy The economy of the Allentown HMA has improved since 2011. During the 12 months ending May 2018, nonfarm payrolls increased by 3,400 jobs, or 0.9 percent, to 371,200. Education and health services is the largest payroll sector accounting for 21 percent of nonfarm payrolls, with transportation and utilities Economic Conditions ........................2 Population and Households ...........6 Housing Market Trends ....................8 Data Profile ........................................ 12 Allentown HMA* Sales Units Rental Units Total demand 3,300 2,625 Under construction 300 850 *Allentown-Bethlehem-Easton Total demand represents estimated production necessary to achieve a balanced market at the end of the forecast period. Units under construction as of June 1, 2018. The forecast period is June 1, 2018, to June 1, 2021. Source: Estimates by analyst Table 1. Housing Demand in the Allentown HMA* During the Forecast Period
Transcript of Comprehensive Housing Market Analysis for › PORTAL › publications › pdf › ... ·...
U.S. Department of Housing and Urban Development | Office of Policy Development and Research | As of June 1, 2018
Allentown-Bethlehem-Easton, Pennsylvania-New Jersey
C O M P R E H E N S I V E H O U S I N G M A R K E T A N A L Y S I S
Housing Market AreaThe Allentown-Bethlehem-Easton Housing Market Area (hereafter, Allentown HMA), coterminous with the Allentown-Bethlehem-Easton, PA-NJ Metropolitan Statistical Area, includes Carbon, Lehigh, and Northampton Counties in Pennsylvania and Warren County in New Jersey. Once home to one of the largest steel manufacturers in America, Bethlehem Steel, it is now one of the largest distribution hubs on the East Coast, located 90 miles east of New York City and 60 miles northwest of Philadelphia.
Market Details
Summary
being the fastest growing at a rate of 10.3 percent during the 12 months ending May 2018. The unemployment rate averaged 4.7 percent during the past 12 months, down from 5.2 percent a year earlier. Average annual nonfarm payroll growth is anticipated to be at 1.0 percent during the 3-year forecast period, with growth expected in each year.
Sales MarketThe sales housing market in the HMA is currently tight. The estimated sales vacancy rate is 1.0 percent, down from 1.8 percent in 2010. During the next 3 years, demand is expected for 3,300 new homes in the HMA (Table 1).
The 300 homes currently under construction will satisfy some of the demand.
EconomyThe economy of the Allentown HMA has improved since 2011. During the 12 months ending May 2018, nonfarm payrolls increased by 3,400 jobs, or 0.9 percent, to 371,200. Education and health services is the largest payroll sector accounting for 21 percent of nonfarm payrolls, with transportation and utilities
Economic Conditions ........................2
Population and Households ...........6
Housing Market Trends ....................8
Data Profile ........................................ 12
Allentown HMA*SalesUnits
RentalUnits
Total demand 3,300 2,625
Under construction 300 850
*Allentown-Bethlehem-Easton
Total demand represents estimated production necessary to achieve a balanced market at the end of the forecast period. Units under construction as of June 1, 2018. The forecast period is June 1, 2018, to June 1, 2021.
Source: Estimates by analyst
Table 1. Housing Demand in the Allentown HMA* During the Forecast Period
All
ento
wn
-Bet
hle
hem
-Ea
sto
n,
Pen
nsy
lva
nia
-New
Jer
sey
• C
OM
PR
EH
EN
SIV
E H
OU
SIN
G M
AR
KE
T A
NA
LYS
IS2
Summary Continued
Economic Conditions
At its highest level of production during World War II, Bethlehem Steel,
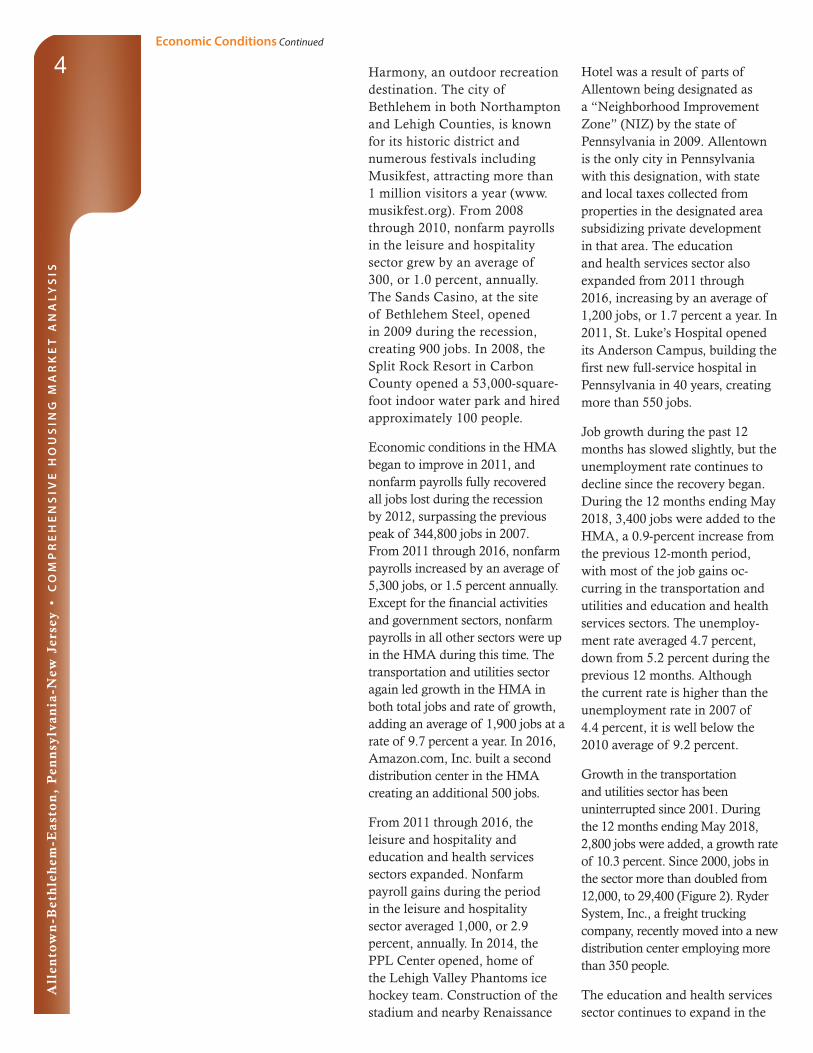
headquartered in the Allentown HMA, employed 300,000 people throughout the country. In 2001, due to decades of increasing international competition, the company declared bankruptcy and ultimately shut down all production in 2003. In spite of the loss, the economy of the Allentown HMA has grown steadily since the Great Recession, when payrolls declined by an average of 3,600, or 1.1 percent annually, from 2008 through 2010. From 2011 through 2016, nonfarm payroll growth averaged 5,200 jobs, or 1.5 percent, annually. During the 12 months ending May 2018, annual payroll growth averaged 3,400 jobs, or 0.9 percent,
Rental MarketThe rental housing market in the HMA is currently balanced with an overall estimated vacancy rate of 6.2 percent, down from 7.6 percent in 2010. The apartment market is tight with a 2.5-percent
vacancy rate (Reis, Inc). During the forecast period, demand is expected for 2,625 new market rate apartments (Table 1). The 850 units under construction and 590 units in planning will satisfy some of the demand during the next 3 years.
slightly below the Pennsylvania average of 1.3 percent (Table 2).
After the closing of Bethlehem Steel, gains in the service-providing sectors offset losses in the manufacturing sector. From 2001 through 2007, losses in the manufacturing sector averaged 2,100 jobs annually, or 4.4 percent. Despite the significant decline in manufacturing jobs, during this period, nonfarm payrolls grew by an average of 3,100 jobs, or 0.9 percent annually, with the unemployment rate averaging 4.4 percent (Figure 1). The education and health services sector accounted for more than one-half of the jobs gained during this period. The HMA is home to numerous higher education institutions including Lafayette College and Lehigh University, as well as healthcare providers such as Saint Luke’s Health Network and Lehigh Valley Health Network, the two largest employers in the HMA (Table 3).
As e-commerce expanded since the mid-1990s, the Allentown HMA was well-positioned to become a major warehousing and distribution hub. Highways in the HMA run 90 miles directly to Newark and New York City and connect to Interstate 95, which links every major metropolitan area along the eastern seaboard. From 2001 through 2007, the transportation and utilities sector, the fastest growing sector in the HMA during the past 12 months, increased by 500 jobs, or
Table 2. 12-Month Average Nonfarm Payroll Jobs in the Allentown HMA* by Sector
12 Months Ending Absolute Change
Percent ChangeMay 2017 May 2018
Total nonfarm payroll jobs 367,800 371,200 3,400 0.9Goods-producing sectors 49,700 50,300 600 1.2
Mining, logging, and construction 13,200 13,600 400 3.0Manufacturing 36,500 36,700 200 0.5
Service-providing sectors 318,100 320,900 2,800 0.9Wholesale and retail trade 55,200 54,600 – 600 – 1.1Transportation and utilities 27,300 30,100 2,800 10.3Information 5,800 5,400 – 400 – 6.9Financial activities 14,400 14,200 – 200 – 1.4Professional and business services 50,100 48,900 – 1,200 – 2.4Education and health services 74,400 76,400 2,000 2.7Leisure and hospitality 37,400 37,300 – 100 – 0.3Other services 14,300 14,500 200 1.4Government 39,300 39,500 200 0.5
*Allentown-Bethlehem-Easton
Notes: Numbers may not add to totals because of rounding. Based on 12-month averages through May 2017 and May 2018.
Source: U.S. Bureau of Labor Statistics

All
ento
wn
-Bet
hle
hem
-Ea
sto
n,
Pen
nsy
lva
nia
-New
Jer
sey
• C
OM
PR
EH
EN
SIV
E H
OU
SIN
G M
AR
KE
T A
NA
LYS
IS3
Economic Conditions Continued
3.7 percent annually. This growth is due in part to the extension of Route 33, connecting Interstates 78, 80, and Route 22, opening more of the area for industrial development.
From 2008 through 2010, with a period that includes the Great Recession, payrolls in the HMA declined by an average of 3,600 jobs, or 1.1 percent, annually. During these years, the mining, logging, and construction sector had the greatest rate of decline. Nonfarm payrolls in the sector decreased by an average of 1,500 jobs, or 9.8 percent a year in response to a sharp decrease in new home construction due to a tightening credit market and an increased rate of foreclosures. Also declining at a fast rate during the period was the information
sector, which lost an average of 600 jobs, or 8.9 percent annually. Some of these loses were at The Morning Call newspaper, which went through a period of restructuring, eliminating 40 jobs in its newsroom. Manufacturing further declined during the period, losing an average of 1,700 jobs, or 4.4 percent a year, in part due to Mack Trucks cutting 180 jobs at its manufacturing plant in Lehigh County.
Despite the mortgage crisis and downturn in the economy, the leisure and hospitality sector grew from 2008 through 2010. Carbon County, in the Pocono mountains, is a popular year-round tourist destination with ski resorts including Jack Frost and Blue Mountain, and Lake
*Allentown-Bethlehem-Easton Source: U.S. Bureau of Labor Statistics
2000
2002
2004
2006
2001
2003
2005
2007
2009
2010
2008
2012
2013
2015
2017
2016
2014
2011
Labo
r fo
rce
and
resi
dent
em
ploy
men
t
Une
mpl
oym
ent r
ate
470,000
450,000
430,000
410,000
390,000
370,000
350,000
330,000
10.09.08.07.06.05.04.03.02.01.00.0
Labor force Resident employment Unemployment rate
Figure 1. Trends in Labor Force, Resident Employment, and Unemployment Rate in the Allentown HMA*, 2000 Through 2017
Table 3. Major Employers in the Allentown HMA*
Name of Employer Nonfarm Payroll Sector Number of Employees
Lehigh Valley Health Network Education and health services 17,000Saint Luke’s Health Network Education and health services 11,000
Sands Bethworks Gaming LLC. Leisure and hospitality 2,500
Walmart, Inc. Wholesale and retail trade 2,500Mack Trucks Manufacturing 2,400Air Products Manufacturing 2,300Giant Food Stores, LLC. Wholesale and retail trade 2,200Commonwealth of Pennsylvania Government 2,200Amazon.com, Inc. Transportation and utilities 2,000Lehigh University Education and health services 1,800
*Allentown-Bethlehem-Easton
Note: Excludes local school districts.
Sources: The Morning Call; Pennsylvania Department of Labor and Industry.
All
ento
wn
-Bet
hle
hem
-Ea
sto
n,
Pen
nsy
lva
nia
-New
Jer
sey
• C
OM
PR
EH
EN
SIV
E H
OU
SIN
G M
AR
KE
T A
NA
LYS
IS4
Economic Conditions Continued
Harmony, an outdoor recreation destination. The city of Bethlehem in both Northampton and Lehigh Counties, is known for its historic district and numerous festivals including Musikfest, attracting more than 1 million visitors a year (www.musikfest.org). From 2008 through 2010, nonfarm payrolls in the leisure and hospitality sector grew by an average of 300, or 1.0 percent, annually. The Sands Casino, at the site of Bethlehem Steel, opened in 2009 during the recession, creating 900 jobs. In 2008, the Split Rock Resort in Carbon County opened a 53,000-square-foot indoor water park and hired approximately 100 people.
Economic conditions in the HMA began to improve in 2011, and nonfarm payrolls fully recovered all jobs lost during the recession by 2012, surpassing the previous peak of 344,800 jobs in 2007. From 2011 through 2016, nonfarm payrolls increased by an average of 5,300 jobs, or 1.5 percent annually. Except for the financial activities and government sectors, nonfarm payrolls in all other sectors were up in the HMA during this time. The transportation and utilities sector again led growth in the HMA in both total jobs and rate of growth, adding an average of 1,900 jobs at a rate of 9.7 percent a year. In 2016, Amazon.com, Inc. built a second distribution center in the HMA creating an additional 500 jobs.
From 2011 through 2016, the leisure and hospitality and education and health services sectors expanded. Nonfarm payroll gains during the period in the leisure and hospitality sector averaged 1,000, or 2.9 percent, annually. In 2014, the PPL Center opened, home of the Lehigh Valley Phantoms ice hockey team. Construction of the stadium and nearby Renaissance
Hotel was a result of parts of Allentown being designated as a “Neighborhood Improvement Zone” (NIZ) by the state of Pennsylvania in 2009. Allentown is the only city in Pennsylvania with this designation, with state and local taxes collected from properties in the designated area subsidizing private development in that area. The education and health services sector also expanded from 2011 through 2016, increasing by an average of 1,200 jobs, or 1.7 percent a year. In 2011, St. Luke’s Hospital opened its Anderson Campus, building the first new full-service hospital in Pennsylvania in 40 years, creating more than 550 jobs.
Job growth during the past 12 months has slowed slightly, but the unemployment rate continues to decline since the recovery began. During the 12 months ending May 2018, 3,400 jobs were added to the HMA, a 0.9-percent increase from the previous 12-month period, with most of the job gains oc-curring in the transportation and utilities and education and health services sectors. The unemploy-ment rate averaged 4.7 percent, down from 5.2 percent during the previous 12 months. Although the current rate is higher than the unemployment rate in 2007 of 4.4 percent, it is well below the 2010 average of 9.2 percent.
Growth in the transportation and utilities sector has been uninterrupted since 2001. During the 12 months ending May 2018, 2,800 jobs were added, a growth rate of 10.3 percent. Since 2000, jobs in the sector more than doubled from 12,000, to 29,400 (Figure 2). Ryder System, Inc., a freight trucking company, recently moved into a new distribution center employing more than 350 people.
The education and health services sector continues to expand in the

All
ento
wn
-Bet
hle
hem
-Ea
sto
n,
Pen
nsy
lva
nia
-New
Jer
sey
• C
OM
PR
EH
EN
SIV
E H
OU
SIN
G M
AR
KE
T A
NA
LYS
IS5
Economic Conditions Continued
HMA. During the 12 months ending May 2018, the sector accounted for nearly 21 percent of all nonfarm payrolls in the area (Figure 3). Approximately 2,000 jobs were added during the past 12 months, a rate of 2.7 percent. Lehigh Valley Hospital-Muhlenberg opened its Family Health Pavilion adding a maternity ward and a 28-bed in-patient physical therapy facility to
the hospital, with an estimated 145 new jobs in patient care.
During the 3-year forecast period, the economy of the Allentown HMA is expected to expand, although at a slightly slower pace than from 2011 through 2016. Total nonfarm payrolls are expected to grow by an average of 3,800 jobs, or 1.0 percent annually. The rate of growth is expected to increase each year while greater in-migration leads to growth in the labor force. During the forecast pe-riod, the transportation and utili-ties sector will contribute substan-tially to job growth in the HMA. FedEx Corporation is currently building a regional distribution hub, an investment of $335 million creating 700 jobs. The education and health services sector will expand with recently announced additions from local hospitals, colleges, and universities. During the 3-year forecast period, Saint Luke’s Health Network will build a new hospital on its Anderson Campus, creating an additional 200 jobs, while Lafayette College will expand its campus into the city of Easton with a new science center opening in 2019.
Figure 2. Sector Growth in the Allentown HMA*, Percentage Change, 2000 to Current
Total nonfarm payroll jobs
Goods-producing sectors
Mining, logging, and construction
Manufacturing
Service-providing sectors
Wholesale and retail trade
Information
Financial activities
Professional and business services
Education and health services
Government
Other services
Leisure and hospitality
Transportation and utilities
0– 50 – 25 5025 75 125100 150
*Allentown-Bethlehem-Easton
Note: Current is based on 12-month averages through May 2018.
Source: U.S. Bureau of Labor Statistics
Figure 3. Current Nonfarm Payroll Jobs in the Allentown HMA*, by Sector
*Allentown-Bethlehem-Easton
Note: Based on 12-month averages through May 2018.
Source: U.S. Bureau of Labor Statistics
Government: 10.6%
Other services: 3.9%
Leisure and hospitality: 10.0%
Education and health services: 20.6%
Professional and business services: 13.2%
Wholesale and retail trade: 14.7%
Manufacturing: 9.9%
Mining, logging, and construction: 3.7%
Transportation and utilities: 8.1%
Financial activities: 3.8%
Information: 1.5%

All
ento
wn
-Bet
hle
hem
-Ea
sto
n,
Pen
nsy
lva
nia
-New
Jer
sey
• C
OM
PR
EH
EN
SIV
E H
OU
SIN
G M
AR
KE
T A
NA
LYS
IS6
Figure 4. Components of Population Change in the Allentown HMA*, 2000 to Forecast
*Allentown-Bethlehem-Easton
Notes: The current date is June 1, 2018. The forecast date is June 1, 2021.
Sources: 2000 and 2010—2000 Census and 2010 Census; current and forecast—estimates by analyst
Ave
rage
ann
ual c
hang
e 7,000
6,500
5,000
4,500
3,000
2,000
1,000
02000 to 2010 2010 to current Current to forecast
Net natural change Net migration
Population and Households
Population in the Allentown HMA increased since July 2013 but at a slower rate than before the Great Recession. As of June 1, 2018, the population of the HMA is estimated at 843,400, with average annual population growth of 3,425 people, or 0.4 percent, since 2013. By comparison, from 2000 to 2008, population growth averaged 8,925 people, or 1.2 percent annually, before declining to an average of 2,500 people, or 0.3 percent a year from 2008 to 2013. Net in-migration fell during the period to an average of 1,400 people annually compared with 7,225 people each year from 2000 to 2008. Since 2013, net in-migration averaged 2,900 people each year due to increasing international and domestic in-migration after the economy recovered. Figure 4 shows the components of the population change in the HMA from 2000 to the forecast date.
The HMA has been a popular destination for immigrants because of its relatively low cost of living, and proximity to other cities, notably New York, with large foreign-born communities. From 2010 to 2017, international
in-migration to the HMA averaged 3,000 annually. The percentage of the population that was foreign-born in the HMA was 9 percent, compared with 6 percent in Pennsylvania (2010 and 2017 American Community Survey [ACS] 1-year data). Lehigh County is especially popular among people in-migrating from outside the United States, with the city of Allentown having a large population with familial ties to the Caribbean and Latin America. In 2016, approximately 12 percent of the population in Lehigh County was Puerto Rican, compared with 3 percent in Pennsylvania (2010 and 2016 ACS 5-year data). The trend of domestic out-migration that occurred for most of the decade in the HMA has changed. From 2010 to 2015, domestic out-migration averaged 1,250 annually. From 2015 to 2016, it was estimated at 640 people. By 2017, domestic out-migration reversed to in-migration with an estimated gain of 1,425 people.
Since 2010, the population of the HMA has grown older as net natural change (resident births minus resident deaths) decreased. From 2000 to 2010, net natural
All
ento
wn
-Bet
hle
hem
-Ea
sto
n,
Pen
nsy
lva
nia
-New
Jer
sey
• C
OM
PR
EH
EN
SIV
E H
OU
SIN
G M
AR
KE
T A
NA
LYS
IS7
Population and Households Continued
Ave
rage
ann
ual c
hang
e
9,0008,0007,0006,0005,0004,0003,0002,0001,000
02000 to 2010 2010 to current Current to forecast
Population Households
Figure 5. Population and Household Growth in the Allentown HMA*, 2000 to Forecast
*Allentown-Bethlehem-Easton Notes: The current date is June 1, 2018. The forecast date is June 1, 2021.Sources: 2000 and 2010—2000 Census and 2010 Census; current and forecast—estimates by analyst
250,000
200,000
150,000
100,000
50,000
0 2000 2010 Current
Renter Owner
Figure 6. Number of Households by Tenure in the Allentown HMA*, 2000 to Current
*Allentown-Bethlehem-Easton Notes: The current date is June 1, 2018.Sources: 2000 and 2010—2000 Census and 2010 Census; current—estimates by analyst
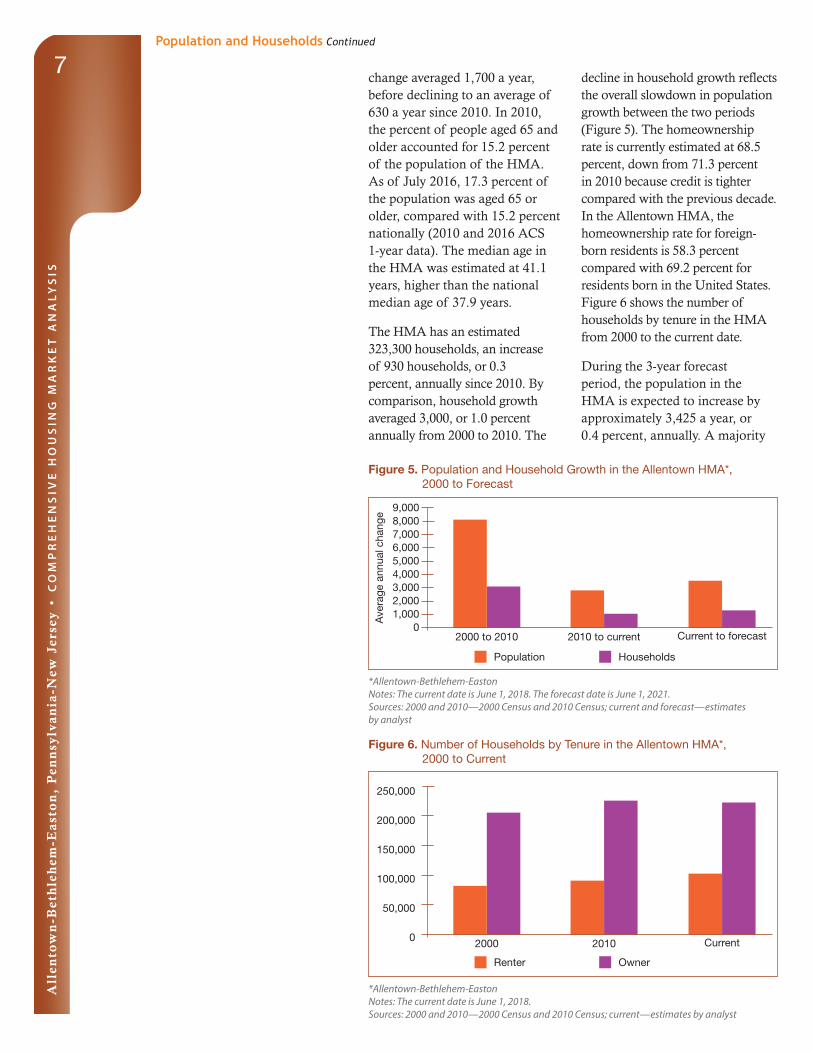
change averaged 1,700 a year, before declining to an average of 630 a year since 2010. In 2010, the percent of people aged 65 and older accounted for 15.2 percent of the population of the HMA. As of July 2016, 17.3 percent of the population was aged 65 or older, compared with 15.2 percent nationally (2010 and 2016 ACS 1-year data). The median age in the HMA was estimated at 41.1 years, higher than the national median age of 37.9 years.
The HMA has an estimated 323,300 households, an increase of 930 households, or 0.3 percent, annually since 2010. By comparison, household growth averaged 3,000, or 1.0 percent annually from 2000 to 2010. The
decline in household growth reflects the overall slowdown in population growth between the two periods (Figure 5). The homeownership rate is currently estimated at 68.5 percent, down from 71.3 percent in 2010 because credit is tighter compared with the previous decade. In the Allentown HMA, the homeownership rate for foreign-born residents is 58.3 percent compared with 69.2 percent for residents born in the United States. Figure 6 shows the number of households by tenure in the HMA from 2000 to the current date.
During the 3-year forecast period, the population in the HMA is expected to increase by approximately 3,425 a year, or 0.4 percent, annually. A majority

All
ento
wn
-Bet
hle
hem
-Ea
sto
n,
Pen
nsy
lva
nia
-New
Jer
sey
• C
OM
PR
EH
EN
SIV
E H
OU
SIN
G M
AR
KE
T A
NA
LYS
IS8
Population and Households Continued
of the population growth will be due to net in-migration, with both domestic and foreign in-migration rising, while net natural change is expected to rise, albeit modestly. The number of households in the HMA is expected to increase by an
Housing Market Trends
average of 1,200, or 0.4 percent, annually, to approximately 326,900. Growth is expected to be concentrated around areas with easy access to Route 22 and Interstate 78 in Lehigh and Northampton Counties.
Sales MarketSales housing market conditions in the Allentown HMA are tight, with an estimated vacancy rate of 1.0 percent, down from 1.8 percent in April 2010 (Table DP-1 at the end of this report). The decline in vacancies reflects a decrease in new construction and the absorption of excess inventory after the foreclosure crisis. The inventory of homes for sale decreased from a 2.7-month supply in April 2017 to a 1.8-month supply as of April 2018 (CoreLogic, Inc, with estimates by the analyst.).
After declining each year from 2008 through 2011, home sales grew as net in-migration increased. However, the number of homes sold is well below the prerecession peak. During the 12 months ending April 2018, sales of new and existing single-family homes, townhomes, and condominiums increased by 910, or 7 percent, from the previous 12-month period, to 13,850 homes sold (CoreLogic, Inc., with adjustments by the analyst). By comparison, from 2003 through 2006, new and existing home sales averaged 17,050 annually, reaching a peak in 2004 of 19,100 homes sold. Home sales declined significantly from 2008 through 2011, to a 12-month average of 7,850 before the housing market began to recover in 2012. During the 12 months ending April 2018, the average new and existing home
sales price increased 3 percent, or by $4,825, to $197,600, compared with a decrease of 2 percent, or $3,775, during the previous 12-month period. By comparison, the 12-month average sales price peaked at $225,300 in 2007 before declining to a low of $182,700 in 2011.
A large number of foreclosed homes entered the market during the Great Recession, but absorption of those homes was slow due to a decline in net in-migration at the beginning of the decade. During the 12 months ending April 2018, distressed home sales (real estate owned [REO] and short sales) accounted for nearly 9 percent of total sales, below the recent high of 20 percent of homes sold in 2011 (CoreLogic, Inc.). However, the share of distressed home sales remains higher than the average from 2001 through 2007, when they accounted for approximately 1 percent of sales. The high share of distressed home sales is due, in part, to the large number of REO properties that entered the market in 2015 that are still being absorbed. The REO properties were slow to enter the market because Pennsylvania is a judicial foreclosure state creating a backlog of distressed properties. In 2013, the average time between initial filing of a foreclosure and resolution was 620 days (RealtyTrac). During the 12 months ending April 2018, the sales price of an REO home

All
ento
wn
-Bet
hle
hem
-Ea
sto
n,
Pen
nsy
lva
nia
-New
Jer
sey
• C
OM
PR
EH
EN
SIV
E H
OU
SIN
G M
AR
KE
T A
NA
LYS
IS9
Housing Market Trends Continued
Figure 7. Single-Family Homes Permitted in the Allentown HMA*, 2000 to Current
2000
2001
2002
2003
2004
2005
2006
5,000
4,000
3,000
2,000
1,000
0
2008
2009
2010
2011
2013
2018
2017
2016
2015
2014
2012
2007
*Allentown-Bethlehem-Easton
Notes: Includes townhomes. Current includes data through May 2018.
Sources: U.S. Census Bureau, Building Permits Survey; estimates by analyst
averaged $114,900, 40 percent less than a regular resale home, contributing to home price growth that was below the national average of 6 percent. Although the percentage of REO sales was relatively higher, as of April 2018, the percentage of home loans in the HMA that were seriously delinquent (90 or more days delinquent or in foreclosure) or had transitioned into REO status was 2.9 percent, slightly above the national average of 2.1 percent, but below the April 2017 average of 3.7 percent. While this is below the peak in 2012 of 8.4 percent, it is above the 2006 average prior to the recession of 1.7 percent.
Despite increasing net in-migration and improved economic conditions, new home construction since 2013 as measured by the number of
single-family homes permitted, has been relatively unchanged. Single-family permitting from 2013 through 2016 averaged 1,050 a year. By comparison, single-family homebuilding peaked in 2004 with 4,450 homes permitted (Figure 7) before declining by an average of 450 homes, or 19 percent, annually through 2012, to a low of 830. During the 12 months ending May 2018, an estimated 1,000 single-family homes were permitted, a decline of 5 percent compared with the same period a year earlier (preliminary data). Currently, an estimated 300 single-family homes are under construction throughout the HMA.
Since 2016, approximately 86 percent of single-family home construction in the HMA was in Northampton and Lehigh Counties. Madison Farms, a planned community in Northampton County is expanding and will include a single-family, townhome, and carriage home development across from Saint Luke’s Hospital Anderson Campus and 1 mile from Interstate 78. When complete, the subdivision will consist of 267 homes, with prices starting at $240,000 for a three-bedroom townhome. The Fields at Blue Barn Meadows in Lehigh County is off the interchange between Route 22 and Interstate 78, near Lehigh Valley Hospital and Dorney Park. Phase one of the planned 112-townhome development is currently under construction. Homes are built as they are sold with a base price of $265,000.
During the next 3 years, demand is expected for 3,300 new homes in the HMA, increasing each year with the expected growth in migration (Table 1). The 300 homes currently under construction will satisfy a portion of the demand. Approximately 65 percent of the demand will be
Table 4. Estimated Demand for New Market-Rate Sales Housing in the Allentown HMA* During the Forecast Period
Price Range ($) Units ofDemand
Percentof TotalFrom To
150,000 249,999 660 20.0
250,000 349,999 1,150 35.0
350,000 449,999 990 30.0
400,000 and higher 500 15.0
*Allentown-Bethlehem-Easton
Notes: Numbers may not add to totals because of rounding. The 300 homes currently under construction in the HMA will likely satisfy some of the forecast demand.
Source: Estimates by analyst
All
ento
wn
-Bet
hle
hem
-Ea
sto
n,
Pen
nsy
lva
nia
-New
Jer
sey
• C
OM
PR
EH
EN
SIV
E H
OU
SIN
G M
AR
KE
T A
NA
LYS
IS10
Housing Market Trends Continued
*Allentown-Bethlehem-Easton
Note: The current date is June 1, 2018.
Sources: 2000 and 2010—2000 Census and 2010 Census; current—estimates by analyst
Figure 8. Rental Vacancy Rates in the Allentown HMA*, 2000 to Current
2000
6.6
2010
7.6
Current
6.28.0
6.0
4.0
2.0
0.0
for new homes priced between $250,000 and $449,999 (Table 4).
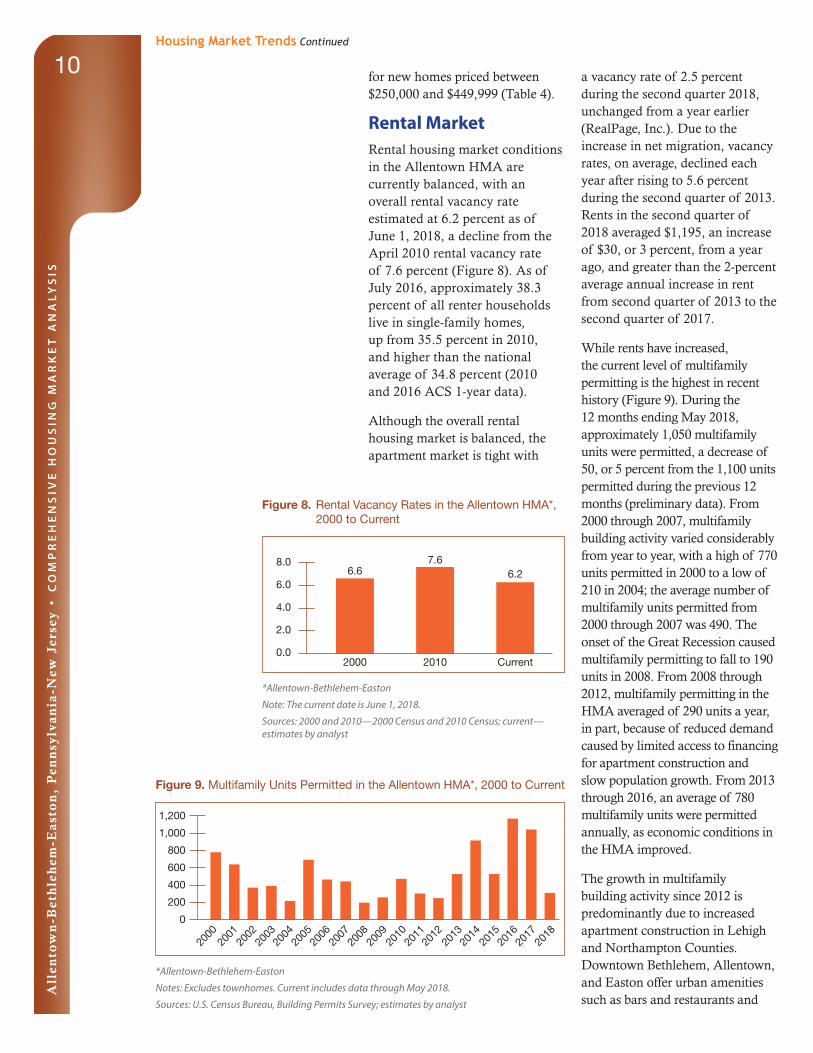
Rental MarketRental housing market conditions in the Allentown HMA are currently balanced, with an overall rental vacancy rate estimated at 6.2 percent as of June 1, 2018, a decline from the April 2010 rental vacancy rate of 7.6 percent (Figure 8). As of July 2016, approximately 38.3 percent of all renter households live in single-family homes, up from 35.5 percent in 2010, and higher than the national average of 34.8 percent (2010 and 2016 ACS 1-year data).
Although the overall rental housing market is balanced, the apartment market is tight with
a vacancy rate of 2.5 percent during the second quarter 2018, unchanged from a year earlier (RealPage, Inc.). Due to the increase in net migration, vacancy rates, on average, declined each year after rising to 5.6 percent during the second quarter of 2013. Rents in the second quarter of 2018 averaged $1,195, an increase of $30, or 3 percent, from a year ago, and greater than the 2-percent average annual increase in rent from second quarter of 2013 to the second quarter of 2017.
While rents have increased, the current level of multifamily permitting is the highest in recent history (Figure 9). During the 12 months ending May 2018, approximately 1,050 multifamily units were permitted, a decrease of 50, or 5 percent from the 1,100 units permitted during the previous 12 months (preliminary data). From 2000 through 2007, multifamily building activity varied considerably from year to year, with a high of 770 units permitted in 2000 to a low of 210 in 2004; the average number of multifamily units permitted from 2000 through 2007 was 490. The onset of the Great Recession caused multifamily permitting to fall to 190 units in 2008. From 2008 through 2012, multifamily permitting in the HMA averaged of 290 units a year, in part, because of reduced demand caused by limited access to financing for apartment construction and slow population growth. From 2013 through 2016, an average of 780 multifamily units were permitted annually, as economic conditions in the HMA improved.
The growth in multifamily building activity since 2012 is predominantly due to increased apartment construction in Lehigh and Northampton Counties. Downtown Bethlehem, Allentown, and Easton offer urban amenities such as bars and restaurants and
Figure 9. Multifamily Units Permitted in the Allentown HMA*, 2000 to Current
*Allentown-Bethlehem-Easton
Notes: Excludes townhomes. Current includes data through May 2018.
Sources: U.S. Census Bureau, Building Permits Survey; estimates by analyst
1,200
1,000
800
600
400
200
0
2000
2001
2002
2003
2004
2005
2006
2008
2009
2010
2011
2013
2018
2017
2016
2015
2014
2012
2007
All
ento
wn
-Bet
hle
hem
-Ea
sto
n,
Pen
nsy
lva
nia
-New
Jer
sey
• C
OM
PR
EH
EN
SIV
E H
OU
SIN
G M
AR
KE
T A
NA
LYS
IS11
Housing Market Trends Continued
access to healthcare services, as well as higher education institutions including Lehigh University and Lafayette College. These areas are appealing to students and young professionals in and around the HMA, contributing to the increase in the demand for apartments. Allentown is especially attractive to developers with the Neighborhood Improvement Zone promising tax incentives for investors.
Strata III—Symphony is an apartment development recently completed in January 2018 in a NIZ in downtown Allentown. The 72-unit complex consists of 8 studio, 12 one-, and 52 two-bedroom units, and rents start at $1,095, $1,265, and $1,385, respectively. All units have been leased since opening.
The 48-unit NorthPark Apartments in Northampton County consists of 32 one-bedroom and 16 two-bedroom units. Rents start at
$1,300 and $1,600, respectively. Completed in 2017, the development is less than 2 miles from Northampton Community College, Saint Luke’s Hospital Anderson Campus, and the intersection of Routes 22 and 33.
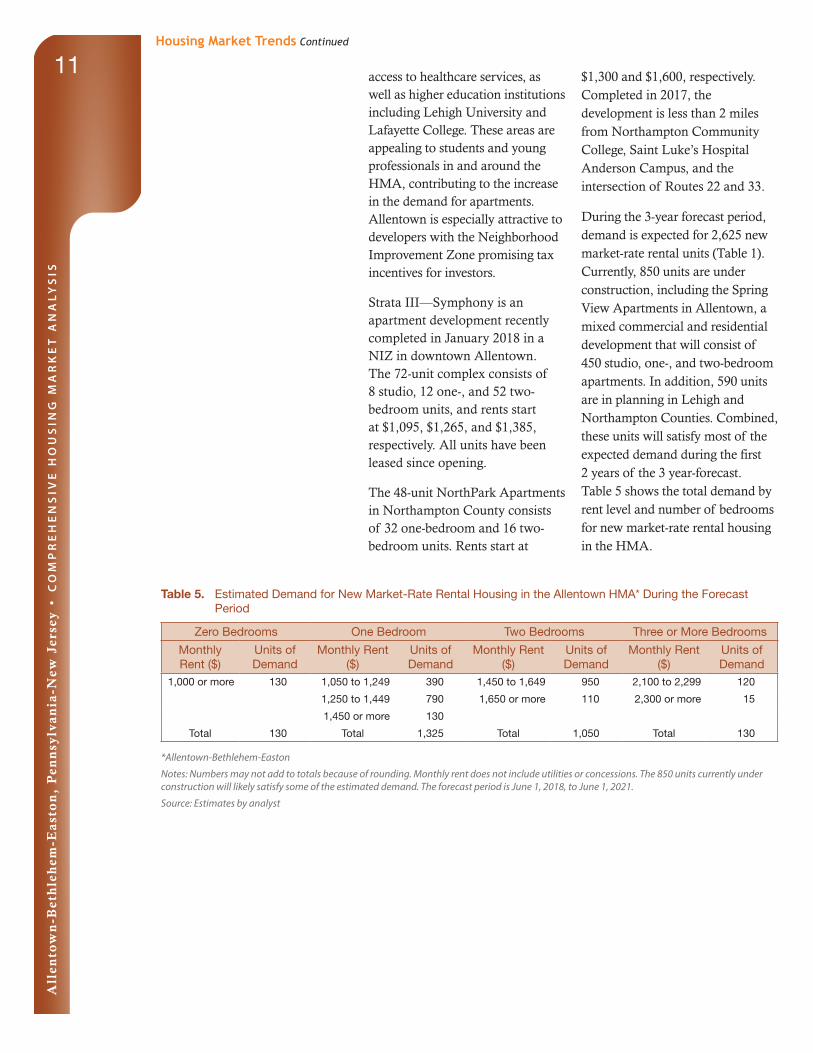
During the 3-year forecast period, demand is expected for 2,625 new market-rate rental units (Table 1). Currently, 850 units are under construction, including the Spring View Apartments in Allentown, a mixed commercial and residential development that will consist of 450 studio, one-, and two-bedroom apartments. In addition, 590 units are in planning in Lehigh and Northampton Counties. Combined, these units will satisfy most of the expected demand during the first 2 years of the 3 year-forecast. Table 5 shows the total demand by rent level and number of bedrooms for new market-rate rental housing in the HMA.
*Allentown-Bethlehem-Easton
Notes: Numbers may not add to totals because of rounding. Monthly rent does not include utilities or concessions. The 850 units currently under construction will likely satisfy some of the estimated demand. The forecast period is June 1, 2018, to June 1, 2021.
Source: Estimates by analyst
Table 5. Estimated Demand for New Market-Rate Rental Housing in the Allentown HMA* During the Forecast Period
Zero Bedrooms One Bedroom Two Bedrooms Three or More Bedrooms
Monthly Rent ($)
Units of Demand
Monthly Rent ($)
Units of Demand
Monthly Rent ($)
Units of Demand
Monthly Rent ($)
Units of Demand
1,000 or more 130 1,050 to 1,249 390 1,450 to 1,649 950 2,100 to 2,299 120
1,250 to 1,449 790 1,650 or more 110 2,300 or more 15
1,450 or more 130
Total 130 Total 1,325 Total 1,050 Total 130

All
ento
wn
-Bet
hle
hem
-Ea
sto
n,
Pen
nsy
lva
nia
-New
Jer
sey
• C
OM
PR
EH
EN
SIV
E H
OU
SIN
G M
AR
KE
T A
NA
LYS
IS12
*Allentown-Bethlehem-Easton Notes: Numbers may not add to totals because of rounding. Median Family Incomes are for 1999, 2009, and 2016. Employment data represent annual averages for 2000, 2010, and the 12 months through May 2018.Sources: U.S. Census Bureau; U.S. Department of Housing and Urban Development; estimates by analyst
Table DP-1. Allentown HMA* Data Profile, 2000 to Current
Average Annual Change (%)
2000 2010 Current 2000 to 2010 2010 to CurrentTotal resident employment 372,190 380,705 413,100 0.2 1.1
Unemployment rate 3.7% 9.2% 4.7%
Total nonfarm payroll jobs 323,400 333,900 371,200 0.3 1.4
Total population 740,395 821,173 843,400 1.0 0.3
Total households 285,808 315,712 323,300 1.0 0.3
Owner households 204,951 225,198 221,500 0.9 – 0.2
Percent owner 71.7% 71.3% 68.5%
Renter households 80,857 90,514 101,800 1.1 1.4
Percent renter 28.3% 28.7% 31.5%
Total housing units 307,269 342,200 348,100 1.1 0.2
Sales vacancy rate 1.7% 1.8% 1.0%
Rental vacancy rate 6.6% 7.6% 6.2%
Median Family Income $54,028 $70,000 $75,440 2.6 1.1
Data Profile

All
ento
wn
-Bet
hle
hem
-Ea
sto
n,
Pen
nsy
lva
nia
-New
Jer
sey
• C
OM
PR
EH
EN
SIV
E H
OU
SIN
G M
AR
KE
T A
NA
LYS
IS13
For additional reports on other market areas, please go to huduser.gov/portal/ushmc/chma_archive.html.
Data Definitions and Sources2000: 4/1/2000—U.S. Decennial Census2010: 4/1/2010—U.S. Decennial CensusCurrent date: 6/1/2018—Estimates by the analystForecast period: 6/1/2018–6/1/2021—Estimates by the analyst
The metropolitan statistical area definition noted in this report is based upon the delineations established by the Office of Management and Budget (OMB) in the OMB Bulletin dated February 28, 2013.
Demand: The demand estimates in the analysis are not a forecast of building activity. They are the estimates of the total housing production needed to achieve a balanced market at the end of the 3-year forecast period given conditions on the as-of date of the analysis, growth, losses, and excess vacancies. The estimates do not account for units currently under construction or units in the development pipeline.
Other Vacant Units: In this analysis conducted by the U.S. Department of Housing and Urban Development (HUD), other vacant units include all vacant units that are not available for sale or for rent. The term therefore includes units rented or sold but not occupied; held for seasonal, recreational, or occasional use; used by migrant workers; and the category specified as “other” vacant by the Census Bureau.
Building Permits: Building permits do not necessarily reflect all residential building activity that occurs in an HMA. Some units are constructed or created without a building permit or are issued a different type of building permit. For example, some units classified as commercial structures are not reflected in the residential building permits. As a result, the
analyst, through diligent fieldwork, makes an estimate of this additional construction activity. Some of these estimates are included in the discussions of single-family and multifamily building permits.
For additional data pertaining to the housing market for this HMA, go to huduser.gov/publications/pdf/CMARtables_Allentown-Bethlehem-EastonPA_ NJ_18.pdf.
Contact InformationMatthew Tieff, EconomistPhiladelphia HUD Regional Office215–430–[email protected]
This analysis has been prepared for the assistance and guidance of HUD in its operations. The factual information, findings, and conclusions may also be useful to builders, mortgagees, and others concerned with local housing market conditions and trends. The analysis does not purport to make determinations regarding the acceptability of any mortgage insurance proposals that may be under consideration by the Department.
The factual framework for this analysis follows the guidelines and methods developed by the Economic and Market Analysis Division within HUD. The analysis and findings are as thorough and current as possible based on information available on the as-of date from local and national sources. As such, findings or conclusions may be modified by subsequent developments. HUD expresses its appreciation to those industry sources and state and local government officials who provided data and information on local economic and housing market conditions.