Comprehensive Energy Assessment Report
24
Comprehensive Energy Assessment Report Prepared for: ABC Company 123 Anaheim Blvd. Anaheim, CA 92805 28202 Cabot Road, Suite 300 Laguna Niguel, CA 92677 TEL: 949.365.5677 [email protected]
Transcript of Comprehensive Energy Assessment Report

Comprehensive Energy Assessment Report
Prepared for: ABC Company
123 Anaheim Blvd. Anaheim, CA 92805
28202 Cabot Road, Suite 300
Laguna Niguel, CA 92677
TEL: 949.365.5677

Anaheim Public Utilities Anaheim Business Energy Efficiency Solutions
www.alliancePROJECT.com 949.365.5677
28202 Cabot Road, Suite 300, Laguna Niguel, CA 92677
INTRODUCTION
Together with the assistance of alliancePROJECT, the City of Anaheim’s sustainability initiative, Anaheim Business Energy Efficiency Solutions (ABEES) is pleased to provide you with this Comprehensive Energy Audit Report at no cost to you. Since 1894, Anaheim Public Utilities (APU) has served the City of Anaheim with low rates and reliable service. Today, Anaheim businesses continue to enjoy low electric rates while being served by one of Orange County’s top-rated electric utilities. APU ABEES, in conjunction with the alliancePROJECT team, is providing recognized engineering excellence to our APU customers and setting a standard of energy efficiency.
Your decision to participate in Anaheim Public Utilities’ ABEES program is a first step toward better control of your energy costs. We hope you make use of this study to develop a comprehensive energy plan for your facility. Concerns with operating costs and environmental issues have prompted many companies to take a second look when purchasing new equipment and implementing operating practices. Improving a building’s energy efficiency is one way to reduce the “Environmental Impact” of the total operation as well as to improve the facility’s “bottom line.” You can consider this report as a ‘Road-Map’ specific to ABC Company, leading you to a more energy-efficient facility, lower environmental impact, and lower utility costs.
UNDERSTANDING INCENTIVE PROGRAMS
APU’s ABEES provides a series of available incentives, “Business Solutions Program,” for particular energy efficiency upgrades conducted by our customers.
Who Can Benefit
Benefits are designed to fit the needs and requirements of all Anaheim Public Utilities commercial, industrial, or institutional electricity customers.
Program Advantages
Financial Savings – In addition to electric cost savings, the program provides funding to assist you in the installation or upgrade to energy-efficient HVAC equipment. Incentives are dependent upon each measure as reduced kW demand or kWh.
Customized Energy Incentives - By upgrading to energy-efficient equipment and processes, energy use will decrease, in turn decreasing electric costs. On average, customers save ten to twenty-five percent (10-25%) on their bill with energy-efficient applications.
Anaheim Public Utilities Anaheim Business Energy Efficiency Solutions
www.alliancePROJECT.com 949.365.5677
28202 Cabot Road, Suite 300, Laguna Niguel, CA 92677
YOUR COMPREHENSIVE ENERGY AUDIT REPORT (CEAR)
This CEAR is intended to provide ABC Company with an analysis of the energy-using systems at your facility, and to recommend measures to help you use energy more wisely and efficiently. The CEAR includes information needed to apply for and process incentives, as well as other benefits that are part of the aggregated “Business Solutions Program.”
The alliancePROJECT team of trained energy professionals performed a thorough on-site audit of all your energy-using equipment. The audit includes data collected from: lighting, heating, air conditioning, refrigeration (HVAC&R), and other miscellaneous electrical equipment. Our representatives gathered information on energy consumption (i.e., manufacturer specifications), hours of operation, capacities, and operating & load factors. alliancePROJECT also obtained and reviewed your facility’s utility bills from most recent twelve (12) months and conducted a rate analysis study.
alliancePROJECT used the data obtained during the on-site inspection to develop a comprehensive computer model of your facility’s energy use. From this model, we determined a “base case scenario” representing the total energy loads from all the various points of usage (lighting, cooling, etc.). The model was then benchmarked to match actual energy usage. The benchmarked energy model of the facility was used to calculate an estimate for future energy use. Analyses performed with this model allowed for specifying which strategies can be used to optimize energy efficiency, and which Energy Efficiency Measures (EEMs) were applicable for ABC Company
This report contains the results and details of the efficiency measures recommended. We included Operation & Maintenance EEMs, Short-Term EEMs, and Long-Term EEMs for each of the specified ABEES programs. Each EEM was evaluated for estimated energy operating cost savings, estimated installation cost, projected Simple Payback Period, and anticipated incentive amount. EEMs were then evaluated for other parameters that could impact the ultimate implementation of the EEM including but not limited to: future expansion capability, regulatory compliance & permitting, cost of maintenance, and incentive reimbursements, etc.
Prepared by:
alliancePROJECT
Prepared for:
ABC Company John Smith General Manager

Anaheim Public Utilities Anaheim Business Energy Efficiency Solutions
www.alliancePROJECT.com 949.365.5677
28202 Cabot Road, Suite 300, Laguna Niguel, CA 92677
ANALYSIS METHODOLOGY
Energy Efficiency Measures (EEMs) were evaluated using the California Energy Commission (CEC) methodology as described in the CEC Technical Assistance report guidelines and ASHRAE Level 2 assessment goals. CEC guidelines require that all Operation and Maintenance (O&M) items be implemented before evaluating measures requiring capital expenditure. After O&M items are implemented, measures are evaluated in the following order:
Note: When using the savings methodology approach for the replacement of any unit, the energy savings are derived by comparing the existing unit’s efficiency rating with the new unit’s efficiency rating.
Each measure was analyzed for estimated savings and estimated costs. When estimating the installed costs, prices were obtained from vendors, recent past projects, and estimating tables. As recommended in the CEC Technical Assistance report guidelines, the measure cost estimates also include: sales taxes, demolition/disposal, engineering/project management, permits, and an inflation factor. We feel that this makes the Payback estimates for these measures rather conservative.
O&M Measures
Lighting EEM’s
Building Envelope EEM’s
HW EEM’s
HVAC EEM’s
Environmental Impact

Anaheim Public Utilities Anaheim Business Energy Efficiency Solutions
www.alliancePROJECT.com 949.365.5677
28202 Cabot Road, Suite 300, Laguna Niguel, CA 92677
EXECUTIVE SUMMARY
ABC Company is located at 123 Anaheim Blvd. The total estimated area is 50,000ft2 that includes 35,000ft2 Air Conditioned area, 15,000ft2 Out Door Area. alliancePROJECT energy professionals performed a Comprehensive Energy Audit to determine energy efficiency projects to lower their energy by utilizing more energy efficient equipment. Data collected includes an inventory of all equipment, equipment nameplates, building operation schedules, equipment operating hours, and the utility bill history obtained from APU. All energy-using systems were analyzed and evaluated for energy consumption and proper operation by utilizing alliancePROJECT’s Energy Modeling Software. A list of applicable potential Energy Efficiency Measures (EEMs) was created and then evaluated for both cost effectiveness and impact on facility operations. For each EEM requiring a capital investment, a Simple Payback of capital cost divided by annual savings was calculated.
ENERGY CONSUMPTION ANALYSIS
ABC Company maximum billing demand that was determined from their electric account is 145kW from March, 2018 to February, 2019. alliancePROJECT’s Energy Modeling Software Analysis breaks down energy usage percentage by type of equipment. The monthly demand for each equipment type is shown in Table 1.
Type of Use kW DemandPercent of
Total Demand
HVAC 38.1 25.9%
Exhaust Fan 0.2 0.2%
Air Compresors 11.9 8.1%
MISC. AND PLUG LOADS 28.6 19.5%
LIGHTING 68.3 46.4%
Total 147 100%
TABLE 1: kW BREAKDOWN

Anaheim Public Utilities Anaheim Business Energy Efficiency Solutions
www.alliancePROJECT.com 949.365.5677
28202 Cabot Road, Suite 300, Laguna Niguel, CA 92677
Energy Efficiency Measures
Energy Efficiency Measure (EEM) recommendations have been broken down into three main categories.
Operation & Maintenance (O&M) EEMs can be accomplished with little or no capital expense; e.g. perform required equipment maintenance, equipment repairs, frequent tune-ups on a regular basis, and/or change operating schemes or time schedules to accurately reflect occupancy and energy requirements. Accurate and efficient O&M policies and systems will help increase the life of your equipment and produce better efficiency.
Short Term EEMs are projects that do not require a great deal of permitting, planning, or engineering design to be implemented. They have a short (5 years or less, per industry standards) Simple Payback and can easily be performed at your facility. Such projects include: lighting retrofit, replacement of older inefficient units with more energy efficient models, etc. These projects require a licensed contractor to perform installations.
Long Term EEMs are projects that require permitting, planning, design, drawings, permit submittals, construction management, and/or start-up services. They have a longer (greater than 5 years, per industry standards) Simple Payback. For Long Term EEMs, we recommend that either an outside engineering consultant or in-house engineer be retained to provide the necessary documentation to complete these detailed and involved measures.
Recommended Program Incentive Projects*
The following general APU ABEES Program incentives are recommended for ABC Company.
*Different aspects of the same project may fall under multiple EEM categories, e.g. Short Term, LongTerm, or O&M. In order to quantify capital investment requirements, Tables 2 and 2.1 categorize each specific EEM in this way. However, for ease of understanding the various energy incentive programs and projects, EEM recommendations are organized below under their specific Program titles.
LIGHTING PROJECTS INCENTIVES may include the replacement of standard Fluorescent lightingsystems, High Intensity Discharge (HID), or Incandescent lamps with new generation Fluorescent,LED, or Induction lamp technologies, etc.
CUSTOMIZED ENERGY PROJECTS INCENTIVES are implemented for replacement of several energysystems such as: older motors with new NEMA rated energy-efficiency motors, adding variablefrequency drive controls, new air compressors, envelope insulation, injection molding machines,energy management controls, or HVAC&R replacements.
Anaheim Public Utilities Anaheim Business Energy Efficiency Solutions
www.alliancePROJECT.com 949.365.5677
28202 Cabot Road, Suite 300, Laguna Niguel, CA 92677
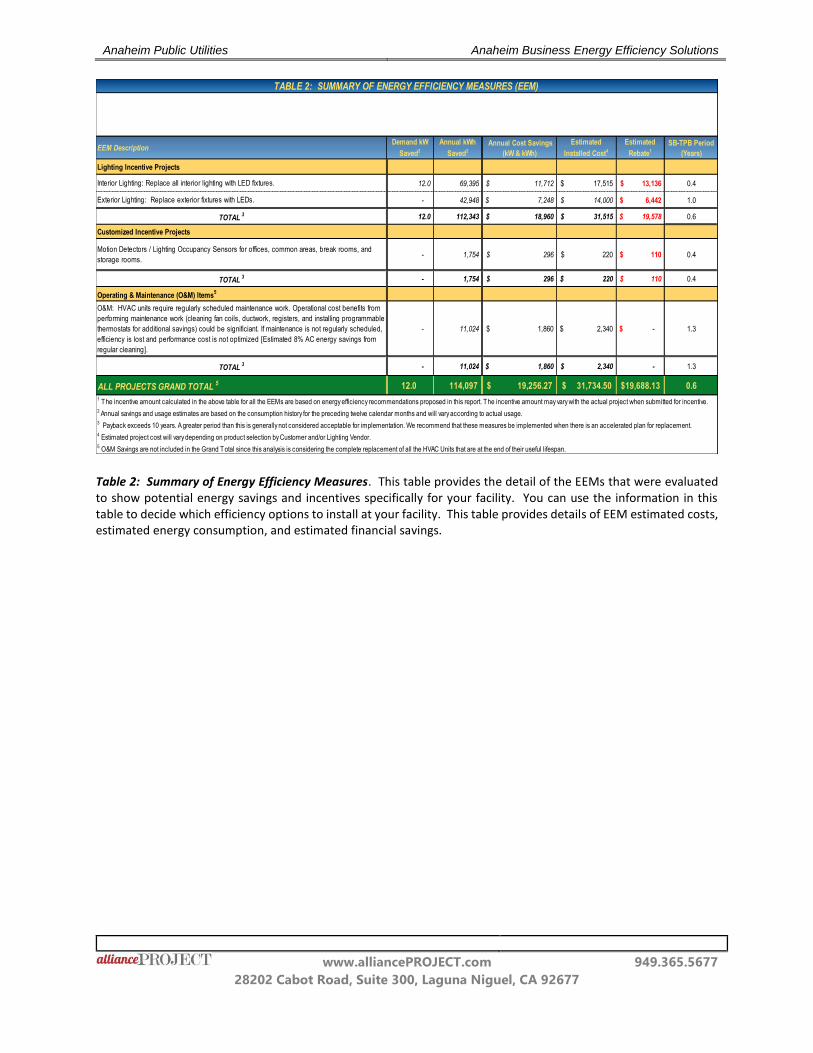
Table 2: Summary of Energy Efficiency Measures. This table provides the detail of the EEMs that were evaluated to show potential energy savings and incentives specifically for your facility. You can use the information in this table to decide which efficiency options to install at your facility. This table provides details of EEM estimated costs, estimated energy consumption, and estimated financial savings.
EEM DescriptionDemand kW
Saved2
Annual kWh
Saved2
Annual Cost Savings
(kW & kWh)
Estimated
Installed Cost4
Estimated
Rebate1
SB-TPB Period
(Years)
Lighting Incentive Projects
12.0 69,395 11,712$ 17,515$ 13,136$ 0.4
- 42,948 7,248$ 14,000$ 6,442$ 1.0
TOTAL3 12.0 112,343 18,960$ 31,515$ 19,578$ 0.6
Customized Incentive Projects
- 1,754 296$ 220$ 110$ 0.4
TOTAL3 - 1,754 296$ 220$ 110$ 0.4
Operating & Maintenance (O&M) Items5
- 11,024 1,860$ 2,340$ -$ 1.3
TOTAL3 - 11,024 1,860$ 2,340$ - 1.3
ALL PROJECTS GRAND TOTAL5 12.0 114,097 19,256.27$ 31,734.50$ 19,688.13$ 0.6
Motion Detectors / Lighting Occupancy Sensors for offices, common areas, break rooms, and
storage rooms.
Interior Lighting: Replace all interior lighting with LED fixtures.
Exterior Lighting: Replace exterior fixtures with LEDs.
O&M: HVAC units require regularly scheduled maintenance work. Operational cost benefits from
performing maintenance work (cleaning fan coils, ductwork, registers, and installing programmable
thermostats for additional savings) could be significiant. If maintenance is not regularly scheduled,
efficiency is lost and performance cost is not optimized [Estimated 8% AC energy savings from
regular cleaning].
5 O&M Savings are not included in the Grand Total since this analysis is considering the complete replacement of all the HVAC Units that are at the end of their useful lifespan.
4 Estimated project cost will vary depending on product selection by Customer and/or Lighting Vendor.
TABLE 2: SUMMARY OF ENERGY EFFICIENCY MEASURES (EEM)
3 Payback exceeds 10 years. A greater period than this is generally not considered acceptable for implementation. We recommend that these measures be implemented when there is an accelerated plan for replacement.
1 The incentive amount calculated in the above table for all the EEMs are based on energy efficiency recommendations proposed in this report. The incentive amount may vary with the actual project when submitted for incentive. 2 Annual savings and usage estimates are based on the consumption history for the preceding twelve calendar months and will vary according to actual usage.

Anaheim Public Utilities Anaheim Business Energy Efficiency Solutions
www.alliancePROJECT.com 949.365.5677
28202 Cabot Road, Suite 300, Laguna Niguel, CA 92677
Table 3: Summary of Electric Use, Costs, and Savings. This table summarizes your present electric uses and costs, a summary of EEM savings, and indices for energy use and cooling. O&M Savings are not included in the Total Energy and Cost Savings since this analysis is considering the complete replacement of all the HVAC Units that are at the end of their useful lifespan.
Average Electric Demand 120 kW
Peak Electric Demand 147 kW
Total Annual Electric Consumption 485,120 kWh
Total Annual Electric Cost $81,854
Average Utility Rate $0.1688
Estimated Facility Total Area 233,192 SF
Estimated Facility Conditioned Area 16,798 SF
Electric Energy Cost Index - Air Conditioned Space and Production Area $0.35 $/SF
Total Energy Saved from EEM's 114,097 kWh
Percentage Annual Energy kWh Saved 24%
Monthly Demand Saved from EEM's 12.0 kW
Percentage Monthly Demand kW Saved 10%
Total Annual Energy Costs Saved from EEM's $19,256.27
Percentage Annual Energy Costs Saved 24%
Daily Cost Savings from EEM's $52.76
Total Installed Cooling Capacity 58.5 Ton
ASHRAE Cooling Index 287 SF/Ton
Lighting Use Index Before Retrofit 0.29 W/SF
Lighting Use Index After Retrofit 0.19 W/SF
Power Use Index 0.52 W/SF
Legend: kW: Kilowatt kWh: Kilowatt Hour SF: Square Foot
ENERGY SAVINGS SUMMARY
COST SAVINGS SUMMARY
COMFORT & POWER USE INDEX
ELECTRICAL COST INDEX
TABLE 3: SUMMARY TABLE OF ELECTRIC USE, COSTS, AND SAVINGS
ELECTRICAL BILL SUMMARY

Anaheim Public Utilities Anaheim Business Energy Efficiency Solutions
www.alliancePROJECT.com 949.365.5677
28202 Cabot Road, Suite 300, Laguna Niguel, CA 92677
ANALYSIS OF EXISTING EQUIPMENT INVENTORY
The offices and sales area are heated and cooled by rooftop package Electric/Electric Heat Pump (HP) units. The HP units are controlled via a programmable room thermostat located within conditioned space.
ROOFTOP HP UNIT
7 DAYS PROGRAMABLE T-STAT
With existing equipment and operating conditions, the energy cost for the building is estimated to be $0.35/ft2. After all recommendations for HVAC and LED lighting upgrades are implemented, new estimated average energy cost can be reduced to $0.30/ft2.
HVAC Industry-recognized guidelines and standards in estimating Normal Life, Repair/Overhaul, and General Maintenance of equipment as published and regulated by American Society of Heating, Refrigeration and Air Conditioning Engineers (ASHRAE) and California Energy Commission (CEC) are listed below in Table 3.
Anaheim Public Utilities Anaheim Business Energy Efficiency Solutions
www.alliancePROJECT.com 949.365.5677
28202 Cabot Road, Suite 300, Laguna Niguel, CA 92677
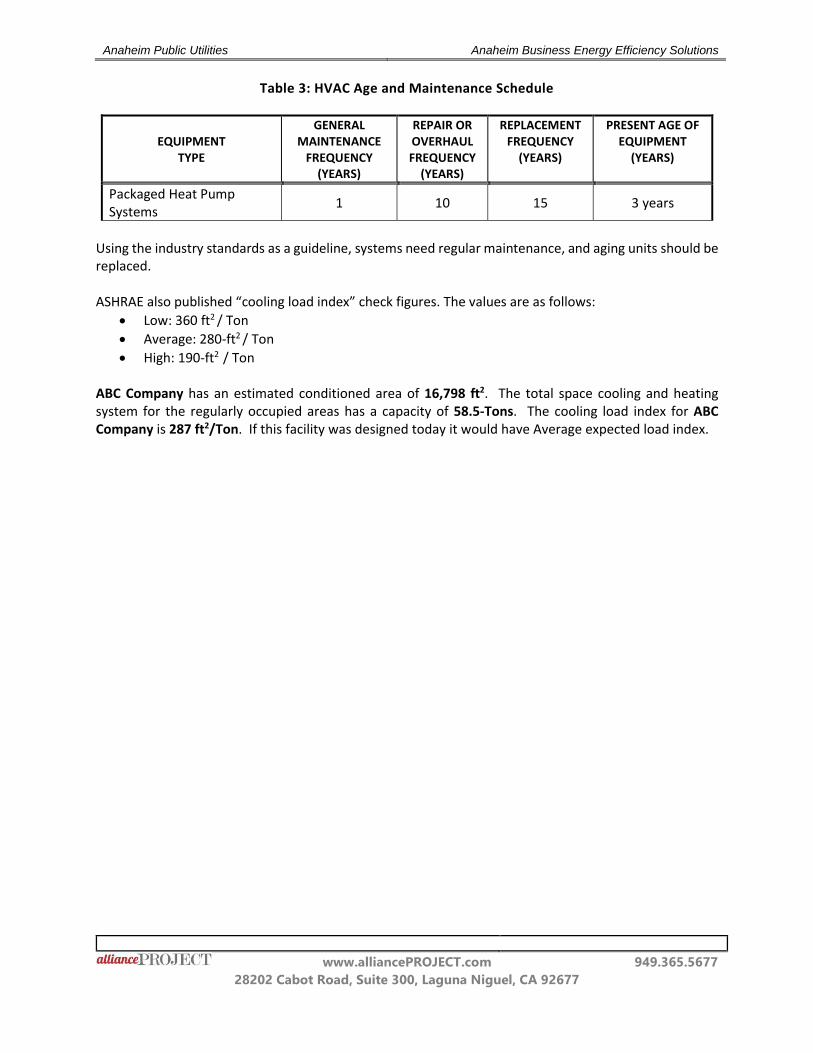
Table 3: HVAC Age and Maintenance Schedule
EQUIPMENT TYPE
GENERAL MAINTENANCE
FREQUENCY (YEARS)
REPAIR OR OVERHAUL FREQUENCY
(YEARS)
REPLACEMENT FREQUENCY
(YEARS)
PRESENT AGE OF EQUIPMENT
(YEARS)
Packaged Heat Pump Systems
1 10 15 3 years
Using the industry standards as a guideline, systems need regular maintenance, and aging units should be replaced.
ASHRAE also published “cooling load index” check figures. The values are as follows:
Low: 360 ft2 / Ton
Average: 280-ft2 / Ton
High: 190-ft2 / Ton
ABC Company has an estimated conditioned area of 16,798 ft2. The total space cooling and heating system for the regularly occupied areas has a capacity of 58.5-Tons. The cooling load index for ABC Company is 287 ft2/Ton. If this facility was designed today it would have Average expected load index.

Anaheim Public Utilities Anaheim Business Energy Efficiency Solutions
www.alliancePROJECT.com 949.365.5677
28202 Cabot Road, Suite 300, Laguna Niguel, CA 92677
OPERATIONS & MAINTENANCE EEM RECOMMENDATIONS
The following O&M recommendations can immediately be implemented at your facility to: 1) reduce cost and energy, 2) increase equipment life, and 3) reduce energy demand without any major capital investment.
RECOMMEND
For all HVAC units, clean evaporative and condensing coils. Replace air filters every three months which results in better air flow and increases efficiency, and schedule for replacing old units. Estimated energy savings is between 3% - 8% for most HVAC systems.
RECOMMEND
Verify refrigerant levels in your air conditioning system. Low refrigerant levels negatively impact energy efficiency and cooling capacity. For example, a system with an 85% charge has 25% less efficiency than a properly charged system.
RECOMMEND
Verify the programmed schedule and temperature set-points regularly to maintain acceptable occupancy comfort. It is recommended to start cooling when it reaches a maximum temperature of 74°F and start heating when it drops to a minimum temperature of 68°F.
LIGHTING EEM RECOMMENDATIONS
Lighting Retrofit
This audit combines an aggressive approach for de-lamping in some areas, with a more conservative “1-for-1” replacement approach in other areas. A 1-for-1 lamp replacement is recommended in areas where lighting illumination levels are critical, such as labs, test areas, design/drafting rooms, etc. However, it is always recommended that an illumination calculation is made prior to actual retrofitting to ensure that the required illumination foot-candles is not compromised beyond acceptable Illumination Engineering Society (IES) and Code levels.
Studies have shown that more efficient lighting also results in decreased replacement costs due to longer lamp and ballast lifespans, reduction in heat gain (which results in lower area cooling demand), and overall improvements to occupant comfort and productivity.
Every effort was made to accurately obtain a lighting fixture count to be used for analysis in this report. However, the worksheets are intended to be an estimation of lighting energy use, and not a fixture-by-fixture inventory.
RECOMMEND
Replace all interior and exterior non-LED lighting with new LED fixtures or bulbs.

Anaheim Public Utilities Anaheim Business Energy Efficiency Solutions
www.alliancePROJECT.com 949.365.5677
28202 Cabot Road, Suite 300, Laguna Niguel, CA 92677
CUSTOMIZED EEM RECOMMENDATIONS
Motion Detectors
Motion detectors, or occupancy sensors, provide efficient lighting control and save energy costs by turning off lights remain in unoccupied spaces. A conservative average savings estimate was calculated at a rate of 35% after installation of these units. (It is noted in the lighting worksheet where some areas have an existing “E” or “x” if a motion sensor is recommended.)
RECOMMEND
Install motion detector, or occupancy sensors, for lighting control in offices, common areas, closets, storage areas, restrooms and conference areas. For open areas it is recommended installing ceiling motions sensor.
Note: Lighting contractors will identify the number of units needed to provide greatest energy savings.
NEXT STEPS
RECOMMEND
Consult with a bonded, licensed mechanical contractor to perform HVAC maintenance and upgrades in accordance with the enclosed recommendations contained herein.
RECOMMEND
Consult with a bonded, licensed lighting contractor to perform lighting retrofits and upgrades in accordance with the enclosed recommendations contained herein, including occupancy and dimming sensor control system.
Apply for all available APU ABEES incentives for the measures described above (see Application details and contact information in the Appendix).

Anaheim Public Utilities Anaheim Business Energy Efficiency Solutions
www.alliancePROJECT.com 949.365.5677
28202 Cabot Road, Suite 300, Laguna Niguel, CA 92677
Comprehensive Energy Audit Report Data and Analysis
ABC Company 123 Anaheim Blvd. Anaheim, CA 92805
Anaheim Business Energy Efficiency Solutions Email: [email protected]

Anaheim Public Utilities Anaheim Business Energy Efficiency Solutions
www.alliancePROJECT.com 949.365.5677
28202 Cabot Road, Suite 300, Laguna Niguel, CA 92677
HISTORICAL ENERGY USE
Comparative Energy Use and Electrical Energy Desegregation
alliancePROJECT’s Energy Modeling Software was used to analyze the energy consumption of ABC Company. The following figures illustrate the comparative energy use and the energy desegregation of those systems.
FIGURE 1: BREAKDOWN OF ELECTRIC DEMAND (KW) BY TYPE-OF-USE
FIGURE 2: BREAKDOWN OF ELECTRIC CONSUMPTION (KWH) BY TYPE-OF-USE
HVAC - 25.9%
Exhaust Fan - 0.2%
Air Compresors - 8.1%
MISC. AND PLUG LOADS - 19.5%
LIGHTING - 46.4%
HVAC - 28.4%
Exhaust Fan - 0.3%
Air Compresors - 3.6%
MISC. AND PLUG LOADS - 9.7%
LIGHTING - 58.0%
Anaheim Public Utilities Anaheim Business Energy Efficiency Solutions
www.alliancePROJECT.com 949.365.5677
28202 Cabot Road, Suite 300, Laguna Niguel, CA 92677
ELECTRICAL CONSUMPTION ANALYSIS
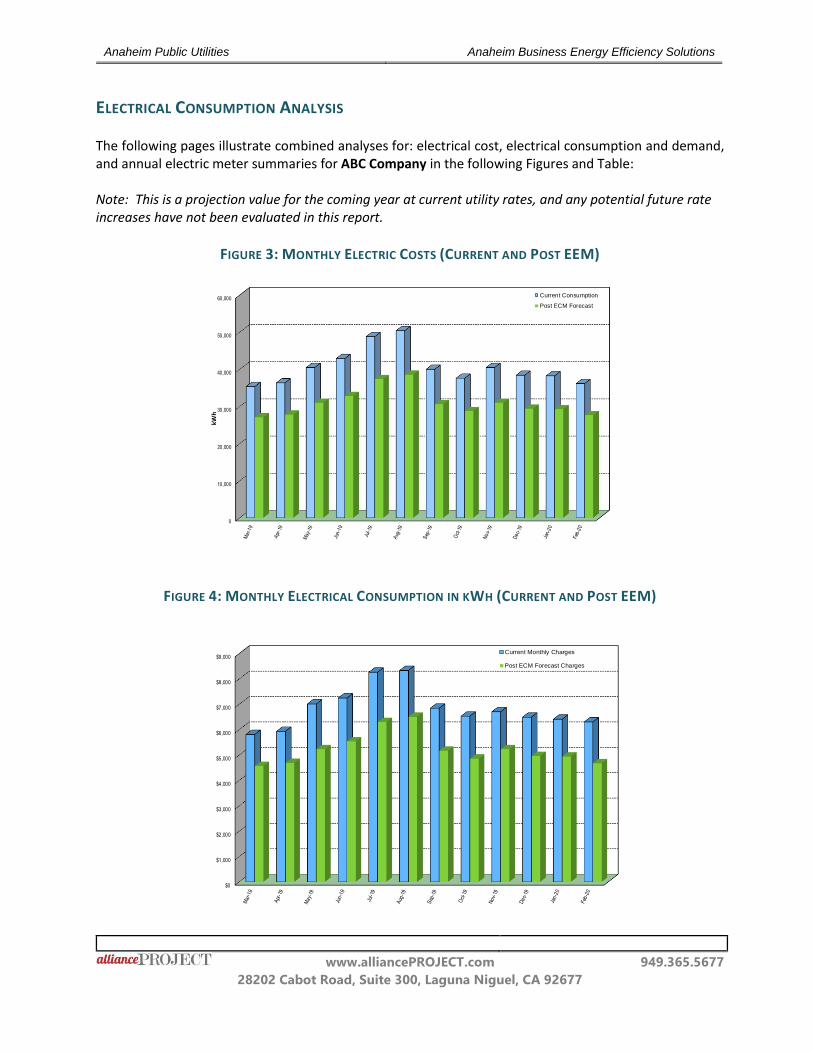
The following pages illustrate combined analyses for: electrical cost, electrical consumption and demand, and annual electric meter summaries for ABC Company in the following Figures and Table:
Note: This is a projection value for the coming year at current utility rates, and any potential future rate increases have not been evaluated in this report.
FIGURE 3: MONTHLY ELECTRIC COSTS (CURRENT AND POST EEM)
FIGURE 4: MONTHLY ELECTRICAL CONSUMPTION IN KWH (CURRENT AND POST EEM)
0
10,000
20,000
30,000
40,000
50,000
60,000Current Consumption
Post ECM Forecast
kWh
$0
$1,000
$2,000
$3,000
$4,000
$5,000
$6,000
$7,000
$8,000
$9,000Current Monthly Charges
Post ECM Forecast Charges

Anaheim Public Utilities Anaheim Business Energy Efficiency Solutions
www.alliancePROJECT.com 949.365.5677
28202 Cabot Road, Suite 300, Laguna Niguel, CA 92677
FIGURE 5: MONTHLY ELECTRICAL DEMAND IN KW (CURRENT)
0.0
20.0
40.0
60.0
80.0
100.0
120.0
140.0
160.0
kW

Anaheim Public Utilities Anaheim Business Energy Efficiency Solutions
www.alliancePROJECT.com 949.365.5677
28202 Cabot Road, Suite 300, Laguna Niguel, CA 92677
Month kWh Usage Demand
kW
Min
Excess
kW
Min
kWh
Cust.
Charge
Total kW
Charge
Total kWh
Charge
State
Surcharge PCA EMA
U.G.
Surchrge
Total
Billed
Avg Cost Per
kWh
Mar-18 35,360 92.8 15 77.8 35,360 $46.97 $1,080.81 $4,292.70 $10.25 $0.00 $159.12 $216.82 $5,806.67 $0.164
Apr-18 36,320 92.8 15 77.8 36,320 $46.97 $1,080.81 $4,409.25 $10.53 $0.00 $163.44 $221.48 $5,932.48 $0.163
May-18 40,480 134.4 15 119.4 40,480 $46.97 $1,591.24 $4,914.27 $11.74 $0.00 $182.16 $262.10 $7,008.48 $0.173
Jun-18 42,880 128.0 15 113.0 42,880 $46.97 $1,512.71 $5,205.63 $12.44 $0.00 $192.96 $270.61 $7,241.32 $0.169
Jul-18 48,800 147.2 15 132.2 48,800 $46.97 $1,748.29 $5,924.32 $14.15 $0.00 $219.60 $308.78 $8,262.12 $0.169
Aug-18 50,400 136.0 15 121.0 50,400 $46.97 $1,610.87 $6,118.56 $14.62 $0.00 $226.80 $311.06 $8,328.87 $0.165
Sep-18 40,000 126.4 15 111.4 40,000 $46.97 $1,493.08 $4,856.00 $11.60 $0.00 $180.00 $255.84 $6,843.49 $0.171
Oct-18 37,600 126.4 15 111.4 37,600 $46.97 $1,493.08 $4,564.64 $10.90 $0.00 $169.20 $244.19 $6,528.98 $0.174
Nov-18 40,480 110.4 15 95.4 40,480 $46.97 $1,296.76 $4,914.27 $11.74 $0.00 $182.16 $250.32 $6,702.22 $0.166
Dec-18 38,400 115.2 15 100.2 38,400 $46.97 $1,355.65 $4,661.76 $11.14 $0.00 $172.80 $242.58 $6,490.90 $0.169
Jan-19 38,240 110.4 15 95.4 38,240 $46.97 $1,296.76 $4,642.34 $11.09 $0.00 $172.08 $239.44 $6,408.68 $0.168
Feb-19 36,160 123.2 15 108.2 36,160 $46.97 $1,453.81 $4,389.82 $10.49 $0.00 $162.72 $235.62 $6,299.44 $0.174
Max / Total / Avg 485,120 147.2 $81,853.64 $0.169
UTILITY BILL SUMMARY WORKSHEET
Anaheim Public Utilities

Anaheim Public Utilities Anaheim Business Energy Efficiency Solutions
www.alliancePROJECT.com 949.365.5677
28202 Cabot Road, Suite 300, Laguna Niguel, CA 92677
Anaheim Public Utilities
HOURS DAYS WEEKS
Annual Hours 5,840 16.0 7 52
Annual Hours - 52
Annual Hours -
Operating
Schedule Notes
Power Input
(kW)
Facility
Age (Years) HP Ton Quantity Total Tons
Location: ROOFTOP
PACKAGED ELECTRIC/ELECTRIC HP UNITS
Carreier / M# 50VRA48 3 -- 4.0 3 12 11.9
Carreier / M# 50VRA36 3 -- 3.0 1 3 3.1
Day & Night / M# PHD46000 2 -- 5.0 2 10 10.7
Carreier / M# 50HCQ006 3 -- 5.0 5 25 20.7
Carreier / M# 50HCQ008 3 -- 7.5 1 7.5 7.8
SPLIT HEAT PUMP UNITS
Hujitsu / M# AOU12 3 -- 1.0 1 1 1.0
58.5
Facility
LOCATION: ROOF HP Ton Quantity kW
EF 0.17 -- 2 -- 0.2
-- 1 -- 0.0
Facility
LOCATION: GROUND HP Ton Quantity kW
Led & Lag 30.00 -- 2 22.4 22.4
Facility Convenience Receptacles Applied Load factor
Facility 208,234 SF 0.25 W/SF 52.1
Total 208,234 SF
See attached lighting worksheet 68.3
147.2 Percentage of Billing kW vs. Connected load kW: 74% 198.1
LIGHTING
Billing Demand kW:
12.112.5
SEER/EERSEER/EER
SEER/EER
Exhaust Fan
--
--
--
Current EfficiencyEfficiency when new
HVAC
Total Installed Tons
11.5
11.612
11.2
14.5
11.6
15
12
Table 4: Existing Equipment Inventory
Systems Equipment Description
TYPE
Facility
OPERATING SCHEDULE
SEER/EER
MISC. AND PLUG LOADS
Current Efficiency
12 11.6
Air Compresors

Anaheim Public Utilities Anaheim Business Energy Efficiency Solutions
www.alliancePROJECT.com 949.365.5677
28202 Cabot Road, Suite 300, Laguna Niguel, CA 92677
UTILITY RATE SCHEDULE(S)
Electric Service Information
There is one (1) main electric account that meters all of the electricity usage.
Rate Schedule GS-1- (14/19) “Small Commercial less than 200 kW Demand.” This rate is applicable to single or three-phase electric service for customers whose demand is less than 200 kW for four consecutive months. Charges are accrued in three ways for each month. 1) A demand charge for maximum billing kW for any 15-minute period is charged, 2) An energy charge for each kWh consumed during each period is charged, and 3) A customer charge for each installed meter is charged.
The following table contains the rate schedule summary worksheets for the electric rates present at this facility.
Time of Year Rate Schedule Monthly Customer Charge per Meter
$126.20 Flat for 1st 15 kW of Bill. Demand
$12.27 All excess kW of Demand $0.000 per kWh, Power Cost Adjustment
NOTES: 1) As of 1-1-01, City is no longer charging 2.85% Public Benefits Charge as a separate surcharge.
2) As of 9-1-15, Environmental Mitigation Adjustment charge is $0.00450
3) As of 3-12, add $0.00029 per kWh for California State Tax. $0.00029
4) Add 4.0% of Energy Cost for Anaheim Underground Surcharge.
5) Rates and charges are effective as of 9-1-15.
Table 5: Utility Rate Summary Sheet
Monthly Demand Charge Monthly Energy Charge ($ / kWh)
All Year
GS-1 (14/19)
Three Phase
Demand Under 200kW
$0.1214
$46.97
GS-1 (14/19) Rate

Anaheim Public Utilities Anaheim Business Energy Efficiency Solutions
www.alliancePROJECT.com 949.365.5677
28202 Cabot Road, Suite 300, Laguna Niguel, CA 92677
DESCRIPTIONS OF ENERGY EFFICIENCY MEASURES
OPERATIONS & MAINTENANCE (O&M)
RECOMMEND
For all HVAC units that are not replaced, it is highly recommended to clean evaporative and condensing coils, and maintain full refrigerant levels. Clean/repair ductwork systems and replace air filters every three months, as it results in approximately 8% minimum-gain efficiency. If the operation and maintenance measures are not regularly implemented, the performance of the HVAC ductwork system and other equipment will degrade with time due to deposit build-up and overall lower energy efficiency of the system.
LIGHTING
RECOMMEND
Upgrade existing lighting in accordance with Table 6: Lighting Audit worksheet.
Luminance
All foot-candles from any fixture installed must meet Uniform Building Code and/or National Electrical Code requirements in accordance with IES Lighting Handbook 2011 Application Volume. Retrofit of any critical area such as operating rooms, emergency, examination rooms, labs, drafting areas, machinery production areas, etc. that involve installation of reflectors (excludes 1-for-1 bulb replacements) should have attached accompanying calculations signed by a Registered Electrical Engineer showing room retrofitted illumination meets IES Code if required by Plan Check. If illumination prior to installation of retrofit does not meet code, additional light sources must be added until the space complies with IES Code.
Light-Emitting Diode
Light-emitting diode (LED) is a semiconductor light source. LEDs are used as indicator lamps in many devices and are increasingly used for general lighting. Appearing as practical electronic components in 1962, early LEDs emitted low-intensity red light, but modern versions are available across the visible, ultraviolet, and infrared wavelengths, with very high brightness.
When a light-emitting diode is switched on, electrons are able to recombine with holes within the device, releasing energy in the form of photons. This effect is called electroluminescence, and the color of the light (corresponding to the energy of the photon) is determined by the energy band gap of the semiconductor. An LED is often small in area (less than 1mm2), and integrated optical components may be used to shape its radiation pattern. LEDs have many advantages over incandescent light sources including lower energy consumption, longer lifetime, improved physical robustness, smaller size, and faster switching. However, LEDs powerful enough for room lighting are relatively expensive, and require more precise current and heat management than compact fluorescent lamp sources of comparable output.

Anaheim Public Utilities Anaheim Business Energy Efficiency Solutions
www.alliancePROJECT.com 949.365.5677
28202 Cabot Road, Suite 300, Laguna Niguel, CA 92677
Anaheim Public Utilities
E Existing Motion Detector, Photo Cell, Daylighting or Comination Control
X New Motion Detector, Photo Cell, Daylighting or ComBination Control
NA Not Applicable
Eligible Occ
SnsrFixture Type
Watts /
Fixture
Fixture
Quantity
Lamps /
Fixture
Total Lamp
Quantity
Hours /
Day
Days /
Week
Hours /
Year kW kWh Lighting Type1 Watts /
Fixture
Fixture
Quantity kW kWh kW kWh
Parts 2'x2'x2U-F17 59 7 2 14 16.0 7 5,840 0.4 2,412 LED Panel 30 7 0.2 1,226 0.2 1,185
Parts 2'x4'x3L-T8 89 11 3 33 16.0 7 5,840 1.0 5,717 LED Tubes 33 11 0.4 2,120 0.6 3,597
Parts 1'x8'x2L-4'-T8 118 49 4 196 16.0 7 5,840 5.8 33,765 LED Tubes 44 98 4.3 25,181 1.5 8,584
Parts 1'x4'x2L-T8 59 3 2 6 16.0 7 5,840 0.2 1,034 LED Tubes 22 6 0.1 771 0.0 263
Restroom 20W CFL 20 1 1 1 16.0 7 5,840 0.0 117 LED 13 1 0.0 76 0.0 41
2nd Floor Filling Room E 1'x8'x2L-4'-T8 118 1 4 4 16.0 7 5,840 0.1 448 LED Tubes 44 1 0.0 167 0.1 281
2nd Floor Lunch Room E 2'x2'x2U-F17 59 6 2 12 16.0 7 5,840 0.4 1,344 LED Panel 30 6 0.2 683 0.2 660
2nd Floor Confrence Room E 2'x2'-LED 30 9 1 9 16.0 7 5,840 0.3 1,025 No Change 30 9 0.3 1,025 0.0 0
Stairs 2'x2'-LED 30 2 1 2 16.0 7 5,840 0.1 350 No Change 30 2 0.1 350 0.0 0
Sales Offices X 2'x4'x3L-T8 89 6 3 18 16.0 7 5,840 0.5 3,118 LED Tubes 33 6 0.2 1,156 0.3 1,962
Filling E 1'x4'x2'-T8 59 2 2 4 16.0 7 5,840 0.1 448 LED Tubes 22 2 0.0 167 0.1 281
Hallway 2'x2'x2U-F17 59 1 2 2 16.0 7 5,840 0.1 345 LED Panel 30 1 0.0 175 0.0 169
Sales Offices X 2'x2'x2U-F17 59 22 2 44 16.0 7 5,840 1.3 7,580 LED Panel 30 22 0.7 3,854 0.6 3,726
Sales Floor E 2'x2'-LED 30 47 1 47 16.0 7 5,840 1.4 5,352 No Change 30 47 1.4 5,352 0.0 0
Sales Floor LED Cans 18 12 1 12 16.0 7 5,840 0.2 1,261 No Change 18 12 0.2 1,261 0.0 0
Sales Floor LED Par 9 3 1 3 16.0 7 5,840 0.0 158 No Change 9 3 0.0 158 0.0 0
Service Waiting Area LED Cans 18 51 1 51 16.0 7 5,840 0.9 5,361 No Change 18 51 0.9 5,361 0.0 0
Restrooms LED Cans 18 14 1 14 16.0 7 5,840 0.3 1,472 No Change 18 14 0.3 1,472 0.0 0
Offices E 2'x2'-LED 30 47 1 47 16.0 7 5,840 1.4 5,352 No Change 30 47 1.4 5,352 0.0 0
Service Bays 400W MH 458 19 1 19 16.0 7 5,840 8.7 50,817 LED Hi Bay 100 19 1.9 11,095 6.8 39,722
Tire Room 1'x8'x2L-4'-T8 118 6 4 24 16.0 7 5,840 0.7 4,134 LED Tubes 44 6 0.3 1,542 0.4 2,593
Service Bays 1'x8'x2-T-12 138 2 2 4 16.0 7 5,840 0.3 1,612 LED 40 2 0.1 467 0.2 1,145
Locker 2'x4'x4L-T8 118 12 4 48 16.0 7 5,840 1.4 8,269 LED Tubes 44 12 0.5 3,083 0.9 5,186
333 614 26 141,490 385 13.5 72,095 12 69,395Total Interior Lighting
Table 6: Existing Lighting Inventory
Existing Fixture New Fixture Savings
INTERIOR LIGHTING
Anaheim Public Utilities Anaheim Business Energy Efficiency Solutions
www.alliancePROJECT.com 949.365.5677
28202 Cabot Road, Suite 300, Laguna Niguel, CA 92677
Eligible Occ
SnsrFixture Type
Watts /
Fixture
Fixture
Quantity
Lamps /
Fixture
Total Lamp
Quantity
Hours /
Day
Days /
Week
Hours /
Year kW kWh Lighting Type1 Watts /
Fixture
Fixture
Quantity kW kWh kW kWh
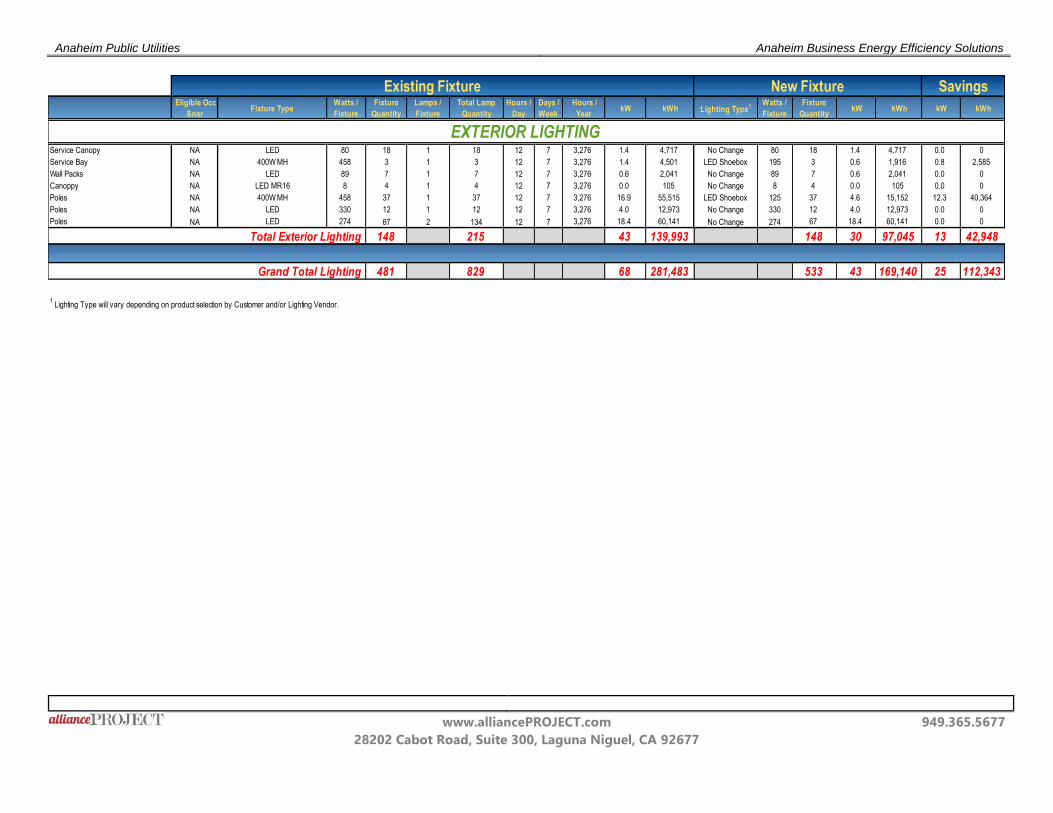
Service Canopy NA LED 80 18 1 18 12 7 3,276 1.4 4,717 No Change 80 18 1.4 4,717 0.0 0
Service Bay NA 400W MH 458 3 1 3 12 7 3,276 1.4 4,501 LED Shoebox 195 3 0.6 1,916 0.8 2,585
Wall Packs NA LED 89 7 1 7 12 7 3,276 0.6 2,041 No Change 89 7 0.6 2,041 0.0 0
Canoppy NA LED MR16 8 4 1 4 12 7 3,276 0.0 105 No Change 8 4 0.0 105 0.0 0
Poles NA 400W MH 458 37 1 37 12 7 3,276 16.9 55,515 LED Shoebox 125 37 4.6 15,152 12.3 40,364
Poles NA LED 330 12 1 12 12 7 3,276 4.0 12,973 No Change 330 12 4.0 12,973 0.0 0
Poles NA LED 274 67 2 134 12 7 3,276 18.4 60,141 No Change 274 67 18.4 60,141 0.0 0
148 215 43 139,993 148 30 97,045 13 42,948
481 829 68 281,483 533 43 169,140 25 112,343
1 Lighting Type will vary depending on product selection by Customer and/or Lighting Vendor.
Total Exterior Lighting
Grand Total Lighting
Existing Fixture New Fixture Savings
EXTERIOR LIGHTING

Anaheim Public Utilities Anaheim Business Energy Efficiency Solutions
www.alliancePROJECT.com 949.365.5677
28202 Cabot Road, Suite 300, Laguna Niguel, CA 92677
LIGHTING OCCUPANCY SENSORS
The most effective method of electricity reduction is to TURN OFF THE LIGHTS!!! Occupancy Sensors or Motion Detectors provide the ability to turn off unneeded lights. These devices use an infrared light beam to sense motion within a specified range and this will complete a relay circuit that turns on the lights. After a period of no movement in the area, the sensor breaks the circuit, thus turning off the lights.
Motion detectors are best suited to rest-rooms, offices, storage rooms, classrooms, and janitor areas. They are not generally suited for nurse’s stations, exam rooms, corridors, and surgeries. Sensing range is up to 60 feet with coverage of approximately 180°. Indoor and outdoor types are available. Note that the kWh savings must be compared not to the original base electric usage, but to the new, lower wattage, retrofitted light fixtures. As the retrofitted light fixtures use significantly less kW per fixture, motion detectors will have a reduced return on investment versus being used on non-retrofitted fixtures.
Recommendation(s)
1. Use motion detectors that are adjustable. Set the “No Motion” setting to five minutes and the“Stay On” setting to 10 minutes. If the “Stay On” setting is too short, the higher current draw ofthe energy efficient electronic ballasts will offset any savings.
Below is a simple savings calculation for a sample fixture:
Before Retrofit: 4 lamp 4 Foot F32 T8 Electric Fixture 110W x 500 hrs/yr saved by motion detector x 10-3 kW/W (conversion factor) = 55 kWh saved
After Retrofit: LED Fixture 50W x 500 hrs/yr saved by motion detector x 10-3 kW/W (conversion factor) = 25 kWh saved
Base kWh Usage
Fixture Retrofit kWh Reduction [Revised Baseline kWh]
Motion Detectors kWh Reduction
Final kWh Total

Anaheim Public Utilities Anaheim Business Energy Efficiency Solutions
www.alliancePROJECT.com 949.365.5677
28202 Cabot Road, Suite 300, Laguna Niguel, CA 92677
QUALIFICATION
The conclusions and recommendations presented in this report are based on the results of the on-site inspection and initial energy audit that was performed at the subject property as well as the review of any drawings, equipment data, and/or utility bills provided. The results of the site investigation are necessarily limited to this specific location and are valid only for the specific time and conditions at which the inspection was performed.
In all cases, a standard of professional care used by comparable consultants performing similar tasks in similar localities was exercised in obtaining, reviewing, interpreting, and verifying all available information. Savings estimates were made as accurately as possible. However, as these figures depend on actual use and information given to us by the facility personnel during the site visit(s), and may vary considerably from month-to-month, the actual savings you receive could be different. The costs shown for installation are based on estimates using current unit costs for labor, equipment, and taxes.
Although every effort has been made to ensure accuracy, exact conditions will vary and you must obtain firm quotes before implementing these measures. The Simple Payback is defined as the capital cost divided by the annual savings. Simple Paybacks have been calculated before taxes for each measure requiring a capital investment. Since the annual savings and capital costs can vary, these Simple Paybacks can also vary.
DISCLAIMER
Neither the Anaheim Public Utilities nor any person or sub-consultant, such as alliancePROJECT, acting on its behalf: (a) makes any warranty or representation, expressed or implied, with respect to accuracy, completeness, or usefulness of the information contained in this report, or that the use of any information, method or process disclosed in this report may not infringe privately owned rights; or (b) assumes any liabilities with respect to use of, or for damage resulting from the use of, any information, method, or process disclosed in this report