Annual Comprehensive Economic Development Strategy (CEDS ...

Comprehensive Economic Development Strategy 2016
North Central Texas Council of Governments Page 1
NORTH CENTRAL TEXAS COUNCIL OF GOVERNMENTS Serving the NCTCOG Region Counties of Collin, Dallas, Denton, Ellis, Erath, Hood, Hunt, Johnson,
Kaufman, Navarro, Palo Pinto, Parker, Rockwall, Somervell, Tarrant and Wise.
COMPREHENSIVE ECONOMIC
DEVELOPMENT STRATEGY FOR THE
NORTH CENTRAL TEXAS REGION
APPROVED BY ECONOMIC DEVELOPMENT ADMINISTRATION
MARCH 15, 2016
PREPARED BY:
NCTCOG CEDS Working Group Key Writer: Bill King, Director of Economic Development, City of Corsicana & Navarro County

Comprehensive Economic Development Strategy 2016
North Central Texas Council of Governments Page 2
NORTH CENTRAL TEXAS COUNCIL OF GOVERNMENTS
2015-2016 EXECUTIVE BOARD
President John Horn, County Judge Hunt County Vice President Lissa Smith, Mayor Pro-Tem City of Plano Secretary-Treasurer Tom Lombard, Council member City of North Richland Hills Past President Kathryn Wilemon, Mayor Pro Tem City of Arlington Board Member Bruce Archer, Council member City of Mesquite J.D. Clark, County Judge Wise County Michael Glaspie, Council member City of Arlington Kelly Allen Gray, Council member City of Fort Worth Clay Jenkins, County Judge Dallas County Dan McClendon, Mayor Pro Tem City of Burleson Bobbie Mitchell, Commissioner Denton County Keith Self, County Judge Collin County Kevin Strength, Mayor City of Waxahachie Chris Watts, Mayor City of Denton Laura Wheat, Mayor Town of Westlake B. Glen Whitley, County Judge Tarrant County Lee Kleinman, Council member City of Dallas Ex-Officio Jeff Leach, State Representative Texas House District 67
STAFF
Executive Director Michael Eastland NCTCOG Lucille Johnson, CEDS Project Director NCTCOG Stephanie Cecil, Senior Admin. Assistant NCTCOG Janet Smith, Receptionist & Researcher NCTCOG
The Comprehensive Economic Development Strategy (CEDS) was adopted by the North Central Texas Council of Governments board on February 25, 2016.

Comprehensive Economic Development Strategy 2016
North Central Texas Council of Governments Page 3
TABLE OF CONTENTS 1. Executive Summary & Introduction Page 4
2. Area Overview & Background Page 7
a. Demographic and Socioeconomic Data Page 7 b. Environmental, Geographic, Climate, Cultural and Natural Resources Profile Page 12 c. Infrastructure Assets Page 16 d. Industry Sectors & Clusters Page 18 e. Educational Institutions Page 19 f. Regional Economic Ties to State & National Economy Page 20 g. Factors Impacting Economic Performance – SWOT Analysis Page 21 h. Economic Resilience Page 23
3. Strategic Direction Page 27
a. Vision Statement Page 27 b. Goals & Objectives Page 27
4. Action Plan/Evaluation Page 32
5. Resource Bibliography Page 36
6. Appendices:
A Population Page 37 B Education Page 41 C Income Page 42 D Employment/Unemployment Page 45 E Community Colleges & School Districts by County Page 48 F SWOT Analysis by Cluster Page 51 G Sector Rankings by Cluster — Survey Results Page 76 H Economic Resilience Page 86 I Industry Sectors & Industry Clusters Page 92 J North Central Texas Region CEDS Committee Members Page 98

Comprehensive Economic Development Strategy 2016
North Central Texas Council of Governments Page 4
SECTION 1 EXECUTIVE SUMMARY & INTRODUCTION
(Return to TOC)
This Comprehensive Economic Development Strategy (CEDS) document has been developed in order to fulfill a requirement of the Economic Development Administration (EDA), U.S. Department of Commerce, for designating the North Central Texas region as an Economic Development District (EDD). An EDA approved Strategy is required by the U.S. Public Works and Economic Development Act of 1965 in order for communities in the NCTCOG region to be eligible to apply for investment assistance under the EDA’s Public Works or Economic Adjustment Assistance program. Designation as an Economic Development District, which requires the completion and approval of an initial Comprehensive Economic Development Strategy (CEDS) document, will help to assure that the NCTCOG region is continually covered by the EDA approved Strategy necessary for application to the Public Works or Economic Adjustment Assistance programs. Furthermore, the NCTCOG region is the only Council of Governments region in the surrounding five-state region that is not currently designated as an Economic Development District (EDD) and, as a result, this region has missed out on a considerable amount of federal funding and grants over the years. This document is the first step in correcting that situation. Finally, once approved by EDA, Regional EDDs must subsequently update their CEDS at least every five years in order to continue to qualify for EDA assistance under its Public Works and Economic Adjustment Assistance programs. The North Central Texas region consists of 16 counties — Collin, Dallas, Denton, Ellis, Erath, Hood, Hunt, Johnson, Kaufman, Navarro, Palo Pinto, Parker, Rockwall, Somervell, Tarrant and Wise — centered around the Dallas-Fort Worth-Arlington Metropolitan Statistical Area (MSA). The region is a collection of cities, suburbs, and rural areas that are becoming increasing interdependent economically. Census data shows that, in 9 of the region’s 16 counties, more than 45 percent of workers cross a county line to get to their jobs. In the global economy, many of the world’s prominent companies have enormous flexibility in the sense that they can be located anywhere on the globe. Experience shows that companies will locate to an area where there is an abundant and highly-skilled workforce, a high quality of life, good school systems, efficient transportation networks, affordable housing, and supportive government entities. While there are no guarantees that a particular region will be successful in attracting new companies, or even keep and retain existing companies, that region must take aggressive action in order to remain competitive because, if it does not act, jobs and economic prosperity could pass them by.

Comprehensive Economic Development Strategy 2016
North Central Texas Council of Governments Page 5
Large metropolitan areas and their surrounding communities have emerged as centerpieces for global competition and, therefore, it is important that the entire region acts collaboratively. As a result, regions around the world are pooling their resources to pursue economic development opportunities. The CEDS document traditionally has been intended to serve as a region’s economic development plan, with a focus on how the regional Economic Development Districts can use the CEDS to add the most value to their region’s economic competitiveness. For some smaller regions, the CEDS ends up being the only regional plan for growth, thus taking on an important role for shaping strategies of local governments. In larger metro regions like ours, the CEDS is just one of many plans being developed and must find a niche for how it can add value. Our CEDS is not intended to provide guidance to individual cities and counties about what they need to be doing in their economic development programs; rather, we believe our role as a COG is to look at our region as unit of cities and counties that compete globally for employers and workers, and therefore focus on capacity-building strategies like transportation, infrastructure, education and healthcare, in addition to housing and environmental issues.
The North Central Texas Region CEDS was created under the direction of a broad-based committee that included representatives from government, higher education, workforce development, economic development, chambers of commerce, and the private sector (see Appendix I for a list of committee members). Private sector business owners operating for-profit enterprises represented a significant portion of the committee’s total membership. Geographically, business members of the committee represented all 16 counties, including both urban and rural areas.
All of the meetings were well attended and in-depth discussions took place in the areas of housing, transportation, education, workforce development, healthcare, financial resources, technical assistance and collaborative partnerships. The Committee used input from these meetings, as well as survey responses, to select goals to be included in the 2016-2021 CEDS. These goals focus on workforce development, economic development, community development, technology and transportation.
The CEDS Committee, because of the diverse nature of the North Central Texas region, organized itself into five sub-regional clusters based on geography, as well as one functional cluster – higher education. Each cluster then performed a SWOT (Strength, Weakness, Opportunity and Threat) analysis of their sub-region or function.
Five major strategic areas stood out as playing a critical role in the future development of the North Central Texas region: education & workforce development; strengthening economic competitiveness, including business attraction and retention, in the global economy; fostering a climate and culture that promotes entrepreneurship; maintaining and improving a robust transportation and public Infrastructure; and maintaining and improving the quality of life that makes north central Texas such a great place to live, work and raise a family.
The CEDS committee then agreed upon a number of specific goals and objectives to address these strategic areas over the next five years. See Section 4, Goals & Objectives, on page 25 for specific details.

Comprehensive Economic Development Strategy 2016
North Central Texas Council of Governments Page 6
NCTCOG will serve as the lead organization for the projects listed in this plan and will work with regional partners, including chambers of commerce, workforce development boards, economic development organizations, school districts, higher education institutions, and others, in order to implement these goals and objectives during 2016-2021.
The purpose of this CEDS is to help influence and shape the environment in which our businesses operate and our people live, so it is difficult to predict exactly how many jobs the CEDS will create, particularly since this is our initial plan. For this region, the Comprehensive Economic Development Strategies are a guide in the continuing efforts by member organizations, their economic development components, local chambers of commerce and other agencies involved in economic development, to focus great energy toward a pro-active plan to facilitate new opportunities and renew existing efforts.
NCTCOG, which serves 16 counties, with 169 cities and a large number of economic development groups, will have, as its primary role in the EDD, to provide data, strategy, and other types of assistance on economic development projects that result in jobs or private investment. These results will be recorded on the annual Government Performance and Results Act (GPRA) form that the EDD will submit to EDA. NCTCOG’s role is to support these efforts in developing regional solutions by facilitating effective collaboration, coordination and implementation.
NCTCOG, in adopting this CEDS, seeks to expand the capacity of all economic development organizations in the North Central Texas region and to strengthen the concept of regionalism. Our goal is to encourage elected officials, economic development practitioners, business leaders and communities to focus on the impact of their planning efforts and decisions, and the ramifications these efforts will have on the economic well-being of their communities and the region as a whole.

Comprehensive Economic Development Strategy 2016
North Central Texas Council of Governments Page 7
SECTION 2 AREA OVERVIEW & BACKGROUND
(Return to TOC) The North Central Texas Council of Governments (NCTCOG) is a political subdivision of the state and a voluntary association of local governments with a membership of 235 political jurisdictions. It is not a government, in that it cannot levy taxes or enact laws. Its primary purposes are to perform long-range, comprehensive planning for matters that transcend jurisdictional boundaries, promote the sound development of the 16-county region and facilitate cooperation and coordination among its member governments. These responsibilities will continue to increase in importance as the region is forecasted to grow from one of 6.8 million people to a population of some 10 to 11 million by 2030. The North Central Texas Region is a mix of urban, suburban and rural counties anchored by the Dallas-Fort Worth-Arlington Metropolitan Statistical Area (MSA), the fourth largest metro area in the U.S. It is a major commercial, industrial, medical and transportation hub that also includes several predominantly rural, agricultural counties.
a. Demographic and Socioeconomic Data. • Population – Slightly less than 7 million people currently reside in the 16-county NCTCOG
region, with most of the population (63.3%) concentrated in Dallas (2,459,095) and Tarrant (1,910,975) counties. The remaining 14 counties range in size from Collin (854,036) and Denton (721,022) counties to Navarro (49,245), Erath (39,862), Palo Pinto (28,568) and Somervell (8,674) counties. The NCTCOG region’s population has grown by 30 percent since the 2000 Census and is projected to grow by another 30 percent over the next 15 years, with the larger urban counties accounting for most of the projected growth.
Population & Growth
County
2000
2010
2013
2030
Change 2000-13
Change 2010-30
Collin 491,675 782,341 854,036 1,211,461 73.7% 54.9% Dallas 2,218,899 2,368,139 2,459,095 2,859,701 10.8% 20.8% Denton 432,976 662,614 721,022 1,014,812 66.5% 53.2% Ellis 111,360 149,610 155,939 213,832 40.0% 42.9% Erath 33,001 37,890 39,862 44,495 20.8% 17.4% Hood 41,100 51,182 53,022 59,479 29.0% 16.2% Hunt 76,596 86,129 88,451 107,574 15.5% 24.9% Johnson 126,811 150,934 157,201 198,761 24.0% 31.7% Kaufman 71,313 103,350 108,298 158,947 51.9% 53.8%

Comprehensive Economic Development Strategy 2016
North Central Texas Council of Governments Page 8
Navarro 45,124 47,735 49,245 58,575 9.1% 22.7% Palo Pinto 27,026 28,111 28,568 32,955 5.7% 17.2% Parker 88,495 116,927 121,178 163,780 36.9% 40.1% Rockwall 43,080 78,337 85,050 120,573 97.4% 53.9% Somervell 6,809 8,490 8,674 10,670 27.4% 25.7% Tarrant 1,446,219 1,809,034 1,910,975 2,287,581 32.1% 26.5% Wise 48,793 59,127 61,558 78,265 26.2% 32.4%
NCTCOG Region 5,309,277 6,539,950 6,902,174 8,621,461 30.0% 31.8%
SOURCE: NCTCOG, Texas State Data Center
One of the strengths of the NCTCOG region is its racial and cultural diversity. Hispanics comprise 28 percent of the region’s population, ranging from Dallas (39%), Tarrant (27.6%), Navarro (25.2%) and Ellis (24.6%) counties to Hood (11.2%), Parker (11.2%), Hunt (14.6%) and Collin (15%) counties. African-Americans comprise 15.7 percent of the region’s population, ranging from Dallas (23.1%), Tarrant (15.9%) and Navarro (14%) counties to Hood (0.8%), Somervell (1.2%), Wise (1.5%) and Erath (1.6%) counties. The NCTCOG region is also characterized by its youth, with more than 30 percent of its population being under the age of 20. Just over half of the population is in the prime working age group of 20-54, with another 10.2 percent (ages 55-64) nearing the end of their working career. Just under 10 percent of the NCTCOG region’s population is 65 or older. For more detailed data on NCTCOG demographics by county, see Appendix A.
• Educational Attainment – The region offers a variety of public and private schools, with robust programming in life sciences, engineering and the arts. The University of North Texas at Denton, the University of Texas at Dallas, and the University of Texas at Arlington are among Texas’ seven “emerging research” universities and are currently expanding program capabilities and funding in an effort to become world-class “tier one” research institutions, which are nationally recognized for the highest levels of innovation and academic excellence. UT Southwestern Medical Center is among the nation’s best in biology and biochemistry research, boasting countless clinical breakthroughs and innovations.
The region is home to 13 major universities: University of North Texas - Denton, The University of Texas at Arlington, The University of Texas at Dallas, Texas Woman’s University, Southern Methodist University, Texas A & M University – Commerce, Texas Christian University, Dallas Baptist University, Texas Wesleyan University, University of Dallas, UT Southwestern, Tarleton State University, and University of North Texas – Dallas. According to the 2014 National Center for Education Statistics, enrollment for these universities totaled 164,288 in 2013, with 27,484 bachelors degrees, 16,306 masters degrees, 832 post baccalaureate certificates, and 2,148 doctorate degrees awarded.

Comprehensive Economic Development Strategy 2016
North Central Texas Council of Governments Page 9
The 16-county NCTCOG region is as diverse in its educational attainment as it is in population. Roughly 31.4 percent of adults over 25 in the region possess at least a bachelor’s degree, led by Collin (49.3%), Denton (40.5%) and Rockwall (36.5%) counties. Palo Pinto (15.1%), Wise (16.2%), Navarro (16.5%), Johnson and Hunt (16.7%) and Kaufman (17.6%) counties have the lowest percentage of college graduates.
Educational Attainment
County Population No HS
Diploma
HS Diploma
Only
1-3 Years of College
Associate Degree
Bachelors or
Advanced Degree
Collin 782,341 6.6% 15.7% 21.1% 7.4% 49.3% Dallas 2,368,139 22.6% 23.0% 20.2% 5.5% 28.5% Denton 662,614 8.2% 19.0% 24.3% 8.0% 40.5% Ellis 149,610 16.3% 30.0% 25.9% 7.1% 20.7% Erath 37,890 18.1% 27.4% 24.7% 5.5% 24.3% Hood 51,182 12.9% 29.1% 27.7% 6.2% 24.1% Hunt 86,129 12.2% 34.4% 23.9% 6.9% 16.7% Johnson 150,934 16.9% 33.1% 26.5% 6.9% 16.7% Kaufman 103,350 17.5% 31.2% 27.3% 6.4% 17.6% Navarro 47,735 21.4% 32.9% 22.5% 6.7% 16.5% Palo Pinto 28,111 20.6% 35.6% 24.2% 4.5% 15.1% Parker 116,927 11.9% 27.0% 28.3% 7.8% 25.0% Rockwall 78,337 8.8% 22.3% 25.0% 7.4% 36.5% Somervell 8,490 15.6% 25.0% 20.9% 9.5% 29.0% Tarrant 1,809,034 15.5% 23.9% 24.5% 6.7% 29.4% Wise 59,127 16.2% 37.1% 25.2% 5.4% 16.2%
NCTCOG Region 6,539,950 16.2% 23.0% 22.7% 6.5% 31.4%
SOURCE: 2013 U. S. Census Bureau 5-Year American Community Survey
The NCTCOG region is extremely fortunate to have a robust community college system, with 6.5 percent or approximately 326,899 of the region’s adults possessing an associate’s degree. This ranges from Somervell (9.5%), Denton (8.0%) and Parker (7.8%) counties to Palo Pinto (4.5%), Wise (5.4%), Erath (5.5%) and Dallas (5.5%) counties. Additionally, according to the National Center for Education Statistics 2014 data, this region has an enrollment of over 192,997 students pursuing associate degrees through its community college districts. On the opposite end of the spectrum, 16.2 percent of the adults in the NCTCOG region have less than a high school diploma, headed by Dallas (22.6%), Navarro (21.4%) and Palo Pinto (20.6%) counties. Not surprisingly, the counties with the highest percentage of college graduates — Collin (49.3%), Denton (40.5%) and Rockwall (36.5%) — also have the fewest

Comprehensive Economic Development Strategy 2016
North Central Texas Council of Governments Page 10
percentage of adults without at least a high school diploma at 6.6%, 8.2% and 8.8% respectively. The biggest challenge facing the NCTCOG region is that nearly two in five (39.2%) adults in the NCTCOG region possess only a high school diploma or less. This presents us with the enormous challenge of helping provide these people with the basic skills necessary to play a meaningful role in a modern economy so that they are able to take part in the American Dream. In four counties — Palo Pinto (56.2%), Navarro (54.3%), Wise (53.3%) and Johnson (50.0%) — half of the adults fall into this category and Dallas County, the largest in the region, is not far behind at 45.6 percent of the adults with a high school diploma or less. For more detailed data on NCTCOG educational attainment by county, see Appendix B.
• Household Income – The median household income for the NCTCOG region is $58,138, which is slightly less than the national average in 2013 of $51,939. The most affluent counties in the region are Rockwall ($86,218), Collin ($85,079) and Denton ($71,568), while the least affluent counties are Palo Pinto ($38,532), Erath ($40,220) and Navarro ($40,129). According to the US Census Bureau, there are just under 2.4 million households in the NCTCOG region. Roughly 30 percent of these households have incomes of less than $35,000, while 32 percent have household incomes between $35,000 and $74,999. The remaining 38 percent of households have incomes greater than $75,000.
Median Household Income
County Population 2000 2013 2018 Change '13 -
'18 Collin 782,341 $ 70,887 $ 85,079 $ 105,040 23.5% Dallas 2,368,139 $ 43,617 $ 48,100 $ 53,810 11.9% Denton 662,614 $ 58,500 $ 72,359 $ 84,379 16.6% Ellis 149,610 $ 50,426 $ 61,711 $ 71,568 16.0% Erath 37,890 $ 30,803 $ 40,220 $ 48,877 21.5% Hood 51,182 $ 43,763 $ 53,341 $ 63,395 18.8% Hunt 86,129 $ 36,909 $ 46,178 $ 50,808 10.0% Johnson 150,934 $ 44,680 $ 56,633 $ 66,399 17.2% Kaufman 103,350 $ 44,818 $ 60,875 $ 70,754 16.2% Navarro 47,735 $ 31,401 $ 40,129 $ 47,917 19.4% Palo Pinto 28,111 $ 31,261 $ 38,532 $ 45,983 19.3% Parker 116,927 $ 45,595 $ 63,382 $ 77,571 22.4% Rockwall 78,337 $ 65,438 $ 86,218 $ 129,385 50.1% Somervell 8,490 $ 39,138 $ 47,850 $ 53,128 11.0% Tarrant 1,809,034 $ 46,246 $ 54,442 $ 63,303 16.3% Wise 59,127 $ 42,315 $ 58,249 $ 68,636 17.8% NCTCOG Region 6,539,950 $ 49,289 $ 58,138 $ 68,019 17.0%
SOURCE:

Comprehensive Economic Development Strategy 2016
North Central Texas Council of Governments Page 11
The counties with the largest percentage of households with incomes less than $35,000 are Erath (45.8%), Navarro (42.9%), Palo Pinto (42.6%), Hunt (39.8%) and Dallas (35.6%). The counties with the greatest percentage of household incomes over $75,000 are Rockwall (57.4%), Collin (54.5%), Denton (49.5%) and Parker (43.8%). For more detailed data on NCTCOG household income by county, see Appendix C.
• Employment & Labor – The average annual unemployment rate in 2014 for the 16-county NCTCOG region was 5.0%, compared to the national average of 6.2 percent and the Texas average of 5.1 percent. The highest unemployment rates for 2014 were in Hunt (5.8%), Dallas (5.4%) and Navarro (5.1%) counties. The lowest unemployment rates for 2014 were in Erath (4.2%), Denton (4.4%) and Collin, Parker and Rockwall (each with 4.5%) counties. Unemployment rates in the NCTCOG region since 2000 have tended to be lower than the national average, while staying close to the state average for Texas. During this period, job creation has been robust, with the number of people employed having grown by 12.0 percent since 2010 and by 21.8 percent since 2000, even though the unemployment rate in 2000 was much lower (3.5%) than it was in 2014 (5.0%). In other words, job growth, as strong as it has been, has not kept up with population growth.

Comprehensive Economic Development Strategy 2016
North Central Texas Council of Governments Page 12
Average Annual Unemployment (2014)
County 2014
Labor Force Employed Unemployed Unemployment Rate
Collin 471,554 450,277 21,277 4.5% Dallas 1,268,571 1,200,663 67,908 5.4% Denton 412,700 394,540 18,160 4.4% Ellis 79,731 75,854 3,877 4.9% Erath 20,223 19,376 847 4.2% Hood 24,400 23,215 1,185 4.9% Hunt 39,024 36,780 2,244 5.8% Johnson 74,914 71,185 3,729 5.0% Kaufman 53,886 51,141 2,745 5.1% Navarro 23,435 22,207 1,228 5.2% Palo Pinto 13,450 12,763 687 5.1% Parker 59,755 57,047 2,708 4.5% Rockwall 43,404 41,469 1,935 4.5% Somervell 4,221 4,009 212 5.0% Tarrant 998,520 948,786 49,734 5.0% Wise 28,873 27,486 1,387 4.8% NCTCOG Region 3,616,661 3,436,798 179,863 5.0%
SOURCE: Texas LMCI Tracer For more detailed data on NCTCOG employment and labor statistics by county, see Appendix D.
b. Geographic, Environmental, Climate, Cultural and Natural Resources Profile.
• Geographic — The NCTCOG region is located in north central Texas and includes the
following 16 counties: Collin, Dallas, Denton, Ellis, Erath, Hood, Hunt, Johnson, Kaufman, Navarro, Palo Pinto, Parker, Rockwell, Somervell, Tarrant and Wise. The economic and population hub for the region is centered on the Dallas-Fort Worth-Arlington Metropolitan Statistical Area (MSA), the fourth largest MSA, by population, in the United States.

Comprehensive Economic Development Strategy 2016
North Central Texas Council of Governments Page 13
• Climate — The Dallas-Fort Worth Metroplex, the heart of the NCTCOG region, is located in North Central Texas, approximately 250 miles north of the Gulf of Mexico. It is near the headwaters of the Trinity River, which lie in the upper margins of the Coastal Plain. The rolling hills in the area range from 500 to 800 feet in elevation. The Dallas-Fort Worth climate is humid subtropical with hot summers. It is also continental, characterized by a wide annual temperature range. Precipitation also varies considerably, ranging from less than 20 to more than 50 inches. Winters are mild, but “northers” occur about three times each month, and often are accompanied by sudden drops in temperature. Periods of extreme cold that occasionally occur are short-lived, so that even in January mild weather occurs frequently. The highest temperatures of summer are associated with fair skies, westerly winds and low humidity. Characteristically, hot spells in summer are broken into three-to-five day periods by thunderstorm activity. There are only a few nights each summer when the low temperature exceeds 80°F. Summer daytime temperatures frequently exceed 100°F. Air conditioners are recommended for maximum comfort indoors and while traveling via automobile.

Comprehensive Economic Development Strategy 2016
North Central Texas Council of Governments Page 14
Throughout the year, rainfall occurs more frequently during the night. Usually, periods of rainy weather last for only a day or two, and are followed by several days with fair skies. A large part of the annual precipitation results from thunderstorm activity, with occasional heavy rainfall over brief periods of time. Thunderstorms occur throughout the year, but are most frequent in the spring. Hail falls on about two or three days a year, ordinarily with only slight and scattered damage. Windstorms occurring during thunderstorm activity are sometimes destructive. Snowfall is rare. The average length of the warm season (freeze-free period) in the Dallas-Fort Worth Metroplex is about 249 days. The average last occurrence of 32°F or below is mid-March and the average first occurrence of 32°F or below is in late November.
• Natural Resources —Texas occupies approximately seven percent of the United States'
water and land area, according to USA Today. Oil and natural gas resources have been extremely important to the development of the North Central economy over the last century. According to the American Oil & Gas Historical Society, the first Texas oil boom occurred in 1894 when the Corsicana oilfield, in Navarro County, was discovered by a drilling contractor hired by the city to find water. Although the NCTCOG region is not nearly as reliant on energy production as it was in the past, the Barnett Shale is still a significant producer of natural gas. The Barnett, which extends from the city of Dallas to the west and south, covers some 5,000 square miles in 18 counties. The core counties are Denton, Johnson, Tarrant and Wise. Limestone is abundant in Hill and Johnson counties, while bituminous coal is found in Erath, Palo Pinto, Parker and Wise counties.
• Environmental — In 2012, the U.S. Environmental Protection Agency (EPA) designated 10 counties (Collin, Dallas, Denton, Ellis, Johnson, Kaufman, Parker, Rockwall, Tarrant and Wise) in North Central Texas as nonattainment for the pollutant ozone in accordance with the 1997 8-hour ozone National Ambient Air Quality Standards (NAAQS). These standards are designed to protect human and environmental health, and ground-level ozone is monitored and targeted for reductions due to its potentially harmful effects. Four main sources of ozone-causing emissions include On-road Mobile Sources like cars and trucks, Non-road Mobile Sources like construction equipment, Point Sources like electric generating utilities and industrial boilers, and Area Sources like solvent use and agriculture. Development of an air quality plan, known as the State Implementation Plan (SIP), is required for all nonattainment areas in order to demonstrate how ozone will be reduced to levels compliant with the NAAQS. The SIP for the Dallas-Fort Worth nonattainment area includes programs to get older cars off the road, technologies to clean up vehicles already

Comprehensive Economic Development Strategy 2016
North Central Texas Council of Governments Page 15
on the road, and education programs so that citizens can do their part in improving air quality in North Texas. NCTCOG works in cooperation with federal, State, and local partners to ensure all air quality requirements are met. NCTCOG strives to achieve attainment of the ozone NAAQS as early as possible and contributes to a better quality of life for all North Texans.
• Cultural. — The NCTCOG region represents a rich a diverse cultural heritage. Not surprisingly, just over 28 percent of the region’s population is Hispanic or Latino, while another 15.7 percent is black or African-American. Together, those two groups make up almost half (43.7%) of the region’s population. The next largest ethnic group is Asian (4.7 %), followed by American Indian (1.0%). The North Central Texas region still reflects its traditional Southwestern heritage, a blend of Hispanic culture and rugged frontier individualism strongly influenced by the cattle and oil economies that helped build modern Texas. Over the past several decades, Texas has evolved into a dynamic modern economy that has transitioned from a heavy reliance on natural resources into a technology-driven, $1.65 billion economy that, according to the International Monetary Fund and the U.S. Bureau of Economic Analysis, would rank No. 12 among the other nations in the world, just behind India, Russia and Canada, and ahead of such nations as Australia, Korea, Spain Mexico, Indonesia and The Netherlands. Despite its dramatic economic and population growth over the past generation or two, which included a huge influx of people from throughout the U.S. and, indeed, from around the world, Texas still maintains its unique, traditional cultural heritage. For more detailed data on the NCTCOG region’s racial and ethnic background by county, see Appendix A.
• Quality of Life — Quality of life issues have to do with a broad range of concerns like income, housing, and education resources. All have implications for the region’s long-term economic growth potential. They also have a bearing on how well the region is able to market itself as a desirable place to work, live and do business in. In a competitive global economy, the quality of place becomes an important factor in helping businesses and institutions decide where they want to locate themselves. It also becomes important for attracting the necessary talent and assets needed to sustain the economic growth process. Over the past decade, the North Central Texas region has been able to take advantage of its assets and quality of life to attract a number of world-class businesses. Toyota Motor Manufacturing was one of those businesses. In the future, the area’s cultural environment and quality of life will likely play an increasingly important role in the economic growth process. While the NCTCOG region continues to be an attractive location for new business

Comprehensive Economic Development Strategy 2016
North Central Texas Council of Governments Page 16
ventures and investment, much still remains to be done to make it a major player in the U.S. and global markets.
c. Infrastructure Assets.
The Dallas-Fort Worth-Arlington MSA, or “Metroplex” as it is commonly known, has a large and robust transportation infrastructure comprised of highways, railways and airports that, with the tremendous growth in the region, require constant, and expensive, maintenance and expansion in order to meet capacity and safety requirements. As the population grows and the existing infrastructure ages, the cost of building new roads, relocating rail lines, and related infrastructure in the region, and throughout the state, have emerged as issues that require urgent attention that must continue to be addressed by the Texas Legislature, Texas Department of Transportation (TxDOT) and other local and regional entities in the years ahead.
• Highways — The NCTCOG region’s transportation infrastructure provides the foundation
upon which the region’s economy functions. Transportation access within the region, and its external linkages to other parts of the state and the nation, are crucial for the region’s long-term economic success. The ever-increasing need to upgrade and maintain the highway network within the region is absolutely essential to providing a high level of connectivity between communities within the region, as well as to other regions throughout Texas and the rest of the U.S. The NCTCOG region is a major highway crossroads, with four major interstate highways (I-20, I-30, I-35 and I-45) connecting the region with the rest of the U.S. In addition, US-67, US-75, US-77, US-80, US-175 and US-287 also service the region. The state of Texas maintains numerous state highways and farm-to-market roads, while local jurisdictions (counties and cities) maintain the rest of the region’s public road infrastructure. While the region is currently well-served by major U.S. and state highways, rural communities still tend to be more isolated. The long-term goal is to ensure that all communities in the region are well-served by a comprehensive network of highways and roads. To this end, it is also important to ensure that public-based transportation systems within the Dallas-Fort Worth-Arlington metropolitan area, as well as the larger communities in the region, are optimized to provide the best transit services possible for local residents.
• Airports — The NCTCOG region, by virtue of its geographic location, population and dynamic economy, is also a major hub for commercial passenger air and air cargo. Dallas-Fort Worth International Airport (DFW), Dallas Love Field, and Fort Worth Alliance Texas Airport are the major airports serving the region, with a large number of smaller executive and municipal airports located throughout the area.

Comprehensive Economic Development Strategy 2016
North Central Texas Council of Governments Page 17
DFW airport ranked No. 9 in the world, and No. 3 in the U.S., in terms of total passenger traffic in 2014, while Dallas Love Field ranks No. 41. DFW airport also ranked No. 5 in the U.S. in terms of total air cargo throughput. The 16-county region of North Central Texas is home to a variety of public and private aviation facilities. Of the more than 400 aviation facilities, 56 are public-use facilities, with 29 included in the FAA’s National Plan of Integrated Airport System.
• Rail & Intermodal — The NCTCOG region is also a major rail crossroads, with three of the
country’s eight Class 1 railroads — Union Pacific, Burlington Northern Santa Fe, and Kansas City Southern — providing service to the NCTCOG region. Each of the three major carriers also operates large intermodal terminals located within the Metroplex. Dallas Area Rapid Transit (DART) Light Rail owns and operates a light rail system that serves Dallas and its suburbs. The system consists of 90 miles between its four lines: the Red Line, the Blue Line, the Green Line, and the Orange Line. It is also the longest light rail system in the U.S. DART partners with the Fort Worth Transportation Authority (the T) to operate the Trinity Rail Express (TRE), a commuter train, which offers commuter rail service between downtown Fort Worth and Dallas, with stops at several “mid-cities” suburbs in between.
• Utility Infrastructure — As with every other type of infrastructure, population growth and aging infrastructure create enormous challenges for regional governments. Every year, NCTCOG's Public Works program is updated and paid for cooperatively by cities and counties across North Central Texas. The FY2015 Public Works Program was approved by the Public Works Council in June 2014. The Public Works Council (PWC), initially established in 1984 as the Public Works Advisory Committee, provides expertise and support to the Executive Board and staff on a wide range of local public works issues. For example, the PWC provides continuing advice regarding the Public Works Construction Standards - North Central Texas, as well as such issues as managing right-of-way, comprehensive and consistent storm water management through iSWM, and regional pavement design guidance, as well as identified sub-regional issues. Management of public works facilities is a very important component of the responsibilities of cities, counties, and special districts across North Central Texas. The quality of the region’s infrastructure (its roads, water distribution, wastewater collection, and storm drainage systems) has always been a high priority and a source of pride for its communities. The Public Works Council created the Public Works Construction Standards to guide infrastructure development in North Central Texas.

Comprehensive Economic Development Strategy 2016
North Central Texas Council of Governments Page 18
Currently, the North Central Texas Council of Governments and the Public Works Council are in the process of updating the current version of the Public Works Construction Standards – North Central Texas, 2004 Version. We anticipate the update will be completed by the end of 2015.
d. Industry Sectors & Clusters. Industry clusters are geographic concentrations of competing, complementary, or interdependent firms and industries that do business with each other and/or have common needs for talent, technology, and infrastructure. Targeted industry clusters in the urban Metroplex, according to the Dallas-Fort Worth Regional Workforce Leadership Council (RWLC), include Aerospace, Healthcare, Infrastructure, and Technology. The RWLC, which has guided the work of developing industry clusters, was formed in 2002 with a Memorandum of Understanding between the Dallas, North Central Texas and Tarrant Workforce Boards, and the Arlington, Dallas and Fort Worth Chambers of Commerce. Major industries in North Central Texas include Aviation, Energy, Finance, Healthcare, High Tech, Logistics and Manufacturing. The region is also home to 18 Fortune 500 Headquarters (2014 Fortune 500 list) and 15 major colleges and universities. Additionally, according to the Dallas Regional Chamber, the top 25 major employers employ a combined workforce of 299,299 employees out of a labor force of approximately 3.5 million. The Trade, Transportation and Utilities industry sector makes up roughly 20% of the labor force, while the Information industry sector is the smallest at 2.5%. The less populous rural counties in the region, on the other hand, are heavily-dominated by agriculture, cattle, manufacturing and energy-related businesses. • Aviation and Aerospace — The North Central Texas region area is among the nation’s top
regions for aviation and aerospace activity, with more than 78,000 people employed in the industry. The region is headquarters to two mainline airlines, American Airlines and Southwest Airlines, as well as regional jet operator (and American Airlines partner) American Eagle Inc. Both American and Southwest operate major maintenance bases here, creating a strong foundation of aviation employment. Aerospace is a key source of economic strength for the region, comprising more than 900 companies and accounting for one of every six jobs in North Texas. Lockheed Martin and Bell Helicopter Textron are the largest aerospace employers, with more than 26,400 employees between them.
• Finance — The North Central Texas region is a key U.S. financial center, hosting the corporate headquarters of Comerica Inc., as well as call centers for major banks such as Bank of America, Capital One and Fidelity Investments. Major centers for JPMorgan Chase & Co., Citigroup Inc. and Wells Fargo & Co. are also among the top employers in the region. Financial firms are distributed throughout the region, but the biggest concentration is centered in downtown Dallas and its northern suburbs of Addison and Plano. Downtown

Comprehensive Economic Development Strategy 2016
North Central Texas Council of Governments Page 19
Fort Worth also has a strong array of financial firms. The region is also home to the Federal Reserve Bank of Dallas, one of 12 regional Federal Reserve Banks in the U.S. and the Bureau of Printing and Engraving, located in Fort Worth.
• Healthcare — Health industry companies are located throughout the North Central Texas region, making it easy for them to tap into a broad base of skilled employees. The health care industry in the region is more than health care services: it is also manufacturing, research and goods distribution. The activities often cluster around each other, creating a synergy within the health care community.
• High Technology — The Dallas-Fort Worth Metroplex has the 6th largest concentration of high tech jobs in the U.S., according to the Dallas Regional Chamber. The new era of information and communication technologies began in Dallas in 1958 with the invention of the microchip at Texas Instruments. The technology industry in the region encompasses four general categories: manufacturing, information services, professional technical services, and bio-life sciences.
• Logistics — The region’s central U.S. location makes it an important distribution hub, with
quick access to rail, air and over-the-ground truck transportation. The region is also a global inland port, with two airports capable of large-scale cargo operations: Dallas-Fort Worth International and Fort Worth Alliance. Major rail logistics hub operations for the two primary western U.S. railroads: Fort Worth-based Burlington Northern Santa Fe (BNSF) and Union Pacific (UP), tap into major east-west arteries and provide important links to Mexican markets. By truck, distributors can efficiently more products throughout the central part of the U.S., reaching 93 percent of the population within 48 hours.
• Manufacturing — Manufacturing makes up nearly 10 percent of the regional economy. The Metroplex has more manufacturing activity than any other metro area in Texas, according to data from the Dallas Regional Chamber. The size and scope of operations here create a diverse manufacturing landscape across many sectors. Goods that are built here range from boots and clothing to bricks, steel, plastics and aerospace components.
For more detailed data on the NCTCOG region’s industry sectors and clusters by county, see Appendix I.
e. Educational Institutions. • Universities Located in Region – The following 4-year colleges and universities are located in
the NCTCOG region: Arlington Baptist College, Criswell College, Dallas Baptist University, Dallas Christian College, Dallas Theological Seminary, Our Lady of the Lake University, Southern Methodist University, Southwestern Adventist University, Southwestern

Comprehensive Economic Development Strategy 2016
North Central Texas Council of Governments Page 20
Assemblies of God University, Southwestern Baptist Seminary, Southwestern Medical Center, Tarleton State University, Texas A&M University-Commerce, Texas A&M University School of Law, Texas Christian University, Texas Wesleyan University, Texas Woman’s University, Tyndale Theological Seminary, University of Dallas, University of North Texas, University of North Texas at Dallas, University of Texas at Arlington, and University of Texas at Dallas.
• Community College Districts Located in Region – The 16 counties encompassing the NCTCOG region are served by 10 separate community colleges: Collin College, Dallas County Community College District (Brookhaven College, Cedar Valley College, Eastfield College, El Centro College, Mountain View College, North Lake College and Richland College), Hill College, North Central Texas College, Navarro College, Paris Junior College, Ranger College, Tarrant County College, Trinity Valley Community College and Weatherford College.
• Educational Institutions (ISDs & Community Colleges) Serving each County – In addition to
the 10 separate community college districts, the NCTCOG region is served by 200 local independent school districts. See Appendix E for a list of community colleges and ISDs serving each of the 16 counties in the region.
For more detailed data on the NCTCOG region’s educational institutions by county, see Appendix E.
f. Regional Economic Ties to State and National Economy.
The North Central Texas region has been a major hub of economic activity for decades. The region has experienced a great amount of positive economic activity due to diversified industries. North Central Texas has become a magnet for the nation’s largest corporations. In 2015, 21 Fortune 500 companies were listed as having their corporate headquarters located in the Dallas-Fort Worth-Arlington MSA, while 40 Fortune 1,000 corporate headquarters are located in the Metroplex. Among the most recent to relocate to North Central Texas is Toyota Motors, which is in the process of moving its North American headquarters from California to Plano, in Collin County. According to the North Texas Commission’s 2015 Profile of North Texas, North Texas has a Gross Domestic Product of $447 Billion, which is 30% of the State’s GDP. Texas has the most diverse economy in Texas and it has a 3.6% job growth rate – out-pacing the nation’s 2.1%. If North Texas were a country, it would rank 27th in the world in GDP, just between Belgium (26th) and Venezuela (28th).

Comprehensive Economic Development Strategy 2016
North Central Texas Council of Governments Page 21
g. Factors Impacting Economic Performance – SWOT Analysis The CEDS Committee, because of the diverse nature of the North Central Texas region, organized itself into five sub-regional clusters based on geography, as well as one functional cluster – higher education. Each cluster then performed a SWOT analysis of their sub-region or function (in the case of the University Cluster). The CEDS Committee as a whole, as well as a number of local stakeholders, began by completing a comprehensive, online survey of their particular cluster (see map below, which shows the geographic borders for Clusters 1 through 5). The data obtained through this survey was then used as the basis for each cluster’s SWOT Analysis. The results of the survey, by cluster, can be found in Appendix G. The survey results also shaped the goals for this CEDS. For more detailed information on each cluster’s SWOT analysis, see Appendix F.
Five major strategic areas stood out as playing a critical role in the future development of the North Central Texas region:

Comprehensive Economic Development Strategy 2016
North Central Texas Council of Governments Page 22
• Economic Competitiveness — There was a strong consensus about the region’s need to continuously expand upon and improve its economic competitiveness through the development of innovation-based clusters, as well as supporting efforts to attract new and expanding businesses while retaining existing businesses.
Among the strategies to accomplish this would be to support the development of innovation-based industry clusters that create high-wage jobs, to help communities implement economic development strategies that grow existing, locally-owned businesses and attract new companies to the region, and to encourage communities to adopt policies that create affordable housing options for people working in the community. In addition, we should support the formation and growth of export-oriented businesses, as well as supporting business attraction and retention efforts of local and regional economic development entities
• Education & Workforce Development — Education is the foundation of our regional economy and there is an ever-increasing need to develop a globally competitive workforce that encourages business to start, locate and expand in the North Central Texas region.
A major element of this would be to conduct collaborative planning activities with regional partners in order to promote alignment of economic and workforce development goals, including advocacy for emphasizing postsecondary education and skills training to support high-growth, high-wage jobs. This will require a continued partnership with local universities within the region to increase production of knowledge-based workers in science and technology sectors.
There was also a consensus to pursue funding opportunities with workforce partners to expand the availability of training programs for targeted industries and occupations, as well as for making labor market information more accessible to school districts and higher education institutions so students can make informed choices about career options.
• Entrepreneurship — Small businesses are the economic engine for the economy and the North Central Texas region has always been a magnet for entrepreneurs. Our goal is to be the most entrepreneur-friendly region in the U.S.
NCTCOG can assist in this goal by supporting programs that encourage people of all ages to consider becoming entrepreneurs, ensuring that entrepreneurs and small businesses have access to the resources they need to start and grow, generating awareness about the economic impact of entrepreneurs on the regional economy, as well as supporting efforts to improve access to capital, suppliers, customers, and collaborative relationships for entrepreneurs. This would include improving awareness of, and access to, regional Small Business Development Centers, and supporting other complementary initiatives including defined economic development priorities of member cities as well as regional accelerators, incubators and public/private/academic partnerships.

Comprehensive Economic Development Strategy 2016
North Central Texas Council of Governments Page 23
• Quality of Life — There was also a strong desire to strengthen the quality of life through comprehensive community development throughout the region.
Among the challenges will be to determine affordable housing needs, to increase accessibility to higher education opportunities in the region, and to increase accessibility to healthcare to underserved populations, particularly in the more remote rural areas of the region. In addition, NCTCOG must continue to advocate for prioritizing the continued upgrading of critical infrastructure in the rural areas of the North Central Texas region, as well as encouraging the alignment of regional healthcare industry strategies with regional economic development strategies in the region.
• Transportation & Public Infrastructure — There is broad consensus to explore and promote comprehensive planning solutions in order to ensure that regional transportation and public infrastructure meets the needs of employers and citizens.
Among the many strategies would be to market public transportation options throughout the region, support development and implementation of regional water/wastewater management strategies, and the continued development and implementation of a master, multi-modal regional transportation infrastructure plan.
In addition, NCTCOG should support development of community/county land use, transportation and economic development plans, as well as supporting local efforts to replace and upgrade aging infrastructure throughout the region.
h. Economic Resilience Economic Resilience is generally defined as the ability to recover quickly from a shock, the ability to withstand a shock, and the ability to avoid a shock all together. These shocks can be either economic or natural disasters (earthquakes, tornados, hurricanes, floods, fires and other occurrences) that can cause major economic and social disruption. Economic shocks can be mitigated, to a large degree, by diversification of the regional economy, or by “not putting all our eggs in the same basket.” North Central Texas, as a region, has made enormous strides in this area over the past 30 years, although some smaller communities in the region may be vulnerable to a downturn or disruption in a single industry sector, such as energy extraction. This does not, however, completely remove the threat of economic disruption, particularly those brought about by national or global causes.
• Emergency Management — The North Central Texas Regional Emergency Managers Group (REM) was established to provide an opportunity for Emergency Management professionals in North Central Texas to network regularly in order to discuss current issues and hear topical discussions or presentations, as well as to provide an organized format for correspondence with State or Federal contacts on issues important to the REM Group.

Comprehensive Economic Development Strategy 2016
North Central Texas Council of Governments Page 24
• Emergency Preparedness — Over the past several decades, the region has made
substantial progress in the area of economic resilience. The region has established a process by which it responds to, or mitigates, natural disasters and other disruptions. The NCTCOG Emergency Preparedness Planning Council (EPPC) serves in an advisory role to the NCTCOG Executive Board and is responsible for providing policy direction and oversight functions to the development and maintenance of a coordinated and integrated regional approach to emergency management planning and response systems. The Council can also make recommendations as to how the region can most efficiently and effectively utilize state and/or federal financial assistance made available for emergency and disaster planning, mitigation, and recovery.
The Regional Emergency Preparedness Advisory Committee (REPAC), established in 2004, is a technical committee of the EPPC and is charged with formulating strategies and recommendations to accomplish coordinated and integrated emergency preparedness planning. The initial focus was on reviewing and approving regional homeland security projects. Subsequent activities include strategic planning, project implementation, evaluation of ongoing regional projects, and other current and future issues facing our region.
REPAC membership consists of 16 county representatives, three urban area representatives, fourteen subject matter expert representatives, and leadership. The subject matter expert representatives come from a wide range of disciplines, including police, fire, emergency management, public works, communications, medical/public health, and education.
• Hazard Mitigation Plan — NCTCOG has worked with the counties in the region to prepare Hazard Mitigation Plans. Counties and jurisdictions entered into an Inter-local Agreement to work on the plans, which are submitted to the Federal Emergency Management Agency (FEMA) and the Texas Department of Emergency Management (TDEM) for approval. FEMA and TDEM are reviewing the plans together in order to reduce the amount of time required for the review. Fourteen counties have worked through NCTCOG to produce their plan, and two counties, Kaufman and Rockwall counties, are coordinating their own plan. All 16 counties have prepared mitigation plans, of which six have been approved and adopted, three are approved pending adoption and five have been submitted and are under review.
• Continuity of Operations (COOP) — COOP is an initiative to ensure that agencies are able to continue performance of essential functions under a broad range of circumstances and emergencies, including localized acts of nature, accidents and technological or attack-related emergencies. To achieve this goal, the objective of

Comprehensive Economic Development Strategy 2016
North Central Texas Council of Governments Page 25
organizations is to identify their essential functions and ensure that they can be continued throughout, or resumed rapidly after, a disruption of normal activities. A COOP plan establishes consistent performance metrics, prioritizes implementation plans, promulgates best practices, and facilitates consistent cross-agency continuity evaluations. All of the NCTCOG counties have COOP plans in place, as they are required for them to receive federal and state grant funds.
• Long-term Recovery Workshops — NCTCOG sponsors periodic seminars on long-term disaster recovery issues and challenges, bringing together entities throughout the region on a regular basis.
• Mobile Workforce Unit — The Workforce Solutions for North Central Texas Mobile Workforce Unit (MWU) is a 38-foot vehicle outfitted with 13 computer stations and a professional presentation system. The MWU is the perfect tool to aid employers in their recruitment and job fair efforts, as well as to respond to business or plant closures and other events involving significant job loss.
The MWU has also participated in many rapid response and disaster recovery events, giving those who lost their place of employment due to a lay-off or disaster, the opportunity to apply for unemployment benefits on site, search for a new job or update their resume. Some of these events include the wildfire disaster recovery in September 2011 in Bastrop; the fertilizer plant explosion disaster in April 2013 in West; the tornado disaster recovery in May 2013 in Ennis; and the tornado disaster recovery in June 2013 in Granbury.
• National Incident Management System (NIMS) Training — Developed by the Secretary of Homeland Security at the request of the President, the National Incident Management System (NIMS) integrates effective practices in emergency preparedness and response into a comprehensive national framework for incident management. The NIMS will enable responders at all levels to work together more effectively to manage domestic incidents no matter what the cause, size or complexity. NCTCOG provides guidance to the region and hosts NIMS training courses to assist the local jurisdictions in the region in reviewing the NIMS training matrix and making sure the appropriate staffs and stakeholders are trained at the FEMA required levels.
• Urban Shield Exercises — NCTCOG sponsors multi-jurisdictional emergency response
exercises, code-named NCT Urban Shield, designed to assess the region’s ability to successfully respond to, and manage, multiple manmade disasters and other

Comprehensive Economic Development Strategy 2016
North Central Texas Council of Governments Page 26
emergencies occurring simultaneously. The overarching goal of the NCT Urban Shield exercise is to provide a multi-layered training exercise to enhance the skills and abilities of participating regional first responders, as well as those responsible for coordinating and managing large-scale events. The exercises are designed to strengthen information sharing, test interoperable communications, and improve operations planning.
For more detailed data on the NCTCOG Economic Resilience-related programs, see Appendix H.
Comprehensive Economic Development Strategy 2016
North Central Texas Council of Governments Page 27
SECTION 3 STRATEGIC DIRECTION
(Return to TOC)
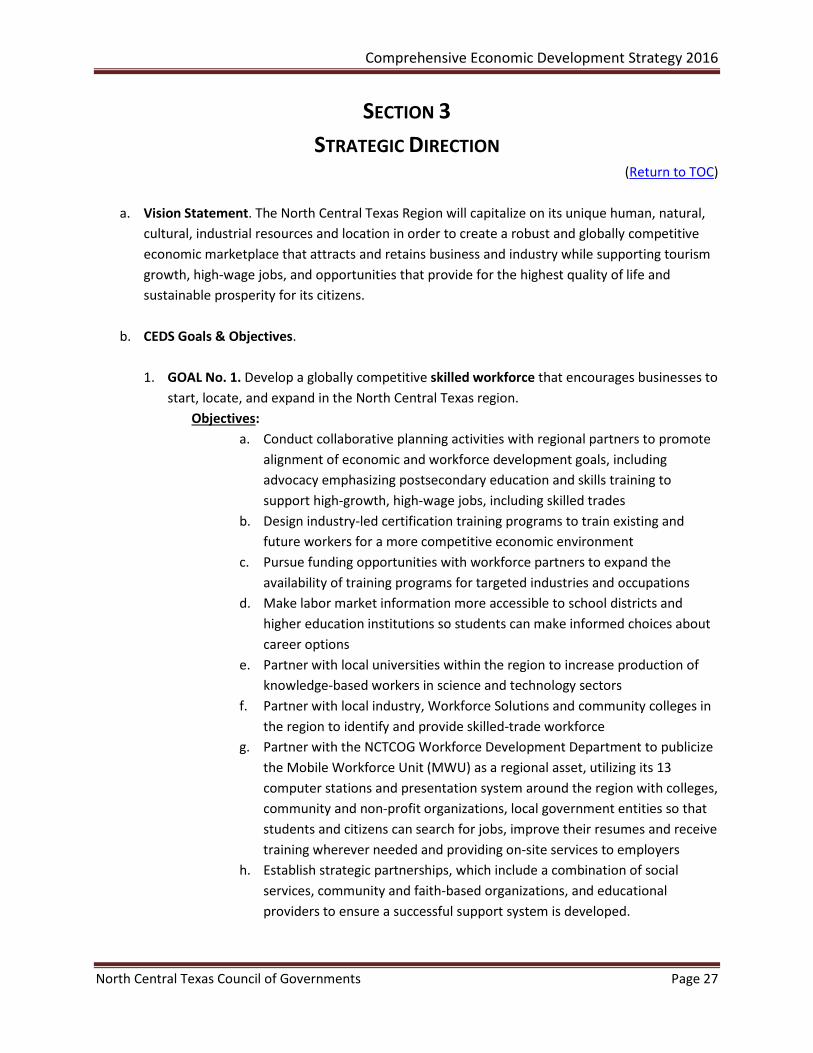
a. Vision Statement. The North Central Texas Region will capitalize on its unique human, natural, cultural, industrial resources and location in order to create a robust and globally competitive economic marketplace that attracts and retains business and industry while supporting tourism growth, high-wage jobs, and opportunities that provide for the highest quality of life and sustainable prosperity for its citizens.
b. CEDS Goals & Objectives.
1. GOAL No. 1. Develop a globally competitive skilled workforce that encourages businesses to
start, locate, and expand in the North Central Texas region. Objectives:
a. Conduct collaborative planning activities with regional partners to promote alignment of economic and workforce development goals, including advocacy emphasizing postsecondary education and skills training to support high-growth, high-wage jobs, including skilled trades
b. Design industry-led certification training programs to train existing and future workers for a more competitive economic environment
c. Pursue funding opportunities with workforce partners to expand the availability of training programs for targeted industries and occupations
d. Make labor market information more accessible to school districts and higher education institutions so students can make informed choices about career options
e. Partner with local universities within the region to increase production of knowledge-based workers in science and technology sectors
f. Partner with local industry, Workforce Solutions and community colleges in the region to identify and provide skilled-trade workforce
g. Partner with the NCTCOG Workforce Development Department to publicize the Mobile Workforce Unit (MWU) as a regional asset, utilizing its 13 computer stations and presentation system around the region with colleges, community and non-profit organizations, local government entities so that students and citizens can search for jobs, improve their resumes and receive training wherever needed and providing on-site services to employers
h. Establish strategic partnerships, which include a combination of social services, community and faith-based organizations, and educational providers to ensure a successful support system is developed.

Comprehensive Economic Development Strategy 2016
North Central Texas Council of Governments Page 28
i. Establish industry-led focus groups to validate career pathways, and required certifications and credentials
2. GOAL No. 2. Enhance the North Central Texas region’s economic competitiveness. Objectives:
a. Support the development of innovation-based industry clusters that create high-wage jobs
b. Help communities implement economic development strategies that grow existing, locally-owned businesses and attract new companies to the North Central Texas Region
c. Support the formation and growth of export-oriented businesses d. Support business attraction and retention efforts of local and regional
economic development entities
3. GOAL No. 3. Pursue opportunities and strategies that continue to make the North Central Texas region an entrepreneur-friendly region.
Objectives: a. Support programs that encourage people of all ages to consider becoming
entrepreneurs b. Encourage and support the development of entrepreneurship education at
the local ISD’s such as Junior Achievement c. Ensure that entrepreneurs and small businesses have access to the
resources they need to start and grow d. Generate awareness about the economic impact of entrepreneurs on the
regional economy e. Support efforts to improve access to capital for entrepreneurs f. Support efforts to improve awareness of, and access to, regional Small
Business Development Centers
4. GOAL No. 4. Explore and promote comprehensive planning solutions to ensure that regional transportation and public infrastructure meets the needs of employers and citizens.
Objectives: a. Coordinate and support NCTCOG Transportation Department’s planning
efforts and personnel activities as the Metropolitan Planning Organization b. Monitor projects included in “Mobility 2035: the Metropolitan
Transportation Plan for North Central Texas” c. Support various transportation planning activities for Dallas Area Rapid
Transit (DART), Denton County Transportation Authority (DCTA) and the Fort Worth Transportation Authority (FWTA)
d. Support the maintenance and growth of aviation infrastructure throughout the NCTCOG region, including in the more rural communities
e. Support creation of regional water/wastewater management strategies

Comprehensive Economic Development Strategy 2016
North Central Texas Council of Governments Page 29
f. Support regional water quality initiatives to accommodate future growth g. Support and coordinate NCTCOG Environment and Development
Department’s efforts to improve infrastructure, reduce costs and maintain economic competitiveness through the Development Excellence program
h. Support and convey watershed initiatives that support strategic conservation of open spaces, provide a network of improved ecosystem benefits, reduce flood risks, provide recreational opportunities and encourage efficient water use
i. Create and implement a master, multi-modal regional transportation infrastructure plan
j. Support local and regional planning efforts including development of integrated community/county land use, transportation, and economic development plans
k. Support local efforts to replace and upgrade aging infrastructure throughout the region
l. Support regional efforts to develop amendments and encourage adoption of building and plumbing codes to reduce costs and provide regional consistency
m. Support and coordinate regional materials management and solid waste initiatives that encourage source reduction and reuse to pro-long the lifespan of existing landfill infrastructure
n. Advocate prioritizing the continued upgrading of critical infrastructure in the rural areas of the North Central Texas region
5. GOAL No. 5. Strengthen the quality of life through comprehensive community development throughout the region.
Objectives: a. Support the Center of Development Excellence and the 12 principles of
Development Excellence, which are a guide to cities, counties, school districts, other public agencies and the private sector as they plan and create future development and redevelopment in the region. The 12 principles are: i. Development Diversity: Meet the needs of changing markets by
providing a mix of development options and land use types in communities throughout the region
ii. Efficient Growth: Promote reinvestment and redevelopment in areas with existing infrastructure, ensure that new infrastructure supports orderly and sustainable growth and provide coordinated regional systems of natural and built infrastructure
iii. Pedestrian Design: Create and connect pedestrian and bicyclist oriented neighborhoods, centers and places throughout the region

Comprehensive Economic Development Strategy 2016
North Central Texas Council of Governments Page 30
iv. Housing Choice: Sustain and facilitate a range of housing opportunities and choices that meets the needs of residents of all economic levels and at all stages of life
v. Activity Centers: Create mixed use developments that are centers of neighborhoods and community activities and serve as hubs of non-automobile transportation systems
vi. Environmental Stewardship: Protect, retain or enhance the region’s important natural assets, including its air, water, land and forests, and integrate these natural features and systems into the character of the region’s communities and the experiences of its residents
vii. Quality Places: Strengthen the identities of the region’s diverse communities through preservation of significant historic structures and natural assets, creation of new landmarks and gathering spaces, use of compatible architectural and landscape design, and support for the activities and institutions that make each community unique
viii. Efficient Mobility Options: Invest in transportation systems, facilities and operations that provide multi-modal choices for the efficient and sustainable movement of people, goods, and services
ix. Resource Efficiency: Design buildings, sites, communities and regional systems to use water, energy, and renewable resources responsibly, effectively and efficiently, and to retain non-renewable resources for the use of future generations
x. Educational Opportunity: Provide opportunities for all North Texans to have access to the schools, people and technology they need for success in learning throughout their lives
xi. Healthy Communities: Identify and support function, sustainable infrastructure and institutions that offer North Texas access to affordable, nutritious foods, opportunities for physical activity, and access to wellness and primary care services
xii. Implementation: Achieve the region’s vision by adoption of compatible comprehensive plans and ordinances for cities and consistent investment plans for regional systems; involve citizens and stakeholders in all aspects of these planning processes
b. Support regional and local efforts to build resilient communities. 6. GOAL No. 6. Integrate emergency management efforts with economic development strategies in order to strengthen regional economic resiliency.
Objectives: a. In a public-private partnership, assess current economic planning efforts,
identify trends and best practices, and provide community-based recommendations to promote and stimulate economic resiliency.

Comprehensive Economic Development Strategy 2016
North Central Texas Council of Governments Page 31
b. Identify critical public infrastructure, including transportation links, electricity, water and sewer, and telecommunications, in order to ensure that public infrastructure is functioning to support rebuilding efforts
c. Develop a workforce resiliency strategy d. Assist local and regional entities in organizing, training and exercising
National Incident Management System (NIMS) to improve emergency response
e. Develop a “clearing house” system to coordinate and facilitate the application for, and administration of, federal and state emergency recovery grants

Comprehensive Economic Development Strategy 2016
North Central Texas Council of Governments Page 32
SECTION 4 ACTION PLAN/EVALUATION FRAMEWORK
(Return to TOC) The North Central Texas Region CEDS will be implemented in a way that aligns closely with other aspects of regional planning, including transportation, environmental protection, workforce development, broadband deployment, and physical infrastructure development. As one of 24 regional planning councils in Texas, NCTCOG engages in air quality monitoring and improvement strategies, disbursement of funding for solid waste mitigation and recycling programs, oversight of Community Development Block Grants (CDBG), and a wide range of other regional activities. NCTCOG’s role as staff for the North Central Texas Economic Development District (NCTEDD) is to provide critical synergy between the CEDS and the region’s broader needs as a growing community. The CEDS will support the State’s economic development priorities through assistance provided to local governments in the North Central Texas Area region. The State of Texas has identified six targeted industry clusters for development: advanced technologies and manufacturing, aerospace and defense, biotechnology and life sciences, information and computer technology, petroleum refining and chemical products, and energy. NCTCOG’s assistance to communities in the region can include helping local officials identify opportunities for growing industries that correspond to the State’s targeted clusters. NCTCOG can also serve as an intermediary for disseminating leads generated by state economic development staff and helping communities respond to opportunities where appropriate. Performance Measures. NCTCOG will use the following performance measures to evaluate its CEDS during 2016-2021 timeframe:
1. Competitive Workforce — (Goal No. 1)
• Number of Skills Development Fund grants, as well as dollar amounts awarded to local businesses through regional community colleges
• Number of credentials and associate, bachelors, masters and Ph.D. degrees awarded by higher education in the NCTCOG region
• Number of events the Mobile Workforce Unit will be utilized allowing workforce services to be provided on-site to employers and communities
• Number of people receiving job training in the region reported by the Workforce Solutions
• Number of industry-sector workforce-development strategies developed

Comprehensive Economic Development Strategy 2016
North Central Texas Council of Governments Page 33
2. Economic Competitiveness — (Goal No. 2) • Number of jobs created, as well as retained, in the NCTCOG region • Amount of new private investment in the region • Number of business formations and expansions in the region • Amount of research expenditures by universities in the NCTCOG region as tracked by
the National Science Foundation 3. Entrepreneur-Friendly — (Goal No. 3)
• Number and amount of SBA loans processed through regional SBDCs • Number of new business start-ups assisted through regional SBDCs and SBA SCORE
offices • Number of SBDC business start-up classes held and number of attendees • University technology transfer (number of patents issued, and licenses consummated;
amount of licensing income and number of commercial products produced and sold) • University entrepreneur programs — number of Entrepreneurship degrees (bachelors,
masters, Ph.D.) awarded), as well as minors and/or certificates in entrepreneurship • Start-ups spun out from universities in the region • Small Business Innovation Research (SBIR) and Small Business Technology Transfer
(STTR) federal grants • Number of banks in the region that are SBA lenders • Number of K-12 students receiving Junior Achievement training in entrepreneurship
4. Transportation & public infrastructure — (Goal No. 4)
• Amount of CDBG infrastructure grants awarded • New lane miles added to regional highways • New passenger rail miles added to the regional network • Decrease in the amount of congestion according to the Texas Transportation Institute’s
Congestion Index • Dollar amount of TXDOT Aviation Capital Improvement Program monies invested in the
region, in addition to the amount of local matching dollars required • Number of commercial air passengers, as well as air cargo tonnage, arriving and
departing airports located in the NCTCOG region • Amount of private sector investment in rail infrastructure, including intermodal facilities • Number or total of State or Federally funded grants to improve/upgrade water and
wastewater systems • Number of new water projects developed for recreation, consumption, flood control • Decrease in per capita disposal rates in landfills • Number of local governments that adopted the most current building and plumbing
codes; number of local governments that adopted NCTCOG Regional Amendments
5. QOL & community development — (Goal No. 5) • Number of mixed use/walkable developments and activity centers

Comprehensive Economic Development Strategy 2016
North Central Texas Council of Governments Page 34
• Number of miles of planned, built, and funded pedestrian/bicycle trails • Number of trail miles developed • Number of Affordable housing units added to region • Number of new local and regional parks and recreation facilities developed • Number of air-quality ozone exceedance days • Number of communities adopting water-efficient landscaping practices and using Texas
SmartScape • Number of renewable energy projects in the region • Amount of energy produced by renewable energy projects • High-school graduation rates and number of Science, Technology, Engineering, and
Mathematics programs • Number of regional hospitals as well as hospitals and clinics added in rural communities
with a population under 25,000 • Number of services funded for affordable transportation to healthcare related activities
and aging-in-place programs • Number of case studies collected that demonstrate the 12 Principles through
implementable policies, programs, and projects
6. Economic Resilience • Identify an office or team tasked with managing economic incident response
and/or recovery • Identify points of integration with other planning efforts in the community (i.e.,
land use plans, hazard mitigation plans, etc.). • Participate in regional or state planning processes for economic resilience as part
of a separate economic planning initiative or as part of mitigation or preparedness planning efforts
• Integrate with other relevant regional, state, and federal economic response and recovery entities
• Identify resources for economic disaster response and recovery for public and private sector Services
• Identify local funding or grant---making mechanisms for post---disaster small business financing and financial program management
• Develop a strategy or plan for rapid return of utilities following a disaster • Develop a strategy for alternate transportation routes and logistics for economic
activity.
7. Miscellaneous • Number of people receiving training on economic development at NCTCOG workshops • Number of requests for assistance completed for communities in the region • Number of visitors to asset map and information clearinghouse on NCTCOG website • Number of presentations on economic development given in the region

Comprehensive Economic Development Strategy 2016
North Central Texas Council of Governments Page 35
Once NCTCOG has been designated as an Economic Development District (EDD), annual progress on the CEDS performance measures will be reported on the Government Performance and Results Act (GPRA) form submitted to EDA, as well as on the NCTCOG website.

Comprehensive Economic Development Strategy 2016
North Central Texas Council of Governments Page 36
.
SECTION 5 RESOURCES
(Return to TOC)
1. Strategic Plan for the North Central Texas www.nctcog.org/edo/stratplan Council of Governments: 2015-2020
2. U.S. Census Bureau www.census.gov 3. American Community Survey www.census.gov/programs-surveys/acs 4. American Factfinder www.factfinder.census.gov 5. U.S. Department of Labor www.bls.gov 6. Texas State Data Center www.txsdc.utsa.edu 7. Texas LMCI Tracer www.tracer2.com 8. Texas Workforce Commission www.twc.state.tx.us 9. Texas Industry Profiles www.texasindustryprofiles.com 10. North Central Texas Council of Governments www.nctcog.org 11. Workforce Solutions North Central Texas www.dfwjobs.com 12. State and County Quick Facts www.quickfacts.census.gov 13. Labor, Market and Career Information www.tracer2.com 14. StatsAmerica www.statsamerica.org 15. Federal Reserve Bank of Dallas www.dallasfed.org 16. Dallas Regional Chamber www.dallaschamber.org

Comprehensive Economic Development Strategy 2016
North Central Texas Council of Governments Page 37
APPENDIX A
POPULATION
Appendix A includes charts on the following topics:
• Historic Population & Projected Growth Rates • Diversity, Race and Ethnicity • Age Distribution • Commute to Work Patterns
Table 1 — Population & Growth
County 2000 2010 2013 2018 2030 Change
2000-13 Change 2013-18
Change 2010-30
Collin 491,675
782,341 854,036 935,596 1,211,461 73.7% 9.5% 54.9% Dallas 2,218,899 2,368,139 2,459,095 2,571,089 2,859,701 10.8% 4.6% 20.8%
Denton 432,976
662,614 721,022 788,272 1,014,812 66.5% 9.3% 53.2%
Ellis 111,360
149,610 155,939 172,756 213,832 40.0% 10.8% 42.9%
Erath 33,001
37,890 39,862 40,178 44,495 20.8% 0.8% 17.4%
Hood 41,100
51,182 53,022 54,773 59,479 29.0% 3.3% 16.2%
Hunt 76,596
86,129 88,451 93,767 107,574 15.5% 6.0% 24.9%
Johnson 126,811
150,934 157,201 168,379 198,761 24.0% 7.1% 31.7%
Kaufman 71,313
103,350 108,298 122,826 158,947 51.9% 13.4% 53.8%
Navarro 45,124
47,735 49,245 51,890 58,575 9.1% 5.4% 22.7%
Palo Pinto 27,026
28,111 28,568 30,104 32,955 5.7% 5.4% 17.2%
Parker 88,495
116,927 121,178 133,826 163,780 36.9% 10.4% 40.1%
Rockwall 43,080
78,337 85,050 93,466 120,573 97.4% 9.9% 53.9%
Somervell 6,809
8,490 8,674 9,261 10,670 27.4% 6.8% 25.7%
Tarrant 1,446,219 1,809,034 1,910,975 1,992,718 2,287,581 32.1% 4.3% 26.5%
Wise 48,793
59,127 61,558 66,195 78,265 26.2% 7.5% 32.4%
NCTCOG Region 5,309,277 6,539,950 6,902,174 7,325,096 8,621,461 30.0% 6.1% 31.8%

Comprehensive Economic Development Strategy 2016
North Central Texas Council of Governments Page 38
Appendix A (continued)
Table 2 — Race/Ethnicity Percentages
County Population White Black/African-American
American Indian Asian Pacific
Islander
Hispanic or
Latino
Not Hispanic or Latino
Collin 782,341 75.0 9.4% 0.7% 12.3% 0.1% 15.0% 85.0%
Dallas 2,368,139 68.3 23.1% 1.1% 5.7% 0.1% 39.0% 61.0%
Denton 662,614 79.9 9.4% 0.9% 7.3% 0.1% 18.9% 81.1%
Ellis 149,610 87.4 9.4% 0.8% 0.7% 0.1% 24.6% 75.4%
Erath 37,890 94.8 1.6% 1.4% 0.8% 0.1% 20.2% 79.8%
Hood 51,182 96.3 0.8% 1.0% 0.7% 0.1% 11.2% 88.8%
Hunt 86,129 87.1 8.4% 1.2% 1.2% 0.2% 14.6% 85.4%
Johnson 150,934 93 3.1% 1.0% 0.8% 0.5% 19.4% 80.6%
Kaufman 103,350 85.5 10.7% 1.0% 1.1% 0.1% 18.8% 81.2%
Navarro 47,735 81.6 14.0% 1.1% 0.8% 0.8% 25.2% 74.8%
Palo Pinto 28,111 94.4 2.4% 0.9% 0.7% 0.1% 19.6% 80.4%
Parker 116,927 94.7 2.0% 0.9% 0.7% 0.1% 11.2% 88.8%
Rockwall 78,337 88.5 6.1% 0.7% 2.7% 0.1% 16.7% 83.3%
Somervell 8,490 94.5 1.2% 1.3% 0.9% 0.1% 19.1% 80.9%
Tarrant 1,809,034 75.7 15.9% 0.9% 0.9% 0.2% 27.6% 72.4%
Wise 59,127 95.5 1.5% 1.0% 0.5% 0.1% 18.2% 81.8%
NCTCOG Region
6,539,950
75.4%
15.7%
1.0%
4.7%
0.1%
28.0%
72.0%
SOURCE: Statsamerica.org

Comprehensive Economic Development Strategy 2016
North Central Texas Council of Governments Page 39
Appendix A (continued)
Table 3 — Age Distribution County Population 0-14 15-19 20-34 35-54 55-64 65-74 75 & Over
Collin 782,341 24.2% 6.9% 18.8% 32.3% 10.0% 5.3% 2.9% Dallas 2,368,139 23.1% 7.0% 23.4% 27.7% 9.8% 5.1% 3.9% Denton 662,614 22.7% 7.1% 22.5% 30.7% 9.5% 4.8% 2.6% Ellis 149,610 23.3% 7.9% 18.5% 28.3% 11.4% 6.4% 4.1% Erath 37,890 17.8% 10.2% 26.4% 22.3% 10.2% 7.0% 6.0% Hood 51,182 17.6% 5.3% 14.9% 24.7% 15.2% 12.9% 9.3% Hunt 86,129 20.3% 7.2% 18.8% 27.0% 12.4% 8.4% 6.0% Johnson 150,934 22.2% 7.2% 18.7% 28.1% 11.7% 7.3% 4.7% Kaufman 103,350 23.6% 7.3% 18.3% 28.7% 11.3% 8.6% 6.1% Navarro 47,735 22.1% 7.8% 17.2% 26.0% 12.2% 8.6% 6.1% Palo Pinto 28,111 20.4% 6.6% 16.7% 26.1% 13.3% 10.1% 6.9% Parker 116,927 25.4% 8.1% 19.7% 24.7% 10.0% 6.8% 5.4% Rockwall 78,337 24.1% 7.6% 16.7% 30.6% 10.7% 6.5% 3.8% Somervell 8,490 19.4% 8.8% 15.9% 26.7% 13.2% 9.1% 6.9% Tarrant 1,809,034 23.2% 7.1% 21.5% 28.5% 10.3% 5.4% 3.9% Wise 59,127 21.1% 7.2% 30.5% 28.6% 12.5% 8.1% 4.9%
NCTCOG Region
6,539,950
23.1%
7.1%
21.7%
28.7%
10.2%
5.6%
3.9% SOURCE: U.S. Census Bureau, 2013 5-Year American Community Survey
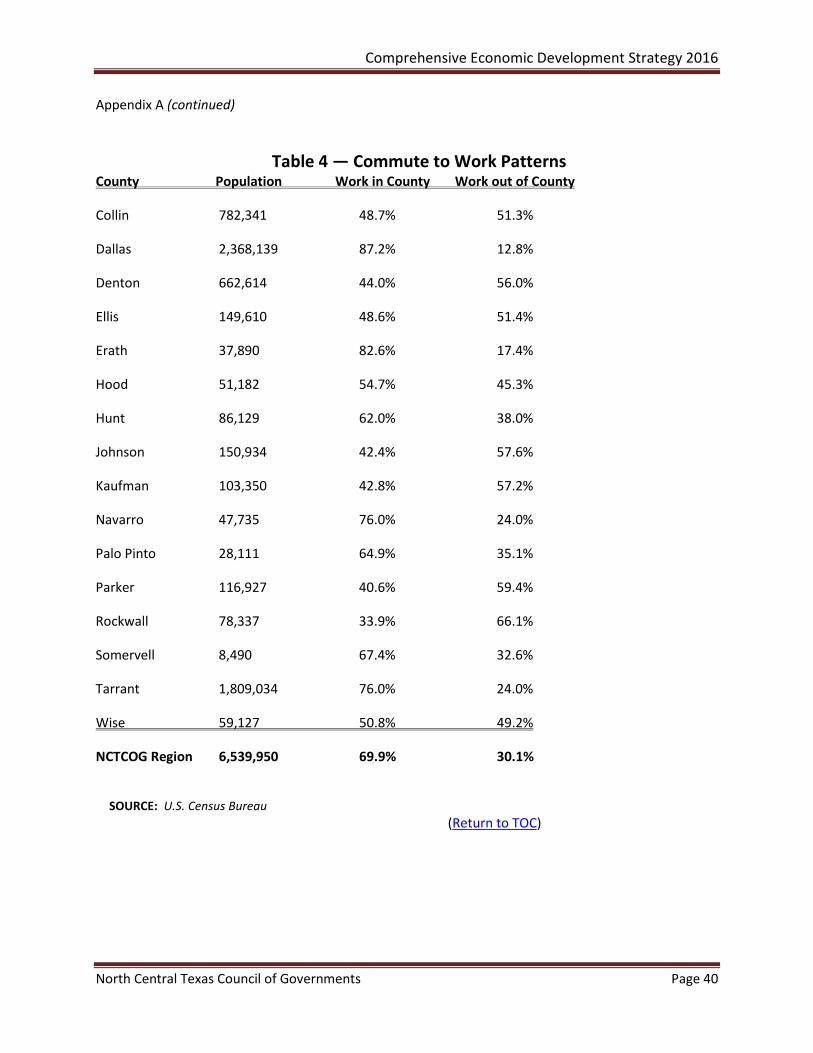
Comprehensive Economic Development Strategy 2016
North Central Texas Council of Governments Page 40
Appendix A (continued)
Table 4 — Commute to Work Patterns County Population Work in County Work out of County
Collin 782,341 48.7% 51.3%
Dallas 2,368,139 87.2% 12.8%
Denton 662,614 44.0% 56.0%
Ellis 149,610 48.6% 51.4%
Erath 37,890 82.6% 17.4%
Hood 51,182 54.7% 45.3%
Hunt 86,129 62.0% 38.0%
Johnson 150,934 42.4% 57.6%
Kaufman 103,350 42.8% 57.2%
Navarro 47,735 76.0% 24.0%
Palo Pinto 28,111 64.9% 35.1%
Parker 116,927 40.6% 59.4%
Rockwall 78,337 33.9% 66.1%
Somervell 8,490 67.4% 32.6%
Tarrant 1,809,034 76.0% 24.0%
Wise 59,127 50.8% 49.2%
NCTCOG Region 6,539,950 69.9% 30.1%
SOURCE: U.S. Census Bureau
(Return to TOC)

Comprehensive Economic Development Strategy 2016
North Central Texas Council of Governments Page 41
APPENDIX B
EDUCATIONAL ATTAINMENT
Appendix B includes charts on adult (over age of 25) educational attainment, by degree level.
Table 1 — Adult Educational Attainment (Highest Level)
County Population No HS Diploma
HS Diploma
Only
1-3 Years of
College
Associate Degree
Bachelor’s Degree
Graduate Degree
Bachelor’s or
Advanced Degree
Collin
782,341 6.6% 15.7% 21.1% 7.4% 32.7% 16.6% 49.3%
Dallas
2,368,139 22.6% 23.0% 20.2% 5.5% 18.4% 10.1% 28.5%
Denton
662,614 8.2% 19.0% 24.3% 8.0% 28.0% 12.5% 40.5%
Ellis
149,610 16.3% 30.0% 25.9% 7.1% 14.4% 6.3% 20.7%
Erath
37,890 18.1% 27.4% 24.7% 5.5% 17.3% 7.0% 24.3%
Hood
51,182 12.9% 29.1% 27.7% 6.2% 16.2% 7.9% 24.1%
Hunt
86,129 12.2% 34.4% 23.9% 6.9% 10.9% 5.8% 16.7%
Johnson
150,934 16.9% 33.1% 26.5% 6.9% 11.9% 4.8% 16.7%
Kaufman
103,350 17.5% 31.2% 27.3% 6.4% 12.5% 5.1% 17.6%
Navarro
47,735 21.4% 32.9% 22.5% 6.7% 11.9% 4.6% 16.5%
Palo Pinto
28,111 20.6% 35.6% 24.2% 4.5% 9.8% 5.3% 15.1%
Parker
116,927 11.9% 27.0% 28.3% 7.8% 17.4% 7.6% 25.0%
Rockwall
78,337 8.8% 22.3% 25.0% 7.4% 25.1% 11.4% 36.5%
Somervell
8,490 15.6% 25.0% 20.9% 9.5% 21.4% 7.6% 29.0%
Tarrant
1,809,034 15.5% 23.9% 24.5% 6.7% 20.3% 9.1% 29.4%
Wise
59,127 16.2% 37.1% 25.2% 5.4% 12.4% 3.8% 16.2%
NCTCOG Region 6,539,950 16.2% 23.0% 22.7% 6.5% 21.1% 10.3% 31.4%
SOURCE: 2013 U. S. Census Bureau 5-Year American Community Survey
(Return to TOC)

Comprehensive Economic Development Strategy 2016
North Central Texas Council of Governments Page 42
APPENDIX C
INCOME
Appendix C includes charts on the following topics:
o Median Household Income o Average Annual Income o Household Income Distribution
Table 1 — Median Household Income County Population 2000 2013 2018 Change
'13 - '18
Collin 782,341 $ 70,887 $ 85,079 $ 105,040 23.5% Dallas 2,368,139 $ 43,617 $ 48,100 $ 53,810 11.9% Denton 662,614 $ 58,500 $ 72,359 $ 84,379 16.6% Ellis 149,610 $ 50,426 $ 61,711 $ 71,568 16.0% Erath 37,890 $ 30,803 $ 40,220 $ 48,877 21.5% Hood 51,182 $ 43,763 $ 53,341 $ 63,395 18.8% Hunt 86,129 $ 36,909 $ 46,178 $ 50,808 10.0% Johnson 150,934 $ 44,680 $ 56,633 $ 66,399 17.2% Kaufman 103,350 $ 44,818 $ 60,875 $ 70,754 16.2% Navarro 47,735 $ 31,401 $ 40,129 $ 47,917 19.4% Palo Pinto 28,111 $ 31,261 $ 38,532 $ 45,983 19.3% Parker 116,927 $ 45,595 $ 63,382 $ 77,571 22.4% Rockwall 78,337 $ 65,438 $ 86,218 $ 129,385 50.1% Somervell 8,490 $ 39,138 $ 47,850 $ 53,128 11.0% Tarrant 1,809,034 $ 46,246 $ 54,442 $ 63,303 16.3% Wise 59,127 $ 42,315 $ 58,249 $ 68,636 17.8%
NCTCOG Region 6,539,950 $ 49,289 $ 58,138 $ 68,019 17.0%
SOURCE: NCT Workforce Solutions: Demographics Now

Comprehensive Economic Development Strategy 2016
North Central Texas Council of Governments Page 43
Appendix C (continued)
Table 2 — Average Annual Income County Population 2000 2013 2018 Change
'13 - '18
Collin 782,341 $ 89,992 $ 112,690 $ 135,026 19.8% Dallas 2,368,139 $ 61,370 $ 74,450 $ 82,078 10.2% Denton 662,614 $ 72,380 $ 95,697 $ 109,105 14.0% Ellis 149,610 $ 60,199 $ 77,390 $ 87,518 13.1% Erath 37,890 $ 42,418 $ 56,988 $ 68,381 20.0% Hood 51,182 $ 56,037 $ 75,394 $ 87,696 16.3% Hunt 86,129 $ 46,305 $ 61,048 $ 65,804 7.8% Johnson 150,934 $ 52,873 $ 70,897 $ 81,439 14.9% Kaufman 103,350 $ 54,258 $ 74,302 $ 84,444 13.6% Navarro 47,735 $ 41,440 $ 55,469 $ 64,167 15.7% Palo Pinto 28,111 $ 39,121 $ 52,644 $ 61,026 15.9% Parker 116,927 $ 56,794 $ 84,649 $ 97,361 15.0% Rockwall 78,337 $ 83,856 $ 110,041 $ 129,385 17.6% Somervell 8,490 $ 49,289 $ 65,244 $ 71,433 9.5% Tarrant 1,809,034 $ 60,085 $ 76,368 $ 86,323 13.0% Wise 59,127 $ 49,887 $ 71,225 $ 82,302 15.6% NCTCOG Region 6,539,950 $ 64,696 $ 81,756 $ 92,829 13.5%
SOURCE: North Central Texas Workforce Solutions: Demographics Now

Comprehensive Economic Development Strategy 2016
North Central Texas Council of Governments Page 44
Appendix C (continued)
Table 3 — Household Income Distribution (2013)
County Total HH Less than $35,000 $35,000 to $74,999 Greater Than $75,000
No. Percent No. Percent No. Percent
Collin
289,752
53,215 18.4%
78,652 27.1%
157,885 54.5%
Dallas
858,332
305,465 35.6%
284,092 33.1%
268,775 31.3%
Denton
243,394
51,303 21.1%
71,709 29.5%
120,385 49.5%
Ellis
51,016
13,466 26.4%
16,894 33.1%
20,656 40.5%
Erath
14,383
6,585 45.8%
4,496 31.3%
3,302 23.0%
Hood
20,758
6,291 30.3%
7,328 35.3%
7,139 34.4%
Hunt
30,756
12,233 39.8%
10,032 32.6%
8,491 27.6%
Johnson
52,044
14,153 27.2%
19,175 36.8%
18,716 36.0%
Kaufman
34,922
9,699 27.8%
11,620 33.3%
13,603 39.0%
Navarro
17,466 7,497 42.9%
5,933 34.0%
4,036 23.1%
Palo Pinto
10,491
4,470 42.6% 5,933 34.0%
2,723 26.0%
Parker
42,322
11,681 27.6%
12,104 28.6%
18,537 43.8%
Rockwall
26,820
4,222 15.7%
7,200 26.8%
15,398 57.4%
Somervell
3,193
928 29.1%
1,062 33.3%
1,203 37.7%
Tarrant
659,736
201,191 30.5%
214,126 32.5%
244,419 37.0%
Wise
20,487
5,577 27.2%
7,472 36.5%
7,438 36.3%
NCTCOG Region 2,375,872 707,976 29.8% 755,193 31.8% 912,706 38.4%
SOURCE: U.S. Census Bureau
(Return to TOC)

Comprehensive Economic Development Strategy 2016
North Central Texas Council of Governments Page 45
APPENDIX D
EMPLOYMENT & UNEMPLOYMENT HISTORY
This section will include charts on the following topics:
o Average Annual Unemployment in 2014 o Average Annual Unemployment in 2010 o Average Annual Unemployment in 2000
Table 1 — Average Annual Unemployment (2014)
County 2014
Labor Force Employed Unemployed Unemployment Rate
Collin 471,554 450,277 21,277 4.5% Dallas 1,268,571 1,200,663 67,908 5.4% Denton 412,700 394,540 18,160 4.4% Ellis 79,731 75,854 3,877 4.9% Erath 20,223 19,376 847 4.2% Hood 24,400 23,215 1,185 4.9% Hunt 39,024 36,780 2,244 5.8% Johnson 74,914 71,185 3,729 5.0% Kaufman 53,886 51,141 2,745 5.1% Navarro 23,435 22,207 1,228 5.2% Palo Pinto 13,450 12,763 687 5.1% Parker 59,755 57,047 2,708 4.5% Rockwall 43,404 41,469 1,935 4.5% Somervell 4,221 4,009 212 5.0% Tarrant 998,520 948,786 49,734 5.0% Wise 28,873 27,486 1,387 4.8% NCTCOG Region 3,616,661 3,436,798 179,863 5.0%
SOURCE: Texas LMCI Tracer

Comprehensive Economic Development Strategy 2016
North Central Texas Council of Governments Page 46
Appendix D (continued)
Table 2 — Average Annual Unemployment (2010)
County 2010
Labor Force Employed Unemployed Unemployment Rate
Collin 425,252 394,597 30,655 7.2%
Dallas 1,194,015 1,091,493 102,522 8.6%
Denton 369,088 342,972 26,116 7.1%
Ellis 75,674 69,611 6,063 8.0%
Erath 20,499 19,179 1,320 6.4%
Hood 23,352 21,363 1,989 8.5%
Hunt 38,128 37,732 3,394 8.9%
Johnson 71,940 65,703 6,237 8.7%
Kaufman 50,807 46,496 4,311 8.5%
Navarro 22,776 20,878 1,898 8.3%
Palo Pinto 13,254 12,111 1,143 8.6%
Parker 56,408 52,113 4,295 7.6%
Rockwall 39,439 36,524 2,915 7.4%
Somervell 4,043 3,721 322 8.0%
Tarrant 924,951 849,576 73,375 7.9%
Wise 27,668 5,269 2,399 8.7%
NCTCOG Region
3,357,294 3,069,338 268,954 8.0%
SOURCE: Texas LMCI Tracer

Comprehensive Economic Development Strategy 2016
North Central Texas Council of Governments Page 47
Appendix D (continued)
Table 3 — Average Annual Unemployment (2000)
County 2000
Labor Force Employed Unemployed Unemployment Rate
Collin 300,048 291,653 8,395 2.8%
Dallas 1,187,494 1,142,138 43,356 3.7%
Denton 267,721 260,275 7,446 2.8%
Ellis 60,192 58,069 2,123 3.5%
Erath 16,598 16,001 597 3.6%
Hood 20,324 19,527 797 3.9%
Hunt 38,897 37,275 1,622 4.2%
Johnson 66,490 64,001 2,489 3.7%
Kaufman 37,629 36,121 1,508 4.0%
Navarro 21,126 20,083 1,043 4.9%
Palo Pinto 13,357 12,809 548 4.1%
Parker 46,358 44,720 1,638 3.5%
Rockwall 24,320 23,596 724 3.0%
Somervell 3,465 3,323 142 4.1%
Tarrant 794,779 766,783 27,996 3.5%
Wise 25,344 24,477 867 3.4%
NCTCOG Region
2,924,142 2,820,851 101,291 3.5%
SOURCE: Texas LMCI Tracer
(Return to TOC)

Comprehensive Economic Development Strategy 2016
North Central Texas Council of Governments Page 48
APPENDIX E
COMMUNITY COLLEGES & INDEPENDENT SCHOOL DISTRICTS
The following is a list of community colleges and independent school districts servicing each of the counties in the NCTCOG region:
• Collin County: o Community College – Collin College o ISDs – There are 22 ISDs serving Collin County: Allen ISD, Anna ISD, Bland ISD,
Blue Ridge ISD, Celina ISD, Community ISD, Farmersville ISD, Frisco ISD, Gunter ISD, Leonard ISD, Lovejoy ISD, McKinney ISD, Melissa ISD, Plano ISD, Princeton ISD, Prosper ISD, Royse City ISD, Trenton ISD, Van Alstyne ISD, Westminster ISD, Whitewright ISD and Wylie ISD.
• Dallas County: o Community College – Dallas County Community College District (Brookhaven
College, Cedar Valley College, Eastfield College, El Centro College, Mountain View College, North Lake College and Richland College)
o ISDs – There are 17 ISDs serving Dallas County: Carrollton-Farmers Branch ISD, Cedar Hill ISD, Coppell ISD, Dallas ISD, DeSoto ISD, Duncanville ISD, Ferris ISD, Garland ISD, Grand Prairie ISD, Grapevine-Colleyville ISD, Highland Park ISD, Irving ISD, Lancaster ISD, Mesquite ISD, Richardson ISD, Sunnyvale ISD, and Wilmer-Hutchins ISD.
• Denton County: o Community College – North Central Texas College o ISDs – There are 17 ISDs serving Denton County: Argyle ISD, Aubrey ISD,
Carrollton-Farmers Branch ISD, Celina ISD, Denton ISD, Era ISD, Frisco ISD, Krum ISD, Lake Dallas ISD, Lewisville ISD, Little Elm ISD, Northwest ISD, Pilot Point ISD, Ponder ISD, Prosper ISD, Sanger ISD, and Slidell ISD.
• Ellis County: o Community College – Navarro College o ISDs – There are 11 ISDs serving Ellis County: Avalon ISD, Ennis ISD, Ferris ISD,
Frost ISD, Italy ISD, Maypearl ISD, Midlothian ISD, Milford ISD, Palmer ISD, Red Oak ISD and Waxahachie ISD.
• Erath County: o Community College – Ranger College

Comprehensive Economic Development Strategy 2016
North Central Texas Council of Governments Page 49
o ISDs – There are 14 ISDs serving Erath County: Bluff Dale ISD, De Leon ISD, Dublin ISD, Gordon ISD, Hico ISD, Huckabay ISD, Iredell ISD, Lingleville ISD, Lipan ISD, Morgan Mill ISD, Santo ISD, Stephenville ISD, Strawn ISD and Three Way ISD.
• Hood County: o Community College – Weatherford College o ISDs – There are six ISDs serving Hood County: Bluff Dale ISD, Glen Rose ISD,
Godley ISD, Granbury ISD, Lipan ISD and Tolar ISD.
• Hunt County: o Community College – Paris Junior College o ISDs – There are 17 ISDs serving Hunt County: Bland ISD, Boles ISD, Caddo Mills
ISD, Campbell ISD, Celeste ISD, Commerce ISD, Community ISD, Cooper ISD, Cumby ISD, Fannindel ISD, Greenville ISD, Leonard ISD, Lone Oak ISD, Quinlan ISD, Royse City ISD, Terrell ISD and Wolfe City ISD.
• Johnson County: o Community College – Hill College o ISDs – There are 12 ISDs serving Johnson County: Alvarado ISD, Burleson ISD,
Cleburne ISD, Crowley ISD, Godley ISD, Granbury ISD, Grandview ISD, Joshua ISD, Keene ISD, Mansfield ISD, Rio Vista ISD, and Venus ISD.
• Kaufman County: o Community College – Trinity Valley Community College o ISDs – There are 10 ISDs serving Kaufman County: Crandall ISD, Forney ISD,
Kaufman ISD, Kemp ISD, Mabank ISD, Quinlan ISD, Rockwall ISD, Scurry-Rosser ISD, Terrell ISD, and Wills Point ISD.
• Navarro County: o Community College – Navarro College o ISDs – There are 12 ISDs serving Navarro County: Blooming Grove ISD, Bynum
ISD, Corsicana ISD, Dawson ISD, Ennis ISD, Fairfield ISD, Frost ISD, Hubbard ISD, Kerens ISD, Mildred ISD, Rice ISD and Wortham ISD.
• Palo Pinto County: o Community College – Weatherford College o ISDs – There are 8 ISDs serving Palo Pinto County: Gordon ISD, Graford ISD,
Lipan ISD, Millsap ISD, Mineral Wells ISD, Palo Pinto ISD, Santo ISD and Strawn ISD.

Comprehensive Economic Development Strategy 2016
North Central Texas Council of Governments Page 50
• Parker County: o Community College – Weatherford College o ISDs – There are 14 ISDs serving Parker County: Aledo ISD, Azle ISD, Brock ISD,
Garner ISD, Granbury ISD, Lipan ISD, Millsap ISD, Mineral Wells ISD, Peaster ISD, Perrin-Whitt Consolidated ISD, Poolville ISD, Santo ISD, Springtown ISD, and Weatherford ISD.
• Rockwall County: o Community College – Collin College o ISDs – There are two ISDs serving Rockwall County: Rockwall ISD and Royse City
ISD.
• Somervell County: o Community College – Hill College o ISDs – There are four ISDs serving Somervell County: Glen Rose ISD, Granbury
ISD, Three Way ISD and Walnut Springs ISD.
• Tarrant County: o Community College – Tarrant County College o ISDs – There are 21 ISDs serving Tarrant County: Aledo ISD, Arlington ISD, Azle
ISD, Birdville ISD, Burleson ISD, Carroll ISD, Castleberry ISD, Crowley ISD, Eagle Mountain-Saginaw ISD, Everman ISD, Fort Worth ISD, Godley ISD, Grapevine-Colleyville ISD, Hurst-Euless-Bedford ISD, Keller ISD, Kennedale ISD, Lake Worth ISD, Mansfield ISD, Masonic Home ISD, Northwest ISD, and White Settlement ISD.
• Wise County: o Community College – Weatherford College o ISDs – There are 13 ISDs serving Wise County: Alvord ISD, Azle ISD, Boyd ISD,
Bridgeport ISD, Chico ISD, Decatur ISD, Jacksboro ISD, Krum ISD, Northwest ISD, Paradise ISD, Poolville ISD, Slidell ISD, and Springtown ISD.
(Return to TOC)

Comprehensive Economic Development Strategy 2016
North Central Texas Council of Governments Page 51
APPENDIX F
SWOT ANALYSIS BY GEOGRAPHIC CLUSTER
The CEDS Committee, because of the diverse nature of the North Central Texas region, organized itself into five sub-regional clusters based on geography, as well as one functional cluster – higher education. Each cluster then performed a SWOT analysis of their sub-region or function.
SWOT ANALYSIS BY CLUSTER — CLUSTER 1
Cluster 1 includes the following counties: Wise, Palo Pinto and Parker.
The Ellis, Johnson, Navarro Cluster met on April 20, 2015, in Decatur to develop a “SWOT” analysis as part of the overall CEDS effort. Attendees included: Ida Mae Burnett, Decatur EDC; Jesica McEachern, City of Bridgeport; Janie Tucknies, City of Runaway Bay; Jim Stegall, Workforce/Private Industry; J.D. Clark, Wise County; and Mary Poche’, Decatur EDC.
A recap of the meeting follows.
STRENGTHS • Major thoroughfare 287, 380, I35, I20, 114 – major roads lead through the Counties • Regional Health System • Education • Oil and gas (infrastructure is in place) • Quarries • Tourism (state parks, trails) • Inexpensive land (but have pipelines crossing it) • Workforce (strong workforce, experienced, skills in demand) • Cowboy culture (sustainable culture) • Rich history (oil & gas, stagecoach capital, Chisholm Trails)

Comprehensive Economic Development Strategy 2016
North Central Texas Council of Governments Page 52
• Cities are established • Low cost of living • Weatherford College • Competitive location • Proximity to airports and the Metroplex • Regional Health care hub • Good Main Street Centers • Volunteerism • Grasslands • Livability
WEAKNESS
• Pricing of land • Lack of available technology • Telecommunications/Fiber infrastructure • Transportation infrastructure within • Industrial Infrastructure • Online shopping (loss of sales tax) • Shortage of affordable housing for young families
OPPORTUNITIES
• Opportunity for some companies to put fiber optics in the ground making the area more attractive for younger
• Opportunity for more education • Professional Bull Riders Association (PBR) – more work with them (promotional) • More outdoor opportunities needed for younger families
THREATS
• Online retail (erodes sales tax base) • Highs and lows of decreasing lake level • Type of broadband available – not stable enough for usage needed • Gaps in affordable housing • Younger generation – wants & needs & lack of being able to reach them • Oil & gas industry dependence • Outmigration of the population
INDUSTRY RANKING FROM SURVEY:
• Infrastructure #s 2, 8, 10, 20, 23 • Economy Retail (by itself) #7 • Economy Tourism #47 • Economy #s 12, 13, 21, 49 • Education #s 1, 5, 6, 9, 41 • Intergovernmental Coordination #s 15, 18 • Water Quality and Conservation #s 3, 4
Appendix F (continued)

Comprehensive Economic Development Strategy 2016
North Central Texas Council of Governments Page 53
SWOT ANALYSIS BY CLUSTER — CLUSTER 2
Cluster 2 includes the following counties: Erath, Hood and Somervell.
The Erath-Hood-Somervell Cluster met on October 30, 2014 in Granbury to develop a “SWOT” analysis as part of the overall CEDS effort. Attendees included: Warren Ketteman, Granbury EDC and Cluster Chair; Danny Chambers, Somervell County; Mike Ford, Somervell County; Kenny Weldon, City of Stephenville; Darrell Cockerham, Hood County; Jack Thompson, Orasi & CEDS Chair; Bob Hart, City of Kennedale City Manager/UTA Class Adjunct Professor; and Salvador Portillo, UTA MPA Student and COG/Cluster 2 Liaison.
A recap of the meeting follows:
STRENGTHS Identified Key Clusters:
• Tourism — extensive cultural, leisure and entertainment options • Rural - High quality of life • Strong local identity • Oil/Gas - machinery manufacturing for industry (Stephenville). • Agriculture - Rodeo program (Stephenville) • Rural - opportunity for future growth (land development/land prices) • Comanche Peak Power Plant- Glen Rose, TX • Education- Home to Tarleton State College • Highly educated population • Existence of a high level of talent and skilled workforce • Chisholm Trial Parkway • Glen Rose – Wheeler Branch Reservoir • Water resources: adequate long-range supplies • Rail (Hood/Erath) • High Retail (GB)
WEAKNESSES
• Primary and secondary jobs • Housing — lack of multi-family housing • Transportation – connection to Ft. Worth • Roads - lacking interstate access • Rail (Somervell) • Counties are without a reliever Airport • Erath- growth is slow, but steady (upward trend) 2% growth • Erath –Fiber internet (limited fiber optic capability)
o more technology needed for wireless communication • COG relationship – promote coordination among local economic development efforts and
responsiveness to rural/region needs o Regional planning efforts aimed at addressing the urban-rural divide o Advocate economic develop projects and programs of benefit to counties outside of the
Dallas/Ft. Worth loop

Comprehensive Economic Development Strategy 2016
North Central Texas Council of Governments Page 54
• Program management issues: o Staffing o Grants o Bureaucracy with higher growth
• Light manufacturing • Increasing median family income • Inadequacy of Transportation Funding
OPPORTUNITIES
• Regional Airport • Toll-way (Glen Rose) –Chisholm Trial Parkway • Secondary education • Collaboration between academic institutions, businesses and governments for
increased innovation, responsiveness to region needs: o Comanche Power Plant o Emerging Technologies o Tarleton – TSU - WC
• Accessible transportation options including: o Rail o 281 Corridor o SH 67 o SH 377
• Proposition 1 • Building capacity of staff at local level • Aging population
o Impending retirement of baby boomers
THREATS OR CHALLENGES • Decision making related to urbanization (TXDOT, Water, Voting, Hospitals, etc) • Building code processes on rural settings - inappropriate burden on cost of construction
(bureaucracy issues) • Few grant writers • County level – reaching Ad Valorem taxes (maxing it out too quickly)
INDUSTRY RANKING FROM SURVEY: • Education – Public Education • Quality of Life – Water Quality/Quantity • Economy – Retail • Education – Universities/Colleges/Community Colleges • Health Care and Social Services - Hospitals

Comprehensive Economic Development Strategy 2016
North Central Texas Council of Governments Page 55
Appendix F (continued)
SWOT ANALYSIS BY CLUSTER — CLUSTER 3
Cluster 3 includes the following counties: Ellis, Johnson and Navarro.
The Ellis, Johnson, Navarro Cluster met to develop a “SWOT” analysis as part of the overall CEDS effort. Attendees included: Mike Ramsey, Kassandra Carroll, Mickey Hillock, Bill King, and Janie Havel.
The recap of the meeting follows.
STRENGTHS
• Power Grid • Transportation Infrastructure 96, 000 cars per day using Interstate I-35 & Highway 287, with
36,000 Intersection/major highways through the counties • Water availability and low cost • Skilled workforce (need a better skilled one to compete, however) • Plenty of land and inexpensive • Proximity to markets • Strong • M\Higher education availability (highest return on investment) • Low tax burden • Strong pro-business climate • Local infrastructure and capacity • Airport • High quality of life and lower cost of living • Growing arts & entertainment (Richland Chambers 3rd largest in Texas) • Rail (BNSF & Union Pacific) • Location to ocean points
WEAKNESSES
• Low median household incomes (good for manufacturing) • Limited rail spurs • Limited incentive options & funding for incentives • Destination retail (commerce) • Lack of social services
OPPORTUNITIES
• Reshoring/on-shoring/offshoring (some companies are coming back)

Comprehensive Economic Development Strategy 2016
North Central Texas Council of Governments Page 56
• Foreign direct investment (opportunities for FDIs who want to invest/buy a piece of the action in the region
THREATS
• Weather (tornadoes) • Increase incentives from other states • 4A & 4B communities can write checks that we can’t • Decline in standard manufacturing base (being replaced with automation) • Offshoring (financial and manufacturing) • Tighter Environmental regulations (i.e., air quality) • Poorly educated workforce • Aging infrastructure
INDUSTRY RANKING FROM SURVEY
• Put water under infrastructure or Quality of Life • Education • Water • Economy • Infrastructure • Healthcare • Quality of Life • Roads, sewer and Broadband under Infrastructure

Comprehensive Economic Development Strategy 2016
North Central Texas Council of Governments Page 57
Appendix F (continued)
SWOT ANALYSIS BY CLUSTER — CLUSTER 4
Cluster 4 includes the following counties: Hunt, Kaufman and Rockwall.
The Hunt-Kaufman-Rockwall Cluster met to develop a “SWOT” analysis as part of the overall CEDS effort. Attendees included: Michael Hampton, Rockwall EDC, Kim Dobbs, Heath EDC, Bonnie Hunter, Commerce EDC, Judge John Horn, Hunt County, Greg Sims, Greenville EDC and Warren Ketteman, Forney EDC.
A recap of the meeting follows:
STRENGTHS
• Highway infrastructure including IH 20, IH 30 and US 80 • Several other State Highways throughout our Cluster • Railway access and rail served sites in several communities • Air mobility including Majors Field in Greenville and municipal airports in other communities • Education: Texas A&M Commerce, Paris Junior College, Trinity Valley CC, ISDs, STEM academy in
Rockwall • Water resources, electric supply and availability • Available sites for business locations • Medical services • Hunt County is an “attainment” county • Lake Ray Hubbard • Downtown Rockwall (great example of downtown revitalization) • No fracking issues • Cooperation within our Cluster, “piggyback on others strengths”
WEAKNESSES
• Labor: Lower population numbers, outmigration of workers to population centers • Population growth, lack of “employment centers” • Accessibility, lack of other corridors especially “north-south” • Reduced number of specialized educational programs at ISD level • Number of low income students/families • “old” downtowns needing a facelift (Rockwall excluded) • Lack of real identity (this issue shared by ½ of our Cluster) • Financial constraints to accomplish goals • Lack of retail choices and reduced “quality of life” in some areas of our Cluster

Comprehensive Economic Development Strategy 2016
North Central Texas Council of Governments Page 58
OPPORTUNITIES
• Market ourselves for additional private investment • Recognize our position and place in the Metro • Not “drive thru” communities but a place for people to live and work • More collaboration especially with business attraction (what doesn’t fit in one community may
work well with one of our neighbors) • Highlight our “rural-ness” and Quality of Life factors • Educate each other on our respective strengths
THREATS
• Excessive governance and legislation at all levels, Local-State-Federal • Inexperienced leadership • Financial power “centered” in DFW, not the periphery • Lack of population in our Cluster • Competition, not only local but global • Congestion along major roadways • Lack of discipline in policy and development
INDUSTRY RANKING FROM SURVEY
1. Goal Number One: Quality of Life issues • Water quality • Water quantity (key to long-term growth in our area) • Land use • Land development options
2. Goal Number Two: Education
• Public schools, ISD’s (address lack of specialized programs) • Colleges/Universities (several in DFW, stress importance of support, expansion) • Vocational Schools (Need to promote these programs, gather more students)
3. Goal Number Three: Infrastructure
• Roadways (Use of main arteries such as IH 20 and IH 30, need for greater connectivity in the “outer” areas such as our cluster. Congestion is a critical issue.)
• Water/Wastewater • Other utilities: electric, fiber, natural gas (lack of natural gas availability and supply in our
cluster) • Rail (Need to highlight and support “rail served sites” in the region. Also need to mitigate
rail impact in communities with no rail access where trains are a “nuisance” and not an asset

Comprehensive Economic Development Strategy 2016
North Central Texas Council of Governments Page 59
(Forney!). Might be good to take a position on the new high-speed rail service, Texas Central High Speed Railway (TCP)
• Air (Highlight and support continued success of Love Field and DFW airports)
4. Goal Number Four: Economic Vitality • Manufacturing • Retail • Technology • Financial
5. Goal Number Five: Workforce Development
• Worker mobility • Employment centers (or lack of these in our cluster) • Training opportunities and support • Low income workers and families (issue in our cluster) • Entrepreneurship

Comprehensive Economic Development Strategy 2016
North Central Texas Council of Governments Page 60
Appendix F (continued)
SWOT ANALYSIS BY CLUSTER — CLUSTER 5
Cluster 5 includes the following counties: Collin, Dallas, Denton and Tarrant.
STRENGTHS Name Organization Item Craig Hulse City of North Richland Hills Stable property tax base, Strong bond rating Transportation (Road network, rail); Connectivity/central location, Strong residential base - diverse mix, Quality development standards; Schools rated highly - public/private - all levels available; Parks and recreation amenities; Citizen satisfaction and pride Jason Moore City of Richland Hills A location central to DFW w/good highway connectivity and easy access to airports, major downtowns and DFW attractions; Have adopted Triple Freeport Exemption; Existing TIF districts: Baker Blvd.; Strong industrial occupancy rates David Schlieg City of Dallas Location as a regional, national and international logistical hub;
Centrally located major business center w/in N. America;
Cost of Living – more affordable Top 10 US cities compared to New York, Los Angeles and Chicago;
Diverse city economy (banking, technology, logistics), providing a diverse range of economic development choices for developers with a strong economic development incentive program supported by the City CBD and greater Downtown Dallas area re-emergence as a vibrant urban center.

Comprehensive Economic Development Strategy 2016
North Central Texas Council of Governments Page 61
Rick Loessberg Dallas County Comprehensive transportation system (DART, interstate highways, thoroughfares, toll roads, etc.); DFW Airport and Love Field; Nationally known colleges and universities; Quality of life amenities (museums, concert/ entertainment venues, hike & bike trail system, extensive retail, restaurants, etc.); Neighborhoods with an “urban” environment Diversified economy with strong tech and healthcare base and a reputation for innovation; Major convention destination; Population continues to grow J.J. Cawelti Bell Helicopter (Items from Fort Worth perspective marked "FW") FW: Land available for growth; FW: Community revitalization efforts; FW: Strong education community to support a highly skilled workforce; FW: International partnership; FW: Strong, pro-business, leadership at local, state and federal level; Strong Aerospace community; Solid focus on preparing an aerospace workforce w/in the schools – good high school/Community College partnerships; Two international airports; Numerous private airports; Strong support for aerospace and defense by elected officials at local, state and federal level;
High level of collaboration between aerospace companies
Maria Evans Workforce Solutions for Tarrant County Stable Employment; Tenure, Workforce Knowledge, and Continuity among Board Staff and Board Members; Low Recidivism Rate through Special Programs Workforce Grants;
Excellent Rapport with Military Base and employers/ contractors in the Defense Industry;
Major Companies headquartered at Alliance Airport

Comprehensive Economic Development Strategy 2016
North Central Texas Council of Governments Page 62
Corridor, with a Workforce Center to solely support those companies and their HR staffing needs; Excellent Rapport with Community Agencies and Organizations to partner and contractually work with to provide niche job-related services, mental health counseling, mentoring, job coaching and career navigation for those with occupational and physical disabilities; Attraction and Recruitment of New Business, both interstate and intrastate Rapport and Partnership with community colleges for skills grants; Workforce Improvement Committee comprised of employers, higher education, and economic development leaders; Five (5) of Six (6) Workforce Centers within 5-10 mile radius of job seeker populations, with three (3) accessible via public transportation; Strong connections with local Chambers, Economic Development Councils, Business Community, and School Districts; Build Community Partnerships to serve community challenges Scott Welmaker City of Mansfield Excellent access to the southern Metroplex and points south ; Strong industrial presence. Jami Woodall City of Lake Worth North Texas is one of the fastest growing areas of the country. Lake Worth is at the crossroads of Loop 820 and Highway 199, the corridor to the west. Low taxes, and relatively low land costs in a region that can support additional retail. We provide an excellent living climate for our residents, and great quality of life. Strategically located close to major defense industries such as Lockheed and NAS/JRB. Centrally located close to major college campuses. Erica Sullivan City of Denton Location: where I-35 E and W intersect, proximity to DFW and Oklahoma;

Comprehensive Economic Development Strategy 2016
North Central Texas Council of Governments Page 63
Demographics: rapidly growing population, permit activity; Historic Downtown: Tax Increment Reinvestment Zone (TIRZ No.1) and Reinvestment Grant Program; Skilled workforce; Airport business park and Westpark TIRZ No. 2; Aviation industry and Flight training; Education: UNT and TWU universities, NCTC, DISD advanced Technology Complex; Quality of Life: major local music scene, unique atmosphere of local restaurants, coffee houses, creative and artistic talent (UNT College of Music); Technology transfer: tech workforce, creative talent, working on an incubator/co-working space; General: low crime rate, low cost of living (housing, taxes, recreation and natural resources), Discovery Park, 40% renewable energy Allison Thompson City of Cedar Hill Location: submarket to a major city (Dallas) with great connectivity via rail and roadway. Suburban quality of life with access to jobs. Indigenous beauty and topographical variety. Superior habitat for flora and fauna; high percentage of parkland.
Kay Brown City of Irving Proximity to DFW International Airport; Diverse economic base; Diversity in City population; Robust transportation access & connectivity within the DFW region (DART, TRE, highway system); Number of Fortune 500 & Fortune 1000 headquartered in Irving; City/Chamber partnership; ISD leader in implementing HB-5 career paths in aviation, culinary, and robotic fields; Linda Highwood City of Batch Springs Rural atmosphere; Prime undeveloped land ready for development Proximity to downtown Dallas Community is located where 3 major highways meet Family entertainment venues Award winning Mesquite ISD is one of the school districts that services the City. Annual seasonal festivities

Comprehensive Economic Development Strategy 2016
North Central Texas Council of Governments Page 64
City Staff that is working to change the spirit / direction of the community Ossana Hermosillo City of Fort Worth Affordable cost of living and land prices; good secondary educational institutions (TCU, Wesleyan, TCC) robust local economy growing population stable water supply public transportation w/access to DFW airport & Dallas qualified workforce improving school district Town halls with our mayor and council members that includes bike rides, walks around schools or parks, and donuts and coffee type events, in addition to e-town halls Unique tourist attractions – historic stockyard district, world class museums, nationally acclaimed zoo, Texas Motor Speedway, award-winning revitalized downtown and public plaza, etc. Robert Winningham Prosper EDC Our strength lies in our leadership’s visionary approach
to handling and being able to stay ahead of our unprecedented amount of recent growth. Constant improvements in infrastructure have allowed us to not miss a beat in terms of allowing high-quality development to flourish and not be held back by infrastructural limits. The presence of major thoroughfares such as the Dallas North Tollway, US Highway 380 and Preston Road, which all intersect in Prosper, also help drive and attract development. Partnerships with prominent developers such as Jerry Jones and Jack Matthews, ensures that we achieve the highest standard for development, which in turn helps us attract the best end-users. Proximity to a highly skilled workforce is also an advantage for Prosper.
WEAKNESSES
Craig Hulse City of North Richland Hills Class A/B office space High speed communication lines for business Lack of high skill/high wage employers Aging commercial and residential properties Primarily built out (70%) Retail cannibalization (Southlake Town Square,

Comprehensive Economic Development Strategy 2016
North Central Texas Council of Governments Page 65
Northeast Mall, Alliance) Pedestrian access (sidewalks, bike lanes) Public transportation Jason Moore City of Richland Hills City is “landlocked” and built out, reducing opportunities for new development No incentive policy for incentives other than tax abatement (e.g. 380 grants) No formal programs for Business Retention & Expansion No resources on web for available sites or leases Limited support resources available, involvement in development review, and experience on ED staff David Schlieg City of Dallas Higher development costs for brownfield redevelopment vs. greenfield development Aging infrastructure Middle Income Housing K-12 Education Rick Loessberg Dallas County Older housing stock and infrastructure in many areas Lack of basic infrastructure in emerging inland port area Declining supply of undeveloped land Problematic central city school district Population is less educated & less affluent than in past Population growth is primarily caused by births and foreign immigration, not by people moving here from another U.S. location J.J. Cawelti Bell Helicopter (Items from Fort Worth perspective marked "FW") FW: Traffic FW: Infrastructure lagging behind current community needs FW: Loss of the enterprise fund and other economic development tools FW: No strong DFW area chamber partnerships – rather segmented chambers with conflicting goals in each individual city Inventory and franchise taxes Technical labor generation gap number of technically skilled graduates does not meet current needs for highly technical aerospace jobs (Although programs have been put in place to improve this, the timing does not line up in time) Maria Evans Workforce Solutions for Tarrant County Transportation: Difficult to connect job seekers without their own cars to some employers (Ex: Alliance Airport Corridor); The T cutting fair-aid for low-income riders in

Comprehensive Economic Development Strategy 2016
North Central Texas Council of Governments Page 66
Oct 2015 Supply and Demand of trained workers; meeting employers’ needs of qualified job candidates and filling the “skills gaps” of their workforce staffing patterns Scott Welmaker City of Mansfield Low inventory of available space, aging infrastructure in older parts of town. Jami Woodall City of Lake Worth Our region is faced with a growing lack of updated roadways for quite some time, and with the influx of population into the region it has become ever- increasing demand on our major roadways. Lake Worth has commercial development that is aging. Erica Sullivan City of Denton We are a 4A/B city (no sales tax for incentives) University brain drain Infrastructure in historic downtown Gas infrastructure in industrial park (in process) Wages are lower than Metroplex Housing leakage outside of the City due to lack of higher-end housing Allison Thompson City of Cedar Hill Dearth of public transportation Inadequate public health access
Kay Brown City of Irving Irving lSD performance compared with many school districts in surrounding communities Aging Irving Mall Perceptions of blight/crime in Old Irving Restrictions on sale of alcohol in public spaces (for events/festivals) in Old Irving Lack of consumer amenities (upscale shopping, fine dining, and nightlife) Lack of "Triple Freeport" tax exemptions that other cities bordering DFW International Airport have. Linda Highwood City of Batch Springs Stereotype as an impoverished community Apathy/negativity from the majority of residents Not enough understanding from decision makers on the benefits of marketing the City We are surrounded by well known, more popular cities Ossana Hermosillo City of Fort Worth Public transportation; Maintenance of streets; keeping up with needed new infrastructure; stronger connection between school districts and business community to create more CTE programs in our high schools for those students who choose not to pursue higher education.

Comprehensive Economic Development Strategy 2016
North Central Texas Council of Governments Page 67
Higher property tax than surrounding cities; adequate grocery stores in all areas of our city. International business development Robert Winningham Prosper EDC An area of weakness is that we are a rapidly growing
community that is currently experiencing some growing pains. In some categories of service, the Town is understaffed and at times it may give the misperception to developers or prospective businesses that customer service is not a priority. Our development standards tend to be a bit higher than most other cities in the DFW Metroplex. This also sometimes gives the impression that the Town is difficult to work with and is anti-business, whereas in other cities the developers may have a smoother, less stringent process. This is something that we are working to improve upon and streamline as we continue to grow at such a rapid pace.
OPPORTUNITIES Craig Hulse City of North Richland Hills Redevelopment of commercial and residential Sustainable growth Infill development (30%) Transit Oriented Developments in progress Jason Moore City of Richland Hills Enhance communication / partnerships with two existing hotels Redevelopment of deteriorated properties Enhanced marketing of available sites David Schlieg City of Dallas A desirable urban environment undergoing significant urban renewal. Logistic and aerospace industries providing growth opportunities. Growing entrepreneur activity/base. Trinity River project A population with a young average age A diverse ethnic population Rick Loessberg Dallas County Redevelop older areas to create additional “urban” environment neighborhoods Develop inland port area within I20, I-35, & Trinity River JJ Cawelti Bell Helicopter (Items from Fort Worth perspective marked "FW") FW: Downtown revitalization FW: More accessible public transportation FW: Update critical infrastructure and roads More opportunity for collaboration with universities for

Comprehensive Economic Development Strategy 2016
North Central Texas Council of Governments Page 68
labor pool, innovation, etc. Maria Evans Workforce Solutions for Tarrant County The new Workforce Innovation and Opportunity Act (replaces WIA-Workforce Investment Act) House Bill 5 – Stipulations to identify and create partnership programs that enhance the career exploration and career planning process for elementary and secondary education students Build and Develop a workforce from youth, ages 16-24; make a positive impact to lower the high school drop- out rate Create and diversify services for employers and job seekers, through advanced technology, who are relocating to Fort Worth and Tarrant County A Strong Business Recruitment and Retention Plan Plans developing for better transportation, water conservation, and high-speed rail Scott Welmaker City of Mansfield Completion of SH-360, now under construction, will improve access to points north and especially to DFW Airport. Jami Woodall City of Lake Worth We are in a position to promote the region as an excellent area for living. As such, the opportunities for growth in our population base, housing market, retail & associated industries are poised for an upward trend. We have an opportunity to take advantage of our region’s attractiveness for business industry & defense if we take a comprehensive, regional approach. Our region was not impacted as severely as other areas of the country during the recent economic downturn. We need to capitalize on this and promote our area as being stable and economically sound as opposed to other areas of the country. Lake Worth has an opportunity of some redevelopment in our commercial area given right economic climate. Erica Sullivan City of Denton Retain and encourage opportunities for our creative class Developing a co-working space Transit Oriented Development near station that connects with Carrollton and DART Arts district along Hickory Work to solve issues with permitting process Partner with Alliance on leads or suppliers Partner with area universities and vocational schools

Comprehensive Economic Development Strategy 2016
North Central Texas Council of Governments Page 69
Allison Thompson City of Cedar Hill Historically growth has gone north but now vacant land to the north is over an hour drive and congested. This region is 20 minutes from downtown Dallas, is not congested, and the land prices are still reasonable Kay Brown City of Irving Sites with thousands of combined acres available for large-scale real estate development for new office space, mixed-use districts, and urban residential zones Several sites with potential for transit-oriented development adjacent to DART Orange Line and TRE station Ongoing development of Music Factory (live music venue, restaurants, Alamo Drafthouse theater) Recent/ongoing/planned urban residential development in Las Colinas Investments and expansion of Highway 183 Expand education training partnerships between local employers and Irving lSD and North Lake College Expand aviation training collaboration between Aviation Institute, Irving lSD, and local employers $20 million donation to University of Dallas business program from prominent Indian business family Leverage the business attraction efforts of the Dallas Regional Chamber and Fort Worth Regional Chamber for economic development in Irving Developable DFW International Airport within Irving city Limits Linda Highwood City of Batch Springs I20 corridor prime land ready for development Proximity to Toyota plant which will hire 7,000 employees Proximity to Dallas Logistics HUB located in the southeast Dallas area Overdevelopment of the surrounding eastern and northern cities Ossana Hermosillo City of Fort Worth Collaborations with public and private partners to tackle issues or develop solutions to challenges across our communities Programs at the local high schools to make them more job ready for employment in the private & public sector create strong partnerships around workforce development to set the course for our ability to continue to attract & retain businesses; attract a more diverse economy, particularly around medical and technology fields; Trends in technology that can be applied to a variety of facets of operating a municipality & serving our
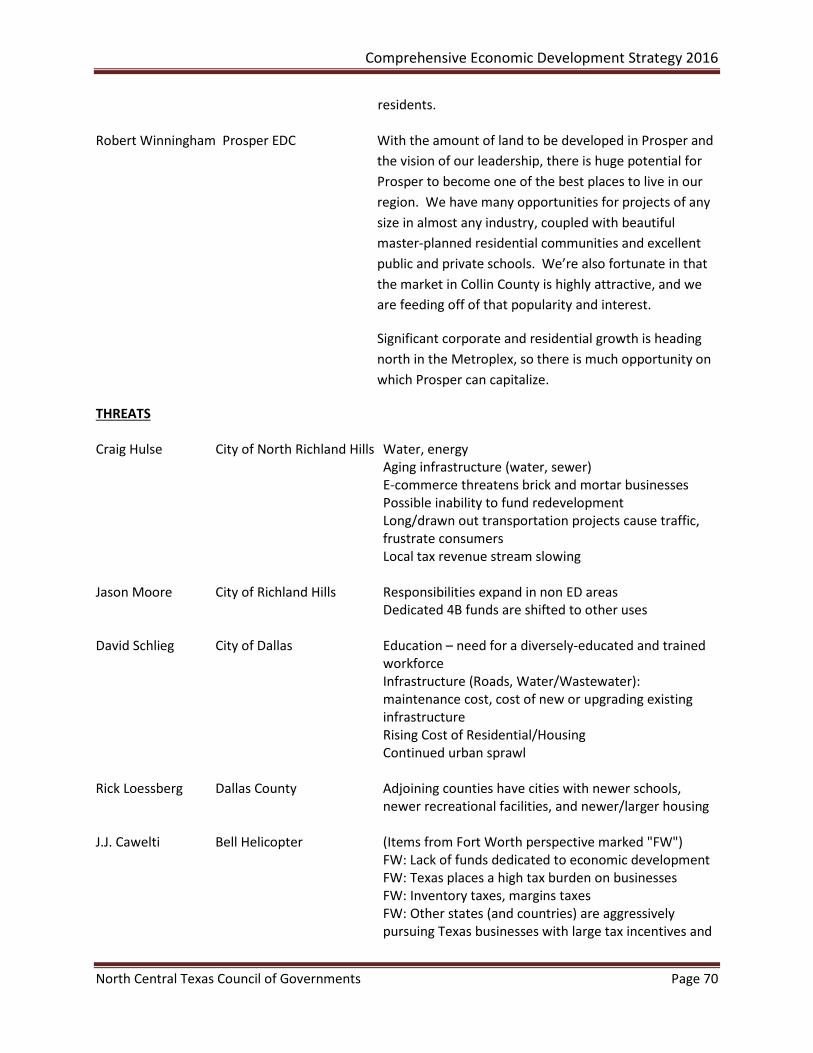
Comprehensive Economic Development Strategy 2016
North Central Texas Council of Governments Page 70
residents. Robert Winningham Prosper EDC With the amount of land to be developed in Prosper and
the vision of our leadership, there is huge potential for Prosper to become one of the best places to live in our region. We have many opportunities for projects of any size in almost any industry, coupled with beautiful master-planned residential communities and excellent public and private schools. We’re also fortunate in that the market in Collin County is highly attractive, and we are feeding off of that popularity and interest.
Significant corporate and residential growth is heading north in the Metroplex, so there is much opportunity on which Prosper can capitalize.
THREATS Craig Hulse City of North Richland Hills Water, energy Aging infrastructure (water, sewer) E-commerce threatens brick and mortar businesses Possible inability to fund redevelopment Long/drawn out transportation projects cause traffic, frustrate consumers Local tax revenue stream slowing Jason Moore City of Richland Hills Responsibilities expand in non ED areas Dedicated 4B funds are shifted to other uses David Schlieg City of Dallas Education – need for a diversely-educated and trained workforce Infrastructure (Roads, Water/Wastewater): maintenance cost, cost of new or upgrading existing infrastructure Rising Cost of Residential/Housing Continued urban sprawl Rick Loessberg Dallas County Adjoining counties have cities with newer schools, newer recreational facilities, and newer/larger housing J.J. Cawelti Bell Helicopter (Items from Fort Worth perspective marked "FW") FW: Lack of funds dedicated to economic development FW: Texas places a high tax burden on businesses FW: Inventory taxes, margins taxes FW: Other states (and countries) are aggressively pursuing Texas businesses with large tax incentives and

Comprehensive Economic Development Strategy 2016
North Central Texas Council of Governments Page 71
cash grants Increasing competition in the global market place Becoming harder to be cost competitive due to high prices of labor and cost of doing business Global competitors pursuing the same business Reduced DOD spending puts aerospace sector at risk Soft commercial market in aerospace Maria Evans Workforce Solutions for Tarrant County The time involved to build better transportation systems to connect people to jobs An unexpected downturn in the economy or elevated unemployment rate A decrease in spending for Defense Industry Legislation changes that impact business hiring and cost of doing business, employee benefits, i.e. Affordable Healthcare Act Business Facing an aging workforce and talent drain Manufacturing decline due to lack of interest of younger workers Lack of training programs w/ credentials to adequately prepare future workforce for manufacturing jobs Scott Welmaker City of Mansfield Encroachment of large new residential projects on existing industrial areas Qualified workforce is increasingly hard to find Jami Woodall City of Lake Worth B.R.A.C. and the possibility of closure of NAS/JRB is always a threat to our region. With the loss of our military presence in the region our defense-related industries would suffer as well, therefore impacting our economy for some time into the future. By lack of a comprehensive approach to our transportation issues, we face the possibility of losing business, industry and jobs to other areas of the region and the state. The issue of transportation must be addressed rapidly with an eye not only on this decade but three or more decades into the future. Being landlocked and having no more buildable land for future developments. Erica Sullivan City of Denton Demographics: providing services for a rapidly growing population Environmental issues in downtown (although we are working on a regional Municipal Setting Designation (MSD) for downtown to help facilitate development) Housing leakage outside of the City due to lack of

Comprehensive Economic Development Strategy 2016
North Central Texas Council of Governments Page 72
higher-end housing Retail is doing well, but there is still leakage for some of the higher end shopping Education: ISD rankings are lower (when compared to Frisco, for example) Allison Thompson City of Cedar Hill Perception of inadequacies in education, workforce, and opportunity is our biggest threat. The perception of a “blue collar” location and lack of opportunities for professional and corporate office development. This is changing but not fast enough! Kay Brown City of Irving Alcohol sale restrictions in Old Irving Fierce competitive environment in Metroplex for business attraction. Competition for commercial real estate development between DFW airport and other properties in Irving Negative perceptions of city due to fracking-related earthquakes. Relatively low achievement levels of Irving lSD (compared to surrounding districts) Linda Highwood City of Batch Springs The political atmosphere can sometimes be a deterrent Strong infrastructure and marketing funds in neighboring cities Ossana Hermosillo City of Fort Worth Keeping up with growth and all the demands and strains it can put on us, and our taxpayers. All the other surrounding cities have lower property taxes, which can be a challenge to retain some of our businesses in FW when they can move a short distance to an adjacent city and pay lower property taxes. Old housing and ability to maintain and preserve quality neighborhoods. Robert Winningham Prosper EDC The flip side to being in a high-growth area is that
attracting business is highly competitive among neighboring communities. This forces us to become increasingly aggressive and creative in our pursuit of projects. This competitive marketplace also drives up prices in the cost of land and labor. If costs continue to increase, especially at such rapid rates, then there is the possibility of pricing businesses out of the market which could lead to a downturn. This is an issue that we are starting to encounter and is likely a concern in other parts of the Metroplex as well.

Comprehensive Economic Development Strategy 2016
North Central Texas Council of Governments Page 73
INDUSTRY RANKING FROM SURVEY • Economy – Technology • QOL – Water Quality/Quantity • CS & Infrastructure – Roads, Toll Roads, Railroads, Streets & Parking • Education – Public Education • Quality of Life – comprehensive land use and development options • CS & Infrastructure – water, sewers and utilities • Economy – Retail • Economy – Manufacturing • CS & Infrastructure – Public Infrastructure • Quality of Life – Community Amenities
Appendix F (continued)
SWOT ANALYSIS BY CLUSTER — CLUSTER 6
Cluster 6 is the University Cluster and contains all institutions of higher learning located in the NCTCOG region.
Higher Education
Strengths 1. North Central Texas has a full range of higher-education institutions from community colleges to
research universities and medical school that contribute to workforce development for the region by training local students and students from out of state or other nations, many of whom remain in the region for employment.
2. North Central Texas is home to some 80 institutions of higher education with a combined annual enrollment totaling 456,551 students, offering 37 areas of study in an extensive range of degree programs with strengths in STEM fields, Law, Health, Business and related support services to graduate a highly educated pool of potential employees for the region.
3. North Central Texas colleges and universities are motivated to create new programs to address the changing educational needs of the region.
4. North Central Texas colleges and universities contribute directly to the region’s cultural and intellectual diversity by attracting students, faculty and speakers, from out of state and other nations.
5. Recipients of degrees from North Central Texas colleges and universities have increased earning potential.
6. North Central Texas colleges and universities create an environment that attracts employers to the region by enhancing the quality of life, cultural richness, and local economy of the region through sports events, the arts, public lectures, libraries, and community engagement.

Comprehensive Economic Development Strategy 2016
North Central Texas Council of Governments Page 74
7. North Central Texas colleges and universities Increase global awareness in community and workforce (thru study abroad programs, international student bodies, speakers, etc.).
8. Early college high school programs – students graduate with high school diploma and 2-year degree.
Weaknesses 1. The presence of a “Tier 1” university attracts and stimulates the growth of industry, but North
Central Texas contains the fastest growing metropolitan area in the US without a “Tier 1” university.
2. The graduation rate of PhDs from North Central Texas colleges and universities is inadequate to meet the region’s needs.
3. The ability of North Central Texas colleges and universities to respond to the region’s evolving needs is limited by the prolonged time (years) required to develop new programs and availability of funds.
4. Inadequate laboratory capacity and limited space for expansion at North Central Texas colleges and universities limits expansion and development of new research and educational programs and collaboration with industry.
5. No mechanisms are in place to encourage and facilitate collaboration and coordination between North Central Texas colleges and universities to optimize their resources.
6. Collaboration between the private sector and the region’s colleges and universities is impaired by their disparate cultures and bureaucracies, and by inadequate awareness of industry needs and resources at colleges and universities.
7. College and university programs and resources devoted to incubating new businesses are not well developed and lack coordination.
Opportunities
1. The rapidly growing population of North Central Texas represents both a challenge and an opportunity to North Central Texas colleges and universities to expand their educational offerings, community engagement, and collaboration with the private sector.
2. Opportunities exist to increase the community engagement of North Central Texas colleges and universities in support of K-12 education, urban planning, entrepreneurship, community service, and industrial partnership.
3. Opportunities exist for North Central Texas colleges and universities to optimize their collective contribution to the region’s economy through strategic planning to minimize competition and increase collaboration to share facilities, create of complementary and joint programs, share instruction, and develop transfer agreements.
4. Opportunities exist for North Central Texas colleges and universities to contribute to growth of the private sector with research facilities, analysis, intellectual resources, interns, workforce development, and continued development of facilities and programs in support of entrepreneurism.

Comprehensive Economic Development Strategy 2016
North Central Texas Council of Governments Page 75
5. North Central Texas colleges and universities attract foundation and philanthropic investment which can contribute to regional economic development through creation of new educational and community outreach programs.
Threats 1. Public access to higher education in North Central Texas is limited by its cost and the regional
transportation infrastructure. 2. Increasing student debt diminishes the financial contribution of college graduates to the local
economy. 3. Workforce development at North Central Texas colleges and universities is being affected by the
changing demographics of student populations with college enrollments characterized by falling numbers of students interested in STEM fields, decreasing numbers of male students, and an increasing number of foreign students, many of whom cannot remain in the US to work.
4. Poor college readiness of many students entering North Central Texas colleges and universities as a result of inadequate preparation by K-12 education slows student progress, reduces graduation rates and increasingly taps resources at colleges and universities to provide remedial educational programs.
5. The ability of North Central Texas colleges and universities to expand and improve programs, improve facilities, and attract outstanding faculty is severely challenged in the current economic climate of increasing infrastructure costs, public and government pressure to limit tuition increases, reductions in State and Federal support for Higher Ed, and stagnant Federal support for research.
6. Legislation that would negatively impact higher education’s primary mission.
(Return to TOC)

Comprehensive Economic Development Strategy 2016
North Central Texas Council of Governments Page 76
APPENDIX G
SECTOR SURVEY RESULTS BY GEOGRAPHIC CLUSTER
The CEDS Committee, because of the diverse nature of the North Central Texas region, organized itself into five sub-regional clusters based on geography, as well as one functional cluster – higher education. As part of its SWOT Analysis, each cluster, as well as their stakeholders, took an online survey to identify those sectors most important to their sub-region or function. Cluster 6, Universities, did not complete a separate survey but, instead, were part of the other five geographic clusters.
SURVEY RESULTS BY CLUSTER — CLUSTER 1
Cluster 1 includes the following counties: Wise, Palo Pinto and Parker.
Cluster 1 - Wise, Palo Pinto and Parker Total
Responses
20 In Ranking Order - Top 10 and Bottom 10 are Highlighted
1 2 3 4 5 Response Average
1. Education - Vocational 0% (0) 0% (0) 10.53% (2) 42.11% (8) 47.37% (9) 4.37
2. CS & INFRA - Land and Buildings for Development 0% (0) 0% (0) 15% (3) 35% (7) 50% (10) 4.35
3. QOL - Water Quality/Quantity 5% (1) 5% (1) 0% (0) 35% (7) 55% (11) 4.3
4. CS & INFRA - Water Conservation and Resource Efficiency 0% (0) 5% (1) 10% (2) 35% (7) 50% (10) 4.3
5. Education - Public Education 0% (0) 5% (1) 10% (2) 35% (7) 50% (10) 4.3
6. Education - Universities/Colleges/Community Colleges 0% (0) 0% (0) 10.53% (2) 52.63% (10) 36.84% (7) 4.26
7. Economy - Retail 0% (0) 0% (0) 20% (4) 35% (7) 45% (9) 4.25
8. CS & INFRA - Water, Sewers and Utility 0% (0) 5% (1) 5% (1) 50% (10) 40% (8) 4.25 9. Education - Technology Transfer, Business
Incubators, and Accelerators 0% (0) 0% (0) 20% (4) 35% (7) 45% (9) 4.25
10. QOL - Comprehensive Land Use and Development Options 0% (0) 0% (0) 20% (4) 40% (8) 40% (8) 4.2
11. Education - Related Businesses and Spin-offs 0% (0) 0% (0) 25% (5) 35% (7) 40% (8) 4.15
12. HC & SS - Hospitals 0% (0) 5.26% (1) 21.05% (4) 31.58% (6) 42.11% (8) 4.11
13. Economy - Manufacturing 5% (1) 0% (0) 15% (3) 40% (8) 40% (8) 4.1
14. Economy - Technology 0% (0) 0% (0) 25% (5) 40% (8) 35% (7) 4.1
15. Economy - Intergovernmental Coordination 0% (0) 0% (0) 20% (4) 50% (10) 30% (6) 4.1
16. QOL - Scenic and Recreation 5% (1) 0% (0) 10% (2) 50% (10) 35% (7) 4.1
17. QOL - Air Quality 5% (1) 5% (1) 5% (1) 45% (9) 40% (8) 4.1
18. CS & INFRA - Local Government 5.26% (1) 5.26% (1) 5.26% (1) 47.37% (9) 36.84% (7) 4.05
19. CS & INFRA - Police and Fire 5% (1) 0% (0) 20% (4) 35% (7) 40% (8) 4.05
20. CS & INFRA - Roads, Toll Roads, Railroads, Streets and Parking 0% (0) 5% (1) 25% (5) 30% (6) 40% (8) 4.05
21. Economy - Energy (Oil and Gas) 0% (0) 10% (2) 20% (4) 30% (6) 40% (8) 4
22. QOL - Community Amenities 5% (1) 0% (0) 25% (5) 30% (6) 40% (8) 4
23. CS & INFRA - Phone, Internet and Broadband 0% (0) 5% (1) 25% (5) 35% (7) 35% (7) 4
24. CS & INFRA - Public Transportation 5% (1) 5% (1) 20% (4) 30% (6) 40% (8) 3.95 25. CS & INFRA - Watershed Management and
Storm Conveyance 0% (0) 5% (1) 20% (4) 50% (10) 25% (5) 3.95

Comprehensive Economic Development Strategy 2016
North Central Texas Council of Governments Page 77
26. QOL - Arts, Entertainment and Culture 5% (1) 5% (1) 20% (4) 35% (7) 35% (7) 3.9
27. CS & INFRA - Aviation Facilities 0% (0) 5% (1) 25% (5) 45% (9) 25% (5) 3.9
28. Economy - Construction/Real Estate 5.26% (1) 0% (0) 26.32% (5) 42.11% (8) 26.32% (5) 3.84
29. Education - Other 5.56% (1) 0% (0) 38.89% (7) 16.67% (3) 38.89% (7) 3.83
30. HC & SS - Local Clinics 0% (0) 5% (1) 40% (8) 25% (5) 30% (6) 3.8
31. HC & SS - Children's Health 0% (0) 10.53% (2) 26.32% (5) 42.11% (8) 21.05% (4) 3.74
32. QOL - Open Space Conservation and Habitat 5% (1) 15% (3) 20% (4) 25% (5) 35% (7) 3.7
33. QOL - Youth Services 5% (1) 15% (3) 20% (4) 25% (5) 35% (7) 3.7
34. HC & SS - Senior Health 0% (0) 10% (2) 30% (6) 40% (8) 20% (4) 3.7
35. HC & SS - Mental Health 0% (0) 10% (2) 30% (6) 40% (8) 20% (4) 3.7
36. CS & INFRA - Solid Waste Management 0% (0) 5.26% (1) 36.84% (7) 42.11% (8) 15.79% (3) 3.68
37. CS & INFRA - Interstate Highways 0% (0) 5.26% (1) 42.11% (8) 31.58% (6) 21.05% (4) 3.68
38. CS & INFRA - Other 0% (0) 0% (0) 61.11% (11) 11.11% (2) 27.78% (5) 3.67
39. Economy - Energy Efficiency Options (Alternative Fuels, Renewable Fuels) 0% (0) 0% (0) 60% (12) 15% (3) 25% (5) 3.65
40. QOL - Senior Services 5% (1) 15% (3) 20% (4) 30% (6) 30% (6) 3.65
41. Education - Private Education 0% (0) 10% (2) 45% (9) 15% (3) 30% (6) 3.65
42. QOL - Other 5.56% (1) 5.56% (1) 44.44% (8) 11.11% (2) 33.33% (6) 3.61
43. CS & INFRA - Housing Stock/Diversity 0% (0) 0% (0) 55% (11) 30% (6) 15% (3) 3.6
44. CS & INFRA - Pedestrian Design 0% (0) 0% (0) 52.63% (10) 36.84% (7) 10.53% (2) 3.58
45. CS & INFRA - Intermodal Freight Facilities 0% (0) 15% (3) 30% (6) 40% (8) 15% (3) 3.55
46. HC & SS - Home-Delivered Meals, Food Banks, Meals on Wheels, Congregate Meals, Community Centers
0% (0) 20% (4) 25% (5) 35% (7) 20% (4) 3.55
47. Economy - Tourism 5% (1) 10% (2) 30% (6) 40% (8) 15% (3) 3.5
48. Economy - Other 6.25% (1) 0% (0) 50% (8) 25% (4) 18.75% (3) 3.5 49. Economy - Agriculture, Forestry, and Natural
Resources 5% (1) 10% (2) 30% (6) 45% (9) 10% (2) 3.45
50. HC & SS - Telemedicine 0% (0) 11.11% (2) 55.56% (10) 16.67% (3) 16.67% (3) 3.39
51. HC & SS - Other 0% (0) 0% (0) 77.78% (14) 5.56% (1) 16.67% (3) 3.39
52. Economy - Defense 5% (1) 5% (1) 55% (11) 20% (4) 15% (3) 3.35
53. CS & INFRA - Commodity Pipelines 5% (1) 15% (3) 40% (8) 25% (5) 15% (3) 3.3
54. Economy - Banking 10.53% (2) 0% (0) 57.89% (11) 26.32% (5) 5.26% (1) 3.16
55. Economy - Sports 5.26% (1) 26.32% (5) 57.89% (11) 10.53% (2) 0% (0) 2.74
Industry Ranking Key: For each industry, please rank the importance of including goals and objectives for this industry in this CEDS document, according to the following scale: 1 = Strongly disagree to this being in this first CEDS document 2 = Disagree to this being in this first CEDS document 3 = Neutral 4 = Agree to this being in this first CEDS document 5 = Strongly agree to this being in this first CEDS document

Comprehensive Economic Development Strategy 2016
North Central Texas Council of Governments Page 78
Appendix G (continued)
SURVEY RESULTS BY CLUSTER — CLUSTER 2
Cluster 2 includes the following counties: Erath, Hood and Somervell.
Cluster 2 - Erath, Hood and Somervell Total Responses 10 In Ranking Order - Top 10 and Bottom 10 are Highlighted
1 2 3 4 5 Response Average
1. Education - Public Education 0% (0) 0% (0) 10% (1) 30% (3) 60% (6) 4.5
2. QOL - Water Quality/Quantity 0% (0) 10% (1) 0% (0) 40% (4) 50% (5) 4.3
3. Economy - Retail 0% (0) 0% (0) 20% (2) 40% (4) 40% (4) 4.2
4. CS & INFRA - Aviation Facilities 0% (0) 10% (1) 10% (1) 30% (3) 50% (5) 4.2
5. HC & SS - Hospitals 0% (0) 0% (0) 40% (4) 0% (0) 60% (6) 4.2
6. Education - Universities/Colleges/Community Colleges 10% (1) 0% (0) 10% (1) 20% (2) 60% (6) 4.2
7. Economy - Tourism 0% (0) 10% (1) 20% (2) 20% (2) 50% (5) 4.1
8. HC & SS - Senior Health 0% (0) 0% (0) 30% (3) 30% (3) 40% (4) 4.1
9. Economy - Manufacturing 0% (0) 10% (1) 10% (1) 50% (5) 30% (3) 4
10. Economy - Energy (Oil and Gas) 0% (0) 10% (1) 0% (0) 70% (7) 20% (2) 4
11. QOL - Community Amenities 0% (0) 10% (1) 30% (3) 10% (1) 50% (5) 4
12. QOL - Scenic and Recreation 0% (0) 10% (1) 20% (2) 30% (3) 40% (4) 4
13. QOL - Comprehensive Land Use and Development Options 0% (0) 0% (0) 22.22% (2) 55.56% (5) 22.22% (2) 4
14. CS & INFRA - Water, Sewers and Utility 0% (0) 0% (0) 30% (3) 40% (4) 30% (3) 4
15. CS & INFRA - Land and Buildings for Development 0% (0) 0% (0) 33.33% (3) 33.33% (3) 33.33% (3) 4
16. CS & INFRA - Roads, Toll Roads, Railroads, Streets and Parking 0% (0) 10% (1) 30% (3) 20% (2) 40% (4) 3.9
17. CS & INFRA - Water Conservation and Resource Efficiency 0% (0) 20% (2) 0% (0) 50% (5) 30% (3) 3.9
18. HC & SS - Children's Health 0% (0) 0% (0) 40% (4) 30% (3) 30% (3) 3.9
19. Education - Vocational 0% (0) 0% (0) 30% (3) 50% (5) 20% (2) 3.9
20. Economy - Intergovernmental Coordination 0% (0) 20% (2) 10% (1) 40% (4) 30% (3) 3.8
21. QOL - Air Quality 0% (0) 20% (2) 10% (1) 40% (4) 30% (3) 3.8
22. QOL - Senior Services 0% (0) 10% (1) 30% (3) 30% (3) 30% (3) 3.8
23. QOL - Arts, Entertainment and Culture 0% (0) 20% (2) 0% (0) 60% (6) 20% (2) 3.8
24. CS & INFRA - Local Government 0% (0) 10% (1) 30% (3) 30% (3) 30% (3) 3.8
25. CS & INFRA - Police and Fire 0% (0) 10% (1) 30% (3) 30% (3) 30% (3) 3.8
26. CS & INFRA - Phone, Internet and Broadband 0% (0) 30% (3) 0% (0) 30% (3) 40% (4) 3.8
27. HC & SS - Local Clinics 0% (0) 0% (0) 50% (5) 20% (2) 30% (3) 3.8
28. Economy - Construction/Real Estate 0% (0) 20% (2) 20% (2) 30% (3) 30% (3) 3.7
29. Economy - Technology 0% (0) 20% (2) 20% (2) 30% (3) 30% (3) 3.7
30. QOL - Youth Services 0% (0) 20% (2) 30% (3) 20% (2) 30% (3) 3.6
31. CS & INFRA - Public Transportation 10% (1) 0% (0) 30% (3) 40% (4) 20% (2) 3.6
32. QOL - Open Space Conservation and Habitat 0% (0) 20% (2) 30% (3) 30% (3) 20% (2) 3.5
33. HC & SS - Mental Health 0% (0) 10% (1) 50% (5) 20% (2) 20% (2) 3.5

Comprehensive Economic Development Strategy 2016
North Central Texas Council of Governments Page 79
34. CS & INFRA - Watershed Management and Storm Conveyance 0% (0) 30% (3) 10% (1) 50% (5) 10% (1) 3.4
35. CS & INFRA - Housing Stock/Diversity 0% (0) 30% (3) 30% (3) 10% (1) 30% (3) 3.4
36. HC & SS - Home-Delivered Meals, Food Banks, Meals on Wheels, Congregate Meals, Community Centers
0% (0) 20% (2) 30% (3) 40% (4) 10% (1) 3.4
37. CS & INFRA - Intermodal Freight Facilities 0% (0) 20% (2) 40% (4) 30% (3) 10% (1) 3.3
38. CS & INFRA - Interstate Highways 10% (1) 10% (1) 40% (4) 20% (2) 20% (2) 3.3
39. Education - Private Education 10% (1) 10% (1) 40% (4) 20% (2) 20% (2) 3.3
40. Education - Related Businesses and Spin-offs 0% (0) 30% (3) 20% (2) 40% (4) 10% (1) 3.3
41. Education - Technology Transfer, Business Incubators, and Accelerators 10% (1) 20% (2) 10% (1) 50% (5) 10% (1) 3.3
42. QOL - Other 0% (0) 0% (0) 88.89% (8) 0% (0) 11.11% (1) 3.22
43. Economy - Agriculture, Forestry, and Natural Resources 10% (1) 10% (1) 40% (4) 30% (3) 10% (1) 3.2
44. Economy - Banking 0% (0) 40% (4) 20% (2) 20% (2) 20% (2) 3.2
45. Economy - Energy Efficiency Options (Alternative Fuels, Renewable Fuels) 10% (1) 20% (2) 30% (3) 20% (2) 20% (2) 3.2
46. Economy - Other 0% (0) 10% (1) 60% (6) 30% (3) 0% (0) 3.2
47. CS & INFRA - Solid Waste Management 0% (0) 30% (3) 40% (4) 20% (2) 10% (1) 3.1
48. HC & SS - Telemedicine 10% (1) 20% (2) 30% (3) 30% (3) 10% (1) 3.1
49. Education - Other 10% (1) 10% (1) 60% (6) 10% (1) 10% (1) 3
50. CS & INFRA - Commodity Pipelines 10% (1) 20% (2) 40% (4) 30% (3) 0% (0) 2.9
51. CS & INFRA - Pedestrian Design 10% (1) 20% (2) 40% (4) 30% (3) 0% (0) 2.9
52. CS & INFRA - Other 0% (0) 10% (1) 90% (9) 0% (0) 0% (0) 2.9
53. HC & SS - Other 0% (0) 10% (1) 90% (9) 0% (0) 0% (0) 2.9
54. Economy - Defense 20% (2) 20% (2) 30% (3) 20% (2) 10% (1) 2.8
55. Economy - Sports 30% (3) 10% (1) 60% (6) 0% (0) 0% (0) 2.3
Industry Ranking Key: For each industry, please rank the importance of including goals and objectives for this industry in this CEDS document, according to the following scale: 1 = Strongly disagree to this being in this first CEDS document 2 = Disagree to this being in this first CEDS document 3 = Neutral 4 = Agree to this being in this first CEDS document 5 = Strongly agree to this being in this first CEDS document

Comprehensive Economic Development Strategy 2016
North Central Texas Council of Governments Page 80
Appendix G (continued)
SURVEY RESULTS BY CLUSTER — CLUSTER 3
Cluster 3 includes the following counties: Ellis, Johnson and Navarro.
Cluster 3 - Johnson, Ellis and Navarro
Total Response
s 13 In Ranking Order - Top 10 and Bottom 10 are Highlighted
1 2 3 4 5 Response Average
1. Education - Vocational 0% (0) 0% (0) 7.69% (1) 7.69% (1) 84.62% (11) 4.77
2. Education - Public Education 0% (0) 0% (0) 7.69% (1) 15.38% (2) 76.92% (10) 4.69
3. Education - Universities/Colleges/Community Colleges 0% (0) 0% (0) 15.38% (2) 7.69% (1) 76.92% (10) 4.62
4. Education - Technology Transfer, Business Incubators, and Accelerators 0% (0) 0% (0) 8.33% (1) 33.33% (4) 58.33% (7) 4.5
5. QOL - Water Quality/Quantity 0% (0) 0% (0) 7.69% (1) 38.46% (5) 53.85% (7) 4.46
6. Economy - Retail 0% (0) 0% (0) 7.69% (1) 46.15% (6) 46.15% (6) 4.38
7. Economy - Construction/Real Estate 0% (0) 0% (0) 7.69% (1) 46.15% (6) 46.15% (6) 4.38 8. CS & INFRA - Roads, Toll Roads, Railroads, Streets
and Parking 0% (0) 0% (0) 7.69% (1) 53.85% (7) 38.46% (5) 4.31
9. CS & INFRA - Water, Sewers and Utility 0% (0) 0% (0) 16.67% (2) 41.67% (5) 41.67% (5) 4.25
10. CS & INFRA - Phone, Internet and Broadband 0% (0) 0% (0) 15.38% (2) 46.15% (6) 38.46% (5) 4.23
11. HC & SS - Hospitals 0% (0) 15.38% (2) 0% (0) 30.77% (4) 53.85% (7) 4.23
12. Education - Private Education 0% (0) 7.69% (1) 15.38% (2) 23.08% (3) 53.85% (7) 4.23
13. Economy - Energy (Oil and Gas) 0% (0) 7.69% (1) 7.69% (1) 46.15% (6) 38.46% (5) 4.15
14. Economy - Manufacturing 0% (0) 7.69% (1) 23.08% (3) 23.08% (3) 46.15% (6) 4.08
15. Economy - Technology 0% (0) 15.38% (2) 7.69% (1) 30.77% (4) 46.15% (6) 4.08
16. QOL - Comprehensive Land Use and Development Options 0% (0) 0% (0) 30.77% (4) 30.77% (4) 38.46% (5) 4.08
17. CS & INFRA - Public Transportation 0% (0) 8.33% (1) 16.67% (2) 33.33% (4) 41.67% (5) 4.08
18. HC & SS - Children's Health 0% (0) 0% (0) 38.46% (5) 15.38% (2) 46.15% (6) 4.08
19. Economy - Banking 0% (0) 0% (0) 38.46% (5) 23.08% (3) 38.46% (5) 4
20. QOL - Senior Services 0% (0) 7.69% (1) 15.38% (2) 46.15% (6) 30.77% (4) 4
21. HC & SS - Senior Health 0% (0) 0% (0) 38.46% (5) 23.08% (3) 38.46% (5) 4
22. HC & SS - Mental Health 0% (0) 7.69% (1) 30.77% (4) 15.38% (2) 46.15% (6) 4
23. QOL - Youth Services 0% (0) 7.69% (1) 23.08% (3) 38.46% (5) 30.77% (4) 3.92
24. CS & INFRA - Local Government 0% (0) 7.69% (1) 23.08% (3) 38.46% (5) 30.77% (4) 3.92
25. CS & INFRA - Interstate Highways 0% (0) 7.69% (1) 23.08% (3) 38.46% (5) 30.77% (4) 3.92
26. CS & INFRA - Land and Buildings for Development 0% (0) 0% (0) 38.46% (5) 30.77% (4) 30.77% (4) 3.92
27. HC & SS - Local Clinics 0% (0) 15.38% (2) 23.08% (3) 15.38% (2) 46.15% (6) 3.92
28. Education - Related Businesses and Spin-offs 0% (0) 23.08% (3) 15.38% (2) 7.69% (1) 53.85% (7) 3.92
29. QOL - Community Amenities 0% (0) 0% (0) 30.77% (4) 53.85% (7) 15.38% (2) 3.85
30. CS & INFRA - Housing Stock/Diversity 0% (0) 7.69% (1) 23.08% (3) 46.15% (6) 23.08% (3) 3.85
31. HC & SS - Home-Delivered Meals, Food Banks, Meals on Wheels, Congregate Meals, Community Centers
0% (0) 7.69% (1) 30.77% (4) 30.77% (4) 30.77% (4) 3.85
32. QOL - Scenic and Recreation 0% (0) 0% (0) 46.15% (6) 30.77% (4) 23.08% (3) 3.77

Comprehensive Economic Development Strategy 2016
North Central Texas Council of Governments Page 81
33. QOL - Air Quality 0% (0) 15.38% (2) 23.08% (3) 30.77% (4) 30.77% (4) 3.77
34. CS & INFRA - Water Conservation and Resource Efficiency 0% (0) 0% (0) 46.15% (6) 30.77% (4) 23.08% (3) 3.77
35. Education - Other 0% (0) 15.38% (2) 30.77% (4) 15.38% (2) 38.46% (5) 3.77
36. QOL - Arts, Entertainment and Culture 0% (0) 16.67% (2) 16.67% (2) 41.67% (5) 25% (3) 3.75
37. CS & INFRA - Police and Fire 0% (0) 15.38% (2) 23.08% (3) 38.46% (5) 23.08% (3) 3.69
38. CS & INFRA - Solid Waste Management 0% (0) 15.38% (2) 30.77% (4) 30.77% (4) 23.08% (3) 3.62
39. HC & SS - Telemedicine 0% (0) 15.38% (2) 23.08% (3) 46.15% (6) 15.38% (2) 3.62
40. Economy - Defense 0% (0) 16.67% (2) 33.33% (4) 25% (3) 25% (3) 3.58
41. CS & INFRA - Aviation Facilities 0% (0) 25% (3) 16.67% (2) 33.33% (4) 25% (3) 3.58
42. Economy - Intergovernmental Coordination 7.69% (1) 7.69% (1) 23.08% (3) 46.15% (6) 15.38% (2) 3.54 43. CS & INFRA - Watershed Management and Storm
Conveyance 0% (0) 7.69% (1) 53.85% (7) 15.38% (2) 23.08% (3) 3.54
44. QOL - Open Space Conservation and Habitat 0% (0) 8.33% (1) 50% (6) 25% (3) 16.67% (2) 3.5
45. Economy - Tourism 0% (0) 23.08% (3) 30.77% (4) 23.08% (3) 23.08% (3) 3.46
46. CS & INFRA - Pedestrian Design 0% (0) 15.38% (2) 38.46% (5) 30.77% (4) 15.38% (2) 3.46
47. CS & INFRA - Intermodal Freight Facilities 0% (0) 15.38% (2) 53.85% (7) 7.69% (1) 23.08% (3) 3.38
48. HC & SS - Other 7.69% (1) 15.38% (2) 38.46% (5) 7.69% (1) 30.77% (4) 3.38 49. Economy - Agriculture, Forestry, and Natural
Resources 0% (0) 23.08% (3) 46.15% (6) 15.38% (2) 15.38% (2) 3.23
50. CS & INFRA - Commodity Pipelines 0% (0) 30.77% (4) 30.77% (4) 23.08% (3) 15.38% (2) 3.23
51. Economy - Sports 8.33% (1) 16.67% (2) 50% (6) 8.33% (1) 16.67% (2) 3.08
52. Economy - Other 15.38% (2) 15.38% (2) 38.46% (5) 7.69% (1) 23.08% (3) 3.08
53. Economy - Energy Efficiency Options (Alternative Fuels, Renewable Fuels)
16.67% (2) 8.33% (1) 41.67% (5) 25% (3) 8.33% (1) 3
54. QOL - Other 0% (0) 27.27% (3) 54.55% (6) 9.09% (1) 9.09% (1) 3
55. CS & INFRA - Other 0% (0) 30.77% (4) 46.15% (6) 15.38% (2) 7.69% (1) 3
Industry Ranking Key: For each industry, please rank the importance of including goals and objectives for this industry in this CEDS document, according to the following scale: 1 = Strongly disagree to this being in this first CEDS document 2 = Disagree to this being in this first CEDS document 3 = Neutral 4 = Agree to this being in this first CEDS document 5 = Strongly agree to this being in this first CEDS document

Comprehensive Economic Development Strategy 2016
North Central Texas Council of Governments Page 82
Appendix G (continued)
SURVEY RESULTS BY CLUSTER — CLUSTER 4
Cluster 4 includes the following counties: Hunt, Kaufman and Rockwall.
Cluster 4 - Kaufman, Rockwall and Hunt Total Responses 6 In Ranking Order - Top 10 and Bottom 10 are Highlighted
1 2 3 4 5 Response Average
1. QOL - Youth Services 0% (0) 0% (0) 33.33% (2) 50% (3) 16.67% (1) 3.83
2. Economy - Retail 16.67% (1) 16.67% (1) 0% (0) 16.67% (1) 50% (3) 3.67 3. Economy - Energy Efficiency Options (Alternative
Fuels, Renewable Fuels) 0% (0) 0% (0) 33.33% (2) 66.67% (4) 0% (0) 3.67
4. QOL - Open Space Conservation and Habitat 0% (0) 0% (0) 66.67% (4) 0% (0) 33.33% (2) 3.67
5. CS & INFRA - Police and Fire 0% (0) 16.67% (1) 16.67% (1) 50% (3) 16.67% (1) 3.67
6. CS & INFRA - Aviation Facilities 0% (0) 0% (0) 50% (3) 33.33% (2) 16.67% (1) 3.67
7. Education - Universities/Colleges/Community Colleges 0% (0) 16.67% (1) 33.33% (2) 16.67% (1) 33.33% (2) 3.67
8. Economy - Manufacturing 16.67% (1) 0% (0) 33.33% (2) 16.67% (1) 33.33% (2) 3.5
9. Economy - Defense 0% (0) 0% (0) 66.67% (4) 16.67% (1) 16.67% (1) 3.5
10. Economy - Energy (Oil and Gas) 0% (0) 16.67% (1) 33.33% (2) 33.33% (2) 16.67% (1) 3.5 11. QOL - Comprehensive Land Use and
Development Options 16.67% (1) 0% (0) 16.67% (1) 50% (3) 16.67% (1) 3.5
12. QOL - Air Quality 16.67% (1) 0% (0) 16.67% (1) 50% (3) 16.67% (1) 3.5
13. QOL - Senior Services 0% (0) 16.67% (1) 33.33% (2) 33.33% (2) 16.67% (1) 3.5
14. QOL - Arts, Entertainment and Culture 0% (0) 16.67% (1) 33.33% (2) 33.33% (2) 16.67% (1) 3.5
15. CS & INFRA - Roads, Toll Roads, Railroads, Streets and Parking 16.67% (1) 0% (0) 33.33% (2) 16.67% (1) 33.33% (2) 3.5
16. CS & INFRA - Housing Stock/Diversity 16.67% (1) 0% (0) 33.33% (2) 16.67% (1) 33.33% (2) 3.5
17. CS & INFRA - Land and Buildings for Development 16.67% (1) 0% (0) 33.33% (2) 16.67% (1) 33.33% (2) 3.5
18. Education - Private Education 16.67% (1) 0% (0) 16.67% (1) 50% (3) 16.67% (1) 3.5
19. QOL - Other 0% (0) 0% (0) 80% (4) 0% (0) 20% (1) 3.4
20. CS & INFRA - Other 0% (0) 0% (0) 80% (4) 0% (0) 20% (1) 3.4
21. Economy - Construction/Real Estate 16.67% (1) 0% (0) 33.33% (2) 33.33% (2) 16.67% (1) 3.33
22. Economy - Sports 0% (0) 16.67% (1) 50% (3) 16.67% (1) 16.67% (1) 3.33
23. Economy - Technology 16.67% (1) 0% (0) 50% (3) 0% (0) 33.33% (2) 3.33
24. QOL - Community Amenities 16.67% (1) 0% (0) 50% (3) 0% (0) 33.33% (2) 3.33
25. QOL - Water Quality/Quantity 33.33% (2) 0% (0) 0% (0) 33.33% (2) 33.33% (2) 3.33
26. CS & INFRA - Local Government 16.67% (1) 16.67% (1) 16.67% (1) 16.67% (1) 33.33% (2) 3.33
27. CS & INFRA - Water, Sewers and Utility 33.33% (2) 0% (0) 0% (0) 33.33% (2) 33.33% (2) 3.33
28. CS & INFRA - Solid Waste Management 0% (0) 0% (0) 66.67% (4) 33.33% (2) 0% (0) 3.33
29. CS & INFRA - Interstate Highways 16.67% (1) 0% (0) 50% (3) 0% (0) 33.33% (2) 3.33
30. HC & SS - Children's Health 0% (0) 16.67% (1) 50% (3) 16.67% (1) 16.67% (1) 3.33
31. Education - Public Education 16.67% (1) 16.67% (1) 16.67% (1) 16.67% (1) 33.33% (2) 3.33
32. Education - Other 0% (0) 0% (0) 83.33% (5) 0% (0) 16.67% (1) 3.33
33. HC & SS - Other 0% (0) 0% (0) 80% (4) 20% (1) 0% (0) 3.2

Comprehensive Economic Development Strategy 2016
North Central Texas Council of Governments Page 83
34. Economy - Agriculture, Forestry, and Natural Resources 0% (0) 0% (0) 83.33% (5) 16.67% (1) 0% (0) 3.17
35. QOL - Scenic and Recreation 0% (0) 16.67% (1) 66.67% (4) 0% (0) 16.67% (1) 3.17
36. CS & INFRA - Intermodal Freight Facilities 16.67% (1) 0% (0) 50% (3) 16.67% (1) 16.67% (1) 3.17
37. CS & INFRA - Pedestrian Design 0% (0) 16.67% (1) 50% (3) 33.33% (2) 0% (0) 3.17
38. HC & SS - Hospitals 16.67% (1) 16.67% (1) 16.67% (1) 33.33% (2) 16.67% (1) 3.17
39. HC & SS - Home-Delivered Meals, Food Banks, Meals on Wheels, Congregate Meals, Community Centers
16.67% (1) 0% (0) 50% (3) 16.67% (1) 16.67% (1) 3.17
40. Education - Technology Transfer, Business Incubators, and Accelerators 16.67% (1) 16.67% (1) 16.67% (1) 33.33% (2) 16.67% (1) 3.17
41. CS & INFRA - Commodity Pipelines 0% (0) 16.67% (1) 66.67% (4) 16.67% (1) 0% (0) 3 42. CS & INFRA - Watershed Management and Storm
Conveyance 0% (0) 33.33% (2) 50% (3) 0% (0) 16.67% (1) 3
43. HC & SS - Local Clinics 16.67% (1) 16.67% (1) 33.33% (2) 16.67% (1) 16.67% (1) 3
44. HC & SS - Senior Health 20% (1) 20% (1) 20% (1) 20% (1) 20% (1) 3
45. HC & SS - Mental Health 16.67% (1) 16.67% (1) 33.33% (2) 16.67% (1) 16.67% (1) 3
46. Education - Vocational 33.33% (2) 0% (0) 33.33% (2) 0% (0) 33.33% (2) 3
47. Education - Related Businesses and Spin-offs 0% (0) 33.33% (2) 50% (3) 0% (0) 16.67% (1) 3
48. Economy - Banking 0% (0) 16.67% (1) 83.33% (5) 0% (0) 0% (0) 2.83
49. Economy - Intergovernmental Coordination 16.67% (1) 33.33% (2) 16.67% (1) 16.67% (1) 16.67% (1) 2.83
50. CS & INFRA - Public Transportation 33.33% (2) 0% (0) 33.33% (2) 16.67% (1) 16.67% (1) 2.83
51. CS & INFRA - Water Conservation and Resource Efficiency 16.67% (1) 16.67% (1) 50% (3) 0% (0) 16.67% (1) 2.83
52. CS & INFRA - Phone, Internet and Broadband 16.67% (1) 16.67% (1) 50% (3) 0% (0) 16.67% (1) 2.83
53. HC & SS - Telemedicine 20% (1) 20% (1) 40% (2) 0% (0) 20% (1) 2.8
54. Economy - Tourism 16.67% (1) 16.67% (1) 50% (3) 16.67% (1) 0% (0) 2.67
55. Economy - Other 33.33% (2) 0% (0) 50% (3) 16.67% (1) 0% (0) 2.5
Industry Ranking Key: For each industry, please rank the importance of including goals and objectives for this industry in this CEDS document, according to the following scale: 1 = Strongly disagree to this being in this first CEDS document 2 = Disagree to this being in this first CEDS document 3 = Neutral 4 = Agree to this being in this first CEDS document 5 = Strongly agree to this being in this first CEDS document

Comprehensive Economic Development Strategy 2016
North Central Texas Council of Governments Page 84
Appendix G (continued)
SURVEY RESULTS BY CLUSTER — CLUSTER 5
Cluster 5 includes the following counties: Collin, Dallas, Denton and Tarrant.
Cluster 5 - Denton, Collin, Tarrant and Dallas Total Response
s 100 In Ranking Order - Top 10 and Bottom 10 are
Highlighted
1 2 3 4 5 Response Average
1. Economy - Technology 1.02% (1) 2.04% (2) 10.2% (10) 29.59% (29) 57.14% (56) 4.4
2. QOL - Water Quality/Quantity 3.03% (3) 1.01% (1) 9.09% (9) 27.27% (27) 59.6% (59) 4.39
3. CS & INFRA - Roads, Toll Roads, Railroads, Streets and Parking 3.03% (3) 3.03% (3) 9.09% (9) 30.3% (30) 54.55% (54) 4.3
4. Education - Public Education 1.98% (2) 2.97% (3) 10.89% (11) 31.68% (32) 52.48% (53) 4.3 5. QOL - Comprehensive Land Use and
Development Options 1.96% (2) 1.96% (2) 11.76% (12) 39.22% (40) 45.1% (46) 4.24
6. CS & INFRA - Water, Sewers and Utility 2% (2) 2% (2) 18% (18) 28% (28) 50% (50) 4.22
7. Economy - Retail 3.03% (3) 5.05% (5) 10.1% (10) 34.34% (34) 47.47% (47) 4.18
8. Economy - Manufacturing 3% (3) 3% (3) 14% (14) 34% (34) 46% (46) 4.17
9. CS & INFRA - Public Transportation 3% (3) 3% (3) 15% (15) 32% (32) 47% (47) 4.17
10. QOL - Community Amenities 1% (1) 2% (2) 17% (17) 41% (41) 39% (39) 4.15
11. Education - Universities/Colleges/Community Colleges
3% (3) 4% (4) 15% (15) 36% (36) 42% (42) 4.1
12. CS & INFRA - Water Conservation and Resource Efficiency 3.03% (3) 4.04% (4) 16.16% (16) 36.36% (36) 40.4% (40) 4.07
13. Education - Vocational 2.02% (2) 2.02% (2) 23.23% (23) 36.36% (36) 36.36% (36) 4.03
14. QOL - Air Quality 2.02% (2) 6.06% (6) 21.21% (21) 29.29% (29) 41.41% (41) 4.02
15. Economy - Construction/Real Estate 1.98% (2) 1.98% (2) 24.75% (25) 35.64% (36) 35.64% (36) 4.01
16. CS & INFRA - Interstate Highways 4.04% (4) 4.04% (4) 20.2% (20) 32.32% (32) 39.39% (39) 3.99 17. Education - Technology Transfer,
Business Incubators, and Accelerators 1.98% (2) 2.97% (3) 27.72% (28) 28.71% (29) 38.61% (39) 3.99
18. CS & INFRA - Local Government 1% (1) 2% (2) 26% (26) 40% (40) 31% (31) 3.98
19. QOL - Scenic and Recreation 1% (1) 3% (3) 27% (27) 37% (37) 32% (32) 3.96
20. Economy - Intergovernmental Coordination 2.97% (3) 6.93% (7) 18.81% (19) 37.62% (38) 33.66% (34) 3.92
21. CS & INFRA - Police and Fire 1.01% (1) 8.08% (8) 23.23% (23) 33.33% (33) 34.34% (34) 3.92
22. CS & INFRA - Land and Buildings for Development 0% (0) 4.04% (4) 26.26% (26) 43.43% (43) 26.26% (26) 3.92
23. HC & SS - Hospitals 1.01% (1) 6.06% (6) 29.29% (29) 32.32% (32) 31.31% (31) 3.87
24. Economy - Tourism 2% (2) 8% (8) 25% (25) 34% (34) 31% (31) 3.84
25. CS & INFRA - Watershed Management and Storm Conveyance 1% (1) 9% (9) 27% (27) 36% (36) 27% (27) 3.79
26. CS & INFRA - Pedestrian Design 2.04% (2) 3.06% (3) 33.67% (33) 38.78% (38) 22.45% (22) 3.77 27. QOL - Open Space Conservation and
Habitat 1.01% (1) 7.07% (7) 34.34% (34) 37.37% (37) 20.2% (20) 3.69
28. HC & SS - Children's Health 2% (2) 8% (8) 33% (33) 33% (33) 24% (24) 3.69
29. CS & INFRA - Housing Stock/Diversity 0% (0) 13.13% (13) 28.28% (28) 38.38% (38) 20.2% (20) 3.66
30. Economy - Energy Efficiency Options (Alternative Fuels, Renewable Fuels) 1.98% (2) 11.88% (1
2) 28.71% (29) 34.65% (35) 22.77% (23) 3.64
31. CS & INFRA - Phone, Internet and Broadband 1.01% (1) 11.11% (1
1) 34.34% (34) 30.3% (30) 23.23% (23) 3.64

Comprehensive Economic Development Strategy 2016
North Central Texas Council of Governments Page 85
32. Economy - Energy (Oil and Gas) 5% (5) 8% (8) 34% (34) 27% (27) 26% (26) 3.61
33. CS & INFRA - Intermodal Freight Facilities 4.95% (5) 10.89% (1
1) 24.75% (25) 36.63% (37) 22.77% (23) 3.61
34. QOL - Arts, Entertainment and Culture 1.01% (1) 5.05% (5) 43.43% (43) 36.36% (36) 14.14% (14) 3.58 35. Education - Related Businesses and Spin-
offs 3.96% (4) 5.94% (6) 37.62% (38) 32.67% (33) 19.8% (20) 3.58
36. CS & INFRA - Solid Waste Management 2.02% (2) 8.08% (8) 39.39% (39) 32.32% (32) 18.18% (18) 3.57
37. HC & SS - Senior Health 2.02% (2) 10.1% (10) 31.31% (31) 42.42% (42) 14.14% (14) 3.57
38. HC & SS - Mental Health 1.02% (1) 10.2% (10) 40.82% (40) 30.61% (30) 17.35% (17) 3.53
39. QOL - Youth Services 1.03% (1) 9.28% (9) 41.24% (40) 35.05% (34) 13.4% (13) 3.51
40. QOL - Senior Services 0% (0) 8.33% (8) 45.83% (44) 34.38% (33) 11.46% (11) 3.49
41. Economy - Banking 3.06% (3) 11.22% (11) 37.76% (37) 30.61% (30) 17.35% (17) 3.48
42. CS & INFRA - Aviation Facilities 5.05% (5) 9.09% (9) 37.37% (37) 29.29% (29) 19.19% (19) 3.48
43. Economy - Defense 7.07% (7) 14.14% (14) 27.27% (27) 27.27% (27) 24.24% (24) 3.47
44. Education - Private Education 7.22% (7) 8.25% (8) 32.99% (32) 35.05% (34) 16.49% (16) 3.45
45. HC & SS - Local Clinics 1.02% (1) 14.29% (14) 38.78% (38) 34.69% (34) 11.22% (11) 3.41
46. HC & SS - Home-Delivered Meals, Food Banks, Meals on Wheels, Congregate Meals, Community Centers
4.08% (4) 12.24% (12) 38.78% (38) 30.61% (30) 14.29% (14) 3.39
47. Economy - Sports 5% (5) 14% (14) 40% (40) 24% (24) 17% (17) 3.34
48. Education - Other 10.23% (9) 1.14% (1) 55.68% (49) 14.77% (13) 18.18% (16) 3.3
49. Economy - Other 7.87% (7) 4.49% (4) 58.43% (52) 16.85% (15) 12.36% (11) 3.21
50. CS & INFRA - Commodity Pipelines 6.19% (6) 17.53% (17) 32.99% (32) 36.08% (35) 7.22% (7) 3.21
51. CS & INFRA - Other 5.38% (5) 7.53% (7) 59.14% (55) 17.2% (16) 10.75% (10) 3.2
52. QOL - Other 6.98% (6) 3.49% (3) 66.28% (57) 15.12% (13) 8.14% (7) 3.14
53. HC & SS - Telemedicine 4.12% (4) 17.53% (17) 50.52% (49) 19.59% (19) 8.25% (8) 3.1
54. Economy - Agriculture, Forestry, and Natural Resources 6.19% (6) 21.65% (2
1) 41.24% (40) 19.59% (19) 11.34% (11) 3.08
55. HC & SS - Other 7.78% (7) 10% (9) 58.89% (53) 18.89% (17) 4.44% (4) 3.02
Industry Ranking Key: For each industry, please rank the importance of including goals and objectives for this industry in this CEDS document, according to the following scale: 1 = Strongly disagree to this being in this first CEDS document 2 = Disagree to this being in this first CEDS document 3 = Neutral 4 = Agree to this being in this first CEDS document 5 = Strongly agree to this being in this first CEDS document
(Return to TOC)

Comprehensive Economic Development Strategy 2016
North Central Texas Council of Governments Page 86
APPENDIX H
ECONOMIC RESILIENCE
The North Central Texas Council of Governments (NCTCOG) coordinates a number of important programs related to economic resilience. The following programs are highlighted in this appendix:
o Continuity of Operations (COOP) o Emergency Management o Emergency Preparedness o Hazard Mitigation Plan o Long-term Recovery Workshops o Mobile Workforce Unit o National Incident Management System (NIMS) o Urban Shield Exercises o Workforce Development Role in Economic Resilience
• Continuity of Operations (COOP) — COOP is an initiative to ensure that agencies are able to continue performance of essential functions under a broad range of circumstances and emergencies, including localized acts of nature, accidents and technological or attack-related emergencies. To achieve this goal, the objective of organizations is to identify their essential functions and ensure that they can be continued throughout, or resumed rapidly after, a disruption of normal activities. A COOP plan establishes consistent performance metrics, prioritizes implementation plans, promulgates best practices, and facilitates consistent cross-agency continuity evaluations.
All of the NCTCOG counties have COOP plans in place, as they are required for them to receive federal and state grant funds.
• Emergency Management — The North Central Texas Regional Emergency Managers Group (REM) was established to provide an opportunity for Emergency Management professionals in North Central Texas to network regularly in order to discuss current issues and hear topical discussions or presentations, as well as to provide an organized format for correspondence with State or Federal contacts on issues important to the REM Group.
• Emergency Preparedness — Over the past several decades, the region has made progress in the area of economic resilience. The region has established a process by which it responds to, or mitigates, natural disasters and other disruptions. The NCTCOG Emergency Preparedness Planning Council serves in an advisory role to the NCTCOG Executive Board and is responsible for providing policy direction and oversight functions to the development and maintenance of a coordinated and integrated regional approach to emergency management planning and

Comprehensive Economic Development Strategy 2016
North Central Texas Council of Governments Page 87
response systems. The Council can also make recommendations as to how the region can most efficiently and effectively utilize state and/or federal financial assistance made available for emergency and disaster planning, mitigation, and recovery.
Established in November 2004, the Regional Emergency Preparedness Advisory Committee is a technical committee of the Emergency Preparedness Planning Council (EPPC), which was established and authorized by North Central Texas Council of Governments' Executive Board. The scope of the REPAC is to assist the Council in carrying out its duties and responsibilities and to formulate strategies and recommendations to affect an approach to accomplish coordinated and integrated emergency preparedness planning. The initial focus was on reviewing and approving regional homeland security projects. Subsequent activities will include strategic planning, project implementation, evaluation of ongoing regional projects, and other current and future issues facing our region.
REPAC membership consists of 16 county representatives, three urban area representatives, fourteen subject matter expert representatives, and leadership. The subject matter expert representatives come from a wide range of disciplines, including police, fire, emergency management, public works, communications, medical/public health, and education.
• Hazard Mitigation Plan — NCTCOG has worked with the counties in the region to prepare Hazard Mitigation Plans. Counties and jurisdictions entered into an Inter-local Agreement to work on the plans, which are submitted to the Federal Emergency Management Agency (FEMA) and the Texas Department of Emergency Management (TDEM) for approval. FEMA and TDEM are reviewing the plans together to reduce the amount of time required for the review.
Fourteen counties have worked through NCTCOG to produce their plan, and two counties, Kaufman and Rockwall counties, are coordinating their own plan. All 16 counties have prepared mitigation plans, and the status of the plans break down as follows:
Approved and Adopted:
o Hood County — submitted, approved by FEMA and TDEM, adopted by county and jurisdictions
o Navarro County — submitted, approved by FEMA and TDEM, adopted by county and jurisdictions
o Palo Pinto County — submitted, approved by FEMA and TDEM, adopted by county and jurisdictions
o Parker County — submitted, approved by FEMA and TDEM – adopted by county and some jurisdictions, and waiting for final resolutions from some jurisdictions
o Somervell County — submitted, approved by FEMA and TDEM, adopted by county and jurisdictions
o Tarrant County — submitted, approved by FEMA and TDEM – adopted by county and some jurisdictions, and waiting for final resolutions from some jurisdictions

Comprehensive Economic Development Strategy 2016
North Central Texas Council of Governments Page 88
Approved Pending Adoption:
o Erath County — submitted and approved by FEMA and TDEM, pending adoption; awaiting county and jurisdictional resolutions to be passed
o Hunt County — submitted and approved by FEMA and TDEM, pending adoption; awaiting county and jurisdictional resolutions to be passed
o Johnson County — submitted and approved by FEMA and TDEM, pending adoption; awaiting county and jurisdictional resolutions to be passed
Submitted and Under Review:
o Collin County — submitted and waiting for review from FEMA and TDEM o Dallas County — submitted and under review from FEMA and TDEM o Denton County — submitted and under review from FEMA and TDEM o Ellis County — submitted and under review from FEMA and TDEM o Wise County — submitted and under review from FEMA and TDEM
Kaufman County and Rockwall counties did not coordinate their plan through COG; rather, they are working on it on their own. Kaufman County has submitted their plan, and it is under review at FEMA and TDEM.
• Long-term Recovery Workshops — NCTCOG sponsors periodic seminars on long-term disaster recovery issues and challenges, bringing together entities throughout the region on a regular basis.
• Mobile Workforce Unit — The Workforce Solutions for North Central Texas Mobile Workforce Unit (MWU) is a 38-foot vehicle outfitted with 13 computer stations and a professional presentation system. The MWU is the perfect tool to aid employers in their recruitment and job fair efforts, as well as to respond to business or plant closures and other events involving significant job loss. Some employers who have used the MWU to aid in their recruitment and job fair efforts include: Amazon, McDonald’s, Teletech, North Central Texas College, and Walmart.
The MWU is a moving extension of the Workforce Centers, bringing services directly to customers in need. Through the multiple computer stations with internet access allow job seekers to search for jobs, improve their resumes and receive training wherever needed.
The MWU has also participated in many rapid response and disaster recovery events, giving those who lost their place of employment due to a lay-off or disaster, the opportunity to apply for unemployment benefits on site, search for a new job or update their resume. Some of these events include the wildfire disaster recovery in September 2011 in Bastrop; the fertilizer plant explosion disaster in April 2013 in West; the tornado disaster recovery in May 2013 in Ennis; and the tornado disaster recovery in June 2013 in Granbury.

Comprehensive Economic Development Strategy 2016
North Central Texas Council of Governments Page 89
• National Incident Management System (NIMS) Training — Developed by the Secretary of Homeland Security at the request of the President, the National Incident Management System (NIMS) integrates effective practices in emergency preparedness and response into a comprehensive national framework for incident management. The NIMS will enable responders at all levels to work together more effectively to manage domestic incidents no matter what the cause, size or complexity.
NCTCOG provides guidance to the region and hosts NIMS training courses to assist the local jurisdictions in the region in reviewing the NIMS training matrix and making sure the appropriate staffs and stakeholders are trained at the FEMA required levels.
• Urban Shield Exercises — NCTCOG sponsors multi-jurisdictional emergency response exercises, code-named NCT Urban Shield, designed to assess the region’s ability to successfully respond to, and manage, multiple manmade disasters and other emergencies occurring simultaneously. The overarching goal of the NCT Urban Shield exercise is to provide a multi-layered training exercise to enhance the skills and abilities of participating regional first responders, as well as those responsible for coordinating and managing large-scale events. The exercises are designed to strengthen information sharing, test interoperable communications, and improve operations planning.
Urban Shield is a one-of-a-kind program intended to bring components of the National Response Plan to life in an urban setting. This 24-hour continuous exercise occurs at regional critical infrastructure sites, with venues including hospitals, schools, government offices, a courthouse, mass transit passenger trains, and a sporting stadium. The National Incident Management System (NIMS) is used to coordinate events at these sites, located in over 14 venues throughout the region.
The exercise incorporates key elements of real-world emergencies and major critical incidents. Dynamic and realistic scenarios are designed to provide training, as well as to evaluate capabilities of a variety of regional emergency response teams, including Special Weapons and Tactics (SWAT), bomb squads, hazardous materials (HazMat), Urban Search and Rescue (USAR), Emergency Medical Services (EMS), and Emergency Operations Centers (EOC) throughout the region. Intelligence and Fusion centers, regional communications systems, Citizen Corps programs, and public information officers (PIO) groups are fully integrated into these exercises and are tested and evaluated, as well.
• Workforce Development Role in Economic Resiliency — The North Central Texas region is home to three workforce solutions programs, Workforce Solutions Greater Dallas, Workforce Solutions for Tarrant County, and the North Central Texas Workforce Solutions, which is facilitated by NCTCOG.
Year round, each of these Workforce Development Boards provides human resource partnerships to this region, offering employers assistance with recruitment; retention; labor market assistance; training; and reorganization, whether it is the result of restructuring,

Comprehensive Economic Development Strategy 2016
North Central Texas Council of Governments Page 90
downsizing, closing or slowdown. To people seeking employment, they provide job seeker services, youth services, Veterans services, disability services, training, and child care. Workforce centers are strategically located throughout the 16 counties to meet the needs of both the employer and the job seeker.
In the event of an economic downturn, in addition to the services mentioned above, the following services are coordinated such that teams are available to meet with individual businesses that are laying off workers in order to develop a customized plan specifically for them and their workers to manage or prevent layoffs. They also provide assistance that may help a business explore different markets or become more competitive through the use of technology.
Shared Work Program. The Shared Work program provides Texas employers with an alternative to layoffs. This voluntary program was developed to help employers and employees withstand a slowdown in business. The program allows employers to:
o Supplement their employees’ wages lost because of reduced work hours with partial unemployment benefits
o Reduce normal weekly work hours for employees in an affected unit by at least 10 percent but not more than 40 percent
Shared work unemployment benefits are payable to employees who qualify for and participate in an approved Shared Work Plan. Employees who qualify will receive both wages and Shared Work unemployment benefits.
Rapid Response. When businesses close plants or lay off workers, Texas Workforce Solutions can provide immediate on-site services to assist workers facing job losses. Rapid Response provides early intervention assistance designed to transition workers to their next employment as soon as possible. Rapid Response services are tailored to each company, based on the needs of the affected employees.
Mass Claims Program. The Mass Claims program streamlines the unemployment benefit claims process for employers faced with layoffs, whether permanent or temporary, of ten or more employees at one time. Employers can submit basic worker information on behalf of their employees to initiate claims for unemployment benefits.
Through this program, employers can:
o submit the layoff information before the layoff, which ensures a smooth transition for both employer and worker
o establish claims more efficiently than workers who submit their own unemployment benefits claims
o submit the worker's final week of earnings, helping to ensure proper payment

Comprehensive Economic Development Strategy 2016
North Central Texas Council of Governments Page 91
o submit information on severance pay or wages in lieu of notice of layoff, reducing subsequent contact by TWC
Additionally, through this program, employers are not inundated with a written notice of application for each individual who applies for unemployment benefits and they automatically become a party of interest of interest to each claim filed.
Trade Adjustment Assistance Program. This program assists workers who have lost or may lose their jobs as a result of foreign trade. The program provides adversely affected workers with opportunities to obtain the skills, credentials, resources and support necessary to become reemployed.
Job Seekers/Disasters Unemployment Assistance. This program provides unemployment benefits for individuals who lost their jobs or self-employment or who are no longer working as a direct result of a major disaster for which a disaster assistance period is declared, and who applied but are not eligible for regular unemployment benefits.
(Return to TOC)

Comprehensive Economic Development Strategy 2016
North Central Texas Council of Governments Page 92
APPENDIX I INDUSTRY SECTORS
Table 1 — Employment Cluster Location Quotient Industry Cluster Collin Dallas Denton Ellis Erath Hood Hunt Johnson Kaufman Navarro Palo Pinto Parker Rockwall Somervell Tarrant Wise
Advanced Materials 1.13 0.97 0.34 2.62 0.94 0.53 2.08 1.15 1.07 1.25 2.04 1.14 0.58 1.06 0.78 1.57
Agribusiness, Food Process & Tech 0.24 0.39 0.28 0.44 5.32 0.64 0.88 0.47 0.36 2.66 0.51 0.82 0.17 1.58 0.45 0.31
Apparel & Textiles 1.12 1.02 0.63 2.72 3.33 0.69 0.63 1.26 2.19 3.02 1.85 0.28 0.51 0.77 0.25
Arts, Entertainment, Recreation & Visitor Industries 0.77 0.81 0.67 0.43 0.6 0.85 0.33 0.46 0.46 0.43 0.84 0.33 0.81 1.45 0.91 0.4
Biomedical/Biotech (Life Sciences) 0.58 0.76 0.74 0.7 1.11 0.63 1.18 0.79 0.76 1.13 0.86 0.65 0.87 1.23 0.81 1.4
Business & Financial Services 1.73 1.77 1.02 0.28 0.38 0.6 0.47 0.33 0.35 0.34 0.26 0.37 0.64 0.63 0.94 0.28 Chemical & Chemical-based Products 0.2 0.89 0.42 7.63 1.87 0.79 4.36 3.26 0.47 2.95 1.76 1.22 0.8 0.88 1.09 2.49
Defense & Security 1.16 1.14 0.98 0.55 0.28 0.41 2.34 0.69 0.65 0.85 0.93 0.53 0.48 0.69 1.23 0.5
Education & Knowledge Creation 0.66 0.74 1.07 1.23 2.19 0.28 0.69 0.28 0.16 1.18 0.07 0.66 1.18 0.17 0.67 0.12
Energy (Fossil & Renewable) 0.92 1.12 0.9 0.73 0.56 3.33 1.13 2.34 1.11 1.29 3.71 2.5 0.99 6.38 1.06 4.99
Forest & Wood Products 0.39 0.92 0.84 3.29 1.86 0.67 2.86 2.21 3.81 0.97 0.23 0.37 0.65 0.2 0.95 0.39
Glass & Ceramics 0.09 0.65 0.84 9.17 5.1 2.56 0.09 2.78 0.47 9.97 1.65 3.71 1.2 0.55 2.24
Info Technology & Telecom 2.89 1.98 1.08 0.28 0.24 0.35 0.25 0.29 0.23 0.08 0.4 0.31 0.37 0.77 0.68 0.22
Transportation & Logistics 0.29 1.34 0.76 2.33 0.65 0.37 0.81 1.8 2.08 1.12 0.43 2.06 1.01 1.65 2.27 2.51
Manufacturing Supercluster 1.23 0.96 0.98 1.18 0.49 0.44 3.73 1.47 1.37 1.1 2.52 1.34 0.84 0.09 1.51 1.76
Primary Metal Manufacturing 0.71 0.47 0.12 8.55 12.38 0.42 4.81 8.77 6.56 0.16 0.79 0.26 2.03
Fabricated Metal Product Mfg. 0.43 0.83 0.74 1.98 0.6 0.89 0.52 2.69 3.48 0.81 1.15 2.18 2.31 1.12 2.53
Machinery Manufacturing 0.23 0.43 0.57 0.61 0.7 0.78 0.26 2.48 0.46 0.19 5.8 3.66 0.72 0.5 1.19 0.92 Computer & Electrical Product Manufacturing 4.63 2.22 0.65 0.03 0.59 0.23 0.95 0.18 0.32 0.56 3.97 0.2 0.19 0.4 0.31
Transportation Equipment Mfg. 0.05 0.6 2.12 0.45 0.1 0.12 11.06 1.23 0.29 2.02 0.41 0.44 0.07 3.43 2.89
Mining 0.22 0.17 0.38 1.48 0.21 12.27 0.31 7.07 0.77 1.58 3.76 3.49 0.76 0.59 3.64
Printing & Publishing 0.76 1.19 0.59 0.46 0.86 0.76 0.38 0.67 0.38 0.49 0.25 0.38 0.49 0.42 0.83 0.16
SOURCE: STATSAMERICA: Economic Modeling Specialist, Inc. Complete Employment Statistics

Comprehensive Economic Development Strategy 2016
North Central Texas Council of Governments Page 93
Appendix I (continued)
Table 2 — Resident Employment by Occupation Industry Cluster Collin Dallas Denton Ellis Erath Hood Hunt Johnson Kaufman Navarro Palo Pinto Parker Rockwall Somervell Tarrant Wise
Management, including Farmers &
Farm Managers 65,208 65,470 25,248 3,034 402 51,890 45,266 47,682 50,781 49,567 63,304 66,793 59,217 77,262 53,599 62,829
Business & Financial Operations 83,974 33,344 16,632 1,214 166 111,300 69,911 64,607 75,956 65,526 46,563 89,808 71,035
70,805 59,875
Computer & Mathematical 90,456 17,460 7,026 995 156 66,722 73,576 73,319 61,990 75,625 47,171 101,537 87,708 82,554 77,151 85,556
Architecture & Engineering 64,831 5,428 1,879 274 126 46,675 58,482 78,009 62,750 41,250 39,911 97,804 47,355
58,502 56,957
Life, Physical & Social Science 43,697 13,553 4,655 1,123 140 37,500 40,956 34,616 39,907 35,875 42,083 41,847 44,632 32,039 40,538 33,480
Community & Social Services 81,676 17,874 2,700 718 57 41,875 55,208 50,824 81,750 49,483 32,404 62,557 83,315
63,836 49,024
Legal 46,394 56,611 25,301 5,057 1,262 51,725 42,422 48,132 45,789 37,442 33,388 44,600 47,833 32,411 46,529 44,065
Education, Training & Library 40,465 21,822 6,691 732 260 27,241 31,477 50,750 22,372 15,938 16,591 29,673 42,976 2,500 34,677 22,100
Arts, Design, Entertainment, Sports & Media 61,431 45,088 16,595 2,767 785 49,196 53,790 56,786 53,513 43,462 55,260 55,000 59,681 40,227 55,699 42,045
Healthcare Practitioners & Technical 26,177 24,471 5,881 1,204 227 25,343 24,830 27,250 27,667 15,465 14,208 23,782 19,220
23,791 19,625
Healthcare Support 46,020 18,590 5,662 1,923 460 65,185 40,058 58,958 50,286 37,250 33,892 50,664 49,650 59,955 45,068 41,641
Protective Service 14,156 68,325 18,060 3,140 996 30,846 14,937 19,333 11,159 12,289 9,647 11,769 13,162 4,647 13,876 9,968
Food Preparation & Serving Related 18,117 59,585 10,119 2,587 735 23,232 25,477 35,656 16,711 11,664 13,675 20,106 19,552 19,196 18,316 14,974
Building & Grounds Cleaning and Maintenance * 15,891 33,304 12,290 1,814 707 50,233 27,321 31,295 15,273 14,912 13,776 12,614 13,636 38,170 14,906 10,651
Service: Personal Care & Service 38,474 122,670 47,918 8,639 2,132 36,832 34,246 43,958 30,000 21,262 15,938 27,984 41,200 38,125 30,056 28,540
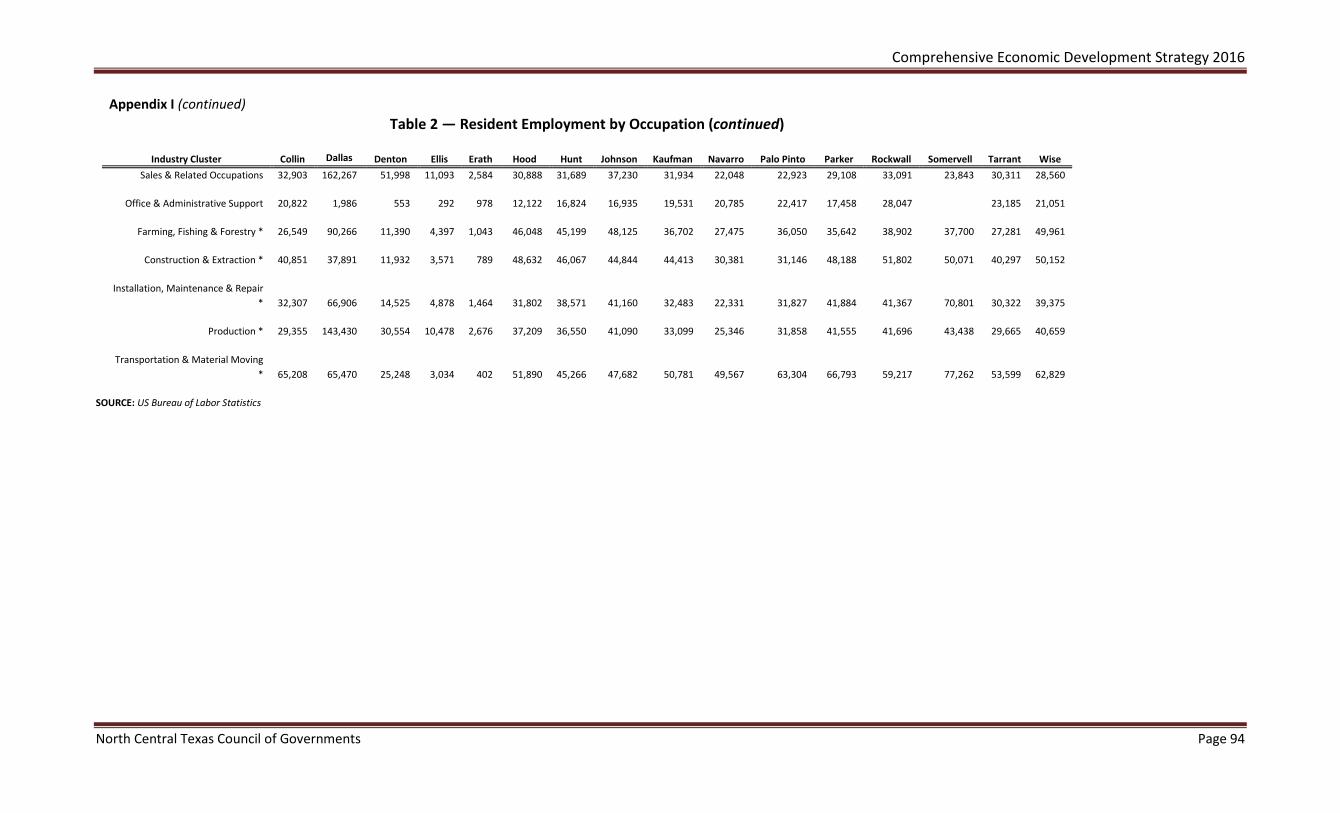
Comprehensive Economic Development Strategy 2016
North Central Texas Council of Governments Page 94
Appendix I (continued) Table 2 — Resident Employment by Occupation (continued)
Industry Cluster Collin Dallas Denton Ellis Erath Hood Hunt Johnson Kaufman Navarro Palo Pinto Parker Rockwall Somervell Tarrant Wise Sales & Related Occupations 32,903 162,267 51,998 11,093 2,584 30,888 31,689 37,230 31,934 22,048 22,923 29,108 33,091 23,843 30,311 28,560
Office & Administrative Support 20,822 1,986 553 292 978 12,122 16,824 16,935 19,531 20,785 22,417 17,458 28,047
23,185 21,051
Farming, Fishing & Forestry * 26,549 90,266 11,390 4,397 1,043 46,048 45,199 48,125 36,702 27,475 36,050 35,642 38,902 37,700 27,281 49,961
Construction & Extraction * 40,851 37,891 11,932 3,571 789 48,632 46,067 44,844 44,413 30,381 31,146 48,188 51,802 50,071 40,297 50,152
Installation, Maintenance & Repair * 32,307 66,906 14,525 4,878 1,464 31,802 38,571 41,160 32,483 22,331 31,827 41,884 41,367 70,801 30,322 39,375
Production * 29,355 143,430 30,554 10,478 2,676 37,209 36,550 41,090 33,099 25,346 31,858 41,555 41,696 43,438 29,665 40,659
Transportation & Material Moving * 65,208 65,470 25,248 3,034 402 51,890 45,266 47,682 50,781 49,567 63,304 66,793 59,217 77,262 53,599 62,829
SOURCE: US Bureau of Labor Statistics

Comprehensive Economic Development Strategy 2016
North Central Texas Council of Governments Page 95
Appendix I (continued)
Table 3 — Employment Cluster Location Quotient Industry Cluster Collin Dallas Denton Ellis Erath Hood Hunt Johnson Kaufman Navarro Palo Pinto Parker Rockwall Somervell Tarrant Wise
Managerial, Sales, Marketing & HR 1.35 1.31 1.17 0.91 0.76 0.89 0.9 0.88 0.88 0.8 0.88 0.96 1.04 0.91 1.05 0.87 Skilled Production Workers: Technicians, Operators, Trades, Installers & Repairers 0.71 0.92 0.88 1.3 0.98 1.22 1.32 1.42 1.34 1.16 1.32 1.38 0.91 1.81 1.1 1.36 Healthcare & Medical Science (Aggregate) 0.78 0.82 0.88 0.63 0.85 0.67 0.73 0.65 0.7 0.89 0.52 0.63 1.01 0.58 0.83 0.66 Healthcare & Medical Science (Medical Practitioners & Scientists) 0.96 0.9 0.88 0.64 0.7 0.62 0.72 0.6 0.62 0.75 0.41 0.61 1.05 0.47 0.79 0.52 Healthcare & Medical Science (Medical Technicians) 0.9 0.92 0.92 0.69 0.81 0.82 0.66 0.63 0.69 0.71 0.47 0.69 1.07 0.48 0.97 0.57 Healthcare & Medical Science (Therapy, Counseling & Rehabilitation) 0.67 0.76 0.86 0.61 0.91 0.64 0.76 0.68 0.73 0.99 0.57 0.62 0.97 0.65 0.79 0.73 Mathematics, Statistics, Data & Accounting 1.65 1.47 1.11 0.73 0.55 0.59 1.07 0.77 0.68 0.56 0.59 0.82 0.99 0.67 1 0.65 Legal & Financial Services, Insurance & Real Estate 1.44 1.35 1.05 0.79 0.8 0.9 0.78 0.93 0.8 0.8 0.78 0.98 1.22 0.77 1.01 0.74 Information Technology 2.23 1.72 1.33 0.61 0.33 0.35 1.11 0.58 0.59 0.28 0.33 0.57 0.76 0.51 1.2 0.46 Natural Sciences & Environmental Management 0.64 0.76 0.85 0.44 0.86 0.93 0.57 0.53 0.62 0.8 1.25 1.11 0.43 1.31 0.93 1.8 Agribusiness & Food Technology 0.46 0.16 0.82 2.77 6.6 3.68 4.56 2.69 4.12 5.27 5.7 4.52 0.8 4.22 0.21 6.15 Primary/Secondary & Vocational Education, Remediation & Social Services 0.98 0.86 1.16 1.24 0.76 1.05 1.11 1.14 1.24 1.12 1.1 1.01 1.2 1.14 0.98 1.06 Building, Landscape & Construction Design 0.95 1.18 0.73 0.69 0.96 1.36 0.91 0.8 0.86 0.69 1.05 0.89 1.1 3.51 1.15 0.69
Appendix I (continued)

Comprehensive Economic Development Strategy 2016
North Central Texas Council of Governments Page 96
Industry Cluster Collin Dallas Denton Ellis Erath Hood Hunt Johnson Kaufman Navarro Palo Pinto Parker Rockwall Somervell Tarrant Wise Engineering & Related Services 1.3 1.31 0.79 0.72 0.36 0.56 2.67 0.71 0.64 0.35 0.95 0.69 0.69 2.37 1.38 0.87 Personal Services Occupations 0.95 0.85 0.94 0.83 0.66 0.74 0.75 0.84 0.8 0.88 0.63 0.84 1 0.62 0.95 0.57 Arts, Entertainment, Publishing & Broadcasting 1.31 0.92 1.18 0.85 0.79 0.88 0.77 0.98 0.8 0.64 0.53 1.23 1.1 0.68 0.96 0.77 Public Safety & Domestic Security 0.67 0.71 0.96 0.9 1.59 0.85 1.22 0.84 1.11 1.15 1.08 0.81 0.81 1.03 0.99 0.93 Post-Secondary Education & Knowledge Creation 0.65 0.71 1.19 0.66 2.29 0.51 1.56 0.52 1.11 0.89 0.72 0.45 0.56 0.71 0.67 0.44 Technology-based Knowledge Clusters 1.48 1.3 1.1 0.67 0.75 0.53 1.27 0.65 0.7 0.55 0.58 0.67 0.83 0.82 1.02 0.62
SOURCE: STATSAMERICA: Economic Modeling Specialist, Inc. Complete Employment Statistics

Comprehensive Economic Development Strategy 2016
North Central Texas Council of Governments Page 97
Appendix I (continued)
Table 4 — Employee Earnings by NAICS NAICS Industry Collin Dallas Denton Ellis Erath Hood Hunt Johnson Kaufman Navarro Palo Pinto Parker Rockwall Somervell Tarrant Wise
11 Forestry, fishing, hunting, agriculture support
30,554
30,290
31,401
29,270
28,527
31,821
26,827
28,799
24,166
23,609
21,404
31,485
26,218
29,100
25,778
21 Mining 125,127
221,149
96,520
73,286
49,856
77,986
70,268
47,833
38,275
63,860
78,355
99,332
109,139
80,940
22 Utilities 54,604
115,996
71,380
127,032
69,045
72,879
61,423
78,256
65,331
62,607
76,783
58,184
85,513
100,940
84,837
23 Construction 61,092
55,455
54,123
43,579
38,696
40,922
41,397
42,625
46,173
54,028
31,868
41,897
47,637
44,992
50,951
47,169
31 Manufacturing 92,480
71,900
59,785
50,117
41,817
49,333
78,558
52,770
49,839
42,099
65,557
50,627
47,608
26,969
71,426
52,961
42 Wholesale Trade 94,404
80,656
76,503
56,421
33,714
52,951
45,487
52,596
60,824
39,041
50,217
54,554
55,868
61,801
64,013
44 Retail Trade 31,041
33,367
28,592
25,362
23,882
27,144
24,690
26,321
24,944
24,084
22,950
29,237
27,315
19,862
29,992
32,416
48 Transportation & Warehousing 45,923
50,904
39,778
43,537
39,047
53,873
50,374
46,796
50,326
37,392
58,254
55,783
36,913
48,642
60,278
55,113
51 Information 106,791
98,626
74,413
39,418
38,819
34,220
48,030
51,741
45,374
26,480
63,062
58,712
64,535
65,422
38,654
52 Finance & Insurance 82,681
88,748
65,750
44,394
41,195
59,909
45,525
43,756
54,352
38,878
53,497
49,445
58,492
70,142
51,745
53 Real Estate & Rental & Leasing 51,202
68,027
40,129
37,430
28,401
40,145
31,545
42,702
30,802
52,656
43,701
30,961
40,308
13,319
45,384
43,134
54
Professional, Scientific & Technical Services
84,971
93,632
71,242
43,793
38,980
51,591
34,517
56,240
40,476
53,795
62,535
90,228
69,753
48,947
55
Management of Companies & Enterprises
141,007
101,781
77,076
83,239
45,379
62,451
45,180
67,616
36,359
90,932
50,331
56 Administration & Support, Waste Management & Remediation
45,976
40,381
38,668
31,076
28,075
33,139
29,435
26,851
23,608
39,621
25,567
57,634
36,112
35,613
61 Educational Services 24,863
46,628
30,761
28,261
20,275
31,940
21,329
26,564
18,724
18,760
14,805
21,020
19,625
37,506
42,183
62 Healthcare & Social Assistance 48,802
53,403
43,450
36,117
36,245
35,532
29,445
31,504
32,142
31,671
27,516
36,478
44,340
49,436
26,138
71 Arts, Entertainment & Recreation 31,925
49,046
21,275
15,519
22,222
25,710
14,597
11,750
15,831
22,518
23,494
19,603
17,577
18,137
29,930
19,566
72 Accommodation & Food Services 18,641
22,170
15,654
14,183
12,487
14,763
13,780
13,696
13,316
13,695
13,177
15,335
16,426
17,591
17,581
13,334
81
Other Services (except Public Administration)
36,764
37,904
29,733
24,008
26,575
28,787
26,026
36,457
37,320
22,200
22,601
25,895
28,428
29,835
32,846
38,033
92 Public Administration
SOURCE: US Bureau of Labor Services (QCEW)
(Return to TOC)

Comprehensive Economic Development Strategy 2016
North Central Texas Council of Governments Page 98
APPENDIX J
CEDS COMMITTEE MEMBERS
More than 140 individuals, representing both the public and private sector throughout all 16 counties, served as members of the NCTCOG Comprehensive Economic Development Strategy (CEDS) committee, which put together this document.
Chair Jack Thompson, President Orasi Development Vice Chair Bill King Corsicana & Navarro County ED Chair, Cluster 1 Mary Poche’ Decatur EDC Chair Kevin Holzbog Bridgeport EDC Oneta Berghoefer City of Runaway Bay Ida Mae Burnett Decatur EDC J.D. Clark, County Judge Wise County Caryn Dunn Wise County Brandon Emmons City of Bridgeport Patricia Giller City of Runaway Bay Mark Krey Springtown Jesica McEachern City of Bridgeport Lisa Patterson Bridgeport EDC Jim Stegall, Farmer/Stockman C & S Dairy Holdings Janie Tucknies City of Runaway Bay Chair, Cluster 2 Warren Ketteman Former Granbury EDC Danny Chambers, County Judge Somervell County Betty Chew Stephenville Darrell Cockerham, County Judge Hood County Mike Ford Somervell County Ryan Norton Stephenville Kenny Weldon, Mayor City of Stephenville Chair, Cluster 3 Mickey Hillock Hillock Foods Doug Barnes Waxahachie EDC Justin Bond Burleson EDC Kassandra Carroll Waxahachie EDC H.M. Davenport, County Judge Navarro County Janie Havel, North Texas Region Rep. Office of the Governor Bill King Corsicana & Navarro County ED Mike Ramsey City of Waxahachie Paul Stevens, City Manager City of Waxahachie Kevin Strength, Mayor City of Waxahachie Daniel Strong, VP Sales & Marketing NadaMoo!

Comprehensive Economic Development Strategy 2016
North Central Texas Council of Governments Page 99
Chair, Cluster 4 Warren Ketteman Forney EDC Vice Chair Bonnie Hunter Commerce EDC Kim Buttram Greenville EDC Kim Dobbs City of Heath ED Sheri Franza Rockwall EDC Michael Hampton Rockwall EDC John Horn, County Judge Hunt County Larry Lott Royce City CDC Felicia Morris Rockwall County Greg Sims Greenville EDC Justin Weiss City of Fate ED Chair, Cluster 5 Craig Hulse City of North Richland Hills EDC Vice Chair Rick Loessberg Dallas County Ryan Adams Irving Kay Brown City of Irving Sally Bane Plano Ted Barron, City Manager City of Mesquite David Berzina, VP Economic Development Fort Worth Chamber of Commerce Aimee Bissett Denton Beth Bowman Irving David Bristol, CEO Employee Solutions Gena Camacho City of Watauga JJ Walker Cawelti, Manager Government Bell Helicopter & Community Affairs Madison Clark Farmers Branch Glenda Lara Davis Greater Irving-Las Colinas Chamber Duane Dankesreiter Dallas Regional Chamber Erica Estrada Fort Worth Chamber of Commerce Maria Evans Workforce Solutions Sarah Fickes City of Mesquite James Fisher, City Manager City of Murphy Jennifer Garcia Fort Worth Hispanic Chamber Tim Glass City of Dallas Bob Hart, City Manager City of Kennedale Ossana Hermosillo City of Fort Worth Linda Highwood City of Balch Springs ED Chris Hillman, City Manager City of Irving Mark Hindman, City Manager North Richland Hills John Hubbard City of Balch Springs ED Mindi Hurley City of Coppell Sherry Jackson Arlington Chamber of Commerce John Jacobs Richardson Chamber Wes Jurey, Executive Director Arlington Chamber of Commerce Cliff Keheley City of Mesquite Jennette Killingsworth Little Elm EDC Laurie Larrea, Executive Director Dallas Workforce Board

Comprehensive Economic Development Strategy 2016
North Central Texas Council of Governments Page 100
Antoine Long DeSoto EDC Opal Mauldin-Robertson, City Manager City of Lancaster Judy McDonald Tarrant Workforce Board Jenny McGary Tarrant County, Precinct 2 Brett McGuire, City Manager City of Lake Worth Lisa McMillian Tarrant County Erica Molett Cedar Hill EDC Michael Montgomery City of Celina Jason Moore City of Richland Hills Matt Mueller, Town Manager City of Little Elm Chris O'Brian City of Dallas ED Bruce Payne City of Arlington ED Jeremiah Quarles DeSoto EDC Shekar Rao Arlington Chamber of Commerce Connie Rash Workforce Solutions Greater Dallas Jacquelyn Reyff City of Watauga Kristen Roberts City of Murphy Mike Rosa Dallas Regional Chamber Tina Stelnicki City of Murphy ED Jennifer Stephens City of North Richland Hills Rona Stringfellow City of Lancaster Robert Sturns, Business Assistance Center City of Fort Worth Erica Sullivan City of Denton LaJeana Thomas Farmers Branch Allison Thompson City of Cedar Hill Jack Thompson, President Orasi Development Victoria Vaughan City of Watauga Carlos Vigil City of Sachse Stefanie Wagoner Frisco EDC Sue Walker Richardson EDP Vicki Watson City of Mesquite Scott Welmaker Mansfield ED Susan White City of Haltom City Debbie Whitley City of Lake Worth Marty Wieder City of Colleyville Robert Winningham Prosper EDC Jami Woodall City of Lake Worth Chair, Cluster 6 Dr. Jim Quick, Dean of Graduate Studies Southern Methodist University (University) Vice President for Research Dr. Mary Brumbach, Associate Vice Chancellor Dallas County Community College Strategic Initiatives District (DCCD) Dr. Carolyn Cason, Vice President, Research University of Texas-Arlington Dr. Dwayne Dimos, Vice President, Research University of Texas-Arlington Dr. Victor Fishman, Associated Vice President University of Texas at Dallas For Applied Research Dr. Bruce Gnade, Vice President for Research University of Texas at Dallas Brad Hancock, Dir. Neeley Entrepreneurship Ctr. Texas Christian University

Comprehensive Economic Development Strategy 2016
North Central Texas Council of Governments Page 101
Mark Hays, Vice Chancellor of Workforce Dallas County Community & Economic Development College District Dr. Mickey McCabe, Research Institute University of Texas-Arlington Executive Director Dr. Tom McCoy, Vice President for Research University of North Texas And Economic Development Dr. Bonnie Melhart, Associate Provost for Texas Christian University Research and Dean of Graduate Studies Dr. Geoffrey Orsak, Executive Director Texas Research Alliance Fred Schmidt, Manager of Community and Tarrant County College District Industry Education Harold Strong, Director, Discovery Park University of North Texas & Technology Transfer Dr. Pyeper Wilkins, Associate Vice Chancellor Dallas Community College District NCTCOG Staff Kent Anderson, Business Dev. Manager NCTCOG Stephanie Cecil, Senior Admin. Assistant NCTCOG Donna Coggeshall, Research Manager NCTCOG Mike Eastland, Executive Director NCTCOG Kevin Feldt, Program Manager NCTCOG Lucille Johnson, CEDS Project Director NCTCOG Kay O'Dell, Workforce Dev. Manager NCTCOG Janet Smith, Receptionist, Public Affairs NCTCOG Student Interns Leigh Collins, CAPSTONE PROJECT University of Texas-Arlington Marissa Paz, CAPSTONE PROJECT University of Texas-Arlington Salvador Portillo, CAPSTONE PROJECT University of Texas-Arlington Glen Showers, CAPSTONE PROJECT University of Texas-Arlington Deborah Vela, CAPSTONE PROJECT University of Texas-Arlington
(Return to TOC)