Comprehensive Annual Financial...
175
Comprehensive Annual Financial Report for the Fiscal Year Ended June 30, 2010 Kim R. Wallin, CMA, CFM, CPA State Controller State of Nevada
Transcript of Comprehensive Annual Financial...

ComprehensiveAnnualFinancialReport
for the Fiscal YearEnded June 30, 2010
Kim R. Wallin, CMA, CFM, CPA
State Controller
State of Nevada

Kim R. WalliN, CMA, CFM, CPA
State CoNtRolleR
Kim Wallin is a native Nevadan and is the first CPA to be elected to the office of State Controller in 50 years. She is the first CMA (Certified Management Accountant) to hold this office.
Kim is currently a member of the AGA Partnership for Intergovernmental Management and Accountability Steering Committee, a Director on the NASC Executive Committee and member of the IMA XBRL Committee. In addition she is a member of the Institute of Manage-ment Accountants, AICPA, NSCPA, NASACT and AGA. She recently served on a workgroup that was formed by an Executive Order to address improper payments. Nevada was one of only three States that were asked to serve on the workgroup.
In September 2003, Accounting Today recognized Wallin as one of the 100 most influential people in accounting in the country. In September 2006 she was named “Woman CPA of the Year” of the entire country by the American Women’s Society of CPA’s.
Kim is the former Chair of the Institute of Management Accountants (IMA), the world’s leading orga-nization dedicated to empowering management accounting and finance professionals to drive business performance. Wallin served as Chair of IMA in 2003-2004.
She served for two years on the Ethics Committee of the Nevada Society of CPA’s (NSCPA).
She is President of her own Las Vegas based accounting firm, D K Wallin, Ltd which she founded in 1984. Previously, she worked for Joseph F. Zerga, Ltd.
Wallin graduated from UNLV completing a degree in Business Administration with a major in account-ing.
Kim has been active with local service and volunteer organizations. She has been President of Soroptimist International of Creative Las Vegans and has served as the Treasurer for the Opus Dance Ensemble and the Actors Repertory Theatre.
Kim’s hobbies include wine tasting and gourmet cooking. She also enjoys working out, golf, skiing, hiking and even has a black belt in Aikido!

Letter of Transmittal.................................................................................................................................................................. Constitutional Officers............................................................................................................................................................... Organizational Chart.................................................................................................................................................................. GFOA Certificate of Achievement.............................................................................................................................................
Independent Auditor’s Report....................................................................................................................................................Management’s Discussion and Analysis....................................................................................................................................
Basic Financial Statements Government-Wide Financial Statements Statement of Net Assets............................................................................................................................................... Statement of Activities................................................................................................................................................ Fund Financial Statements Balance Sheet - Governmental Funds.......................................................................................................................... Reconciliation of the Governmental Funds Balance Sheet to the Statement of Net Assets....................................... Statement of Revenues, Expenditures and Changes in Fund Balances - Governmental Funds.................................. Reconciliation of Revenues, Expenditures and Changes in Fund Balances of Governmental Funds to the Statement of Activities....................................................................................................................... Statement of Net Assets - Proprietary Funds.............................................................................................................. Statement of Revenues, Expenses and Changes in Fund Net Assets - Proprietary Funds.......................................... Statement of Cash Flows - Proprietary Funds............................................................................................................. Statement of Fiduciary Net Assets - Fiduciary Funds................................................................................................. Statement of Changes in Fiduciary Net Assets - Fiduciary Funds.............................................................................. Notes to the Financial Statements........................................................................................................................................
Required Supplementary Information Budgetary Comparison Schedule - General Fund and Major Special Revenue Funds.............................................. Notes to Required Supplementary Information - Budgetary Reporting.................................................................... Schedule of Funding Progress - Pension Plans.......................................................................................................... Schedule of Infrastructure Condition and Maintenance Data.................................................................................... Combining Statements and Schedules Nonmajor Governmental Funds Combining Balance Sheet.......................................................................................................................................... Combining Statement of Revenues, Expenditures and Changes in Fund Balances................................................... Nonmajor Special Revenue Funds Combining Balance Sheet..................................................................................................................................... Combining Statement of Revenues, Expenditures and Changes in Fund Balances.............................................. Other Nonmajor Governmental Funds Combining Balance Sheet...................................................................................................................................... Combining Statement of Revenues, Expenditures and Changes in Fund Balances...............................................
table of CoNteNtS
fiNaNCial SeCtioN
iNtRoduCtoRy SeCtioN
10
12
2628
303334
3738414244
4547
84868788
9495
96100
104106
1678

Table 1 - Net Assets by Component...............................................................................................................................................Table 2 - Changes in Net Assets............................................................................................................................................Table 3 - Fund Balances of Governmental Funds.........................................................................................................................Table 4 - Changes in Fund Balances of Governmental Funds..............................................................................................Table 5 - Taxable Sales by County...............................................................................................................................................Table 6 - Principal Sales Tax Payers by Business Type........................................................................................................Table 7 - Ratios of Outstanding Debt by Type.....................................................................................................................Table 8 - Ratios of General Bonded Debt Outstanding........................................................................................................Table 9 - Legal Debt Margin Information........................................................................................................................................................Table 10 - Pledged Revenue Coverage..............................................................................................................................................Table 11 - Demographic and Economic Statistics........................................................................................................................Table 12 - Principal Employers...........................................................................................................................................................Table 13 - School Enrollment.................................................................................................................................................................Table 14 - Full-time Equivalent State Government Employees by Function..........................................................................Table 15 - Operating Indicators by Function..........................................................................................................................Table 16 - Capital Asset Statistics by Function.......................................................................................................................
Schedule of Total Uses - Budget and Actual, Non-GAAP Budgetary Basis - All General Fund Budgets.....................
Schedule of Total Uses - Budget and Actual, Non-GAAP Budgetary Basis - All Special Revenue Fund Budgets...................... Schedule of Sources - Budget and Actual, Non-GAAP Budgetary Basis - All Nonmajor Special Revenue Fund Budgets..................................................................................................................................... Nonmajor Enterprise Funds Combining Statement of Net Assets........................................................................................................................ Combining Statement of Revenues, Expenses and Changes in Fund Net Assets.................................................... Combining Statement of Cash Flows....................................................................................................................... Internal Service Funds Combining Statement of Net Assets.......................................................................................................................... Combining Statement of Revenues, Expenses and Changes in Fund Net Assets.................................................... Combining Statement of Cash Flows........................................................................................................................Fiduciary Funds Combining Statement of Fiduciary Net Assets–Pension and Other Employee Benefit Trust, Investment Trust and Private–Purpose Trust Funds............................................................................................................................ Combining Statement of Changes in Fiduciary Net Assets–Pension and Other Employee Benefit Trust, Investment Trust and Private–Purpose Trust Funds............................................................................................................................. Combining Statement Fiduciary Assets and Liabilites–Agency Funds..................................................................... Combining Statement of Changes in Assets and Liabilities - Agency Funds...........................................................
CompliaNCe SeCtioN
StatiStiCal SeCtioN
fiNaNCial SeCtioN (continued)
Independent Auditor’s Report on Internal Control over Financial Reporting and on Compliance and Other Matters.......
108117
120
124126128
132134136
140142144146
150150152152154155155156157158159160161161162164
168
table of CoNteNtS (continued)NEVADA

1
State of Nevada
Office of State ControllerCarson City, Nevada 89701-4786
Kim R. Wallin, CMA, CFM, CPA Office: (775) 684-5777State Controller Fax: (775) 684-5696
State of Nevada
Office of State ControllerCarson City, Nevada 89701-4786
Kim R. Wallin, CMA, CFM, CPAState Controller
Office: (775) 684-5632Fax: (775) 684-5696
December 20, 2010
To the Citizens, Governor and Legislators of the State of Nevada:
In accordance with Nevada Revised Statutes (NRS) 227.110 and the State Accounting Procedures Law (NRS 353.291 through 353.3245), I am pleased to present the State of Nevada Comprehensive Annual Financial Report (CAFR) for the fiscal year ended June 30, 2010. The objective of this Report is to provide a clear picture of the government as a single, unified entity as well as providing traditional fund-based financial statements.
IntroductIon to the report
Responsibility: The Controller’s Office prepares the State of Nevada CAFR and is responsible for the accuracy, completeness, and fairness of the presentation, including disclosures. To the best of our knowledge and belief, the information contained in the State of Nevada CAFR is accurate in all material respects and is reported in a manner that fairly presents the financial position and results of operations of the State’s primary government and the compo-nent units for which it is financially accountable. Additionally, this report includes all disclosures necessary to enable the reader to gain a reasonable understanding of Nevada’s financial activities.
Generally Accepted Accounting Principles: As required by State Accounting Procedures Law, this report has been prepared in accordance with generally accepted accounting principles (GAAP), applicable to State and Local Governments as established by the Governmental Accounting Standards Board (GASB). The State also volun-tarily follows the recommendations of the Government Finance Officer’s Association (GFOA) for the contents of government financial reports and participates in the GFOA’s review program for the Certificate of Achievement for Excellence in Financial Reporting.
Internal Control Structure: The State of Nevada has established a comprehensive internal control framework designed to both safeguard the government’s assets against loss from unauthorized use or theft, and to properly record and adequately document transactions. As a result, the transactions can be compiled into the presentation of the State’s financial statements in conformity with GAAP. Since the cost of internal controls should not outweigh their benefits, the State’s comprehensive framework of internal controls has been designed to provide reasonable, rather than absolute, assurance that the financial statements will be free from material misstatement.
Many of the essential control features are decentralized. Consequently, the State relies upon the controls in place within the various State departments and agencies. NRS 353A.025 requires the head of each agency to review their internal controls on a periodic basis to determine if the agency is in compliance with the Uniform System of Internal Accounting and Administrative Controls adopted pursuant to NRS 353A.020. On or prior to July 1st of even-numbered years, agencies are required to report the status of their internal controls to the Department of Administration.

2
Independent Auditors: The independent accounting firm of Kafoury, Armstrong & Co. has audited the accompa-nying financial statements in accordance with generally accepted governmental auditing standards. Their opinion appears in the Financial Section of this publication. The goal of the independent audit is to provide reasonable assurance that the financial statements of the State of Nevada are free of material misstatement. We received an unqualified opinion on the basic financial statements for this fiscal year.
The independent audit of the financial statements of the State of Nevada is part of a broader, federally mandated Single Audit designed to meet the special needs of federal grantor agencies. The standards governing Single Audit engagements require the independent auditor to report not only on the fair presentation of the financial statements, but also on the audited government’s internal controls and compliance with legal requirements, with special empha-sis on internal controls and legal requirements involving the financial statements. This report can be found in the Compliance Section of the CAFR, as well as in the State of Nevada’s separately issued Single Audit Report.
Management’s Discussion and Analysis: Generally accepted accounting principles require management to provide a narrative introduction, overview and analysis to accompany the basic financial statements in the form of Management’s Discussion and Analysis (MD&A). This letter of transmittal is designed to complement the MD&A and should be read in conjunction with it.
profIle of Government
Background: The State of Nevada was admitted to the Union in 1864 and is bordered by five other states. The Great Basin Desert dominates the landscape, with the Sierra Nevada Mountains to the west and the Rocky Moun-tains to the east. Over 80 percent of Nevada’s 70,264,320 acres are owned and managed by the federal government. Approximately 88 percent of our 2.7 million residents live in two distinct population centers, Washoe County in the northwest and Clark County at the southeast tip, separated by 450 miles.
The State of Nevada does not levy a personal income tax. The State’s economy and tax base are dependent upon the interrelated gaming and tourism industries as well as upon federal activities, mining, warehousing, manufacturing, and agriculture.
The State operates under a constitution which provides for a full range of services, including education, health and social services, highway maintenance and construction, law enforcement, public safety, business regulation, and resource development.
Reporting Entity: The State of Nevada reporting entity reflected in the State of Nevada CAFR, which is more fully described in Note 1 to the basic financial statements, conforms to the requirements of GASB Statement No. 14. The accounting and reporting principles contained in Statement No. 14 are based primarily upon the fundamen-tal concept that publicly elected officials are accountable to their constituents, and that financial statements should emphasize primary government and permit financial statement users to distinguish between the primary government and its component units.
The primary government includes the Public Employees, Legislators and Judicial Retirement Systems, and the Nevada Real Property Corporation. The State Legislature retains significant governing powers over these entities. The Nevada System of Higher Education and the Colorado River Commission are shown separately as component units to emphasize that they are legally separate from the State.
Financial Information
Debt Management: The State Constitution limits the aggregate principal amount of the general obligation debt to two percent of the total reported assessed property value of the State. Additional disclosures regarding the State’s long-term obligations are provided in Note 8 to the basic financial statements.

3
Long Term Financial Planning and Financial Policies: The State’s statute requires a balanced budget (NRS 353.205) and is designed to limit the growth of spending from the General Fund to the growth of population and inflation (NRS 353.213). The Governor must submit a proposed budget for the Executive Branch to the State Legis-lature before each regular session, which convenes every odd-numbered year. The Legislature enacts the budget through passage of the General Appropriations Act and the Authorized Expenditures Act. Once passed and signed, the budget becomes the State’s financial plan for the next two fiscal years.
In accordance with State statute, The Economic Forum, comprised of private economic and financial experts appointed by the Legislature and the Governor, sets the General Fund revenue forecasts which are binding on the budget. If revenues fall below those originally anticipated during the course of the fiscal year, the Governor must revise the budget to ensure that State appropriations do not exceed revenues. If the revisions exceed thresholds specified in NRS 353.220, they must be submitted to the Legislative Interim Finance Committee for approval.
economIc outlook
Nevada will continue to struggle through a slow recovery before reaching economic stability, but the heavy cuts to the 2010 budget and a more realistic perspective have begun to bring spending in line with revenues. In 2010 General Fund revenue increased over last year by $700 million, with $198 million resulting from increased taxes and $487 million from intergovernmental federal funding. In addition, 2011 monthly tax and fee collections to date are 7.8% more than budgeted. The American Recovery and Reinvestment Act (ARRA) funds have provided relief during the current budget cycle; however, they will be fully expended in the short term and are not expected to be extended. Short-term tax increases will expire as well.
The Economic Forum revenue forecast of $5.3 billion for the 2012-2013 biennium is 17% ($1.1 billion) less than existing spending levels and $3 billion less than the budget requests from State agencies. The greatest impact on the upcoming budget will be covering for the loss of $592 million in ARRA funds and another $552 million of expired local taxes that had supported schools. The State will also incur the added cost of $240 million in Medicare case-load and rate increases, $105.7 million in interest due on Unemployment Trust funds borrowed from the federal government to pay unemployment claims, and a $78 million increase in school health benefit costs. When the 2012-2013 biennial budget is finalized in the upcoming legislative session, fewer dollars will translate to reduced services in all areas of government.
Gaming revenues reached a six-year low in 2010, but they have begun to see signs of recovery. The first quarter of 2011 had a healthy 2.3% increase over the previous quarter. Revenues were still down year over year, but nowhere near the 14% decline seen during 2009. Hotel occupancy had been stagnant, but average daily room rates are up 6%, and visitor volume from January to June in Las Vegas is up 4.3% compared to last year. The weak national economy, higher unemployment rates, higher foreclosure rates and increased competition for gaming customers are all seen as contributing to falling revenues for the gaming industry. Unemployment in Nevada was 14.3% in June, and while the private sector added 3,400 jobs during that month, the construction industry lost an estimated 2,400 jobs as projects reached completion. The U.S. Bureau of Labor Statis-tics has put the actual unemployment rate closer to 22%, including those working part-time for economic reasons and discouraged workers not actively seeking employment. The State’s unemployment rate rose to an all-time high of 14.5% in September, but was immediately followed by a substantial drop to 13.7% in October, and employment projections for the State indicate moderate growth through 2013. Nevada continues to have the highest foreclosure rate in the country for the 43rd straight month. As the national recovery begins to take hold and stimulate a rebound for Nevada, the State is focused on important opportunities to diversify its economy, but to do that Nevada will need a more educated workforce.
major InItIatIves
Resource Development: Nevada’s sustainable energy initiative gained momentum during 2010, and clean energy is now the fastest-growing industry in the State. Our renewable energy standard is one of the most aggressive in the nation; by the year 2025 at least 25% of energy sold to consumers must be from renewable sources with at least 6% from solar by 2016.

4
National, state, tribal, and local governments recently entered into an agreement to use 25-square miles of the former Nevada Nuclear Test Site for a Solar Demonstration Zone that will test innovative, utility-scale solar energy tech-nologies and demonstrate their commercial viability. The site will allow companies to gain valuable field results in order to bring their projects quickly to market, while ensuring that Nevada is at the center of this promising industry.
Currently, the State’s renewable energy base (in Megawatts) is 120 of solar, 375 of geothermal, 1 of wind, 7 of biomass and 1,100 of hydroelectric. Projects with permits in place will add 776 of solar, 568 of geothermal and 350 of wind, and an additional 108 such projects are under development. Now that these resources are being developed in earnest, one challenge is getting them to the electricity grid. Transmission from remote locations is an urgent issue, especially if Nevada is to become a net exporter of renewable energy. Solutions include the 235-mile “ON Line” that will deliver renewable energy to market, scheduled for completion by early 2013.
The Nevada Commission on Economic Development is focused on attracting suppliers and manufacturers to our State that build and operate these renewable energy plants on a worldwide scale. Amonix, a California-based leader in the manufacture of photovoltaic systems, has chosen North Las Vegas to open a new manufacturing plant that will bring 300 jobs to the area with an estimated economic impact of $608 million.
Nevada’s favorable corporate tax structure and business-friendly policies complement our 270 days of sunshine, broad expanses of windy desert and unique potential for geothermal production, all of which reinforce the State’s advantage in this emerging economy.
Education: A critical lack of funding is straining the education system. Administrators, teachers and parents will have to use existing resources or creatively find funding sources to prepare the rising generation of Nevadans. K-12 education continues to make steady gains in both national and state level tests, and in reducing achievement gaps. Nevada students increased their math scores from 2003-2009 at a rate greater than the national average. The State Board of Education has adopted a rigorous set of state-led education standards, Common Core State Standards (CCSS), which establish mathematics and English language arts as the foundation of curriculum, instruction and assessments.
Each year students must meet the target set for the federal Adequate Yearly Progress (AYP). Due to budget cuts only 45% of elementary schools, 37% of middle schools and 72% of high schools met the requirements, which was a slight decline over last year. On a positive note, 46 schools were “designated” as High Achieving and nine received the highest honor of Exemplary. Educators will look to these successful schools as instructional models for improving statewide graduation rates and meeting AYP targets.
The Nevada System of Higher Education (NSHE) currently serves over 114,000 students and enrollment has increased again for the 11th year in a row. Our colleges and universities are a vital economic resource, the conduit to an educated population capable of supporting stable industries in a stronger economy. They intend to recruit, retain and graduate 1,064 more students each year through 2020 by renewing their commitment to excellence and efficiency. To achieve this they have proposed fee restructuring, accelerated degree programs, credit limitations on degrees, streamlining transfer agreements, stricter review of programs with too small numbers of graduates, and providing incentives to shorten the time it takes to get a degree. As part of the plan they will be funding research designed to bring high-tech businesses to Nevada, focusing on green technologies and renewable energy, water and natural resources, biotechnology and health care. It’s critical for Nevada’s economy to have an educated workforce. Failure to do so will have long term effects on all segments of Nevada’s society and economy.
Health and Human Services: Nevada began the year with one of the lowest per capita Medicaid enrollments in the country, but the number of Medicaid recipients increased by 22% during the year. As caseload growth acceler-ated more than anticipated, ARRA funds helped keep benefit and eligibility cuts to a minimum. Unfortunately, the State will need to add $240 million to the budget for Medicaid. As expected, demand for social programs hit hard; Temporary Assistance to Needy Families (TANF) recipients increased 29%, food stamp recipients increased 45%, and the number of WIC participants in 2010 increased 10% to 870,000. Program cuts and a decline in our popu-lation resulted in a decrease in the number of mental health clients and the number of at-risk children supported through Welfare during the year.

5
The State continues to study the impact of the Affordable Care Act, which could impact the State’s ability to provide other services when it takes effect in 2014.
Transportation: The Nevada Department of Transportation (NDOT) obligated all $201 million of its ARRA funds one month ahead of schedule and was one of the first three states to obligate all of their allotted ARRA money. All 17 Nevada counties received funds, resulting in approximately 70 ARRA funded projects statewide. More than $120 million went to projects in Clark County. An estimated $26 million was for construction of the I-580/Meado-wood Interchange project in Washoe County, while various projects throughout other areas of the State improved rural Nevada roads. Projects were selected based on engineering need and ability to advance jobs and economic growth while equitably providing transportation improvements. Highway preservation projects such as repaving were selected because they help repair roadways before more costly repairs are needed.
NDOT’s first design-build project, the $250 million widening of I-15 north of Las Vegas, was completed 20 months early and within budget. This project is one of ten finalists in the 2010 America’s Transportation Awards.
The Hoover Dam Bypass project was also completed ahead of schedule and within budget at a total cost of $240 million. Combined with the impressive Colorado River Bridge and Boulder City Bypass, the US 93/95 interchange will provide the region with a much safer and less congested corridor when all phases of the plan are complete.
awards and acknowledGments
GFOA Certificate of Achievement: The GFOA awarded a Certificate of Achievement for Excellence in Financial Reporting to the State of Nevada for its CAFR for the fiscal year ended June 30, 2009. In order to be awarded a Certificate of Achievement, a government must publish an easily readable and efficiently organized CAFR that satisfies both generally accepted accounting principles and applicable legal requirements. A copy of the GFOA Certificate of Achievement is included in the Introductory Section of the CAFR.
A Certificate of Achievement is valid for only a one-year period. We believe our current CAFR continues to meet the requirements of Certificate of Achievement Program and we are submitting it to the GFOA to determine its eligibility for another certificate.
Acknowledgments and Conclusion: This report would not have been possible without the hard work, dedication and professionalism of my staff and the cooperation and assistance from all State Agencies, Legislature and the Judiciary. I sincerely appreciate the efforts of all the individuals involved. The Nevada State Controller’s Office is committed to advancing accountability, continuity and efficiency in the State’s financial operations.
Sincerely,
Kim R. Wallin, CMA, CFM, CPANevada State Controller

6
Jim GibbonsGovernor ross miller
secretary of state
brian KrolicKilieutenant Governor
Kim r. Wallincontroller
Kate marshalltreasurer
catherine cortez mastoattorney General
State of Nevada CoNStitutioNal offiCeRS
7
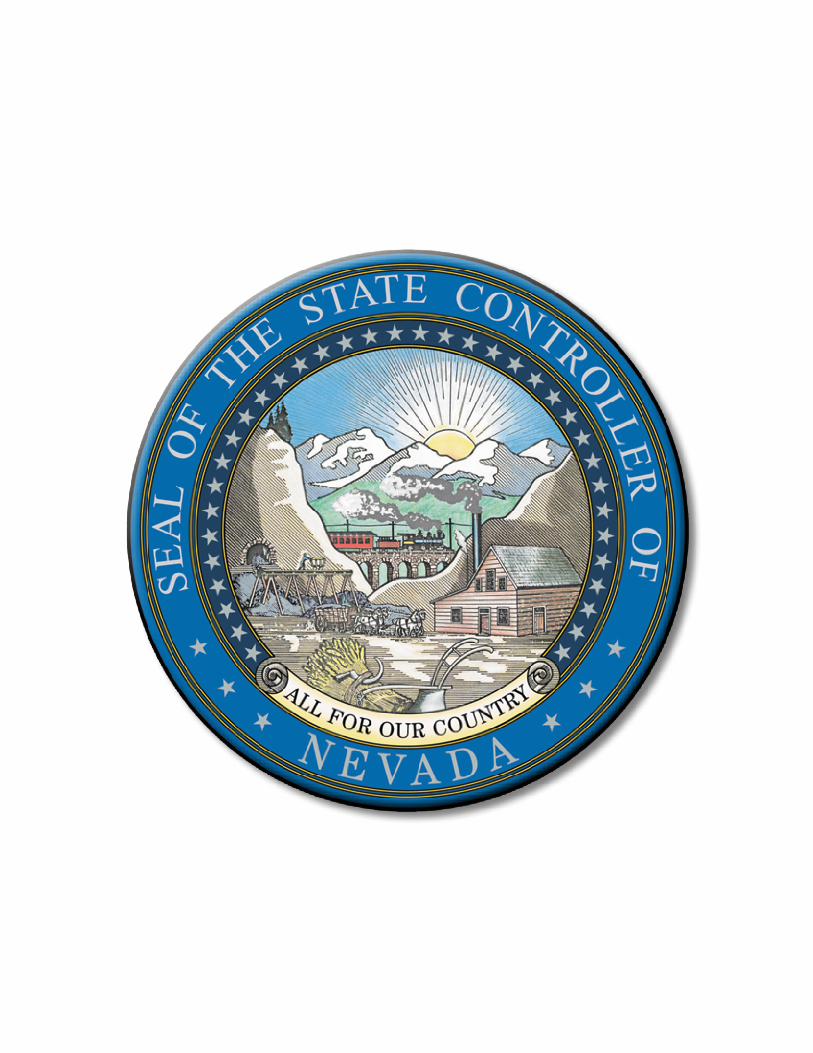
Citizens
ExecutiveBranchJudicialBranch LegislativeBranch
Governor*
LieutenantGovernor* SecretaryofState*
Treasurer* Controller*
AttorneyGeneral* UniversitiesandColleges*
SupremeCourt*
DistrictCourts*
Justices’Courts*
MunicipalCourts*
Senate* Assembly*
AdministrationAgriculture
BusinessandIndustryColoradoRiverCommission
ConservationandNaturalResourcesCorrections
CulturalAffairsEducation
Employment,TrainingandRehabilitationGaming
HealthandHumanServicesInformationTechnology
MilitaryMotorVehiclesPersonnel
PublicEmployeesBenefitsPublicEmployeesRetirement
PublicSafetyTaxation
TransportationVeterans’Services
Wildlife
*ElectedOfficials
oRgaNizatioNal ChaRt
MiscellaneousBoardsandCommissions

8
Certificate ofAchievementfor Excellence
in FinancialReporting
Presented to
State of Nevada
For its Comprehensive AnnualFinancial Report
for the Fiscal Year EndedJune 30, 2009
A Certificate of Achievement for Excellence in FinancialReporting is presented by the Government Finance Officers
Association of the United States and Canada togovernment units and public employee retirement
systems whose comprehensive annual financialreports (CAFRs) achieve the higheststandards in government accounting
and financial reporting.
President
Executive Director

9
Financial Section
Thunder Canyon Golf CourseWashoe Valley, NV Photo by: Laura Jones

10
10
Independent Auditor’s Report
The Honorable Kim Wallin, CMA, CFM, CPA State Controller We have audited the accompanying financial statements of the governmental activities, the business-type activities, the aggregate discretely presented component units, each major fund, and the aggregate remaining fund information of the State of Nevada, as of and for the year ended June 30, 2010, which collectively comprise the State of Nevada’s basic financial statements as listed in the table of contents. These financial statements are the responsibility of the State of Nevada’s management. Our responsibility is to express opinions on these financial statements based on our audit. We did not audit: Government-Wide Financial Statements
the financial statements of the Housing Division, which represent 63.17 percent of the assets and 3.50 percent of the revenues of the business-type activities;
the financial statements of the Nevada System of Higher Education and the Colorado River
Commission, both of which are discretely presented component units.
Fund Financial Statements the financial statements of the Housing Division Enterprise Fund;
the financial statements of the Self Insurance and Insurance Premiums Internal Service Funds, which
represent less than one percent of the assets and 4.92 percent of the revenues of the aggregate remaining fund information;
the financial statements of the Pension Trust Funds and the Other Employee Benefit Trust Fund –
State Retirees’ Fund, which in the aggregate represent 73.50 percent of the assets and 46.61 percent of the revenues of the aggregate remaining fund information;
the financial statements of the Nevada College Savings Plan – Private Purpose Trust Fund, which
represents 17.80 percent of the assets and 30.65 percent of the revenues of the aggregate remaining fund information;
the financial statements of the Retirement Benefits Investment Fund, which represent less than one
percent of the assets and revenues of the aggregate remaining fund information. Those financial statements were audited by other auditors whose reports thereon have been furnished to us, and our opinion, insofar as it relates to the amounts included for the above-mentioned funds and entities, is based on the reports of the other auditors.

11
We conducted our audit in accordance with auditing standards generally accepted in the United States of America and the standards applicable to financial audits contained in Government Auditing Standards, issued by the Comptroller General of the United States. Those standards require that we plan and perform the audit to obtain reasonable assurance about whether the financial statements are free of material misstatement. The financial statements of the Higher Education Tuition Trust Enterprise Fund, the Self Insurance and Insurance Premiums Internal Service Funds, the Pension Trust Funds and the Other Employee Benefit Trust Fund – State Retirees’ Fund, the Nevada College Savings Plan – Private Purpose Trust Fund, and the Retirement Benefits Investment Fund were not audited in accordance with Government Auditing Standards. An audit includes examining, on a test basis, evidence supporting the amounts and disclosures in the financial statements. An audit also includes assessing the accounting principles used and significant estimates made by management, as well as evaluating the overall financial statement presentation. We believe that our audit and the reports of other auditors provide a reasonable basis for our opinions. In our opinion, based on our audit and the reports of other auditors, the financial statements referred to above present fairly, in all material respects, the respective financial position of the governmental activities, the business-type activities, the aggregate discretely presented component units, each major fund, and the aggregate remaining fund information of the State of Nevada, as of June 30, 2010, and the respective changes in financial position and, cash flows, where applicable, thereof for the year then ended in conformity with accounting principles generally accepted in the United States of America. In accordance with Government Auditing Standards, we have also issued our report dated December 17, 2010 on our consideration of the State of Nevada’s internal control over financial reporting and on our tests of its compliance with certain provisions of laws, regulations, contracts, and grant agreements and other matters. The purpose of that report is to describe the scope of our testing of internal control over financial reporting and compliance and the results of that testing, and not to provide an opinion on the internal control over financial reporting or on compliance. That report is an integral part of an audit performed in accordance with Government Auditing Standards and should be considered in assessing the results of our audit. Management’s discussion and analysis on pages 12 through 22, the budgetary comparison schedule, the notes to required supplementary information-budgetary reporting, the schedule of funding progress and the schedule of infrastructure condition and maintenance data, collectively on pages 84 through 88, are not required parts of the basic financial statements but are supplementary information required by accounting principles generally accepted in the United States of America. We and the other auditors have applied certain limited procedures, which consisted principally of inquiries of management regarding the methods of measurement and presentation of the required supplementary information. However, we did not audit the information and express no opinion on it. Our audit was conducted for the purpose of forming opinions on the financial statements that collectively comprise the State of Nevada’s basic financial statements. The introductory section, combining statements, schedules, and statistical section are presented for purposes of additional analysis and are not a required part of the basic financial statements. The combining statements and schedules have been subjected to the auditing procedures applied by us and the other auditors in the audit of the basic financial statements and, in our opinion, based on our audit and the reports of other auditors, are fairly stated in all material respects in relation to the basic financial statements taken as a whole. The introductory and statistical sections as listed in the table of contents have not been subjected to the auditing procedures applied by us and the other auditors in the audit of the basic financial statements and accordingly, we express no opinion on them. Reno, Nevada December 17, 2010
12
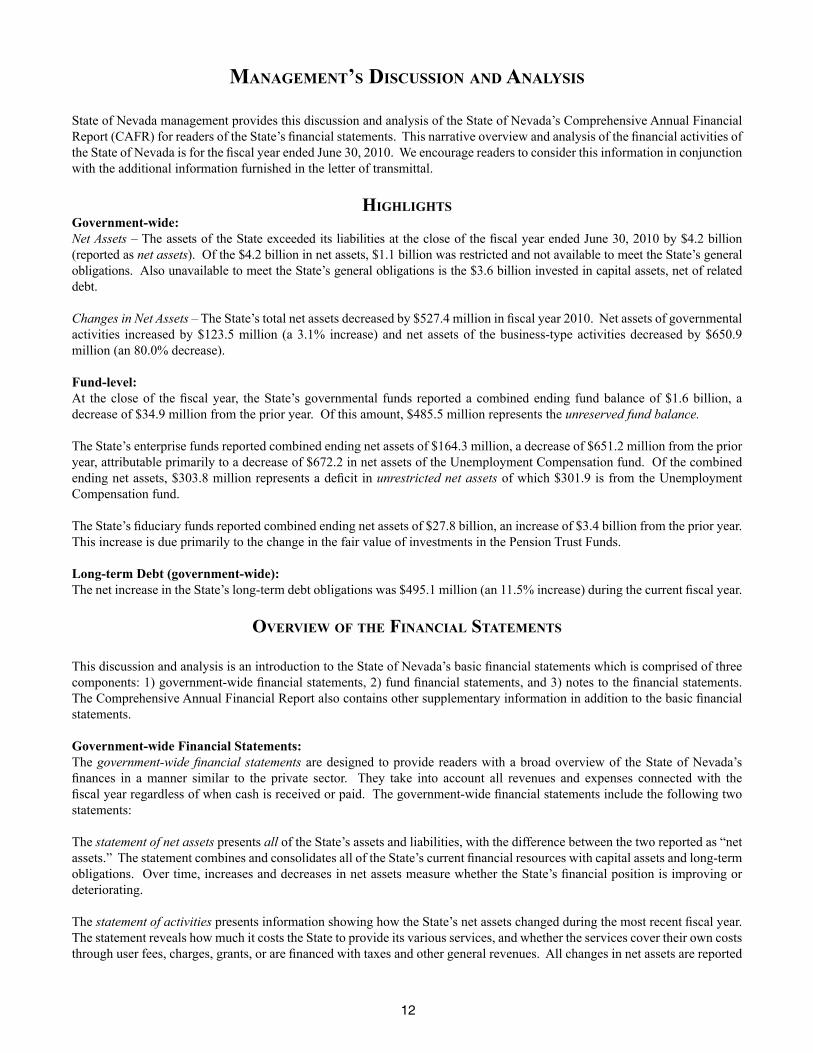
ManageMent’s Discussion anD analysis
State of Nevada management provides this discussion and analysis of the State of Nevada’s Comprehensive Annual Financial Report (CAFR) for readers of the State’s financial statements. This narrative overview and analysis of the financial activities of the State of Nevada is for the fiscal year ended June 30, 2010. We encourage readers to consider this information in conjunction with the additional information furnished in the letter of transmittal.
HigHligHtsGovernment-wide:Net Assets – The assets of the State exceeded its liabilities at the close of the fiscal year ended June 30, 2010 by $4.2 billion (reported as net assets). Of the $4.2 billion in net assets, $1.1 billion was restricted and not available to meet the State’s general obligations. Also unavailable to meet the State’s general obligations is the $3.6 billion invested in capital assets, net of related debt.
Changes in Net Assets – The State’s total net assets decreased by $527.4 million in fiscal year 2010. Net assets of governmental activities increased by $123.5 million (a 3.1% increase) and net assets of the business-type activities decreased by $650.9 million (an 80.0% decrease).
Fund-level:At the close of the fiscal year, the State’s governmental funds reported a combined ending fund balance of $1.6 billion, a decrease of $34.9 million from the prior year. Of this amount, $485.5 million represents the unreserved fund balance.
The State’s enterprise funds reported combined ending net assets of $164.3 million, a decrease of $651.2 million from the prior year, attributable primarily to a decrease of $672.2 in net assets of the Unemployment Compensation fund. Of the combined ending net assets, $303.8 million represents a deficit in unrestricted net assets of which $301.9 is from the Unemployment Compensation fund.
The State’s fiduciary funds reported combined ending net assets of $27.8 billion, an increase of $3.4 billion from the prior year. This increase is due primarily to the change in the fair value of investments in the Pension Trust Funds.
Long-term Debt (government-wide):The net increase in the State’s long-term debt obligations was $495.1 million (an 11.5% increase) during the current fiscal year.
overview of tHe financial stateMents
This discussion and analysis is an introduction to the State of Nevada’s basic financial statements which is comprised of three components: 1) government-wide financial statements, 2) fund financial statements, and 3) notes to the financial statements. The Comprehensive Annual Financial Report also contains other supplementary information in addition to the basic financial statements.
Government-wide Financial Statements:The government-wide financial statements are designed to provide readers with a broad overview of the State of Nevada’s finances in a manner similar to the private sector. They take into account all revenues and expenses connected with the fiscal year regardless of when cash is received or paid. The government-wide financial statements include the following two statements:
The statement of net assets presents all of the State’s assets and liabilities, with the difference between the two reported as “net assets.” The statement combines and consolidates all of the State’s current financial resources with capital assets and long-term obligations. Over time, increases and decreases in net assets measure whether the State’s financial position is improving or deteriorating.
The statement of activities presents information showing how the State’s net assets changed during the most recent fiscal year. The statement reveals how much it costs the State to provide its various services, and whether the services cover their own costs through user fees, charges, grants, or are financed with taxes and other general revenues. All changes in net assets are reported

13
as soon as the underlying event occurs, regardless of the timing of cash flows. Therefore, some revenue and expenses reported in this statement will not result in cash flows until future fiscal periods (e.g., uncollected taxes and earned but unused leave).
Both government-wide statements above report three types of activities:
Governmental Activities – Taxes and intergovernmental revenues primarily support these activities. Most services normally associated with State government fall into this category, including general government, health and social services, education and support services, law, justice and public safety, regulation of business, transportation, recreation and resource development, interest on long-term debt and unallocated depreciation.
Business-type Activities – These activities are intended to recover all, or a significant portion, of the costs of the activities by charging fees to customers. The Housing Division and Unemployment Compensation are examples of the State’s business-type activities.
Discretely Presented Component Units – Component units are legally separate organizations for which the elected officials of the government are financially accountable or have significant influence in governing board appointments. The State has two discretely presented component units – the Nevada System of Higher Education and the Colorado River Commission. Complete financial statements of the individual component units can be obtained from their respective administrative offices.
Fund Financial Statements:A fund is an accounting entity consisting of a set of self-balancing accounts to track funding sources and spending for a particular purpose. The State’s funds are broken down into three types:
Governmental funds – Most of the State’s basic services are reported in governmental funds. These funds focus on short-term inflows and outflows of expendable resources as well as balances left at the end of the fiscal year available to finance future activities. These funds are reported using the flow of current financial resources measurement focus and the modified accrual basis of accounting.
The governmental fund financial statements focus on major funds and provide additional information that is not provided in the government-wide financial statements. It is useful to compare the information presented for governmental funds with similar information presented for governmental activities in the government-wide financial statements. By doing so, readers may better understand the long-term impact of the government’s near-term financing decisions. A reconciliation is provided between the governmental fund statements and the governmental activities in the government-wide financial statements.
Proprietary funds – When the State charges customers for the services it provides, whether to outside customers (enterprise funds) or to other State agencies (internal service funds), the services are generally reported in the proprietary funds. Proprietary funds apply the accrual basis of accounting utilized by private sector businesses, and there is a reconciliation between the government-wide financial statement business-type activities and the enterprise fund financial statements. Because internal service fund operations primarily benefit governmental funds, they are included with the governmental activities in the government-wide financial statements.
Fiduciary funds – These funds are used to account for resources held for the benefit of parties outside the state government. For instance, the State acts as a trustee or fiduciary for its employee pension plans, and it is also responsible for other assets that, because of a trust arrangement, can be used only for the trust beneficiaries. Fiduciary funds are reported using the accrual basis of accounting. The government-wide statements exclude fiduciary fund activities and balances because these assets are restricted in purpose and do not represent discretionary assets of the State to finance its operations.
Notes to the Financial Statements:The notes to the financial statements provide additional information that is essential to a full understanding of the data provided in both the government-wide and fund financial statements.
Required Supplementary Information:The required supplementary information includes budgetary comparison schedules for the General Fund and major special revenue funds, along with notes and a reconciliation of the statutory and generally accepted accounting principles (GAAP) fund balances at fiscal year-end. This section also includes a schedule of funding progress for certain pension trust funds and a schedule of infrastructure condition and maintenance data.

14
TotalChange
2010 2009 2010 2009 2010 2009 2010-2009
AssetsCurrent and other assets 3,299,428$ 3,390,666$ 1,904,758$ 2,040,393$ 5,204,186$ 5,431,059$ (226,873)$ Net capital assets 5,330,157 5,198,108 10,986 10,360 5,341,143 5,208,468 132,675
Total assets 8,629,585 8,588,774 1,915,744 2,050,753 10,545,329 10,639,527 (94,198)
LiabilitiesCurrent liabilities 1,399,495 1,458,110 78,624 79,965 1,478,119 1,538,075 (59,956)Long-term liabilities 3,148,576 3,172,628 1,672,864 1,153,620 4,821,440 4,326,248 495,192
Total liabilities 4,548,071 4,630,738 1,751,488 1,233,585 6,299,559 5,864,323 435,236
Net AssetsInvested in capital assets, net of related debt 3,622,787 3,492,205 3,615 3,286 3,626,402 3,495,491 130,911Restricted 683,526 702,743 464,346 819,348 1,147,872 1,522,091 (374,219)Unrestricted (deficit) (224,799) (236,912) (303,705) (5,466) (528,504) (242,378) (286,126)
Total net assets 4,081,514$ 3,958,036$ 164,256$ 817,168$ 4,245,770$ 4,775,204$ (529,434)$
Activities Activities Total
State of Nevada's Net Assets-Primary Government(expressed in thousands)
Governmental Business-type
Other Supplementary Information:Other supplementary information includes combining financial statements for non-major governmental, non-major enterprise, all internal service and all fiduciary funds. The non-major funds are added together, by fund type, and presented in single columns in the basic financial statements. Other supplementary information also contains budgetary schedules of total uses for the General Fund and special revenue fund budgets, as well as a schedule of sources for non-major special revenue fund budgets.
governMent-wiDe financial analysis
The State’s overall financial position and operations for the fiscal years ended June 30, 2010 and 2009 for the primary government are summarized in the following statements based on the information included in the government-wide financial statements.
Net Assets:As noted earlier, net assets may serve over time as a useful indicator of a government’s financial position. The State’s combined net assets (governmental and business-type activities) totaled $4.2 billion at the end of 2010, compared with $4.8 billion at the end of the previous year.
The largest portion of the State’s net assets ($3.6 billion or 85%) reflects its investment in capital assets such as land, buildings, improvements other than buildings, equipment, construction in progress, infrastructure and rights-of-way, less any related debt still outstanding that was used to acquire those assets. The State uses these capital assets to provide services to its citizens; consequently, these assets are not available for future spending. Although the State’s investment in its capital assets is reported net of related debt, it should be noted that the resources needed to repay this debt must be provided from other sources, since the capital assets themselves cannot be used to liquidate these liabilities.
An additional portion of the State’s net assets of $1.1 billion or 27% represents resources that are subject to external restrictions on how they may be used. At the close of the fiscal year, the State reported an unrestricted net assets deficit of $528.5 million or -12%, as compared to a $242.4 million deficit in the prior year. Although general revenues in the form of gaming taxes, sales and use taxes, and motor taxes were lower, total government-wide revenues increased over the prior year, due primarily to additional federal funds received through the American Recovery and Reinvestment Act which includes stimulus, Medicaid and unemployment compensation programs. Even so, the unrestricted net assets deficit occurred because the increase in government-wide expenses exceeded the revenues received. The majority of the increase in government-wide expenses was due to the $897 million increase in unemployment insurance benefits paid. Nevada’s unemployment rate is significantly higher
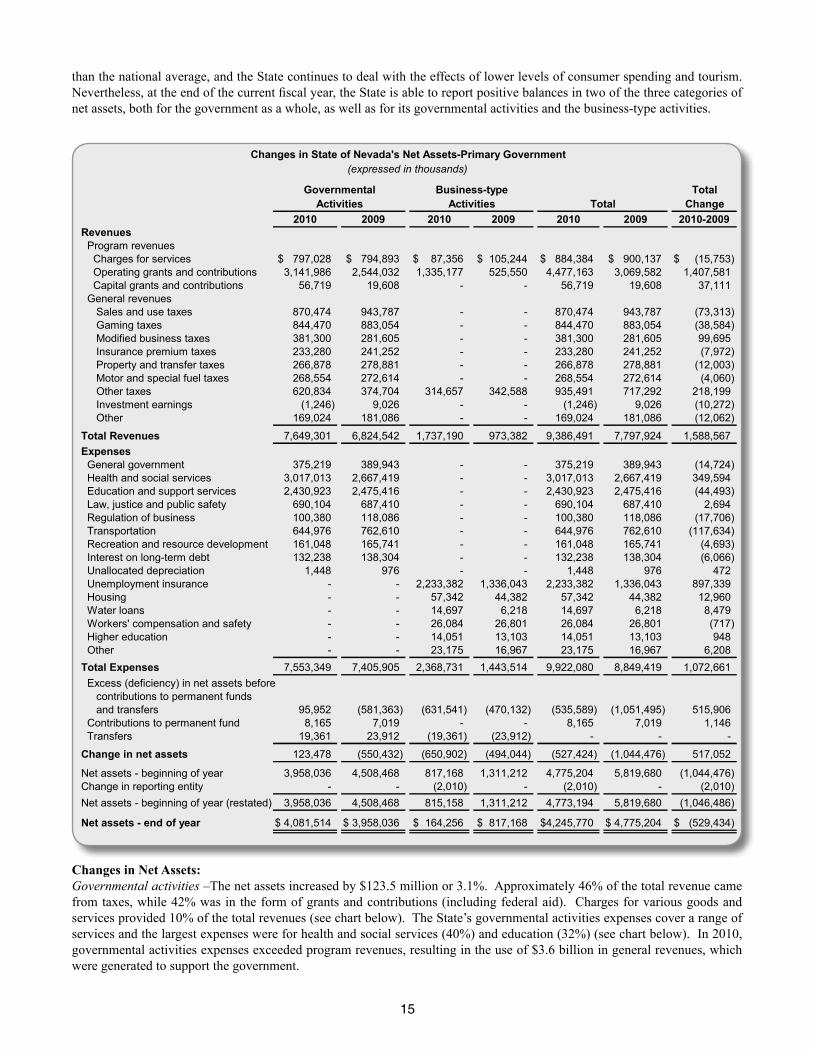
than the national average, and the State continues to deal with the effects of lower levels of consumer spending and tourism. Nevertheless, at the end of the current fiscal year, the State is able to report positive balances in two of the three categories of net assets, both for the government as a whole, as well as for its governmental activities and the business-type activities.
Changes in Net Assets:Governmental activities –The net assets increased by $123.5 million or 3.1%. Approximately 46% of the total revenue came from taxes, while 42% was in the form of grants and contributions (including federal aid). Charges for various goods and services provided 10% of the total revenues (see chart below). The State’s governmental activities expenses cover a range of services and the largest expenses were for health and social services (40%) and education (32%) (see chart below). In 2010, governmental activities expenses exceeded program revenues, resulting in the use of $3.6 billion in general revenues, which were generated to support the government.
15
TotalChange
2010 2009 2010 2009 2010 2009 2010-2009Revenues Program revenues Charges for services 797,028$ 794,893$ 87,356$ 105,244$ 884,384$ 900,137$ (15,753)$ Operating grants and contributions 3,141,986 2,544,032 1,335,177 525,550 4,477,163 3,069,582 1,407,581 Capital grants and contributions 56,719 19,608 - - 56,719 19,608 37,111 General revenues Sales and use taxes 870,474 943,787 - - 870,474 943,787 (73,313) Gaming taxes 844,470 883,054 - - 844,470 883,054 (38,584) Modified business taxes 381,300 281,605 - - 381,300 281,605 99,695 Insurance premium taxes 233,280 241,252 - - 233,280 241,252 (7,972) Property and transfer taxes 266,878 278,881 - - 266,878 278,881 (12,003) Motor and special fuel taxes 268,554 272,614 - - 268,554 272,614 (4,060) Other taxes 620,834 374,704 314,657 342,588 935,491 717,292 218,199 Investment earnings (1,246) 9,026 - - (1,246) 9,026 (10,272) Other 169,024 181,086 - - 169,024 181,086 (12,062)
Total Revenues 7,649,301 6,824,542 1,737,190 973,382 9,386,491 7,797,924 1,588,567Expenses General government 375,219 389,943 - - 375,219 389,943 (14,724) Health and social services 3,017,013 2,667,419 - - 3,017,013 2,667,419 349,594 Education and support services 2,430,923 2,475,416 - - 2,430,923 2,475,416 (44,493) Law, justice and public safety 690,104 687,410 - - 690,104 687,410 2,694 Regulation of business 100,380 118,086 - - 100,380 118,086 (17,706) Transportation 644,976 762,610 - - 644,976 762,610 (117,634) Recreation and resource development 161,048 165,741 - - 161,048 165,741 (4,693) Interest on long-term debt 132,238 138,304 - - 132,238 138,304 (6,066) Unallocated depreciation 1,448 976 - - 1,448 976 472 Unemployment insurance - - 2,233,382 1,336,043 2,233,382 1,336,043 897,339 Housing - - 57,342 44,382 57,342 44,382 12,960 Water loans - - 14,697 6,218 14,697 6,218 8,479 Workers' compensation and safety - - 26,084 26,801 26,084 26,801 (717) Higher education - - 14,051 13,103 14,051 13,103 948 Other - - 23,175 16,967 23,175 16,967 6,208Total Expenses 7,553,349 7,405,905 2,368,731 1,443,514 9,922,080 8,849,419 1,072,661 Excess (deficiency) in net assets before contributions to permanent funds and transfers 95,952 (581,363) (631,541) (470,132) (535,589) (1,051,495) 515,906 Contributions to permanent fund 8,165 7,019 - - 8,165 7,019 1,146 Transfers 19,361 23,912 (19,361) (23,912) - - -
Change in net assets 123,478 (550,432) (650,902) (494,044) (527,424) (1,044,476) 517,052
Net assets - beginning of year 3,958,036 4,508,468 817,168 1,311,212 4,775,204 5,819,680 (1,044,476)Change in reporting entity - - (2,010) - (2,010) - (2,010)Net assets - beginning of year (restated) 3,958,036 4,508,468 815,158 1,311,212 4,773,194 5,819,680 (1,046,486)
Net assets - end of year 4,081,514$ 3,958,036$ 164,256$ 817,168$ 4,245,770$ 4,775,204$ (529,434)$
Activities Activities Total
Changes in State of Nevada's Net Assets-Primary Government(expressed in thousands)
Governmental Business-type

The following chart depicts the governmental activities revenues for the fiscal year:
The following chart depicts the governmental activities expenses for the fiscal year:
The following table depicts the total program revenues and expenses for each function of governmental activities:
Business-type activities –The net assets decreased by $651 million or 80%. Approximately 18% of the total revenue came from taxes, while 77% was in the form of grants and contributions (including federal aid). Charges for various goods and services provided 5% of the total revenues (see chart below). The State’s business-type activities expenses cover a range of services. The largest expenses were for unemployment compensation (94%) and housing (2%) (see chart below). In 2010, business-type activities expenses exceeded program revenues by $946.2 million. Of this amount, unemployment compensation was the largest, with net expenses of $982 million, resulting in the use of $315 million in general revenues generated by and restricted to the Unemployment Compensation Fund.
16
Health and social services 3,017,013 39.94% 40%Education 2,430,923 32.18% 32%Law, justice 690,105 9.14% 9%Transportation 644,976 8.54% 9%Other 770,332 10.20% 10%Total 7,553,349 100% 100%
Health and social services
40%
Education32%
Law, justice 9%
Transportation9%
Other10%
Charges for services 797,028 10.42% 10%Grants and contributions 3,198,705 41.82% 42%Taxes 3,485,790 45.57% 46%Investment earnings and other 167,778 2.19% 2%Total 7,649,301 100% 100%
Charges for services
10%
Grants and contributions
42% Taxes46%
Investment earnings and
other2%
Expenses RevenueGeneral Government 375,219$ 342,565$ Health and Social Services 3,017,013 2,075,962Education 2,430,923 531,317Law, Justice 690,104 388,214Regulation 100,380 97,838Transportation 644,976 481,270Recreation 161,048 77,742
Total 7,419,663$ 3,994,908$
Revenues and Expenses by Function: Governmental Activities(expressed in thousands)

The following chart depicts the business-type activities revenues for the fiscal year:
The following chart depicts the business-type activities expenses for the fiscal year:
The following table depicts the total program revenues and expenses for each function for business-type activities:
Although the net assets of the governmental activities had an increase of $124 million, the net assets of the business-type activities had a $651 million decrease, resulting in a decline in the State government’s overall financial position. Net assets of the governmental activities increased 3.1% during 2010, however, 2009 declined 12.2%. The net assets of the business-type activities had an 80% decline, on top of a 38% decline in 2009. Both Nevada and the U.S. economy continue to recover from the decline in the housing sector and the collapse of the financial markets. Tax revenues for governmental activities increased in the current fiscal year by 6.4%, compared to a decrease of 9.6% in the prior fiscal year. This increase was mainly a result of an increase in the modified business tax due to a change in law, and changes in other taxes, specifically, an increase in the lodging tax rate and certain ad valorem taxes redirected to the General Fund. However, there was a continued slowdown in gaming, sales, property and transfer taxes. An increase in unemployment claims, mostly related to the drop in construction and leisure/hospitality employment, was another reason for the fall in growth of business-type activities.
Charges for services 87,356 5.03% 5%Grants and contributions 1,335,177 76.86% 77%Taxes and other 314,657 18.11% 18%Total 1,737,190 100% 100%
Charges for services
5%
Grants and contributions
77%
Taxes18%
17
Unemployment compensation 2,233,382 94%Housing 57,342 2%Other 37,873 2%Workers compensation & safety 26,084 1%Higher education 14,050 1%Total 2,368,731 100%
Unemployment compensation
94%
Housing2%
Other2%
Workers compensation &
safety1%
Higher education1%
Expenses RevenueUnemployment Compensation 2,233,382$ 1,251,318$ Housing 57,342 60,719Water Loans 14,697 34,076Workers Compensation 26,084 32,675Higher Education 14,051 20,378Other 23,175 23,367
Total 2,368,731$ 1,422,533$
Revenues and Expenses by Function: Business-type Activities(expressed in thousands)

financial analysis of tHe state’s funDsGovernmental Funds:As of the end of the current fiscal year, the State’s governmental funds reported combined ending fund balances of $1.58 billion, a decrease of $35 million in comparison with the prior year. Approximately 30.8% of this total amount constitutes unreserved fund balance, which is available for spending in the coming year. The remainder of fund balance is reserved to indicate it is not available for new spending because it has already been committed to liquidate contracts and purchase orders of the prior fiscal year, to pay debt service, to be held in permanent trust funds or for a variety of other purposes. The major governmental funds are discussed individually below:
The General Fund is the chief operating fund of the State. At the end of the current fiscal year, the total General Fund fund balance was $234.6 million. The fund balance increased by $41.7 million during the current fiscal year, which is a 21.6% increase from the prior year. The reasons for this increase are discussed in further detail below.
The following schedule presents a summary of revenues of the General Fund for the fiscal years ended June 30, 2010 and 2009 (expressed in thousands). Other financing sources are not included.
The total General Fund revenues increased 13.2%. The largest increase in revenue sources was $487 million or 21.9% in intergovernmental revenue. These are revenues received from the federal government, and the most significant increases were from the stimulus and Medicaid programs. The stimulus program was implemented as a result of the American Recovery and Reinvestment Act (ARRA), which was signed into law on February 17, 2009 by President Obama. The intent of ARRA was to grant additional monies to all the states to stimulate economic growth. During fiscal year 2010 the major stimulus funds received were $194.6 million for Medicaid and $256.9 million for stabilization. Of this, 70% has been awarded for fiscal stabilization and entitlements. The State expects to receive more than $3.16 billion in total stimulus funds from the start of the program in 2009 through 2014. Other increases in General Fund revenue sources were $107.6 or 38.8% in modified business taxes and $227.8 million or 72.2% in other taxes. The largest declines in revenue sources were $82.6 million or 8.7% in sales tax, $37.9 million or 4.4% in gaming taxes, fees and licenses, and $12.6 million or 19.1% in property and transfer taxes, all due to the continued slow down of the economy and lingering effects from the collapse of the security and real estate markets.
The following schedule presents a summary of expenditures by function of the General Fund for the fiscal years ended June 30, 2010 and 2009 (expressed in thousands). Other financing uses are not included.
18
Amount Percent Amount Percent Amount Percent Gaming taxes, fees and licenses 827,681$ 13.7% 865,609$ 16.3% (37,928)$ -4.4%Sales taxes 870,539 14.5% 953,112 18.0% (82,573) -8.7%Modified business taxes 385,110 6.4% 277,516 5.2% 107,594 38.8%Insurance premium taxes 233,906 3.9% 238,524 4.5% (4,618) -1.9%Property and transfer taxes 53,315 0.9% 65,922 1.2% (12,607) -19.1%Motor and special fuel taxes 3,016 0.1% 3,135 0.1% (119) -3.8%Intergovernmental 2,708,799 45.0% 2,221,824 41.8% 486,975 21.9%Other taxes 543,573 9.0% 315,726 5.9% 227,847 72.2%Licenses, fees and permits 244,507 4.1% 209,250 3.9% 35,257 16.8%Sales and charges for services 53,333 0.9% 54,304 1.0% (971) -1.8%Interest and investment income 11,657 0.2% 7,606 0.1% 4,051 53.3%Other revenues 81,500 1.3% 103,979 2.0% (22,479) -21.6% Total revenues 6,016,936$ 100.0% 5,316,507$ 100.0% 700,429$ 13.2%
General Fund Revenues (expressed in thousands)
2010 2009 Increase (Decrease)
Amount Percent Amount Percent Amount PercentGeneral government 91,485$ 1.5% 97,675$ 1.7% (6,190)$ -6.3%Health and social services 2,716,246 44.6% 2,428,459 42.0% 287,787 11.9%Education and support services 56,712 0.9% 57,077 1.0% (365) -0.6%Law, justice and public safety 462,314 7.6% 450,076 7.8% 12,238 2.7%Regulation of business 84,885 1.4% 83,253 1.4% 1,632 2.0%Recreation, resource development 108,135 1.8% 111,828 1.9% (3,693) -3.3%Intergovernmental 2,568,947 42.2% 2,552,842 44.2% 16,105 0.6%Debt service 1,747 0.0% 1,532 0.0% 215 14.0% Total expenditures 6,090,471$ 100.0% 5,782,742$ 100.0% 307,729$ 5.3%
General Fund Expenditures (expressed in thousands)
2010 2009 Increase (Decrease)

19
The total General Fund expenditures increased 5.3%. Health and social services expenditures increased $287.8 million or 11.9%. The largest portion of this amount was for Health Care Financing & Policy, Medicaid, food stamps, and energy assistance programs. Intergovernmental expenditures increased $16.1 million or .6% primarily due to intergovernmental expenditures for education.
The State Highway Fund is a special revenue fund used to account for the maintenance, regulation and construction of public highways and is funded through vehicle fuel taxes, federal funds, other charges and bond revenue. The fund balance decreased $38.8 million during the current fiscal year, which is a 12.5% decrease from the prior year. This decrease is primarily due to increased intergovernmental payments. The unreserved fund balance is a negative $243.3 million and the reserved balance is a positive $513.9 million.
The Municipal Bond Bank Fund is a special revenue fund used to account for revenues and expenditures associated with buying local government bonds with proceeds of State general obligation bonds. The fund balance decreased by $14.6 million during the current fiscal year, which is a 4.5% decrease from the prior year. This decrease was primarily due to a decrease in debt service payments received from entities as a result of lower principal balances.
The Consolidated Bond Interest and Redemption Fund is a debt service fund used to accumulate monies for the payment of leases and principal and interest on general obligation bonds of the State. The fund balance decreased by $.8 million during the current fiscal year, which is a .5% decrease from the prior year.
Proprietary Funds:The State’s proprietary funds provide the same type of information found in the government-wide financial statements, but in more detail. Proprietary funds are comprised of two types: enterprise funds and internal service funds. Enterprise funds are used when goods or services are provided primarily to parties outside of the State while internal service funds are used when goods or services are provided primarily to State agencies.
Enterprise Funds – There are three major enterprise funds: Housing Division Fund, Unemployment Compensation Fund and Water Projects Loans Fund. The combined net assets of the three major funds comprise 81% of the total combined net assets of all enterprise funds. The combined net assets of the enterprise funds decreased by $651.2 million in 2010. The major enterprise funds are discussed below:
The Housing Division Fund provides low interest loans to first-time homebuyers with low or moderate household incomes. The net assets increased by $3.4 million or 1.9% during the current fiscal year, and the results of operations were down 7% from last year, due to the downturn of the housing market.
The Unemployment Compensation Fund accounts for the payment of unemployment compensation benefits to unemployed State citizens. The net assets decreased by $672 million during the current fiscal year, which is a 182% decrease from the prior year. An increase in unemployment due to the slowdown in the economy and the drop in construction and hospitality/leisure employment resulted in a 67% increase in operating expenses compared to the previous year.
The Water Projects Loans Fund issues loans to governmental, as well as private entities for two programs: safe drinking water and water pollution control. The federal EPA matches the State’s bond proceeds to make loans to governmental entities; only federal funds are loaned to private entities. Total revenues exceeded expenses and transfers by $17.9 million during the current fiscal year, for final net assets of $251.2 million, which is a 7.7% increase from the prior year.

20
Internal Service Funds – The internal service funds charge State agencies for goods and services such as building maintenance, purchasing, printing, insurance, data processing and motor pool in order to recover the costs of the goods or services. Rates charged to State agencies for the operations of internal service funds are adjusted in following years to offset gains and losses. Because these are allocations of costs to other funds, they are not included separately in the government-wide financial statements but are eliminated and reclassified as either governmental activities or business-type activities. In 2010, total internal service fund net assets increased by $5.6 million, for a final net asset balance of $54 million. The two largest funds are:
The Self-Insurance Fund accounts for group health, life and disability insurance for State employees and retirees and certain other public employees. The fund had an increase in net assets of $3.1 million for the year as compared to a decrease in net assets of $11.9 million in the prior year, with final net assets of $54.7 million. This year’s gain resulted from a 6% increase in insurance premium income.
The Insurance Premiums Fund accounts for general, civil (tort), auto and property casualty liabilities of State agencies. The deficit improved by $4.2 million or 15% during fiscal year 2010, to a total deficit of $24.1 million. This year’s increase from operations was caused primarily by a 30% decrease in claims expense, and a 6% increase in premium income. NRS 331.187 provides that if money in the Fund is insufficient to pay a tort claim, the claim is to be paid from the reserve for statutory contingency account.
analysis of general funD BuDget variations
The General Fund total sources were $555 million or 7.1% less than the final budget. This was due primarily to actual intergovernmental revenues received that were less than the final budgeted amount.
The net increase in the General Fund expenditures and other uses budget from original to final was $738 million. Some of the differences originate because the original budget consists only of budgets subject to legislative approval through the General Appropriations Act and the Authorizations Bill. Also, non-executive budgets, not subject to legislative approval, only require approval by the Budget Division and if approved after July 1, are considered to be revisions.
Increases due to the revisions discussed above were approximately $923 million. Other budget revisions included: $253 million decrease in appropriations per AB6 of the 26th Special Session of the Nevada Legislature; $23.7 million decrease for legislatively approved transfer of appropriations to fiscal year 2009; $38.8 million decrease for legislatively approved transfer of appropriations to fiscal year 2011; and $130 million increase for legislatively approved transfers from fiscal year 2011.
capital assets anD DeBt aDMinistrationCapital Assets:The State’s capital assets for its governmental and business-type activities as of June 30, 2010, amount to $6.2 billion, net of accumulated depreciation of $888 million, leaving a net book value of $5.3 billion. This investment in capital assets includes land, buildings, improvements other than buildings, equipment, software costs, infrastructure, rights-of-way, and construction in progress. Infrastructure assets are items that are normally immovable, such as roads and bridges.
As allowed by GASB Statement No. 34, the State has adopted an alternative process for recording depreciation expense on selected infrastructure assets. Under this alternative method, referred to as the modified approach, the State expenses certain maintenance and preservation costs and does not report depreciation expense on infrastructure. Utilization of this approach requires the State to: 1) commit to maintaining and preserving affected assets at or above a condition level established by the State; 2) maintain an inventory of the assets and perform periodic condition assessments to ensure that the condition level is being maintained; and 3) make annual estimates of the amounts that must be expended to maintain and preserve assets at the predetermined condition levels. To monitor the condition of the roadways the State uses the International Roughness Index (IRI). The State has set a policy that it will maintain a certain percentage of each category of its roadways with an IRI of less than 80 and will also maintain its bridges so that not more than 10% are structurally deficient or functionally obsolete. The Department of Transportation conducts a biennial condition assessment of roadways and bridges in odd numbered calendar years. The following table shows the State’s policy and the condition level of the roadways and bridges:

The substandard condition of bridges, for the most current condition assessment, is the result of a change in bridge reporting and inspection methodologies. The estimated amount necessary to maintain and preserve infrastructure assets at target condition levels exceeded the actual amounts of expense incurred for fiscal year 2010 by $29.6 million. Even though actual spending for maintenance and preservation of infrastructure assets fell below estimated, condition levels are expected to continue to meet or exceed the target condition levels, as the most recent condition assessment indicates that the State already exceeds the established benchmarks in the roadway category. The State is considering revising its policy for bridges to allow for the changes in reporting and inspection methodologies. Additional information on the State’s infrastructure can be found in the Schedule of Infrastructure Condition and Maintenance Data in the Required Supplementary Information section to the financial statements.
To keep pace with the demands of the population, the State also has a substantial capital projects program. The following is a summary of major projects in progress during 2010 (expressed in millions):
The total increase in the State’s capital assets for the primary government for the current fiscal year was $399.1 million. This increase included current expenditures to purchase capital assets and completed projects from construction in progress. Depreciation charges for the year totaled $78 million.
Additional information on the State’s capital assets can be found in Note 7 to the financial statements.
21
I II III IV V
State Policy-minimum percentage 70% 65% 60% 40% 10%
Actual results of 2009 condition assessment 82% 82% 87% 56% 21%Actual results of 2007 condition assessment 82% 82% 88% 61% 25%Actual results of 2005 condition assessment 81% 78% 89% 61% 26%
2009 2007 2005
State Policy-maximum percentage 10% 10% 10%
Actual results condition assessment 15% 4% 3%
Percentage of substandard bridges
Condition Level of the Roadways
Percentage of roadways with an IRI of less than 80
Condition Level of the Bridges
Category
Expended byJune 30, 2010 Total Budget
High Desert State Prison Phase 5 48.9$ 49.6$ SNWCC 300 Bed Expansion 41.9 43.1 Indian Springs Conservation Camp 40.1 40.9 Unified Tax System 34.4 40.5 GSF/Campos Office Building 39.2 39.7 Readiness Center North Las Vegas 1.00 35.8 Housing Units - Pre-Engineered 29.1 29.3 SDCC Housing Unit & Planning 20.2 28.9 Las Vegas Readiness Center 24.2 25.9 Las Vegas Readiness Center - Field Maintenance Shop - 24.3

Debt Administration:As of year-end, the State had $4.8 billion in long-term liabilities outstanding, compared to $4.3 billion last year, an increase of $495.2 million or 11.5% during the current fiscal year. This increase was due primarily to the issuance of special obligation bonds.
The most current bond ratings from Fitch, Moody’s Investor Service and Standard and Poor’s were AA+, Aa1 and AA+, respectively. These ratings are an indication of high quality obligations and a reflection of sound financial management. The Constitution of the State limits the aggregate principal amount of the general obligation debt to 2% of the total reported assessed property value of the State.
New bonds and certificates of participation issued during the 2010 fiscal year were (expressed in thousands):
This list of new bonds and certificates of participation does not agree completely with the schedule of additions as seen in Note 8 to the financial statements, due to the inclusion of accreted interest, deferred items and bonds redeemed prior to year-end.
Additional information on the State’s long-term debt obligations can be found in Note 8 to the financial statements and in the Statistical Section.
Requests for InformationThis financial report is designed to provide a general overview of the State of Nevada’s finances for all those with an interest in the government’s finances. Questions concerning any of the information provided in this report or requests for additional financial information should be addressed to: State of Nevada, Office of the State Controller, 101 N. Carson Street, Suite 5, Carson City, NV 89701-4786 or visit our website at: www.controller.nv.gov.
22
General Obligation Capital Improvements 11/17/09A 68,000$ General Obligation Capital Improvements and Cultural Affairs and Refunding 11/17/09B 34,990 General Obligation Natural Resources and Refunding 11/17/09C 14,680 General Obligation Open Space, Parks and Cultural Resources 11/17/09D 5,000 General Obligation Open Space, Parks and Natural Resources 11/17/09E 8,240 General Obligation Natural Resources 06/24/10A 4,675 General Obligation Water Refunding 06/24/10B 7,405 COPS Juvenile Treatment Facility Project Refunding 12/10/2009 7,900 Housing Single-Family 2009 Issue B 11/19/2009 22,651 Housing Single-Family 2009 Issue I, Variable 12/28/2009 102,340 Housing Multi-Unit Series A 12/28/2009 24,500

23
Landsailing at Stateline, NVPhoto Courtesy of Mark P. Harrishttp://www.nalsa.org

24
Landsailing at Stateline, NV Photo Courtesy of Mark P. Harris
http://www.nalsa.org

25
Basic Financial statements
Landsailing at Stateline, NV Photo Courtesy of Mark P. Harrishttp://www.nalsa.org

NEVA
DA
Gov
ernm
enta
l Ac
tiviti
esB
usin
ess-
type
Ac
tiviti
esTo
tal
Col
orad
o R
iver
C
omm
issi
onN
evad
a Sy
stem
of
Hig
her E
duca
tion
Asse
tsC
ash
and
pool
ed in
vest
men
ts1,
466,
778
$
159,
832
$
1,
626,
610
$
4,
196
$
172,
487
$
Inve
stm
ents
578,
475
804,
915
1,38
3,39
0-
785,
162
Inte
rnal
bal
ance
s6,
138
(6,1
38)
--
-D
ue fr
om th
e st
ate
--
-28
91,8
28A
ccou
nts
rece
ivab
le49
,674
6,03
355
,707
16,8
5132
,107
Taxe
s/as
sess
men
ts re
ceiv
able
712,
860
131,
495
844,
355
--
Inte
rgov
ernm
enta
l rec
eiva
bles
449,
615
1,87
745
1,49
2-
39,3
97A
ccru
ed in
tere
st a
nd d
ivid
ends
5,56
913
,129
18,6
9820
-C
ontra
cts
rece
ivab
le-
18,4
3518
,435
--
Mor
tgag
es re
ceiv
able
-59
5,21
859
5,21
8-
-N
otes
/loan
s re
ceiv
able
520
23,7
7224
,292
-12
,359
Oth
er re
ceiv
able
s17
623
-56
,046
Inve
ntor
y13
,714
1,45
215
,166
-6,
369
Pre
paid
exp
ense
s2,
614
72,
621
33,7
87-
Def
erre
d ch
arge
s13
,454
4,27
017
,724
--
Res
trict
ed a
sset
s: C
ash
--
-10
,950
8,71
6 I
nves
tmen
ts-
145,
793
145,
793
--
Oth
er a
sset
s-
4,66
24,
662
-41
,738
Cap
ital a
sset
s: L
and,
infra
stru
ctur
e an
d co
nstru
ctio
n in
pro
gres
s4,
073,
686
9,04
44,
082,
730
-21
2,66
3 O
ther
cap
ital a
sset
s, n
et1,
256,
471
1,94
21,
258,
413
56,5
771,
757,
329
T
otal
ass
ets
8,62
9,58
51,
915,
744
10,5
45,3
2912
2,40
93,
216,
201
Liab
ilitie
sA
ccou
nts
paya
ble
707,
760
53,3
8076
1,14
011
,399
35,9
59A
ccru
ed p
ayro
ll an
d re
late
d lia
bilit
ies
55,4
2287
856
,300
-29
,444
Inte
rgov
ernm
enta
l pay
able
s92
,811
473
93,2
84-
7,07
4In
tere
st p
ayab
le25
,793
9,42
835
,221
1,36
111
,140
Due
to c
ompo
nent
uni
ts60
,019
2960
,048
--
Con
tract
s/re
tent
ions
pay
able
39,0
00-
39,0
00-
-U
near
ned
reve
nues
350,
886
9,72
436
0,61
058
736
,894
Oth
er li
abili
ties
67,8
044,
712
72,5
164,
199
24,5
69
Prim
ary
Gov
ernm
ent
Com
pone
nt U
nits
Sta
tem
ent o
f Net
Ass
ets
Ass
ets
June
30, 2
010 (
Expr
essed
in Th
ousa
nds)
Liab
ilitie
s
26

Long
-term
liab
ilitie
s: P
ortio
n du
e or
pay
able
with
in o
ne y
ear:
Res
erve
for l
osse
s51
,467
-51
,467
--
Obl
igat
ions
und
er c
apita
l lea
ses
3,23
2-
3,23
2-
2,46
9 C
ompe
nsat
ed a
bsen
ces
70,3
251,
197
71,5
2221
830
,910
Ben
efits
pay
able
-10
,000
10,0
00-
- B
onds
pay
able
198,
717
22,6
7122
1,38
85,
669
20,1
38 C
ertif
icat
es o
f par
ticip
atio
n pa
yabl
e70
3-
703
--
Arb
itrag
e re
bate
liab
ility
195
-19
5-
- P
ortio
n du
e or
pay
able
afte
r one
yea
r: F
eder
al u
nem
ploy
men
t adv
ance
-43
8,32
543
8,32
5-
- R
eser
ve fo
r los
ses
28,1
69-
28,1
69-
- O
blig
atio
ns u
nder
cap
ital l
ease
s30
,614
-30
,614
-6,
244
Com
pens
ated
abs
ence
s33
,248
698
33,9
4691
15,1
44 B
enef
its p
ayab
le-
121,
505
121,
505
--
Bon
ds p
ayab
le2,
641,
008
1,07
8,40
43,
719,
412
91,1
1048
9,72
0 C
ertif
icat
es o
f par
ticip
atio
n pa
yabl
e56
,067
-56
,067
--
Due
to c
ompo
nent
uni
t31
,808
-31
,808
--
Arb
itrag
e re
bate
liab
ility
3,02
364
3,08
7-
-
Tot
al li
abili
ties
4,54
8,07
11,
751,
488
6,29
9,55
911
4,63
470
9,70
5
Net
Ass
ets
Inve
sted
in c
apita
l ass
ets,
net
of r
elat
ed d
ebt
3,62
2,78
73,
615
3,62
6,40
2(4
,224
)1,
452,
875
Res
trict
ed fo
r: S
ecur
ity o
f out
stan
ding
obl
igat
ions
-17
9,97
417
9,97
4-
- W
orke
rs' c
ompe
nsat
ion
-32
,313
32,3
13-
- C
apita
l pro
ject
s-
--
-97
,463
Deb
t ser
vice
35,8
41-
35,8
41-
13,0
48 E
duca
tion
and
supp
ort s
ervi
ces
3,93
6-
3,93
6-
- T
rans
porta
tion
260,
220
-26
0,22
0-
- R
ecre
atio
n an
d re
sour
ce d
evel
opm
ent
52,8
4925
1,15
930
4,00
8-
- L
aw, j
ustic
e an
d pu
blic
saf
ety
11,1
04-
11,1
04-
- H
ealth
and
soc
ial s
ervi
ces
8,58
0-
8,58
0-
- R
egul
atio
n of
bus
ines
s9,
704
900
10,6
04-
- M
unic
ipal
sec
uriti
es1,
353
-1,
353
--
Sch
olar
ship
s-
--
-24
0,25
8 L
oans
--
--
7,41
2 O
pera
tions
and
mai
nten
ance
--
-71
0-
Fun
ds h
eld
as p
erm
anen
t inv
estm
ents
:
Non
expe
ndab
le29
9,91
9-
299,
919
-26
5,60
4
Exp
enda
ble
20-
20-
-U
nres
trict
ed (d
efic
it)(2
24,7
99)
(303
,705
)(5
28,5
04)
11,2
8942
9,83
6
Tot
al n
et a
sset
s4,
081,
514
$
164,
256
$
4,
245,
770
$
7,
775
$
2,50
6,49
6$
The
note
s to
the
finan
cial
sta
tem
ents
are
an
inte
gral
par
t of t
his
stat
emen
t.
Net
Ass
ets
27

NEVA
DA
Expe
nses
Cha
rges
for
Serv
ices
Ope
ratin
g G
rant
s an
d C
ontr
ibut
ions
Cap
ital
Gra
nts
and
Con
trib
utio
nsG
over
nmen
tal
Activ
ities
Bus
ines
s-ty
pe
Activ
ities
Tota
l
Col
orad
o R
iver
C
omm
issi
on
Nev
ada
Syst
em o
f H
ighe
r Ed
ucat
ion
Func
tions
/Pro
gram
s
Pr
imar
y go
vern
men
t
Gov
ernm
enta
l act
iviti
es:
G
ener
al g
over
nmen
t37
5,21
9$
285,
927
$
56
,617
$
21$
(32,
654)
$
-$
(32,
654)
$
-
$
-
$
Hea
lth a
nd s
ocia
l ser
vice
s3,
017,
013
131,
408
1,94
4,55
4-
(941
,051
)-
(941
,051
)-
-
Edu
catio
n an
d su
ppor
t ser
vice
s2,
430,
923
3,35
152
7,96
6-
(1,8
99,6
06)
-(1
,899
,606
)-
-
Law
, jus
tice
and
publ
ic s
afet
y69
0,10
423
6,00
414
9,45
12,
759
(301
,890
)-
(301
,890
)-
-
Reg
ulat
ion
of b
usin
ess
100,
380
67,4
9830
,340
-(2
,542
)-
(2,5
42)
--
T
rans
porta
tion
644,
976
36,5
4439
1,71
453
,012
(163
,706
)-
(163
,706
)-
-
Rec
reat
ion
and
reso
urce
dev
elop
men
t16
1,04
836
,296
40,5
1992
7(8
3,30
6)-
(83,
306)
--
I
nter
est o
n lo
ng-te
rm d
ebt
132,
238
-82
5-
(131
,413
)-
(131
,413
)-
-
Una
lloca
ted
depr
ecia
tion
1,44
8-
--
(1,4
48)
-(1
,448
)-
-
Tot
al g
over
nmen
tal a
ctiv
ities
7,55
3,34
979
7,02
83,
141,
986
56,7
19(3
,557
,616
)-
(3,5
57,6
16)
--
B
usin
ess-
type
act
iviti
es:
U
nem
ploy
men
t ins
uran
ce2,
233,
382
1,66
91,
249,
649
--
(982
,064
)(9
82,0
64)
--
H
ousi
ng57
,342
23,6
9337
,026
--
3,37
73,
377
--
W
ater
loan
s14
,697
8,40
925
,667
--
19,3
7919
,379
--
W
orke
rs' c
ompe
nsat
ion
and
safe
ty26
,084
30,1
442,
531
--
6,59
16,
591
--
H
ighe
r edu
catio
n14
,051
8920
,289
--
6,32
76,
327
--
O
ther
23,1
7523
,352
15-
-19
219
2-
-
Tot
al b
usin
ess-
type
act
iviti
es2,
368,
731
87,3
561,
335,
177
--
(946
,198
)(9
46,1
98)
--
To
tal p
rimar
y go
vern
men
t9,
922,
080
$
884,
384
$
4,
477,
163
$
56
,719
$
(3,5
57,6
16)
(946
,198
)(4
,503
,814
)-
-
C
ompo
nent
Uni
ts
Col
orad
o R
iver
Com
mis
sion
85,1
37$
84
,336
$
-$
-
$
--
-(8
01)
-
Nev
ada
Sys
tem
of H
ighe
r Edu
catio
n1,
517,
039
524,
767
600,
318
6,89
2-
--
-(3
85,0
62)
To
tal c
ompo
nent
uni
ts1,
602,
176
$
609,
103
$
60
0,31
8$
6,
892
$
-
--
(801
)(3
85,0
62)
Net
(Exp
ense
s) R
even
ues
and
Cha
nges
in N
et A
sset
sPr
ogra
m R
even
ues
Prim
ary
Gov
ernm
ent
Com
pone
nt U
nits
Sta
tem
ent o
f Act
iviti
es
For t
he F
iscal
Year
End
ed Ju
ne 30
, 201
0 (Ex
press
ed in
Thou
sand
s)
Func
tions
/Pro
gram
s
Pri
mar
y G
over
nmen
t
Com
pone
nt U
nits
28

29
810,
758
-81
0,75
8-
-78
4,28
3-
784,
283
--
381,
300
-38
1,30
0-
-23
3,28
0-
233,
280
--
53,3
15-
53,3
15-
-3,
016
-3,
016
--
509,
912
-50
9,91
2-
-
-31
4,65
731
4,65
7-
-
86,1
91-
86,1
91-
-33
,712
-33
,712
--
186,
714
-18
6,71
4-
-89
,298
-89
,298
--
22,1
45-
22,1
45-
-
27,0
40-
27,0
40-
-
26,8
49-
26,8
49-
-39
,405
-39
,405
--
176,
240
-17
6,24
0-
-40
,503
-40
,503
--
3,97
4-
3,97
4-
-37
,993
-37
,993
--
(1,2
46)
-(1
,246
)50
84,4
4610
8,88
6-
108,
886
626
-8,
165
-8,
165
-20
,009
--
--
458,
616
--
-(3
70)
-19
,361
(19,
361)
--
-
3,68
1,09
429
5,29
63,
976,
390
306
563,
071
123,
478
(650
,902
)(5
27,4
24)
(495
)17
8,00
9
3,95
8,03
681
5,15
84,
773,
194
8,27
02,
328,
487
4,08
1,51
4$
164,
256
$
4,24
5,77
0$
7,
775
$
2,
506,
496
$
The
note
s to
the
finan
cial
sta
tem
ents
are
an
inte
gral
par
t of t
his
stat
emen
t.
Mot
or a
nd s
peci
al fu
el
G
ener
al re
venu
es:
T
axes
:
G
amin
g
S
ales
and
use
Mod
ified
bus
ines
s
In
sura
nce
prem
ium
Pro
perty
and
tran
sfer
Oth
er ta
xes
Oth
er
Res
trict
ed fo
r une
mpl
oym
ent c
ompe
nsat
ion:
Oth
er ta
xes
R
estri
cted
for e
duca
tiona
l pur
pose
s:
S
ales
and
use
taxe
s
G
amin
g ta
xes
R
estri
cted
for d
ebt s
ervi
ce p
urpo
ses:
Pro
perty
and
tran
sfer
taxe
s
M
otor
and
spe
cial
fuel
taxe
s
O
ther
R
estri
cted
for r
ecre
atio
n an
d re
sour
ce d
evel
opm
ent p
urpo
ses:
C
ontri
butio
ns to
per
man
ent f
unds
R
estri
cted
for h
ealth
and
soc
ial s
ervi
ces
purp
oses
:
P
rope
rty a
nd tr
ansf
er ta
xes
Oth
er ta
xes
R
estri
cted
for t
rans
porta
tion
purp
oses
:
M
otor
and
spe
cial
fuel
taxe
s
O
ther
taxe
s
Res
trict
ed fo
r reg
ulat
ion
purp
oses
:
O
ther
taxe
s
Tob
acco
set
tlem
ent i
ncom
e
Unr
estri
cted
inve
stm
ent e
arni
ngs
O
ther
gen
eral
reve
nues
N
et a
sset
s - e
ndin
g
P
aym
ents
from
Sta
te o
f Nev
ada
S
peci
al it
em -
aban
donm
ent l
oss
Tr
ansf
ers
T
otal
gen
eral
reve
nues
, spe
cial
item
s, a
nd tr
ansf
ers
Cha
nge
in n
et a
sset
s
N
et a
sset
s - b
egin
ning
(as
rest
ated
)

30
Balance SheetGovernmental Funds
June 30, 2010
General Fund State Highway Municipal Bond BankAssetsCash and pooled investments: Cash with treasurer 513,480,030$ 279,433,088$ 345,722$ Cash in custody of other officials 2,821,631 180,406 -Investments 7,826,340 - 311,565,000Receivables: Accounts receivable 18,365,182 4,434,281 - Taxes receivable 663,464,529 43,662,555 - Intergovernmental receivables 277,212,539 24,454,314 - Accrued interest and dividends 2,804,706 - 1,420,588 Notes/loans receivable 386,735 - - Other receivables 15,830 - -Due from other funds 42,822,559 2,994,496 3,966Due from fiduciary funds 110,329 - -Due from component units 539,989 - -Inventory - 12,308,833 -Advances to other funds 7,325,057 - -Prepaid items 1,677,341 11,800 - Total assets 1,538,852,797$ 367,479,773$ 313,335,276$
Liabilities and Fund BalancesAccounts payable and accruals: Accounts payable 286,137,409$ 26,069,564$ -$ Accrued payroll and related liabilities 36,308,556 13,948,612 - Intergovernmental payables 83,017,970 7,758,265 - Interest payable - - - Contracts/retentions payable 503,898 25,978,361 -Due to other funds 69,270,886 2,193,276 417,731Due to fiduciary funds 369,581,473 732,504 -Due to component units 9,487,211 209,125 -Deferred revenues 383,986,756 18,741,421 1,421,203Bonds payable - - -Other liabilities 66,000,588 1,249,361 - Total liabilities 1,304,294,747 96,880,489 1,838,934
Fund balances:Reserved: Encumbrances and contracts 3,073,785 501,570,976 - Inventories - 12,308,833 - Advances 7,325,057 - - Funds held as permanent investments - - - Fiscal emergency - - - Debt service - - - Other 2,064,076 11,800 -Unreserved, designated for balances forward 219,988,894 - -Unreserved, designated for approved capital projects 2,106,238 - -Unreserved, designated, reported in nonmajor: Special revenue funds - - - Capital project funds - - -Unreserved, undesignated - (243,292,325) 311,496,342Unreserved, undesignated, reported in nonmajor: Special revenue funds - - - Permanent funds - - -(5) 2 1 Total fund balances 234,558,050 270,599,284 311,496,342 Total liabilities and fund balances 1,538,852,797$ 367,479,773$ 313,335,276$
The notes to the financial statements are an integral part of this statement.
Assets
Liabilities and Fund Balances

31
NEVADA
Consolidated Bond Interest and Redemption
Other Governmental Funds
Total Governmental Funds
161,614,681$ 346,152,335$ 1,301,025,856$ - 43,137,649 46,139,686- 259,083,450 578,474,790
- 21,634,031 44,433,494- 5,733,304 712,860,388
132,258,124 9,430,573 443,355,550- 1,343,250 5,568,544- 23,069 409,804- 1,000 16,830
4,753,143 66,078,682 116,652,846- 422,492 532,821
5,775,000 86,000 6,400,989- 1,125,257 13,434,090
1,506,366 - 8,831,423- 98,629 1,787,770
305,907,314$ 754,349,721$ 3,279,924,881$
74,421$ 12,158,207$ 324,439,601$ - 3,868,250 54,125,418
4,234 1,990,817 92,771,2863,090,091 - 3,090,091
- 12,517,964 39,000,2235,096,665 43,540,671 120,519,229
- 128,588 370,442,565- 58,810,153 68,506,489
137,261,414 21,422,377 562,833,171360,000 - 360,000
- 553,932 67,803,881145,886,825 154,990,959 1,703,891,954
- 22,543,073 527,187,834- 1,125,257 13,434,090
1,506,366 - 8,831,423- 299,919,132 299,919,132- 41,321,014 41,321,014
158,514,123 35,840,821 194,354,944- 3,383,938 5,459,814- - 219,988,894- - 2,106,238
- 1,200,000 1,200,000- 59,943,263 59,943,263- 68,204,017
- 134,062,087 134,062,087- 20,177 20,177- (7) (9)
160,020,489 599,358,762 1,576,032,927305,907,314$ 754,349,721$ 3,279,924,881$

32
Horse Showing in Minden, NVPhoto Courtesy of Brenda Laird

NEVADA
33
Reconciliation of the Governmental Funds Balance Sheet to the Statement of Net Assets
June 30, 2010
Total fund balances - governmental funds 1,576,032,927$
Amounts reported for governmental activities in the statement of net assets are differentbecause:
Capital assets used in governmental activities are not financial resources and thereforeare not reported in the funds. These assets consist of:
Land 138,205,139$ Construction in progress 178,010,275 Infrastructure assets 3,164,498,164 Rights-of-way 592,841,789 Buildings 1,477,385,017 Improvements other than buildings 113,730,011 Furniture and equipment 322,278,777 Software costs 136,534,764 Accumulated depreciation/amortization (819,957,767) Total capital assets 5,303,526,169
Some of the State's revenues will be collected after year-end but are not availablesoon enough to pay for the current period's expenditures and therefore are deferredin the funds. 212,045,613
Intergovernmental receivable not providing current resources. 221,045
Judicial Retirement System of Nevada has been funded in excess of the annual required contributions, creating a year-end asset. This asset is not a current availableresource and is not reported in the funds. 10,002
Amounts due to component unit for bonds authorized to be issued are not reported inthe funds as they are not due and payable. (31,808,146)
Internal service funds are used by management to charge the costs of certain activitiesto individual funds. The assets and liabilities of the internal service funds are includedin governmental activities in the statement of net assets. 53,941,028
The deferred loss on early retirement of debt is reported as a deferred charge on thestatement of net assets and is amortized over the original remaining life of the old debt, or the life of the new debt, whichever is less. 56,428
Certain bond costs are reported as a deferred charge on the statement of net assetsand are amortized over the life of the debt. 13,397,723
Some liabilities are not due and payable in the current period and therefore are not reported in the funds. Those liabilities consist of:
Bonds payable (2,831,548,535) Accrued interest on bonds (22,702,568) Arbitrage rebate liability (3,218,353) Certificates of participation (56,769,427) Capital leases (31,278,680) Compensated absences (100,390,896) Total long-term liabilities (3,045,908,459)
Net assets of governmental activities 4,081,514,330$
The notes to the financial statements are an integral part of this statement.
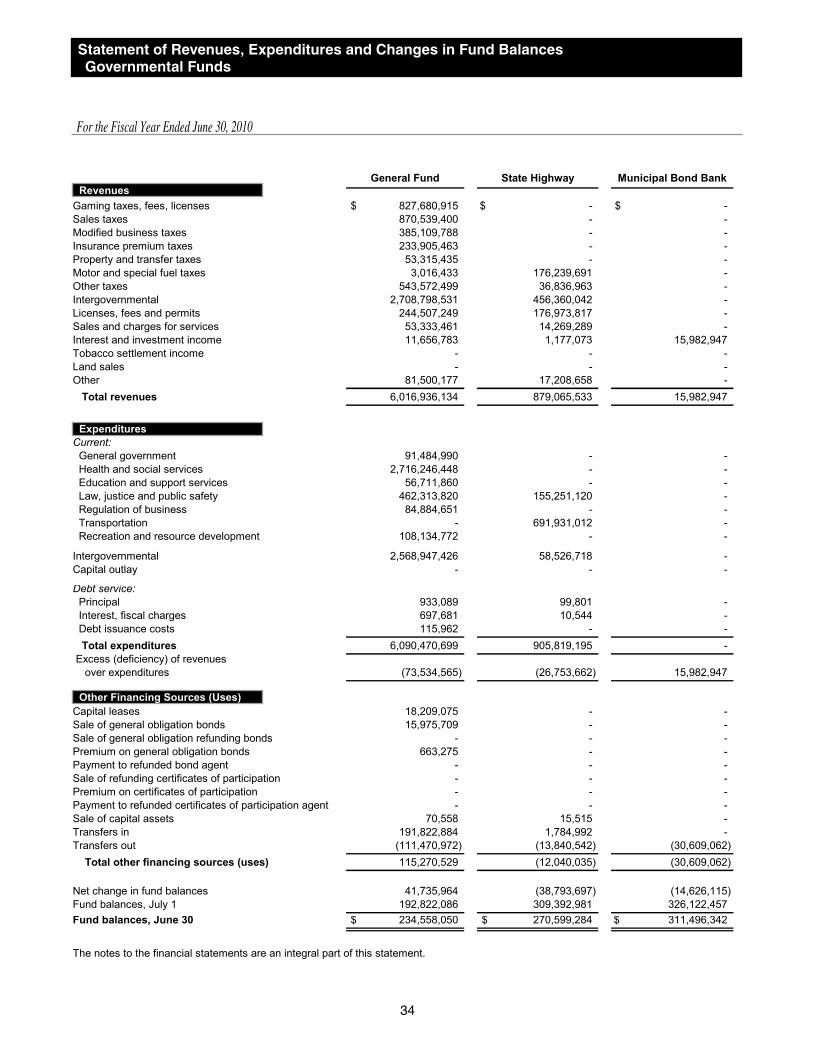
34
General Fund State Highway Municipal Bond BankRevenuesGaming taxes, fees, licenses 827,680,915$ -$ -$ Sales taxes 870,539,400 - -Modified business taxes 385,109,788 - -Insurance premium taxes 233,905,463 - -Property and transfer taxes 53,315,435 - -Motor and special fuel taxes 3,016,433 176,239,691 -Other taxes 543,572,499 36,836,963 -Intergovernmental 2,708,798,531 456,360,042 -Licenses, fees and permits 244,507,249 176,973,817 -Sales and charges for services 53,333,461 14,269,289 -Interest and investment income 11,656,783 1,177,073 15,982,947Tobacco settlement income - - -Land sales - - -Other 81,500,177 17,208,658 - Total revenues 6,016,936,134 879,065,533 15,982,947
ExpendituresCurrent: General government 91,484,990 - - Health and social services 2,716,246,448 - - Education and support services 56,711,860 - - Law, justice and public safety 462,313,820 155,251,120 - Regulation of business 84,884,651 - - Transportation - 691,931,012 - Recreation and resource development 108,134,772 - -
Intergovernmental 2,568,947,426 58,526,718 -Capital outlay - - -
Debt service: Principal 933,089 99,801 - Interest, fiscal charges 697,681 10,544 - Debt issuance costs 115,962 - - Total expenditures 6,090,470,699 905,819,195 - Excess (deficiency) of revenues over expenditures (73,534,565) (26,753,662) 15,982,947
Other Financing Sources (Uses)Capital leases 18,209,075 - -Sale of general obligation bonds 15,975,709 - -Sale of general obligation refunding bonds - - -Premium on general obligation bonds 663,275 - -Payment to refunded bond agent - - -Sale of refunding certificates of participation - - -Premium on certificates of participation - - -Payment to refunded certificates of participation agent - - -Sale of capital assets 70,558 15,515 -Transfers in 191,822,884 1,784,992 -Transfers out (111,470,972) (13,840,542) (30,609,062) Total other financing sources (uses) 115,270,529 (12,040,035) (30,609,062)
Net change in fund balances 41,735,964 (38,793,697) (14,626,115)Fund balances, July 1 192,822,086 309,392,981 326,122,457Fund balances, June 30 234,558,050$ 270,599,284$ 311,496,342$
The notes to the financial statements are an integral part of this statement.
Revenues
Expenditures
Statement of Revenues, Expenditures and Changes in Fund BalancesGovernmental Funds
For the Fiscal Year Ended June 30, 2010
Other Financing Sources (Uses)

35
NEVADA
Consolidated Bond Interest and Redemption
Other Governmental Funds
Total Governmental Funds
-$ 14,678,019$ 842,358,934$ - - 870,539,400- - 385,109,788- - 233,905,463
186,714,280 26,848,669 266,878,384- 89,297,677 268,553,801- 40,133,870 620,543,332
8,472,085 99,635,725 3,273,266,383- 31,356,427 452,837,493
191,356 16,628,028 84,422,134(284,453) 9,322,931 37,855,281
- 41,962,948 41,962,948- 964,965 964,965- 14,019,331 112,728,166
195,093,268 384,848,590 7,491,926,472
257,346 46,251,608 137,993,944- 116,958,029 2,833,204,477- 484,527 57,196,387- 16,325,234 633,890,174- 22,260,041 107,144,692- - 691,931,012- 22,665,407 130,800,179
389,769 76,825,557 2,704,689,470- 59,520,431 59,520,431
121,720,000 54,229,265 176,982,155105,674,261 34,112,485 140,494,971
832,378 785,939 1,734,279228,873,754 450,418,523 7,675,582,171
(33,780,486) (65,569,933) (183,655,699)
- - 18,209,075597,216 92,670,837 109,243,762
33,746,240 - 33,746,2402,166,174 1,098,902 3,928,351
(35,677,139) - (35,677,139)- 7,900,000 7,900,000- 742,775 742,775- (8,465,569) (8,465,569)- 5,315 91,388
47,195,511 117,309,241 358,112,628(15,000,000) (168,195,235) (339,115,811)33,028,002 43,066,266 148,715,700
(752,484) (22,503,667) (34,939,999)160,772,973 621,862,429 1,610,972,926160,020,489$ 599,358,762$ 1,576,032,927$

36
ATV Offroading at Sand Mountain, NVPhoto Courtesy of Nevada Commission on Tourism
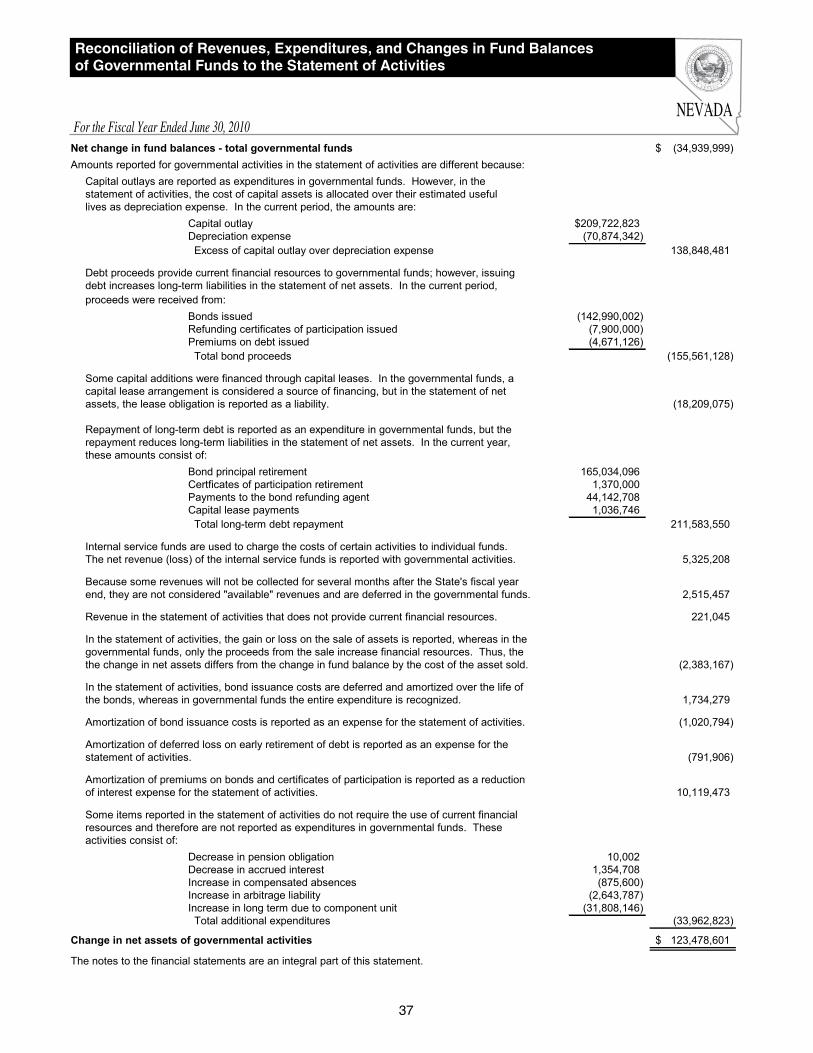
NEVADA
37
Reconciliation of Revenues, Expenditures, and Changes in Fund Balances of Governmental Funds to the Statement of Activities
For the Fiscal Year Ended June 30, 2010Net change in fund balances - total governmental funds (34,939,999)$ Amounts reported for governmental activities in the statement of activities are different because:
Capital outlays are reported as expenditures in governmental funds. However, in thestatement of activities, the cost of capital assets is allocated over their estimated usefullives as depreciation expense. In the current period, the amounts are:
Capital outlay 209,722,823$ Depreciation expense (70,874,342) Excess of capital outlay over depreciation expense 138,848,481
Debt proceeds provide current financial resources to governmental funds; however, issuingdebt increases long-term liabilities in the statement of net assets. In the current period,proceeds were received from:
Bonds issued (142,990,002) Refunding certificates of participation issued (7,900,000) Premiums on debt issued (4,671,126) Total bond proceeds (155,561,128)
Some capital additions were financed through capital leases. In the governmental funds, a capital lease arrangement is considered a source of financing, but in the statement of netassets, the lease obligation is reported as a liability. (18,209,075)
Repayment of long-term debt is reported as an expenditure in governmental funds, but therepayment reduces long-term liabilities in the statement of net assets. In the current year, these amounts consist of:
Bond principal retirement 165,034,096 Certficates of participation retirement 1,370,000 Payments to the bond refunding agent 44,142,708 Capital lease payments 1,036,746 Total long-term debt repayment 211,583,550
Internal service funds are used to charge the costs of certain activities to individual funds.The net revenue (loss) of the internal service funds is reported with governmental activities. 5,325,208
Because some revenues will not be collected for several months after the State's fiscal yearend, they are not considered "available" revenues and are deferred in the governmental funds. 2,515,457
Revenue in the statement of activities that does not provide current financial resources. 221,045
In the statement of activities, the gain or loss on the sale of assets is reported, whereas in thegovernmental funds, only the proceeds from the sale increase financial resources. Thus, thethe change in net assets differs from the change in fund balance by the cost of the asset sold. (2,383,167)
In the statement of activities, bond issuance costs are deferred and amortized over the life ofthe bonds, whereas in governmental funds the entire expenditure is recognized. 1,734,279
Amortization of bond issuance costs is reported as an expense for the statement of activities. (1,020,794)
Amortization of deferred loss on early retirement of debt is reported as an expense for thestatement of activities. (791,906)
Amortization of premiums on bonds and certificates of participation is reported as a reductionof interest expense for the statement of activities. 10,119,473
Some items reported in the statement of activities do not require the use of current financialresources and therefore are not reported as expenditures in governmental funds. Theseactivities consist of:
Decrease in pension obligation 10,002 Decrease in accrued interest 1,354,708 Increase in compensated absences (875,600) Increase in arbitrage liability (2,643,787) Increase in long term due to component unit (31,808,146) Total additional expenditures (33,962,823)
Change in net assets of governmental activities 123,478,601$
The notes to the financial statements are an integral part of this statement.

38
Housing Division
Unemployment Compensation
Water Projects Loans
Other Enterprise
Funds Total
Internal Service Funds
AssetsCurrent assets:Cash and pooled investments: Cash with treasurer 251,672$ -$ 76,521,995$ 44,767,356$ 121,541,023$ 119,612,618$ Cash in custody of other officials 545,419 36,728,044 - 1,017,130 38,290,593 100Investments 159,404,615 - - 106,364,432 265,769,047 -Receivables: Accounts receivable - - - 6,025,527 6,025,527 1,983,427 Assessments receivable - 131,495,322 - - 131,495,322 - Intergovernmental receivables - - 1,492,751 384,554 1,877,305 6,038,407 Contracts receivable - - - 4,400,000 4,400,000 - Mortgages receivable 10,898,920 - - - 10,898,920 - Accrued interest and dividends 9,056,322 - 3,557,468 515,805 13,129,595 - Notes/loans receivable - - - - - 10,000 Trades pending settlement - - - 5,609 5,609 -Due from other funds 30,898 - 251,541 857,994 1,140,433 6,360,108Due from fiduciary funds - - - 7,177 7,177 2,723,881Due from component units - - - 533 533 2,106,221Inventory - - - 1,451,733 1,451,733 279,585Prepaid expenses - - - 6,516 6,516 816,626Deferred outflow of resources 4,647,460 - - - 4,647,460 -Restricted assets: Investments 118,335,720 - - - 118,335,720 - Total current assets 303,171,026 168,223,366 81,823,755 165,804,366 719,022,513 139,930,973Noncurrent assets:Investments 292,306,742 - 246,839,652 - 539,146,394 -Receivables: Contracts receivable - - - 14,035,024 14,035,024 - Mortgages receivable 584,318,629 - - - 584,318,629 - Notes/loans receivable - - 23,771,807 - 23,771,807 100,000Deferred charges 2,973,093 - 1,202,375 94,475 4,269,943 -Restricted assets: Investments 27,456,817 - - - 27,456,817 -Other assets - - - 15,000 15,000 -Capital assets: Land - - - 567,812 567,812 130,954 Buildings - - - 3,388,840 3,388,840 22,078,621 Improvements other than buildings - - - 630,647 630,647 713,667 Furniture and equipment 373,523 - 35,280 5,194,663 5,603,466 48,634,512 Software costs - - - - - 15,323,810 Construction in progress - - - 8,476,095 8,476,095 - Less accumulated depreciation/ amortization (357,527) - (34,135) (7,288,931) (7,680,593) (60,250,222) Total noncurrent assets 907,071,277 - 271,814,979 25,113,625 1,203,999,881 26,731,342 Total assets 1,210,242,303 168,223,366 353,638,734 190,917,991 1,923,022,394 166,662,315
Enterprise Funds
Assets
Statement of Net AssetsProprietary Funds
June 30, 2010

39
NEVADA
Housing Division
Unemployment Compensation
Water Projects Loans
Other Enterprise
Funds Total
Internal Service Funds
Current liabilities:Accounts payable and accruals: Accounts payable 19,708,882$ 31,590,395$ 76,892$ 1,831,168$ 53,207,337$ 7,283,029$ Accrued payroll and related liabilities 87,034 - 15,317 775,753 878,104 1,296,601 Interest payable 7,543,179 - 1,855,647 29,038 9,427,864 - Intergovernmental payables - - 458,920 13,979 472,899 39,751 Trades pending settlement - - - 53,393 53,393 -Bank overdraft - - - - - 5,580,929Due to other funds 3,686 216,841 369,049 1,413,260 2,002,836 1,631,322Due to fiduciary funds - - 82,924 89,707 172,631 14,755Due to component units - - - 29,904 29,904 19,171Unearned revenues - - - 9,723,495 9,723,495 98,151Derivative instrument - interest rate swap 4,647,460 - - - 4,647,460 -Other liabilities - - - 11,509 11,509 -Short-term portion of long-term liabilities: Reserve for losses - - - - - 51,466,753 Compensated absences 163,450 - 28,054 1,005,788 1,197,292 2,050,229 Benefits payable - - - 10,000,000 10,000,000 - Bonds payable 14,256,000 - 8,272,806 141,710 22,670,516 513,323 Obligations under capital leases - - - - - 1,309,397 Total current liabilities 46,409,691 31,807,236 11,159,609 25,118,704 114,495,240 71,303,411Noncurrent liabilities:Advances from funds - - - 5,351,256 5,351,256 3,480,167Federal Unemployment Advance - 438,325,470 - - 438,325,470 -Reserve for losses - - - - - 28,168,951Compensated absences 136,141 - 16,285 544,889 697,315 1,132,274Benefits payable - - - 121,505,000 121,505,000 -Bonds payable 979,936,615 - 91,238,438 7,229,236 1,078,404,289 7,302,864Obligations under capital leases - - - - - 1,257,774Arbitrage rebate liability - - 63,962 - 63,962 - Total noncurrent liabilities 980,072,756 438,325,470 91,318,685 134,630,381 1,644,347,292 41,342,030 Total liabilities 1,026,482,447 470,132,706 102,478,294 159,749,085 1,758,842,532 112,645,441
Net AssetsInvested in capital assets, net of related debt 15,996 - 1,145 3,598,180 3,615,321 16,451,309Restricted for: Security of outstanding obligations 179,974,459 - - - 179,974,459 - Workers' compensation - - - 32,312,658 32,312,658 - Revolving loans - - 251,159,295 - 251,159,295 - Regulation of business - - - 900,368 900,368 -Unrestricted (deficit) 3,769,401 (301,909,340) - (5,642,300) (303,782,239) 37,565,565 Total net assets 183,759,856$ (301,909,340)$ 251,160,440$ 31,168,906$ 164,179,862 54,016,874$
Some amounts reported for business-type activities in the statement of net assets are different because certain internal service fund assets and liabilities are included with 75,846 business-type activities. Net assets of business-type activities 164,255,708$
The notes to the financial statements are an integral part of this statement.
Enterprise Funds
Liabilities
Net Assets

40
Kayakers at Lake Mead, NVPhoto Courtesy of Nevada Commission onTourism

NEVADA
41
Housing Division
Unemployment Compensation
Water Projects Loans
Other Enterprise
Funds TotalInternal
Service Funds
Operating RevenuesNet premium income -$ -$ -$ -$ -$ 367,196,083$ Sales - - - 13,661,341 13,661,341 2,768,661Assessments - 314,656,925 - 23,906,566 338,563,491 -Charges for services - - 137,914 13,894,374 14,032,288 42,083,186Rental income - - - 165,936 165,936 20,091,594Interest income on loans/notes 19,329,081 - 8,268,637 - 27,597,718 -Federal government - 1,246,970,205 25,988,385 - 1,272,958,590 -Licenses, fees and permits - - - 3,258,378 3,258,378 -Fines - - - 2,859,844 2,859,844 -Other 4,363,870 1,669,396 2,562 3,967,470 10,003,298 4,205,076 Total operating revenues 23,692,951 1,563,296,526 34,397,498 61,713,909 1,683,100,884 436,344,600
Operating ExpensesSalaries and benefits 2,004,427 - 435,220 28,278,903 30,718,550 32,583,902Operating 3,970,475 - 9,764,779 12,198,113 25,933,367 35,386,842Claims and benefits expense - 2,233,381,579 - 20,360,741 2,253,742,320 251,937,071Interest on bonds payable 33,236,040 - - - 33,236,040 -Materials or supplies used - - - 2,094,412 2,094,412 1,103,068Servicers' fees 123,652 - - - 123,652 -Depreciation 17,989 - 1,476 441,686 461,151 5,591,796Amortization - - - - - 857,853Bond issuance costs amortization 449,839 - 160,417 - 610,256 -Insurance premiums - - - - - 103,990,195 Total operating expenses 39,802,422 2,233,381,579 10,361,892 63,373,855 2,346,919,748 431,450,727
Operating income (loss) (16,109,471) (670,085,053) 24,035,606 (1,659,946) (663,818,864) 4,893,873
Nonoperating Revenues (Expenses)Interest and investment income 19,268,879 2,678,819 (321,287) 12,342,332 33,968,743 216,544Interest expense - - (4,345,698) (166,000) (4,511,698) (118,480)Bond issuance costs amortization - - - (3,446) (3,446) -Federal grant revenue 17,756,895 - - 2,359,495 20,116,390 -Federal grant expense (17,557,436) - - - (17,557,436) -Gain (loss) on disposal of assets - - - 3,510 3,510 222,189Arbitrage rebate - - 8,200 - 8,200 - Total nonoperating revenues (expenses) 19,468,338 2,678,819 (4,658,785) 14,535,891 32,024,263 320,253
Income (loss) before transfers 3,358,867 (667,406,234) 19,376,821 12,875,945 (631,794,601) 5,214,126
TransfersTransfers in - - - 429,293 429,293 364,100Transfers out - (4,780,041) (1,500,657) (13,509,513) (19,790,211) -
Change in net assets 3,358,867 (672,186,275) 17,876,164 (204,275) (651,155,519) 5,578,226Net assets, July 1 (as restated) 180,400,989 370,276,935 233,284,276 31,373,181 48,438,648
Net assets, June 30 183,759,856$ (301,909,340)$ 251,160,440$ 31,168,906$ 54,016,874$
Some amounts reported for business-type activities in the statement of activities are different because the net revenue (expense) of certain internal service funds is reported with business-type activities. 253,018 Change in net assets of business-type activities (650,902,501)$
The notes to the financial statements are an integral part of this statement.
Enterprise Funds
Operating Revenues
Operating Expenses
Statement of Revenues, Expenses and Changes in Fund Net AssetsProprietary Funds
For the Fiscal Year Ended June 30, 2010
Nonoperating Revenues (Expenses)
Transfers

42
Statement of Cash FlowsProprietary Funds
For the Fiscal Year Ended June 30, 2010
Water Other InternalHousing Unemployment Projects Enterprise ServiceDivision Compensation Loans Funds Totals Funds
Cash flows from operating activitiesReceipts from customers and users 12,856,524$ 305,009,527$ 140,604$ 56,808,959$ 374,815,614$ 91,921,826$ Receipts for interfund services provided - 2,995,134 - 3,063,805 6,058,939 267,336,400 Receipts from component units - - - - - 76,624,627 Receipts of principal on loans/notes 17,655,701 - 21,691,824 - 39,347,525 5,000 Receipts of interest on loans/notes 19,894,622 - 7,578,693 - 27,473,315 - Receipts from federal government - 1,246,970,205 25,358,348 - 1,272,328,553 - Payments to suppliers, other governments and beneficiaries (7,310,886) (2,240,598,197) (9,105,635) (18,299,308) (2,275,314,026) (382,028,300) Payments to employees (1,850,809) - (454,701) (28,187,987) (30,493,497) (32,610,580) Payments for interfund services (196,382) - (130,239) (5,222,771) (5,549,392) (16,616,000) Payments to component units - - - (3,507,467) (3,507,467) (171,973) Purchase of loans and notes (26,931,154) - (19,282,688) - (46,213,842) -
Net cash provided by (used for) operating activities 14,117,616 (685,623,331) 25,796,206 4,655,231 (641,054,278) 4,461,000
Cash flows from noncapital financing activitiesGrant receipts 17,756,895 - - 2,542,286 20,299,181 - Advances from federal government - 438,325,470 - - 438,325,470 - Proceeds from sale of bonds 149,491,400 - - - 149,491,400 - Transfers and advances from other funds - - - 5,433,829 5,433,829 2,446,412 Principal paid on noncapital debt (67,081,785) - (7,860,000) - (74,941,785) - Interest paid on noncapital debt (33,581,352) - (4,639,201) - (38,220,553) - Transfers and advances to other funds - (4,709,718) (1,667,734) (13,905,501) (20,282,953) - Other noncapital financing activities (18,190,433) - - - (18,190,433) (40)
Net cash provided by (used for) noncapital financing activities 48,394,725 433,615,752 (14,166,935) (5,929,386) 461,914,156 2,446,372
Cash flows from capital and related financing activitiesProceeds from sale of capital assets - - - 3,510 3,510 226,934 Purchase of capital assets - - - (298,920) (298,920) (2,038,167) Principal paid on capital debt - - - (150,090) (150,090) (3,694,234) Interest paid on capital debt - - - (353,480) (353,480) (118,440) Payments on construction projects - - - (1,008,466) (1,008,466) - Net cash provided by (used for) capital and related financing activities - - - (1,807,446) (1,807,446) (5,623,907)
Cash flows from investing activitiesProceeds from sale of investments 470,545,136 - - 124,427,620 594,972,756 - Purchase of investments (551,915,711) - - (136,243,404) (688,159,115) - Interest, dividends and gains (losses) 19,447,636 6,318,572 (36,125) 3,122,979 28,853,062 593,449
Net cash provided by (used for) investing activities (61,922,939) 6,318,572 (36,125) (8,692,805) (64,333,297) 593,449
Net increase (decrease) in cash 589,402 (245,689,007) 11,593,146 (11,774,406) (245,280,865) 1,876,914 Cash and cash equivalents, July 1 207,689 282,417,051 64,928,849 57,558,892 405,112,481 117,735,804
Cash and cash equivalents, June 30 797,091 $ 36,728,044 $ 76,521,995 $ 45,784,486 $ 159,831,616 $ 119,612,718 $
Enterprise Funds

43
NEVADA
Water Other InternalHousing Unemployment Projects Enterprise ServiceDivision Compensation Loans Funds Totals Funds
Enterprise Funds
Reconciliation of operating income (loss) to net cash provided by (used for) operating activitiesOperating income (loss) (16,109,471)$ (670,085,053)$ 24,035,606 $ (1,659,946)$ (663,818,864)$ 4,893,873 $
Adjustments to reconcile operating income (loss) to net cash provided by (used for) operating activitiesDepreciation 17,989 - 1,476 441,686 461,151 5,591,796 Amortization - - 160,417 - 160,417 857,853 Bond issuance costs amortization 449,839 - - - 449,839 - Interest on bonds payable 33,236,040 - - - 33,236,040 - Decrease (increase) in loans and notes receivable (8,501,496) - 2,409,136 - (6,092,360) 5,000 Decrease (increase) in accrued interest and receivables 20,442 (8,321,660) (1,319,853) (2,495,082) (12,116,153) (540,118) Decrease (increase) in inventory, deferred charges, other assets - - - 672,335 672,335 (636,684) Increase (decrease) in accounts payable, accruals, other liabilities 5,004,273 (7,216,618) 509,424 7,696,238 5,993,317 (5,710,720)
Total adjustments 30,227,087 (15,538,278) 1,760,600 6,315,177 22,764,586 (432,873)
Net cash provided by (used for) operating activities 14,117,616 $ (685,623,331)$ 25,796,206 $ 4,655,231 $ (641,054,278)$ 4,461,000 $
Noncash investing, capital and financing activitiesGain (loss) on disposal of assets -$ -$ -$ -$ -$ 5,656$ Increase (decrease) in fair value of investments 21,917 - (901,188) 9,374,278 8,495,007 (200,571)
The notes to the financial statements are an integral part of this statement.

NEVADA
44
Pension and Other Employee
Benefit Trust Funds
Investment Trust Funds
Private-Purpose Trust Funds Agency Funds
AssetsCash and pooled investments: Cash with treasurer 29,257,133$ 73$ 4,773,745$ 113,502,269$ Cash in custody of other officials 390,365,603 5,969,877 5,320,660 83,989,850
Investments: Investments 760,739 963,410,224 5,885,633,932 175,661,293 Fixed income securities 6,199,713,956 - - - Marketable equity securities 7,862,126,972 - - - International securities 5,072,204,652 - - - Mortgage loans 4,378 - - - Real estate 853,999,874 - - - Alternative investments 575,344,723 - - -
Collateral on loaned securities 2,942,675,281 - - -
Receivables: Accrued interest and dividends 97,638,614 1,648,334 7,000 - Taxes receivable - - - 10,503,877 Trades pending settlement 251,977,372 - 11,666,158 - Intergovernmental receivables 89,183,954 - 65,333 - Contributions receivable - - 4,710,000 - Other receivables - - - 33,837,971
Due from other funds 1,253,180 82,924 173,747 369,120,100Due from fiduciary funds 17,964,909 - - 11,206,802Due from component unit 1,312,085 - - -Other assets 2,053,010 - - -Furniture and equipment 35,321,293 - - -Accumulated depreciation (31,031,992) - - - Total assets 24,392,125,736 971,111,432 5,912,350,575 797,822,162
LiabilitiesAccounts payable and accruals: Accounts payable 11,222,200 147,579 1,896,594 - Accrued payroll and related liabilities - - - 43,901 Intergovernmental payables - 8,973 13,474 447,142,988 Redemptions payable - - 1,954,521 - Trades pending settlement 372,694,790 5,475,724 15,222,321 -
Bank overdraft - - 4,000 -Obligations under securities lending 3,021,077,050 - - -Due to other funds 2,723,693 454 539,732 -Due to fiduciary funds - - 12,687 29,159,024Other liabilities: Deposits - - - 315,732,893 Other liabilities - - - 5,743,356 Total liabilities 3,407,717,733 5,632,730 19,643,329 797,822,162
Net assetsHeld in trust for: Employees' pension benefits 20,954,512,748 - - - OPEB benefits 29,895,255 - - - Pool participants - 965,478,702 - - Individuals - - 5,892,707,246 - Total net assets 20,984,408,003$ 965,478,702$ 5,892,707,246$ -$
The notes to the financial statements are an integral part of this statement.
Statement of Fiduciary Net AssetsFiduciary Funds
June 30, 2010
Assets
Liabilities
Net Assets

NEVADA
45
Pension and Other Employee Benefit
Trust FundsInvestment Trust
FundsPrivate-Purpose Trust
FundsAdditionsContributions: Employer 1,321,831,595$ -$ -$ Plan members 99,714,452 - - Participants - - 1,743,092,803 Repayment and purchase of service 26,890,242 - -Total contributions 1,448,436,289 - 1,743,092,803
Investment income: Net increase (decrease) in fair value of investments 1,427,660,203 (77,526) 450,178,644 Interest, dividends 597,067,096 14,620,191 138,843,674 Net securities lending income 1,726,152 - - Other 66,326,682 - -
2,092,780,133 14,542,665 589,022,318Less investment expense: Other (23,910,107) (9,922) -Net investment income 2,068,870,026 14,532,743 589,022,318
Other: Investment from local governments - 785,559,606 - Reinvestment from interest income - 1,211,961 - Other 1,979,997 53 -Total other 1,979,997 786,771,620 - Total additions 3,519,286,312 801,304,363 2,332,115,121
DeductionsPrincipal redeemed - 877,250,011 972,973,972Benefit payments 1,336,702,874 - 17,640,812Refunds 20,270,764 - -Contribution distributions 429,264 - -Dividends to investors - 1,282,640 -Administrative expense 11,263,655 560,261 21,623,909 Total deductions 1,368,666,557 879,092,912 1,012,238,693 Change in net assets 2,150,619,755 (77,788,549) 1,319,876,428Net assets, July 1 18,833,788,248 1,043,267,251 4,572,830,818
Net assets, June 30 20,984,408,003$ 965,478,702$ 5,892,707,246$
The notes to the financial statements are an integral part of this statement.
Statement of Changes in Fiduciary Net AssetsFiduciary Funds
For the Fiscal Year Ended June 30, 2010
Additions
Deductions

46
Hiking in the Ruby MountainsLamoille, NV
Photographed by Grant Tuttle

47
NEVADA
Notes to Financial StatementsFor the Fiscal Year Ended June 30, 2010
Note 1 - Summary of Significant Accounting Policies………………………….......................................….
Note 2 - Budgetary and Legal Compliance……………………………..……....…........…………......…
Note 3 - Deposits and Investments……………………………….....…………............………......……
Note 4 - Receivables…………………………..................................................…………….....………
Note 5 - Interfund Transactions………………….……...........................................…….............…..…
Note 6 - Restricted Assets………………......….……...........................................……..............…..…
Note 7 - Capital Assets…………………........……….......................................……...………....……
Note 8 - Long-Term Obligations………....................................……....………………….........………
Note 9 - Pensions and Other Employee Benefits……………….................................................................
Note 10 - Risk Management……………………...............................……....……….....…………....…
Note 11 - Fund Balances and Net Assets...............................................................................................…
Note 12 - Principal Tax Revenues……………….……..........................................……..........….......…
Note 13 - Works of Art and Historical Treasures…….........................................................….…….......…
Note 14 - Commitments and Contingencies………………………..................................…….......…...…
Note 15 - Subsequent Events……………...............................................................…………........……
Note 16 - Accounting Changes and Restatements…............................................................................……
48
53
54
59
60
63
63
65
72
77
78
79
80
80
82
82
Index

48
NEVADA
Notes to Financial StatementsFor the Fiscal Year Ended June 30, 2010
Note 1 - Summary of Significant Accounting Policies
A. ReportingEntityThe accompanying financial statements of the State of Nevada (the State) have been prepared in conformity with accounting principles generally accepted in the United States of America (GAAP) as applied to government units. The Governmental Accounting Standards Board (GASB) is the accepted stan-dard setting body for establishing governmental accounting and financial reporting principles. As required by GAAP, the State’s reporting entity includes the “primary government” and its “component units.” The primary government includes all funds, departments, agencies, and those authorities that are considered an integral part of the primary government. Compo-nent units are legally separate governmental organizations for which the State’s elected officials are financially accountable. The State’s component units have a June 30 year-end.
Financial accountability is defined in GASB Statement No. 14, The Financial Reporting Entity, as amended by GASB Statement No. 39, Determining Whether Certain Organiza-tions are Component Units. The State is financially account-able for those entities in which the State appoints a voting majority of an organization’s governing authority, and either is able to impose its will upon the entity or there exists a finan-cial benefit or burden relationship with the State. For those entities in which the State does not appoint a voting majority of the governing authority, GASB Statement No. 14 requires inclusion in the reporting entity if they are fiscally dependent on the State or if it would be misleading to exclude the entity.
BlendedComponentUnits: The following blended compo-nent units are entities that are legally separate from the State. However, since the State Legislature retains certain signifi-cant governing powers over these entities, they are reported as if they are part of the primary government under the provi-sions of GASB Statement No. 14.
The Public Employees’ Retirement System (PERS), the Legislators’ Retirement System (LRS) and the Judicial Retirement System (JRS) are administered by a seven-member board appointed by the Governor. PERS is the administrator of a cost-sharing, multiple-employer, defined benefit public employees’ retirement system established by the Nevada Legislature in 1947 to provide a reasonable base income to qualified employees who have been employed by a public employer and whose earning capacities have been removed or substantially impaired by age or disability. LRS is the administrator of a single-employer public employees’ defined benefit retirement system established in 1967 by the Nevada Legislature to provide a reasonable base income to Legislators at retirement. JRS is the administrator of an agent multiple-employer public employees’ defined benefit retirement system established by the Nevada Legislature to provide a reasonable base income to justices of the Supreme Court, district judges, municipal court judges, and justices of the peace at retirement.
The Retirement Benefits Investment Fund (RBIF) was creat-ed by NRS 355.220 (2) for the sole purpose of providing an investment vehicle for monies belonging to either the State or
local government other post employment benefit trust funds. RBIF is administered by the Retirement Benefits Investment Board, which consists of the same members of the Public Employees’ Retirement Board.
Nevada Real Property Corporation is a legally separate enti-ty whose board of directors are exclusively State employees or officials. It was incorporated to finance certain construc-tion projects. Such projects include office buildings, a tran-sitional residential facility and a warehouse, all financed by the issuance of certificates of participation. Upon comple-tion of construction, the Corporation leases the facilities to the State. The State reports these financial transactions as part of the primary government using the blended method.
Discretely Presented Component Units: Per the provi-sions of GASB Statement No. 14, a component unit should be included in the reporting entity financial statements using the discrete presentation method if the component unit’s govern-ing body is not substantively the same as the governing body of the primary government, and the component unit does not provide services entirely or almost entirely to the primary government. The following discretely presented component units are reported in separate columns in the government-wide financial statements to emphasize they are legally separate from the State.
The Nevada System of Higher Education (NSHE) is governed by a Board of Regents elected by the voters. However, NSHE is fiscally dependent upon the State because of appropriations from the State Legislature, the Legislative approval of the budget for those appropriations, the levying of taxes, if necessary, and the issuance of debt to support NSHE. Because NSHE has a separate govern-ing body and does not provide services entirely or almost entirely to the primary government, it is presented discrete-ly in the financial statements.
The Colorado River Commission (CRC) is a legally sepa-rate entity responsible for managing Nevada’s interests in the water and power resources available from the Colorado River. It is governed by seven commissioners, a majority of whom are appointed by the State: four are appointed by the Governor and three appointed by the board of direc-tors of the Southern Nevada Water Authority. Bonds issued by the CRC are backed by the full faith and credit of the State of Nevada, which creates the potential for a finan-cial burden to the State. CRC provides services to citizens through the distribution and sale of electric power. As CRC has a separate governing body and does not provide servic-es entirely or almost entirely to the primary government, it is presented discretely in the financial statements.
Complete financial statements for each of the individual component units, with the exception of the Nevada Real Prop-erty Corporation, which has no other financial activity than that described above, may be obtained at that entity’s admin-istrative offices:
• Public Employees’ Retirement SystemCarson City, NV

49
Notes to Financial StatementsFor the Fiscal Year Ended June 30, 2010
NEVADA(Note 1 Continued)
• Retirement Benefits Investment FundCarson City, NV
• Legislators’ Retirement SystemCarson City, NV
• Judicial Retirement SystemCarson City, NV
• Nevada System of Higher Education Reno, NV
• Colorado River CommissionLas Vegas, NV
Related Organizations: The Governor is responsible for appointing the members of many occupational licensing boards. The State’s accountability for these boards does not extend beyond making the appointments and thus these boards are excluded from this report. The State does not exercise financial or administrative control over the excluded occupa-tional licensing boards.
B. Government-WideandFundFinancialStatementsGovernment-Wide Financial Statements: The Statement of Net Assets and the Statement of Activities report informa-tion on all non-fiduciary activities of the primary government and its component units. For the most part, the effect of inter-fund activity has been removed from these statements. Inter-fund receivables and payables between governmental funds and enterprise funds are reported as internal balances in the government-wide statement of net assets. Primary govern-ment activities are distinguished between governmental and business-type activities. Governmental activities generally are financed through taxes, intergovernmental revenues, and other non-exchange revenues. Business-type activities are financed in whole or in part by fees charged to external parties for goods or services.
The Statement of Net Assets presents the reporting entity’s non-fiduciary assets and liabilities with the difference report-ed as net assets. Net assets are reported in three categories:
Invested in capital assets, net of related debt consists of capital assets, net of accumulated depreciation and reduced by outstanding balances for bonds, notes, and other debt that are attributed to the acquisition, construction, or improvement of those assets.
Restricted net assets result when constraints placed on net asset use are either externally imposed by creditors, grant-ors, contributors, and the like, or imposed by law through constitutional provisions or enabling legislation. Addition-al disclosure related to the amount of net assets restricted by enabling legislation is provided in Note 11.
Unrestricted net assets consist of net assets that do not meet the definition of the two preceding categories. Unrestricted net assets often are designated to indicate that manage-ment does not consider them to be available for general operations. Unrestricted net assets often have constraints on resources that are imposed by management but can be removed or modified.
The Statement of Activities demonstrates the degree to which the direct expenses of a given function or segment are offset by program revenues. Direct expenses are those that are clearly identifiable within a specific function. Certain centralized costs have been included as part of the program expenses reported for the various functions and activities. Program revenues include: 1) charges to customers or applicants who purchase, use or directly benefit from goods, services or privileges provided by a given function, and 2) grants and contributions that are restrict-ed to meeting the operational or capital requirements of a partic-ular function. Taxes and other items not meeting the definition of program revenues are instead reported as general revenues. In general, internal activity has been eliminated from the State-ment of Activities. Overhead costs have been removed to mini-mize the double counting of internal activities, but interfund services provided and used have been retained, as their elimi-nation would distort the measurement of the cost of individual functional activities. Internal activities of a reimbursement type nature reduce the expenses of the reimbursed programs.
FundFinancialStatements: Separate financial statements are provided for governmental funds, proprietary funds, and fiduciary funds, even though the latter are excluded from the government-wide statements. Major individual governmental funds and major individual proprietary funds are reported as separate columns in the fund financial statements with non-major funds being combined into a single column.
C. Measurement Focus, Basis of Accounting andFinancialStatementPresentationMeasurement Focus and Basis of Accounting: The government-wide statements are reported using the economic resources measurement focus and the accrual basis of account-ing, as are the proprietary and fiduciary fund financial state-ments. Revenues are recorded when earned and expenses are recorded when a liability is incurred, regardless of the timing of cash flows. Property taxes are recognized as revenues in the year for which they are levied. Grants and similar items are recognized as revenues as soon as all eligibility require-ments imposed by the provider have been met.
Private-sector standards of accounting and financial report-ing issued prior to December 1, 1989 generally are followed in both the government-wide and proprietary fund financial statements to the extent that those standards do not conflict with or contradict guidance of the Governmental Account-ing Standards Board. Governments also have the option of following subsequent private-sector guidance for their busi-ness-type activities and enterprise funds, subject to this same limitation. The State has elected not to follow subsequent private-sector guidance.
Proprietary funds distinguish operating revenues and expenses from nonoperating items. Operating revenues and expenses generally result from providing services and producing and deliv-ering goods in connection with a proprietary fund’s principal, ongoing operations. All revenues and expenses not meeting this definition are reported as nonoperating revenues and expenses.
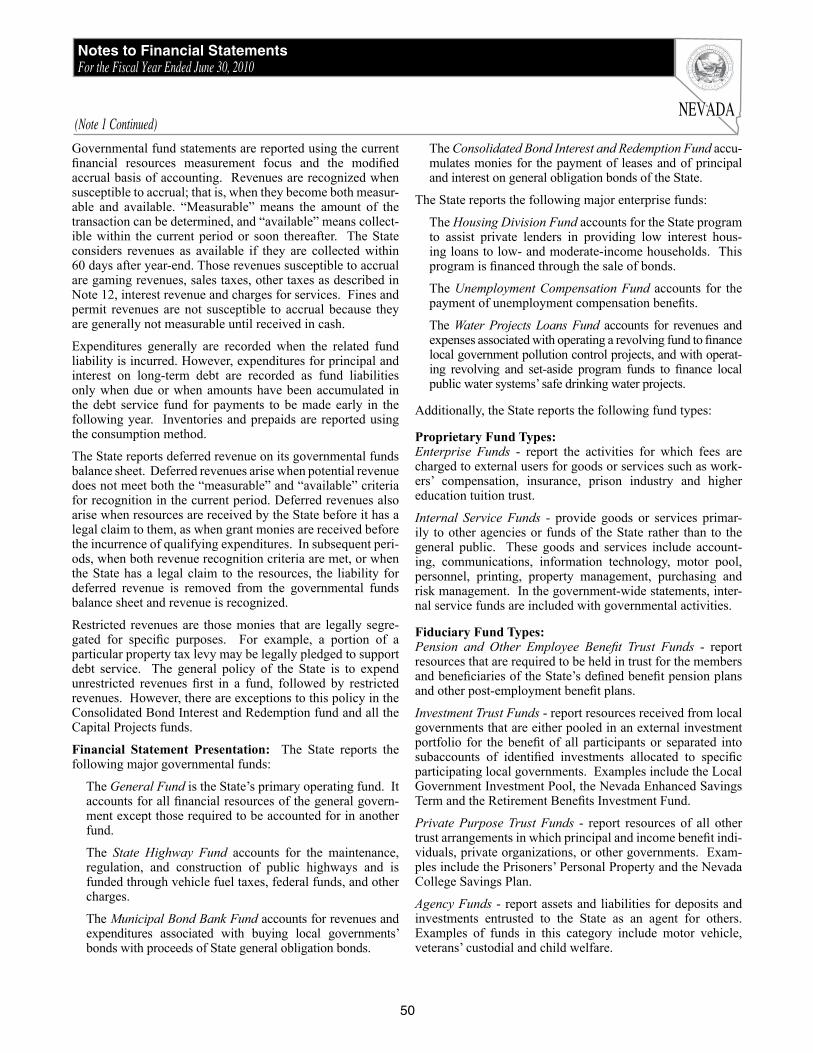
50
Notes to Financial StatementsFor the Fiscal Year Ended June 30, 2010
NEVADA(Note 1 Continued)
Governmental fund statements are reported using the current financial resources measurement focus and the modified accrual basis of accounting. Revenues are recognized when susceptible to accrual; that is, when they become both measur-able and available. “Measurable” means the amount of the transaction can be determined, and “available” means collect-ible within the current period or soon thereafter. The State considers revenues as available if they are collected within 60 days after year-end. Those revenues susceptible to accrual are gaming revenues, sales taxes, other taxes as described in Note 12, interest revenue and charges for services. Fines and permit revenues are not susceptible to accrual because they are generally not measurable until received in cash.
Expenditures generally are recorded when the related fund liability is incurred. However, expenditures for principal and interest on long-term debt are recorded as fund liabilities only when due or when amounts have been accumulated in the debt service fund for payments to be made early in the following year. Inventories and prepaids are reported using the consumption method.
The State reports deferred revenue on its governmental funds balance sheet. Deferred revenues arise when potential revenue does not meet both the “measurable” and “available” criteria for recognition in the current period. Deferred revenues also arise when resources are received by the State before it has a legal claim to them, as when grant monies are received before the incurrence of qualifying expenditures. In subsequent peri-ods, when both revenue recognition criteria are met, or when the State has a legal claim to the resources, the liability for deferred revenue is removed from the governmental funds balance sheet and revenue is recognized.
Restricted revenues are those monies that are legally segre-gated for specific purposes. For example, a portion of a particular property tax levy may be legally pledged to support debt service. The general policy of the State is to expend unrestricted revenues first in a fund, followed by restricted revenues. However, there are exceptions to this policy in the Consolidated Bond Interest and Redemption fund and all the Capital Projects funds.
Financial Statement Presentation: The State reports the following major governmental funds:
The General Fund is the State’s primary operating fund. It accounts for all financial resources of the general govern-ment except those required to be accounted for in another fund.
The State Highway Fund accounts for the maintenance, regulation, and construction of public highways and is funded through vehicle fuel taxes, federal funds, and other charges.
The Municipal Bond Bank Fund accounts for revenues and expenditures associated with buying local governments’ bonds with proceeds of State general obligation bonds.
The Consolidated Bond Interest and Redemption Fund accu-mulates monies for the payment of leases and of principal and interest on general obligation bonds of the State.
The State reports the following major enterprise funds:
The Housing Division Fund accounts for the State program to assist private lenders in providing low interest hous-ing loans to low- and moderate-income households. This program is financed through the sale of bonds.
The Unemployment Compensation Fund accounts for the payment of unemployment compensation benefits.
The Water Projects Loans Fund accounts for revenues and expenses associated with operating a revolving fund to finance local government pollution control projects, and with operat-ing revolving and set-aside program funds to finance local public water systems’ safe drinking water projects.
Additionally, the State reports the following fund types:
ProprietaryFundTypes:Enterprise Funds - report the activities for which fees are charged to external users for goods or services such as work-ers’ compensation, insurance, prison industry and higher education tuition trust.
Internal Service Funds - provide goods or services primar-ily to other agencies or funds of the State rather than to the general public. These goods and services include account-ing, communications, information technology, motor pool, personnel, printing, property management, purchasing and risk management. In the government-wide statements, inter-nal service funds are included with governmental activities.
FiduciaryFundTypes:Pension and Other Employee Benefit Trust Funds - report resources that are required to be held in trust for the members and beneficiaries of the State’s defined benefit pension plans and other post-employment benefit plans.
Investment Trust Funds - report resources received from local governments that are either pooled in an external investment portfolio for the benefit of all participants or separated into subaccounts of identified investments allocated to specific participating local governments. Examples include the Local Government Investment Pool, the Nevada Enhanced Savings Term and the Retirement Benefits Investment Fund.
Private Purpose Trust Funds - report resources of all other trust arrangements in which principal and income benefit indi-viduals, private organizations, or other governments. Exam-ples include the Prisoners’ Personal Property and the Nevada College Savings Plan.
Agency Funds - report assets and liabilities for deposits and investments entrusted to the State as an agent for others. Examples of funds in this category include motor vehicle, veterans’ custodial and child welfare.

51
Notes to Financial StatementsFor the Fiscal Year Ended June 30, 2010
NEVADA(Note 1 Continued)
D. Assets,LiabilitiesandNetAssets/FundBalanceCash and Pooled Investments - The State Treasurer manages a cash pool where all temporary surplus cash is invested. These investments are reported on the Statement of Net Assets and Balance Sheet as cash and pooled investments. Earnings from these pooled investments are credited to the General Fund and certain other funds that have specific statutory authority to receive a prorated share based on daily cash balances. Also included in this category is cash held by departments in petty cash funds and in bank accounts outside the Treasurer’s cash management pool. The operations and investments of the cash pool are described in Note 3.
Cash and cash equivalents are defined as bank accounts, petty cash, money market demand accounts and certificates of deposit with original maturities of three months or less. Cash and cash equivalents are reported in the Statement of Cash Flows for proprietary fund types.
Investments - Investments are stated at fair value. Fair value is defined as the price at which an asset passes from a will-ing seller to a willing buyer. It is assumed that both buyer and seller are rational and have a reasonable knowledge of relevant facts. Short-term investments are generally reported at cost, which approximates fair value. Securities, traded on a national or international exchange, are valued at the last reported sale price of the day. International securities prices incorporate end-of-day exchange rates. The fair value of real estate investments is based on estimated current value, and MAI (Member Appraisal Institute) independent appraisals. Investments that do not have an established market are report-ed at estimated fair value.
The Local Government Investment Pool, the Nevada Enhanced Savings Term Investment Trust and the Retirement Benefits Investment Fund are investment trust funds as defined in Governmental Accounting Standards Board Statement No. 31, Accounting and Financial Reporting for Certain Investments and for External Investment Pools. The investments of the Local Government Investment Pool and the Nevada Enhanced Savings Term Investment Trust are subject to the general limi-tation of section 355.170 of Nevada Revised Statutes. The investments of the Retirement Benefits Investment Fund are governed by the prudent person standard, as set forth by NRS 286.682. Security transactions are accounted for on the trade date (the date the order to buy or sell is executed). Interest income is determined on an accrual basis with discounts earned and premiums paid being amortized. Realized gains and losses, if any, on sales of securities are calculated using the amortized cost basis at the date of sale. The fair value of the position in the pool is the same as the value of the pool shares. Wells Fargo Trust Operations is the custodian and transfer agent for both the Local Government Investment Pool and the Nevada Enhanced Savings Term Investment Trust funds. The Bank of New York Mellon is the custodian and transfer agent for the Retirement Benefits Investment Fund.
Derivative securities are priced and accounted for at fair value. For exchange-traded securities, such as futures and options, closing prices from the securities exchanges are used. For fixed income derivatives, such as collateralized mortgage obligations (CMO), mortgage backed securities, and asset backed securities, commercial pricing services (where avail-able) or bid-side prices from a broker/dealer are used. Foreign exchange forward contracts are valued at the price at which the transaction could be settled by offset in the forward markets. Investments are discussed further in Note 3.
Receivables - Receivables represent amounts due to the State at June 30, which will be collected sometime in the future. In the government-wide financial statements, a correspond-ing amount is recorded as revenue. In the governmental fund financial statements, the portions considered “available” (i.e., received by the State within approximately 60 days after year-end) are recorded as revenue; the remainder is recorded as deferred revenue. Receivables in proprietary fund types have arisen in the ordinary course of business. All receivables are shown net of an allowance for uncollectible accounts.
Property taxes are levied July 1 on property values assessed by the prior January 1. Property tax billings are payable in quarterly installments on the third Monday in August and the first Monday in October, January and March, after which time the bill is delinquent.
Significant receivable balances not expected to be collected within one year are presented in Note 4.
Interfund Transactions - The State has two types of interfund transactions:
1. Services rendered and employee benefit contribu-tions are accounted for as revenues, expenditures/expenses in the funds involved.
2. Operating appropriations and subsidies are account-ed for as transfers in the funds involved.
Transfers and due from/due to other funds are presented in Note 5.
Inventories - Inventories are stated at cost on the first-in, first-out basis. Inventory in the State Highway Fund, a special revenue fund, consists of expendable supplies held for consumption. The cost is recorded as an expenditure at the time individual inventory items are consumed. Inventory items in the funds are offset by a fund balance reserve to indi-cate that they are unavailable for appropriation.
Prepaid Expenses – Prepaid expenses reflect payments for costs applicable to future accounting periods and are record-ed in both government-wide and fund financial statements. Prepaid items in the funds are offset by a fund balance reserve to indicate that they are unavailable for appropriation.
Advances to Other Funds - Long-term interfund advances are recorded by the advancing fund as a receivable and as a reser-vation of fund balance to maintain the accountability and to disclose properly the amount available for appropriation (unre-

52
Notes to Financial StatementsFor the Fiscal Year Ended June 30, 2010
NEVADA(Note 1 Continued)
served fund balance). Repayments are credited to the receiv-able and corresponding reductions are made in the reserve. A summary of interfund advances is presented in Note 5.
Capital Assets and Depreciation - An inventory of State-owned land, buildings and equipment was developed in 1985. All capital assets are recorded in the Statement of Net Assets at historical cost or estimated historical cost, based on acquisi-tion of comparable property or agency records, if actual histor-ical cost is not available. Donated capital assets are stated at appraised fair value at the time of donation or estimated fair value at time of donation, based on acquisition of comparable property, if appraised fair value is not available. The govern-ment defines capital assets as assets with a unit cost of $5,000 or more for furniture and equipment, or $100,000 or more for buildings and improvements, and an estimated useful life in excess of one year. Interest incurred during construction is only capitalized in proprietary funds.
Most capital assets are depreciated principally on a straight-line basis over estimated useful lives of 40 years for structures and 3 to 30 years for improvements, furniture and equipment. The State’s significant infrastructure assets utilize the modi-fied approach in which costs to maintain and preserve these assets are expensed and no depreciation expense is recorded. This approach is discussed further in the Required Supple-mentary Information portion of this report.
In the Nevada System of Higher Education, capital assets are defined as assets with an initial unit cost of $5,000 or more and an estimated useful life in excess of one year. Such assets are stated at cost at the date of acquisition or fair value at date of donation in the case of gifts. Depreciation is computed on a straight-line basis over estimated useful lives of 40 years for buildings, 15 years for land improvements and 3 to 18 years for library books, machinery and equipment. Additional disclosure related to capital assets is provided in Note 7.
Compensated Absences - Compensated absences are account-ed for in accordance with GASB Statement No. 16, Account-ing for Compensated Absences, which requires that a liabil-ity for compensated absences relating to services already rendered and that are not contingent on a specified event be accrued as employees earn the rights to the benefits. Compen-sated absences relating to future services or that are contin-gent on a specified event will be accounted for in the period those services are rendered or those events take place. Propri-etary fund types report accrued compensated absences as liabilities in the appropriate funds. Governmental funds report compensated absences expected to be liquidated with expend-able available financial resources as an expenditure and a fund liability in the fund financial statements. On the Statement of Net Assets, the total accrued compensated absences for both proprietary and governmental fund types is reported.
Deferred Revenues - Deferred revenues in the General Fund consist primarily of refundable gaming taxes and fees and nonexchange transactions for which the revenue is measur-
able but not available. Deferred revenue in the debt service funds consists primarily of amounts due from other govern-ments to retire long-term debt.
Long-Term Obligations - In the government-wide state-ments and proprietary fund financial statements, long-term debt and other long-term liabilities are reported as liabilities. Bond premiums and discounts, as well as issuance costs, are deferred and amortized over the life of the bonds using the straight-line method. Bonds payable are reported net of the applicable bond premium or discount. Bond issuance costs are reported as deferred charges.
In the fund financial statements, governmental fund types recog-nize bond premiums and discounts, as well as bond issuance costs, during the current period. The face amount of the debt issued is reported as other financing sources. Premiums received on debt issuances are reported as other financing sources while discounts on debt issuances are reported as other financing uses. Issuance costs, whether or not withheld from the actual debt proceeds, are reported as debt service expenditures. Long-Term Obligations are more fully described in Note 8.
Net Assets/Fund Balance - The difference between fund assets and liabilities is “Net Assets” on the government-wide, propri-etary and fiduciary fund statements, and “Fund Balance” on governmental fund statements.
Fund Balance Reservations and Designations – In the fund financial statements, governmental funds classify fund balanc-es as either reserved or unreserved. Reserved fund balances are those amounts that are not available for appropriation or are legally restricted by outside parties for a specific use. Unreserved fund balances reflect the balances available for appropriation for the general purposes of the fund. Manage-ment may designate a portion of the unreserved fund balance for a specific purpose, but designations are tentative manage-ment plans that are subject to change.
The nature of reserved and designated fund balances is ex-plained below:
“Encumbrances and contracts” indicates assets required to meet future payment obligations.
“Inventory” indicates consumable supplies held in stock by governmental fund types.
“Advances” indicates assets, which have been advanced to other funds on a long-term basis.
“Funds held as permanent investments” indicates assets per-manently invested for the purpose of the fund.
“Fiscal emergency” indicates assets restricted for use in a State fiscal emergency as declared by the Legislature and the Governor.
“Debt service” indicates assets reserved for the retirement of long-term obligations.

53
Notes to Financial StatementsFor the Fiscal Year Ended June 30, 2010
NEVADA(Note 1 Continued)
Note 2 - Budgetary and Legal Compliance
“Other” generally indicates assets that, because of their nature, are unavailable for expenditures.
“Balances forward” indicates unexpended funds brought forward to the next year, which are designated for general government; health and social services; education and support services; law, justice and public safety; regulation of busi-ness; transportation or recreation and resource development purposes.
Note 11 provides a disaggregation of governmental fund balances, reserved for other, and governmental fund balances, unreserved, designated.
E. IntergovernmentalAssistanceProgramsThe State participates in various federal award programs. Federal awards are received by the State in both cash and noncash forms. Federal reimbursement type grants are record-ed as revenues when the related expenditures are recognized (as they become susceptible to accrual [measureable and avail-able] under the modified accrual basis of accounting). The State considers revenues as available if they are collected within 60 days after year-end. Certain grants have matching requirements in which the State must contribute a proportion-ate share of the total costs of a program. Use of grant resourc-es is conditioned upon compliance with terms of the grant agreements and applicable federal regulations, which include subjecting grants to financial and compliance audits.
BudgetaryProcessandControlThe Governor must submit his proposed budget for the Exec-utive Branch to the State Legislature not later than 14 calen-dar days before each regular session, which convenes every odd-numbered year. The presented budget spans the next two fiscal years and contains the detailed budgetary estimates of revenues and expenditures. The Legislature enacts the budget through passage of the General Appropriations Act, which allows expenditures from unrestricted revenues, and the Authorized Expenditures Act, which allows expenditures from revenues collected for specific purposes. Once passed and signed, the budget becomes the State’s financial plan for the next two fiscal years.
The legal level of budgetary control, the level at which appro-priations are approved and the level at which over expenditure of appropriations or transfers of appropriated amounts may not occur without Legislative action, is at the total program level within each department or agency.
Limited budgetary revisions may be made without Legisla-tive action through the following management/administrative procedures. After obtaining the approval of the Governor, or his designee, the Budget Director, Legislative Interim Finance Committee (LIFC) approval is required of those revisions in excess of $20,000 which have the affect, when taken into consideration with all other changes during the fiscal year, of increasing or decreasing any legislatively approved expendi-ture level by 10% or $50,000, whichever is less. Revisions not exceeding this threshold require only budget director approval. The LIFC approval is not equivalent to governing body approval, as total appropriations for a program may not be increased except as follows. The Legislature appropri-ates limited funds to the Contingency Fund, a Special Reve-nue Fund, which may be allocated to programs by the LIFC upon recommendation of the Board of Examiners. Alloca-tions totaling $36,907,078 were made in the 2010 fiscal year.
Unencumbered appropriations lapse at the end of each fiscal year unless specific authority to carry forward is granted in the Appropriations Act. Unexpended authorized resources, under the Authorized Expenditures Act, are carried forward for expenditure in the next fiscal period.
Budgets are legally adopted for the General Fund and Special Revenue Funds, except for the Nevada Real Property Corpo-ration special revenue fund. In addition, certain activity within such funds may be unbudgeted. The State’s budget is prepared principally on a modified accrual basis with the following exceptions:
1. Cash placed in petty cash funds or outside bank accounts is considered expended for budgetary purposes.
2. Advances to other funds are considered expenditures. Repayments of such advances are considered revenues.
3. Certain prepaid/deferred assets are considered expend-ed for budgetary purposes. Inventory is an expendi-ture for budgetary purposes. Certain deferred revenue is considered revenue for budgetary purposes.
4. Expenditures are only recognized if the liability is liquidated within 45 days after the fiscal year end.
5. Revenue from grants is only recognized when it is received in cash.
6. Encumbrances for goods or services not received by fiscal year end are considered an expenditure of the current period if received and paid within 45 days.
The Budgetary Comparison Schedule is presented as Required Supplementary Information (RSI) in this report. Actual amounts in this schedule are presented on a budgetary basis. Because this basis differs from accounting principles general-ly accepted in the United States of America (GAAP), a recon-ciliation between the budgetary and GAAP basis is presented in the RSI.

54
Notes to Financial StatementsFor the Fiscal Year Ended June 30, 2010
NEVADANote 3 - Deposits and Investments
The Nevada Revised Statutes and Nevada Administrative Code, as well as procedures approved by the State Board of Finance, govern deposits and investing activities for the prima-ry government and its discretely presented component units. The Office of the State Treasurer is responsible for oversight of the deposits and investments for the State of Nevada.
A. DepositsPrimary Government, Private Purpose Trust, Pension and Other Employee Benefit Trust, and Investment Trust Funds - the State minimizes its custodial credit risk by legislation establishing a program to monitor a collateral pool for public deposits. Custodial credit risk for deposits is the risk that in the event of a bank failure, the State’s deposits may not be recovered. The Nevada Revised Statutes direct the Office of the State Treasurer to deposit funds into any state, or national bank, credit union or savings and loan association covered by federal depository insurance. For those deposits over and above the federal depository insurance maximum balance, sufficient collateral must be held by the financial institution to protect the State of Nevada against loss. The pooled collateral for deposits program maintains a 102% pledged collateral for all public deposits. As of June 30, 2010, the bank balance of the primary government, private purpose trust, pension and other employee benefit trust, and investment trust funds totaled $57,045,151, of which $2,677,891 was uncollateral-ized and uninsured.
Component Units - cash and cash equivalents of the Nevada System of Higher Education (NSHE) are stated at cost, which approximates market, and consist of deposits in money market funds, which are not federally insured, and cash in the bank. At June 30, 2010 NSHE’s deposits in money market funds totaled $117,128,000 and cash in bank was $7,390,000. Of these balances, $250,000 are covered by the Federal Deposi-tory Insurance Corporation (FDIC); the remaining deposits are uncollateralized and uninsured.
B. InvestmentsNevada Revised Statute (NRS) 355.140 details the types of securities in which the State may invest. In general, autho-rized investments include: certificates of deposit, asset-backed securities, bankers’ acceptances and commercial paper, collat-eralized mortgage obligations, corporate notes, money market mutual funds whose policies meet the criteria set forth in the statute, United States treasury securities, and specific securi-ties implicitly guaranteed by the federal government. Addi-tionally, the State may invest in limited types of repurchase agreements; however, statutes generally prohibit the State
from entering into reverse-repurchase agreements. The State’s Permanent School Fund is further limited by statute as to the types of investments in which it may invest (NRS 355.060). Cash and Investments are also discussed at Note 1 under Assets, Liabilities and Net Assets/Fund Balance.
The State Board of Finance reviews the State’s investment policies at least every four months. The Board is comprised of the Governor, the State Controller, the State Treasurer and two members appointed by the governor, one of which must be actively engaged in commercial banking in the State.
Investments held in the Local Government Investment Pool (LGIP), Retirement Benefits Investment Fund (RBIF), and Nevada Enhanced Savings Term (NVEST) are specifically identifiable investment securities and are included in the following tables. LGIP, RBIF, and NVEST are investment trust funds and discussed further under Note 1, Assets, Liabilities and Net Assets/Fund Balance. LGIP and NVEST are governed by the Nevada State Board of Finance and administered by the Nevada State Treasurer. Complete financial statements for LGIP and NVEST may be obtained from the State Treasurer’s Office, 101 N. Carson Street, Suite 4, Carson City, NV 89701. RBIF is administrated by the Retirement Benefits Invest-ment Board. The audited financial statements of RBIF may be obtained from the Public Employees’ Retirement System, 693 West Nye Lane, Carson City, Nevada 89703.
InterestRateRisk: Interest rate risk is the risk that chang-es in interest rates will adversely affect the fair value of an investment.
Primary Government, Pension and Other Employee Benefit Trust, and Investment Trust Funds - The State does not have a written interest rate risk policy. However, the benchmark used by the State Treasurer to determine whether competitive market yields are being achieved is the 90 day U.S. Treasury Bill’s average over the previous three month period (Rolling 90 day T-Bill). Investment policies for the pension and other employee benefit trust funds authorize all securities within the Barclays Capital Aggregate Index benchmark. If secu-rities are purchased outside the Barclays Capital Aggregate Index, they must be of investment grade rating by at least two of Moody’s, Standard & Poor’s or Fitch (BBB- or better by Standard & Poor’s/Fitch, Baa3 or better by Moody’s). The following table provides information about the interest rate risks associated with the State’s investments as of June 30, 2010 (expressed in thousands):

55
Notes to Financial StatementsFor the Fiscal Year Ended June 30, 2010
NEVADA(Note 3 Continued)
Private Purpose Trust - Nevada College Savings Plan, a private purpose trust, currently has no formal investment poli-cy with regard to interest rate risk for the investments. Invest-ments having interest rate risk are all invested in mutual funds with various maturities from 13 days to 9.2 years and are not included in the table above.
Component Units – The Nevada System of Higher Education’s (NSHE) policy for reducing its exposure to interest rate risk is to have an average investment life of at least two years for fixed income securities within both the endowment and operating investment pools. With regard to the trusts included in endow-ment investments, NSHE is not the trustee of these invest-ments and, therefore, currently has no policies with regard to interest rate risk for these investments. Investments having interest rate risk are principally invested in mutual funds and private commingled funds. The following table provides the segmented time distribution for these investments at June 30, 2010 (expressed in thousands):
CreditRisk: Credit risk is the risk that an issuer or other counterparty to an investment will not fulfill its obligations to the State of Nevada.
Primary Government, Private Purpose Trust, Pension and Other Employee Benefit Trust, and Investment Trust Funds -
NRS 355.140, the State Treasurer’s investment policy, and investment policies of the pension and other employee bene-fit trust and investment trust funds all address credit risk. A summary of the policies is presented as follows:
• Commercial paper, Negotiable Certificates of Deposit, and Bankers’ Acceptances are rated by a nationally recognized rating service as “A-1,” “P-1” or its equivalent, or better,
• Notes, bonds and other unconditional obligations issued by corporations in the U.S. are rated by a nationally recog-nized rating service as “A” or its equivalent, or better,
• Money market mutual funds are SEC registered 2(A)7 and rated by a nationally recognized rating service as “AAA” or its equivalent,
• Collateralized mortgage obligations and asset-backed securities are rated by a nationally recognized rating service as “AAA” or its equivalent,
• Repurchase agreements with banks or registered broker-dealers provided the agreement is collateralized by 102% with U.S. Treasuries or U.S. government agency securities on a delivery basis.
In addition to the above provisions, investment policies for the pension and other employee benefit trust funds allow investment in corporate bonds, assets-related instruments, and foreign debt issued in the U.S. rated by at least two of the following: Moody’s, Standard & Poor’s, or Fitch (BBB- or better by Standard & Poor’s/Fitch, Baa3 or better by Moody’s). Nevada College Savings Plan, a private purpose trust, currently has no formal investment policy with regard to credit risk for the investments. Investments having credit risk are all invested in unrated mutual funds that are included in the table below.
Fair Value Less Than 1 1-5 6-10 More Than 10U. S. Treasury securities 4,938,307$ 316,214$ 1,439,061$ 706,995$ 2,476,037$ Negotiable certificate of deposit 14,999 14,999 - - - U. S. agencies 2,262,181 1,539,676 390,916 36,146 295,443 Mutual funds 7,242 7,242 - - - Asset backed corporate securities 133,761 20,000 73,336 17,685 22,740 Corporate bonds and notes 1,045,868 22,745 22,383 592,729 408,011 Commercial paper 44,999 44,999 - - - Fixed income securities 23,767 23,767 - - - International investments 1,290,621 52,087 474,722 391,204 372,608 Municipal bonds 558,405 - 17,907 30,006 510,492 Investment agreements 38,028 - - 525 37,503 Other short-term investments 1,043,126 498,426 544,700 - - Collateralized mortgage obligations 369,724 1,355 10,020 58,363 299,986 Total 11,771,028$ 2,541,510$ 2,973,045$ 1,833,653$ 4,422,820$
Maturities in Years
Less than 1 year 479,634$ 1 to 5 years 21,673 6 to 10 years 15,218 More than 10 years 20,486 Total 537,011$

56
Notes to Financial StatementsFor the Fiscal Year Ended June 30, 2010
NEVADA(Note 3 Continued)
The State’s investments as of June 30, 2010 were rated by Standard & Poor’s and/or an equivalent national rating organization, and the ratings are presented below using the Standard & Poor’s rating scale (at fair value, expressed in thousands):
As of June 30, 2010, the State of Nevada held debt obligations of Lehman Brothers Holdings Inc. On September 14, 2008, Lehman Brothers Holdings Inc. declared bankruptcy. The ulti-mate value of the State’s debt securities will not be known until the bankruptcy proceedings are completed. However, debt obligations of Lehman Brothers Holdings Inc. held by the State were marked to market at June 30, 2010.
Component Unit - the Nevada System of Higher Education’s (NSHE) policy for reducing its exposure to credit risk is to maintain a weighted average credit rating of AA or better, and never below A, for investments with credit risk within both the endowment and operating investment pools. With regard to the trusts included in endowment investments, NSHE is not the trustee of these investments and therefore, it currently has no policies with regard to credit risk for these investments. The credit risk profile for NSHE operating and endowment invest-ments at June 30, 2010 is as follows (expressed in thousands):
Concentration of Credit Risk: Concentration of credit risk is the risk of loss that may be attributed to the magni-tude of a government’s investment in a single issuer. The NRS 355.140, 355.060, and the State Treasurer’s investment policy limit the investing in any one issuer to 5% of the total par value of the portfolio, with the exception of the Hous-ing Division and the Investment Trust Funds. At June 30, 2010, the following investments exceeded 5% of the Primary Government and Investment Trust Funds’ total investments (expressed in thousands):
At June 30, 2010, the following investments exceeded 5% of the Higher Education Tuition Trust’s total investments (expressed in thousands):
AAA AA A BBB BB B CCC CC UnratedNegotiable certificate of deposit -$ -$ 14,999$ -$ -$ -$ -$ -$ -$ U.S. agencies 859,007 - 1,334,764 - - - - - - Mutual funds 6,618 - - - - - - - 5,885,662 Asset backed corporate securities 98,977 3,700 23,600 800 - 4,100 500 - - Corporate bonds and notes 54,789 194,894 710,067 525,400 20,000 1,200 - - 12,400 Commerical paper - - 44,999 - - - - - - Fixed income securities - - - - - - - - 23,679 International investments 447,158 601,255 181,336 43,800 9,451 - - - 78,922 Municipal bonds - 558,405 - - - - - - - Investment agreements 847 5,701 30,433 - 756 - - - 291 Other short-term investments 132,442 - - - - - - - 507,575 Collateralized mortgage obligations 176,797 16,900 29,900 20,800 1,800 8,100 23,500 4,200 26,000 Total 1,776,635$ 1,380,855$ 2,370,098$ 590,800$ 32,007$ 13,400$ 24,000$ 4,200$ 6,534,529$
Quality Rating
Fair Value UnratedMutual funds publicly traded 204,983$ 204,983$ Partnerships 186,154 186,154 Equities 6,191 6,191 Endowment cash/cash equivalents 1,406 1,406 Trust(s) 5,264 5,264 Private commingled funds 133,013 133,013 Total 537,011$ 537,011$
Fair Value PercentagePrimary government
Federal Farm Credit Bank 218,637$ 7.42%Federal Home Loan Bank 433,130 14.71%Federal National Mortgage Assoc 356,168 12.09%Federal Home Loan Mortgage Corp. 340,597 11.57%So Nevada Water Authority 234,840 7.97%
Investment Trust FundsFederal National Mortgage Assoc 224,280 23.11%Federal Home Loan Bank 205,142 21.14%Federal Home Loan Mortgage Corp. 219,984 22.67%
Fair Value PercentageFederal Home Loan Mortgage Corporation 7,087$ 6.66%Federal National Mortgage Association 11,859 11.15%

57
Notes to Financial StatementsFor the Fiscal Year Ended June 30, 2010
NEVADA(Note 3 Continued)
The Housing Division currently places no limit on the amount it may invest in any one issuer provided their ratings are in the highest two general rating categories. However, the Divi-sion monitors rating changes on all issuers. If warranted, more concentrated investments may have to be diluted to alterna-tive providers. As of June 30, 2010, the Housing Division’s investments in Fannie Mae and Ginnie Mae are 16.24% and 30.24% respectively, of Housing Division’s total investments. The Fannie Mae and Ginnie Mae investments are in mortgage backed securities matched to the interest rate and maturity of the underlying bonds. Because such investments are matched to concomitant liabilities, the Division is less concerned about a concentration risk on these investments.
ForeignCurrencyRisk: Foreign currency risk is the risk that changes in exchange rates will adversely affect the fair value of an investment or deposit.
Primary Government, Pension and Other Employee Benefit Trust Funds, and Investment Trust Funds - the primary govern-ment does not have a policy regarding foreign currency risk; however, the State Treasurer’s office does not have any depos-its or investments in foreign currency. The Public Employees’ Retirement System of Nevada, the Legislators’ Retirement System of Nevada, the Judicial Retirement System of Nevada, and the Retirement Benefits Investment Fund do have foreign currency policies for deposit and investments, which may be used for portfolio diversification and hedging. Highly specu-lative positions in currency are not permitted. The follow-ing table summarizes the pension and other employee benefit trust funds and investment trust funds’ exposure to foreign currency risk in U.S. dollars as of June 30, 2010 (expressed in thousands):
Fixed Income Equity Derivatives Cash TotalAustralian Dollar 9,525$ 269,100$ -$ 2,210$ 280,835$ British Pound Sterling 86,076 689,000 1,400 4,121 780,597Canadian Dollar 32,409 - - 2,810 35,219Danish Krone 10,229 33,500 1,600 905 46,234Euro 502,212 980,500 (13,000) 2,513 1,472,225Hong Kong Dollar - 84,600 - 500 85,100Israeli Shekel - 28,000 - 100 28,100Japanese Yen 517,062 771,300 (6,200) 10,121 1,292,283Malaysian Ringgit 2,822 - - 302 3,124New Zealand Dollar - 3,300 - 100 3,400Norwegian Krone 3,308 23,900 - 201 27,409Polish Zloty 9,528 - - 4 9,532Singapore Dollar 3,911 55,900 - 905 60,716Swedish Krona 7,421 98,000 - 303 105,724Swiss Franc 3,418 265,600 - 405 269,423Total 1,187,921$ 3,302,700$ (16,200)$ 25,500$ 4,499,921$
Currency by Investment and Fair Value
Component Unit - the Nevada System of Higher Education does not directly invest in foreign currency investments and is therefore not subject to foreign currency risk. However, it has $71,151,000 in mutual funds in both the operating and endowment pools that are primarily invested in international equities at June 30, 2010.
C. SecuritiesLendingPrimary Government and Investment Trust Funds - NRS 355.135 authorizes the State Treasurer to lend securities from the investment portfolio of the State if collateral received from the borrower is at least 102% of market value of the underlying securities and the value of the securities borrowed is determined on a daily basis.
There were no securities on loan at June 30, 2010 (excluding PERS).
Public Employees’ Retirement System (PERS) – The system also maintains a securities lending program under the author-ity of the “prudent person” standard of NRS 286.682. Securi-ties loaned under this program consist of U.S. Treasury Obli-gations, corporate fixed income securities, international fixed income securities, equity securities, and international equity securities. Collateral received consists of cash and securities issued by the U.S. Government, its agencies or instrumen-talities. Collateral received for the lending of U.S. securities must equal at least 102% of market value, plus accrued inter-est in the case of fixed income securities. Collateral received for the lending of international securities must equal at least 105% of market value, plus accrued interest in the case of fixed income securities.

58
Notes to Financial StatementsFor the Fiscal Year Ended June 30, 2010
NEVADA(Note 3 Continued)
At year-end, PERS has no credit risk exposure to borrowers because the amount PERS owes to borrowers exceeds the amounts the borrowers owe to PERS. PERS has no discre-tionary authority to sell or pledge collateral received or secu-rities loaned. The contract with the securities lending agent requires the agent to indemnify PERS for all losses relating to securities lending transactions. There were no losses resulting from borrower default during the period nor were there any recoveries of prior period losses.
PERS may only loan up to 33 1/3% of its total portfolio. Either PERS or the borrower can terminate all securities loans on demand. The securities lending agent is authorized to invest collateral only in high quality, short-term investment vehicles in accordance with PERS’ Investment Objectives and Poli-cies. The maturities of the investments made with cash collat-eral generally match the maturities of the securities loaned.
The fair value of underlying securities on loan at June 30, 2010 is $2,890,340,441. Cash collateral received in securities lending arrangements is reported on the Statement of Fidu-ciary Net Assets as an asset with a related liability. At June 30, 2010, PERS has collateral consisting of cash and securi-ties issued by the U.S. Government, its agencies or instrumen-talities, in excess of the market value of investments held by brokers/dealers under a securities lending agreement.
D. DerivativesPrimary Government and Investment Trust Funds - There was no exposure to derivatives as of June 30, 2010.
Public Employees’ Retirement System (PERS) - Foreign exchange forward contracts are periodically employed by PERS to hedge currency risk of investments in foreign curren-cies. No other derivatives are permitted within the PERS port-folio. Generally, derivatives are subject both to market risk and to counterparty risk. The derivatives utilized by PERS typical-ly have no greater market risk than their physical counterparts and, in many cases, are offset by exposures elsewhere in the portfolio. Counterparty risk, the risk that the “other party” to a contract will default, is managed by careful screening of coun-terparties. Derivative securities are priced and accounted for at fair value. Foreign exchange forward contracts are valued at the price at which the transaction could be settled by offsets in the forward markets. PERS derivative transactions for fiscal year 2010 are summarized in the following table (expressed in thousands):
PurchasesRealized
Gain / Loss SellsRealized
Gain / Loss
Total Realized
Gain / LossAustralian Dollar 57,206$ 473$ (39,822)$ 150$ 623$ British Pound Sterling 155,464 574 (122,798) (28) 546Canadian Dollar 14,330 (11) (2,456) 94 83Danish Krone 17,016 (16) (11,870) 27 11Euro 454,601 709 (347,724) (481) 228Hong Kong Dollar 13,511 18 (16,627) (9) 9Israeli Shekel 29,403 (123) - - (123)Japanese Yen 267,825 (19) (109,972) (768) (787)Malaysian Ringgit 496 3 - - 3New Zealand Dollar 932 (9) (556) 8 (1)Norwegian Krone 13,385 (1) (13,161) (56) (57)Polish Zloty 3,845 10 (1,015) 24 34Singapore Dollar 16,208 (17) (11,546) 37 20Swedish Krona 28,694 (116) (23,604) (8) (124)Swiss Franc 51,229 (43) (47,597) (7) (50)Total 1,124,145$ 1,432$ (748,748)$ (1,017)$ 415$
Foreign Exchange Contracts

59
Notes to Financial StatementsFor the Fiscal Year Ended June 30, 2010
NEVADA(Note 3 Continued)
The PERS derivative pending transactions as of June 30, 2010, are summarized in the following table (expressed in thousands):
Management believes that it is unlikely that any of the derivatives in the PERS portfolio could have a material adverse effect on their financial condition. In addition, the credit, market, or legal risks are not above and beyond those risks apparent by the nature of the type of investment for any of the securities contained within the portfolio.
Legislators’ Retirement System (LRS) and Judicial Retirement System (JRS) - foreign exchange forward contracts are periodi-cally employed by LRS and JRS to hedge currency risk of investments in foreign currencies. There was no exposure to deriva-tives as of June 30, 2010.
PurchasesUnrealized Gain / Loss Sells
Realized Gain / Loss
Total Unrealized Gain / Loss
British Pound Sterling 1,384$ -$ -$ -$ -$ Danish Krone 1,588 - - - -Euro 8,620 (137) (21,640) 760 623Japanese Yen - - (6,223) (300) (300)Total 11,592$ (137)$ (27,863)$ 460$ 323$
Foreign Exchange Contracts
Governmental Nevada System ofFunds Higher Education
As shown on financial statements:Intergovernmental receivables 443,355$ 39,397$ Notes/loans receivable 410 12,359 Due from Component Unit 6,401 -
Total 450,166$ 51,756$
Classified:Current portion 310,360$ 41,110$ Noncurrent portion:
Intergovernmental receivables 134,057 - Notes/loans receivable 389 10,646 Due from Component Unit 5,360 - Total noncurrent portion 139,806 10,646 Total 450,166$ 51,756$
Note 4 - Receivables
Receivable balances are disaggregated by type and presented separately in the financial statements. Significant receivable balances not expected to be collected within one year and not already classified in the fund financials are presented below (expressed in thousands):
Not included in the receivable balances are amounts considered to be uncollectible. In the governmental funds, uncollectible taxes receivable are estimated at $50 million, and uncollectible accounts receivable are estimated at $71.6 million. The propri-etary funds have $31.5 million in uncollectible accounts receivable of which $13.7 million are from uninsured employer’s fines and penalties, and $16.8 million are from unemployment contributions and benefit overpayments.

60
NEVADA
Notes to Financial StatementsFor the Fiscal Year Ended June 30, 2010
Note 5 - Interfund Transactions
ConsolidatedBond Interest
General and Redemption TotalAdvances ToNonmajor enterprise 5,351$ -$ 5,351$ Internal service 1,974 1,506 3,480
Total other funds 7,325$ 1,506$ 8,831$
Major FundsAdvances From
A. InterfundAdvancesA summary of interfund advances at June 30, 2010, follows (expressed in thousands):
Interfund advances are the portions of interfund balances that are not expected to be repaid within one year. The interfund balances that are expected to be repaid within one year are shown in the Due From/Due To summary below.
Advances are generally made to finance capital expenditures or as a loan for operating purposes.
Cons BondState Municipal Interest and Nonmajor Total
General Highway Bond Bank Redemption Governmental GovernmentalDue FromMajor Governmental Funds:
General -$ 2,824$ 4$ 260$ 60,152$ 63,240$ State Highway 999 - - - 258 1,257 Municipal Bond Bank 9 - - 409 - 418 Consolidated Bond Interest and Redemption 14 - - - 5,083 5,097
Nonmajor governmental 39,056 28 - 3,933 340 43,357 Total Governmental 40,078 2,852 4 4,602 65,833 113,369 Major Enterprise Funds:
Housing Division - - - - - - Unemployment Comp - - - - 217 217 Water Projects Loans 369 - - - - 369
Nonmajor enterprise 1,312 5 - - 3 1,320 Total Enterprise 1,681 5 - - 220 1,906 Internal Service 1,064 137 - 151 26 1,378 Total other funds 42,823$ 2,994$ 4$ 4,753$ 66,079$ 116,653$ Fiduciary 110$ -$ -$ -$ 423$ 533$ Component Units:
Nevada System of Higher Education 540$ -$ -$ 5,775$ 86$ 6,401$ Colorado River Commission - - - - - -
Total Component Units 540$ -$ -$ 5,775$ 86$ 6,401$
Due ToMajor Governmental Funds
B. DueFrom/DueToOtherFundsandComponentUnitsA summary of due from and due to other funds and component units at June 30, 2010, is shown below (expressed in thousands):

61
Notes to Financial StatementsFor the Fiscal Year Ended June 30, 2010
NEVADA(Note 5 Continued)
Housing Water Projects Nonmajor Total Internal TotalDivision Loans Enterprise Enterprise Service Other Funds Fiduciary
Due FromMajor Governmental Funds:
General 31$ 251$ 827$ 1,109$ 4,921$ 69,270$ 369,581$ State Highway - - 23 23 913 2,193 733 Municipal Bond Bank - - - - - 418 - Consolidated Bond Interest and Redemption - - - - - 5,097 -
Nonmajor governmental - - 1 1 183 43,541 129 Total Governmental 31 251 851 1,133 6,017 120,519 370,443 Major Enterprise Funds:
Housing Division - - - - 4 4 - Unemployment Comp - - - - - 217 - Water Projects Loans - - - - - 369 83
Nonmajor enterprise - - 4 4 89 1,413 90 Total Enterprise - - 4 4 93 2,003 173
Internal Service - - 3 3 250 1,631 15 Total other funds 31$ 251$ 858$ 1,140$ 6,360$ 124,153$ 370,631$
Fiduciary -$ -$ 7$ 7$ 2,724$ 3,264$ 29,172$ Component Units:
Nevada System of Higher Education -$ -$ 1$ 1$ 2,103$ 8,505$ 1,312$ Colorado River Commission - - - - 3 3 -
Total Component Units -$ -$ 1$ 1$ 2,106$ 8,508$ 1,312$
Due ToMajor Enterprise Funds
Nevada System of Colorado River Total ComponentHigher Education Commission Units
Due FromPrimary Government:
Governmental Activities for long term receivable 31,808$ -$ 31,808$ Major Governmental Funds:
General 9,457 30 9,487 State Highway 209 - 209
Nonmajor governmental 58,810 - 58,810 Total Governmental Funds 68,476 30 68,506 Nonmajor enterprise 30 - 30 Internal Service 19 1 20 Total 100,333$ 31$ 100,364$
Due ToComponent Units
The balances result primarily from timing differences between the date goods and services are provided or reimbursable expenses occur, and the date the transactions are recorded in the accounting system and payment is made. An exception is the long term receivable due to the Nevada System of Higher Education (NSHE) from the Primary Government in the amount of $31,808,146. This represents the remaining amount of State of Nevada general obligation bonds that may be issued, as autho-rized during the 2009 Legislative Session, for NSHE capital improvements.
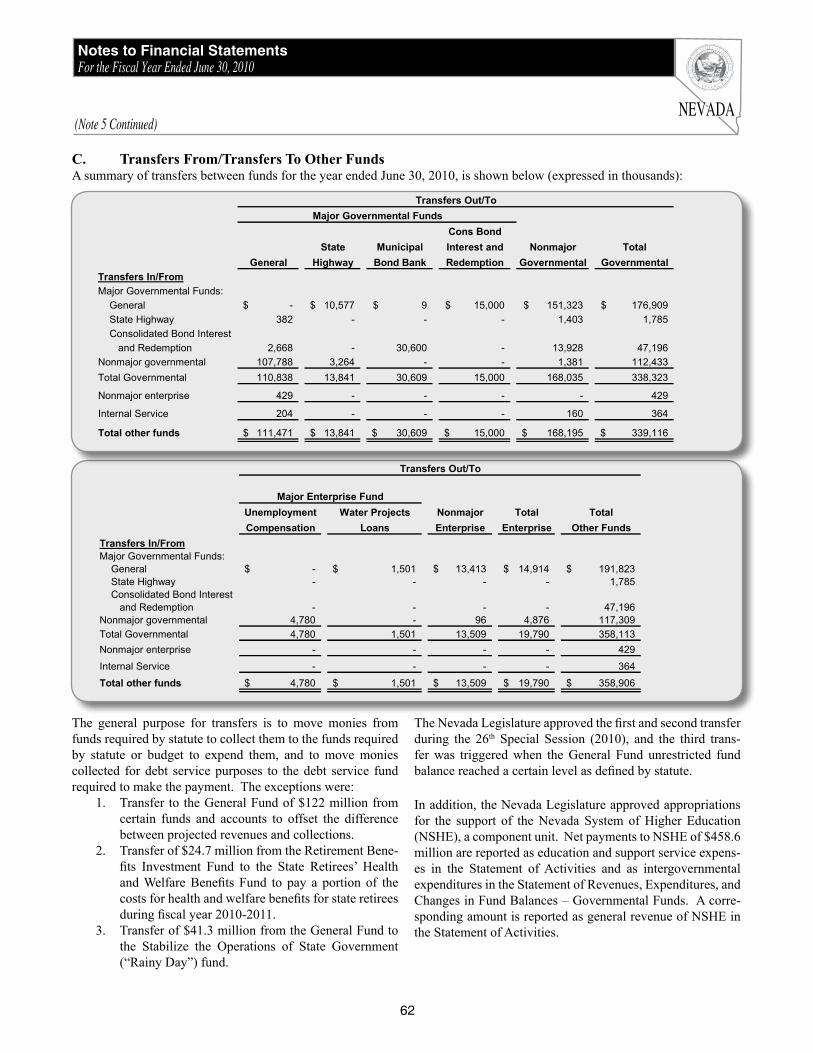
62
Notes to Financial StatementsFor the Fiscal Year Ended June 30, 2010
NEVADA(Note 5 Continued)
Cons BondState Municipal Interest and Nonmajor Total
General Highway Bond Bank Redemption Governmental GovernmentalTransfers In/FromMajor Governmental Funds:
General -$ 10,577$ 9$ 15,000$ 151,323$ 176,909$ State Highway 382 - - - 1,403 1,785 Consolidated Bond Interest and Redemption 2,668 - 30,600 - 13,928 47,196
Nonmajor governmental 107,788 3,264 - - 1,381 112,433 Total Governmental 110,838 13,841 30,609 15,000 168,035 338,323
Nonmajor enterprise 429 - - - - 429
Internal Service 204 - - - 160 364
Total other funds 111,471$ 13,841$ 30,609$ 15,000$ 168,195$ 339,116$
Major Governmental FundsTransfers Out/To
Unemployment Water Projects Nonmajor Total TotalCompensation Loans Enterprise Enterprise Other Funds
Transfers In/FromMajor Governmental Funds:
General -$ 1,501$ 13,413$ 14,914$ 191,823$ State Highway - - - - 1,785 Consolidated Bond Interest and Redemption - - - - 47,196
Nonmajor governmental 4,780 - 96 4,876 117,309 Total Governmental 4,780 1,501 13,509 19,790 358,113 Nonmajor enterprise - - - - 429
Internal Service - - - - 364
Total other funds 4,780$ 1,501$ 13,509$ 19,790$ 358,906$
Transfers Out/To
Major Enterprise Fund
C. TransfersFrom/TransfersToOtherFundsA summary of transfers between funds for the year ended June 30, 2010, is shown below (expressed in thousands):
The general purpose for transfers is to move monies from funds required by statute to collect them to the funds required by statute or budget to expend them, and to move monies collected for debt service purposes to the debt service fund required to make the payment. The exceptions were:
1. Transfer to the General Fund of $122 million from certain funds and accounts to offset the difference between projected revenues and collections.
2. Transfer of $24.7 million from the Retirement Bene-fits Investment Fund to the State Retirees’ Health and Welfare Benefits Fund to pay a portion of the costs for health and welfare benefits for state retirees during fiscal year 2010-2011.
3. Transfer of $41.3 million from the General Fund to the Stabilize the Operations of State Government (“Rainy Day”) fund.
The Nevada Legislature approved the first and second transfer during the 26th Special Session (2010), and the third trans-fer was triggered when the General Fund unrestricted fund balance reached a certain level as defined by statute.
In addition, the Nevada Legislature approved appropriations for the support of the Nevada System of Higher Education (NSHE), a component unit. Net payments to NSHE of $458.6 million are reported as education and support service expens-es in the Statement of Activities and as intergovernmental expenditures in the Statement of Revenues, Expenditures, and Changes in Fund Balances – Governmental Funds. A corre-sponding amount is reported as general revenue of NSHE in the Statement of Activities.

63
NEVADA
Notes to Financial StatementsFor the Fiscal Year Ended June 30, 2010
Business-Type Activities
Total Primary Government
Component Units
Restricted:Cash -$ -$ 19,666$ Investments 145,793 145,793 - Total 145,793$ 145,793$ 19,666$
Restricted for:Debt service 145,793$ 145,793$ 3,185$ Construction - - 10,203Other purposes - - 6,278 Total 145,793$ 145,793$ 19,666$
Various debt service, operation and mainte-nance, capital improvement and construction (acquisition) funding requirements of bond covenants, and trust indentures are recorded as restricted assets on the Statement of Net Assets. The components of restricted assets at June 30, 2010 are as follows (expressed in thousands):
Note 7- Capital Assets
Beginning EndingBalance Increases Decreases Balance
Governmental activities:Capital assets, not being depreciated
Land 137,100$ 1,236$ -$ 138,336$ Construction in progress 269,147 94,627 (185,764) 178,010 Infrastructure 3,125,559 38,939 - 3,164,498 Rights-of-way 522,486 70,480 (124) 592,842
Total capital assets, not being depreciated 4,054,292 205,282 (185,888) 4,073,686 Capital assets, being depreciated/amortized
Buildings 1,325,368 176,409 (2,313) 1,499,464 Improvements other than buildings 113,618 826 - 114,444 Furniture and equipment 375,128 14,345 (18,560) 370,913 Software costs 151,563 750 (455) 151,858
Total capital assets, being depreciated/amortized 1,965,677 192,330 (21,328) 2,136,679
Less accumulated depreciation/amortization for:Buildings (366,104) (33,254) 1,687 (397,671) Improvements other than buildings (59,536) (4,800) - (64,336) Furniture and equipment (264,020) (30,633) 16,837 (277,816) Software costs (132,201) (8,637) 453 (140,385)
Total accumulated depreciation/amortization (821,861) (77,324) 18,977 (880,208)
Total capital assets, being depreciated/amortized, net 1,143,816 115,006 (2,351) 1,256,471 Governmental activities capital assets, net 5,198,108$ 320,288$ (188,239)$ 5,330,157$
Business-type activities:Capital assets, not being depreciated
Land 568$ -$ -$ 568$ Construction in progress 7,687 1,202 (413) 8,476
Total capital assets, not being depreciated 8,255 1,202 (413) 9,044
Capital assets, being depreciatedBuildings 3,389 - - 3,389 Improvements other than buildings 631 - - 631 Furniture and equipment 5,403 306 (106) 5,603
Total capital assets, being depreciated 9,423 306 (106) 9,623
Less accumulated depreciation for:Buildings (2,312) (103) - (2,415) Improvements other than buildings (551) (9) - (560) Furniture and equipment (4,455) (349) 98 (4,706)
Total accumulated depreciation (7,318) (461) 98 (7,681) Total capital assets, being depreciated, net 2,105 (155) (8) 1,942
Business-type activities capital assets, net 10,360$ 1,047$ (421)$ 10,986$
Capital asset activity of the primary government for the year ended June 30, 2010, was as follows (expressed in thousands):
Note 6 - Restricted Assets

64
Notes to Financial StatementsFor the Fiscal Year Ended June 30, 2010
NEVADA
Current period depreciation and amortization expense was charged to functions of the primary government as follows (expressed in thousands):
Capital asset activity of the Nevada System of Higher Education for the year ended June 30, 2010, was as follows (expressed in thousands):
Governmental activities:General government 7,174$ Education, support services 2,169Health, social services 10,759Law, justice, public safety 28,164Recreation, resource development 6,545Transportation 13,244Regulation of business 1,371Unallocated 1,448Depreciation and amortization on capital assets held by the State's internal service funds is charged to the various functions based on their use of the assets 6,450 Total depreciation/amortization expense - governmental activities 77,324$
Business-type activities:Enterprise 461$ Total depreciation expense - business-type activities 461$
Beginning EndingBalance Increases Decreases Balance
Nevada System of Higher Education:Capital assets, not being depreciated
Construction in progress 126,858$ 13,408$ (95,940)$ 44,326$ Land 81,821 - (261) 81,560 Intangibles - 808 - 808 Collections 9,697 76,286 (14) 85,969
Total capital assets, not being depreciated 218,376 90,502 (96,215) 212,663 Capital assets, being depreciated
Buildings 2,049,840 106,566 (1,339) 2,155,067 Land and improvements 100,648 4,972 (1,163) 104,457 Machinery and equipment 301,212 30,843 (18,370) 313,685 Intangibles - 6,702 - 6,702 Library books and media 113,118 7,753 (677) 120,194
Total capital assets, being depreciated 2,564,818 156,836 (21,549) 2,700,105 Less accumulated depreciation for:
Buildings (494,231) (51,428) 100 (545,559) Land and improvements (75,180) (3,754) 939 (77,995) Machinery and equipment (199,270) (27,254) 15,959 (210,565) Intangibles - (1,369) - (1,369) Library books and media (99,101) (8,854) 667 (107,288)
Total accumulated depreciation (867,782) (92,659) 17,665 (942,776) Total capital assets, being depreciated, net 1,697,036 64,177 (3,884) 1,757,329
Nevada System of Higher Education activity capital assets, net 1,915,412$ 154,679$ (100,099)$ 1,969,992$
(Note 7 Continued)

65
NEVADA
Notes to Financial StatementsFor the Fiscal Year Ended June 30, 2010
A. ChangesinLong-TermLiabilitiesThe following is a summary of changes in long-term obligations of the primary government for the fiscal year ended June 30, 2010 (expressed in thousands):
Beginning Ending Due WithinBalance Additions Reductions Balance One Year
Governmental activities:Bonds payable:
General obligation bonds 2,079,805$ 142,990$ (155,180)$ 2,067,615$ 131,790$ Special obligation bonds 722,880 - (54,040) 668,840 56,795
Subtotal 2,802,685 142,990 (209,220) 2,736,455 188,585 Issuance premiums on bonds 109,407 3,928 (10,065) 103,270 10,132
Total bonds payable 2,912,092 146,918 (219,285) 2,839,725 198,717
Certificates of participation 58,030 7,900 (9,850) 56,080 605 Issuance premiums on certificates of participation - 743 (53) 690 98
Total certificates of participation 58,030 8,643 (9,903) 56,770 703 Other Governmental long-term activities:
Obligations under capital leases 17,916 18,209 (2,279) 33,846 3,232 Compensated absences obligations 102,546 75,476 (74,449) 103,573 70,325 Arbitrage rebate liability 575 2,643 - 3,218 195
Total other governmental long term activities 121,037 96,328 (76,728) 140,637 73,752 Governmental activities long-term obligations 3,091,159$ 251,889$ (305,916)$ 3,037,132$ 273,172$
Business-type activities:Bonds payable
General obligation bonds 113,055$ -$ (7,995)$ 105,060$ 8,255$ Special obligation bonds 911,783 149,340 (67,079) 994,044 14,251
Subtotal 1,024,838 149,340 (75,074) 1,099,104 22,506 Issuance premiums 1,987 151 (167) 1,971 165
Total bonds payable 1,026,825 149,491 (75,241) 1,101,075 22,671 Compensated absences obligations 1,792 1,464 (1,361) 1,895 1,197 Federal unemployment advance - 438,325 - 438,325 - Tuition benefits payable 124,931 11,225 (4,651) 131,505 10,000 Arbitrage rebate liability 72 10 (18) 64 -
Business-type activities long-term obligations 1,153,620$ 600,515$ (81,271)$ 1,672,864$ 33,868$
Note 8 - Long-Term Obligations
The General Fund, special revenue funds and internal service funds in which the leases are recorded typically liquidate the capital lease obligations. The compensated absence obliga-tions are typically liquidated by the funds incurring the relat-ed salaries and wages costs. The debt service funds typically liquidate the arbitrage obligations.
B. BondsPayableThe State issues general obligation bonds for the acquisition, construction and improvement of major capital facilities; buying local governments’ bonds in the municipal bond bank fund; protection of natural resources; cultural affairs projects; the construction, reconstruction, improvement and mainte-nance of highways; and for refunding purposes. General obli-gation bonds are direct obligations and pledge the full faith and credit of the State.
Special obligation highway improvement revenue bonds provide funds for property acquisition and construction of highway projects. Special obligation housing bonds in the aggregate have a debt limit of $5,000,000,000 and are used for housing loans or to purchase mortgage loans having both fixed and variable interest rates. Special obligation bonds are payable solely from gross pledged revenues and are not gener-al obligations of the State.
General obligation bonds and special obligation bonds of the primary government outstanding at June 30, 2010 are comprised of the following (expressed in thousands):

66
Notes to Financial StatementsFor the Fiscal Year Ended June 30, 2010
NEVADA
Interest Original PrincipalRates Amount Outstanding
Governmental activities:General obligation bonds:
Subject to Constitutional Debt Limitation 2.0-7.0% 1,690,580$ 1,375,790$ Exempt from Constitutional Debt Limitation 1.6-7.0% 1,428,415 691,825
Special obligation bonds:Exempt from Constitutional Debt Limitation- Highway Improvement Revenue Bonds 3.5-6.0% 963,925 668,840 Subtotal 4,082,920 2,736,455
Issuance premiums 153,950 103,270 Governmental activities bonds payable 4,236,870 2,839,725
Business-type activities:General obligation bonds:
Exempt from Constitutional Debt Limitation 2.0-6.5% 144,180 105,060 Special obligation bonds:
Housing Bonds *.8-8.02% 1,612,470 994,044 Subtotal 1,756,650 1,099,104
Issuance premiums 3,081 1,971 Business-type activities bonds payable 1,759,731 1,101,075
Total bonds payable 5,996,601$ 3,940,800$
*Many Housing bonds have variable rates of interest. The tax exempt bonds track the SIFMA Indexwhile the federally taxable debt tracks the one-month LIBOR Index.
Year EndingJune 30 Principal Interest Principal Interest
2011 188,585$ 131,628$ 22,506$ 34,305$ 2012 162,180 122,418 19,847 33,175 2013 179,640 114,270 20,846 32,273 2014 187,515 105,350 21,910 31,307 2015 172,130 96,404 22,338 30,264
2016-2020 834,420 357,660 139,579 133,816 2021-2025 695,100 169,819 155,675 95,949 2026-2030 312,405 23,464 152,083 60,849 2031-2035 3,640 774 204,518 29,716 2036-2040 840 42 162,982 9,325 2041-2045 - - 150,010 1,500 2046-2050 - - 2,310 198 2051-2055 - - 24,500 -
Total 2,736,455$ 1,121,829$ 1,099,104$ 492,677$
Governmental Activities Business-Type Activities
Debt service requirements (principal and interest) for all long-term bonds and notes outstanding at June 30, 2010, of the primary government are summarized in the table following (expressed in thousands):
C. ConstitutionalDebtLimitationsSection 3, Article 9, of the State Constitution (as amended) limits the aggregate principal amount of the State’s public debt to two percent (2%) of the assessed valuation of the State. Exempt from this limitation are debts authorized by the Legislature that are incurred for the protection and preservation of, or for obtaining the benefits of, any property or natural resources within the State. At June 30, 2010, the debt limitation and its unused portion are computed as follows (expressed in thousands):
(Note 8 Continued)

67
Notes to Financial StatementsFor the Fiscal Year Ended June 30, 2010
NEVADA(Note 8 Continued)
D. NevadaMunicipalBondBankGeneral obligation bonds have been issued through the Nevada Municipal Bond Bank, a special revenue fund, as authorized by NRS 350A. These bonds are subject to statutory limitation of $1.8 billion and are exempt from the Constitutional Debt Limitation. Proceeds from the bonds are used to purchase validly issued general obligation bonds of the State’s local governments to finance projects related to natural resources. The State anticipates that the debt service revenue it receives from the participating local governments will be sufficient to pay the debt service requirements of the State bonds as they become due. Twenty-two projects were funded through the Nevada Municipal Bond Bank as of June 30, 2010, and total investments in local governments amounted to $311,565,000.
E. RefundedDebtandRedemptionsOn November 17, 2009 the State issued General Obliga-tion (Limited Tax) Capital Improvement, Cultural Affairs and Refunding Bonds Series 2009B and General Obligation (Limited Tax) Natural Resources and Refunding Bonds Series 2009C. Series 2009B was issued to refund $25,365,000 of General Obligation (Limited Tax) Refunding Bonds Series 1999A and $905,000 General Obligation (Limited Tax) Cultural Affairs Bonds, Series 1998C. Series 2009C was issued to refund $1,400,000 of General Obligation (Limited Tax) Refunding Bonds, Series 1999B.
On December 10, 2009 the Nevada Real Property Corpora-tion issued $7,900,000 State of Nevada General Obligation (Limited Tax) Certificates to prepay all of the 1999 Nevada Real Property Corporation Certificates balance of $8,480,000.
On June 24, 2010 the State issued General Obligation (Limit-ed Tax) (Revenue Supported) Water Refunding Bonds Series 2010B to refund the following General Obligation (Limited Tax) (Revenue Supported) Water Refunding Bonds Series: $2,210,000 Series 1997B, $455,000 Series 2003C, $4,495,000 Series 2006D.
The reacquisition price exceeded the carrying amount of the old debt by $828,474. This amount is being reported as a deferred charge and amortized over the remaining life of the refunded debt, which is shorter than the life of the new debt. The refunding increased the aggregate debt service payments by $440,648; however the State completed the refunding to obtain an economic gain or present value gain of $2,002,908.In current and prior years, the State defeased certain general obligations and other bonds by placing the proceeds of new
bonds and other monies in an irrevocable trust to provide for all future debt service payments on the old bonds. Accord-ingly, the trust account assets and the liability for the defeased bonds are not included in the State’s financial statements. The total outstanding amount of defeased issues at June 30, 2010 is $31,564,310.
F. Amounts Available and Amounts to beProvidedforDebtServiceAt June 30, 2010, the amount available to service debt in the Consolidated Bond Interest and Redemption debt service fund is $158,514,123. At June 30, 2010, the amount available to service debt in the Highway Revenue Bonds debt service fund is $35,840,821. At June 30, 2010, the amount available to service the debt in the Municipal Bond Bank special revenue fund is $311,496,342.
The amount to be provided by other governments of $131,470,000 is due from the Southern Nevada Water Authority (SNWA). Until January 1, 1996 the Colorado River Commission (CRC), a component unit responsible for manag-ing Nevada’s interest in the water and power resources avail-able from the Colorado River, operated the Southern Nevada Water System (SNWS). In accordance with Chapter 393 of the 1995 Legislature, certain rights, powers, duties and liabili-ties of SNWS were transferred from the State and CRC to the SNWA effective January 1, 1996. These rights, powers, duties and liabilities included, but were not limited to, the State of Nevada general obligation bonds, the existing water user contracts, the Service Contract between CRC and the Las Vegas Valley Water District, and all other contracts related to the SNWS including contracts for capital improvement. Accordingly, the State records the general obligation bonds previously reported in CRC and an associated amount to be provided by other governments in the government-wide finan-cial statements.
G. BondIndentureProvisionsThere are restrictions and limitations contained in the various bond indentures. The State is in compliance with the require-ments of the bond covenants.
H. CapitalLeasesThe State has entered into various agreements for the lease of equipment and improvement of buildings. Assets of the primary government acquired under such leases at June 30, 2010, include equipment with a historical cost of $7,894,000 with accumulated depreciation of $6,223,000, building improvements of $11,149,000 with accumulated depreciation of $1,114,000, and construction in progress of $12,318,577.
For all capital leases of the primary government, the gross minimum lease payments and the present value of the net mini-mum lease payments as of June 30, 2010 follow (expressed in thousands):
Debt limitation (2% of total assessed valuation) 1,900,366$ Less : Bonds and leases payable as of June 30, 2010, subject to limitation (1,410,211)
Remaining debt capacity 490,155$

68
Notes to Financial StatementsFor the Fiscal Year Ended June 30, 2010
NEVADA(Note 8 Continued)
I. CertificatesofParticipationIn fiscal year 2010, the Nevada Real Property Corporation, a blended component unit, issued $7,900,000 of general obli-gation certificates of participation at 5.0-5.125% interest to prepay the remaining outstanding balance of the 1999 issue of the Nevada Real Property Corporation. The original 1999 issue of $15,000,000 was to finance the acquisition, construc-tion, installation and equipping of a secured juvenile treat-ment facility that is currently operating. The 2010 issue is a direct general obligation of the State to which the full faith and credit of the State is pledged. The State is required to make payments from general (ad valorem) taxes in the Consolidated Bond Interest and Redemption debt service fund that approxi-mate the interest and principal payments made by trustees to certificate holders.
In fiscal year 2004, the Nevada Real Property Corporation issued $21,550,000 of Lease Revenue Certificates of Participa-tion at 4.0-5.0% interest to finance the construction of an office building in Carson City. In fiscal year 2005, the Nevada Real Property Corporation issued $22,435,000 of Lease Revenue Certificates of Participation at 3.0-5.0% interest to finance the acquisition of a site for and the construction of a new correc-tional facility in Las Vegas. In fiscal year 2007, the Nevada Real Property Corporation issued $5,760,000 of Lease Reve-nue Certificates of Participation at 4.0-5.0% interest to finance the design and construction of a warehouse addition to the Legislative Counsel Bureau’s existing State Printing Office building in Carson City and resurfacing of the exterior of the existing building, together with related improvements on the premises. Under the lease revenue certificates of participa-tion financing arrangements, the certificates are not general obligations of the State and are not backed by the faith and credit or the taxing power of the State. The State’s obligation to pay base rent and make other payments to the trustee under the financing leases is subject to appropriation by the State. However, the payment of principal and interest on both issues of certificates is being guaranteed by an insurance policy.
The following schedule presents future certificates of partici-pation payments as of June 30, 2010 (expressed in thousands):
J. TuitionBenefitsPayableThe Higher Education Tuition Trust Fund, an enterprise fund, reports benefits payable as shown in Section A based upon the actuarial present value (APV) of the future tuition obligations and administrative expenses that will be paid in future years. The present value calculation includes the effects of project-ed tuition and fee increases and termination of contracts as follows:
The actuarial valuation used an investment yield assumption of 6.75% per year and tuition growth assumptions as follows:
K.ArbitrageRebateRequirementThe Tax Reform Act of 1986 imposes a rebate requirement with respect to some bonds issued by the State. Under this requirement, an amount equal to the sum of (a) the excess of the aggregate amount earned on all investments (other than certain specified exceptions) over the amount that would have been earned if all investments were invested at a rate equal to the yield on the bonds, and (b) any income earned on the excess described in (a) must be rebated to the United States Treasury, in order for the interest on the bonds to be excluded from gross income for federal income tax purposes. In accordance with the Internal Revenue Service Regulations, arbitrage rebate liability has been calculated as of June 30, 2010, and changes for the fiscal year then ended is presented in Section A of this note.L. ConduitDebtObligationsThe State has issued Industrial Revenue Bonds to provide financial assistance to private-sector entities for the acquisi-tion and construction of commercial facilities deemed to be in the public interest. The bonds are secured by the prop-erty financed and are payable solely from payments received
Year EndingJune 30 Principal Interest
2011 605$ 2,634$ 2012 1,660 2,563 2013 1,815 2,488 2014 1,975 2,406 2015 2,150 2,314
2016-2020 10,905 10,051 2021-2025 11,655 7,852 2026-2030 17,315 4,638 2031-2035 8,000 594
Total 56,080$ 35,540$
APV of the future tuition obligation $131,505,000Net assets available 121,796,839Net assets as a percentage of tuition benefits obligation 92.62%
Universities Community CollegesFall 2011 9.81% 9.92%Fall 2012 0.00% 0.00%Fall 2013 and later 6.00% 4.00%
Year Ending Governmental June 30 Activities
2011 4,703$ 2012 3,6582013 2,8882014 2,9302015 3,003
2016-2020 16,3842021-2025 12,2482026-2030 48
Total minimum lease payments 45,862Less: amount representing interest (12,016)Obligations under capital leases 33,846$

69
Notes to Financial StatementsFor the Fiscal Year Ended June 30, 2010
NEVADA(Note 8 Continued)
on the underlying mortgage loans. Upon repayment of the bonds, ownership of the acquired facilities transfers to the private-sector entity served by the bond issuance. The State is not obligated in any manner for the repayment of the bonds. Accordingly, the bonds are not reported as liabilities in the accompanying financial statements.
As of June 30, 2010, there are nineteen series of Industrial Revenue Bonds outstanding, with an aggregate principal amount payable of $1,023,805,032. Included in this amount is $693,861,665 payable from the Las Vegas Monorail Company that filed Chapter 11 bankruptcy protection on January 13, 2010 in order to restructure the company’s debt through this process.
M. PledgedRevenuePledged motor vehicle and special fuel tax - The State has pledged a portion of future motor vehicle fuel and special fuel tax revenues as well as federal aid for eligible projects to repay $668,840,000 in outstanding Highway Improve-ment Revenue Bonds that were issued from December 2000 through April 2008 for highway construction projects and property acquisition. Total principal and interest remain-ing on the bonds is $888,864,905 payable through Decem-ber 2025. Upon completion of eligible projects, federal aid of $237,552,243 is expected to be received in fiscal year 2011. For the current year, principal and interest paid was $87,915,760, and total motor vehicle fuel and special fuel tax revenues were $265,537,368.
Pledged Nevada Housing Division program funds - The single-family bonds are payable from, and secured by, a pledge of the proceeds derived from the sale of bonds; the rights and interest of the Housing Division in all mortgage loans purchased under the various bond certificates; reve-
nues which primarily include mortgage repayments and the net income, if any, derived as a result of foreclosure or other action taken in the event of a default on such a mortgage loan; curtailments, consisting generally of all amounts representing monthly principal payments with respect to mortgage loans which are received in advance of the scheduled amortization thereof; and all earnings realized by the investment of monies in all funds and accounts as well as all funds and accounts created by the various bond certificates.
The multi-unit bonds are payable from, and secured by, a pledge of the proceeds derived from the sale of bonds; all earnings realized from the investment of bond proceeds; after permanent financing, all revenues received from the develop-ment including housing assistance and rental payments made by tenants, notes receivable collateralized by deeds of trust and the rights to FHA insurance, draws on bank letters of credit, private mortgage and hazard insurance and condemna-tion proceeds.
Substantially all program fund assets are pledged in trust for the benefit of the bondholders.
N.InterestRateSwapAgreementsObjective - The Nevada Housing Division has entered into six pay-fixed, receive-variable interest rate swaps in order to provide lower cost fixed rate financing for its single-family loan production needs. The Nevada Housing Division policy requires hedging of all variable rate debt issuances through synthetic fixed rate structures.
Terms, Fair Values and Credit Ratings - The terms, fair values, and credit ratings of the outstanding swaps as of June 30, 2010 were as follows (expressed in thousands):
Associated Current Fixed Counter-Single-Family Notional Effective Rate Variable Rate Termination Party Fair
Bond Issue Amount Date Paid Received Date Rating Value
2006 Issue A 4,500$ 09/23/08 4.720% 68% of USD-LIBOR-BBA 04/01/37 Aaa (577)$
2006 Issue B 4,500 09/23/08 4.230% 68% of USD-LIBOR-BBA 10/01/41 Aaa (502)
2007 Issue A 4,500 09/23/08 4.246% 68% of USD-LIBOR-BBA 04/01/42 Aaa (547)
2007 Issue B 8,000 10/09/07 4.340% 68% of USD-LIBOR-BBA 04/01/42 Aaa (1,016)
2008 Issue A 14,700 04/03/08 3.736% 68% of USD-LIBOR-BBA 10/01/39 Aaa (1,330)
2008 Issue B 7,500 09/25/08 3.670% 68% of USD-LIBOR-BBA 04/01/39 Aaa (675)
Total Single-Family 43,700$ (4,647)$
The notional amounts of the swaps match the principal amounts of the associated debt. Except as discussed under rollover risk, the Housing Division’s swap agreements contain scheduled reductions to outstanding notional amounts that are expected to approximately follow scheduled or anticipated reductions in the associated “bonds payable” category.
Credit Risk – All of the Housing Division’s swaps rely upon the performance of the third parties who serve as swap counter-parties, and as a result the Housing Division is exposed to credit risk. Credit risk is the risk that a swap counterparty fails to

70
Notes to Financial StatementsFor the Fiscal Year Ended June 30, 2010
NEVADA
perform according to contractual obligations. The appropri-ate measurement of this risk at the reporting date is the fair value of the swaps as detailed above. To mitigate this credit risk, the Housing Division maintains strict credit standards for swap counterparties, and requires the counterparties to be rated in the AA or higher category by either Moody’s or Standard & Poor’s at the time the contract is entered into. The Housing Division has executed its swap transactions with two counterparties. The counterparties are rated Aaa/A1. The swap agreements contain a collateral agreement with the counterparty, and require full collateralization of the fair value of the swap should the counterparty’s credit rating fall below the requirement. Eligible collateral on the swaps can include cash or U.S. government securities held by a third-party custodian.
Basis Risk – The Housing Division is exposed to basis risk when the relationship between LIBOR and BMA converges, changing the synthetic rate on the bonds. When exposed to basis risk, the net interest expense incurred on the combina-tion of the swap agreement and the associated variable rate debt may be higher or lower than anticipated. As of June 30, 2010, the BMA rate was .25% and 68% of the LIBOR was .23694%.
Termination Risk – The Housing Division’s swap agreements do not contain any out-of-the-ordinary termination events that would expose it to significant termination risk. In keep-ing with market standards, the Housing Division or the coun-terparty may terminate each swap if the other party fails to perform under the terms of the contract. In addition, the swap documents allow either party to terminate in the event of a significant loss of creditworthiness. The Housing Division views the likelihood of such events to be remote at this time. If at the termination a swap has a negative value, the Housing Division would be liable to the counterparty for a payment equal to the fair value of such swap.
Rollover Risk – The Housing Division is exposed to rollover risk on swaps that mature or may be terminated at the counter-
party’s option prior to the maturity of the associated debt. As of June 30, 2010, the Division is not exposed to any rollover risk.
Swap Payments and Associated Debt - Using interest rates as of June 30, 2010, debt service requirements of the Hous-ing Division’s outstanding variable-rate debt and net swap payments are as follows (expressed in thousands):
As rates vary, variable-rate interest rate payments on the bonds and net sweep payments will change.
O.FederalUnemploymentAdvanceDuring fiscal year 2010, the Unemployment Compensation Trust Fund obtained repayable federal advances in the amount of $438,325,000 from the U.S. Department of Labor in accor-dance with provisions of Title XII, Section 1201 of the Social Security Act. No interest accrues on these federal advances until after December 31, 2010.
P.ComponentUnitObligationsNevada System of Higher Education (NSHE) – Bonds, notes, capital leases and compensated absences payable by NSHE at June 30, 2010, and the changes for the year then ended, consist of the following (expressed in thousands):
(Note 8 Continued)
Year Ending Swaps,June 30 Principal Interest Net Total
2011 -$ 109$ 1,662$ 1,771$ 2012 - 109 1,662 1,771 2013 - 109 1,662 1,771 2014 - 109 1,662 1,771 2015 - 109 1,662 1,771
2016-2020 - 546 8,310 8,856 2021-2025 - 546 8,310 8,856 2026-2030 2,490 538 8,185 11,213 2031-2035 13,580 436 6,723 20,739 2036-2040 24,280 160 2,302 26,742 2041-2045 3,350 4 58 3,412
Total 43,700$ 2,775$ 42,198$ 88,673$
Beginning Ending Due WithinBalance Additions Reductions Balance One Year
Bonds and notes payable 517,435$ 9,814$ (28,397)$ 498,852$ 19,578$ Issuance premiums 11,210 - (475) 10,735 474 Total bonds payable 528,645 9,814 (28,872) 509,587 20,052
Obligations under capital leases 8,702 1,537 (2,777) 7,462 2,077 Compensated absences obligations 43,072 30,290 (27,321) 46,041 30,897 Total 580,419$ 41,641$ (58,970)$ 563,090 53,026 Discretely presented component units of the NSHE: Capital leases 1,251 392 Compensated absences obligations 13 13 Long-term debt 271 86 Total 564,625$ 53,517$

71
Notes to Financial StatementsFor the Fiscal Year Ended June 30, 2010
NEVADA(Note 8 Continued)
Year Ending June 30 Principal Interest
2011 20,052$ 23,052$ 2012 19,517 22,292 2013 20,005 21,479 2014 21,241 20,606 2015 21,692 19,818
2016-2020 107,953 83,302 2021-2025 89,122 60,435 2026-2030 90,568 39,041 2031-2035 91,517 16,679 2036-2040 27,920 1,804
Total 509,587$ 308,508$
Year Ending June 30 Amount2011 2,410$ 2012 1,5552013 1,5282014 1,1942015 959
2016-2019 753Total minimum lease payments 8,399Less: amount representing interest (937)Obligations under capital leases 7,462$
Tuition and fees, auxiliary enterprises’ revenue and certain other revenue as defined in the bond indentures secure the revenue bonds.
The following table presents annual principal and interest payments for bonds and notes payable outstanding by NSHE at June 30, 2010 (expressed in thousands):
Future net minimum rental payments which are required under the capital leases by NSHE for the years ending June 30 are as follows (expressed in thousands):
Colorado River Commission (CRC) – Bonds and compensated absences payable by CRC at June 30, 2010, and the changes for the year then ended, consist of the following (expressed in thousands):
Beginning Ending Due WithinBalance Additions Reductions Balance One Year
Bonds payable:General obligation bonds 104,060$ -$ (5,490)$ 98,570$ 5,770$ Issuance premiums 2,904 - (247) 2,657 247 Issuance discounts (2) - 2 - - Unamortized refunding charges (4,796) - 348 (4,448) (348)
Total bonds payable 102,166 - (5,387) 96,779 5,669 Compensated absences obligations 273 164 (128) 309 218
Total 102,439$ 164$ (5,515)$ 97,088$ 5,887$
Scheduled maturities for bonds payable by CRC for the years ending June 30 are as follows (expressed in thousands):
Year Ending June 30 Principal Interest2011 5,770$ 4,792$ 2012 6,065 4,482 2013 6,400 4,156 2014 6,735 3,812 2015 7,100 3,450
2016-2020 31,225 11,598 2021-2025 19,140 6,188 2026-2030 16,135 1,430
Total 98,570$ 39,908$

72
NEVADA
Notes to Financial StatementsFor the Fiscal Year Ended June 30, 2010
Note 9 - Pensions and Other Employee Benefits
The Nevada Legislature created various plans to provide benefits to qualified employees and certain elected officials of the State as well as employees of other public employers. The Public Employees’ Retirement Board administers the Public Employees’ Retirement System of Nevada (PERS), the Legis-lators’ Retirement System of Nevada (LRS) and the Judicial Retirement System of Nevada (JRS). A summary description of the plans follows.
A. PERSPlan Description - All full-time State employees and full-time employees of participating local government entities in the State are members in the PERS, a defined benefit cost-sharing, multiple-employer public employees’ retirement system established in 1947 by the Nevada Legislature. PERS provides a reasonable base income to qualified employees who have been employed by a public employer and whose earning capacities have been removed or substantially impaired by age or disability. Any government employer in the State may elect to have its regular and police/fire employees covered by PERS. At June 30, 2010, there were 183 participating employers and other contributing entities.
PERS’ issues a stand-alone financial report that includes finan-cial statements and required supplementary information. The State reports PERS as a pension trust fund. PERS’ financial report may be obtained from the Public Employees’ Retirement System, 693 West Nye Lane, Carson City, Nevada 89703.
Benefits, as required by statute, are determined by the number of years of accredited service at the time of retirement and the member’s highest average compensation in any 36 consecu-tive months with special provisions for members entering the System on or after January 1, 2010. Benefit payments to which participants or their beneficiaries may be entitled under the plan include pension benefits, disability benefits and survivor benefits. Monthly benefit allowances for regular members are computed at 2.5% of average compensation for each accred-ited year of service prior to July 1, 2001. For service earned after July 1, 2001, this multiplier is 2.67% of average compen-sation. However, for members entering the System on or after January 1, 2010, there is only a 2.5% multiplier. PERS offers several alternatives to the unmodified service retirement allow-ance which, in general, allows the retired employee to accept a reduced service retirement allowance payable monthly during his or her lifetime and various optional monthly payments to a named beneficiary after his or her death.
Summary of Significant Accounting Policies – PERS uses the economic resources measurement focus and the accrual basis of accounting. Revenues are recorded in the accounting period in which they are earned and become measurable. Per statute, employee and employer contributions are recognized
in the reporting period for which they are due. Expenses are recorded when the corresponding liabilities are incurred, regardless of when payment is made. Benefits and refunds are recognized when due and payable in accordance with the terms of the plan. Unfunded portions of actuarially deter-mined liabilities for retirement benefits are not recorded in the financial statements.
Investments are reported at fair value. Securities traded on national or international exchanges are valued at the last reported sales price at current exchange rates. The fair value of real estate investments is based on estimated current values and Member Appraisal Institute independent appraisals. For private equity partnership investments, estimated fair value is determined in good faith by the general partner of the respec-tive investment partnership. In addition, each partnership undergoes an independent audit on an annual basis.
Contributions - The authority for establishing and amending the obligation to make contributions, and member contribu-tion rates, is provided by statute. New hires of the State of Nevada and public employers, who did not elect the employ-er-pay contribution plan prior to July 1, 1983, have the option of selecting either the employee/employer contribution plan or the employer-pay contribution plan. One plan provides for matching employee and employer contributions while the other plan provides for employer-pay contributions only.
Funding Policy - PERS’ basic funding policy provides for periodic contributions at a level pattern of cost as a percent-age of salary throughout an employee’s working lifetime in order to accumulate sufficient assets to pay benefits when due. Although PERS receives an actuarial valuation on an annual basis indicating the contribution rates required to fund PERS on an actuarial reserve basis, contributions actually made are in accordance with the required rates established by the Legis-lature. These statutory rates are increased or decreased pursu-ant to NRS 286.421 and 286.450.
Required contribution rates for employers and for active plan members, as a percentage of covered payroll, for the fiscal year ended June 30, 2010 were as follows:
The State’s contribution requirements for the current fiscal year and each of the two preceding years were (expressed in thousands):
Employer EmployeesRegular employees: Employer-pay plan 21.50% na Employee/employer plan (matching rate) 11.25% 11.25%Police and Fire employees: Employer-pay plan 37.00% na Employee/employer plan (matching rate) 19.00% 19.00%
Statutory Rate

73
Notes to Financial StatementsFor the Fiscal Year Ended June 30, 2010
NEVADA(Note 9 Continued)
B. LRSPlan Description - All State Legislators are members in the Legislators’ Retirement System (LRS), a defined benefit, single-employer public employees’ retirement system estab-lished in 1967 by the Nevada Legislature to provide a reason-able base income to Legislators at retirement. LRS is legislat-ed by and functions in accordance with State laws established by the Nevada Legislature. Benefits, as required by statute, are determined by the number of years of accredited service at the time of retirement. Service years include the entire elec-tion term whether or not the Legislature is in session. Benefit payments to which participants may be entitled under the plan include pension benefits and death benefits. Monthly benefit allowances are $25 for each year of service up to thirty years.
LRS issues a stand-alone financial report that includes finan-cial statements and required supplementary information. The State reports LRS as a pension trust fund. LRS financial report may be obtained from the Public Employees’ Retirement System, 693 West Nye Lane, Carson City, Nevada 89703.
Summary of Significant Accounting Policies – LRS uses the economic resources measurement focus and the accrual basis of accounting. Revenues are recorded in the account-ing period in which they are earned and become measurable.
Per statute employee and employer contributions are recog-nized in the reporting period for which they are due. Expenses are recorded when the corresponding liabilities are incurred, regardless of when payment is made. Benefits and refunds are recognized when due and payable in accordance with the terms of the plan. Unfunded portions of actuarially deter-mined liabilities for retirement benefits are not recorded in the financial statements.
Investments are reported at fair value. The fair values of investments in securities are generally based on published market prices and quotations from major investment firms. In general, fixed income securities are valued based on yield currently available on comparable securities of issuers with similar credit ratings.
Contributions - The Legislator contribution of 15% of compensation is paid by the Legislator only when the Legisla-ture is in session, as required by statute. The Legislature holds sessions every two years. Prior to 1985, the employee contri-butions were matched by the employer. The 1985 Legislators’ Retirement Act includes NRS 218C.390(2) which states, “The Director of the Legislative Counsel Bureau shall pay to the Board from the Legislative Fund an amount as the contribu-tion of the State of Nevada as employer which is actuarially determined to be sufficient to provide the System with enough money to pay all benefits for which the System will be liable.” The Legislature appropriated $401,732 for fiscal years 2009 and 2010, which is the required State contribution as deter-mined by the actuary. This amount was paid by the State of Nevada to the Legislative fund during fiscal 2009, of which $200,866 (half) was recognized as employer contributions in the fiscal year 2009, and the other half was recognized in fiscal year 2010. Employee contributions of $61,201 were received in fiscal year 2009, of which, $30,600 (half) was recorded as employee contributions in the fiscal year 2009, and the remaining $30,601 was recorded in fiscal year 2010.
Actuarial Information - Actuarial valuations of the LRS are prepared every two years to determine State contributions required to fund the system on an actuarial basis. Actuarial methods and significant assumptions used in the July 1, 2010, actuarial valu-ation include the following:
2010 2009 2008Primary Government 164,630$ 153,768$ 146,754$ Component Units: Colorado River Commission 470 443 448 Nevada System of Higher Education 28,274 28,030 27,269Total component units 28,744 28,473 27,717Total reporting entity 193,374$ 182,241$ 174,471$ Contributions as % of covered payroll 17% 16% 16%Percentage of pension costs contributed 100% 100% 100%
Actuarial Cost Method: Entry age normalAmortization Method: Year-by-year closed with each amortization period set at 20 yearsAsset Valuation Method: Five year smoothed marketActuarial Assumptions:
Investment yield 8%Projected salary increases None
Retirement Age for Active Members: Legislators become fully vested at age 60 with eight years of service with service credit before July 1, 1985, or at age 60 with ten years of service without service credit before July 1, 1985.
(Continued on next page)

74
Notes to Financial StatementsFor the Fiscal Year Ended June 30, 2010
NEVADA(Note 9 Continued)
Actuarial Valuation Annual State Contribution Net PensionDate Pension Cost Made Obligation
1/1/2008 185$ 185$ -$ 1/1/2009 201 201 -7/1/2010 201 201 -100%
Percentage of Annual
100%100%
Pension Cost Contributed
Assumed Mortality Rate: 1983 Group Annuity Mortality TableCost of Living (Post-Retirement) Increases: 2% after 3 years of receiving benefits 3% after 6 years of receiving benefits 3.5% after 9 years of receiving benefits 4% after 12 years of receiving benefits 5% after 14 years of receiving benefits * Cap based on CPI if benefits outpace inflation
*Does not apply to retirees who enter the LRS on or after January 1, 2010.
Funded Status and Funding Progress – As of July 1, 2010, the most recent actuarial valuation date, the LRS was 74% funded. The actuarial accrued liability for benefits was $5.6 million, and the actuarial value of assets was $4.1 million, resulting in an unfunded actuarial accrued liability (UAAL) of $1.5 million. The covered payroll (annual payroll of active employees covered by the plan) was $ .4 million, and the ratio of the UAAL to the covered payroll was 411%.
The schedule of funding progress, presented as Required Supplementary Information following the notes to the financial statements, presents multiyear trend information about whether the actuarial value of plan assets are increasing or decreasing over time relative to the actuarial accrued liability for benefits.
C. JRSPlan Description - The Judicial Retirement System of Nevada (JRS) is the administrator of an agent multiple-employer public employees defined benefit retirement system estab-lished in 2001 by the Nevada Legislature. The JRS is legis-lated by and functions in accordance with laws established by the Nevada Legislature. The JRS was established to provide benefits in the event of retirement, disability, or death of justices of the Supreme Court, district judges, municipal court judges and justices of the peace, funded on an actuarial reserve basis. As of July 1, 2010, the Supreme Court and ten municipalities in Nevada elected to participate in JRS.
JRS issues a stand-alone financial report that includes finan-cial statements and required supplementary information. The State reports JRS as a pension trust fund. JRS financial report may be obtained from the Public Employees’ Retirement System, 693 West Nye Lane, Carson City, Nevada 89703.
Benefits are paid according to various options contained in pertinent statutes, dependent upon whether a member was serving as a judge before November 5, 2002. Retiring members who were serving as a judge before November 5, 2002 may select among the two benefit options below. Retir-ing members who began serving as a justice or judge on or after November 5, 2002 may select only the first option below.
Option 1 - 2003 Benefit Plan: Benefits, as required by stat-ute, are computed at 3.4091% per year of accredited service at the time of retirement to a maximum of 75% with 22 years, times the member’s highest average compensation in any 36 consecutive months. Benefit payments to which partici-pants may be entitled under the plan include pension benefits, disability benefits and survivor benefits.
Option 2 – Previous Benefit Plan: Retiring members who were serving as a judge prior to November 5, 2002 may select the following benefit: Benefit payments are computed at 4.1666% for the first five years of service and 4.1666% for each addi-tional year of service, up to a total maximum of 22 years, times the member’s compensation for their last year of service.
Summary of Significant Accounting Policies – JRS uses the economic resources measurement focus and the accrual basis of accounting. Revenues are recorded in the accounting period in which they are earned and become measurable. Per statute, contributions are recognized in the reporting period for which they are due. Expenses are recorded when the corresponding liabilities are incurred, regardless of when payment is made. Benefits and refunds are recognized when due and payable in accordance with the terms of the plan. Unfunded portions of actuarially determined liabilities for retirement benefits are not recorded in the financial statements.
Trend Information - Three-year trend information follows (expressed in thousands):
(Continued from previous page)

75
Notes to Financial StatementsFor the Fiscal Year Ended June 30, 2010
NEVADA(Note 9 Continued)
Investments are reported at fair value. The fair values of investments in securities are generally based on published market prices and quotations from major investment firms. In general, fixed income securities are valued based on yields currently available on comparable securities of issuers with similar credit ratings.
Contributions – The JRS is an employer-paid plan and there is no contribution from active members. The participating employers submit the percentage of compensation deter-
mined by the actuary to pay the normal costs and administra-tive expenses. Annually, the participating employers pay to the JRS an amount on the unfunded liability which is actuari-ally determined to be sufficient to enable the JRS to pay all current benefits for which the JRS is liable.
Actuarial Information – Actuarial valuations of the JRS are prepared annually on a fiscal year basis. Significant actuarial assumptions used in the July 1, 2010 valuation include the following:
2010 2009 2008Annual required contribution 5,043$ 3,740$ 3,453$ Interest on net pension obligation (40) (24) (6)Adjustment to annual required contribution 116 69 19Annual pension cost 5,119 3,785 3,466State contribution made (4,624) (3,992) (3,680)Increase (decrease) in net pension obligation 495 (207) (214)Net pension obligation (asset) at beginning of year (505) (298) (84)Net pension obligation (asset) at end of year (10)$ (505)$ (298)$
Percentage of annual pension costs contributed 90% 105% 106%
Actuarial Cost Method: Entry age normal Amortization Method: Level percent of pay (3% payroll growth assumed) over a declining
amortization period of: 30 years for Supreme Court and District Judges 20 years for each non-state agencyAsset Valuation Method: 5-year smoothed marketActuarial Assumptions:
Investment yield 8%Projected salary increases 1 to 4 years of service increase of 3% per year
5 years of service increase of 11% per year6 to 12 years of service increase of 5% per year13 or more years of service increase of 3% per year
Retirement Age for Active Members: Retirement rates after completion of five years of service and attain-ment of the following ages:
AgeRateperAge 60—64 35% 65—67 50% 68—69 75% 70 100%
Assumed Mortality Rate: RP-2000 Male Combined Healthy TableRP-2000 Female Combined Healthy Table set forward one year
Cost of Living (Post-Retirement) Increases: 2% after 3 years of receiving benefits 3% after 6 years of receiving benefits 3.5% after 9 years of receiving benefits 4% after 12 years of receiving benefits 5% after 14 years of receiving benefits* Cap based on CPI if benefits outpace inflation
* Does not apply to retirees who enter the JRS on or after January 1, 2010.
Trend Information - Three-year trend information for the current fiscal year and each of the two preceding fiscal years follows (expressed in thousands):

76
Notes to Financial StatementsFor the Fiscal Year Ended June 30, 2010
NEVADA(Note 9 Continued)
Funded Status and Funding Progress – As of July 1, 2010, the most recent actuarial valuation date, the JRS was 59% funded. The actuarial accrued liability for benefits was $80.4 million, and the actuarial value of assets was $47.3 million, resulting in an unfunded actuarial accrued liability (UAAL) of $33.2 million. The covered payroll (annual payroll of active employees covered by the plan) was $15.3 million, and the ratio of the UAAL to the covered payroll was 217%.
The schedule of funding progress, presented as Required Supplementary Information following the notes to the financial statements, presents multiyear trend information about whether the actuarial value of plan assets are increasing or decreasing over time relative to the actuarial accrued liability for benefits.
D. OtherPostemploymentBenefitsPlan Description – The State Retirees’ Health and Welfare Benefits Fund, Public Employees’ Benefits Program (“PEBP”) of the State of Nevada (“Retirees’ Fund”) was created in 2007 by the Nevada Legislature to account for the financial assets designated to offset the portion of current and future costs of health and welfare benefits paid on behalf of state retirees. NRS 287.0436 established the Retirees’ Fund as an irrevocable trust fund for the purpose of providing retirement benefits other than pensions. The Retirees’ Fund is a multiple-employer cost shar-ing defined postemployment benefit plan with three participat-ing employers, and is administered by the Board of the Public Employees’ Benefits Program of the State of Nevada. The Retirees’ Fund provides benefits other than pensions to eligible retirees and their dependents through the payment of subsidies to the PEBP. PEBP administers a group health and life insur-ance program for covered employees, both active and retired, of the State, and certain other participating public employers within the State of Nevada. NAC 287.530 establishes the bene-fit upon the retiree. All Nevada public employees who retire with at least five years of public service and who have State service are eligible to receive benefits from the Retirees’ Fund. State service is defined as employment with any Nevada State agency, the Nevada System of Higher Education and any State Board or Commission. A portion of the monthly premiums are deducted from pension checks and paid to the PEBP. The cost varies depending on which health plan the retiree chooses, as well as the amount of subsidy they receive.
The Retirees’ Fund issues a stand-alone financial report that includes financial statements and required supplementary information. The State reports the Retiree’s Fund as a trust fund. The Retirees’ Fund financial report may be obtained from Public Employees’ Benefits Program, 901 South Stewart Street, Suite 1001, Carson City, NV 89701.
Summary of Significant Accounting Policies - The financial state-ments of the Retirees’ Fund have been prepared using the accrual basis of accounting. Employer contributions are recognized when due and the employer has made a formal commitment to provide the contributions. Benefits and refunds are recognized when due and payable in accordance with the terms of the plan. The Retirees’ Fund does not receive member contributions.
Method Used to Value Investments – Investments are reported at fair value, which is defined as the price at which an asset passes from a willing seller to a willing buyer. Investments are held with the Retirement Benefits Investment Fund (RBIF), which values participants’ shares according to the contributions of each entity, and accordingly, earnings and expenses are allocated to each enti-ty in proportion to the participants’ share in the RBIF.
Contributions and Funding Policy - NRS 287.046 establishes a subsidy to pay an amount toward the cost of the premium or contribution for the persons retired from the State. Contribu-tions to the Retirees’ Fund are paid by the State of Nevada through an assessment of actual payroll paid by each State entity. For the period from July 1, 2009 through June 30, 2010 the rate assessed was 2.296% of annual covered payroll. The assessment is based on an amount provided by the Legisla-ture each biennium in session law. For the year ended June 30, 2010, the State and its component units contributed $33,406,435 to the plan, which is 100% of the contractually required contribution. For the year ended June 30, 2009, the State and its component units contributed $38,683,119 to the plan, including $32,256,720, which is 100% of the contrac-tually required contribution, and an additional $6,426,399 to prefund benefits. For the year ended June 30, 2008, the State and its component units contributed $59,263,078 to the plan, including $39,590,702, which is 100% of the contractu-ally required contribution, and an additional $19,672,376 to prefund benefits.

77
NEVADA
Notes to Financial StatementsFor the Fiscal Year Ended June 30, 2010
Self InsuranceInsurance Premiums
Fund Fund
Balance June 30, 2008 32,634$ 43,802$ Claims and changes in estimates 238,691 18,999Claim payments (235,444) (17,213)Balance June 30, 2009 35,881 45,588 Claims and changes in estimates 238,725 13,212Claim payments (240,133) (13,637)Balance June 30, 2010 34,473$ 45,163$
Due Within One Year 34,473$ 16,994$
Note 10 - Risk Management
The State of Nevada established the Self-Insurance and Insur-ance Premiums funds in 1983 and 1979, respectively. Both funds are classified as internal service funds.
Interfund premiums are reported as interfund services provid-ed and used. All State funds participate in the insurance program. Changes in the claims liabilities during the past two fiscal years were as follows (expressed in thousands):
These liabilities are recorded in accordance with GASB State-ment No. 10. This statement requires that a liability for claims be reported if information received before the issuance of the financial statements indicates it is probable a liability has been incurred at the date of the financial statements and the amount of the loss can be reasonably estimated. These liabilities include incremental claims adjustment costs. A reserve for losses has been established in both funds to account for these liabilities and is included in the liability section of the State-ment of Net Assets.
There was no insurance coverage for excess liability insurance.
There are several pending lawsuits or unresolved disputes involving the State or its representatives at June 30, 2010. The estimated liability for these claims has been factored into the calculation of the reserve for losses and loss adjustment expenses developed.
A. Self-InsuranceFundThe Self-Insurance Fund administers the group health, life and disability insurance for covered employees, both active and retired, of the State and certain other participating public employers within the State. All public employers in the State are eligible to participate in the activities of the Self-Insurance Fund and currently, in addition to the State, there are fifteen public employers whose employees are covered under the plan. Additionally, all retirees of public employ-ers contracted with the Self-Insurance Fund to provide cover-age to their active employees are eligible to join the program subsequent to their retirement. Public employers are required to subsidize their retirees who participate in the plan in the same manner the State subsidizes its retirees. Currently, one hundred twenty-seven public employers are billed for retiree subsidies. The Self-Insurance Fund is overseen by the Public Employees’ Benefit Program Board. The Board is composed of nine members: eight members appointed by the Governor,
and the Director of the Department of Administration or his designee.
The Self-Insurance Fund is self-insured for medical, dental, vision, mental health and substance abuse benefits and assumes all risk for claims incurred by plan participants. Fully insured HMO products are also offered. Accidental death and dismem-berment, travel accident, long-term disability and life insur-ance benefits are fully insured by outside carriers. For the self-insured benefits, fund rate-setting policies have been established after consultation with an actuary. The participat-ing public employers, with the exception of the State, are not subject to supplemental assessment in the event of deficiencies.
The management of the Self-Insurance Fund establishes claims liabilities based on estimates of the ultimate cost of claims (including future claim adjustment expenses) that have been reported but not settled and of claims that have been incurred but not reported. Because actual claims costs depend on such complex factors as inflation, changes in doctrines of legal liabil-ity and damage awards, the process used in computing claims liabilities does not necessarily result in an exact amount. Upon consultation with an actuary, claims liabilities are recomputed annually using a variety of actuarial and statistical techniques to produce current estimates that reflect recent settlements, claim frequency and other economic and social factors. A provision for inflation in the calculation of estimated future claims costs is implicit in the calculation, because reliance is placed both on actual historical data that reflect past inflation and on other factors that are considered to be appropriate modifiers of past experi-ence. Adjustments to claims liabilities are charged or credited to expense in the periods in which claims are made.
B. InsurancePremiumsFundThe Insurance Premiums Fund provides general, civil (tort), and auto liability insurance to State agencies, workers’ compensation insurance for State employees, and auto physi-cal damage and property insurance for State agencies.
For the period beginning January 1, 2001, and for each calen-dar year thereafter, the Fund purchased a high deductible policy for workers’ compensation. For the year ended June 30, 2010, the loss retention for this policy was $1,500,000. Effective January 1, 2001 NSHE and PERS were excluded from coverage under this policy. Liabilities in the amount of $35,246,832 as of June 30, 2010 were determined using stan-dard actuarial techniques as estimates for the case, reserves, incurred but not reported losses and allocated loss adjustment expenses under the plan as of June 30, 2010.
The Fund is financed by the State. The State has a maximum exposure of $50,000 through October 1, 2007 and $75,000 thereafter for each general liability claim, with the exception of claims that are filed in other jurisdictions, namely, federal court. Those claims filed in federal court are not subject to the limit. The State statutory tort recovery limit will increase to $100,000 effective October 1, 2011. Per State statute, if,

78
Notes to Financial StatementsFor the Fiscal Year Ended June 30, 2010
NEVADA
A. NetAssetsRestrictedbyEnablingLegislationThe government-wide statement of net assets reports $1,147,872,387 of restricted net assets for the primary government of which $113,961,050 is restricted by enabling legislation.
B. GovernmentalFundBalancesGovernmental fund balances, reserved for other at June 30, 2010, are explained as follows (expressed in thousands):
Governmental fund balances, unreserved, designated, reported in nonmajor funds at June 30, 2010, are explained as follows (expressed in thousands):
(Note 10 Continued)as the result of future general liability or catastrophic losses, fund resources are exhausted, coverage is first provided by the reserve for statutory contingency account and would then revert to the General Fund.
The Fund is fully self-insured for general, civil and vehicle liability. The fund is also self-insured for comprehensive and collision loss to automobiles, self-insured to $250,000 for property loss with commercial insurance purchased to cover the excess above this amount, and commercially insured for losses to boilers and machinery and certain other risks.
At June 30, 2010, incurred but not reported claims liability for general, civil and auto liability insurance is based upon stan-dard actuarial techniques, which take into account financial data, loss experience of other self-insurance programs and the insurance industry, the development of known claims, esti-mates of the cost of reported claims, incurred but not reported claims, and allocated loss adjustment expenses. The incurred but not reported claims liability for property casualty insur-ance is based upon the estimated cost to replace damaged property. The liabilty for estimated losses from reported and unreported claims in excess of the amounts paid for the work-ers’ compensation policies is determined using standard actu-arial tecniques, which take into account claims history and loss development factors for similar entities. This liability is further adjusted for a non-working escrow deposit on-hand
with the insurer which is restricted for use as collateral against future losses and a loss fund on-hand with the insurer that is restricted for payment of claims. Incurred but not reported claims liabilities are included in the reserve for losses.
The State is contingently liable for the cost of post retirement heart disease benefits payable under the Nevada Occupation-al Disease Act. Any fireman or police officer that satisfies the five-year employment period requirement under this act is eligible for coverage under Workers’ Compensation for heart disease. A range of estimated losses from $9,647,700 to $40,118,200 has been determined using standard actuarial techniques. Due to the high degree of uncertainty surround-ing this coverage, no accrual for these losses is reflected in the financial statements.
At June 30, 2010 total liabilities exceeded total assets by $24,131,446. The Fund is liable for approximately $25,000,000 as of June 30, 2010 in potential claims settle-ments, which have yet to be funded through premium contri-butions. As NRS 331.187 provides that if money in the Fund is insufficient to pay a tort claim, the claim is to be paid from the reserve for statutory contingency account, and, as manage-ment assesses premiums to cover current claims payments, management believes that this provides the opportunity for the Fund to satisfy these liabilities.
Note 11 - Fund Balances and Net Assets
General State Highway Other Governmental TotalFund balances, reserved for other:
Reserved for prepaid items 1,677$ 12$ 99$ 1,788$ Reserved for noncurrent receivables - notes 387 - 23 410 Reserved for specific purpose private contributions - - 165 165 Reserved for legislatively approved allocations - - 3,097 3,097
Total fund balances, reserved for other 2,064$ 12$ 3,384$ 5,460$
Other GovernmentalFund balances, unreserved, designated, reported in nonmajor:
Special revenue funds: Designated for waiver of furloughs and increased costs associated with compensated absences due to upcoming Legislative Session 1,200$ Capital project funds: Designated for approved capital projects 59,943
Total fund balances, unreserved, designated, reported in nonmajor funds 61,143$

79
Notes to Financial StatementsFor the Fiscal Year Ended June 30, 2010
NEVADA(Note 11 Continued)
Note 12 - Principal Tax Revenues
The principal taxing authorities for the State of Nevada are the Nevada Tax Commission and the Nevada Gaming Commission.
The Nevada Tax Commission was created under NRS 360.010 and is the taxing and collecting authority for most non-gaming taxes. The following are the primary non-gaming tax revenues:
Sales and Use Taxes are imposed at a minimum rate of 6.85%, with county and local option up to an additional 1.25%, on all taxable sales and taxable items of use. The State receives tax revenue of 2% of total sales with the balance distributed to local governmental entities and school districts.
Modified Business Tax is imposed at a tiered rate for businesses other than financial institutions. If the sum of all taxable wages paid by the employer does not exceed $62,500 for the calendar quarter, the amount of tax is 0.5% of the sum of the wages. If the sum of all the wages paid by the employer exceeds $62,500 for the calendar quarter, the tax is $312.50 plus 1.17% of the amounts the wages exceed $62,500. Modified Business Tax is imposed on financial institutions at 2% on gross wages paid by the employer during the calendar quarter. There is an allow-able deduction from the gross wages for amounts paid by the employer for qualified health insurance or a qualified health benefit plan.
Insurance Premium Tax is imposed at 3.5% on insurance premiums written in Nevada. A “Home Office Credit” is given to insurance companies with home or regional offices in Nevada, but not to exceed 80% of the taxes due.
Motor Vehicle Fuel Tax is levied at 24.805 cents per gallon on gasoline and gasohol sales. 17.65 cents of the tax goes to the State Highway Fund, .75 cents goes to the Clean-ing Up Petroleum Discharges Fund, .055 cents goes to the General Fund and the remaining 6.35 cents goes to the counties. The counties have an option to levy up to an additional 9 cents per gallon.
Other Sources of tax revenues include: Cigarette Tax, Controlled Substance Tax, Estate Tax, Jet Fuel, Liquor Tax, Live Entertainment Tax (non-gaming establishments), Lodging Tax, Business License Fees, Motor Carrier Fees, Motor Vehicle Registration Fees, Net Proceeds of Minerals Tax, Property Tax, Real Property Transfer Tax, Short-Term Lessor Fees and Tire Tax.
The Nevada Gaming Commission was created under NRS 463.022 and is charged with collecting State gaming taxes and fees. The following sources account for gaming tax revenues:
Percentage Fees are the largest of several State levies on gaming. They are based upon gross revenue and are collected monthly. The fee is applied on a graduated basis at the following monthly rates: 3.5% of the first $50,000 of gross revenue; 4.5% of the next $84,000 of gross revenue; and 6.75% of the gross revenue in excess of $134,000.
Live Entertainment Taxes are imposed at 10% of all amounts paid for admission, food, merchandise or refresh-ment, while the establishment is providing entertainment in facilities with less than occupancy/seating of 7,500. A 5% rate is imposed for facilities with at least 7,500 occu-pancy/seating.
Flat Fee Collections are levied on the number of gambling games and slot machines operated. Licensees pay fees at variable rates on the number of gaming devices operated per quarter.
Other Sources of gaming tax revenues include: Annu-al State Slot Machine Taxes, Annual License Fees and Miscellaneous Collections, which consists of penalties and fines, manufacturer’s, distributor’s and slot route opera-tor’s fees, advance payments, race wire fees, pari-mutuel wagering tax and other nominal miscellaneous items.
C. IndividualFundDeficitsNonmajorEnterpriseFundsNevada Magazine - The Nevada Magazine Fund accounts for the operation of the publication, Nevada Magazine, which is published to promote tourism. The fund shows an increase in net assets of $62,561 for the fiscal year ended June 30, 2010, resulting in net liabilities (negative net assets) of $73,084 at June 30, 2010.
Higher Education Tuition Trust - The Higher Education Tuition Trust Fund accounts for the receipts and disbursements related to prepaid tuition contracts that allow the cost of tuition to be
paid in advance of enrollment at an institution of higher educa-tion. The fund shows an increase in net assets of $6,755,683 for the fiscal year ended June 30, 2010, resulting in net liabilities (negative net assets) of $9,708,161 at June 30, 2010.
InternalServiceFundInsurance Premiums - The Insurance Premiums Fund allo-cates the cost of fidelity insurance, property insurance and workers’ compensation insurance to State agencies. The fund recorded an increase in net assets of $4,150,903 for the year ended June 30, 2010, resulting in net liabilities (negative net assets) of $24,131,446 at June 30, 2010.

80
NEVADA
Notes to Financial StatementsFor the Fiscal Year Ended June 30, 2010
Note 13 - Works of Art and Historical Treasures
Note 14 - Commitments and Contingencies
The State possesses certain works of art, historical treasures, and similar assets that are not included in the capital assets shown in Note 7. The mission of the Lost City Museum in Overton is to study, preserve, and protect prehistoric Pueblo sites found in the Moapa Valley and adjacent areas and to interpret these sites through exhibits and public programs. In Reno, the Nevada Historical Society exhibits and maintains a large number of historical collections preserving the cultural heritage of Nevada. These collections are divided into four sections: library, manuscripts, photography, and museum. The Nevada State Museum in Carson City collects, preserves, and documents three general types of collections: anthropol-ogy, history, and natural history as it relates to Nevada and the Great Basin. The mission of the Nevada State Museum, Las Vegas, is to inspire and educate a diverse public about the history and natural history of Nevada. Its major collec-tions include transportation, mining, and tourism as well as daily artifacts such as clothing, historical correspondence, business records, and photography. The Nevada State Rail-road Museum, which is located in Carson City, preserves the
rich railroad heritage of Nevada, including locomotives and cars of the famous Virginia & Truckee Railroad. The East Ely Depot Museum, located in the historic Nevada Northern Rail-road Depot building, exhibits artifacts, documents, and photo-graphs of early Eastern Nevada mining and railroad transpor-tation. The Nevada Arts Council with locations in Carson City and Las Vegas exhibits artwork. Its mission is to enrich the cultural life of the state and make excellence in the arts acces-sible to all Nevadans.
These collections are not capitalized by the State because they are:
• Held for public exhibition, education or research in furtherance of public service, rather than financial gain,
• Protected, kept unencumbered, cared for and preserved, and
• Subject to an organizational policy that requires the proceeds from sales of collection items to be used to acquire other items for collections.
A. PrimaryGovernmentLawsuits - The State Attorney General’s Office reported that the State of Nevada or its officers and employees were parties to numerous lawsuits, in addition to those described below. In view of the financial condition of the State, the State Attor-ney General is of the opinion that the State’s financial condi-tion will not be materially affected by this litigation, based on information known at this time.
Several of the actions pending against the State are based upon the State’s (or its agents’) alleged negligence in which the State must be named as a party defendant. However, there is a statutory limit to the State’s liability of $50,000 per cause of action through October 1, 2007 and $75,000 per cause of action thereafter. Such limitation does not apply to federal actions such as civil rights actions under 42 U.S.C. Section 1983 brought under federal law or to actions in other states. Tort claims are handled in accordance with NRS 41. Building and contents are insured on a blanket replacement cost basis for all risk except certain specified exclusions.
The State and/or its officers and employees are parties to a number of lawsuits filed under the federal civil rights statutes. However, the State is statutorily required to indemnify its offi-cers and employees held liable in damages for acts or omis-sions on the part of its officers and employees occurring in the course of their public employment. Several claims may thus be filed against the State based on alleged civil rights viola-tions by its officers and employees. Since the statutory limit of liability (discussed above) does not apply in federal civil rights cases, the potential liability of the State is not ascer-
tainable at the present time. Currently, the State is involved in several actions alleging federal civil rights violations that could result in substantial liability to the State.
In litigation filed against the Department of Taxation, the plaintiff is seeking a declaration that the Live Entertainment Tax is unconstitutional on its face and that they do not have to pay the tax. The Live Entertainment Tax is collected by the Department of Taxation as well as the Gaming Control Board. The Gaming Control Board’s collection of the Live Entertain-ment Tax has not been challenged. Should a refund be grant-ed, the estimated amount to date is $60.8 million. However, if the tax is found to be unconstitutional on its face, the statute may be completely stricken.
The State instituted a claim for declaratory relief relating to its actions in 2008 in terminating a forward delivery invest-ment agreement between it and Lehman Brothers Commer-cial Bank, a Utah industrial bank (“LBCB”). When the State entered into the forward delivery investment agreement in June of 2002, it received a fee of $20.5 million in exchange for agreeing to purchase certain specified US treasury securi-ties of various maturities and principal amounts from LBCB at different times between June 30, 2002 and May 15, 2028. The State was required to purchase the securities at their matured values, or par value if discount securities were purchased. LBCB would realize revenue at the time of delivery to the custodian. In January of 2009, LBCB (now known as Wood-lands Commercial Bank) filed an answer to the State’s declar-atory judgement action and a counterclaim requesting a judge-ment in favor of LBCB in the declaratory relief claim, and

81
Notes to Financial StatementsFor the Fiscal Year Ended June 30, 2010
NEVADA
For the YearEnding June 30 Amount
2011 30,214$ 2012 22,5482013 16,4902014 10,3412015 6,704
2016-2020 7,6792021-2025 2,100
Total 96,076$
(Note 14 Continued)
seeking other relief, including an award of damages against the State. While the State believes it has a meritorious claim for declaratory relief and meritorious defenses to LBCB’s counterclaim, the State cannot at this time predict the outcome of this action.
PERS - The Public Employees’ Retirement System (PERS) has entered into investment funding commitments related to private markets to fund an additional $533.3 million at some future date.
Leases - The State is obligated by leases for buildings and equipment accounted for as operating leases. Operating leas-es do not give rise to property rights as capital leases do. There-fore, the results of the lease agreements are not reflected in the Statement of Net Assets. Primary government lease expense for the year ended June 30, 2010 amounted to $36 million. The following is the primary government’s schedule of future mini-mum rental payments required under operating leases that have initial or remaining noncancelable lease terms in excess of one year as of June 30, 2010 (expressed in thousands):
Federal Grants - The State receives significant financial assis-tance from the federal government in the form of grants and entitlements, which are generally conditioned upon compli-ance with terms and conditions of the grant agreements and applicable federal regulations, including the expenditure of the resources for eligible purposes. Substantially all grants are subject to financial and compliance audits by federal agencies. Any disallowance as a result of these audits could become a liability of the State. As of June 30, 2010, the State is unable to estimate the amount, if any, of expenditures that may be disallowed, although the State expects such amounts, if any, to be immaterial.
Rebate Arbitrage - The Federal Tax Reform Act of 1986 imposes a rebate requirement with respect to some bonds
issued by the State. Under this requirement, an amount equal to the sum of (a) the excess of the aggregate amount earned on all investments (other than certain specified exceptions) over the amount that would have been earned if all invest-ments were invested at a rate equal to the yield on the bonds, and (b) any income earned on the excess described in (a) is required to be rebated to the U.S. Treasury, in order for the interest on the bonds to be excluded from gross income for federal income tax purposes. Rebatable arbitrage is computed as of each installment computation date. The present value of the rebatable arbitrage is $3,282,000 and has been recorded as a liability in the Statement of Net Assets at June 30, 2010. Future calculations might result in different rebatable arbi-trage amounts.
Construction Commitments – As of June 30, 2010, the Nevada Department of Transportation had total contractual commitments of approximately $478.4 million for construc-tion of various highway projects. Other major non-highway construction commitments for the primary government’s budgeted capital projects funds total $23.3 million.
B. DiscretelyPresentedComponentUnitsNevada System of Higher Education (NSHE) – As of June 30, 2010, NSHE had entered into various investment agreements with private equity partnerships and private commingled funds. Under the terms of certain of these investment agree-ments, NSHE is obligated to make additional investments in these partnerships of $4,827,000.
NSHE is a defendant or co-defendant in legal actions. Based on present knowledge and advice of legal counsel, NSHE management believes any ultimate liability in these matters, in excess of insurance coverage, will not materially affect the net assets, changes in net assets or cash flows of NSHE.
The estimated cost to complete property authorized or under construction at June 30, 2010 is $127,884,000. These costs will be financed by State appropriations, private donations, available resources and/or long-term borrowings.
Colorado River Commission (CRC) - The CRC may from time to time be a party in various litigation matters. It is manage-ment’s opinion, based upon advice from legal counsel, that the risk of financial losses to CRC from such litigation, if any, will not have a material adverse effect on CRC’s future financial position, results of operations or cash flows. Accordingly, no provision has been made for any such losses.
The CRC does not accrue for estimated future legal defense costs, if any, to be incurred in connection with outstanding or threatened litigation and other disputed matters but rather, records such as period costs when the services are rendered.

82
NEVADA
Notes to Financial StatementsFor the Fiscal Year Ended June 30, 2010
Note 15 - Subsequent Events
Note 16 - Accounting Changes and Restatements
Net assets as of July 1, 2009 have been restated in the enterprise funds and business type activities to reflect a change in the reporting of the WICHE Student Loan Fund (enterprise fund). WICHE Student Loan Fund is no longer part of the primary government, and is reported by the Nevada System of Higher Education (component unit) beginning July 1, 2009. The result is a reduction in beginning net assets of $2,010,098.
PrimaryGovernmentBonds – On December 8, 2010 the State executed purchase agreements for the following bonds, which are scheduled to close on December 21, 2010:
$121,920,000 Series 2010C General Obligation (Limited Tax), Capital Improvement and Refunding Bonds (subject to the Constitutional Debt Limit)
$20,170,000 Series 2010D General Obligation (Limited Tax), Natural Resources and Refunding Bonds (not subject to the Constitutional Debt Limit)
$4,535,000 Series 2010G General Obligation (Limited Tax), Water Pollution Control Revolving Fund Matching Bonds (not subject to the Constitutional Debt Limit)
$4,625,000 Series 2010H, Subseries 1 (Tax-Exempt) General Obligation (Limited Tax), Water Pollution Control Revolving Fund Leveraged Refunding Bonds (not subject to the Constitutional Debt Limit)
$3,725,000 Series 2010H, Subseries 2 (Taxable) General Obligation (Limited Tax), Water Pollution Control Revolving Fund Leveraged Refunding Bonds (not subject to the Constitutional Debt Limit)
$6,235,000 Series 2010I General Obligation (Limited Tax), Safe Drinking Water Revolving Fund Matching and Refunding Bonds (not subject to the Constitutional Debt Limit)
Advances from the Federal Unemployment Account – The State drew repayable advances of $141.4 million between July1, 2010 and November 30, 2010. The State has applied for and may still draw up to $270 million to meet State unemployment insurance obligations through March 31, 2011. Thereafter loan requests may be submitted every 90 days.

83
Kayaking East Fork of the Carson River, NVPhoto Courtesy of Nevada Commission on Tourism
RequiRed SupplementaRy infoRmation

84
For the Fiscal Year Ended June 30, 2010
Budgetary Comparison ScheduleGeneral Fund and Major Special Revenue Funds
Original Budget Final Budget ActualVariance with Final Budget
SOURCES OF FINANCIAL RESOURCESFund balances, July 1 477,958,549$ 477,958,549$ 477,958,549$ -$
Revenues: Sales taxes 831,058,800 758,074,300 784,348,571 26,274,271 Gaming taxes, fees, licenses 856,907,929 793,888,829 789,608,373 (4,280,456) Intergovernmental 2,169,665,619 2,716,130,421 2,237,855,390 (478,275,031) Other taxes 1,349,075,833 1,300,239,513 1,325,144,697 24,905,184 Sales, charges for services 223,283,905 217,965,676 181,384,891 (36,580,785) Licenses, fees and permits 492,775,654 495,435,579 497,356,970 1,921,391 Interest 14,202,179 17,964,032 4,939,938 (13,024,094) Other 222,125,156 239,550,158 216,116,335 (23,433,823)
Other financing sources: Proceeds from sale of bonds - 16,521,898 16,523,022 1,124 Transfers 292,211,880 750,697,611 694,982,282 (55,715,329) Reversions from other funds - - 3,249,831 3,249,831
Total sources 6,929,265,504 7,784,426,566 7,229,468,849 (554,957,717)
USES OF FINANCIAL RESOURCESExpenditures and encumbrances: Constitutional agencies 291,523,030 478,256,379 400,733,325 77,523,054 Finance and administration 74,959,435 76,962,746 62,961,540 14,001,206 Education 2,667,381,791 2,844,498,591 2,603,053,645 241,444,946 Human services 2,829,480,385 2,983,570,791 2,755,876,129 227,694,662 Commerce and industry 155,188,779 210,394,019 137,448,452 72,945,567 Public safety 434,700,215 528,019,818 400,592,933 127,426,885 Infrastructure 262,374,898 324,844,059 145,193,108 179,650,951 Special purpose agencies 37,878,103 45,180,595 34,563,193 10,617,402Other financing uses: Transfers to other funds 60,028,571 59,501,928 59,501,928 - Reversions to other funds - - 1,175,148 (1,175,148)Projected reversions (53,500,000) (53,500,000) - (53,500,000)
Total uses 6,760,015,207 7,497,728,926 6,601,099,401 896,629,525
Fund balances, June 30 169,250,297$ 286,697,640$ 628,369,448$ 341,671,808$
General Fund
Sources of Financial Resources
Uses of Financial Resources

85
NEVADA
Original Budget Final Budget Actual
Variance with Final
BudgetOriginal Budget Final Budget Actual
Variance with Final
Budget
295,089,004$ 295,089,004$ 295,089,004$ -$ -$ -$ -$ -$
- - - - - - - -- - - - - - - -
362,396,583 537,052,820 440,919,912 (96,132,908) - - - -284,232,340 284,279,760 302,324,379 18,044,619 - - - -21,725,190 16,323,338 16,130,971 (192,367) - - - -
165,068,439 161,470,066 177,454,612 15,984,546 - - - -8,051,793 3,051,793 3,106,451 54,658 30,618,109 30,618,109 30,148,333 (469,776)
44,263,591 33,005,124 37,354,061 4,348,937 - - - -
- - - - - - - -15,772,197 21,264,676 14,623,963 (6,640,713) - - - -
- - - - - - - -
1,196,599,137 1,351,536,581 1,287,003,353 (64,533,228) 30,618,109 30,618,109 30,148,333 (469,776)
- - - - - - - -- - - - - - - -- - - - - - - -- - - - - - - -- - - - - - - -
201,540,407 211,291,925 190,318,430 20,973,495 - - - -720,249,174 935,801,864 744,200,816 191,601,048 - - - -
- - - - - - - -
89,297,677 94,053,726 94,053,724 2 30,618,109 30,618,109 30,146,884 471,225- - 34,335 (34,335) - - - -- - - - - - - -
1,011,087,258 1,241,147,515 1,028,607,305 212,540,210 30,618,109 30,618,109 30,146,884 471,225
185,511,879$ 110,389,066$ 258,396,048$ 148,006,982$ -$ -$ 1,449$ 1,449$
Highway Fund Municipal Bond Bank
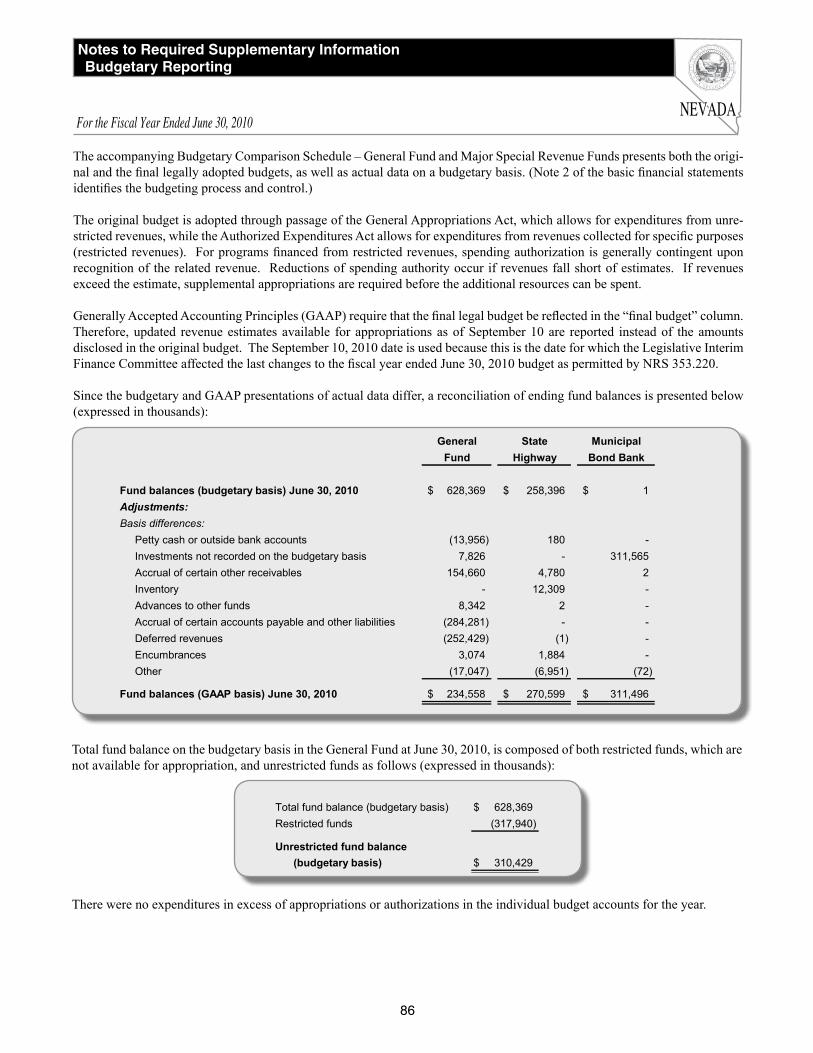
NEVADAFor the Fiscal Year Ended June 30, 2010
Notes to Required Supplementary InformationBudgetary Reporting
86
Total fund balance (budgetary basis) 628,369$ Restricted funds (317,940)
Unrestricted fund balance (budgetary basis) 310,429$
General State MunicipalFund Highway Bond Bank
Fund balances (budgetary basis) June 30, 2010 628,369$ 258,396$ 1$ Adjustments:Basis differences: Petty cash or outside bank accounts (13,956) 180 - Investments not recorded on the budgetary basis 7,826 - 311,565 Accrual of certain other receivables 154,660 4,780 2 Inventory - 12,309 - Advances to other funds 8,342 2 - Accrual of certain accounts payable and other liabilities (284,281) - - Deferred revenues (252,429) (1) - Encumbrances 3,074 1,884 - Other (17,047) (6,951) (72)
Fund balances (GAAP basis) June 30, 2010 234,558$ 270,599$ 311,496$
The accompanying Budgetary Comparison Schedule – General Fund and Major Special Revenue Funds presents both the origi-nal and the final legally adopted budgets, as well as actual data on a budgetary basis. (Note 2 of the basic financial statements identifies the budgeting process and control.)
The original budget is adopted through passage of the General Appropriations Act, which allows for expenditures from unre-stricted revenues, while the Authorized Expenditures Act allows for expenditures from revenues collected for specific purposes (restricted revenues). For programs financed from restricted revenues, spending authorization is generally contingent upon recognition of the related revenue. Reductions of spending authority occur if revenues fall short of estimates. If revenues exceed the estimate, supplemental appropriations are required before the additional resources can be spent.
Generally Accepted Accounting Principles (GAAP) require that the final legal budget be reflected in the “final budget” column. Therefore, updated revenue estimates available for appropriations as of September 10 are reported instead of the amounts disclosed in the original budget. The September 10, 2010 date is used because this is the date for which the Legislative Interim Finance Committee affected the last changes to the fiscal year ended June 30, 2010 budget as permitted by NRS 353.220.
Since the budgetary and GAAP presentations of actual data differ, a reconciliation of ending fund balances is presented below (expressed in thousands):
Total fund balance on the budgetary basis in the General Fund at June 30, 2010, is composed of both restricted funds, which are not available for appropriation, and unrestricted funds as follows (expressed in thousands):
There were no expenditures in excess of appropriations or authorizations in the individual budget accounts for the year.

NEVADAFor the Fiscal Year Ended June 30, 2010
Schedule of Funding ProgressPension Plans
87
Legislator’sRetirementSystem(LRS)Schedule of Funding Progress - Actuarial valuations of the LRS are prepared every two years to determine State contributions required to fund the system on an actuarial basis. During the fiscal year, the Plan changed the actuarial valuation date from a calendar year to a fiscal year to be consistent with the financial statements. A schedule of funding progress follows (expressed in thousands):
Trends can be affected by investment experience (favorable or unfavorable), salary experience, retirement experience or chang-es in demographic characteristics of employees. Changes in benefits provisions and in actuarial methods and assumptions can also affect trends. Actuarial valuation is performed biennially; plans with biennial valuations need not present duplicate information for the intervening years.
LRS issues a stand-alone financial report which may be obtained from the Public Employees’ Retirement System, 693 West Nye Lane, Carson City, Nevada 89703.
JudicialRetirementSystem(JRS)Schedule of Funding Progress - Actuarial valuations of the JRS are prepared annually on a fiscal year basis to determine State contributions required to fund the system on an actuarial basis. During the fiscal year, the Plan changed the actuarial valuation date from a calendar year to a fiscal year to be consistent with the financial statements. A schedule of funding progress follows (expressed in thousands):
Trends can be affected by investment experience (favorable or unfavorable), salary experience, retirement experience or chang-es in demographic characteristics of employees. Changes in benefits provisions and in actuarial methods and assumptions can also affect trends.
Actuarial UAAL as a %Valuation Ratio of of Annual
Date Assets to AAL Covered Payroll
01/01/07 $ 5,884 $ 4,323 $ 1,561 73% $ 328 476%01/01/09 5,955 4,229 1,726 71% 351 492%07/01/10 5,608 4,134 1,474 74% 359 411%
AnnualCoveredPayroll
Actuarial AccruedLiability (AAL)
Actuarial Valueof Assets
UnfundedActuarial AccruedLiability (UAAL)
Actuarial UAAL as a %Valuation Ratio of of Annual
Date Assets to AAL Covered Payroll
01/01/08 $ 62,067 $ 40,076 $ 21,991 65% $ 11,492 191%01/01/09 67,192 39,764 27,428 59% 11,368 241%07/01/10 80,447 47,281 33,166 59% 15,315 217%
AnnualCoveredPayroll
Actuarial AccruedLiability (AAL)
Actuarial Valueof Assets
UnfundedActuarial AccruedLiability (UAAL)

NEVADA
The State has adopted the modified approach for reporting infrastructure assets defined as a single roadway network that includes bridges. Bridges are not considered a subsystem as they are included in the cost of road construction. Under this approach, the State expenses certain maintenance and preservation costs and does not report depreciation expense. The single roadway network accounted for under the modified approach includes the combination of approximately 5,300 centerline miles of roads and approximately 1,100 bridges.
The State manages its roadway network by dividing the roadway system into five categories based on the traffic load. The categories range from category I, representing the busiest roadways and interstates, to category V, representing the least busy rural routes with an average daily traffic of less than 200 vehicles. In odd numbered calendar years the State completes a condi-tion assessment of its roadways. To monitor the condition of the roadways the State uses the International Roughness Index (IRI). IRI measures the cumulative deviation from a smooth surface. The lower the IRI value, the better the condition of the roadway. The State has set a policy that it will maintain a certain percentage of each category of its roadways with an IRI of less than 80. The State has set a policy that it will maintain its bridges so that not more than 10 percent are structurally deficient or functionally obsolete. During the current reporting period some of the bridge reporting and inspection methodologies changed. In prior years, bridges that were functionally obsolete and not eligible for federal funding were not reported as functionally obsolete. These bridges are now reported as functionally obsolete. In addition, the inspection methodologies have been refined, resulting in an increase of functionally obsolete bridges. These changes caused the State to exceed its 10 percent policy. The State is considering revising its policy to allow for these changes in reporting. The following tables show the State’s policy and the condition level of the roadways and bridges.
The following table shows the State’s estimate of spending necessary to preserve and maintain the roadway network at, or above, the established condition level and the actual amount spent during the past five fiscal years.
Maintenance and preservation costs are primarily funded with the fuel taxes, vehicle registration and license fees. The funding level for maintenance and preservation costs is affected by the amount of taxes and fees collected and the amount appropriated for construction of new roadways.
For the Fiscal Year Ended June 30, 2010
Schedule of Infrastructure Condition and Maintenance Data
88
I II III IV V
State Policy-minimum percentage 70% 65% 60% 40% 10%
Actual results of 2009 condition assessment 82% 82% 87% 56% 21%Actual results of 2007 condition assessment 82% 82% 88% 61% 25%Actual results of 2005 condition assessment 81% 78% 89% 61% 26%
Condition Level of the RoadwaysPercentage of roadways with an IRI of less than 80
Category
2009 2007 2005State Policy-maximum percentage 10% 10% 10%
Actual results condition assessment 15% 4% 3%
Percentage of substandard bridgesCondition Level of the Bridges
2010 2009 2008 2007 2006Estimated 181,054$ 124,926$ 155,051$ 243,191$ 207,751$
Actual 151,448 121,798 146,507 218,923 196,080
Maintenance and Preservation Costs(Expressed in Thousands)

89
Terribles Town 250 Off Road RaceJean, NVPhoto Courtesy of Nevada Commission on Tourism

90
Fishing at Wildhorse Reservoir, NVPhoto Courtesy of Nevada Department of Wildlife

91
Combining StatementS and SCheduleS
Fishing at Wildhorse Reservoir, NVPhoto Courtesy of Nevada Department of Wildlife

92
NoNmajor GoverNmeNtal FuNdsNonmajor Special Revenue Funds
Employment Security Accounts for the administration of employment training programs (NRS 612.607), unemployment compensation claims (NRS 612.605), and employment security laws (NRS 612.615).
Regulatory Accounts for receipts and expenditures related to enforcement of regulations on manufactured housing (NRS 489.491), enforcement of regulations pursuant to dairy products (NRS 584.053), legal judgments against real estate licensees (NRS 645.842), regulation of transportation services (NRS 706.1516), regulation of public utilities (NRS 703.147), and regulation of taxicabs (NRS 706.8825).
Legislative Accounts for the necessary expenditures of the Legislature and Legislative Counsel Bureau (NRS 218.085).
Higher Education Capital Construction Accounts for the first $5,000,000 and 20% of the remaining annual slot machine tax, which is designated for capital construction and payment of principal and interest of construction bonds for higher education (NRS 463.385).
Cleaning Up Petroleum Discharges Accounts for fees collected and claims paid related to the use, storage or discharge of petroleum (NRS 590.830).
Hospital Care to Indigent Persons Accounts for taxes levied to provide care to indigent persons hospitalized from motor vehicle accidents, and for taxes received and payments to counties for supplemental medical assistance to indigent persons (NRS 428.175).
Tourism Promotion Accounts for room taxes and other monies designated for the support of the Commission on Tourism (NRS 231.250).
Offenders’ Store Accounts for operations of the general merchandise stores and snack bars used by offenders. Earnings, except interest, must be expended for the welfare and benefit of all offenders (NRS 209.221).
Tobacco Settlement Accounts for proceeds from settlement agreements with and civil actions against manufacturers of tobacco products, forty percent of which is allocated to the Millennium Scholarship fund for the purpose of increasing the number of State residents who enroll in and attend a university or community college of the Nevada System of Higher Education (NRS 396.926); fifty percent of which is allocated to the Healthy Nevada fund (NRS 439.620) and ten percent of which is allocated to the Public Health Trust fund, for the purpose of assisting Nevada residents in obtaining and maintaining good health (NRS 439.605).
Contingency Accounts for funds appropriated by the Legislature for contingencies. Funds can be allocated to State agencies and officers by the Interim Finance Committee upon recommendation of the Board of Examiners (NRS 353.266).
Care of Sites for Radioactive Waste Disposal Accounts for receipts for the care of sites for the disposal of radioactive waste (NRS 459.231).
Gift Accounts for gifts and grants received by the Commission for the Preservation of Wild Horses (NRS 504.450), the Department of Conservation and Natural Resources (NRS 232.070), the State Board of Education (NRS 385.095), the State Library and Archives (NRS 378.090), the Division of State Parks (NRS 407.075), the Rehabilitation Division of the Department of Employment, Training and Rehabilitation (NRS 232.960), and the Department of Human Resources (NRS 232.355).
Natural Resources Accounts for grants to publicly owned water systems for water conservation and capital improvements (NRS 349.952).
NV Real Property Corp General Fund Accounts for the general fund activity of the Nevada Real Property Corporation, a blended component unit incorporated to finance certain construction projects.
Stabilization Accounts for funds appropriated by the Legislature to be expended only if actual revenues for the biennium fall short by 5% or more from anticipated revenues, or the Legislature and Governor declare that a fiscal emergency exists (NRS 353.288).

93
Miscellaneous Accounts for receipts and expenditures related to compensation of victims of crime (NRS 217.260); fees related to private investigators and recoveries for unfair trade practices (NRS 228.096); prosecution of racketeering (NRS 207.415); the office of advocate for customers of public utilities (NRS 228.310); and administration of capital improvement projects (NRS 341.146). It also accounts for private money received by the Division of Museums and History for the Dedicated Trust Fund (NRS 381.0031); loans for farm projects (NRS 561.405); fees collected from owners of mobile home parks to provide mobile home lot rent assistance to low-income mobile home owners (NRS 118B.215); and funding of school improvement programs approved by the Legislature or Interim Finance Committee (NRS 387.032).
Nonmajor Debt Service Fund
Highway Revenue Bonds Accumulates monies for the payment of principal and interest on highway revenue bonds of the State (NRS 349.300).
Nonmajor Capital Projects Funds
Parks Capital Project Construction Accounts for the parks improvements program for the Division of State Parks of the Department of Conservation and Natural Resources (NRS 407.065).
Capital Improvement Program - Motor Vehicle Accounts for capital improvement projects for the Department of Motor Vehicles and Public Safety (NRS 341.146).
Capital Improvement Program - Human Resources Accounts for capital improvement projects for the Department of Human Resources (NRS 341.146).
Capital Improvement Program - University System Accounts for capital improvement projects for the Nevada System of Higher Education (NRS 341.146).
Capital Improvement Program - General State Government Accounts for capital improvement projects for general government (NRS 341.146).
Capital Improvement Program - Prison System Accounts for capital improvement projects for the Department of Corrections (NRS 341.146).
Capital Improvement Program - Military Accounts for capital improvement projects for the Department of Military (NRS 341.146).
Capital Improvement Program - Wildlife Accounts for capital improvement projects for the Department of Wildlife (NRS 341.146).
Nonmajor Permanent Funds
Permanent School Fund Accounts for certain property and the proceeds derived from such property, escheated estates, and all fines collected under penal laws of the State, which become permanent assets of the fund. Earnings on the assets are to be used for education (State Constitution, Article 11, Section 3).
Henry Wood Christmas Fund Accounts for the bequest of the late Henry Wood to provide Christmas gifts to orphans.

94
NEVADA
Special Revenue
Funds
Highway Revenue
Bonds Debt Service
Capital Projects Funds
Permanent Funds
Total Nonmajor Governmental
FundsAssetsCash and pooled investments: Cash with treasurer 137,677,946$ 35,840,820$ 163,818,916$ 8,814,653$ 346,152,335$ Cash in custody of other officials 122,570 - - 43,015,079 43,137,649
Investments 6,028,740 - - 253,054,710 259,083,450
Receivables: Accounts receivable 21,634,031 - - - 21,634,031 Taxes receivable 5,733,304 - - - 5,733,304 Intergovernmental receivables 8,275,634 - 657,736 497,203 9,430,573 Accrued interest and dividends 2,129 - - 1,341,121 1,343,250 Notes/loans receivable 23,069 - - - 23,069 Other receivables 1,000 - - - 1,000
Due from other funds 64,097,736 1 1,826,341 154,604 66,078,682Due from fiduciary funds 422,492 - - - 422,492Due from component units 55 - 85,945 - 86,000Inventory 1,125,257 - - - 1,125,257Prepaid items 98,629 - - - 98,629 Total assets 245,242,592$ 35,840,821$ 166,388,938$ 306,877,370$ 754,349,721$
Liabilities and Fund Balances:Accounts payable and accruals: Accounts payable 12,063,062$ -$ 95,145$ -$ 12,158,207$ Accrued payroll and related liabilities 3,868,250 - - - 3,868,250 Intergovernmental payables 1,979,095 - 11,722 - 1,990,817
Contracts payable - - 4,698,348 - 4,698,348Retention payable - - 7,819,616 - 7,819,616Due to other funds 23,611,424 - 13,345,510 6,583,737 43,540,671Due to fiduciary funds 128,588 - - - 128,588Due to component units 442,448 - 58,367,705 - 58,810,153Deferred revenues 21,278,591 - 143,479 307 21,422,377Other liabilities - - - 553,932 553,932 Total liabilities 63,371,458 - 84,481,525 7,137,976 154,990,959
Fund balances:Reserved for: Encumbrances and contracts 578,923 - 21,964,150 - 22,543,073 Inventories 1,125,257 - - - 1,125,257 Funds held as permanent investments 199,915 - - 299,719,217 299,919,132 Fiscal emergency 41,321,014 - - - 41,321,014 Debt service - 35,840,821 - - 35,840,821 Other 3,383,938 - - - 3,383,938Unreserved: Designated: Approved capital projects - - 59,943,263 - 59,943,263 Other 1,200,000 - - - 1,200,000 Undesignated 134,062,087 - - 20,177 134,082,264 Total fund balances 181,871,134 35,840,821 81,907,413 299,739,394 599,358,762 Total liabilities and fund balances 245,242,592$ 35,840,821$ 166,388,938$ 306,877,370$ 754,349,721$
Combining Balance SheetNonmajor Governmental Funds
June 30, 2010
Assets
Liabilities and Fund Balances

95
NEVADA
Special Revenue
Funds
Highway Revenue
Bonds Debt Service
Capital Projects Funds
Permanent Funds
Total Nonmajor Governmental
FundsRevenuesGaming taxes, fees, licenses 14,678,019$ -$ -$ -$ 14,678,019$ Property and transfer taxes 26,848,669 - - - 26,848,669Motor and special fuel taxes - 89,297,677 - - 89,297,677Other taxes 40,133,870 - - - 40,133,870Intergovernmental 96,776,741 - 2,858,984 - 99,635,725Licenses, fees and permits 31,356,427 - - - 31,356,427Sales and charges for services 16,628,028 - - - 16,628,028Interest and investment income 1,402,171 - 530 7,920,230 9,322,931Tobacco settlement income 41,962,948 - - - 41,962,948Land sales - - - 964,965 964,965Other 6,760,446 - 8,342 7,250,543 14,019,331 Total revenues 276,547,319 89,297,677 2,867,856 16,135,738 384,848,590
ExpendituresCurrent: General government 46,251,608 - - - 46,251,608 Health and social services 116,958,029 - - - 116,958,029 Education and support services 484,527 - - - 484,527 Law, justice and public safety 16,325,234 - - - 16,325,234 Regulation of business 22,260,041 - - - 22,260,041 Recreation, resource development 22,665,407 - - - 22,665,407
Intergovernmental 38,147,805 - 38,677,752 - 76,825,557Capital outlay - - 59,520,431 - 59,520,431
Debt service: Principal 189,265 54,040,000 - - 54,229,265 Interest, fiscal charges 236,725 33,875,760 - - 34,112,485 Debt issuance costs 250,063 - 535,876 - 785,939 Total expenditures 263,768,704 87,915,760 98,734,059 - 450,418,523 Excess (deficiency) of revenues over expenditures 12,778,615 1,381,917 (95,866,203) 16,135,738 (65,569,933)
Other Financing Sources (Uses)Sale of general obligation bonds 17,828,580 - 74,842,257 - 92,670,837Premium on general obligation bonds 502,771 - 596,131 - 1,098,902Sale of refunding certificates of participation 7,900,000 - - - 7,900,000Premium on certificates of participation 742,775 - - - 742,775Payment to refunded certificates of participation agent (8,465,569) - - - (8,465,569)Sale of capital assets 5,315 - - - 5,315Transfers in 112,453,531 - 4,855,710 - 117,309,241Transfers out (149,337,380) - (10,912,067) (7,945,788) (168,195,235) Total other financing sources (uses) (18,369,977) - 69,382,031 (7,945,788) 43,066,266Net change in fund balances (5,591,362) 1,381,917 (26,484,172) 8,189,950 (22,503,667)Fund balances, July 1 187,462,496 34,458,904 108,391,585 291,549,444 621,862,429Fund balances, June 30 181,871,134$ 35,840,821$ 81,907,413$ 299,739,394$ 599,358,762$
Combining Statement of Revenues, Expenditures and Changes in Fund BalancesNonmajor Governmental Funds
For the Fiscal Year Ended June 30, 2010
Revenues
Expenditures
Other Financing Sources (Uses)

96
Employment Security Regulatory Legislative
Higher Education
Capital Construction
Cleaning Up Petroleum Discharges
AssetsCash and pooled investments: Cash with treasurer 5,771,216$ 8,784,456$ 9,261,654$ 3,121,204$ 8,364,247$ Cash in custody of other officials 125 2,750 64,511 - -
Investments - - - - -
Receivables: Accounts receivable 238,592 903,987 73,772 - 300 Taxes receivable 2,262,641 - - - - Intergovernmental receivables 7,581,267 10,541 - - - Accrued interest and dividends - - - - - Notes/loans receivable - - - - - Other receivables - - - - -
Due from other funds 1,415,481 78,374 58,676 12,614,001 28,102Due from fiduciary funds - - - - -Due from component units - - 55 - -Inventory - - 633,939 - -Prepaid items - 88,575 10,054 - - Total assets 17,269,322$ 9,868,683$ 10,102,661$ 15,735,205$ 8,392,649$
Liabilities and Fund Balances:Accounts payable and accruals: Accounts payable 2,132,065$ 122,715$ 312,080$ 10,750$ 95$ Accrued payroll and related liabilities 1,791,744 776,242 700,790 - 327 Intergovernmental payables 9,309 - 2,882 - -
Due to other funds 2,263,844 312,515 14,113 5,011,000 76,685Due to fiduciary funds 2,899 49 118,577 - -Due to component units 414,717 2,500 - - -Deferred revenues 1,621 1,016,044 - - 4,069 Total liabilities 6,616,199 2,230,065 1,148,442 5,021,750 81,176
Fund balances:Reserved for: Encumbrances and contracts 212,565 70,632 201,361 - - Inventories - - 633,939 - - Funds held as permanent investments - - - - - Fiscal emergency - - - - - Other - 88,575 992,260 - -Unreserved: Designated: Other - - 1,200,000 - - Undesignated 10,440,558 7,479,411 5,926,659 10,713,455 8,311,473 Total fund balances 10,653,123 7,638,618 8,954,219 10,713,455 8,311,473 Total liabilities and fund balances 17,269,322$ 9,868,683$ 10,102,661$ 15,735,205$ 8,392,649$
Combining Balance SheetNonmajor Special Revenue Funds
June 30, 2010
Assets
Liabilities and Fund Balances

97
NEVADAPage 1 of 2
Hospital Care to Indigent
PersonsTourism
PromotionOffenders'
StoreTobacco
Settlement Contingency
Care of Sites for
Radioactive Waste
Disposal Gift
2,269,671$ 2,832,204$ 4,077,485$ 24,837,405$ 20,500,421$ 500,254$ 2,737,982$ - - - - - - 22,604
- - - - - - 138,432
- 10,005 779,133 19,539,837 - 37,026 2451,027,959 2,442,704 - - - - -
- - - - - - 79,230- - - - - - 960- - - - - - -- - - - - - 1,000
79,054 200,105 29,725 2,841,346 441,565 344 9,230- - 400,241 - - - -- - - - - - -- - 304,687 - - - -- - - - - - -
3,376,684$ 5,485,018$ 5,591,271$ 47,218,588$ 20,941,986$ 537,624$ 2,989,683$
-$ 1,578,953$ 371,097$ 251,604$ 13,050$ 4,084$ 33,700$ - 79,908 144,638 25,372 - - 27,305
1,387,431 219,869 - 108,733 - - 239,540
1,921,160 509,100 663,931 1,999,559 10,425,836 4,745 5,195- - 6,618 - 410 - -- - - 25,231 - - -
4,149 6 505,964 19,514,772 - 53 1,1923,312,740 2,387,836 1,692,248 21,925,271 10,439,296 8,882 306,932
- 24,745 48,115 5,762 - - 6,500- - 304,687 - - - -- - - - - - -- - - - - - -- - - - 2,280,034 - -
- - - - - - -63,944 3,072,437 3,546,221 25,287,555 8,222,656 528,742 2,676,25163,944 3,097,182 3,899,023 25,293,317 10,502,690 528,742 2,682,751
3,376,684$ 5,485,018$ 5,591,271$ 47,218,588$ 20,941,986$ 537,624$ 2,989,683$

98
NEVADA
Natural Resources
NV Real Property
Corp General Fund Stabilization Miscellaneous
Total Nonmajor Special Revenue
FundsAssetsCash and pooled investments: Cash with treasurer 30,897,522$ -$ 2,995,504$ 10,726,721$ 137,677,946$ Cash in custody of other officials - - - 32,580 122,570
Investments - 4,837,298 - 1,053,010 6,028,740
Receivables: Accounts receivable - - - 51,134 21,634,031 Taxes receivable - - - - 5,733,304 Intergovernmental receivables - - - 604,596 8,275,634 Accrued interest and dividends - - - 1,169 2,129 Notes/loans receivable - - - 23,069 23,069 Other receivables - - - - 1,000
Due from other funds 4,715,844 - 41,327,791 258,098 64,097,736Due from fiduciary funds - - - 22,251 422,492Due from component units - - - - 55Inventory - - - 186,631 1,125,257Prepaid items - - - - 98,629 Total assets 35,613,366$ 4,837,298$ 44,323,295$ 12,959,259$ 245,242,592$
Liabilities and Fund Balances:Accounts payable and accruals: Accounts payable 79,617$ -$ 295$ 7,152,957$ 12,063,062$ Accrued payroll and related liabilities - - - 321,924 3,868,250 Intergovernmental payables 11,331 - - - 1,979,095
Due to other funds 192,749 - - 210,992 23,611,424Due to fiduciary funds - - - 35 128,588Due to component units - - - - 442,448Deferred revenues 14,200 - 1,052 215,469 21,278,591 Total liabilities 297,897 - 1,347 7,901,377 63,371,458
Fund balances:Reserved for: Encumbrances and contracts - - - 9,243 578,923 Inventories - - - 186,631 1,125,257 Funds held as permanent investments - - - 199,915 199,915 Fiscal emergency - - 41,321,014 - 41,321,014 Other - - - 23,069 3,383,938Unreserved: Designated: Other - - - - 1,200,000 Undesignated 35,315,469 4,837,298 3,000,934 4,639,024 134,062,087 Total fund balances 35,315,469 4,837,298 44,321,948 5,057,882 181,871,134 Total liabilities and fund balances 35,613,366$ 4,837,298$ 44,323,295$ 12,959,259$ 245,242,592$
Combining Balance SheetNonmajor Special Revenue Funds
June 30, 2010 Page 2 of 2
Assets
Liabilities and Fund Balances

99
Mountaineering Ruby Mountains, NVPhoto Courtesy of Nevada Commission on Tourism

100
Employment Security Regulatory Legislative
Higher Education
Capital Construction
Cleaning Up
Petroleum Discharges
RevenuesGaming taxes, fees, licenses -$ -$ -$ 14,678,019$ -$ Property and transfer taxes - - - - -Other taxes 9,899,256 57,064 - - 12,232,085Intergovernmental 90,661,147 571,611 - 2,500,000 -Licenses, fees and permits 325,868 18,465,653 - - 415,500Sales and charges for services 1,067,327 6,350 779,225 - -Interest and investment income 176,699 14,051 - - 2,961Tobacco settlement income - - - - -Other 1,417,250 544,650 122,886 - - Total revenues 103,547,547 19,659,379 902,111 17,178,019 12,650,546
ExpendituresCurrent: General government - - 30,057,123 - - Health and social services 108,477,546 - - - - Education and support services - - - - - Law, justice and public safety - - - - - Regulation of business - 21,900,207 - - - Recreation, resource development - - - - 8,721,181
Intergovernmental - - - - 449,213
Debt service: Principal - - 185,407 - - Interest - - 236,062 650 - Debt issuance costs - - - - - Total expenditures 108,477,546 21,900,207 30,478,592 650 9,170,394 Excess (deficiency) of revenues over expenditures (4,929,999) (2,240,828) (29,576,481) 17,177,369 3,480,152
Other Financing Sources (Uses)Sale of general obligation bonds - - - - -Premium on general obligation bonds - - - - -Sale of refunding certificates of participation - - - - -Premium on certificates of participation - - - - -Payment to refunded certificates of participation agent - - - - -Sale of capital assets 495 4,160 - - -Transfers in 6,406,961 2,729,102 30,123,309 - -Transfers out (8,141,650) (2,439,083) (182,479) (12,904,438) (1,946,156) Total other financing sources (uses) (1,734,194) 294,179 29,940,830 (12,904,438) (1,946,156)Net change in fund balances (6,664,193) (1,946,649) 364,349 4,272,931 1,533,996Fund balances, July 1 17,317,316 9,585,267 8,589,870 6,440,524 6,777,477Fund balances, June 30 10,653,123$ 7,638,618$ 8,954,219$ 10,713,455$ 8,311,473$
Combining Statement of Revenues, Expenditures and Changes in Fund BalancesNonmajor Special Revenue Funds
Revenues
Expenditures
For the Fiscal Year Ended June 30, 2010
Other Financing Sources (Uses)

101
NEVADAPage 1 of 2
Hospital Care to Indigent Persons
Tourism Promotion
Offenders' Store
Tobacco Settlement Contingency
Care of Sites for Radioactive
Waste Disposal Gift
-$ -$ -$ -$ -$ -$ -$ 26,848,669 - - - - - -
- 13,835,453 - - - - -- - - - - - -- 8,205 - - - 128,556 1,066,399- - 14,261,579 - - - 1,698
83,462 286 51,401 283,477 - 196,806 48,639- - - 41,962,948 - - -- 16,444 38,800 15,251 - - 216,809
26,932,131 13,860,388 14,351,780 42,261,676 - 325,362 1,333,545
- - - 366,723 149,099 - -100,001 - - 7,906,928 - 15,513 458,041
- - - - - - 11,091- - 12,390,801 - - - -- - - - - - -- 9,824,278 - - - - 174,302
1,387,431 - - 26,677,607 - - 1,013,016
- - 3,858 - - - -- - 13 - - - -- - - - - - -
1,487,432 9,824,278 12,394,672 34,951,258 149,099 15,513 1,656,450
25,444,699 4,036,110 1,957,108 7,310,418 (149,099) 309,849 (322,905)
- - - - - - -- - - - - - -- - - - - - -- - - - - - -- - - - - - -- - - - - - -
52,317 73,127 4,122 3,232,443 27,151,987 - 483(25,467,492) (3,754,590) (3,544,882) (35,132,288) (36,907,078) (9,069,731) (4,858)(25,415,175) (3,681,463) (3,540,760) (31,899,845) (9,755,091) (9,069,731) (4,375)
29,524 354,647 (1,583,652) (24,589,427) (9,904,190) (8,759,882) (327,280)34,420 2,742,535 5,482,675 49,882,744 20,406,880 9,288,624 3,010,03163,944$ 3,097,182$ 3,899,023$ 25,293,317$ 10,502,690$ 528,742$ 2,682,751$

102
NEVADA
Natural Resources
NV Real Property
Corp General
Fund Stabilization Miscellaneous
Total Nonmajor
Special Revenue
FundsRevenuesGaming taxes, fees, licenses -$ -$ -$ -$ 14,678,019$ Property and transfer taxes - - - - 26,848,669Other taxes - - - 4,110,012 40,133,870Intergovernmental 414,710 - - 2,629,273 96,776,741Licenses, fees and permits - - - 10,946,246 31,356,427Sales and charges for services - - - 511,849 16,628,028Interest and investment income 90,608 204,020 98,075 151,686 1,402,171Tobacco settlement income - - - - 41,962,948Other - 2,757,166 32,198 1,598,992 6,760,446 Total revenues 505,318 2,961,186 130,273 19,948,058 276,547,319
ExpendituresCurrent: General government - 398 - 15,678,265 46,251,608 Health and social services - - - - 116,958,029 Education and support services - - - 473,436 484,527 Law, justice and public safety - - - 3,934,433 16,325,234 Regulation of business - - - 359,834 22,260,041 Recreation, resource development 3,945,647 - - - 22,665,408
Intergovernmental 8,620,538 - - - 38,147,805
Debt service: Principal - - - - 189,265 Interest - - - - 236,725 Debt issuance costs 101,928 148,135 - - 250,063 Total expenditures 12,668,113 148,533 - 20,445,968 263,768,705 Excess (deficiency) of revenues over expenditures (12,162,795) 2,812,653 130,273 (497,910) 12,778,614
Other Financing Sources (Uses)Sale of general obligation bonds 17,828,580 - - - 17,828,580Premium on general obligation bonds 502,771 - - - 502,771Sale of refunding certificates of participation - 7,900,000 - - 7,900,000Premium on certificates of participation - 742,775 - - 742,775Payment to refunded certificates of participation agent - (8,465,569) - - (8,465,569)Sale of capital assets - - 660 - 5,315Transfers in - - 41,447,517 1,232,163 112,453,531Transfers out (750,677) (2,931,719) (5,187,114) (973,144) (149,337,379) Total other financing sources (uses) 17,580,674 (2,754,513) 36,261,063 259,019 (18,369,976)Net change in fund balances 5,417,879 58,140 36,391,336 (238,891) (5,591,362)Fund balances, July 1 29,897,590 4,779,158 7,930,612 5,296,773 187,462,496Fund balances, June 30 35,315,469$ 4,837,298$ 44,321,948$ 5,057,882$ 181,871,134$
Combining Statement of Revenues, Expenditures and Changes in Fund BalancesNonmajor Special Revenue Funds
Revenues
Expenditures
For the Fiscal Year Ended June 30, 2010
Other Financing Sources (Uses)
Page 2 of 2

103
Viking Boatsman Cave Lake, NVPhoto Courtesy of Nevada Commission on Tourism

104
Parks Capital Project
ConstructionCIP Motor
VehicleCIP Human Resources
CIP University
System
CIP General State
GovernmentCIP Prison
SystemAssetsCash and pooled investments: Cash with treasurer 112,866$ 675,596$ 17,854,995$ 67,457,967$ 27,495,416$ 31,829,384$ Cash in custody of other officials - - - - - -
Investments - - - - - -
Receivables: Intergovernmental receivables - - - - - - Accrued interest and dividends - - - - - -
Due from other funds 10,917 239,060 - 1,383,991 15,026 -Due from component units - - - - 85,945 - Total assets 123,783$ 914,656$ 17,854,995$ 68,841,958$ 27,596,387$ 31,829,384$
Liabilities and Fund BalancesAccounts payable and accruals: Accounts payable 113$ 4,510$ 8$ 12,649$ 5,978$ 49,363$ Intergovernmental payables - - - - - 166
Contracts payable - 232,363 165,398 2,128,445 466,048 1,352,978Retentions payable - 75,986 5,758 4,354,889 168,304 3,103,100Due to other funds 123,670 7,870 111,084 3,838,954 4,480,724 3,643,259Due to component units - - - 58,363,542 - -Deferred revenues - - - 143,479 - -Other liabilities - - - - - -
Total liabilities 123,783 320,729 282,248 68,841,958 5,121,054 8,148,866
Fund balances:Reserved: Encumbrances and contracts - 151,374 1,704,536 - 10,821,485 5,150,719 Funds held as permanent investments - - - - - -Unreserved: Designated for approved capital projects - 442,553 15,868,211 - 11,653,848 18,529,799 Undesignated - - - - - -
Total fund balances - 593,927 17,572,747 - 22,475,333 23,680,518 Total liabilities and fund balances 123,783$ 914,656$ 17,854,995$ 68,841,958$ 27,596,387$ 31,829,384$
Capital Projects Funds
Combining Balance SheetOther Nonmajor Governmental Funds
Assets
Liabilities and Fund Balances
June 30, 2010

105
NEVADA
CIP Military CIP Wildlife TotalPermanent
School Fund
Henry Wood Christmas
Fund Total
18,259,543$ 133,149$ 163,818,916$ 8,764,116$ 50,537$ 8,814,653$ - - - 43,015,079 - 43,015,079
- - - 253,054,710 - 253,054,710
644,864 12,872 657,736 497,203 - 497,203- - - 1,341,121 - 1,341,121
34,971 142,376 1,826,341 154,458 146 154,604- - 85,945 - - -
18,939,378$ 288,397$ 166,388,938$ 306,826,687$ 50,683$ 306,877,370$
3,311$ 19,213$ 95,145$ -$ -$ -$ - 11,556 11,722 - - -
313,555 39,561 4,698,348 - - -111,579 - 7,819,616 - - -
1,132,179 7,770 13,345,510 6,583,254 483 6,583,737- 4,163 58,367,705 - - -- - 143,479 284 23 307- - - 553,932 - 553,932
1,560,624 82,263 84,481,525 7,137,470 506 7,137,976
3,929,902 206,134 21,964,150 - - -- - - 299,689,217 30,000 299,719,217
13,448,852 - 59,943,263 - - -- - - - 20,177 20,177
17,378,754 206,134 81,907,413 299,689,217 50,177 299,739,39418,939,378$ 288,397$ 166,388,938$ 306,826,687$ 50,683$ 306,877,370$
Capital Projects Funds Permanent Funds

106
Parks Capital Project
ConstructionCIP Motor
VehicleCIP Human Resources
CIP University
System
CIP General State
GovernmentCIP Prison
SystemRevenuesIntergovernmental -$ -$ -$ -$ -$ -$ Interest and investment income 530 - - - - -Land sales - - - - - -Other 8,342 - - - - -
Total revenues 8,872 - - - - -
ExpendituresCurrent:Intergovernmental - 2,406,872 - 36,270,880 - -
Capital outlay 136,719 10,128,130 1,959,996 - 6,234,924 34,220,777
Debt service: Debt issuance costs - - 15,153 262,624 131,755 40,438
Total expenditures 136,719 12,535,002 1,975,149 36,533,504 6,366,679 34,261,215 Excess (deficiency) of revenues over expenditures (127,847) (12,535,002) (1,975,149) (36,533,504) (6,366,679) (34,261,215)
Other Financing Sources (Uses)Sale of general obligation bonds - - 2,157,417 35,937,373 18,758,982 5,757,444Premium on general obligation bonds - - - 596,131 - -Transfers in 119,768 498,639 - - 452,958 933,638Transfers out - (23,904) (96,171) - (5,051,188) (3,625,609)
Total other financing sources (uses) 119,768 474,735 2,061,246 36,533,504 14,160,752 3,065,473Net change in fund balances (8,079) (12,060,267) 86,097 - 7,794,073 (31,195,742)Fund balances, July 1 8,079 12,654,194 17,486,650 - 14,681,260 54,876,260Fund balances, June 30 -$ 593,927$ 17,572,747$ -$ 22,475,333$ 23,680,518$
Capital Projects Funds
Combining Statement of Revenues, Expenditures and Changes in Fund BalancesOther Nonmajor Governmental Funds
Revenues
Expenditures
For the Fiscal Year Ended June 30, 2010
Other Financing Sources (Uses)

107
NEVADA
CIP Military CIP Wildlife TotalPermanent
School Fund
Henry Wood
Christmas Fund Total
2,731,948$ 127,036$ 2,858,984$ -$ -$ -$ - - 530 7,920,044 186 7,920,230- - - 964,965 - 964,965- - 8,342 7,250,543 - 7,250,543
2,731,948 127,036 2,867,856 16,135,552 186 16,135,738
- - 38,677,752 - - -
4,001,886 2,837,999 59,520,431 - - -
85,906 - 535,876 - - -
4,087,792 2,837,999 98,734,059 - - -
(1,355,844) (2,710,963) (95,866,203) 16,135,552 186 16,135,738
12,231,041 - 74,842,257 - - -- - 596,131 - - -
318,230 2,532,477 4,855,710 - - -(2,074,536) (40,659) (10,912,067) (7,945,305) (483) (7,945,788)
10,474,735 2,491,818 69,382,031 (7,945,305) (483) (7,945,788)9,118,891 (219,145) (26,484,172) 8,190,247 (297) 8,189,9508,259,863 425,279 108,391,585 291,498,970 50,474 291,549,444
17,378,754$ 206,134$ 81,907,413$ 299,689,217$ 50,177$ 299,739,394$
Capital Projects Funds Permanent Funds

108
Final Budget Actual Variance
GENERAL FUND UNBUDGETED ACTIVITY -$ 1,345,197$ (1,345,197)$ CONSTITUTIONAL AGENCIESExecutive BranchOffice of the Governor 2,510,434 2,475,276 35,158State Fiscal Stabilization 256,956,692 256,956,690 2Governor's Mansion Maintenance 274,208 253,617 20,591Governor's Office of Consumer Health Assistance 967,535 781,734 185,801Governor's Office Homeland Security 2,887,112 2,079,947 807,165Governor's Washington Office 247,079 247,079 -Ethics Commission 634,983 621,836 13,147High Level Nuclear Waste 2,112,825 2,050,149 62,676Petroleum Overcharge Rebate 186,718 76,652 110,066Governor's Office Energy Conservation 48,192,075 11,804,222 36,387,853Lieutenant Governor 561,623 534,457 27,166Attorney General Administrative Account 24,678,994 23,931,994 747,000Attorney General Extradition Coordinator 635,962 635,961 1Attorney General Special Fund 7,025,848 3,388,984 3,636,864Attorney General Workers' Compensation Fraud 4,312,324 3,613,294 699,030Attorney General Crime Prevention 277,830 275,902 1,928Attorney General Medicaid Fraud 4,625,530 1,824,462 2,801,068Attorney General Violence Against Women Grants 3,849,813 1,988,320 1,861,493Attorney General Council For Prosecuting Attorneys 294,569 195,716 98,853Attorney General Victims of Domestic Violence 1,033,846 234,254 799,592Private Investigators Licensing Board 1,038,202 885,150 153,052Secretary of State 17,094,154 13,949,686 3,144,468Secretary of State HAVA Election Reform 7,975,529 1,457,062 6,518,467Secretary of State Advisory Committee Gift 61 - 61Notary Training 359,814 162,188 197,626State Treasurer 2,546,968 2,408,847 138,121Silicosis and Disabled Pensions 348,542 59,334 289,208Nevada College Savings Trust 816,208 576,833 239,375Endowment Account 10,419,813 8,383,626 2,036,187College Savings Private Entity 183,248 33,106 150,142Unclaimed Property 2,457,396 1,933,278 524,118Controller's Office 4,554,149 4,426,635 127,514Debt Recovery 430,000 1,022 428,978Judicial BranchAdministrative Office of the Courts 4,855,274 3,246,295 1,608,979Divison of Planning and Analysis 1,622,115 1,151,537 470,578Uniform System of Judicial Records 3,674,899 1,693,039 1,981,860Judicial Education 3,050,412 1,815,675 1,234,737District Judges' Salary 16,648,614 16,600,444 48,170Judicial Travel and Support 650,637 190,834 459,803District Judge/Surviving Spouse Pension 1,788,200 1,788,200 -Supreme Court 13,048,382 12,738,700 309,682Specialty Court 8,381,870 6,203,417 2,178,453Senior Justice and Senior Judge Program 1,511,778 1,460,665 51,113Judicial Selection 3,213 3,212 1Foreclosure Mediation Program 8,043,742 3,404,865 4,638,877Legislative Counsel Bureau Disbursement 2,031,098 19,569 2,011,529So Nevada Community Project Fund 67,162 - 67,162Law Library Gift Fund 79,516 7,112 72,404Law Library 1,637,896 1,637,393 503Judicial Discipline 671,487 525,055 146,432
478,256,379 400,733,325 77,523,054FINANCE AND ADMINISTRATIONAdministrationConstruction Education Account 777,657 343,647 434,010Deferred Compensation Committee 825,629 718,369 107,260Commission For Women 1,504 - 1,504
General Fund Unbudgeted ActivityConstitutional Agencies
Schedule of Total Uses - Budget and Actual, Non-GAAP Budgetary BasisAll General Fund Budgets
For the Fiscal Year Ended June 30, 2010
Finance and Administration
Page 1 of 9

109
NEVADA
Final Budget Actual Variance
Special Appropriations 135,053$ 48,840$ 86,213$ Judicial College/Juvenile and Family Justice 322,050 322,050 -Information Technology Division 640,171 629,934 10,237Information Technology Projects 5,688,543 5,688,542 1Budget and Planning 3,228,655 3,161,614 67,041Division of Internal Audits 1,589,060 1,581,116 7,944Graffiti Reward Fund 12,135 10,908 1,227Merit Award Board 4,151 400 3,751Controlled Substance Grants 5,796 3,796 2,000Commodity Food Program 14,269,764 8,736,962 5,532,802Roof Maintenance Reserve 920,830 44,062 876,768Public Works Administration 260,084 256,941 3,143School Plan Checking 279,772 25,847 253,925Administration - Hearings Division 4,512,177 4,427,267 84,910Stale Claims 5,500,000 3,942,950 1,557,050Emergency Fund 514,179 225,950 288,229Statutory Contingency 3,523,889 1,459,120 2,064,769TaxationDepartment of Taxation 27,785,708 27,509,405 276,303PersonnelState Unemployment Compensation 6,165,939 2,478,623 3,687,316
76,962,746 61,616,343 15,346,403EDUCATIONEducationDrug Abuse Education 1,793,935 908,660 885,275Student Incentive Grants 536,459 535,401 1,058Distributive School Account 1,382,403,878 1,361,639,054 20,764,824School Health Education - AIDS 273,185 212,102 61,083School Remediation 26,457,626 26,221,025 236,601Education State Programs 3,870,645 3,794,549 76,096Educational Trust Fund 49,481 - 49,481Career and Technical Education 10,447,851 8,613,902 1,833,949Gear Up 3,672,093 2,021,511 1,650,582Gear Up Scholarship Trust 11,736,183 458,692 11,277,491Continuing Education 5,813,475 5,517,274 296,201Proficiency Testing 5,959,230 5,284,794 674,436Other State Education Programs 10,315,445 9,977,174 338,271Education Technology Trust 20,844 - 20,844Teacher Education and Licensing 2,195,053 1,337,841 857,212Discretionary Grants - Unrestricted 1,482,194 772,430 709,764Discretionary Grants - Restricted 25,785,983 14,848,177 10,937,806Elementary and Secondary Ed - Title I 182,051,001 95,068,130 86,982,871Elementary and Secondary Ed Titles II, V & VI 37,834,966 27,677,659 10,157,307Individuals with Disabilities (IDEA) 162,535,816 99,525,663 63,010,153Education Staffing Services 1,492,121 1,251,436 240,685Education Support Services 3,741,257 2,644,901 1,096,356Incentives for Licensed Educational Personnel 31,444,244 22,366,247 9,077,997Nutrition Education Programs 93,608,165 90,331,266 3,276,899Commission on Postsecondary Education 417,264 408,737 8,527Student Indemnification Account 755,151 438,422 316,729Cultural AffairsCultural Affairs Administration 867,224 816,490 50,734Lost City Museum 429,475 338,690 90,785LV Springs Preserve Museum Dev 4,004,084 1,379,554 2,624,530Nevada Historical Society 469,804 417,940 51,864State Museum, Carson City 1,403,924 1,352,154 51,770Museums and History 427,808 418,527 9,281
Page 2 of 9
Education

110
Final Budget Actual Variance
Museum and Historical Society - Las Vegas 946,187$ 875,792$ 70,395$ State Railroad Museums 1,666,828 1,099,062 567,766Archives and Records 800,074 690,301 109,773Micrographics and Imaging 558,301 456,821 101,480Nevada State Library 5,957,407 5,629,063 328,344Nevada State Library-Literacy 171,120 149,503 21,617Nevada Humanities 50,000 50,000 -Nevada State Library - CLAN 574,111 276,757 297,354Nevada Arts Council 2,454,696 2,204,507 250,189Cultural Resource Program 5,753,691 2,762,307 2,991,384Historic Preservation 1,912,730 1,218,677 694,053Comstock Historic District 143,061 141,066 1,995Comstock Historical District Gifts 144,611 27,976 116,635Nevada System of Higher EducationSpecial Projects 4,539,064 2,943,075 1,595,989Education for Dependent Children 25,474 15,366 10,108University of Nevada - Reno 176,514,332 174,888,811 1,625,521School of Medical Sciences 32,996,770 32,907,306 89,464Intercollegiate Athletics UNR 5,850,604 5,850,602 2Statewide Programs - UNR 5,746,204 5,746,204 -University System Administration 5,017,186 5,017,186 -University of Nevada Las Vegas 245,055,624 243,254,749 1,800,875Intercollegiate Athletics UNLV 7,749,932 7,749,932 -Agricultural Experiment Station 9,403,998 9,403,998 -Cooperative Extension Service 9,916,661 9,858,239 58,422System Computing Center 19,428,946 19,428,946 -UNLV Law School 12,350,564 12,188,349 162,215National Direct Student Loan Program 42,699 42,699 -University Press 795,751 795,751 -Anatomical Gift 354,790 75,000 279,790Statewide Programs - UNLV 1,281,008 1,281,008 -UNLV Dental School 14,243,483 14,170,585 72,898Business Center North 2,227,906 2,227,906 -Business Center South 1,909,549 1,909,549 -Collegiate License Plate Account 275,355 207,114 68,241Nevada State College at Henderson 16,949,746 16,625,330 324,416Community College of Southern Nevada 131,691,579 131,435,327 256,252Laboratory and Research 1,772,797 1,772,797 -Great Basin College 19,915,246 19,842,495 72,751Desert Research Institute 9,406,565 8,479,604 926,961Western Nevada Community College 23,366,712 23,327,369 39,343Truckee Meadows Community College 48,858,051 48,064,801 793,250WICHE ProgramWICHE Loan and Stipend 1,069,284 1,069,283 1WICHE Administration 314,030 314,030 -
2,844,498,591 2,603,053,645 241,444,946HUMAN SERVICESHealth and Human ServicesAdministration 3,237,406 2,372,335 865,071Grants Management Unit 42,674,875 35,322,928 7,351,947Problem Gambling 2,029,900 1,478,600 551,300State and Community Collaboration 5,864,694 5,083,914 780,780Developmental Disabilities 918,318 697,164 221,154Community Based Services 12,432,582 10,180,558 2,252,024Family to Family Connections 4,392,838 3,985,255 407,583Aging ServicesSenior Sevices Program 8,384,102 6,272,300 2,111,802Aging Older Americans Act 22,985,235 17,503,640 5,481,595Senior Citizens' Property Tax Assistance 5,722,845 5,674,690 48,155
Human Resources
Schedule of Total Uses - Budget and Actual, Non-GAAP Budgetary BasisAll General Fund Budgets
For the Fiscal Year Ended June 30, 2010 Page 3 of 9

111
NEVADAPage 4 of 9
Final Budget Actual Variance
EPS/Homemaker Programs 2,654,311$ 2,367,030$ 287,281$ Health Care Financing and PolicyIntergovernmental Transfer Program 85,357,457 62,212,378 23,145,079Administration 81,783,968 74,522,941 7,261,027HIFA Holding Account 551,234 536,255 14,979Increased Quality of Nursing Care 28,587,337 27,190,358 1,396,979Nevada Check-Up Program 34,571,120 33,639,251 931,869Nevada Medicaid, Title XIX 1,507,115,818 1,454,530,657 52,585,161HIFA Medical 1,529,963 1,480,864 49,099HealthRadiological Health 4,713,595 2,452,087 2,261,508Cancer Control Registry 1,141,790 696,038 445,752Alcoholism and Drug Rehabilitation 30,181,992 25,954,252 4,227,740Vital Statistics 1,681,902 1,481,696 200,206Consumer Health Protection 2,593,700 1,883,463 710,237Office of Minority Health 230,104 180,094 50,010Early Intervention Services 23,097,395 21,988,778 1,108,617Immunization Program 5,486,452 4,661,250 825,202WIC Food Supplement 57,852,967 57,108,316 744,651Sexually Transmitted Disease Control 16,064,641 15,148,692 915,949Health Facilities Hospital Licensing 10,812,499 8,007,670 2,804,829Health Facilities-Admin Penalty 666,083 480,359 185,724Public Health Preparedness Program 28,426,523 22,370,571 6,055,952Communicable Disease Control 9,115,905 5,905,552 3,210,353Maternal Child Health Services 7,760,937 5,179,522 2,581,415Office of Health Administration 5,791,729 4,685,054 1,106,675Community Health Services 4,013,061 3,411,856 601,205Emergency Medical Services 1,126,427 1,065,907 60,520WelfareWelfare Administration 32,323,321 27,679,832 4,643,489Temp Assistance for Needy Families 59,153,699 56,171,051 2,982,648Assistance to Aged and Blind 7,386,983 7,358,000 28,983Welfare Field Services 68,796,735 66,617,011 2,179,724Child Support Enforcement Program 18,291,384 11,676,507 6,614,877Child Support Federal Reimbursement 37,613,933 28,625,298 8,988,635Child Assistance and Development 58,499,719 42,977,574 15,522,145Energy Assistance Program 30,262,259 29,196,806 1,065,453Mental Health and Developmental ServicesSo NV Adult Mental Health Services 93,172,053 88,997,969 4,174,084No NV Adult Mental Health Services 33,947,076 31,683,269 2,263,807Mental Health Information System 1,883,738 1,680,760 202,978Family Preservation Program 2,260,842 2,260,604 238Rural Regional Center 15,743,036 14,933,177 809,859MHDS Administration 8,040,335 7,547,649 492,686Desert Regional Center 80,655,450 77,340,670 3,314,780Sierra Regional Center 34,521,456 32,050,853 2,470,603Facility for the Mental Offender 9,588,672 9,247,624 341,048Alcohol Tax Program 1,135,189 799,896 335,293Rural Clinics 15,646,581 15,056,357 590,224Child and Family ServicesCommunity Juvenile Justice Programs 3,779,105 2,784,513 994,592Washoe County Integration 30,518,014 26,736,141 3,781,873Clark County Integration 80,917,715 77,472,333 3,445,382UNITY/SACWIS 5,436,678 5,251,148 185,530Children, Youth and Family Administration 26,124,586 20,246,882 5,877,704Youth Alternative Placement 3,702,597 3,702,597 -Juvenile Correctional Facility 5,567,678 5,044,400 523,278

112
Final Budget Actual Variance
Child Care Services 1,360,134$ 1,086,434$ 273,700$ Caliente Youth Center 8,135,886 7,767,388 368,498Victims of Domestic Violence 4,582,020 3,583,903 998,117Childrens Trust Account 1,017,739 776,521 241,218Rural Child Welfare 16,074,705 15,840,073 234,632Review of Death of Children 241,625 103,227 138,398Nevada Youth Training Center 10,282,218 9,373,082 909,136Youth Parole Services 6,201,427 5,451,290 750,137Farm Account - Youth Training Center 11,650 - 11,650No NV Child and Adolescent Services 7,049,715 6,146,206 903,509So NV Child and Adolescent Services 24,190,125 22,399,267 1,790,858Employment, Training and RehabilitationBlind Business Enterprise Program 5,610,171 2,189,851 3,420,320Services to the Blind 5,632,525 4,316,736 1,315,789Client Assistance Program 218,884 209,782 9,102Vocational Rehabilitation 21,357,874 16,274,288 5,083,586Rehabilitation Administration 1,407,117 1,230,381 176,736Disability Adjudication 16,333,811 15,588,671 745,140Equal Rights Commission 1,575,989 1,259,990 315,999Administration 4,889,805 4,538,336 351,469Research and Analysis 7,802,845 5,829,894 1,972,951Information Develoment and Processing 9,782,376 8,001,447 1,780,929Other Human ServicesPublic Defender 2,957,904 2,866,281 91,623Indian Affairs Commission 333,707 191,885 141,822
2,983,570,791 2,755,876,129 227,694,662COMMERCE AND INDUSTRYEconomic Development and TourismEconomic Development and Diversification 24,894 24,894 -Commission on Economic Development 5,313,516 4,939,292 374,224Nevada Film Office 1,056,020 759,703 296,317Rural Community Development 6,062,512 5,249,842 812,670Procurement Outreach Program 529,748 503,705 26,043MineralsMinerals 3,387,726 2,154,312 1,233,414Bond Reclamation 6,632,990 788,511 5,844,479AgricultureNevada Beef Council 267,480 258,475 9,005Gas Pollution Standards 726,101 607,773 118,328Weed Abatement and Control 186,062 35,334 150,728Plant Industry 931,612 835,785 95,827Grade and Certification of Ag Products 245,069 104,890 140,179Garlic and Onion Research Promotion 113,943 12,471 101,472Agricultural Registration/Enforcement 3,630,621 3,154,544 476,077Livestock Inspection 1,550,747 1,017,860 532,887Marijuana Health Registry 786,794 400,853 385,941USDA CCC 478,958 101,101 377,857Agriculture License Plates 25,819 13,970 11,849Veterinary Medical Services 1,061,346 1,001,295 60,051Weights and Measures 2,301,547 2,050,536 251,011Noxious Weed and Insect Control 6,213,392 1,540,354 4,673,038Agriculture Administration 1,288,305 1,202,092 86,213Rangeland Resources Commission 257,548 198,718 58,830Morman Cricket and Grasshoppers 1,266,159 462,341 803,818Predatory Animal and Rodent Control 996,338 988,729 7,609Nevada Jr Livestock Show Board 25,861 25,793 68Gaming ControlGaming Control Board 44,322,557 41,790,428 2,532,129
Schedule of Total Uses - Budget and Actual, Non-GAAP Budgetary BasisAll General Fund Budgets
For the Fiscal Year Ended June 30, 2010 Page 5 of 9
Commerce and Industry

113
NEVADA
Final Budget Actual Variance
Gaming Control Federal Forfeiture 762,473$ 4,930$ 757,543$ Gaming Control - Forfeiture Account 558,399 70,050 488,349Gaming Control - Other State Forfeiture 655,189 85,106 570,083Federal Forfeiture Treasury 990,416 4,350 986,066Gaming Commission 392,547 381,750 10,797Business and IndustryBusiness and Industry Administration 1,169,879 1,160,290 9,589Industrial Development Bonds 745,679 303,515 442,164Insurance Regulation 9,541,066 7,284,812 2,256,254Captive Insurers 2,111,002 1,674,012 436,990Insurance Recovery 652,005 584,890 67,115Insurance Education and Research 1,431,707 929,912 501,795Nat. Assoc. of Insurance Commissioners 69,985 16,185 53,800Insurance Cost Stabilization 406,840 167,907 238,933Consumer Affairs Restitution 41,692 41,692 -Consumer Affairs Recovery Acct 26,772 26,771 1Consumer Affairs 264,102 264,100 2Special Housing Assistance 23,521,147 10,728,688 12,792,459Low Income Housing Trust Fund 27,040,854 6,411,058 20,629,796Weatherization 21,479,598 18,851,152 2,628,446Renewable Energy and Energy Efficiency Authority 1,440,000 180,277 1,259,723Employee Management Relations Board 501,855 387,027 114,828Common Interest Communities 4,619,287 2,085,387 2,533,900Real Estate Administration 3,058,340 2,941,345 116,995Athletic Commission 866,438 676,035 190,403Labor Commissioner 1,429,365 1,423,624 5,741Division of Mortgage Lending 5,492,018 3,193,111 2,298,907Attorney for Injured Workers 3,326,779 3,221,341 105,438Financial Institutions Investigations 539,355 40,993 498,362Financial Institutions 6,922,215 3,843,558 3,078,657Financial Institutions Audit 653,350 240,983 412,367
210,394,019 137,448,452 72,945,567PUBLIC SAFETYCorrectionsPrison Medical Care 47,591,148 47,566,019 25,129Director's Office 19,061,068 18,536,090 524,978Correctional Programs 7,169,460 6,572,828 596,632So Nevada Correctional Center 364,572 295,683 68,889Warm Springs Correctional Center 9,158,182 9,144,932 13,250No Nevada Correctional Center 26,073,085 25,361,324 711,761Nevada State Prison 17,474,095 17,447,792 26,303Stewart Conservation Camp 1,812,431 1,805,520 6,911Pioche Conservation Camp 1,539,670 1,502,521 37,149Northern Nevada Restitution Center 1,068,834 1,064,865 3,969Indian Springs Conservation Camp 2,300,727 2,292,721 8,006Southern Desert Correctional Center 21,980,266 21,825,377 154,889Wells Conservation Camp 1,247,467 1,240,294 7,173Humboldt Conservation Camp 1,303,354 1,280,959 22,395Ely Conservation Camp 1,329,803 1,316,245 13,558Jean Conservation Camp 1,562,761 1,539,027 23,734Silver Springs Conservation Camp 17,627 13,444 4,183Ely State Prison 27,138,874 26,910,631 228,243Carlin Conservation Camp 1,199,863 1,193,950 5,913Tonopah Conservation Camp 1,087,562 1,075,059 12,503Lovelock Correctional Center 23,743,506 23,677,908 65,598Southern Nevada Women's Correctional Center 11,796,866 11,688,463 108,403High Desert State Prison 41,642,640 41,212,592 430,048Casa Grande Transitional Housing 4,252,516 4,221,611 30,905
Public Safety
Page 6 of 9
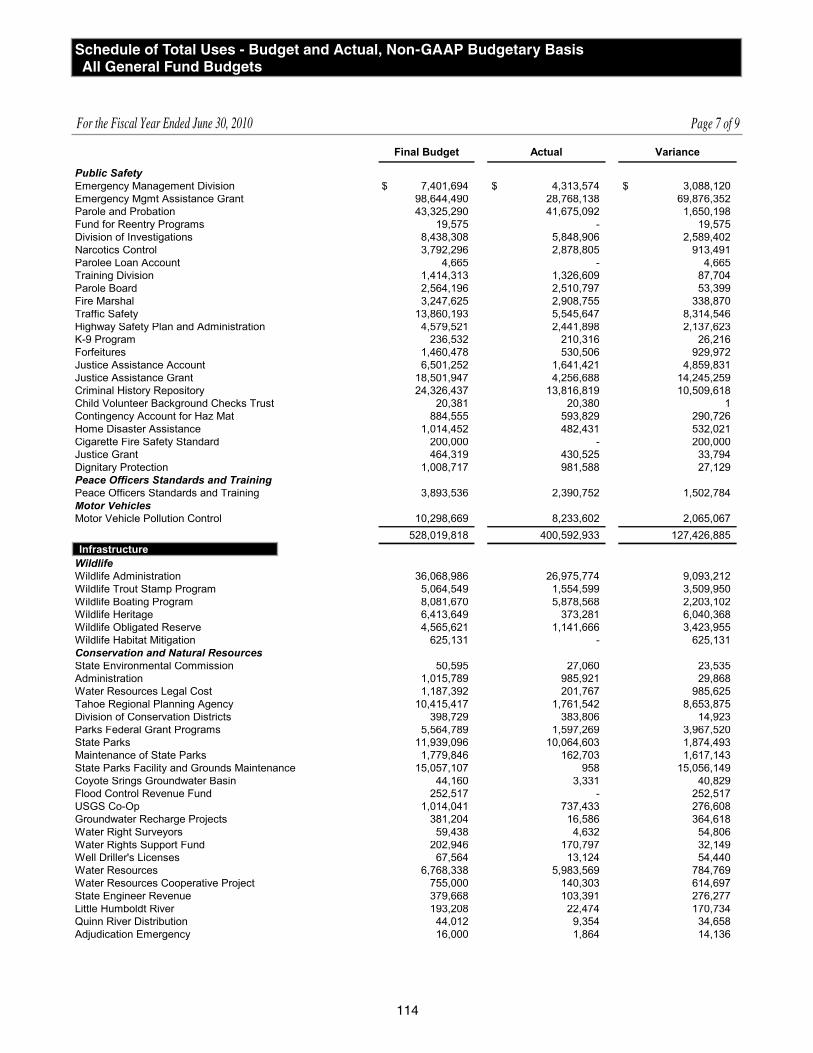
114
Final Budget Actual Variance
Public SafetyEmergency Management Division 7,401,694$ 4,313,574$ 3,088,120$ Emergency Mgmt Assistance Grant 98,644,490 28,768,138 69,876,352Parole and Probation 43,325,290 41,675,092 1,650,198Fund for Reentry Programs 19,575 - 19,575Division of Investigations 8,438,308 5,848,906 2,589,402Narcotics Control 3,792,296 2,878,805 913,491Parolee Loan Account 4,665 - 4,665Training Division 1,414,313 1,326,609 87,704Parole Board 2,564,196 2,510,797 53,399Fire Marshal 3,247,625 2,908,755 338,870Traffic Safety 13,860,193 5,545,647 8,314,546Highway Safety Plan and Administration 4,579,521 2,441,898 2,137,623K-9 Program 236,532 210,316 26,216Forfeitures 1,460,478 530,506 929,972Justice Assistance Account 6,501,252 1,641,421 4,859,831Justice Assistance Grant 18,501,947 4,256,688 14,245,259Criminal History Repository 24,326,437 13,816,819 10,509,618Child Volunteer Background Checks Trust 20,381 20,380 1Contingency Account for Haz Mat 884,555 593,829 290,726Home Disaster Assistance 1,014,452 482,431 532,021Cigarette Fire Safety Standard 200,000 - 200,000Justice Grant 464,319 430,525 33,794Dignitary Protection 1,008,717 981,588 27,129Peace Officers Standards and TrainingPeace Officers Standards and Training 3,893,536 2,390,752 1,502,784Motor VehiclesMotor Vehicle Pollution Control 10,298,669 8,233,602 2,065,067
528,019,818 400,592,933 127,426,885INFRASTRUCTUREWildlifeWildlife Administration 36,068,986 26,975,774 9,093,212Wildlife Trout Stamp Program 5,064,549 1,554,599 3,509,950Wildlife Boating Program 8,081,670 5,878,568 2,203,102Wildlife Heritage 6,413,649 373,281 6,040,368Wildlife Obligated Reserve 4,565,621 1,141,666 3,423,955Wildlife Habitat Mitigation 625,131 - 625,131Conservation and Natural ResourcesState Environmental Commission 50,595 27,060 23,535Administration 1,015,789 985,921 29,868Water Resources Legal Cost 1,187,392 201,767 985,625Tahoe Regional Planning Agency 10,415,417 1,761,542 8,653,875Division of Conservation Districts 398,729 383,806 14,923Parks Federal Grant Programs 5,564,789 1,597,269 3,967,520State Parks 11,939,096 10,064,603 1,874,493Maintenance of State Parks 1,779,846 162,703 1,617,143State Parks Facility and Grounds Maintenance 15,057,107 958 15,056,149Coyote Srings Groundwater Basin 44,160 3,331 40,829Flood Control Revenue Fund 252,517 - 252,517USGS Co-Op 1,014,041 737,433 276,608Groundwater Recharge Projects 381,204 16,586 364,618Water Right Surveyors 59,438 4,632 54,806Water Rights Support Fund 202,946 170,797 32,149Well Driller's Licenses 67,564 13,124 54,440Water Resources 6,768,338 5,983,569 784,769Water Resources Cooperative Project 755,000 140,303 614,697State Engineer Revenue 379,668 103,391 276,277Little Humboldt River 193,208 22,474 170,734Quinn River Distribution 44,012 9,354 34,658Adjudication Emergency 16,000 1,864 14,136
Schedule of Total Uses - Budget and Actual, Non-GAAP Budgetary BasisAll General Fund Budgets
For the Fiscal Year Ended June 30, 2010 Page 7 of 9
Infrastructure

115
NEVADAPage 8 of 9
Final Budget Actual Variance
Steptoe Valley Water Basin 9,978$ 1,451$ 8,527$ Diamond Valley Ground Water 24,046 1,585 22,461Lake Valley Ground Water Basin 10,000 - 10,000Middle Reese River Ground Water Basin 29,300 465 28,835Dixie Creek/10 Mi Ground Water 17,649 623 17,026Churchill Valley Ground Water 9,954 6,309 3,645Colorado River Valley 18,763 528 18,235Washoe Valley Ground Water 5,892 464 5,428Amargosa Valley Ground Water 5,269 4,766 503Las Vegas Basin Water District 4,079,493 932,775 3,146,718Muddy River Surface Water 30,687 7,184 23,503Flood Repairs and Disaster Relief 50,000 50,000 -Channel Clearance 21,184 21,184 -Pahranagat Lake 51,418 37,031 14,387Pahrump Artesian Basin 125,306 28,436 96,870Boulder Flat Ground Water 98,535 6,818 91,717Dayton Valley Ground Water 11,632 4,162 7,470Mason Valley Ground Water 95,230 18,673 76,557Humboldt Water District 383,070 169,238 213,832Water District Revenue Fund 30,000 - 30,000Smith Valley Artesian Basin 39,334 15,819 23,515Currant Creek 5,251 - 5,251Duckwater Creek 25,990 9,540 16,450Paradise Valley Ground Water 39,435 10,267 29,168Upper White River 14,983 - 14,983Muddy River Springs 20,374 799 19,575Kingston Creek 7,256 2,099 5,157Warm Springs/Winnemucca Creek 15,573 3,895 11,678Eagle Valley 47,188 11,003 36,185Carson Valley Ground Water 46,004 19,341 26,663Fish Lake Valley Artesian 17,935 3,592 14,343Carico Creek 443 - 443Lemmon Valley 69,357 23,733 45,624Truckee Meadows/Sun Valley 80,308 36,755 43,553Antelope Middle Reese River 45,099 29,528 15,571Warm Springs Ground Water 34,054 3,980 30,074Lower Moapa Valley Groundwater 5,742 - 5,742Honey Lake Valley 13,795 440 13,355Whirlwind Valley 14,374 871 13,503Crescent Water Groundwater 28,560 3,672 24,888Pumpernickel Valley 34 - 34Clovers Area Groundwater 48,035 4,969 43,066Cold Springs Valley 22,734 3,828 18,906Imlay Ground Water 25,838 3,125 22,713Kelly Creek Ground Water 36,189 3,366 32,823Lower Reese River Valley 48,538 3,460 45,078Maggie Creek 54,752 6,725 48,027North Fork Ground Water 22,265 1,718 20,547Pleasant Valley 7,139 1,470 5,669Forestry 20,932,943 9,293,755 11,639,188Forest Fire Suppression/Emergency Response 5,185,674 1,689,440 3,496,234Forestry Honor Camps 8,895,001 8,532,649 362,352Forestry Inter-Gov Agreements 3,884,648 3,465,412 419,236Tahoe License Plates 1,948,175 311,201 1,636,974Mt. Charleston License Plates 422,285 23,360 398,925Nevada Tahoe Regional Planning Agency 1,490 370 1,120State Lands 1,972,075 1,707,649 264,426State Lands Revolving Account 88,472 5,263 83,209Tahoe Bond Sale 1,052,865 195,881 856,984Tahoe Mitigation 3,590,345 47,649 3,542,696Nevada Natural Heritage 1,296,629 797,931 498,698

116
NEVADA
Final Budget Actual Variance
AB9/Q1 Bonds 45,075,990$ 13,347,347$ 31,728,643$ Storage Tank Management 317,120 35,142 281,978Environmental Protection Administration 4,628,823 3,690,753 938,070Chemical Hazard Prevention 1,268,507 394,076 874,431Reclamation Surety Account 2,568,876 - 2,568,876Air Quality Management Account 10,206,881 3,261,846 6,945,035Air Quality 10,528,282 7,919,269 2,609,013Water Pollution Control 5,508,833 3,603,978 1,904,855Water Quality Planning 7,582,434 4,202,235 3,380,199Safe Drinking Water Regulatory Program 3,350,391 2,146,582 1,203,809Waste Management and Federal Facilities 19,157,939 11,605,586 7,552,353Mining Regulation/Reclamation 5,135,618 2,340,014 2,795,604Interim Fluid Management Trust 1,329,898 - 1,329,898Hazardous Waste Management 21,880,848 6,225,645 15,655,203Hazardous Waste - Beatty Site 12,013,308 - 12,013,308Water Planning - Capital Improvement 318,341 187,092 131,249InfrastructureAB544 Highway Projects 350,921 350,921 -
324,844,059 145,193,108 179,650,951SPECIAL PURPOSE AGENCIESVeterans' AffairsCommissioner for Veterans' Affairs 2,641,146 2,489,053 152,093Veterans' Home Account 16,077,717 15,221,856 855,861Veterans' Gifts and Donations 169,734 41,625 128,109Veterans' Home Donation 35,796 21,108 14,688Gift Account for Veterans 757,831 252,077 505,754Office of MilitaryMilitary 16,306,046 11,879,149 4,426,897Military Emergency Operations Center 345,974 314,552 31,422Adjutant General Construction 7,955,408 4,091,204 3,864,204National Guard Benefits 62,594 61,139 1,455Patriot Relief Account 753,247 150,093 603,154Civil Air Patrol 75,102 41,337 33,765
45,180,595 34,563,193 10,617,402APPROPRIATED TRANSFERS TO OTHER FUNDSLegislative Fund 29,441,231 29,441,231 -Contingency Fund 28,562,971 28,562,971 -Attorney General Fund - Consumer Advocate 1,232,163 1,232,163 -Stabilize the Operations of State Government 126,503 126,503 -Highway Fund 35,923 35,923 -Healthy Nevada Fund 103,137 103,137 -
59,501,928 59,501,928 -REVERSIONS TO OTHER FUNDSReversion to Highway Fund - 234,011 (234,011)Reversion to Workers' Comp and Safety Fund - 499,189 (499,189)Reversion to Consolidated Bond Interest and Redemption Fund - 10,000 (10,000)Reversion to Contingency Fund - 431,948 (431,948)
- 1,175,148 (1,175,148)PROJECTED REVERSIONS (53,500,000) - (53,500,000)Total General Fund 7,497,728,926$ 6,601,099,401$ 896,629,525$
Special Purpose Agencies
Schedule of Total Uses - Budget and Actual, Non-GAAP Budgetary BasisAll General Fund Budgets
For the Fiscal Year Ended June 30, 2010 Page 9 of 9
Appropriated Transfers to Other Funds
Reversions to Other Funds
Projected Reversions

117
NEVADA
Final Budget Actual Variance
STATE HIGHWAYFinance and AdministrationUnbudgeted Activity -$ 209,175$ (209,175)$ Appropriations to Other Funds 4,756,049 4,756,047 2InfrastructureTransportation Administration 820,456,560 683,679,021 136,777,539Bond Construction 20,625,730 20,625,730 -Aviation Trust Fund 90,313 - 90,313AB 595 Revenue Rental Car Tax 11,714,912 730,599 10,984,313AB 595 Revenue Clark Co. 76,727,384 36,997,213 39,730,171AB 595 Revenue Washoe Co. 1,851,406 1,723,723 127,683NDOT - SB 5 RTC Public Road Project 4,040,000 - 4,040,000System of Providing Information to the Traveling Public 295,559 235,354 60,205Public SafetyBicycle Safety Program 366,225 216,630 149,595Motorcycle Safety Program 1,036,763 647,247 389,516Director's Office - Public Safety 1,253,836 1,192,255 61,581Internal Affairs 585,863 539,443 46,420Records Search 9,180,057 9,097,762 82,295Highway Patrol 67,691,679 65,077,162 2,614,517Administrative Services 2,052,264 1,848,384 203,880DMV Motor Vehicle Information Technology 9,222,904 8,444,965 777,939Motor Carrier 4,448,531 3,805,989 642,542PS Highway Safety Grants Account 3,048,247 2,155,088 893,159Emergency Response Commission 2,585,740 1,503,341 1,082,399Verification of Insurance 16,420,156 13,582,327 2,837,829Hearings - DMV and PS 1,203,236 1,141,893 61,343Special Plates Trust Account 1,148,983 398,705 750,278Salvage Titles Trust Account 302,411 234,307 68,104Public Safety Technology Division 6,199,454 5,539,085 660,369DMV Field Services 44,743,937 39,421,838 5,322,099Compliance Enforcement 4,689,433 4,519,965 169,468Central Services 12,752,076 11,647,898 1,104,178Management Services 1,415,306 1,286,245 129,061Director's Office - DMV 5,308,590 5,241,384 67,206DMV Real ID 3,146,197 1,373,091 1,773,106Administrative Services 12,490,037 11,437,762 1,052,275Debt Service TransfersDebt Service 89,297,677 89,297,677 -Total 1,241,147,515 1,028,607,305 212,540,210MUNICIPAL BOND BANKConstitutional AgenciesMunicipal Bond Bank Revenue 30,618,109 30,146,884 471,225Total 30,618,109 30,146,884 471,225EMPLOYMENT SECURITYHuman ServicesClaimant Employment Program 22,965,038 14,218,641 8,746,397Employment Security 112,120,971 92,989,570 19,131,401Employment Security Special Fund 35,581,306 10,413,645 25,167,661Total 170,667,315 117,621,856 53,045,459REGULATORYCommerce and IndustryManufactured Housing 2,380,782 1,263,875 1,116,907Real Estate Education and Research 1,917,085 756,699 1,160,386Real Estate Recovery 942,480 531,300 411,180Mobile Home Parks 345,356 169,037 176,319Mfg Housing-Education/Recovery 202,857 67,827 135,030Regulatory Fund 15,036,625 11,510,641 3,525,984Administrative Fines 100,000 27,250 72,750Transportation Services Authority 2,891,184 2,858,340 32,844TSA Administrative Fines 380,383 134,822 245,561
State Highway
Municipal Bond Bank
Schedule of Total Uses - Budget and Actual, Non-GAAP Budgetary BasisAll Special Revenue Fund Budgets
For the Fiscal Year Ended June 30, 2010 Page 1 of 3
Employment Security
Regulatory

118
Final Budget Actual Variance
Taxicab Authority 8,541,294$ 5,938,151$ 2,603,143$ Dairy Commission 2,021,119 1,568,489 452,630Total 34,759,165 24,826,431 9,932,734LEGISLATIVEConstitutional AgenciesNevada Legislative Interim 604,873 565,681 39,192Legislative Counsel Bureau 36,308,369 27,314,896 8,993,473Audit Contingency Account 323,700 323,700 -Total 37,236,942 28,204,277 9,032,665HIGHER EDUCATION CAPITAL Finance and AdministrationHigher Education Capital Construction - 5,000,000 (5,000,000)Higher Education Special Construction 35,000,000 7,905,088 27,094,912Total 35,000,000 12,905,088 22,094,912CLEANING UP PETROLEUM DISCHARGESInfrastructurePetroleum Clean-Up Trust Fund 21,527,702 11,123,898 10,403,804Total 21,527,702 11,123,898 10,403,804HOSPITAL CARE TO INDIGENT PERSONSFinance and AdministrationSupplemental Fund - Indigents 28,222,521 26,954,923 1,267,598Total 28,222,521 26,954,923 1,267,598TOURISM PROMOTIONCommerce and IndustryTourism Development 68,456 - 68,456Commission on Tourism 17,351,069 13,653,213 3,697,856Total 17,419,525 13,653,213 3,766,312OFFENDERS' STOREPublic SafetyOffenders' Store Fund 18,656,380 14,721,794 3,934,586Inmate Welfare Account 5,460,537 5,284,304 176,233Total 24,116,917 20,006,098 4,110,819TOBACCO SETTLEMENTConstitutional AgenciesMillennium Scholarship Fund 45,059,644 25,517,510 19,542,134Millennium Scholarship Administration 407,682 354,442 53,240Trust Fund for Healthy Nevada 54,349,869 38,189,418 16,160,451Trust Fund for Public Health 6,025,111 5,443,144 581,967Human ServicesHealthy Nevada Fund 9,514,947 5,579,589 3,935,358Senior RX and Disability RX 6,013,913 4,688,903 1,325,010Healthy Nevada Fund Administration 7,060,873 6,678,306 382,567Total 128,432,039 86,451,312 41,980,727CONTINGENCYConstitutional AgenciesInterim Finance Committee 49,258,336 33,939,709 15,318,627Total 49,258,336 33,939,709 15,318,627CARE OF SITES FOR RADIOACTIVE Human ServicesRadioactive Material Disposal 9,699,780 9,085,244 614,536Total 9,699,780 9,085,244 614,536GIFTEducationEducation Gift Fund 20,987 - 20,987Library and Archives Gift Fund 196,781 12,068 184,713Human ServicesRRC Gift Fund 14,225 - 14,225
Schedule of Total Uses - Budget and Actual, Non-GAAP Budgetary BasisAll Special Revenue Fund Budgets
For the Fiscal Year Ended June 30, 2010 Page 2 of 3
Cleaning Up Petroleum Discharges
Legislative
Higher Education Capital Construction
Tourism Promotion
Offenders’ Store
Tobacco Settlement
Hospital Care to Indigent Persons
Contingency
Care of Sites for Radioactive Waste Disposal
Gift

119
NEVADA
Final Budget Actual Variance
SNAMHS Gift Fund 18,998$ 600$ 18,398$ Settlement Funds 80,957 77,674 3,283Health Division Gifts 21,003 1,070 19,933Transition from Foster Care 2,230,237 1,088,828 1,141,409Aging Services Gift 309,759 264,420 45,339Summit View Commissary 22,128 6,307 15,821Disability Services Gift 1,213 - 1,213CBS Washoe Gift Fund 14,455 - 14,455Indian Commission Gift Acct 32,115 6,237 25,878Hospital Gift Fund 298,598 6,233 292,365NNMRS Gift Fund 9,650 - 9,650Blind Gift Fund 163,307 16,531 146,776Welfare Gift Fund 9,887 - 9,887Rehabilitation Gift Fund 38,744 9,319 29,425Henry Woods Christmas Fund 3,683 1,175 2,508Nevada Children's Gift Account 600,777 5,699 595,078CYC Gift Fund 6,420 1,113 5,307Youth Training Center Gift Fund 35,445 - 35,445DRC Gift Fund 12,134 - 12,134InfrastructureHeil Wild Horse Bequest 137,137 131,703 5,434Park Gift and Grants 174,818 42,597 132,221Total 4,453,458 1,671,574 2,781,884NATURAL RESOURCESInfrastructureGrants To Water Purveyors 15,052,273 8,693,998 6,358,275Erosion Control Bond Q12 898,550 492,682 405,868Protect Lake Tahoe 34,314,616 4,130,183 30,184,433Total 50,265,439 13,316,863 36,948,576STABILIZE THE OPERATIONS Public SafetyEmergency Assistance 717,884 522,399 195,485Constitutional AgenciesDisaster Relief 6,793,994 4,143,985 2,650,009Stabilization of State Government 632,516 632,516 -Total 8,144,394 5,298,900 2,845,494MISCELLANEOUSConstitutional AgenciesRacketeering-Prosecution Account 125 - 125Consumer Advocate 5,543,913 4,200,772 1,343,141Unfair Trade Practices 781,705 241,794 539,911Commerce and IndustryLot Rent Trust Subsidy 463,739 367,525 96,214Rural Rehabilitation Trust 243,037 - 243,037EducationMuseums and History Board Trust 15,544 15,535 9Museums Administrator Trust 30,113 27,920 2,193Nevada Historical Society Trust 186,479 102,716 83,763Nevada State Museum Trust 743,343 337,575 405,768Nevada Railroad Museum Trust 323,774 209,558 114,216Lost City Museum Trust 169,643 89,512 80,131Las Vegas Museum and Trust 64,061 43,048 21,013Finance and AdministrationPublic Works Inspection 7,828,624 6,357,824 1,470,800Public Works Retention Payment 474,417 58,038 416,379Victims of Crime 11,637,247 9,645,852 1,991,395Special ProjectsSchool Improvement 100 - 100Total 28,505,864 21,697,669 6,808,195Total Special Revenue Funds 1,919,475,021$ 1,485,511,244$ 433,963,777$
Page 3 of 3
Natural Resources
Miscellaneous
Stabilize the Operations of State Government

120
Final Budget Actual Variance Final Budget Actual Variance
Fund balances, July 1 17,097,156$ 17,097,156$ -$ 9,581,190$ 9,581,190$ -$
Revenues: Federal 135,042,088 95,441,188 (39,600,900) 1,257,408 571,611 (685,797) Other taxes - - - 11,202,742 10,833,695 (369,047) Sales and charges for services 746,615 1,093,538 346,923 5,216,697 4,899,075 (317,622) Licenses, fees and permits 320,641 325,868 5,227 3,413,413 2,796,312 (617,101) Interest 246,898 115,498 (131,400) 102,413 34,901 (67,512) Other 14,100,000 11,315,722 (2,784,278) 716,208 577,995 (138,213)Other financing sources: Transfer from other funds 3,113,917 2,595,425 (518,492) 3,269,094 3,163,420 (105,674)Total sources 170,667,315$ 127,984,395$ (42,682,920)$ 34,759,165$ 32,458,199$ (2,300,966)$
Fund balances, July 1 5,812,173$ 5,812,173$ -$ -$ -$ -$
Revenues: Gaming taxes, fees, licenses - - - 14,678,019 14,678,019 - Sales, charges for services 987,550 827,430 (160,120) - - - Licenses, fees and permits 5,000 5,800 800 - - - Other 231,335 286,248 54,913 - - -Other financing sources: Transfer from other funds 30,200,884 30,226,390 25,506 - - -Total sources 37,236,942$ 37,158,041$ (78,901)$ 14,678,019$ 14,678,019$ -$
Fund balances, July 1 6,877,602$ 6,877,602$ -$ 152,317$ 152,317$ -$
Revenues: Federal 100 - (100) - - - Other taxes 13,500,000 12,232,085 (1,267,915) 27,911,956 26,848,669 (1,063,287) Licenses, fees and permits 550,000 415,500 (134,500) - - - Interest 500,000 67,748 (432,252) 158,248 53,938 (104,310) Other 100,000 7,349 (92,651) - - -Other financing sources: Transfer from other funds - - - - 52,317 52,317Total sources 21,527,702$ 19,600,284$ (1,927,418)$ 28,222,521$ 27,107,241$ (1,115,280)$
Fund balances, July 1 2,737,281$ 2,737,281$ -$ 5,271,345$ 5,271,345$ -$
Revenues: Other taxes 14,650,329 13,842,014 (808,315) - - - Sales, charges for services - - - 14,347,419 14,264,871 (82,548) Licenses, fees and permits 9,700 8,205 (1,495) - - - Interest 1,573 316 (1,257) 375,160 87,096 (288,064) Other 20,642 66,044 45,402 391,035 425,488 34,453Other financing sources: Transfer from other funds - 73,127 73,127 3,731,958 3,678,080 (53,878)Total sources 17,419,525$ 16,726,987$ (692,538)$ 24,116,917$ 23,726,880$ (390,037)$
Schedule of Sources - Budget and Actual, Non-GAAP Budgetary BasisAll Nonmajor Special Revenue Fund Budgets
For the Fiscal Year Ended June 30, 2010
Employment Security Regulatory
Legislative Higher Education Capital Construction
Cleaning Up Petroleum Discharges Hospital Care to Indigent Persons
Tourism Promotion Offenders’ Store

121
NEVADA
Final Budget Actual Variance Final Budget Actual Variance
Fund balances, July 1 50,411,346$ 50,411,346$ -$ 20,506,349$ 20,506,349$ -$
Revenues: Interest 400,529 270,242 (130,287) - - - Other 46,616,566 41,978,197 (4,638,369) - - -Other financing sources: Transfer from other funds 31,003,598 19,601,240 (11,402,358) 28,751,987 28,811,008 59,021Total sources 128,432,039$ 112,261,025$ (16,171,014)$ 49,258,336$ 49,317,357$ 59,021$
Fund balances, July 1 9,416,263$ 9,416,263$ -$ 2,918,738$ 2,918,738$ -$
Revenues: Sales, charges for services - - - 12,480 1,698 (10,782) Licenses, fees and permits 166,513 128,556 (37,957) 1,103,707 1,066,399 (37,308) Interest 117,004 79,641 (37,363) 79,207 27,326 (51,881) Other - - - 336,826 220,649 (116,177)Other financing sources: Transfer from other funds - - - 2,500 483 (2,017)Total sources 9,699,780$ 9,624,460$ (75,320)$ 4,453,458$ 4,235,293$ (218,165)$
Fund balances, July 1 30,315,090$ 30,315,090$ -$ 7,391,878$ 7,391,878$ -$
Revenues: Federal 665,137 414,710 (250,427) - - - Interest 1,055,789 284,971 (770,818) 120,000 60,478 (59,522) Other - - - - 660 660Other financing sources: Proceeds from sale of bonds 18,229,423 18,229,423 - - - - Transfers from other funds - - - 270,488 270,488 -Total sources 50,265,439$ 49,244,194$ (1,021,245)$ 7,782,366$ 7,723,504$ (58,862)$
Fund balances, July 1 4,233,038$ 4,233,038$ -$ 172,721,766$ 172,721,766$ -$
Revenues: Gaming taxes, fees, licenses - - - 14,678,019 14,678,019 - Federal 2,695,273 2,629,273 (66,000) 139,660,006 99,056,782 (40,603,224) Other taxes 2,928,435 2,928,334 (101) 70,193,462 66,684,797 (3,508,665) Sales, charges for services 883,696 557,738 (325,958) 22,194,457 21,644,350 (550,107) Licenses, fees and permits 12,481,138 11,868,466 (612,672) 18,050,112 16,615,106 (1,435,006) Interest 580,703 71,056 (509,647) 3,737,524 1,153,211 (2,584,313) Other 3,420,770 2,131,880 (1,288,890) 65,933,382 57,010,232 (8,923,150)Other financing sources: Proceeds from sale of bonds - - - 18,229,423 18,229,423 - Transfer from other funds 1,282,669 1,242,919 (39,750) 101,627,095 89,714,897 (11,912,198)Total sources 28,505,722$ 25,662,704$ (2,843,018)$ 627,025,246$ 557,508,583$ (69,516,663)$
Tobacco Settlement Contingency
Care of Sites for Radioactive Waste Disposal Gift
Natural Resources Stabilization
Miscellaneous Total Nonmajor Special Revenue Funds

122
Mountain Biking in the Ruby Mountains, NVPhoto Courtesy of Nevada Commission on Tourism

123
NoNmajor eNterprise FuNdsWorkers’ Compensation and Safety Records assessments on insurers for compensation of injured workers and administration of regulations for employee safety (NRS 616A.425), assesses self-insurers to pay claims against insolvent self-insured employers (NRS 616B.309), accounts for compensation benefits to physically impaired employees from a subsequent injury in the course of employment (NRS 616B.554, 616B.575, 616B.584), and accounts for injury claims of employees of uninsured employers (NRS 616A.430).
Insurance Examination Accounts for activities related to examinations of financial records and assets of authorized insurers (NRS 679B.300).
Gaming Investigative Accounts for activities related to investigations of gaming license applicants (NRS 463.331) and cash transactions of gaming licensees (NRS 463.332).
Forestry Nurseries Accounts for the self-supporting operation of State nurseries, which propagate, maintain and distribute plants for conservation purposes (NRS 528.100).
Prison Industry Accounts for a self-supporting program of job training through the employment of inmates in farming and manufacturing (NRS 209.189).
Nevada Magazine Accounts for the operation of the publication, Nevada Magazine, which is published to promote tourism (NRS 231.290).
Higher Education Tuition Trust Accounts for the receipts and disbursements related to prepaid tuition contracts that allow the cost of tuition to be paid in advance of enrollment at an institution of higher education (NRS 353B.140).
Marlette Lake Water System Accounts for the costs of operating the State-owned Marlette Lake Water System. The system serves the State Buildings and Grounds Division and portions of Carson City and Storey County (NRS 331.180).

124
Workers' Compensation and Safety
Insurance Examination
Gaming Investigative
Forestry Nurseries
AssetsCurrent assets:Cash and pooled investments: Cash with treasurer 29,233,616$ 820,080$ 10,950,388$ 73,776$ Cash in custody of other officials 523 - 197,709 100Investments - - - -Receivables: Accounts receivable 4,921,288 463,086 111,219 3,846 Intergovernmental receivables 106,103 - - - Contracts receivable - - - - Accrued interest and dividends - - - - Trades pending settlement - - - -Due from other funds 619,077 - 699 63,976Due from fiduciary funds - - - -Due from component units - - - -Inventory - - - 255,872Prepaid expenses - - - - Total current assets 34,880,607 1,283,166 11,260,015 397,570Noncurrent assets:Receivables: Contracts receivable - - - -Deferred charges - - - -Other assets - - - -Capital assets: Land - - - - Buildings - - - - Improvements other than buildings - - - - Furniture and equipment 2,315,609 7,040 163,726 78,561 Construction in progress - - - - Less accumulated depreciation (1,705,326) (43) (112,348) (78,561) Total noncurrent assets 610,283 6,997 51,378 - Total assets 35,490,890 1,290,163 11,311,393 397,570LiabilitiesCurrent liabilities:Accounts payable and accruals: Accounts payable 638,014 381,716 425,242 1,813 Accrued payroll and related liabilities 654,451 - - 7,082 Interest payable - - - - Intergovernmental payables 13,250 - 457 - Trades pending settlement - - - -Due to other funds 43,394 3,082 1,220,556 42,074Due to fiduciary funds 16 - - 582Due to component units - - - 25Deferred revenues - - 9,361,759 -Other liabilities - - - -Short-term portion of long-term liabilities: Compensated absences 818,386 - - 4,208 Benefits payable - - - - Bonds payable - - - - Total current liabilities 2,167,511 384,798 11,008,014 55,784Noncurrent liabilities:Advances from general fund - - - 330,720Compensated absences 400,438 - - 668Benefits payable - - - -Bonds payable - - - - Total noncurrent liabilities 400,438 - - 331,388 Total liabilities 2,567,949 384,798 11,008,014 387,172Net AssetsInvested in capital assets, net of related debt 610,283 6,997 51,378 -Restricted for workers' compensation 32,312,658 - - -Restricted for regulation of business - 898,368 2,000 -Unrestricted (deficit) - - 250,001 10,398 Total net assets 32,922,941$ 905,365$ 303,379$ 10,398$
Combining Statement of Net AssetsNonmajor Enterprise Funds
June 30, 2010
Assets
Liabilities
Net Assets

125
NEVADA
Prison IndustryNevada
MagazineHigher Education
Tuition TrustMarlette Lake Water System Total
1,480,625$ 107,652$ 1,003,848$ 1,097,371$ 44,767,356$ 100 - 818,698 - 1,017,130
- - 106,364,432 - 106,364,432
419,819 106,269 - - 6,025,52776,383 - - 202,068 384,554
- - 4,400,000 - 4,400,000- - 515,805 - 515,805- - 5,609 - 5,609
166,726 8 7,448 60 857,9947,177 - - - 7,177
533 - - - 5331,182,691 13,170 - - 1,451,733
408 6,108 - - 6,5163,334,462 233,207 113,115,840 1,299,499 165,804,366
- - 14,035,024 - 14,035,024- - - 94,475 94,475
15,000 - - - 15,000
153,140 - - 414,672 567,8122,890,227 - - 498,613 3,388,840
- - - 630,647 630,6471,030,863 - 15,295 1,583,569 5,194,663
- - - 8,476,095 8,476,095(2,925,735) - (13,606) (2,453,312) (7,288,931)1,163,495 - 14,036,713 9,244,759 25,113,6254,497,957 233,207 127,152,553 10,544,258 190,917,991
80,963 49,147 221,989 32,284 1,831,16870,449 22,291 7,101 14,379 775,753
- - - 29,038 29,038119 - - 153 13,979
- - 53,393 - 53,39316,904 401 29,300 57,549 1,413,26089,109 - - - 89,707
- - 29,867 12 29,904165,586 196,150 - - 9,723,495
9,459 - - 2,050 11,509
129,794 23,339 12,061 18,000 1,005,788- - 10,000,000 - 10,000,000- - - 141,710 141,710
562,383 291,328 10,353,711 295,175 25,118,704
- - 5,000,000 20,536 5,351,256109,620 14,963 2,003 17,197 544,889
- - 121,505,000 - 121,505,000- - - 7,229,236 7,229,236
109,620 14,963 126,507,003 7,266,969 134,630,381672,003 306,291 136,860,714 7,562,144 159,749,085
1,148,495 - 1,689 1,779,338 3,598,180- - - - 32,312,658- - - - 900,368
2,677,459 (73,084) (9,709,850) 1,202,776 (5,642,300)3,825,954$ (73,084)$ (9,708,161)$ 2,982,114$ 31,168,906$

126
Workers' Compensation and
SafetyInsurance
ExaminationGaming
InvestigativeForestry
NurseriesOperating RevenuesSales -$ -$ -$ 428,291$ Assessments 23,906,566 - - -Charges for services 180 - 13,355,311 -Rental income - - - -Licenses, fees and permits 370,765 2,887,613 - -Fines 2,859,844 - - -Other 3,004,620 - - 2,250
Total operating revenues 30,141,975 2,887,613 13,355,311 430,541
Operating ExpensesSalaries and benefits 15,153,180 - 10,510,442 84,061Operating 3,707,714 3,290,588 1,758,381 485,946Claims and benefits expense 7,165,077 - - -Materials or supplies used - - - 253,184Depreciation 220,243 43 37,101 - Total operating expenses 26,246,214 3,290,631 12,305,924 823,191 Operating income (loss) 3,895,761 (403,018) 1,049,387 (392,650)
Nonoperating Revenues (Expenses)Interest and investment income 171,336 - - -Interest expense (26) - - -Bond issuance costs amortization - - - -Federal grants 2,359,495 - - -Gain (loss) on disposal/sale of assets 1,980 - - - Total nonoperating revenues (expenses) 2,532,785 - - -Income (loss) before transfers 6,428,546 (403,018) 1,049,387 (392,650)
TransfersTransfers in - - 1,378 -Transfers out (10,713,977) (600,000) (1,215,369) -
Change in net assets (4,285,431) (1,003,018) (164,604) (392,650)
Net assets, July 1 37,208,372 1,908,383 467,983 403,048Net assets, June 30 32,922,941$ 905,365$ 303,379$ 10,398$
Combining Statement of Revenues, Expenses and Changes in Fund Net AssetsNonmajor Enterprise Funds
Operating Revenues
Operating Expenses
For the Fiscal Year Ended June 30, 2010
Nonoperating Revenues (Expenses)
Transfers

127
NEVADA
Prison IndustryNevada
Magazine
Higher Education
Tuition TrustMarlette Lake Water System Total
2,933,108$ 1,183,086$ 8,133,295$ 983,561$ 13,661,341$ - - - - 23,906,566
450,120 - 88,763 - 13,894,374154,436 - - 11,500 165,936
- - - - 3,258,378- - - - 2,859,844
842,838 3,653 - 114,109 3,967,470
4,380,502 1,186,739 8,222,058 1,109,170 61,713,909
1,701,356 514,869 149,572 165,423 28,278,9031,870,730 219,489 703,344 161,921 12,198,113
- - 13,195,664 - 20,360,7411,451,408 389,820 - - 2,094,412
130,993 - 2,000 51,306 441,6865,154,487 1,124,178 14,050,580 378,650 63,373,855(773,985) 62,561 (5,828,522) 730,520 (1,659,946)
14,706 - 12,156,290 - 12,342,332- - - (165,974) (166,000)- - - (3,446) (3,446)- - - - 2,359,495- - - 1,530 3,510
14,706 - 12,156,290 (167,890) 14,535,891(759,279) 62,561 6,327,768 562,630 12,875,945
- - 427,915 - 429,293(980,167) - - - (13,509,513)
(1,739,446) 62,561 6,755,683 562,630 (204,275)
5,565,400 (135,645) (16,463,844) 2,419,484 31,373,1813,825,954$ (73,084)$ (9,708,161)$ 2,982,114$ 31,168,906$

128
Combining Statement of Cash FlowsNonmajor Enterprise Funds
For the Fiscal Year Ended June 30, 2010
Workers'Compensation Insurance Gaming Forestry
and Safety Examination Investigative NurseriesCash flows from operating activitiesReceipts from customers and users 27,195,175$ 3,293,512$ 13,999,404$ 131,109$ Receipts for interfund services provided 34,376 18,055 - 336,957 Payments to suppliers, other governments and beneficiaries (8,749,064) (2,012,258) (1,755,417) (376,849) Payments to employees (15,078,666) - (10,510,442) (83,436) Payments for interfund services used (1,864,318) (1,183,488) (64,119) (24,236) Payments to component units (760) - - -
Net cash provided by (used for) operating activities 1,536,743 115,821 1,669,426 (16,455)
Cash flows from noncapital financing activitiesGrant receipts 2,542,286 - - - Transfers and advances from other funds - - 1,435 - Transfers and advances to other funds (9,921,918) (600,000) (2,403,416) -
Net cash provided by (used for) noncapital financing activities (7,379,632) (600,000) (2,401,981) -
Cash flows from capital and related financing activitiesProceeds from sale of capital assets 1,980 - - - Purchase of capital assets (182,449) (7,040) (47,302) - Principal paid on capital debt - - - (15,090) Interest paid on capital debt - - - - Payments on construction projects - - - - Net cash provided by (used for) capital and related financing activities (180,469) (7,040) (47,302) (15,090)
Cash flows from investing activitiesProceeds from sale of investments - - - - Purchase of investments - - - - Interest and dividends received 410,408 - - -
Net cash provided by (used for) investing activities 410,408 - - -
Net increase (decrease) in cash (5,612,950) (491,219) (779,857) (31,545) Cash and cash equivalents, July 1 34,847,089 1,311,299 11,927,954 105,421
Cash and cash equivalents, June 30 29,234,139 $ 820,080 $ 11,148,097 $ 73,876 $
Reconciliation of operating income (loss) to net cash provided by (used for) operating activitiesOperating income (loss) 3,895,761 $ (403,018)$ 1,049,387 $ (392,650)$
Adjustments to reconcile operating income (loss) to net cash provided by (used for) operating activitiesDepreciation 220,243 43 37,101 - Decrease (increase) in accrued interest and receivables (2,912,424) 423,954 2,370 37,525 Decrease (increase) in inventory, deferred charges, other assets - - 2,480 374,771 Increase (decrease) in accounts payable, accruals, other liabilities 333,163 94,842 578,088 (36,101)
Total adjustments (2,359,018) 518,839 620,039 376,195
Net cash provided by (used for) operating activities 1,536,743 $ 115,821 $ 1,669,426 $ (16,455)$
Noncash investing, capital and financing activitiesIncrease (decrease) in fair value of investments (14,086)$ -$ -$ -$

129
NEVADA
Prison Nevada Higher Education Marlette LakeIndustry Magazine Tuition Trust Water System Total
2,783,602$ 837,168$ 7,495,916$ 1,073,073$ 56,808,959$ 2,239,598 319,178 115,641 - 3,063,805
(1,554,582) (545,614) (3,267,001) (38,523) (18,299,308) (1,687,098) (516,489) (145,454) (166,402) (28,187,987) (1,448,413) (65,460) (510,394) (62,343) (5,222,771)
- - (3,503,177) (3,530) (3,507,467)
333,107 28,783 185,531 802,275 4,655,231
- - - - 2,542,286 - 4,479 5,427,915 - 5,433,829
(980,167) - - - (13,905,501)
(980,167) 4,479 5,427,915 - (5,929,386)
- - - 1,530 3,510 (62,129) - - - (298,920)
- - - (135,000) (150,090) - - - (353,480) (353,480) - - - (1,008,466) (1,008,466)
(62,129) - - (1,495,416) (1,807,446)
- - 124,427,620 - 124,427,620 - - (136,243,404) - (136,243,404)
31,686 - 2,680,885 - 3,122,979
31,686 - (9,134,899) - (8,692,805)
(677,503) 33,262 (3,521,453) (693,141) (11,774,406) 2,158,228 74,390 5,343,999 1,790,512 57,558,892
1,480,725 $ 107,652 $ 1,822,546 $ 1,097,371 $ 45,784,486 $
(773,985)$ 62,561 $ (5,828,522)$ 730,520 $ (1,659,946)$
130,993 - 2,000 51,306 441,686 592,242 7,849 (610,501) (36,097) (2,495,082) 291,668 3,416 - - 672,335 92,189 (45,043) 6,622,554 56,546 7,696,238
1,107,092 (33,778) 6,014,053 71,755 6,315,177
333,107 $ 28,783 $ 185,531 $ 802,275 $ 4,655,231 $
(6,102)$ -$ 9,394,466$ -$ 9,374,278$

130
Hiking at Kings CanyonCarson City, NV
Photographed by Diane Sterling

131
iNterNal service FuNdsSelf-Insurance Accounts for self-insured group life, accident and health insurance plans for State and other government employees (NRS 287.0435).
Buildings and Grounds Accounts for the maintenance, housekeeping and security of most State buildings (NRS 331.101).
Motor Pool Accounts for the operations of the State vehicle fleet (NRS 336.110).
Communications Accounts for the operation of mail services for State agencies in Carson City, Reno, Las Vegas and Elko (NRS 331.103).
Insurance Premiums Allocates the costs of fidelity insurance, property insurance and workers’ compensation insurance to State agencies (NRS 331.187).
Administrative Services Provides administrative and accounting services to various divisions of the Department of Administration (NRS 232.219).
Personnel Accounts for the costs of administering the State personnel system. Operations are financed by assessments charged to user agencies (NRS 284.110).
Purchasing Provides purchasing services to State agencies and other governmental units. The operation is financed by an administrative charge on purchase orders and warehouse orders (NRS 333.120).
Information Services Accounts for designing, programming, and maintaining data processing software and also operating the State’s central computer facility, radio communication and telecommunication systems (NRS 242.211).
Printing Accounts for the operation of the State printing facilities (NRS 344.090).

132
Self-InsuranceBuildings and
Grounds Motor Pool CommunicationsAssetsCurrent assets:Cash and pooled investments: Cash with treasurer 85,199,531$ 4,622,969$ 1,151,403$ 454,722$ Cash in custody of other officials - - - -Receivables: Accounts receivable 1,952,483 4,770 - - Intergovernmental receivables 5,995,145 2,403 12,102 1,084 Notes receivable - - - -Due from other funds 2,030,393 367,458 384,435 548,632Due from fiduciary funds 2,723,307 - 386 -Due from component units 2,100,558 - 1,380 955Inventory - - - -Prepaid expenses - 134 - - Total current assets 100,001,417 4,997,734 1,549,706 1,005,393Noncurrent assets:Notes receivable - - - -Capital assets: Land - 20,400 - - Buildings - 2,268,068 1,037,144 - Improvements other than buildings - 291,216 - 422,451 Furniture and equipment 361,572 879,686 13,757,769 1,073,645 Software costs - - - - Less accumulated depreciation/amortization (258,538) (2,196,902) (10,813,058) (923,060) Total noncurrent assets 103,034 1,262,468 3,981,855 573,036 Total assets 100,104,451 6,260,202 5,531,561 1,578,429LiabilitiesCurrent liabilities:Accounts payable and accruals: Accounts payable 5,022,771 981,625 76,685 4,683 Accrued payroll and related liabilities 88,192 267,792 31,080 40,159 Intergovernmental payables - 37,435 547 -Bank overdraft 5,580,929 - - -Due to other funds 11,169 53,581 72,351 5,172Due to fiduciary funds - 4,464 1,098 -Due to component units - - - -Deferred revenues 86,579 - - -Short-term portion of long-term liabilities: Reserve for losses 34,473,000 - - - Compensated absences 106,048 397,278 65,328 65,521 Bonds payable - - - - Obligations under capital leases - - - - Total current liabilities 45,368,688 1,742,175 247,089 115,535Noncurrent liabilities:Advances: Advances from general fund - - - - Advances from debt service fund - - - -Reserve for losses - - - -Compensated absences 45,864 174,647 52,394 37,930Bonds payable - - - -Obligations under capital leases - - - - Total noncurrent liabilities 45,864 174,647 52,394 37,930 Total liabilities 45,414,552 1,916,822 299,483 153,465Net AssetsInvested in capital assets, net of related debt 103,034 1,262,468 3,981,855 573,036Unrestricted (deficit) 54,586,865 3,080,912 1,250,223 851,928Total net assets 54,689,899$ 4,343,380$ 5,232,078$ 1,424,964$
Combining Statement of Net AssetsInternal Service Funds
Assets
Liabilities
June 30, 2010
Net Assets

133
NEVADA
Insurance Premiums
Administrative Services Personnel Purchasing
Information Services Printing Total
20,034,809$ 398,678$ 2,838,951$ 658,784$ 3,502,777$ 749,994$ 119,612,618$ - - - - 100 - 100
9,039 - 187 350 2,350 14,248 1,983,427- - - - 27,673 - 6,038,407
10,000 - - - - - 10,000860,600 - 40,559 1,150 1,920,237 206,644 6,360,108
- - - - 188 - 2,723,881- - - - 3,328 - 2,106,221- - - - - 279,585 279,585
816,492 - - - - - 816,62621,730,940 398,678 2,879,697 660,284 5,456,653 1,250,471 139,930,973
100,000 - - - - - 100,000
- - - 95,554 15,000 - 130,954- - - 140,000 14,762,838 3,870,571 22,078,621- - - - - - 713,667
30,475 59,699 230,456 189,459 28,118,024 3,933,727 48,634,512- - 15,323,810 - - - 15,323,810
(27,289) (52,016) (14,222,139) (312,553) (27,571,544) (3,873,123) (60,250,222)103,186 7,683 1,332,127 112,460 15,324,318 3,931,175 26,731,342
21,834,126 406,361 4,211,824 772,744 20,780,971 5,181,646 166,662,315
616,668 2,815 120,051 6,873 187,670 263,188 7,283,02931,156 41,297 254,195 80,730 462,000 - 1,296,601
- - - - 1,769 - 39,751- - - - - - 5,580,929
105,804 6,696 1,072,773 25,960 264,749 13,067 1,631,322- - 1 - - 9,192 14,755
15,671 - 3,500 - - - 19,171- - - - 11,572 - 98,151
16,993,753 - - - - - 51,466,75328,762 54,281 365,798 148,317 731,552 87,344 2,050,229
- - - - 513,323 - 513,323- - - - 1,309,397 - 1,309,397
17,791,814 105,089 1,816,318 261,880 3,482,032 372,791 71,303,411
- - 1,059,293 - 914,508 - 1,973,801- - - - 1,506,366 - 1,506,366
28,168,951 - - - - - 28,168,9514,807 14,563 219,610 94,106 401,589 86,764 1,132,274
- - - - 7,302,864 - 7,302,864- - - - 1,257,774 - 1,257,774
28,173,758 14,563 1,278,903 94,106 11,383,101 86,764 41,342,03045,965,572 119,652 3,095,221 355,986 14,865,133 459,555 112,645,441
3,186 7,683 1,332,127 112,460 5,144,285 3,931,175 16,451,309(24,134,632) 279,026 (215,524) 304,298 771,553 790,916 37,565,565(24,131,446)$ 286,709$ 1,116,603$ 416,758$ 5,915,838$ 4,722,091$ 54,016,874$

134
Self-InsuranceBuildings and
Grounds Motor Pool CommunicationsOperating RevenuesNet premium income 341,716,909$ -$ -$ -$ Sales - - - -Charges for services - 1,159,942 22,692 6,096,830Rental income - 15,146,326 4,782,924 -Other 4,016,840 59,107 - - Total operating revenues 345,733,749 16,365,375 4,805,616 6,096,830
Operating ExpensesSalaries and benefits 2,164,391 6,121,005 842,984 1,012,011Operating 3,020,097 9,758,394 2,008,255 5,564,238Claims expense 238,725,223 - - -Materials or supplies used - - 435,892 -Depreciation 32,942 102,575 2,088,980 74,564Amortization - - - -Insurance premiums 98,884,219 - - - Total operating expenses 342,826,872 15,981,974 5,376,111 6,650,813 Operating income (loss) 2,906,877 383,401 (570,495) (553,983)Nonoperating Revenues (Expenses)Interest and investment income 215,882 - - -Interest expense - - - -Gain (loss) on disposal of assets - 1,470 196,867 - Total nonoperating revenues (expenses) 215,882 1,470 196,867 -Income (loss) before transfers 3,122,759 384,871 (373,628) (553,983)TransfersTransfers in - 203,908 - -Change in net assets 3,122,759 588,779 (373,628) (553,983)Net assets, July 1 51,567,140 3,754,601 5,605,706 1,978,947
Net assets, June 30 54,689,899$ 4,343,380$ 5,232,078$ 1,424,964$
Combining Statement of Revenues, Expenses and Changes in Fund Net AssetsInternal Service Funds
Operating Revenues
Operating Expenses
For the Fiscal Year Ended June 30, 2010
Nonoperating Revenues (Expenses)
Transfers

135
NEVADA
Insurance Premiums
Administrative Services Personnel Purchasing
Information Services Printing Total
25,479,174$ -$ -$ -$ -$ -$ 367,196,083$ - - - - - 2,768,661 2,768,661- 1,193,939 9,419,865 2,415,312 21,774,606 - 42,083,186- - - - 162,344 - 20,091,594
61,786 - 38,731 3,150 - 25,462 4,205,07625,540,960 1,193,939 9,458,596 2,418,462 21,936,950 2,794,123 436,344,600
711,029 1,016,130 6,101,282 1,995,811 11,051,321 1,567,938 32,583,9022,359,857 248,014 2,749,933 697,128 8,273,542 707,384 35,386,842
13,211,848 - - - - - 251,937,071- - - - - 667,176 1,103,068
2,009 2,886 25,078 7,148 2,907,971 347,643 5,591,796- - 857,853 - - - 857,853
5,105,976 - - - - - 103,990,19521,390,719 1,267,030 9,734,146 2,700,087 22,232,834 3,290,141 431,450,7274,150,241 (73,091) (275,550) (281,625) (295,884) (496,018) 4,893,873
662 - - - - - 216,544- - (40) (110) (118,330) - (118,480)- - - - 24,007 (155) 222,189
662 - (40) (110) (94,323) (155) 320,2534,150,903 (73,091) (275,590) (281,735) (390,207) (496,173) 5,214,126
- - - - - 160,192 364,1004,150,903 (73,091) (275,590) (281,735) (390,207) (335,981) 5,578,226
(28,282,349) 359,800 1,392,193 698,493 6,306,045 5,058,072 48,438,648
(24,131,446)$ 286,709$ 1,116,603$ 416,758$ 5,915,838$ 4,722,091$ 54,016,874$

136
Combining Statement of Cash FlowsInternal Service Funds
For the Fiscal Year Ended June 30, 2010
Self- Buildings MotorInsurance and Grounds Pool Communications
Cash flows from operating activitiesReceipts from customers and users 91,015,348$ 24,425$ 18,668$ 2,682$ Receipts for interfund services provided 177,933,617 16,155,314 4,744,916 6,778,340 Receipts from component units 76,041,748 - 78,955 8,899 Receipts of principal on loans and notes - - - - Payments to suppliers, other governments and beneficiaries (344,465,063) (8,309,243) (1,515,642) (5,339,466) Payments to employees (2,141,697) (6,143,923) (826,628) (1,006,898) Payments for interfund services used (1,153,549) (956,307) (975,304) (245,076) Payments to component units - (120) - -
Net cash provided by (used for) operating activities (2,769,596) 770,146 1,524,965 198,481
Cash flows from noncapital financing activitiesTransfers and advances from other funds - 203,908 - - Other noncapital financing activities - - - -
Net cash provided by (used for) noncapital financing activities - 203,908 - -
Cash flows from capital and related financing activitiesProceeds from sale of capital assets - 1,470 197,611 - Purchase of capital assets (65,425) (29,300) (1,243,756) (28,236) Principal paid on capital debt - - - - Interest paid on capital debt - - - - Net cash provided by (used for) capital and related financing activities (65,425) (27,830) (1,046,145) (28,236)
Cash flows from investing activitiesInterest and dividends received 592,787 - - -
Net cash provided by (used for) investing activities 592,787 - - -
Net increase (decrease) in cash (2,242,234) 946,224 478,820 170,245 Cash and cash equivalents, July 1 87,441,765 3,676,745 672,583 284,477
Cash and cash equivalents, June 30 85,199,531 $ 4,622,969 $ 1,151,403 $ 454,722 $
Reconciliation of operating income (loss) to net cash provided by (used for) operating activitiesOperating income (loss) 2,906,877 $ 383,401 $ (570,495)$ (553,983)$
Adjustments to reconcile operating income (loss) to net cash provided by (used for) operating activitiesDepreciation 32,942 102,575 2,088,980 74,564 Amortization - - - - Decrease (increase) in loans and notes receivable - - - - Decrease (increase) in accrued interest and receivables (816,005) (185,636) 36,923 693,091 Decrease (increase) in inventory, deferred charges, other assets - (134) - - Increase (decrease) in accounts payable, accruals, other liabilities (4,893,410) 469,940 (30,443) (15,191)
Total adjustments (5,676,473) 386,745 2,095,460 752,464
Net cash provided by (used for) operating activities (2,769,596)$ 770,146 $ 1,524,965 $ 198,481 $
Noncash investing, capital and financing activitiesCapital assets leased or acquired -$ -$ -$ -$ Gain (loss) on disposal of assets - - (744) - Increase (decrease) in fair value of investments (200,571) - - -

137
NEVADA
Insurance Administrative InformationPremiums Services Personnel Purchasing Services Printing Total
96,606$ -$ 3,124$ 1,497$ 480,082$ 279,394$ 91,921,826$ 24,375,315 1,193,939 9,247,940 2,416,354 21,964,974 2,525,691 267,336,400
318,665 - 176,335 25 - - 76,624,627 5,000 - - - - - 5,000
(11,874,421) (74,873) (1,210,915) (95,696) (8,072,078) (1,070,903) (382,028,300) (710,610) (1,011,509) (6,110,341) (2,013,974) (11,072,430) (1,572,570) (32,610,580)
(9,701,935) (214,694) (1,666,414) (634,851) (807,554) (260,316) (16,616,000) (70,498) - (13,030) - (88,325) - (171,973)
2,438,122 (107,137) 426,699 (326,645) 2,404,669 (98,704) 4,461,000
2,000,000 - - - - 242,504 2,446,412 - - (40) - - - (40)
2,000,000 - (40) - - 242,504 2,446,372
- - - - 27,853 - 226,934 - - (17,259) - (593,525) (60,666) (2,038,167) - - (970,267) - (2,723,967) - (3,694,234) - - - (110) (118,330) - (118,440)
- - (987,526) (110) (3,407,969) (60,666) (5,623,907)
662 - - - - - 593,449
662 - - - - - 593,449
4,438,784 (107,137) (560,867) (326,755) (1,003,300) 83,134 1,876,914 15,596,025 505,815 3,399,818 985,539 4,506,177 666,860 117,735,804
20,034,809 $ 398,678 $ 2,838,951 $ 658,784 $ 3,502,877 $ 749,994 $ 119,612,718 $
4,150,241 $ (73,091)$ (275,550)$ (281,625)$ (295,884)$ (496,018)$ 4,893,873 $
2,009 2,886 25,078 7,148 2,907,971 347,643 5,591,796 - - 857,853 - - - 857,853
5,000 - - - - - 5,000 (750,374) 430 (31,197) (586) 502,274 10,962 (540,118) (550,060) - 398 - 40 (86,928) (636,684) (418,694) (37,362) (149,883) (51,582) (709,732) 125,637 (5,710,720)
(1,712,119) (34,046) 702,249 (45,020) 2,700,553 397,314 (432,873)
2,438,122 $ (107,137)$ 426,699 $ (326,645)$ 2,404,669 $ (98,704)$ 4,461,000 $
-$ -$ -$ -$ -$ -$ -$ - - - - 6,555 (155) 5,656 - - - - - - (200,571)

138
Kayaking East Fork of the Carson River, NVPhoto Courtesy of Nevada Commission on Tourism

139
Fiduciary FuNdsPension and Other Employee Benefit Trust
Public Employees’ Retirement Accounts for the operations of the Public Employees’ Retirement System which provides income benefits to qualified public employees (NRS 286.220).
Legislators’ Retirement Accounts for the operations of the Legislators’ Retirement System (NRS 218.2375).
Judicial Retirement Accounts for the operations of the Judicial Retirement System which provides benefits for justices of the Supreme Court and district judges (NRS 1A.160).
State Retirees’ Fund Accounts for the assets accumulated and the payments made for other postemployment benefits provided to current and future State retirees. Administered as a defined benefit Other Postemployment Benefit Plan (OPEB). Funding comes from employer contributions and investment earnings (NRS 287.0436).
Investment Trust
Local Government Investment Pool Accounts for investment funds received from local governments and pooled to obtain greater interest earnings (NRS 355.167).
Nevada Enhanced Savings Term Accounts for the establishment of one or more separate subaccounts for identified investments that are made for and allocated to specific participating local governments (NRS 355.165).
Retirement Benefits Investment Fund Accounts for investment of contributions made by participating entities to support financing of other post employment benefits at some time in the future (NRS 355.220).
Private Purpose Trust
Prisoners’ Personal Property Accounts for personal property held in trust for prisoners pending their release (NRS 209.241).
Nevada College Savings Plan Accounts for participant contributions used to pay for future college expenses (NRS 353B.340).
Agency
Intergovernmental Accounts for taxes and fees, such as sales and use, property tax and motor vehicle privilege tax, collected by the Department of Taxation on behalf of local governments (NRS 353.254).
State Agency Fund for Bonds Accounts for surety bonds and deposits held by the State (NRS 353.251).
Motor Vehicle Accounts for taxes and fees collected by the Department of Motor Vehicles pending distribution to counties (NRS 482.180).
Child Support Disbursement Accounts for the centralized collection and disbursement of child support payments in accordance with 42 U.S.C. Sec. 654b (NRS 425.363).
Child Welfare Trust Accounts for survivor benefits held in trust for children receiving welfare services (NRS 432.037).
Restitution Trust Accounts for money received from parolees making restitution (NRS 213.126).
Veterans’ Custodial Accounts for the estates of persons for whom the Nevada Commissioner for Veteran Affairs acts as guardian (NRS 417.113).
State Payroll Accounts for payment of payroll and payroll deductions such as income tax withholding, insurance deductions, credit union deductions, etc. (NRS 227.130).

140
Public Employees' Retirement
Legislators' Retirement
Judicial Retirement
Other Employee
Benefit Trust Fund - State
Retirees' Fund TotalAssetsCash and pooled investments: Cash with treasurer -$ -$ -$ 29,257,133$ 29,257,133$ Cash in custody of other officials 389,957,314 25,415 382,874 - 390,365,603Investments: Investments - - - 760,739 760,739 Fixed income securities 6,184,214,644 1,228,150 14,271,162 - 6,199,713,956 Marketable equity securities 7,833,430,243 2,304,057 26,392,672 - 7,862,126,972 International securities 5,069,365,796 208,284 2,630,572 - 5,072,204,652 Mortgage loans 4,378 - - - 4,378 Real estate 853,999,874 - - - 853,999,874 Alternative investments 575,344,723 - - - 575,344,723Collateral on loaned securities 2,942,675,281 - - - 2,942,675,281Receivables: Accrued interest and dividends 97,567,846 1,365 69,403 - 97,638,614 Trades pending settlement 251,956,939 5,649 14,784 - 251,977,372 Intergovernmental receivables 88,425,497 - 723,032 35,425 89,183,954 Contributions receivable - - - - -Due from other funds - - - 1,253,180 1,253,180Due from fiduciary funds 17,964,909 - - - 17,964,909Due from component units - - - 1,312,085 1,312,085Other assets 2,053,010 - - - 2,053,010Furniture and equipment 35,321,293 - - - 35,321,293Accumulated depreciation (31,031,992) - - - (31,031,992) Total assets 24,311,249,755 3,772,920 44,484,499 32,618,562 24,392,125,736
LiabilitiesAccounts payable and accruals: Accounts payable 11,205,431 550 16,219 - 11,222,200 Intergovernmental payables - - - - - Redemptions payable - - - - - Trades pending settlement 372,683,783 894 10,113 - 372,694,790Bank overdraft - - - - -Obligations under securities lending 3,021,077,050 - - - 3,021,077,050Due to other funds 386 - - 2,723,307 2,723,693Due to fiduciary funds - - - - - Total liabilities 3,404,966,650 1,444 26,332 2,723,307 3,407,717,733
Net assetsHeld in trust for: Employees' pension benefits 20,906,283,105 3,771,476 44,458,167 - 20,954,512,748 OPEB benefits - - - 29,895,255 29,895,255 Pool participants - - - - - Individuals - - - - -Total net assets 20,906,283,105$ 3,771,476$ 44,458,167$ 29,895,255$ 20,984,408,003$
Pension Trust Funds
Combining Statement of Fiduciary Net AssetsPension and Other Employee Benefit Trust, Investment Trust and Private–Purpose Trust Funds
Assets
Liabilities
June 30, 2010
Net Assets

141
NEVADA
Local Government Investment
Pool
Nevada Enhanced
Savings Term
Retirement Benefits
Investment Fund Total
Prisoners' Personal Property
Nevada College Savings Plan Total
73$ -$ -$ 73$ 4,773,745$ -$ 4,773,745$ - - 5,969,877 5,969,877 - 5,320,660 5,320,660
586,527,217 352,237,565 24,645,442 963,410,224 - 5,885,633,932 5,885,633,932- - - - - - -- - - - - - -- - - - - - -- - - - - - -- - - - - - -- - - - - - -- - - - - - -
316,847 1,293,724 37,763 1,648,334 - 7,000 7,000- - - - - 11,666,158 11,666,158- - - - 65,333 - 65,333- - - - - 4,710,000 4,710,000
82,924 - - 82,924 173,747 - 173,747- - - - - - -- - - - - - -- - - - - - -- - - - - - -- - - - - - -
586,927,061 353,531,289 30,653,082 971,111,432 5,012,825 5,907,337,750 5,912,350,575
- 133,258 14,321 147,579 136,471 1,760,123 1,896,5948,973 - - 8,973 13,474 - 13,474
- - - - - 1,954,521 1,954,521- - 5,475,724 5,475,724 - 15,222,321 15,222,321- - - - - 4,000 4,000- - - - - - -
454 - - 454 539,732 - 539,732- - - - 12,687 - 12,687
9,427 133,258 5,490,045 5,632,730 702,364 18,940,965 19,643,329
- - - - - - -- - - - - - -
586,917,634 353,398,031 25,163,037 965,478,702 - - -- - - - 4,310,461 5,888,396,785 5,892,707,246
586,917,634$ 353,398,031$ 25,163,037$ 965,478,702$ 4,310,461$ 5,888,396,785$ 5,892,707,246$
Private Purpose Trust FundsInvestment Trust Funds

142
Public Employees' Retirement
Legislators' Retirement
Judicial Retirement
Other Employee
Benefit Trust Fund - State
Retirees' Fund TotalAdditionsContributions: Employer 1,281,714,847$ 200,866$ 5,836,481$ 34,079,401$ 1,321,831,595$ Plan members 99,683,851 30,601 - - 99,714,452 Participants - - - - - Repayment and purchase of service 26,890,242 - - - 26,890,242Total contributions 1,408,288,940 231,467 5,836,481 34,079,401 1,448,436,289
Investment income: Net increase (decrease) in fair value of investments 1,418,887,486 447,441 4,590,852 3,734,424 1,427,660,203 Interest, dividends 596,336,416 49,509 553,196 127,975 597,067,096 Net securities lending income 1,726,152 - - - 1,726,152 Other 66,326,682 - - - 66,326,682
2,083,276,736 496,950 5,144,048 3,862,399 2,092,780,133Less investment expense: Other (23,898,938) (821) (10,348) - (23,910,107)Net investment income 2,059,377,798 496,129 5,133,700 3,862,399 2,068,870,026
Other: Investment from local governments - - - - - Reinvestment from interest income - - - - - Other 1,931,123 48,843 31 - 1,979,997Total other 1,931,123 48,843 31 - 1,979,997 Total additions 3,469,597,861 776,439 10,970,212 37,941,800 3,519,286,312
DeductionsPrincipal redeemed - - - - -Benefit payments 1,301,633,191 399,368 3,114,507 31,555,808 1,336,702,874Refunds 20,270,764 - - - 20,270,764Contribution distributions 429,264 - - - 429,264Dividends to investors - - - - -Administrative expense 11,118,633 46,962 71,369 26,691 11,263,655 Total deductions 1,333,451,852 446,330 3,185,876 31,582,499 1,368,666,557
Change in net assets 2,136,146,009 330,109 7,784,336 6,359,301 2,150,619,755Net assets, July 1 18,770,137,096 3,441,367 36,673,831 23,535,954 18,833,788,248Net assets, June 30 20,906,283,105$ 3,771,476$ 44,458,167$ 29,895,255$ 20,984,408,003$
Pension Trust Funds
Combining Statement of Changes in Fiduciary Net AssetsPension and Other Employee Benefit Trust, Investment Trust and Private–Purpose Trust Funds
Additions
Deductions
For the Fiscal Year Ended June 30, 2010

143
NEVADA
Local Government Investment
Pool
Nevada Enhanced
Savings Term
Retirement Benefits
Investment Fund Total
Prisoners' Personal Property
Nevada College Savings Plan Total
-$ -$ -$ -$ -$ -$ -$ - - - - - - -- - - - 17,554,823 1,725,537,980 1,743,092,803- - - - - - -- - - - 17,554,823 1,725,537,980 1,743,092,803
(28,851) (1,225,309) 1,176,634 (77,526) - 450,178,644 450,178,6441,294,616 12,312,676 1,012,899 14,620,191 - 138,843,674 138,843,674
- - - - - - -- - - - - - -
1,265,765 11,087,367 2,189,533 14,542,665 - 589,022,318 589,022,318
- - (9,922) (9,922) - - -1,265,765 11,087,367 2,179,611 14,532,743 - 589,022,318 589,022,318
776,693,379 3,000,000 5,866,227 785,559,606 - - -1,211,961 - - 1,211,961 - - -
- - 53 53 - - -777,905,340 3,000,000 5,866,280 786,771,620 - - -779,171,105 14,087,367 8,045,891 801,304,363 17,554,823 2,314,560,298 2,332,115,121
868,209,736 9,040,275 - 877,250,011 - 972,973,972 972,973,972- - - - 17,640,812 - 17,640,812- - - - - - -- - - - - - -
1,282,640 - - 1,282,640 - - -11,975 529,266 19,020 560,261 - 21,623,909 21,623,909
869,504,351 9,569,541 19,020 879,092,912 17,640,812 994,597,881 1,012,238,693
(90,333,246) 4,517,826 8,026,871 (77,788,549) (85,989) 1,319,962,417 1,319,876,428677,250,880 348,880,205 17,136,166 1,043,267,251 4,396,450 4,568,434,368 4,572,830,818586,917,634$ 353,398,031$ 25,163,037$ 965,478,702$ 4,310,461$ 5,888,396,785$ 5,892,707,246$
Private Purpose Trust FundsInvestment Trust Funds

144
IntergovernmentalState Agency Fund
for Bonds Motor VehicleChild Support Disbursement
AssetsCash and pooled investments: Cash with treasurer 10,367,534$ 56,476,232$ 26,750,994$ -$ Cash in custody of other officials - 74,797,437 5,639,489 3,552,924
Investments - 175,661,293 - -
Receivables: Taxes receivable 10,503,877 - - - Other receivables - - 33,837,971 -
Due from other funds 367,404,453 1,072,320 485,781 -Due from fiduciary funds 11,194,115 - 563 - Total assets 399,469,979$ 308,007,282$ 66,714,798$ 3,552,924$
LiabilitiesAccounts payable and accruals: Accrued payroll and related liabilities -$ -$ -$ -$ Intergovernmental payables 399,469,979 - 47,659,586 -
Due to fiduciary funds - - 11,194,115 -Other liabilities: Deposits - 307,966,506 7,766,387 - Other liabilities - 40,776 94,710 3,552,924 Total liabilities 399,469,979$ 308,007,282$ 66,714,798$ 3,552,924$
Assets
Liabilities
Combining Statement of Fiduciary Assets and LiabilitiesAgency Funds
June 30, 2010

145
NEVADA
Child Welfare Trust Restitution TrustVeterans' Custodial State Payroll Total
18,041$ 1,936,816$ 100,212$ 17,852,440$ 113,502,269$ - - - - 83,989,850
- - - - 175,661,293
- - - - 10,503,877- - - - 33,837,971
783 340 53 156,370 369,120,100- 12,124 - - 11,206,802
18,824$ 1,949,280$ 100,265$ 18,008,810$ 797,822,162$
-$ -$ -$ 43,901$ 43,901$ 13,423 - - - 447,142,988
- - - 17,964,909 29,159,024
- - - - 315,732,8935,401 1,949,280 100,265 - 5,743,356
18,824$ 1,949,280$ 100,265$ 18,008,810$ 797,822,162$

146
Balance BalanceJuly 1, 2009 Additions Deletions June 30, 2010
IntergovernmentalAssetsCash with treasurer 13,981,835$ 2,578,881,778$ 2,582,496,079$ 10,367,534$ Taxes receivable 10,444,666 26,349,262 26,290,051 10,503,877 Due from other funds 347,438,143 367,404,453 347,438,143 367,404,453 Due from fiduciary funds 11,569,272 11,194,115 11,569,272 11,194,115 Total assets 383,433,916$ 2,983,829,608$ 2,967,793,545$ 399,469,979$ LiabilitiesIntergovernmental payables 383,433,916$ 2,994,507,015$ 2,978,470,952$ 399,469,979$ Total liabilities 383,433,916$ 2,994,507,015$ 2,978,470,952$ 399,469,979$ State Agency Fund for BondsAssetsCash with treasurer 55,316,829$ 6,916,967$ 5,757,564$ 56,476,232$ Cash in custody of other officials 72,393,269 13,992,208 11,588,040 74,797,437 Investments 154,842,201 84,498,569 63,679,477 175,661,293 Due from other funds 1,010,931 1,072,320 1,010,931 1,072,320 Total assets 283,563,230$ 106,480,064$ 82,036,012$ 308,007,282$ LiabilitiesDeposits 283,523,238$ 104,306,175$ 79,862,907$ 307,966,506$ Other liabilities 39,992 822 38 40,776 Total liabilities 283,563,230$ 104,306,997$ 79,862,945$ 308,007,282$ Motor VehicleAssetsCash with treasurer 20,899,358$ 1,061,755,318$ 1,055,903,682$ 26,750,994$ Cash in custody of other officials 3,239,403 2,562,486 162,400 5,639,489 Intergovernmental receivables 215,958 - 215,958 - Other receivables 35,829,200 66,420,479 68,411,708 33,837,971 Due from other funds 1,485,451 485,781 1,485,451 485,781 Due from fiduciary funds 240 563 240 563 Total assets 61,669,610$ 1,131,224,627$ 1,126,179,439$ 66,714,798$ LiabilitiesIntergovernmental payables 45,384,885$ 1,116,246,030$ 1,113,971,329$ 47,659,586$ Due to fiduciary funds 11,569,272 11,194,115 11,569,272 11,194,115 Deposits 4,546,557 3,450,439 230,609 7,766,387 Other liabilities 168,896 - 74,186 94,710 14,160 157,848 Total liabilities 61,669,610$ 1,130,890,584$ 1,125,845,396$ 66,714,798$ Child Support Disbursement Assets Cash in custody of other officials 3,961,512$ 194,790,707$ 195,199,295$ 3,552,924$ Total assets 3,961,512$ 194,790,707$ 195,199,295$ 3,552,924$ LiabilitiesOther liabilities 3,961,512$ 194,121,771$ 194,530,359$ 3,552,924$ Total liabilities 3,961,512$ 194,121,771$ 194,530,359$ 3,552,924$ Child Welfare TrustAssetsCash with treasurer 41,871$ 336,867$ 360,697$ 18,041$ Other receivables 5,594 - 5,594 - Due from other funds 467 783 467 783 Total assets 47,932$ 337,650$ 366,758$ 18,824$ LiabilitiesIntergovernmental payables -$ 13,423$ -$ 13,423$ Other liabilities 47,932 373,010 415,541 5,401 Total liabilities 47,932$ 386,433$ 415,541$ 18,824$
Intergovernmental
State Agency Fund for Bonds
Combining Statement of Changes in Assets and LiabilitiesAgency Funds
For the Fiscal Year Ended June 30, 2010
Motor Vehicle
Child Support Disbursement
Child Welfare Trust

147
NEVADA
Balance BalanceJuly 1, 2009 Additions Deletions June 30, 2010
Restitution Trust Assets Cash with treasurer 1,325,601$ 3,095,312$ 2,484,097$ 1,936,816$ Due from other funds 657 340 657 340 Due from fiduciary funds 13,804 12,124 13,804 12,124 Total assets 1,340,062$ 3,107,776$ 2,498,558$ 1,949,280$ LiabilitiesOther liabilities 1,340,062$ 3,087,898$ 2,478,680$ 1,949,280$ Total liabilities 1,340,062$ 3,087,898$ 2,478,680$ 1,949,280$ Veterans CustodialAssetsCash with treasurer 1,019,849$ 84,341$ 1,003,978$ 100,212$ Due from other funds 8,891 53 8,891 53 Total assets 1,028,740$ 84,394$ 1,012,869$ 100,265$ LiabilitiesOther liabilities 1,028,740$ 84,376$ 1,012,851$ 100,265$ Total liabilities 1,028,740$ 84,376$ 1,012,851$ 100,265$ State PayrollAssetsCash with treasurer 17,364,311$ 634,511,033$ 634,022,904$ 17,852,440$ Due from other funds 50,536 156,370 50,536 156,370 Total assets 17,414,847$ 634,667,403$ 634,073,440$ 18,008,810$ LiabilitiesAccrued payroll and related liabilities 7,250$ 400,326,064$ 400,289,413$ 43,901$ Due to fiduciary funds 17,407,597 234,872,716 234,315,404 17,964,909 Total liabilities 17,414,847$ 635,198,780$ 634,604,817$ 18,008,810$ Totals - All Agency FundsAssetsCash with treasurer 109,949,654$ 4,285,581,616$ 4,282,029,001$ 113,502,269$ Cash in custody of other officials 79,594,184 211,345,401 206,949,735 83,989,850 Investments 154,842,201 84,498,569 63,679,477 175,661,293 Taxes receivable 10,444,666 26,349,262 26,290,051 10,503,877 Intergovernmental receivables 215,958 - 215,958 - Other receivables 35,834,794 66,420,479 68,417,302 33,837,971 Due from other funds 349,995,076 369,120,100 349,995,076 369,120,100 Due from fiduciary funds 11,583,316 11,206,802 11,583,316 11,206,802 Total assets 752,459,849$ 5,054,522,229$ 5,009,159,916$ 797,822,162$ LiabilitiesAccrued payroll and related liabilities 7,250$ 400,326,064$ 400,289,413$ 43,901$ Intergovernmental payables 428,818,801 4,110,766,468 4,092,442,281 447,142,988 Due to fiduciary funds 28,976,869 246,066,831 245,884,676 29,159,024 Deposits 288,069,795 107,756,614 80,093,516 315,732,893 Other liabilities 6,587,134 197,667,877 198,511,655 5,743,356 Total liabilities 752,459,849$ 5,062,583,854$ 5,017,221,541$ 797,822,162$
Restitution Trust
Veterans Custodial
State Payroll
Totals - All Agency Funds

148
Free Fishing DayCave Lake, NV
Photo Courtesy of Nevada Department of Wildlife
149
This part of the State of Nevada’s comprehensive annual financial report presents detailed information as a context for understanding what the information in the financial statements, note disclosures, and required supplementary information says about the government’s overall financial health.
Tables Pages
Financial Trends
These tables contain trend information to help the reader understand how the government’s financial performance and well-being have changed over time.
revenue caPaciTy
These tables contain information to help the reader assess the government’s most significant revenue source, taxable sales.
debT caPaciTy
These tables present information to help the reader assess the affordability of the government’s current levels of outstanding debt and the government’s ability to issue additional debt in the future.
demograPhic and economic inFormaTion
These tables offer demographic and economic indicators to help the reader understand the environment within which the government’s financial activities take place.
oPeraTing inFormaTion
These tables contain service and infrastructure data to help the reader understand how the information in the government’s financial report relates to the services the government provides and the activities it performs.
Sources: Unless otherwise noted, the information in these tables is derived from the comprehensive annual financial reports of the relevant year.
150
154
155
159
162
StatiStical Section

Sta
tistic
al T
able
s
150
NEVA
DA
Last
Nin
e Fi
scal
Yea
rs, (
Acc
rual
Bas
is o
f Acc
ount
ing,
Exp
ress
ed in
Tho
usan
ds)
Tabl
e 2
- Cha
nges
in N
et A
sset
s
Last
Nin
e Fi
scal
Yea
rs, (
Acc
rual
Bas
is o
f Acc
ount
ing,
Exp
ress
ed in
Tho
usan
ds)
Tabl
e 1
- Net
Ass
ets
by C
ompo
nent
Gov
ernm
enta
l Act
iviti
es20
0220
0320
0420
0520
0620
0720
0820
0920
10
Inv
este
d in
cap
ital a
sset
s, n
et o
f rel
ated
deb
t3,
149,
657
$
3,22
2,05
2$
3,
493,
458
$
3,25
7,46
9$
3,
445,
629
$
3,48
6,15
5$
3,
522,
177
$
3,49
2,20
5$
3,
622,
787
$
R
estri
cted
402,
535
432,
125
484,
164
663,
901
675,
966
613,
375
697,
168
702,
743
683,
526
U
nres
trict
ed (d
efic
it) (
a)(3
1,96
9)(1
61,8
33)
(153
,370
)30
3,70
450
4,54
162
3,78
728
9,12
3(2
36,9
12)
(224
,799
)To
tal g
over
nmen
tal a
ctiv
ities
net
ass
ets
3,52
0,22
3$
3,
492,
344
$
$3,8
24,2
524,
225,
074
$
4,62
6,13
6$
4,
723,
317
$
4,50
8,46
8$
3,
958,
036
$
4,08
1,51
4$
B
usin
ess-
type
Act
iviti
es
Inv
este
d in
cap
ital a
sset
s, n
et o
f rel
ated
deb
t2,
659
$
3,05
9$
3,
047
$
2,90
6$
2,
824
$
2,78
3$
3,
393
$
3,28
6$
3,
615
$
R
estri
cted
826,
190
801,
846
821,
829
956,
895
1,14
3,24
81,
293,
737
1,29
7,61
381
9,34
846
4,34
6
Unr
estri
cted
(def
icit)
8,00
98,
029
8,47
58,
470
6,42
89,
441
10,2
06(5
,466
)(3
03,7
05)
Tota
l bus
ines
s-ty
pe a
ctiv
ities
net
ass
ets
836,
858
$
81
2,93
4$
$833
,351
968,
271
$
1,
152,
500
$
1,30
5,96
1$
1,
311,
212
$
817,
168
$
16
4,25
6$
Prim
ary
Gov
ernm
ent
I
nves
ted
in c
apita
l ass
ets,
net
of r
elat
ed d
ebt
3,15
2,31
6$
3,
225,
111
$
3,49
6,50
5$
3,
260,
375
$
3,44
8,45
3$
3,
488,
938
$
3,52
5,57
0$
3,
495,
491
$
3,62
6,40
2$
Res
trict
ed1,
228,
725
1,23
3,97
11,
305,
993
1,62
0,79
61,
819,
214
1,90
7,11
21,
994,
781
1,52
2,09
11,
147,
872
U
nres
trict
ed (d
efic
it) (
a)(2
3,96
0)(1
53,8
04)
(144
,895
)31
2,17
451
0,96
963
3,22
829
9,32
9(2
42,3
78)
(528
,504
)To
tal p
rimar
y go
vern
men
t net
ass
ets
4,35
7,08
1$
4,
305,
278
$
$4,6
57,6
035,
193,
345
$
5,77
8,63
6$
6,
029,
278
$
5,81
9,68
0$
4,
775,
204
$
4,24
5,77
0$
Not
es:
The
Sta
te d
id n
ot b
egin
repo
rting
gov
ernm
ent-w
ide
stat
emen
ts u
ntil
it im
plem
ente
d G
AS
B S
tate
men
t 34
in fi
scal
yea
r 200
2.(a
) The
200
3 le
gisl
ativ
e se
ssio
n en
acte
d ch
ange
s in
the
Sta
te's
tax
stru
ctur
e, w
hich
resu
lted
in in
crea
ses
in g
ener
al re
venu
es a
nd th
e un
rest
ricte
d ne
t ass
ets.
The
se c
hang
es w
ent i
nto
effe
ct
in O
ctob
er 2
003,
with
the
first
full
fisca
l yea
r res
ults
see
n in
200
5.
2002
2003
2004
2005
2006
2007
2008
2009
2010
Expe
nses
Gov
ernm
enta
l act
iviti
es:
G
ener
al g
over
nmen
t20
9,07
4 $
226,
761
$
22
6,58
5$
304,
926
$
34
9,22
4$
421,
291
$
43
9,68
2$
38
9,94
3$
375,
219
$
Hea
lth a
nd s
ocia
l ser
vice
s (c
)1,
604,
205
1,81
7,00
11,
888,
806
2,08
2,56
22,
198,
551
2,34
0,88
42,
454,
843
2,66
7,41
93,
017,
013
E
duca
tion
and
supp
ort s
ervi
ces
1,36
3,53
61,
439,
255
1,66
3,86
21,
717,
479
1,83
0,23
62,
254,
626
2,38
1,73
12,
475,
416
2,43
0,92
3
Law
, jus
tice
and
publ
ic s
afet
y44
8,08
244
4,77
448
5,48
053
5,37
157
8,04
962
4,14
965
0,65
768
7,41
069
0,10
4
Reg
ulat
ion
of b
usin
ess
81,8
0081
,674
86,3
1892
,240
101,
857
104,
385
114,
786
118,
086
100,
380
Tr
ansp
orta
tion
356,
692
394,
489
474,
416
665,
315
508,
569
680,
281
576,
815
762,
610
644,
976
R
ecre
atio
n an
d re
sour
ce d
evel
opm
ent
115,
082
124,
426
132,
106
157,
881
156,
933
173,
037
167,
627
165,
741
161,
048
In
tere
st o
n lo
ng-te
rm d
ebt
121,
092
112,
096
130,
902
141,
154
132,
969
150,
486
146,
312
138,
304
132,
238
U
nallo
cate
d de
prec
iatio
n1,
144
1,15
21,
315
1,44
11,
513
720
992
976
1,44
8To
tal g
over
nmen
tal a
ctiv
ities
exp
ense
s4,
300,
707
4,64
1,62
85,
089,
790
5,69
8,36
95,
857,
901
6,74
9,85
96,
933,
445
7,40
5,90
57,
553,
349
Bus
ines
s-ty
pe a
ctiv
ities
:
Une
mpl
oym
ent i
nsur
ance
407,
241
377,
395
334,
065
238,
386
239,
232
296,
784
439,
632
1,33
6,04
32,
233,
382
H
ousi
ng76
,904
71,9
2760
,250
53,0
1145
,397
46,1
5243
,953
44,3
8257
,342
W
ater
loan
s4,
930
4,71
55,
856
7,71
08,
226
7,88
56,
836
6,21
814
,697
W
orke
rs' c
ompe
nsat
ion
and
safe
ty19
,581
19,2
7420
,685
21,0
0423
,991
25,3
8126
,258
26,8
0126
,084
H
ighe
r edu
catio
n (a
)-
--
11,4
9618
,940
10,5
048,
109
13,1
0314
,051
O
ther
12,6
9513
,134
13,0
2114
,706
15,6
0116
,424
20,4
9616
,967
23,1
75To
tal b
usin
ess-
type
act
iviti
es e
xpen
ses
521,
351
486,
445
433,
877
346,
313
351,
387
403,
130
545,
284
1,44
3,51
42,
368,
731
Tota
l prim
ary
gove
rnm
ent e
xpen
ses
4,82
2,05
8$
5,
128,
073
$
5,52
3,66
7$
6,
044,
682
$
6,20
9,28
8$
7,
152,
989
$
7,47
8,72
9$
8,84
9,41
9$
9,
922,
080
$

151
Prog
ram
Rev
enue
sG
over
nmen
tal a
ctiv
ities
:
Cha
rges
for s
ervi
ces:
Gen
eral
gov
ernm
ent
146,
391
$
15
3,10
8$
181,
530
$
20
0,39
0$
226,
191
$
25
4,94
7$
254,
198
$
281,
997
$
28
5,92
7$
Hea
lth a
nd s
ocia
l ser
vice
s10
6,84
613
4,84
712
7,74
313
3,65
113
8,67
512
5,91
514
7,78
514
1,47
313
1,40
8
La
w, j
ustic
e an
d pu
blic
saf
ety
187,
717
195,
259
214,
363
261,
254
242,
262
256,
015
257,
355
252,
755
236,
004
Oth
er92
,005
81,4
8011
4,51
614
2,43
016
2,02
814
8,95
913
5,03
411
8,66
814
3,68
9
Ope
ratin
g gr
ants
and
con
tribu
tions
1,28
4,45
31,
499,
849
1,63
8,07
31,
829,
252
1,84
8,09
12,
025,
361
1,98
2,31
52,
544,
032
3,14
1,98
6
Cap
ital g
rant
s an
d co
ntrib
utio
ns2,
260
8,53
59,
320
7,79
527
,080
16,0
1021
,871
19,6
0856
,719
Tota
l gov
ernm
enta
l act
iviti
es p
rogr
am re
venu
es1,
819,
672
2,07
3,07
82,
285,
545
2,57
4,77
22,
644,
327
2,82
7,20
72,
798,
558
3,35
8,53
33,
995,
733
Bus
ines
s-ty
pe a
ctiv
ities
:
Cha
rges
for s
ervi
ces:
Une
mpl
oym
ent i
nsur
ance
--
--
--
-1,
460
1,66
9
H
ousi
ng61
,682
54,8
5441
,183
34,9
3133
,589
32,3
7230
,721
26,6
0423
,693
Wor
kers
' com
pens
atio
n an
d sa
fety
22,6
9420
,703
32,3
8533
,892
25,5
9336
,037
35,6
3238
,955
30,1
44
O
ther
21,8
3221
,659
26,2
3927
,534
30,6
1134
,635
40,8
7438
,225
31,8
50
Ope
ratin
g gr
ants
and
con
tribu
tions
179,
379
131,
771
98,4
6983
,672
111,
598
99,5
4688
,335
525,
550
1,33
5,17
7To
tal b
usin
ess-
type
act
iviti
es p
rogr
am re
venu
es28
5,58
722
8,98
719
8,27
618
0,02
920
1,39
120
2,59
019
5,56
263
0,79
41,
422,
533
Tota
l prim
ary
gove
rnm
ent p
rogr
am re
venu
es2,
105,
259
$
2,30
2,06
5$
2,
483,
821
$
2,75
4,80
1$
2,
845,
718
$
3,02
9,79
7$
2,
994,
120
$
3,
989,
327
$
5,41
8,26
6$
N
et (E
xpen
se)/R
even
ueG
over
nmen
tal a
ctiv
ities
(2,4
81,0
35)
$
(2,5
68,5
50)
$
(2,8
04,2
45)
$
(3,1
23,5
97)
$
(3,2
13,5
74)
$
(3,9
22,6
52)
$
(4,1
34,8
87)
$
(4
,047
,372
)$
(3
,557
,616
)$
B
usin
ess-
type
act
iviti
es(2
35,7
64)
(257
,458
)(2
35,6
01)
(166
,284
)(1
49,9
96)
(200
,540
)(3
49,7
22)
(812
,720
)(9
46,1
98)
Tota
l prim
ary
gove
rnm
ent n
et e
xpen
se(2
,716
,799
)$
(2
,826
,008
)$
(3
,039
,846
)$
(3
,289
,881
)$
(3
,363
,570
)$
(4
,123
,192
)$
(4
,484
,609
)$
(4,8
60,0
92)
$
(4,5
03,8
14)
$
Gen
eral
Rev
enue
s an
d O
ther
Cha
nges
in N
et A
sset
sG
over
nmen
tal a
ctiv
ities
:
Sal
es a
nd u
se ta
xes
724,
399
$
76
0,89
1$
855,
687
$
99
9,62
3$
1,09
7,93
9$
1,
149,
456
$
1,10
1,74
1$
943,
787
$
87
0,47
4$
G
amin
g ta
xes
697,
482
735,
652
834,
791
900,
261
1,00
3,11
11,
029,
044
1,01
1,50
688
3,05
484
4,47
0
Mod
ified
bus
ines
s ta
xes
(b)
--
161,
650
226,
924
255,
252
282,
729
297,
161
281,
605
381,
300
In
sura
nce
prem
ium
taxe
s15
6,34
717
3,99
319
4,21
821
5,35
323
8,29
726
1,37
825
6,84
724
1,25
223
3,28
0
Pro
perty
and
tran
sfer
taxe
s (b
)99
,234
95,8
0820
4,86
628
7,41
031
8,94
129
6,49
828
0,89
627
8,88
126
6,87
8
Mot
or a
nd s
peci
al fu
el ta
xes
242,
670
253,
951
269,
131
281,
726
297,
383
300,
182
297,
087
272,
614
268,
554
O
ther
taxe
s25
8,86
327
1,16
935
0,18
536
2,79
739
8,46
042
7,10
942
5,25
040
7,46
964
2,97
9
Inve
stm
ent e
arni
ngs
35,8
3926
,712
10,9
9625
,238
87,7
2914
3,01
310
5,07
59,
026
(1,2
46)
O
ther
147,
228
181,
267
205,
597
162,
869
86,3
7199
,476
116,
082
148,
321
146,
879
C
ontri
butio
ns to
per
man
ent f
und
8,75
915
,952
31,6
9344
,598
76,5
5312
,208
8,80
17,
019
8,16
5
Spe
cial
item
-
8,48
5-
-(2
76,7
73)
--
--
Tr
ansf
ers
19,2
3816
,791
17,3
3917
,620
31,3
7318
,740
19,5
9223
,912
19,3
61To
tal g
over
nmen
tal a
ctiv
ities
2,39
0,05
92,
540,
671
3,13
6,15
33,
524,
419
3,61
4,63
64,
019,
833
3,92
0,03
83,
496,
940
3,68
1,09
4B
usin
ess-
type
act
iviti
es:
O
ther
taxe
s24
0,60
825
0,32
527
3,35
732
0,62
236
5,59
837
2,74
137
4,56
534
2,58
831
4,65
7
Oth
er2
--
--
--
--
Tr
ansf
ers
(19,
238)
(16,
791)
(17,
339)
(17,
620)
(31,
373)
(18,
740)
(19,
592)
(23,
912)
(19,
361)
Tota
l bus
ines
s-ty
pe a
ctiv
ities
221,
372
233,
534
256,
018
303,
002
334,
225
354,
001
354,
973
318,
676
295,
296
Tota
l prim
ary
gove
rnm
ent
2,61
1,43
1$
2,
774,
205
$
3,39
2,17
1$
3,
827,
421
$
3,94
8,86
1$
4,
373,
834
$
4,27
5,01
1$
3,81
5,61
6$
3,
976,
390
$
Cha
nge
in N
et A
sset
sG
over
nmen
tal a
ctiv
ities
(90,
976)
$
(2
7,87
9)$
331,
908
$
40
0,82
2$
401,
062
$
97
,181
$
(214
,849
)$
(5
50,4
32)
$
12
3,47
8$
Bus
ines
s-ty
pe a
ctiv
ities
(14,
392)
(23,
924)
20,4
1713
6,71
818
4,22
915
3,46
15,
251
(494
,044
)(6
50,9
02)
Tota
l prim
ary
gove
rnm
ent
(105
,368
)$
(51,
803)
$
35
2,32
5$
537,
540
$
58
5,29
1$
250,
642
$
(2
09,5
98)
$
(1,0
44,4
76)
$
(527
,424
)$
Not
es:
The
Sta
te d
id n
ot b
egin
repo
rting
gov
ernm
ent-w
ide
stat
emen
ts u
ntil
it im
plem
ente
d G
AS
B S
tate
men
t 34
in fi
scal
yea
r 200
2.(a
) Effe
ctiv
e in
fisc
al y
ear 2
005,
The
Hig
her E
duca
tion
Tuiti
on T
rust
Fun
d w
as re
clas
sifie
d fro
m a
priv
ate-
purp
ose
trust
fund
to a
n en
terp
rise
fund
.(b
) The
200
3 le
gisl
ativ
e se
ssio
n en
acte
d ch
ange
s in
the
Sta
te's
tax
stru
ctur
e w
hich
wen
t int
o ef
fect
in O
ctob
er 2
003.
The
firs
t ful
l fis
cal y
ear r
esul
ts o
f the
se c
hang
es c
an b
e se
en b
egin
ning
with
fisc
al y
ear 2
005.
(c)T
hein
crea
sein
heal
than
dso
cial
serv
ices
expe
nses
from
FY02
toFY
03w
aspr
imar
ilydu
eto
the
effe
cts
ofth
eS
epte
mbe
r11,
2001
terr
oris
tatta
cks,
resu
lting
inan
incr
ease
inun
empl
oym
enta
ndan
incr
ease
inM
edic
aid
case
load
.

Sta
tistic
al T
able
s
152
NEVA
DA
Last
Nin
e Fi
scal
Yea
rs, (
Mod
ified
Acc
rual
Bas
is o
f Acc
ount
ing,
Exp
ress
ed in
Tho
usan
ds)
Tabl
e 4
- Cha
nges
in F
und
Bal
ance
s of
Gov
ernm
enta
l Fun
ds
Tab
le 3
- Fu
nd B
alan
ces
of G
over
nmen
tal F
unds
Last
Nin
e Fi
scal
Yea
rs, (
Mod
ified
Acc
rual
Bas
is o
f Acc
ount
ing,
Exp
ress
ed in
Tho
usan
ds)
2002
2003
2004
2005
2006
2007
2008
2009
2010
Gen
eral
Fun
d
Res
erve
d43
,256
$
68,5
40$
66
,523
$
65,6
56$
35
,336
$
17,5
85$
15
,088
$
13,5
12$
12
,463
$
U
nres
erve
d7,
492
40,9
8127
5,58
647
4,34
248
6,16
0
427,
506
38
4,66
3
179,
310
22
2,09
5
Tota
l Gen
eral
fund
50,7
48$
10
9,52
1$
342,
109
$
53
9,99
8$
521,
496
$
44
5,09
1$
399,
751
$
19
2,82
2$
234,
558
$
All O
ther
Gov
ernm
enta
l Fun
ds
Res
erve
d1,
474,
192
$
1,38
4,53
0$
65
1,73
8$
798,
715
$
1,
004,
407
$
1,24
4,43
0$
1,
311,
024
$
947,
719
$
1,
078,
045
$
U
nres
erve
d, re
porte
d in
:
S
peci
al re
venu
e fu
nds
383,
769
260,
297
1,15
6,79
71,
225,
603
1,03
8,75
3
77
1,88
7
403,
715
39
6,52
0
203,
466
C
apita
l pro
ject
s fu
nds
51,3
5271
,137
41,8
7146
,316
39,3
65
87
,057
17,4
02
73
,892
59,9
44
P
erm
anen
t fun
ds21
2222
2121
22
22
20
20
Tota
l all
othe
r gov
ernm
enta
l fun
ds1,
909,
334
$
1,71
5,98
6$
1,
850,
428
$
2,07
0,65
5$
2,
082,
546
$
2,10
3,39
6$
1,
732,
163
$
1,41
8,15
1$
1,
341,
475
$
Not
e: D
ue to
cha
nges
in th
e S
tate
's fu
nd s
truct
ure
initi
ated
whe
n G
AS
B S
tate
men
t 34
was
impl
emen
ted,
the
fund
bal
ance
info
rmat
ion
is a
vaila
ble
only
beg
inni
ng in
200
2.
2002
2003
2004
2005
2006
2007
2008
2009
2010
Rev
enue
sG
amin
g ta
xes,
fees
, lic
ense
s69
7,48
2 $
735,
652
$
83
4,79
1 $
900,
261
$
1,
003,
111
$
1,02
8,66
3$
1,
008,
516
$
880,
573
$
84
2,35
9$
Sal
es ta
xes
718,
910
75
6,96
2
858,
866
99
3,32
4
1,09
9,48
3
1,
132,
418
1,08
8,02
4
95
3,11
2
870,
539
M
odifi
ed b
usin
ess
taxe
s (a
)-
-
16
1,64
9
226,
923
25
5,25
2
278,
953
28
4,60
0
277,
516
38
5,11
0
Insu
ranc
e pr
emiu
m ta
xes
156,
347
17
3,99
3
194,
218
21
5,35
3
238,
297
25
9,27
5
256,
693
23
8,52
4
233,
906
P
rope
rty a
nd tr
ansf
er ta
xes
(a)
99,2
34
95,8
08
204,
866
28
7,41
0
318,
941
29
6,49
8
280,
895
27
8,88
1
266,
878
M
otor
and
spe
cial
fuel
taxe
s24
2,67
0
253,
951
26
9,13
2
281,
726
29
7,38
3
300,
182
29
7,08
8
272,
614
26
8,55
4
Oth
er ta
xes
263,
657
26
9,76
2
348,
238
35
2,32
1
343,
292
37
3,43
6
372,
652
38
7,44
9
620,
543
In
terg
over
nmen
tal
1,34
7,25
1
1,
662,
820
1,82
5,72
3
1,
943,
630
1,97
2,79
9
2,
108,
916
2,05
8,07
1
2,
672,
751
3,27
3,26
6
Li
cens
es, f
ees
and
perm
its27
0,72
4
280,
851
34
4,23
8
377,
419
42
2,93
4
429,
501
43
2,72
9
419,
514
45
2,83
8
Sal
es a
nd c
harg
es fo
r ser
vice
s54
,953
58
,585
76
,173
81
,561
80
,134
97
,408
95
,407
85
,401
84
,422
In
tere
st a
nd in
vest
men
t inc
ome
124,
674
11
0,01
1
74,0
03
120,
901
15
2,80
1
239,
651
18
5,00
6
44,8
31
37,8
55
Toba
cco
settl
emen
t inc
ome
44,6
28
44,7
53
38,3
00
39,1
14
35,6
85
37,3
51
45,9
76
50,0
62
41,9
63
Fine
s3,
780
4,20
2
4,
235
-
-
-
-
-
-
Land
sal
es4,
976
11,6
54
27,4
13
39,7
70
71,2
31
5,75
6
2,
503
663
96
5
Oth
er49
,459
54
,232
48
,153
71
,372
88
,006
91
,086
10
5,47
5
141,
808
11
2,72
8
Tota
l rev
enue
s4,
078,
745
4,51
3,23
6
5,
309,
998
5,93
1,08
5
6,
379,
349
6,67
9,09
4
6,
513,
635
6,70
3,69
9
7,
491,
926

153
Expe
nditu
res
Gen
eral
gov
ernm
ent
108,
507
99
,406
12
1,16
9
163,
100
18
3,19
4
230,
011
21
2,65
9
166,
909
13
7,99
4
Hea
lth a
nd s
ocia
l ser
vice
s1,
536,
696
1,73
7,67
7
1,
822,
074
2,02
1,15
2
2,
060,
371
2,22
0,21
2
2,
298,
239
2,51
0,53
0
2,
833,
205
Edu
catio
n an
d su
ppor
t ser
vice
s43
,051
47
,976
15
,616
27
,692
39
,021
39
,257
45
,240
57
,815
57
,196
La
w, j
ustic
e an
d pu
blic
saf
ety
412,
317
42
8,54
9
450,
956
48
0,92
2
530,
247
58
3,60
1
617,
151
62
8,50
0
633,
890
R
egul
atio
n of
bus
ines
s75
,189
78
,247
86
,396
88
,995
95
,467
10
0,11
9
104,
844
10
5,63
1
107,
145
Tr
ansp
orta
tion
418,
870
49
9,45
0
674,
837
69
1,32
8
706,
543
77
6,85
2
612,
493
74
7,42
5
691,
931
R
ecre
atio
n an
d re
sour
ce d
evel
opm
ent
95,8
69
99,0
85
113,
081
12
1,38
5
134,
841
14
4,24
5
166,
347
13
5,27
2
130,
800
In
terg
over
nmen
tal
1,42
5,36
1
1,
534,
952
1,81
4,58
2
1,
917,
752
2,10
4,07
5
2,
502,
222
2,63
4,97
6
2,
706,
025
2,70
4,69
0
C
apita
l out
lay
18,4
04
22,2
94
43,4
73
88,8
82
114,
226
71
,999
16
7,95
9
176,
599
59
,520
D
ebt s
ervi
ce:
Prin
cipa
l10
9,16
7
90,1
45
115,
468
13
6,26
3
296,
771
34
8,07
2
424,
971
18
3,97
6
176,
982
I
nter
est,
fisca
l cha
rges
119,
488
11
9,86
0
127,
740
13
7,05
8
120,
683
13
7,97
2
143,
181
14
5,16
9
140,
495
D
ebt i
ssua
nce
cost
s99
4
872
3,
815
3,84
4
1,
116
3,16
7
2,
440
2,08
0
1,
734
Adv
ance
esc
row
pay
men
t-
-
76
2
-
-
-
-
-
-
Arb
itrag
e pa
ymen
t61
1
200
56
2
-
74
-
-
-
-
To
tal e
xpen
ditu
res
4,36
4,52
4
4,
758,
713
5,39
0,53
1
5,
878,
373
6,38
6,62
9
7,
157,
729
7,43
0,50
0
7,
565,
931
7,67
5,58
2
E
xces
s (d
efic
ienc
y) o
f rev
enue
s o
ver (
unde
r) ex
pend
iture
s(2
85,7
79)
(245
,477
)
(8
0,53
3)
52,7
12
(7,2
80)
(4
78,6
35)
(916
,865
)
(8
62,2
32)
(183
,656
)
Oth
er F
inan
cing
Sou
rces
(Use
s)C
apita
l lea
ses
1,48
8
3,
538
1,07
3
1,
113
4,14
3
8,
487
2,92
6
20
18
,209
S
ale
of g
ener
al o
blig
atio
n bo
nds
112,
107
68
,890
37
5,70
2
293,
921
23
1,62
3
387,
155
44
8,37
9
300,
384
10
9,24
4
Sal
e of
gen
eral
obl
igat
ion
refu
ndin
g bo
nds
19,9
61
13,1
35
80,7
91
677,
231
-
118,
346
-
-
33
,746
P
rem
ium
on
gene
ral o
blig
atio
n bo
nds
2,86
0
1,
631
35,2
28
51,0
03
9,70
3
17
,635
17
,861
18
,494
3,
928
Pay
men
t to
refu
nded
bon
d ag
ent
(19,
961)
(1
3,13
5)
(84,
237)
(7
18,9
19)
-
(1
22,0
39)
-
-
(35,
677)
S
ale
of c
ertif
icat
es o
f par
ticip
atio
n-
-
21
,550
22
,435
-
5,76
0
-
-
-
Sal
e of
refu
ndin
g ce
rtific
ates
of p
artic
ipat
ion
-
-
-
-
-
-
-
-
7,90
0
P
rem
ium
(dis
coun
t) on
cer
tific
ates
of p
artic
ipat
ion
-
-
555
(3
7)
-
(7
8)
-
-
743
P
aym
ent t
o re
fund
ed c
ertif
icat
es o
f
parti
cipa
tion
agen
t-
-
-
-
-
-
-
-
(8
,466
)
Sal
e of
cap
ital a
sset
s50
17
,881
73
1
23,3
50
166
64
6
11,4
89
684
92
Tr
ansf
ers
in25
3,22
0
398,
068
34
1,81
9
436,
899
38
0,85
8
587,
137
76
3,98
8
476,
147
35
8,11
3
Tran
sfer
s ou
t(2
32,7
56)
(379
,105
)
(3
25,6
50)
(421
,592
)
(3
49,0
50)
(579
,970
)
(7
44,3
50)
(454
,439
)
(3
39,1
16)
Tota
l oth
er fi
nanc
ing
sour
ces
(use
s)13
6,96
9
110,
903
44
7,56
2
365,
404
27
7,44
3
423,
079
50
0,29
3
341,
290
14
8,71
6
Spec
ial I
tem
One
-tim
e ta
x re
bate
-
-
-
-
(276
,773
)
-
-
-
-
N
et c
hang
e in
fund
bal
ance
s(1
48,8
10)
$
(1
34,5
74)
$
36
7,02
9$
418,
116
$
(6
,610
)$
(5
5,55
6)$
(416
,572
)$
(520
,942
)$
(34,
940)
$
Tota
l exp
endi
ture
s4,
364,
524
$
4,75
8,71
3 $
5,
390,
531
$
5,87
8,37
3 $
6,
386,
629
$
7,15
7,72
9 $
7,
430,
500
$
7,56
5,93
1 $
7,
675,
582
$
Less
: Cap
italiz
ed a
sset
s in
clud
ed in
the
func
tiona
l cat
egor
ies
115,
886
14
6,29
3
273,
824
17
7,86
3
387,
287
24
5,03
2
295,
926
22
7,81
2
209,
123
To
tal n
onca
pita
l exp
endi
ture
s4,
248,
638
$
4,61
2,42
0$
5,
116,
707
$
5,70
0,51
0$
5,
999,
342
$
6,91
2,69
7$
7,
134,
574
$
7,33
8,11
9$
7,
466,
459
$
Tota
l deb
t ser
vice
exp
endi
ture
s23
0,26
0$
211,
077
$
24
8,34
7$
277,
165
$
41
8,64
4$
489,
211
$
57
0,59
2$
331,
225
$
31
9,21
1$
Deb
t ser
vice
exp
endi
ture
s as
a p
erce
ntag
e of
no
ncap
ital e
xpen
ditu
res
5.42
%4.
58%
4.85
%4.
86%
6.98
%7.
08%
8.00
%4.
51%
4.28
%
Not
es:
Due
to c
hang
es in
the
Sta
te's
fund
stru
ctur
e in
itiat
ed w
hen
GA
SB
Sta
tem
ent 3
4 w
as im
plem
ente
d, th
e ch
ange
s in
fund
bal
ance
info
rmat
ion
is a
vaila
ble
only
beg
inni
ng in
200
2.
(a) T
he 2
003
legi
slat
ive
sess
ion
enac
ted
chan
ges
in th
e S
tate
's ta
x st
ruct
ure
whi
ch w
ent i
nto
effe
ct in
Oct
ober
200
3. T
he fi
rst f
ull f
isca
l yea
r res
ults
of t
hese
cha
nges
can
be
seen
beg
inni
ng
with
fisc
al y
ear 2
005.

Sta
tistic
al T
able
s
154
NEVA
DA
Last
Ten
Fis
cal Y
ears
, (E
xpre
ssed
in T
hous
ands
)
Tab
le 5
- Ta
xabl
e S
ales
by
Cou
nty
2001
2002
2003
2004
2005
2006
2007
2008
2009
2010
Taxa
ble
Sale
s by
Cou
nty:
Car
son
City
824,
013
$
88
8,24
9$
861,
278
$
91
3,49
5$
979,
049
$
$1
,021
,210
991,
893
$
91
9,26
6$
761,
379
$
67
8,62
6$
Chu
rchi
ll21
6,39
2
220,
744
22
6,39
8
240,
352
28
0,30
4
331,
338
30
6,42
6
294,
411
32
1,71
3
251,
257
C
lark
22,6
29,1
22
22,8
35,3
62
24
,535
,344
28,0
75,6
36
32
,430
,309
35,6
04,3
92
36,2
62,3
88
35
,930
,374
31
,378
,242
27
,969
,288
D
ougl
as57
3,49
7
565,
974
64
6,96
0
750,
928
80
5,33
4
815,
590
76
5,21
8
691,
609
58
4,67
9
537,
187
E
lko
773,
158
71
4,94
9
700,
491
75
7,71
4
857,
707
1,
029,
763
1,19
3,44
9
1,
148,
379
1,10
1,16
4
1,
093,
158
Esm
eral
da5,
705
5,34
9
5,47
2
7,57
5
8,70
7
8,59
8
16
,523
12,6
45
9,
226
6,55
1
E
urek
a14
2,18
4
140,
199
15
3,83
7
162,
155
19
4,94
3
315,
450
50
1,07
7
328,
505
28
5,94
2
266,
356
H
umbo
ldt
307,
041
31
2,27
3
306,
695
33
2,60
5
386,
364
48
3,36
6
474,
811
50
8,71
3
498,
791
53
3,66
7
Land
er71
,903
62,9
27
48
,072
55,4
21
15
7,11
4
170,
539
28
0,37
8
228,
213
26
4,10
9
220,
348
Li
ncol
n22
,086
22,0
26
35
,946
24,1
31
30
,023
31,5
29
15
,398
26,9
67
25
,257
25,8
71
Ly
on25
4,69
5
251,
497
27
4,98
3
323,
078
39
0,74
3
441,
896
37
5,52
3
385,
591
34
0,28
4
290,
241
M
iner
al32
,621
28,8
21
30
,867
36,4
24
31
,532
33,4
45
35
,679
38,8
43
37
,247
36,2
80
N
ye29
6,51
7
291,
330
30
9,42
0
366,
330
47
7,92
1
522,
296
54
0,37
7
473,
291
42
7,50
5
397,
570
P
ersh
ing
61,1
75
56
,962
54,2
74
54
,925
56,8
47
62
,992
68,3
32
67
,279
62,8
92
65
,681
Sto
rey
57,9
15
40
,518
38,5
04
54
,571
85,4
16
10
9,41
1
204,
717
12
1,24
4
59,5
78
48
,299
Was
hoe
5,19
4,14
6
5,
280,
706
5,47
5,60
2
6,
003,
368
6,66
0,26
3
7,
245,
525
7,20
2,64
1
6,
823,
701
5,70
7,79
1
5,
176,
982
Whi
te P
ine
64,9
94
68
,065
70,7
54
80
,819
127,
928
17
5,14
7
192,
877
19
7,81
8
220,
815
17
4,70
5
Tota
l31
,527
,164
$
31,7
85,9
51$
33
,774
,897
$
38,2
39,5
27$
43
,960
,504
$
48,4
02,4
87$
49
,427
,707
$
48,1
96,8
49$
42
,086
,614
$
37,7
72,0
67$
Dire
ct S
ales
Tax
Rat
e
2%2%
2%2%
2%2%
2%2%
2%2%
2%
Sour
ce:
Dep
artm
ent o
f Tax
atio
n

155
Tabl
e 6
- Pri
ncip
al S
ales
Tax
Pay
ers
by B
usin
ess
Type
Cur
rent
Yea
r and
Nin
e Y
ears
Ago
, (E
xpre
ssed
in T
hous
ands
)
Last
Nin
e Fi
scal
Yea
rs, (
Exp
ress
ed in
Tho
usan
ds, E
xcep
t for
Per
Cap
ita)
Tabl
e 7
- Rat
ios
of O
utst
andi
ng D
ebt b
y Ty
pe
Taxa
ble
Perc
enta
ge o
f Ta
xTa
xabl
e Pe
rcen
tage
of
Tax
Sale
sTo
tal T
axab
le S
ales
Liab
ility
Sale
sTo
tal T
axab
le S
ales
Liab
ility
Bus
ines
s Ty
pe:
Food
ser
vice
s an
d dr
inki
ng p
lace
s5,
801,
746
$
18
.4%
116,
035
$
6,36
9,75
6$
16.9
%12
7,39
5$
G
ener
al m
erch
andi
se s
tore
s2,
833,
352
9.
0%56
,667
3,
813,
628
10
.1%
76,2
72
Mot
or v
ehic
le a
nd p
arts
dea
lers
4,32
3,52
6
13.7
%86
,471
3,
364,
568
8.
9%67
,291
C
loth
ing
and
clot
hing
acc
esso
ries
stor
es1,
276,
652
4.1%
25,5
33
2,85
8,33
3
7.6%
57,1
67
Mer
chan
t who
lesa
lers
, dur
able
goo
ds1,
837,
559
5.
8%36
,751
2,
360,
348
6.
2%47
,207
A
ccom
mod
atio
n-
--
1,90
7,96
2
5.1%
38,1
59
Food
and
bev
erag
e st
ores
1,33
1,16
1
4.2%
26,6
23
1,54
7,83
2
4.1%
30,9
57
Bui
ldin
g m
ater
ial,
gard
en e
quip
men
t, su
pplie
s 2,
044,
530
6.
5%40
,891
1,
491,
780
3.
9%29
,836
E
lect
roni
cs a
nd a
pplia
nce
stor
es-
--
1,35
2,81
3
3.6%
27,0
56
Ren
tal a
nd le
asin
g se
rvic
es-
--
1,31
5,45
1
3.5%
26,3
09
Mis
cella
neou
s re
tail
3,41
6,87
7
10.9
%68
,337
-
--
Furn
iture
and
hom
e fu
rnis
hing
s st
ores
1,74
2,65
4
5.5%
34,8
53
--
-B
usin
ess
serv
ices
1,24
2,59
6
3.9%
24,8
52
--
-To
tal
25,8
50,6
53$
82.0
%51
7,01
3$
26
,382
,471
$
69
.9%
527,
649
$
Sour
ce:
Dep
artm
ent o
f Tax
atio
nN
ote:
Due
to c
onfid
entia
lity
issu
es, t
he n
ames
of t
he te
n la
rges
t rev
enue
pay
ers
are
not a
vaila
ble.
Th
e ca
tego
ries
pres
ente
d ar
e in
tend
ed to
pro
vide
alte
rnat
ive
info
rmat
ion
rega
rdin
g th
e so
urce
of t
he S
tate
's re
venu
e.
Fisc
al Y
ear 2
001
Fisc
al Y
ear 2
010
2002
2003
2004
2005
2006
2007
2008
2009
2010
Gov
ernm
enta
l Act
iviti
es
G
ener
al o
blig
atio
n bo
nds
2,18
5,79
8$
2,
178,
218
$
2,28
6,54
9$
2,
293,
793
$
2,07
5,75
8$
1,
964,
616
$
1,90
9,72
5$
2,
079,
805
$
2,06
7,61
5$
H
ighw
ay re
venu
e bo
nds
91,9
3583
,505
238,
265
380,
945
541,
680
693,
285
774,
300
722,
880
668,
840
Obl
igat
ions
und
er c
apita
l lea
ses
5,40
27,
152
8,23
67,
712
9,86
615
,955
19,8
9117
,916
33,8
46C
ertif
icat
es o
f par
ticip
atio
n14
,395
13,7
6534
,655
56,4
0055
,680
60,4
5559
,320
58,0
3056
,770
Tota
l gov
ernm
enta
l act
iviti
es2,
297,
530
2,28
2,64
02,
567,
705
2,73
8,85
02,
682,
984
2,73
4,31
12,
763,
236
2,87
8,63
12,
827,
071
Bus
ines
s-ty
pe A
ctiv
ities
Gen
eral
obl
igat
ion
bond
s57
,625
54,4
1012
0,53
012
0,45
511
8,54
011
7,31
011
5,80
511
3,05
510
5,06
0S
peci
al o
blig
atio
n bo
nds
1,31
3,03
51,
184,
163
970,
087
862,
966
745,
780
782,
307
886,
195
911,
783
994,
044
Tota
l bus
ines
s-ty
pe a
ctiv
ities
1,37
0,66
01,
238,
573
1,09
0,61
798
3,42
186
4,32
089
9,61
71,
002,
000
1,02
4,83
81,
099,
104
Tota
l prim
ary
gove
rnm
ent
3,66
8,19
0$
2,
337,
050
$
3,65
8,32
2$
3,
722,
271
$
3,54
7,30
4$
3,
633,
928
$
3,76
5,23
6$
3,
903,
469
$
3,92
6,17
5$
Deb
t as
a Pe
rcen
tage
of P
erso
nal I
ncom
e5.
70%
5.28
%5.
11%
4.72
%4.
09%
3.93
%3.
63%
3.72
%3.
94%
Amou
nt o
f Deb
t per
Cap
ita1,
751
$
1,62
4$
1,
632
$
1,59
5$
1,
469
$
1,45
6$
1,
468
$
1,50
1$
1,
485
$
Not
es:
Det
ails
rega
rdin
g th
e S
tate
's d
ebt c
an b
e fo
und
in th
e no
tes
to th
e fin
anci
al s
tate
men
ts.
The
Sta
te d
id n
ot b
egin
repo
rting
gov
ernm
ent-w
ide
stat
emen
ts u
ntil
the
impl
emen
tatio
n of
GA
SB
Sta
tem
ent 3
4 in
fisc
al y
ear 2
002.
See
tabl
e 11
for p
erso
nal i
ncom
e an
d po
pula
tion
data
.D
ebt a
s a
Per
cent
age
of P
erso
nal I
ncom
e is
bas
ed o
n pr
ior y
ear P
erso
nal I
ncom
e.A
mou
nt o
f Deb
t per
Cap
ita is
bas
ed o
n pr
ior y
ear P
opul
atio
n.

Sta
tistic
al T
able
s
156
NEVA
DA
Last
Ten
Fis
cal Y
ears
, (E
xpre
ssed
in T
hous
ands
, Exc
ept f
or P
er C
apita
)
Tabl
e 8
- Rat
ios
of G
ener
al B
onde
d D
ebt O
utst
andi
ng
2001
2002
2003
2004
2005
2006
2007
2008
2009
2010
Gen
eral
Bon
ded
Deb
t
Out
stan
ding
Gen
eral
obl
igat
ion
bond
s2,
204,
316
$
2,
185,
798
$
2,
178,
218
$
2,
286,
549
$
2,
293,
793
$
2,
075,
758
$
1,
964,
616
$
1,
909,
725
$
2,
079,
805
$
2,
067,
615
$
C
ertif
icat
es o
f par
ticip
atio
n15
,000
14,3
95
13
,765
13,1
05
12
,415
11,6
95
10
,940
10,1
55
9,
335
24
,280
Wat
er p
roje
cts
bond
s (a
)-
57
,625
54,4
10
12
0,53
0
12
0,45
5
12
0,78
211
7,35
511
0,28
6
10
7,53
4
99
,511
Hou
sing
bon
ds1,
276,
954
1,
313,
035
1,
184,
163
97
0,08
7
86
2,96
6
74
5,78
078
2,30
788
6,19
5
91
1,78
3
99
4,19
3
To
tal
3,49
6,27
0
3,57
0,85
3
3,43
0,55
6
3,39
0,27
1
3,28
9,62
9
2,95
4,01
5
2,87
5,21
8
2,91
6,36
1
3,10
8,45
7
3,18
5,59
9
Less
: am
ount
s re
stric
ted
to r
epay
ing
prin
cipa
l10
0,89
1
10
5,68
5
10
7,44
8
11
0,90
6
11
0,46
7
12
5,88
4
12
9,08
7
13
6,30
9
14
2,53
9
14
5,79
3
N
et g
ener
al b
onde
d de
bt3,
395,
379
$
3,
465,
168
$
3,
323,
108
$
3,
279,
365
$
3,
179,
162
$
2,
828,
131
$
2,
746,
131
$
2,
780,
052
$
2,
965,
918
$
3,
039,
806
$
Actu
al T
axab
le P
rope
rty
Val
ue
142,
140,
708
$ 15
1,26
7,82
1$
165,
053,
522
$ 17
9,82
2,44
4$
198,
569,
862
$ 24
5,07
5,28
3$
327,
140,
473
$ 38
3,57
1,01
3$
410,
130,
698
$ 34
1,88
6,42
3$
Perc
enta
ge o
f Act
ual T
axab
le V
alue
of P
rope
rty
2.39
%2.
29%
2.01
%1.
82%
1.60
%1.
15%
0.84
%0.
72%
0.72
%0.
89%
Deb
t Per
Cap
ita (
b)1,
621
$
1,
598
$
1,
482
$
1,
406
$
1,
316
$
1,
133
$
1,
071
$
1,
069
$
1,
122
$
N
/A
Not
e: D
etai
ls re
gard
ing
the
Stat
e's
outs
tand
ing
debt
can
be
foun
d in
the
note
s to
the
finan
cial
sta
tem
ents
.(a
) W
ater
pro
ject
bon
ds in
clud
ed in
gen
eral
obl
igat
ion
bond
s fis
cal y
ears
200
1 an
d pr
ior.
(b)
See
Tabl
e 11
for p
opul
atio
n da
ta.

157
Last
Ten
Fis
cal Y
ears
, (E
xpre
ssed
in T
hous
ands
)
Tab
le 9
- Le
gal D
ebt M
argi
n In
form
atio
n
2001
2002
2003
2004
2005
2006
2007
2008
2009
2010
Deb
t lim
it1,
075,
731
$
1,17
2,31
7$
1,
276,
838
$
1,40
8,68
8$
1,
743,
736
$
2,33
9,59
3$
2,
756,
849
$
2,96
3,12
4$
2,
482,
138
$
1,90
0,36
6$
Tota
l deb
t app
licab
le to
lim
it77
7,90
2
804,
860
82
5,08
2
925,
183
94
4,73
2
920,
737
1,
015,
375
1,21
4,99
1
1,
405,
781
1,41
0,21
1
Le
gal d
ebt m
argi
n29
7,82
9$
367,
457
$
45
1,75
6$
483,
505
$
79
9,00
4$
1,41
8,85
6$
1,
741,
474
$
1,74
8,13
3$
1,
076,
357
$
490,
155
$
Lega
l deb
t mar
gin
as a
per
cent
age
of th
e de
bt li
mit
27.6
9%31
.34%
35.3
8%34
.32%
45.8
2%60
.65%
63.1
7%59
.00%
43.3
6%25
.79%
.Asse
ssed
val
ue o
f tax
able
pro
pert
y at
Jun
e 30
, 201
0 (a
)95
,018
,324
$
Deb
t lim
itatio
n (2
% o
f ass
esse
d va
lue)
1,90
0,36
6$
G
ener
al O
blig
atio
n B
onds
sub
ject
to li
mit
1,36
8,46
5$
Le
ases
33,8
46
C
ertif
icat
es o
f par
ticip
atio
n56
,080
Less
obl
igat
ions
exe
mpt
from
deb
t mar
gin:
L
ease
reve
nue
certi
ficat
es o
f par
ticip
atio
n(4
8,18
0)
D
ebt s
ubje
ct to
deb
t lim
itatio
n(1
,410
,211
)
Le
gal d
ebt m
argi
n at
Jun
e 30
, 201
049
0,15
5$
Not
e:
Com
puta
tion
of L
egal
Deb
t Mar
gin
at J
une
30, 2
010:
(a)
On
June
30of
each
year
,the
mos
tcu
rrent
asse
ssed
valu
eav
aila
ble
isth
eas
sess
edva
lue
used
for
calc
ulat
ing
and
asse
ssin
gta
xes
for
the
follo
win
gfis
caly
ear.
Ther
efor
e,th
ede
btlim
itatio
nas
ofJu
ne30
ofea
chye
aris
calc
ulat
edus
ing
the
asse
ssed
valu
efo
rthe
follo
win
gfis
caly
ear.
Forp
urpo
ses
ofth
isco
mpu
tatio
n,as
sess
edva
luat
ion
incl
udes
35%
ofac
tual
taxa
ble
prop
erty
val
ue, p
lus
stat
ewid
e re
deve
lopm
ent a
genc
y as
sess
ed v
alue
s.

Sta
tistic
al T
able
s
158
NEVA
DA
Last
Ten
Fis
cal Y
ears
, (E
xpre
ssed
in T
hous
ands
)
Tabl
e 10
- P
ledg
ed R
even
ue C
over
age
2001
2002
2003
2004
2005
2006
2007
2008
2009
2010
Hig
hway
Impr
ovem
ent R
even
ue B
onds
R
even
ue -
fuel
taxe
s23
2,97
4$
239,
365
$
25
0,74
0$
265,
964
$
27
8,64
1$
294,
348
$
29
7,14
2$
293,
941
$
26
9,47
9$
265,
487
$
D
ebt s
ervi
ce
Prin
cipa
l-
$
8,06
5$
8,
430
$
21,6
75$
30,6
65$
30,7
10$
41,1
25$
48,9
55$
51,4
20$
54,0
40$
In
tere
st2,
254
4,80
6
4,
394
11,7
12
18,7
19
23,7
39
30,1
06
32,7
27
37,1
57
33,8
76
Tota
l
2,25
4$
12
,871
$
12
,824
$
33
,387
$
49
,384
$
54
,449
$
71
,231
$
81
,682
$
88
,577
$
87
,916
$
Cov
erag
e (c
)10
3.36
18.6
019
.55
7.97
5.64
5.41
4.17
3.60
3.04
3.02
Mor
tgag
e R
even
ue B
onds
Rev
enue
(a)
167,
700
$
20
6,58
9$
312,
431
$
33
5,06
2$
251,
806
$
43
5,33
2$
355,
328
$
12
9,28
6$
70,0
51$
42,1
23$
Exp
ense
s (b
)9,
315
11,8
35
8,77
0
10
,335
9,
512
6,72
0
4,
595
4,36
8
5,
277
6,54
8
N
et a
vaila
ble
reve
nues
158,
385
$
19
4,75
4$
303,
661
$
32
4,72
7$
242,
294
$
42
8,61
2$
350,
733
$
12
4,91
8$
64,7
74$
35,5
75$
Deb
t ser
vice
P
rinci
pal
69,5
11$
187,
664
$
25
7,70
2$
297,
681
$
15
5,79
1$
136,
186
$
51
,003
$
37
,897
$
33
,592
$
67
,082
$
Inte
rest
65,7
49
67,7
96
63,2
35
50,0
34
42,2
98
38,6
44
37,0
02
38,0
51
36,3
54
33,2
36
Tota
l
135,
260
$
25
5,46
0$
320,
937
$
34
7,71
5$
198,
089
$
17
4,83
0$
88,0
05$
75,9
48$
69,9
46$
100,
318
$
Cov
erag
e (c
)1.
170.
760.
950.
931.
222.
453.
991.
640.
930.
36
Not
es:
Det
ails
rega
rdin
g th
e S
tate
's o
utst
andi
ng d
ebt c
an b
e fo
und
in th
e no
tes
to th
e fin
anci
al s
tate
men
ts.
(a) C
onsi
sts
of in
tere
st a
nd in
vest
men
t inc
ome
and
prin
cipa
l col
lect
ions
of t
he H
ousi
ng D
ivis
ion
Ent
erpr
ise
Fund
.(b
) Con
sist
s of
ope
ratin
g ex
pens
es, n
onop
erat
ing
expe
nses
and
tran
sfer
s ou
t les
s in
tere
st e
xpen
se a
nd d
epre
ciat
ion.
(c) C
over
age
equa
ls n
et a
vaila
ble
reve
nues
div
ided
by
tota
l deb
t ser
vice
.

159
Last
Ten
Cal
enda
r Yea
rs
Tab
le 1
1 - D
emog
raph
ic a
nd E
cono
mic
Sta
tistic
s
2000
2001
2002
2003
2004
2005
2006
2007
2008
2009
Popu
latio
n
Nev
ada
2,01
8,21
42,
094,
827
2,16
7,86
72,
241,
700
2,33
2,89
82,
414,
807
2,49
5,52
92,
565,
382
2,60
0,16
72,
643,
085
P
erce
ntag
e ch
ange
4.3%
3.8%
3.5%
3.4%
4.1%
3.5%
3.3%
2.8%
1.4%
1.7%
U
nite
d S
tate
s28
2,19
3,47
728
5,10
7,92
328
7,98
4,79
929
0,85
0,00
529
3,65
6,84
229
6,41
0,40
429
9,39
8,48
430
1,62
1,15
730
4,05
9,72
430
7,00
6,55
0
Per
cent
age
chan
ge1.
1%1.
0%1.
0%1.
0%1.
0%0.
9%1.
0%0.
7%0.
8%1.
0%
Tota
l Per
sona
l Inc
ome
N
evad
a (in
mill
ions
)61
,428
64,3
6766
,632
71,6
0678
,822
86,6
5092
,557
103,
847
104,
924
99,6
21
Per
cent
age
chan
ge8.
8%4.
8%3.
5%7.
5%10
.1%
9.9%
6.8%
12.2
%1.
0%-5
.1%
U
nite
d S
tate
s (in
mill
ions
)8,
422,
074
8,71
6,99
28,
872,
871
9,15
7,25
79,
705,
504
10,2
51,6
3910
,860
,917
11,6
45,8
8212
,086
,534
12,1
65,4
74
Per
cent
age
chan
ge8.
0%3.
5%1.
8%3.
2%6.
0%5.
6%5.
9%7.
2%3.
8%0.
7%
Per C
apita
Per
sona
l Inc
ome
N
evad
a 30
,437
30,7
2730
,736
31,9
4333
,787
35,8
8337
,089
40,4
8040
,353
37,6
91
Per
cent
age
chan
ge4.
3%1.
0%0.
0%3.
9%5.
8%6.
2%3.
4%9.
1%-0
.3%
-6.6
%
Uni
ted
Sta
tes
29,8
4530
,574
30,8
1031
,484
33,0
5034
,586
36,2
7638
,611
39,7
5139
,626
P
erce
ntag
e ch
ange
6.8%
2.4%
0.8%
2.2%
5.0%
4.6%
4.9%
6.4%
3.0%
-0.3
%
Labo
r For
ce a
nd E
mpl
oym
ent
N
evad
a La
bor F
orce
1,06
4,01
51,
102,
370
1,12
4,62
91,
148,
519
1,17
7,55
81,
218,
525
1,29
5,08
51,
335,
852
1,37
3,46
21,
369,
891
U
nem
ploy
ed47
,943
58,4
5962
,729
58,8
1051
,212
49,0
0254
,217
64,3
8091
,450
161,
270
U
nem
ploy
men
t Rat
e4.
5%5.
3%5.
6%5.
1%4.
3%4.
0%4.
2%4.
8%6.
7%11
.8%
U
nite
d S
tate
s La
bor F
orce
142,
583,
000
143,
734,
000
144,
863,
000
146,
510,
000
147,
401,
000
149,
320,
000
151,
428,
000
153,
124,
000
154,
287,
000
154,
142,
000
U
nem
ploy
ed5,
692,
000
6,80
1,00
08,
378,
000
8,77
4,00
08,
149,
000
7,59
1,00
07,
001,
000
7,07
8,00
08,
924,
000
14,2
65,0
00
Une
mpl
oym
ent R
ate
4.0%
4.7%
5.8%
6.0%
5.5%
5.1%
4.6%
4.6%
5.8%
9.3%
Sour
ces:
U.S
. Dep
artm
ent o
f Com
mer
ce, B
urea
u of
Eco
nom
ic A
naly
sis;
Nev
ada
Dep
artm
ent o
f Em
ploy
men
t, Tr
aini
ng, a
nd R
ehab
ilita
tion
Not
e: T
otal
per
sona
l inc
ome
is c
ompo
sed
of w
ages
and
sal
arie
s, p
ropr
ieto
rs' i
ncom
e, p
erso
nal i
nter
est a
nd d
ivid
end
inco
me,
rent
al in
com
e, a
nd p
erso
nal c
urre
nt tr
ansf
er re
ceip
ts, l
ess
cont
ribut
ions
for g
over
nmen
t soc
ial i
nsur
ance
. P
er c
apita
per
sona
l inc
ome
is c
alcu
late
d by
div
idin
g to
tal p
erso
nal i
ncom
e by
pop
ulat
ion.

Sta
tistic
al T
able
s
160
NEVA
DA
Cur
rent
Yea
r and
Nin
e Y
ears
Ago
Tabl
e 12
- P
rinc
ipal
Em
ploy
ers
Perc
enta
ge o
f Tot
al
Perc
enta
ge o
f Tot
al
Empl
oyee
sR
ank
Stat
e Em
ploy
men
tEm
ploy
ees
Ran
kSt
ate
Empl
oym
ent
Empl
oyer
:C
lark
Cou
nty
Sch
ool D
istri
ct25
,000
- 25
,499
1 2.
37%
30,0
00 -
39,9
991
2.55
%S
tate
of N
evad
a15
,000
- 15
,499
2 1.
43%
30,0
00 -
39,9
992
2.55
%C
lark
Cou
nty
8,00
0 - 8
,499
3 0.
78%
8,50
0 - 8
,999
3 0.
64%
Was
hoe
Cou
nty
Sch
ool D
istri
ct6,
500
- 6,9
995
0.63
%8,
500
- 8,9
994
0.64
%W
ynn
Las
Veg
as-
--
8,00
0 - 8
,499
5 0.
60%
Aria
Res
ort &
Cas
ino,
LLC
--
-7,
500
- 7,9
996
0.57
%M
GM
Gra
nd H
otel
/Cas
ino
8,00
0 - 8
,499
4 0.
78%
7,50
0 - 7
,999
7 0.
57%
Bel
lagi
o, L
LC-
--
7,00
0 - 7
,499
8 0.
53%
Man
dala
y B
ay R
esor
t & C
asin
o-
--
6,00
0 - 6
,499
9 0.
46%
Las
Veg
as M
etro
polit
an P
olic
e3,
500
- 3,9
9910
0.
35%
5,50
0 - 5
,999
10
0.42
%M
irage
Cas
ino-
Hot
el6,
000
- 6,4
996
0.59
%-
-C
aesa
rs P
alac
e4,
500
- 4,9
997
0.45
%-
-U
nive
rsity
of N
evad
a - L
V4,
500
- 4,9
998
0.45
%-
-Lu
xor
4,00
0 - 4
,499
9 0.
40%
--
Tota
l85
,000
- 89
,990
8.23
%11
8,50
0 - 1
42,4
909.
53%
Sour
ces:
Nev
ada
Dep
artm
ent o
f Em
ploy
men
t, Tr
aini
ng, a
nd R
ehab
ilita
tion
and
Nev
ada
Dep
artm
ent o
f Per
sonn
el
Not
e: P
erce
ntag
e of
tota
l sta
te e
mpl
oym
ent i
s ba
sed
on th
e m
idpo
ints
in th
e ra
nges
giv
en.
Cal
enda
r Yea
r 200
0C
alen
dar Y
ear 2
009

161
Last
Ten
Fis
cal Y
ears
Tab
le 1
3 - S
choo
l Enr
ollm
ent
Tabl
e 14
- Fu
ll-tim
e E
quiv
alen
t Sta
te G
over
nmen
t Em
ploy
ees
by F
unct
ion
Last
Ten
Fis
cal Y
ears
2001
2002
2003
2004
2005
2006
2007
2008
2009
2010
Publ
ic S
choo
l Enr
ollm
ent
Prim
ary
(K -
6)20
7,03
921
1,26
021
7,48
822
3,97
322
9,41
920
1,46
523
9,41
824
0,45
323
5,29
523
9,72
3S
econ
dary
(7 -
12)
149,
775
158,
225
167,
926
177,
245
183,
833
189,
501
193,
822
196,
325
196,
014
196,
921
Tota
l35
6,81
436
9,48
538
5,41
440
1,21
841
3,25
239
0,96
643
3,24
043
6,77
843
1,30
943
6,64
4
Publ
ic H
ighe
r Edu
catio
n En
rollm
ent
10,8
0411
,668
11,9
6512
,451
12,6
6012
,444
12,4
2912
,709
12,8
8913
,601
16,2
3217
,777
18,6
3920
,077
20,5
6920
,180
20,0
0720
,297
20,6
7020
,160
Nev
ada
Sta
te C
olle
ge
-11
633
085
61,
017
1,31
01,
418
1,34
01,
622
1,86
7C
olle
ge o
f Sou
ther
n N
evad
a15
,266
16,5
3217
,716
17,6
7618
,234
18,3
2019
,501
20,9
0621
,751
22,2
86G
reat
Bas
in C
olle
ge1,
208
1,25
11,
436
1,35
61,
353
1,58
41,
613
1,78
12,
002
1,99
6Tr
ucke
e M
eado
ws
Com
mun
ity C
olle
ge4,
889
5,32
45,
559
5,95
36,
213
6,21
06,
454
6,80
07,
312
7,14
3W
este
rn N
evad
a C
olle
ge2,
128
2,16
42,
180
2,28
82,
410
2,46
32,
427
2,43
82,
908
2,96
0To
tal
50,5
2754
,832
57,8
2560
,657
62,4
5662
,511
63,8
4966
,271
69,1
5470
,013
Not
e: P
ublic
hig
her e
duca
tion
enro
llmen
t rep
rese
nts
full-
time
equi
vale
nt s
tude
nts
at fa
ll en
rollm
ent.
Sour
ces:
Nev
ada
Dep
artm
ent o
f Edu
catio
n an
d N
evad
a S
yste
m o
f Hig
her E
duca
tion
Uni
vers
ity o
f Nev
ada,
Ren
oU
nive
rsity
of N
evad
a, L
as V
egas
2001
2002
2003
2004
2005
2006
2007
2008
2009
2010
Func
tion
Gen
eral
gov
ernm
ent
1,42
31,
449
1,42
11,
470
1,51
31,
536
1,55
81,
570
1,53
91,
487
Hea
lth a
nd s
ocia
l ser
vice
s4,
425
4,49
54,
562
5,04
44,
992
5,36
45,
773
6,14
55,
823
6,15
1Ed
ucat
ion
and
supp
ort s
ervi
ces
3,31
06,
863
7,24
07,
092
7,76
28,
118
8,67
09,
030
8,93
08,
670
Law
, jus
tice
and
publ
ic s
afet
y5,
148
5,21
04,
995
5,24
45,
449
5,65
45,
946
5,92
45,
815
5,81
2R
egul
atio
n of
bus
ines
s1,
261
1,25
91,
217
1,29
81,
315
1,33
11,
412
1,39
01,
363
1,37
4Tr
ansp
orta
tion
1,70
31,
720
1,75
71,
798
1,78
31,
771
1,79
21,
829
1,81
01,
776
Rec
reat
ion
and
reso
urce
dev
elop
men
t1,
369
1,39
81,
417
1,42
51,
455
1,47
91,
403
1,18
61,
172
1,17
2
Tota
l18
,639
22,3
9422
,609
23,3
7124
,269
25,2
5326
,554
27,0
7426
,452
26,4
42
Sour
ces:
Nev
ada
Dep
artm
ent o
f Per
sonn
el, N
evad
a Sy
stem
of H
ighe
r Edu
catio
n an
d Le
gisl
ativ
e C
ouns
el B
urea
u

Sta
tistic
al T
able
s
162
NEVA
DA
Last
Ten
Fis
cal Y
ears
Tabl
e 15
- O
pera
ting
Indi
cato
rs b
y Fu
nctio
n
2001
2002
2003
2004
2005
2006
2007
2008
2009
2010
Gen
eral
Gov
ernm
ent
Dep
artm
ent o
f Tax
atio
nN
umbe
r of s
ales
and
use
tax
audi
ts1,
413
1,79
61,
825
1,37
71,
643
1,66
81,
994
1,34
61,
397
N/A
Pub
lic E
mpl
oyee
s B
enef
its P
rogr
am
Num
ber o
f pla
n pa
rtici
pant
s30
,196
30,8
8931
,328
31,0
4233
,395
35,0
4938
,936
42,0
4944
,232
43,9
43G
ener
ic d
rug
utili
zatio
n (b
)43
%43
%52
%52
%59
%59
%65
%65
%N
/AN
/AD
epar
tmen
t of A
dmin
istra
tion
Squ
are
feet
of n
on-s
tate
ow
ned
spac
e le
ased
(b)
1,39
1,46
31,
391,
463
1,37
6,53
41,
376,
534
1,37
7,52
51,
377,
525
1,54
7,46
71,
547,
467
N/A
N/A
Job
appl
icat
ions
pro
cess
ed21
,641
27,5
3639
,635
48,0
8936
,317
54,3
7892
,353
66,0
4168
,552
76,1
29H
ealth
and
Soc
ial S
ervi
ces
Dep
artm
ent o
f Edu
catio
n, T
rain
ing
& R
ehab
ilita
tion
Voc
atio
nal R
ehab
ilita
tion
clie
nts
ente
ring
full-
time
empl
oym
ent
w
ith in
sura
nce
(b)
79%
79%
65%
65%
48%
48%
58%
58%
N/A
N/A
Car
eer E
nhan
cem
ent P
rogr
am c
lient
s en
terin
g em
ploy
men
t (b)
60%
60%
91%
91%
84%
84%
90%
90%
N/A
N/A
Hea
lth C
are
Fina
ncin
g &
Pol
icy
Nev
ada
Med
icai
d - a
vera
ge m
onth
ly e
ligib
les
117,
629
141,
681
163,
784
172,
779
176,
418
172,
685
168,
197
180,
369
197,
313
240,
528
NV
Che
ck-U
p P
rogr
am -
aver
age
mon
thly
enr
ollm
ent (
b)22
,414
22,4
1425
,025
25,0
2527
,492
27,4
9229
,075
29,0
75N
/AN
/AH
ealth
Div
isio
nW
omen
, Inf
ants
and
Chi
ldre
n P
rogr
am p
artic
ipan
ts (F
FY)
476,
920
482,
421
520,
463
538,
857
567,
076
602,
100
602,
784
711,
018
793,
166
870,
398
Wel
fare
Div
isio
nA
vera
ge m
onth
ly n
umbe
r of T
AN
F re
cipi
ents
18,1
2328
,809
31,0
3424
,956
21,7
4819
,880
17,7
0621
,022
22,5
5629
,084
Ave
rage
mon
thly
num
ber o
f Men
tal H
ealth
clie
nts
13,1
8714
,354
16,3
9016
,616
14,9
8114
,655
13,2
4914
,582
15,5
7515
,160
Ave
rage
mon
thly
num
ber o
f Men
tal H
ealth
inpa
tient
s14
615
514
215
318
219
824
626
525
322
5A
vera
ge m
onth
ly n
umbe
r of S
NA
P (F
ood
Sta
mp)
reci
pien
ts70
,016
91,2
1610
6,96
611
9,75
012
2,04
211
8,47
411
9,59
613
7,58
917
9,79
026
0,41
7A
vera
ge m
onth
ly n
umbe
r of D
evel
opm
enta
l Ser
vice
s cl
ient
s2,
782
3,05
43,
225
3,52
23,
888
4,05
74,
387
4,67
24,
876
5,08
6P
erce
nt o
f cur
rent
chi
ld s
uppo
rt ow
ed th
at is
col
lect
ed (b
)46
%46
%47
%47
%46
%46
%46
%46
%N
/AN
/ATA
NF
reci
pien
t chi
ldre
n re
ceiv
ing
child
car
e (f)
17,3
2517
,325
15,8
4315
,843
17,9
7717
,977
16,7
9724
,705
19,1
1917
,407
Non
-TA
NF
child
ren
rece
ivin
g ch
ild c
are
(f)10
6,77
910
6,77
944
,998
44,9
9810
4,46
310
4,46
311
2,45
211
3,42
684
,517
69,5
41A
pplic
atio
ns fo
r ene
rgy
assi
stan
ce re
ceiv
ed (b
)20
,076
20,0
7619
,081
19,0
8124
,846
24,8
4627
,515
27,5
15N
/AN
/AH
ouse
hold
s se
rved
with
ene
rgy
assi
stan
ce (b
)15
,665
15,6
6515
,986
15,9
8614
,552
14,5
5216
,846
16,8
46N
/AN
/AEd
ucat
ion
and
Supp
ort S
ervi
ces
Nev
ada
Dep
artm
ent o
f Edu
catio
n (a
)P
erce
nt o
f occ
upat
iona
l edu
catio
n st
uden
ts re
ceiv
ing
a di
plom
a (f)
N/A
N/A
89%
89%
88%
88%
N/A
93%
95%
88%
Per
cent
of p
ublic
sch
ools
par
ticip
atin
g in
the
Nat
'l S
choo
l Lun
ch P
rogr
am (b
)85
%85
%93
%93
%94
%94
%94
%94
%N
/AN
/AP
erce
nt o
f K-1
2 st
uden
ts p
artic
ipat
ing
in th
e N
at'l
Sch
ool L
unch
Pro
gram
(b)
42%
42%
34%
34%
41%
41%
43%
43%
N/A
N/A
Num
ber o
f mea
ls s
erve
d in
the
Chi
ldre
n &
Adu
lt Fo
od C
are
Pro
gram
(b)
3,24
3,96
53,
243,
965
4,29
7,85
04,
297,
850
4,25
6,70
14,
256,
701
3,09
3,88
93,
093,
889
N/A
N/A
Num
ber o
f spe
cial
edu
catio
n st
uden
ts re
ceiv
ing
a hi
gh s
choo
l dip
lom
a (f)
492
492
675
675
503
503
458
437
703
560
Per
cent
/num
ber o
f ele
men
tary
stu
dent
s id
entif
ied
as b
eing
at r
isk
rece
ivin
g
supp
lem
enta
l ins
truct
ion
from
Titl
e I f
unds
(b)
52%
52%
60%
60%
5,38
95,
389
5,99
35,
993
N/A
N/A
Dep
artm
ent o
f Cul
tura
l Affa
irs
Vol
umes
(exc
lude
s do
cum
ents
and
mic
rofil
m)
64,4
5166
,140
69,3
6173
,005
76,5
2776
,527
79,9
1782
,913
81,3
68N
/AG
over
nmen
t pub
licat
ions
(U.S
., N
evad
a an
d C
alifo
rnia
)67
7,50
068
3,38
474
1,57
377
1,25
877
9,19
479
8,01
381
3,14
282
7,69
783
3,70
5N
/A

163
Law
, Jus
tice
and
Publ
ic S
afet
yTh
e S
upre
me
Cou
rt of
Nev
ada
Cas
es fi
led
(c)
1,78
41,
711
1,84
81,
885
2,04
92,
171
2,12
42,
212
2,16
9N
/AC
ases
dis
pose
d (c
)2,
001
1,86
61,
651
1,94
91,
994
2,38
71,
976
2,05
82,
238
N/A
Num
ber o
f opi
nion
s w
ritte
n (c
)80
9768
105
9012
161
103
63N
/AN
evad
a D
epar
tmen
t of C
orre
ctio
ns
Tota
l adm
issi
ons
(e)
4,66
64,
843
5,33
75,
574
5,74
16,
292
6,01
6N
/A5,
781
5,80
1To
tal r
elea
ses
(e)
4,54
04,
734
4,87
34,
708
5,45
55,
162
5,30
8N
/A6,
120
6,05
6In
-hou
se p
opul
atio
n at
yea
r-en
d (e
)9,
959
10,0
8110
,550
11,4
2711
,740
12,8
1612
,967
12,8
5312
,742
12,5
91D
epar
tmen
t of P
ublic
Saf
ety,
Hig
hway
Pat
rol D
ivis
ion
Tota
l num
ber o
f DU
I arr
ests
3,99
7N
/A3,
778
3,68
73,
803
4,26
45,
093
4,72
04,
676
3,98
1To
tal n
umbe
r of s
afet
y in
spec
tions
13,6
10N
/A16
,560
20,6
2720
,800
24,7
1424
,227
22,6
6926
,478
26,0
56D
epar
tmen
t of M
otor
Veh
icle
s M
otor
veh
icle
regi
stra
tions
1,48
9,55
51,
488,
540
1,54
3,51
41,
790,
456
1,88
4,81
62,
262,
743
2,35
1,58
12,
345,
500
2,33
5,77
82,
284,
437
Reg
ulat
ion
of B
usin
ess
Nev
ada
Gam
ing
Com
mis
sion
Lice
nses
issu
ed &
act
ive
at fi
scal
yea
r-en
d2,
806
2,84
62,
829
2,91
32,
905
2,92
42,
961
2,93
32,
882
2,82
7Li
cens
ed d
evic
es a
t fis
cal y
ear-
end:
G
ames
6,10
26,
002
5,99
86,
040
6,18
86,
232
6,13
36,
135
6,01
95,
985
Ta
bles
469
388
473
540
760
1,09
81,
102
1,00
11,
063
1,13
2
Slo
ts21
3,19
121
2,49
320
9,97
620
5,04
120
4,21
320
7,56
920
2,36
219
8,08
019
4,18
019
0,13
5D
epar
tmen
t of B
usin
ess
and
Indu
stry
U
nits
of a
fford
able
hou
sing
pro
duce
d (b
)35
035
026
326
323
623
640
340
3N
/AN
/ATa
xica
b A
utho
rity
notic
es o
f vio
latio
n is
sued
(f)
4,07
74,
077
4,04
64,
046
3,29
03,
290
3,12
94,
066
4,29
23,
474
Taxi
cab
Aut
horit
y ve
hicl
e in
spec
tions
mad
e (f)
7,14
77,
147
6,83
66,
836
6,62
76,
627
6,48
67,
025
7,50
77,
471
Num
ber o
f wor
ksite
saf
ety
& h
ealth
insp
ectio
ns3,
269
3,65
13,
520
3,07
02,
753
2,59
42,
399
2,56
62,
835
2,04
0N
umbe
r of b
oile
r and
ele
vato
r ins
pect
ions
12,8
8919
,702
20,0
2020
,105
20,5
3520
,606
18,3
2319
,233
21,2
0016
,382
Insu
ranc
e lic
ense
and
rene
wal
app
licat
ions
pro
cess
ed (b
)23
,911
23,9
1130
,621
30,6
2141
,646
41,6
4644
,765
44,7
65N
/AN
/ATr
ansp
orta
tion
Nev
ada
Dep
artm
ent o
f Tra
nspo
rtatio
n M
iles
of h
ighw
ays
- ru
ral
(e)
4,89
94,
898
4,90
04,
900
4,69
44,
741
4,75
74,
736
4,80
24,
782
Mile
s of
hig
hway
s -
urba
n (e
)54
854
954
954
970
565
866
566
261
861
8R
ecre
atio
n an
d R
esou
rce
Dev
elop
men
tC
omm
issi
on o
n To
uris
m
Inqu
iries
from
adv
ertis
ing
cam
paig
n (d
)17
7,35
017
7,35
017
5,31
812
4,60
815
5,01
916
2,59
230
1,22
341
7,26
936
3,67
719
6,05
8To
uris
m w
eb s
ite v
isito
rs (d
)1,
033,
601
1,03
3,60
11,
327,
170
1,34
1,04
61,
423,
359
1,40
5,97
21,
951,
193
3,45
9,74
51,
685,
237
2,05
6,34
9C
omm
issi
on o
n E
cono
mic
Dev
elop
men
tN
umbe
r of p
roje
cts
requ
estin
g C
omm
unity
Dev
elop
men
t Blo
ck G
rant
s (f)
5353
4343
5757
4237
2146
Num
ber o
f pro
ject
s fu
nded
(f)
4040
2828
2727
2726
2038
Dep
artm
ent o
f Con
serv
atio
n an
d N
atur
al R
esou
rces
P
erce
nt o
f hum
an c
ause
d w
ildla
nd fi
res
in N
DF'
s ju
risdi
ctio
n in
vest
igat
ed (b
)96
%96
%10
0%10
0%97
%97
%10
0%10
0%N
/AN
/AN
umbe
r of S
tate
Par
k us
ers
(c)
3,31
5,15
83,
305,
115
3,29
6,02
03,
219,
061
3,20
7,53
73,
215,
606
3,34
3,05
33,
004,
037
3,15
0,69
3N
/AN
umbe
r of S
tate
Par
k us
ers
per F
TE e
mpl
oyee
s (b
)23
,940
23,9
4026
,054
26,0
5424
,391
24,3
9122
,915
22,9
15N
/AN
/AN
umbe
r of S
tate
Par
k us
ers
per a
rres
t (b)
, act
ual b
egin
ning
200
513
9,49
513
9,49
513
1,74
913
1,74
950
,027
54,9
2066
,552
49,3
0194
,441
153,
375
N/A
= n
ot a
vaila
ble
Not
es:
(a) S
ee ta
ble
13 fo
r pub
lic s
choo
l enr
ollm
ent.
(f) D
ata
from
Exe
cutiv
e B
udge
t prio
r to
2006
.
(c) D
ata
base
d on
cal
enda
r yea
r.(d
) Rev
ised
figu
res
prov
ided
by
Com
mis
sion
on
Tour
ism
for 2
003-
2006
and
200
9.(e
) Dat
a pr
ior t
o 20
09 w
as b
ased
on
cale
ndar
yea
r.
Sour
ces:
Nev
ada
Dep
artm
ents
of T
axat
ion,
Per
sonn
el, H
ealth
and
Hum
an S
ervi
ces,
Cul
tura
l Affa
irs, C
orre
ctio
ns, M
otor
Veh
icle
s, P
ublic
Saf
ety,
Tra
nspo
rtatio
n, B
usin
ess
and
Indu
stry
, Con
serv
atio
n an
d N
atur
al R
esou
rces
; Sup
rem
e C
ourt
of N
evad
a; N
evad
a G
amin
g C
omm
issi
on a
nd C
ontro
l Boa
rd; P
ublic
Em
ploy
ees
Ben
efit
Pro
gram
; Sta
te o
f Nev
ada
Exe
cutiv
e B
udge
ts.
(b) T
he E
xecu
tive
Bud
get i
s pr
epar
ed b
ienn
ially
, and
act
ual f
igur
es a
re o
nly
avai
labl
e fo
r the
bas
e ye
ar (e
ven
num
bere
d ye
ars)
. Th
eref
ore,
bas
e ye
ar fi
gure
s ha
ve b
een
used
for o
dd n
umbe
red
year
s in
this
tabl
e.

Sta
tistic
al T
able
s
164
NEVA
DA
Last
Ten
Fis
cal Y
ears
Tabl
e 16
- C
apita
l Ass
et S
tatis
tics
by F
unct
ion
2001
2002
2003
2004
2005
2006
2007
2008
2009
2010
Gen
eral
Gov
ernm
ent
Sta
te o
wne
d of
fice
spac
e (s
quar
e fe
et)
132,
975
138,
011
138,
011
146,
045
142,
733
214,
747
215,
867
201,
688
201,
688
202,
229
Veh
icle
s (m
otor
poo
l)76
281
675
678
974
182
479
084
985
182
8H
ealth
and
Soc
ial S
ervi
ces
Sta
te o
wne
d of
fice
spac
e (s
quar
e fe
et)
86,7
1277
,668
77,6
6893
,509
93,5
0912
2,41
552
,626
33,0
9333
,344
70,9
39M
enta
l hea
lth c
ente
rs5
55
55
55
55
5V
eter
ans'
hom
e0
11
11
11
11
1Y
outh
cor
rect
iona
l cen
ters
22
23
33
33
32
Veh
icle
s25
427
226
724
925
124
124
022
523
221
9Ed
ucat
ion
and
Supp
ort S
ervi
ces
Sta
te o
wne
d of
fice
spac
e (s
quar
e fe
et)
19,7
6719
,767
19,7
6719
,767
19,7
6728
,200
28,2
0028
,200
27,9
4928
,031
Num
ber o
f Sta
te m
useu
ms
66
77
77
77
77
Sta
te li
brar
y1
11
11
11
11
1La
w, J
ustic
e an
d Pu
blic
Saf
ety
Sta
te o
wne
d of
fice
spac
e (s
quar
e fe
et)
383,
308
385,
428
400,
108
459,
331
478,
724
550,
648
540,
125
596,
564
596,
564
646,
446
Sup
rem
e C
ourt
build
ing
11
11
11
11
11
Dep
artm
ent o
f Cor
rect
ions
faci
litie
s21
2020
2020
2121
1920
20V
ehic
les
915
1,02
21,
049
1,02
01,
065
1,09
11,
067
1,17
21,
217
1,19
9R
egul
atio
n of
Bus
ines
sS
tate
ow
ned
offic
e sp
ace
(squ
are
feet
)74
,470
77,9
5477
,954
72,2
5971
,811
107,
547
107,
547
107,
547
107,
547
106,
027
Veh
icle
s20
724
023
825
028
327
928
529
229
332
3Tr
ansp
orta
tion
Sta
te o
wne
d of
fice
spac
e (s
quar
e fe
et)
179,
948
179,
948
179,
948
179,
948
179,
948
184,
988
251,
658
251,
658
251,
658
258,
056
ND
OT
lane
mile
s13
,220
13,2
0313
,196
13,1
9913
,199
13,0
8713
,131
13,1
3713
,055
13,0
55N
DO
T br
idge
s1,
004
994
1,00
599
71,
015
1,02
51,
045
1,09
21,
092
1,09
2N
DO
T ve
hicl
es79
181
275
880
382
987
286
490
182
662
5N
DO
T he
avy
equi
pmen
t1,
751
1,75
11,
814
1,80
21,
826
1,87
51,
900
1,91
31,
886
2,03
3N
DO
T m
aint
enan
ce s
tatio
ns (s
taffe
d)45
4545
4545
4151
4845
45R
ecre
atio
n an
d R
esou
rce
Dev
elop
men
tS
tate
ow
ned
offic
e sp
ace
(squ
are
feet
)33
,042
26,9
6526
,965
36,5
9336
,593
146,
982
137,
353
139,
874
139,
874
140,
998
Num
ber o
f Sta
te P
arks
2525
2525
2526
2425
2424
Acr
es o
f Sta
te P
arks
132,
590
132,
590
132,
590
132,
800
132,
800
132,
800
132,
800
132,
117
145,
750
145,
750
Num
ber o
f Fis
h H
atch
erie
s4
44
44
44
44
4W
ildlif
e M
anag
emen
t Are
as11
1111
1111
1111
1111
11A
cres
of W
ildlif
e M
anag
emen
t Are
as11
7,95
911
7,95
911
7,95
911
7,95
911
7,95
911
7,95
911
7,95
911
7,95
911
6,88
811
8,99
3V
ehic
les
911
913
940
927
1,00
799
880
381
185
491
9
Sour
ces:
Fed
eral
Hig
hway
Adm
inis
tratio
n; N
evad
a A
ttorn
ey G
ener
al's
Offi
ce; N
evad
a D
epar
tmen
ts o
f Adm
inis
tratio
n, C
onse
rvat
ion
and
Nat
ural
Res
ourc
es, C
orre
ctio
ns, C
ultu
ral A
ffairs
, H
ealth
& H
uman
Ser
vice
s, T
rans
porta
tion,
Wild
life
Not
e: D
ivis
ion
of B
uild
ings
and
Gro
unds
cha
nged
the
way
Sta
te-o
wne
d of
fice
build
ing
rent
(pre
viou
sly
base
d on
use
able
squ
are
foot
age)
is c
alcu
late
d be
ginn
ing
in fi
scal
yea
r 200
6. R
ent i
s no
w b
ased
on
gros
s in
stea
d of
use
able
squ
are
foot
age.

165
Douglas County, NVPhotographed by Grant Tuttle

166
Heavenly Ski ResortSouth Lake Tahoe, NVPhotographed by Dana Tuttle

167
compliance Section
Little Dipper Heavenly Ski ResortSouth Lake Tahoe, NVPhotographed by Dana Tuttle

168
Independent Auditor’s Report on Internal Control over Financial Reporting and on Compliance and Other Matters Based on an Audit of Financial Statements
Performed in Accordance with Government Auditing Standards
The Honorable Kim Wallin, CMA, CFM, CPA State Controller We have audited the financial statements of the governmental activities, the business-type activities, the aggregate discretely presented component units, each major fund, and the aggregate remaining fund information of the State of Nevada (the State), as of and for the year ended June 30, 2010, which collectively comprise the State’s basic financial statements and have issued our report thereon dated December 17, 2010. Our report was modified to include a reference to other auditors. We conducted our audit in accordance with auditing standards generally accepted in the United States of America and the standards applicable to financial audits contained in Government Auditing Standards, issued by the Comptroller General of the United States. Other auditors audited the financial statements of the Nevada System of Higher Education and the Colorado River Commission, discretely presented component units; the Housing Division Enterprise Fund, the Self Insurance and Insurance Premiums Internal Service Funds, the Pension Trust Funds and the Other Employee Benefit Trust Fund – State Retirees’ Fund, the Nevada College Savings Plan – Private Purpose Trust Fund, and the Retirement Benefits Investment Fund as described in our report on the State’s financial statements. This report does not include the results of the other auditors’ testing of internal control over financial reporting or compliance and other matters that are reported on separately by some of those auditors. The financial statements of the Higher Education Tuition Trust Enterprise Fund, the Self Insurance and Insurance Premiums Internal Service Funds, the Pension Trust Funds and the Other Employee Benefit Trust Fund – State Retirees’ Fund, the Nevada College Savings Plan – Private Purpose Trust Fund, and the Retirement Benefits Investment Fund were not audited in accordance with Government Auditing Standards. Internal Control Over Financial Reporting: In planning and performing our audit, we considered the State’s internal control over financial reporting as a basis for designing our auditing procedures for the purpose of expressing our opinions on the financial statements, but not for the purpose of expressing an opinion on the effectiveness of the State’s internal control over financial reporting. Accordingly, we do not express an opinion on the effectiveness of the State’s internal control over financial reporting. A deficiency in internal control exists when the design or operation of a control does not allow management or employees, in the normal course of performing their assigned functions, to prevent or detect and correct misstatements on a timely basis. A material weakness is a deficiency, or combination of deficiencies, in internal control such that there is a reasonable possibility that a material misstatement of the entity’s financial statements will not be prevented, or detected and corrected on a timely basis.

Our consideration of the internal control over financial reporting was for the limited purpose described in the first paragraph of this section and was not designed to identify all deficiencies in internal control over financial reporting that might be deficiencies, significant deficiencies or material weaknesses. We did not identify any deficiencies in internal control over financial reporting that we consider to be material weaknesses, as defined above. Compliance and Other Matters: As part of obtaining reasonable assurance about whether the State’s financial statements are free of material misstatement, we performed tests of its compliance with certain provisions of laws, regulations, contracts and grant agreements, noncompliance with which could have a direct and material effect on the determination of financial statement amounts. However, providing an opinion on compliance with those provisions was not an objective of our audit and, accordingly, we do not express such an opinion. The results of our tests disclosed no instances of noncompliance or other matters that are required to be reported under Government Auditing Standards. This report is intended solely for the information and use of the Nevada Legislature, management of the State, and Federal awarding agencies and pass-through entities and is not intended to be and should not be used by anyone other than these specified parties. Reno, Nevada December 17, 2010

170