Comprehensive Annual Financial Report - tn.gov Cover: Raccoon ... and Office of Management and...
201
Comprehensive Annual Financial Report June 30, 2004 Comprehensive Annual Financial Report June 30, 2004
Transcript of Comprehensive Annual Financial Report - tn.gov Cover: Raccoon ... and Office of Management and...

Com
prehensive Annual Financial Report June 3
0, 2
00
4
Comprehensive Annual Financial Report June 30, 2004

Tennessee ComprehensiveAnnual Financial Report
For the Year Ended June 30, 2004PHIL BREDESEN, Governor
DEPARTMENT OF AUDITJOHN G. MORGAN, Comptroller of the Treasury
Division of State AuditARTHUR A. HAYES, JR., Director
DEPARTMENT OF FINANCE AND ADMINISTRATIONM.D. GOETZ, JR., Commissioner
Division of AccountsJAN I. SYLVIS, Chief of Accounts
Tennessee Department of Finance and Administration,Authorization No. 317332, December, 2004. 850 copies. Thispublic document was promulgated at a cost of $8.62 per copy.
Front Cover: Raccoon (State Wild Animal)Photographic ServicesState of Tennessee

STATE OF TENNESSEE COMPREHENSIVE ANNUAL FINANCIAL REPORT
FOR THE YEAR ENDED JUNE 30, 2004
TABLE OF CONTENTS INTRODUCTORY SECTION Page Letters of Transmittal I Organization Chart VI Certificate of Achievement for Excellence in Financial Reporting VII FINANCIAL SECTION Auditor’s Report 2 Management’s Discussion and Analysis 5 Basic Financial Statements: Government-wide Financial Statements: Statement of Net Assets 17 Statement of Activities 18 Fund Financial Statements: Balance Sheet - Governmental Funds 22 Statement of Revenues, Expenditures, and Changes in Fund Balances - Governmental Funds 23 Reconciliation of the Statement of Revenues, Expenditures, and Changes in Fund Balances of Governmental Funds to the Statement of Activities 24 Statement of Net Assets - Proprietary Funds 26 Statement of Revenues, Expenses, and Changes in Fund Net Assets - Proprietary Funds 27 Statement of Cash Flows - Proprietary Funds 28 Statement of Fiduciary Net Assets - Fiduciary Funds 32 Statement of Changes in Fiduciary Net Assets - Fiduciary Funds 33 Index for the Notes 34 Required Supplementary Information: Infrastructure Assets Reported Using the Modified Approach 84 Schedule of Revenues, Expenditures, and Changes in Fund Balances - Budget and Actual–Major Governmental Funds 86 Reconciliation of Budget to GAAP - Note to RSI 88 Supplementary Information Nonmajor Governmental Funds: Combining Balance Sheet - Nonmajor Governmental Funds - by Fund Type 90 Combining Statement of Revenues, Expenditures, and Changes in Fund Balances - Nonmajor Governmental Funds - by Fund Type 91 Nonmajor Special Revenue Funds: Combining Balance Sheet - Nonmajor Special Revenue Funds 94 Combining Statement of Revenues, Expenditures, and Changes in Fund Balances - Nonmajor Special Revenue Funds 98 Combining Schedule of Revenues, Expenditures, and Changes in Fund Balances - Budget and Actual (Budgetary Basis) – All Nonmajor Budgeted Special Revenue Funds 102

Page Debt Service Fund: Schedule of Revenues, Expenditures, and Changes in Fund Balances - Budget and Actual (Budgetary Basis) – Debt Service Fund 117 Permanent Funds: Combining Balance Sheet - Permanent Funds 120 Combining Statement of Revenues, Expenditures, and Changes in Fund Balances - Permanent Funds 121 General Fund Supplementary Schedules: Comparative Schedules of Revenues by Source - General Fund 124 Comparative Schedules of Expenditures by Function and Department - General Fund 125 Nonmajor Enterprise Funds: Combining Statement of Net Assets - Nonmajor Enterprise Funds 128 Combining Statement of Revenues, Expenses, and Changes in Fund Net Assets - Nonmajor Enterprise Funds 130 Combining Statement of Cash Flows - Nonmajor Enterprise Funds 132 Internal Service Funds: Combining Statement of Net Assets - Internal Service Funds 136 Combining Statement of Revenues, Expenses, and Changes in Fund Net Assets - Internal Service Funds 138 Combining Statement of Cash Flows - Internal Service Funds 140 Fiduciary Funds: Combining Statement of Fiduciary Net Assets - Pension and Other Employee Benefit Trust Funds 144 Combining Statement of Changes in Fiduciary Net Assets - Pension and Other Employee Benefit Trust Funds 145 Combining Statement of Fiduciary Net Assets - Private-Purpose Trust Funds 146 Combining Statement of Changes in Fiduciary Net Assets - Private-Purpose Trust Funds 147 Combining Statement of Fiduciary Net Assets - Agency Funds 148 Combining Statement of Changes in Assets and Liabilities - All Agency Funds 149 Component Units: Combining Statement of Net Assets - Component Units 152 Combining Statement of Activities - Component Units 156 Combining Statement of Revenues, Expenditures, and Changes in Fund Balances - Governmental Fund Type Component Units 158 Combining Statement of Revenues, Expenses, and Changes in Fund Net Assets - Proprietary Fund Type Component Units 160 Statement of Fiduciary Net Assets – Components Units – Tennessee Student Assistance Corporation – Federal Family Education Loan Trust 162 Statement of Changes in Fiduciary Net Assets – Components Units – Tennessee Student Assistance Corporation – Federal Family Education Loan Trust 163
Schedule Page Supplementary Schedules Debt Service Requirements to Maturity - General Obligation Bonds 1 165 Schedule of Outstanding Debt - All Fund Types 2 166 Schedule of General Obligation Commercial Paper Outstanding-By Purpose - All Fund Types 3 166 Schedule of Outstanding Debt - Component Units 4 167

Table Page STATISTICAL AND ECONOMIC DATA Revenues by Source and Transfers In - All Governmental Fund Types I 169 Expenditures by Function and Transfers Out - All Governmental Fund Types II 169 Tax Revenues by Source - All Governmental Fund Types III 170 Description of Tax Sources - All Governmental Fund Types 171 Ratio of Net General Long-Term Debt to Assessed Value and Net Debt Per Capita IV 172 Computation of Legal Debt Service Margin V 172 Ratio of Annual Debt Service for General Long-Term Debt to Total Expenditures - All Governmental Fund Types VI 173 Schedule of Revenue Bond Coverage - Component Units - Tennessee Housing Development Agency and College and University Funds VII 173 Schedule of Fees/Charges, Legislative Appropriations and Debt Service - Component Units - College and University Funds VIII 174 Student Fees and Charges - For Institutions with Tennessee State School Bond Authority Debt - Component Units - College and University Funds IX 178 Principal Amount of Debt Outstanding by Institution - Component Units - College and University Funds X 178 Economic Characteristics 179 Index to Securities and Exchange Commission (SEC) Disclosures 185 Acknowledgments 186

___________________________________________________________________________________________ INTRODUCTORY SECTION ___________________________________________________________________________________________

This Page Intentionally Left Blank

STATE OF TENNESSEE DEPARTMENT OF FINANCE AND ADMINISTRATION
STATE CAPITOL NASHVILLE, TENNESSEE 37243-0285
DAVE GOETZ COMMISSIONER
December 3, 2004 The Honorable Phil Bredesen Governor of the State of Tennessee I am pleased to submit the Comprehensive Annual Financial Report of the State of Tennessee for the fiscal year ended June 30, 2004. Responsibility for both the accuracy of the data and the completeness and fairness of the presentation, including all disclosures, rests with the State. To the best of our knowledge and belief, the enclosed data are accurate in all material respects and are reported in a manner designed to present fairly the financial position and results of operations of the various funds of the State. All disclosures necessary to enable the reader to gain an understanding of the State’s financial activities are included. In developing and modifying the State’s accounting system, consideration is given to the adequacy of internal accounting controls. Internal accounting controls are designed to provide reasonable, but not absolute, assurance regarding the safeguarding of assets against loss from unauthorized use or disposition, the reliability of financial records for preparing financial statements and maintaining accountability for assets. The concept of reasonable assurance recognizes that the cost of a control should not exceed the benefits likely to be derived and that evaluations occur within the above framework. I believe that the State’s internal accounting controls adequately safeguard assets and provide reasonable assurance of proper recording of financial transactions. Generally accepted accounting principles require that management provide a narrative introduction, overview, and analysis to accompany the basic financial statements in the form of Management’s Discussion and Analysis (MD&A). The State of Tennessee’s MD&A can be found immediately following the report of the independent auditors.
PROFILE OF THE GOVERNMENT The State of Tennessee was admitted to the union in 1796, as the sixteenth state. Tennessee has 41,219 square miles and a population estimated to be 5.9 million. The State has three branches of government, the Executive, Legislative and Judicial. The Executive branch is headed by the Governor, who appoints commissioners to lead the various departments. The Legislative branch is bicameral, with 99 members of the House of Representatives and 33 Senators. The Representatives serve two-year terms. The Senators serve four-year terms, with about one half being elected every two years. The Judicial branch rules on the constitutionality of laws enacted by the Legislature and the legality of administrative policies and regulations of the Executive branch. The financial reporting entity of the State includes all the funds of the primary government as well as all its component units. Component units are legally separate entities for which the primary government is financially accountable. The government provides a full range of services including education, health and social services, transportation, law, correction, safety, resources, regulation, and business and economic development. In addition to internal controls, the State maintains budgetary controls. The objective of these budgetary controls is to ensure compliance with legal provisions embodied in the annually appropriated budget approved by the Legislature. Activities of the general fund, special revenue funds (except Fraud and Economic Crime, Community Development and the Dairy Promotion Board) and debt service fund are included in the annually appropriated budget. Budgetary control is maintained at the departmental level by the encumbrance of estimated purchase amounts prior to the release of purchase orders to vendors. Purchase orders which result in an overrun of available
ag04m88
I

balances are not released until budget revisions are approved or additional appropriations are made. Open encumbrances are reported as reservations of fund balance at June 30, 2004. State statutes require an annual audit of all financial statements of the State. The accompanying financial statements have been examined by the Office of the Comptroller of the Treasury, Division of State Audit. Their examination was conducted in accordance with government auditing standards generally accepted in the United States of America, and their opinion appears elsewhere herein. In conjunction with this examination, the Division of State Audit conducted an organization-wide audit as described in the Single Audit Act of 1984, as amended, and Office of Management and Budget Circular A-133, Audits of State, Local Governments, and Non-Profit Organizations. The audit included tests of compliance with applicable federal laws and regulations, as well as, a study and evaluation of internal controls, including internal accounting and administrative controls used in administering federal financial assistance programs. The results of this single audit are published under separate cover by the Division of State Audit.
FACTORS AFFECTING FINANCIAL CONDITION Local economy. The State’s economic diversity has improved substantially over the last several years. Investments announced in new and expanding manufacturing businesses exceeded $1 billion every year since 1983. Announced manufacturing capital investments in 2003 were $2.33 billion. This growth has created 15,780 new jobs in this year alone, and has had a positive effect on employment and the State’s economy. Additionally, investments in headquarters, distribution and selected services were $1.26 billion in 2003 and created 12,788 new jobs. For June 2004, the state unemployment rate of 4.5% was under the national average of 5.6%. The financial impact of these events is presented later in this letter. Based on current projections, the State’s overall growth is expected to exceed the national average over the next several years. While having a positive impact, this growth also presents significant challenges for the State. If the present level of services is to be maintained and an ambitious program for major improvements in the educational system is to continue to be implemented, the State must continue to conservatively manage its financial resources. The national recession appears to have ended. As evidence, the real (inflation-adjusted) gross domestic product increased only 3.0 percent during the calendar year 2003 and increased over 3.3 percent during each of the first three quarters of 2004. The Federal Reserve has interest rates at historic lows, although rates have risen slightly. Tennessee’s state government will take appropriate steps to ensure that the State is able to successfully manage its finances in the future. Financial planning. The Administration emerged from its first transitional year with state finances restored to a more solid footing. The General Fund Reserve for Revenue Fluctuations at June 30, 2004, was increased to $217 million. While the 2004-2005 budget proposed an average 3.7% reduction, the reduction was smaller than the previous year’s 9% reduction in its discretionary base appropriations. The Administration concentrated on its review of the TennCare program, the State’s managed care health insurance program that replaced and expanded Medicaid in 1994. Through private-sector donations, the state obtained the services of a consultant, McKinsey and Company, to report on the program’s viability. TennCare, in its current form, is consuming greater and greater portions of the total state budget each year. The McKinsey report offered options to curb the rate of program growth and provided some financial projections to aid in budgetary analysis. Based on the report, the Administration developed a reform effort that was sent to the federal government for approval. Represented advocacy groups requested, and were granted, a stay of the reform process. While deliberations are continuing, the state is exploring its options, including a return to a basic Medicaid program.
ag04m88
II

Pension and other post-employment benefits. The State sponsors a cost-sharing multiple employer defined benefit pension plan. Biennially, an independent actuary engaged by the State calculates the contribution rate that the State must make to the pension plan to ensure that the plan will be able to fully meet its obligations to retired employees on a timely basis. As a matter of policy, the State fully funds each year’s annual required contribution to the pension plan as determined by the actuary. As a result of the State’s conservative funding policy, as of July 1, 2003, the present value of the projected benefits earned by employees is funded at 99.8%. The State also provides post-retirement health benefits for employees and retirees. For fiscal year ended June 30, 2004, there was an average of 6,433 retired employees receiving these benefits, which were financed on a pay-as-you-go-basis. Generally Accepted Accounting Principles (GAAP) do not require governments to report a liability in the financial statements in connection with an employer’s obligation to provide these benefits. Additional information on the State’s pension arrangement and post-employment benefits can be found in Notes 6E and G in the notes to the financial statements. Cash Management. The State Treasurer has pursued an aggressive cash management and investment program. One aspect of this, which we believe is unique to Tennessee, is our direct access into the Federal Reserve wire system. Through the State Trust of Tennessee, wire services in the federal system are available via a terminal located in the State’s investment offices. This provides the State flexibility in investing and concentrating cash balances, pension fund assets, and in redeeming warrants and checks issued against the Treasury. During fiscal year 2004, uncommitted State funds were invested in short-term collateralized deposits as follows (averaged): certificates of deposit (48%); repurchase agreements (7%); commercial paper (22%); U.S. Treasuries (22%); and money market accounts (1%). The composite average yield on these investments was 1.11%, down from 1.64% last year.
OTHER INFORMATION Securities and Exchange Commission Disclosures. The State Funding Board, the Tennessee State School Bond Authority, and the Tennessee Local Development Authority have each entered into Continuing Disclosure Undertakings with respect to certain debt issues. These Undertakings were made for the benefit of the holders of the debt pursuant to U.S. Securities and Exchange Commission Rule 15c2-12. The issuers have covenanted to provide certain annual financial information, including audited financial statements, as well as, certain additional financial and operating data. With the exceptions of information related to Tennessee Consolidated Retirement System and of certain local government financial information related to the Tennessee Local Development Authority provided to the Nationally Recognized Municipal Securities Information Repositories (NRMSIRs) under separate cover, financial and operating data required pursuant to the Undertakings is located in this Comprehensive Annual Financial Report. The reader should use the index located at the end of this report to identify the specific page where the information is presented. Awards. The Government Finance Officers Association of the United States and Canada (GFOA) awarded a Certificate of Achievement for Excellence in Financial Reporting to the State of Tennessee for its Comprehensive Annual Financial Report for the year ended June 30, 2003. This is the twenty-fifth consecutive year that the State has received this prestigious award. In order to be awarded a Certificate of Achievement, a government must publish an easily readable and efficiently organized comprehensive annual financial report. This report must satisfy both generally accepted accounting principles and applicable legal requirements. A Certificate of Achievement is valid for a period of one year only. We believe our current Comprehensive Annual Financial Report continues to meet the Certificate of Achievement Program requirements, and we are submitting it to the GFOA to determine its eligibility for another certificate. In addition, the Tennessee Consolidated Retirement System has received this award for sixteen consecutive years for its Comprehensive Annual Financial Report.
ag04m88
III
Acknowledgments. The preparation of the comprehensive annual financial report was made possible by the dedication of the entire staff of the Division of Accounts in the Department of Finance and Administration. This report could not have been prepared without the cooperation of all state agencies and branches. Respectfully submitted, /s/ M. D. Goetz, Jr. M. D. Goetz, Jr., Commissioner Department of Finance and Administration MDG/jmc
ag04m88
IV

S T A T E O F T E N N E S S E E C O M P T R O L L E R O F T H E T R E A S U R Y
STATE CAPITOL NASHVILLE, TENNESSEE 37243-0260
(615) 741-2501
John G. Morgan Comptroller December 3, 2004 To the Members of the General Assembly of the State of Tennessee and The Honorable Phil Bredesen, Governor of the State of Tennessee Ladies and Gentlemen: In accordance with Section 4-3-304, Tennessee Code Annotated, transmitted herewith is the auditor’s report on the Comprehensive Annual Financial Report of the State of Tennessee for the fiscal year ended June 30, 2004. Respectfully, /s/ John G. Morgan John G. Morgan Comptroller of the Treasury JGM/jmc
ag04m88
V

COURT OFAPPEALS
COURT OFCRIMINAL APPEALS
ATTORNEY GENERALPAUL G. SUMMERS
SPEAKER OFTHE SENATE
JOHN S. WILDER
GENERAL ASSEMBLYSUPREME COURT
FRANK F. DROWOTA IIICHIEF JUSTICE
CHANCERYCOURT
LAW ANDEQUITY COURT
CIRCUITCOURTS
CRIMINALCOURTS
SPEAKER OFTHE HOUSE
JIMMY NAIFEH
SECRETARY OFSTATE
RILEY DARNELL
STATETREASURERDALE SIMS
COMPTROLLER OFTHE TREASURY
JOHN G. MORGAN
DEPARTMENT OFPERSONNEL
RANDY C. CAMP
DEPARTMENT OFGENERAL SERVICES
GWENDOLYN SIMS DAVIS
DEPARTMENT OFREVENUE
LOREN L. CHUMLEY
DEPARTMENT OF FINANCEAND ADMINISTRATION
M.D. GOETZ, JR.
DEPARTMENT OFEDUCATION
LANA C. SEIVERS
DEPARTMENT OF ENVIRONMENTAND CONSERVATION
BETSY CHILD
DEPARTMENT OFHUMAN SERVICESVIRGINIA T. LODGE
DEPARTMENT OFSAFETY
FRED PHILLIPS
DEPARTMENT OFCHILDRENS SERVICES
VIOLA P. MILLER
BUREAU OFINVESTIGATION
MARK GWYN
DEPARTMENT OFTRANSPORTATIONGERALD F. NICELY
DEPARTMENT OFHEALTH
KENNETH S. ROBINSON
DEPARTMENT OFMENTAL HEALTHVIRGINIA T. BETTS
DEPARTMENT OF LABOR &WORKFORCE DEVELOPMENT
JAMES G. NEELEY
PROBATION AND PAROLE
CHARLES TRAUGHBER
DEPARTMENT OF COMMERCEAND INSURANCE
PAULA A. FLOWERS
DEPARTMENT OFCORRECTION
QUENTON I. WHITE
DEPARTMENT OFAGRICULTUREKEN GIVENS
DEPARTMENT OF ECONOMICAND COMMUNITY DEVELOPMENT
MATTHEW KISBER
DEPARTMENT OFVETERANS AFFAIRS
JOHN A. KEYS
DEPARTMENT OFTHE MILITARY
GUS L. HARGETT, JR.
DEPARTMENT OFTOURIST DEVELOPMENT
SUSAN H. WHITAKER
DEPARTMENT OFFINANCIAL INSTITUTIONS
KEVIN P. LAVENDER
WILDLIFE RESOURCESAGENCY
GARY T. MYERS
BOARDSAND
COMMISSIONS
BOARDSOF REGENTS
CHARLES MANNING
HIGHER EDUCATIONCOMMISSION
RICHARD G. RHODA
GOVERNORPHIL BREDESEN
ELECTORATE
STATE OF TENNESSEEORGANIZATION CHART
As of June 30, 2004
U.T. BOARDOF TRUSTEES
JOHN D. PETERSON
ag04m88
VI

This Page Intentionally Left Blank
ag04m88
VIII

___________________________________________________________________________________________ FINANCIAL SECTION ___________________________________________________________________________________________
___________________________________________________________________________________________
ag04m88
1

STATE OF TENNESSEE COMPTROLLER OF THE TREASURY
DEPARTMENT OF AUDIT DIVISION OF STATE AUDIT
SUITE 1500 JAMES K. POLK STATE OFFICE BUILDING
NASHVILLE, TENNESSEE 37243-0264 PHONE (615) 401-7897
FAX (615) 532-2765
Independent Auditor’s Report
December 3, 2004
The Honorable John G. Morgan Comptroller of the Treasury State Capitol Nashville, Tennessee 37243
Dear Mr. Morgan: We have audited the accompanying financial statements of the governmental activities, the business-type activities, the aggregate discretely presented component units, each major fund, and the aggregate remaining fund information of the State of Tennessee as of and for the year ended June 30, 2004, which collectively comprise the State’s basic financial statements as listed in the table of contents. These financial statements are the responsibility of the State of Tennessee’s management. Our responsibility is to express opinions on these financial statements based on our audit. We conducted our audit in accordance with auditing standards generally accepted in the United States of America and the standards applicable to financial audits contained in Government Auditing Standards, issued by the Comptroller General of the United States. Those standards require that we plan and perform the audit to obtain reasonable assurance about whether the financial statements are free of material misstatement. An audit includes examining, on a test basis, evidence supporting the amounts and disclosures in the financial statements. An audit also includes assessing the accounting principles used and significant estimates made by management, as well as evaluating the overall financial statement presentation. We believe that our audit provides a reasonable basis for our opinions. Tennessee statutes, in addition to audit responsibilities, entrust certain other responsibilities to the Comptroller of the Treasury. Those responsibilities include serving as a member of the board of directors of many agencies, commissions, and component units of the State of Tennessee; approving accounting policies of the state as prepared by the state’s Department of Finance and Administration; approving plans of operation of the state’s Community Services Agencies and the Tennessee State Veterans’ Homes Board; approving certain state contracts; participating in the negotiation and procurement of services for the state; managing the state’s debt; making loans to the state’s colleges and universities from debt proceeds; maintaining the accounting records for the Tennessee Local Development Authority and the Tennessee State School Bond Authority; developing policy guidelines for the overall management of the state’s information systems; and providing support staff to the State Funding Board, the bond finance committee of the Tennessee Housing Development Agency, various legislative committees, and commissions. The boards of which the Comptroller of the Treasury serves as a member per state statutes include Baccalaureate Education System Trust, Board of Claims, Board of Standards, Chairs of Excellence, Health Services and Development Agency, Local Education Committee, Local Government Insurance Committee, State Building Commission, State Funding Board, State Insurance Committee, State Trust of Tennessee, Tennessee Consolidated Retirement System, Tennessee Higher Education Commission, Tennessee Housing Development Agency, Tennessee Local Development Authority, Tennessee Student Assistance Corporation, and Tennessee State School Bond Authority.
ag04m88
2

Page 2 December 3, 2004 In our opinion, the financial statements referred to above present fairly, in all material respects, the respective financial position of the governmental activities, the business-type activities, the aggregate discretely presented component units, each major fund, and the aggregate remaining fund information of the State of Tennessee as of June 30, 2004, and the respective changes in financial position and cash flows, where applicable, thereof for the year then ended in conformity with accounting principles generally accepted in the United States of America. As discussed in Note 4 to the financial statements, the State of Tennessee has implemented the Governmental Accounting Standards Boards’ Statement No. 39, Determining Whether Certain Organizations Are Component Units and Technical Bulletin No. 2004-1, Tobacco Settlement Recognition and Financial Reporting Entity Issues. The management’s discussion and analysis, the schedule of revenues, expenditures and changes in fund balances – budget and actual, and infrastructure assets reported using the modified approach are not a required part of the basic financial statements but are supplementary information required by accounting principles generally accepted in the United States of America. We have applied certain limited procedures, which consisted principally of inquiries of management regarding the methods of measurement and presentation of the required supplementary information. However, we did not audit the information and express no opinion on it. Our audit was conducted for the purpose of forming opinions on the financial statements that collectively comprise the State of Tennessee’s basic financial statements. The introductory section, combining and individual nonmajor fund financial statements and schedules, and statistical and economic data are presented for purposes of additional analysis and are not a required part of the basic financial statements. The combining and individual nonmajor fund financial statements and schedules have been subjected to the auditing procedures applied in the audit of the basic financial statements and, in our opinion, are fairly stated in all material respects in relation to the basic financial statements taken as a whole. The introductory section and statistical and economic data have not been subjected to the auditing procedures applied in the audit of the basic financial statements and, accordingly, we express no opinion on them. In accordance with Government Auditing Standards, we will issue our report dated December 3, 2004, on our consideration of the State of Tennessee’s internal control over financial reporting and on our tests of its compliance with certain provisions of laws, regulations, contracts, and grant agreements and other matters in the Tennessee Single Audit Report. The purpose of that report is to describe the scope of our testing of internal control over financial reporting and compliance and the results of that testing, and not to provide an opinion on the internal control over financial reporting or on compliance. That report is an integral part of an audit performed in accordance with Government Auditing Standards and should be considered in assessing the results of our audit.
Sincerely, /s/ Arthur A. Hayes, Jr. Arthur A. Hayes, Jr., CPA, Director Division of State Audit AAH/jmc
ag04m88
3

This Page Intentionally Left Blank
ag04m88
4

MANAGEMENT’S DISCUSSION AND ANALYSIS Our management discussion and analysis (MD&A) of the State of Tennessee’s (the State’s) financial performance provides an overview of the State’s financial activities for the year ended June 30, 2004. Please read it as a narrative introduction to the financial statements that follow. The information included here should be considered along with the transmittal letter which can be found on pages I-IV of this report. MD&A includes a description of the basic financial statements for government, condensed financial information along with analyses of balances and financial position, descriptions of significant asset and debt activity, discussions of budgetary matters and significant issues affecting financial position.
FINANCIAL HIGHLIGHTS
• Government-wide: Net Assets - The assets of the State exceeded its liabilities at June 30, 2004, by $21.642 billion (reported as net assets). Of this amount, $815.1 million may be used to meet the State’s obligations not funded by restricted net assets. However, $18.694 billion of this amount represents invested in capital assets, net of related debt, which cannot be used to fund ongoing activities of the government. Changes in Net Assets - The State’s net assets increased by $1.298 billion. Most of this increase results from the State’s decision to utilize the modified approach for reporting infrastructure capital assets. Because of this decision, the State capitalized infrastructure expenditures of $654.2 million and did not record depreciation expense. Other capital assets are depreciated. Component units - Component units reported net assets of $3.76 billion, an increase of $142.9 million.
• Fund Level:
At June 30, 2004, the State’s governmental funds reported combined ending fund balances of $2.4 billion, an increase of $725 million (see discussion on page 10) in comparison to the prior year. Of the combined fund balance approximately $658.2 million is available for spending at management’s discretion (unreserved fund balance), however $217 million of this amount is designated for revenue fluctuations.
• Long-Term Debt:
The State’s total debt decreased by $28.5 million during the fiscal year to total $1.232 billion. This change reflects the tight budgetary situation faced by the State in recent years during which capital projects were not authorized in the legislative process. With the improvement in the economy, capital projects were authorized in the legislative session just completed.
USING THIS ANNUAL REPORT This annual report consists of a series of financial statements. The Statement of Net Assets and the Statement of Activities (on pages 17 and 18-19) provide information about the activities of the State as a whole (government-wide statements) and present a longer-term view of the State’s finances. Fund financial statements start on page 22. For governmental activities, these statements tell how services were financed in the short term as well as what remains for future spending. Fund financial statements also report the State’s operations in more detail than the government-wide statements by providing information about the State’s most significant funds. The remaining statements provide financial information about activities for which the State acts solely as a trustee or agent for the benefit of those outside of the government.
ag04m88
5

Reporting the State as a Whole The Statement of Net Assets and the Statement of Activities Our analysis of the State as a whole begins on page 7. One of the most important questions asked about the State’s finances is, “Is the State as a whole better off or worse off as a result of the year’s activities?” The Statement of Net Assets and the Statement of Activities report information about the State as a whole and about its activities in a way that helps answer this question. These statements include all assets and liabilities using the accrual basis of accounting, which is similar to the accounting used by most private-sector companies. All of the current year’s revenues and expenses are taken into account regardless of when cash is received or paid. These statements report financial information about the entire government except fiduciary activities. The statements distinguish between the primary government and its component units, and also distinguish between governmental activities and business-type activities of the primary government. The Statement of Net Assets displays all the State’s financial and capital resources in the format of assets minus liabilities equal net assets. The Statement of Activities reports the State’s operations by function to arrive at net revenue (expense). The statement reports what type revenue (either program revenue or tax revenue) funds the government operations. The State functions that are identified on this statement correspond to the functions used for budgetary purposes:
• Governmental activities–general government; education; health and social services; law, justice and public safety; recreation and resources development; regulation of business and professions; transportation; state shared taxes paid to local governments; and interest on long-term debt.
• Business-type activities–employment security, insurance programs, loan programs and other.
• Component units–significant component units include the Tennessee Housing Development Agency, the Tennessee
Education Lottery Corporation, the Tennessee Board of Regents, and the University of Tennessee. Although these and other smaller entities are legally separate, these “component units” are important because the State is financially accountable for them.
Reporting the State’s Most Significant Funds Fund financial statements Our analysis of the State’s major funds begins on page 10. The fund financial statements begin on page 22 and provide detailed information about the most significant funds–not the State as a whole. Some funds are required to be established by State law and by bond covenants. However, the State establishes many other funds to help it control and manage money for particular purposes (like capital projects) or to show that it is meeting legal responsibilities for using certain taxes, grants, and other money. The State’s two kinds of funds–governmental and proprietary–use different accounting approaches. Governmental funds focus on the near-term inflows and outflows of funds and the balances left at year-end available for spending. The modified accrual basis of accounting is used for these funds, which means that we measure cash and all other financial assets that can readily be converted to cash. These statements provide a short-term view of the State’s basic general government operations. One can determine whether there are more or fewer financial resources that can be spent in the near future. The governmental activities in the Statement of Net Assets are reconciled to the governmental funds in the fund financial statements in a reconciliation at the bottom of the fund financial statements. Proprietary funds report the government services that charge service fees to its customers. Proprietary funds include enterprise funds (serving citizens) and internal service funds (serving state agencies). The enterprise funds are the same as the business-type activities reported in the government-wide statements, but provide more detail; whereas the internal service funds are included in the governmental activities. Notes to the financial statements. Notes to the financial statements are also included and provide necessary information to understand the financial statements. They are an integral part of the financial statements and focus on the primary government and its activities. Some information is provided for significant component units.
ag04m88
6

The State as Trustee Reporting the State’s Fiduciary Responsibility Fiduciary funds are used to report resources held for the benefit of parties outside the government. Fiduciary funds are not reflected in the government-wide financial statements because the State cannot use these assets to finance its operations. Instead, the State is responsible for using the fiduciary assets for the fiduciary fund’s intended purposes.
THE STATE AS A WHOLE Government-wide Financial Analysis Net assets may serve over time as a useful indicator of a government’s financial position. In the case of the State, combined assets exceeded liabilities by $21.642 billion as of June 30, 2004. By far the largest portion of the State’s net assets (86%) reflects its investment in capital assets (e.g., land, infrastructure, structures and improvements, machinery and equipment), less any related debt used to acquire those assets that is still outstanding. The State uses these capital assets to provide services to its citizens; consequently, these assets are not available for future spending. Although the State’s investment in its capital assets is reported net of related debt, it should be noted that the resources needed to repay this debt must be provided from other sources, since the capital assets themselves cannot be used to liquidate these liabilities.
State of Tennessee Net Assets
(Expressed in Thousands)
Governmental Activities Business-Type Activities Total Primary Government 2004 2003 2004 2003 2004 2003 Current and other assets $ 4,412,431 $ 3,580,391 $ 1,427,852 $ 1,307,543 $ 5,840,283 $ 4,887,934 Capital assets 19,178,823 18,643,165 _________ _________ 19,178,823 18,643,165 Total Assets 23,591,254 22,223,556 1,427,852 1,307,543 25,019,106 23,531,099 Current and other liabilities 1,545,081 1,476,722 59,797 63,786 1,604,878 1,540,508 Noncurrent liabilities 1,764,352 1,635,566 8,140 11,129 1,772,492 1,646,695 Total liabilities 3,309,433 3,112,288 67,937 74,915 3,377,370 3,187,203 Net assets: Invested in capital assets, net of related debt 18,694,346 18,119,735 18,694,346 18,119,735 Restricted net assets 843,889 703,010 1,288,353 1,181,636 2,132,242 1,884,646 Unrestricted net assets 743,586 288,523 71,562 50,992 815,148 339,515 Total net assets $ 20,281,821 $ 19,111,268 $ 1,359,915 $ 1,232,628 $21,641,736 $ 20,343,896 An additional portion of the State’s net assets (9.9 percent) is restricted and represents resources that are subject to either external restrictions or legislative restrictions on how they may be used. The remaining balance is unrestricted net assets ($815.148 million) and may be used to meet the State’s ongoing obligations to citizens and creditors not funded by resources that are restricted. At the end of the current fiscal year, the State was able to report positive balances in all three categories of net assets, for the government as a whole, and for its separate governmental and business-type activities. The State’s net assets increased by $1.298 billion during the year ended June 30, 2004. As previously discussed, most of this increase was attributable to the State’s decision to adopt the modified approach to infrastructure. Because of this decision, the State capitalized $654.2 million in infrastructure expenditures and did not record depreciation expense. Also, Tennessee does not fund highway construction by issuing debt, but it is funded primarily with fuel taxes and federal grants in the Highway Fund. Most of the remaining gain of $643.8 million resulted from operations in the General Fund, which is discussed later in this MD&A.
ag04m88
7

Net assets of the State’s business-type activities increased by $127.3 million. This increase was caused by a $47.5 million increase in the Employment Security Fund, which resulted from the improvement in the national economy, and a $40.6 million increase in the sewer treatment loan program, which resulted from increases in the number of loans issued and the amount of federal monies received for these loans.
State of Tennessee Changes in Net Assets
(Expressed in Thousands)
Governmental Activities Business-Type Activities Total Primary Government 2004 2003 2004 2003 2004 2003 Revenues: Program revenues: Charges for services $ 1,775,553 $ 1,040,020 $ 960,800 $ 837,350 $ 2,736,353 $ 1,877,370 Operating grants and contributions 8,095,087 7,452,665 208,296 256,444 8,303,383 7,709,109 Capital grants and contributions 503,539 568,221 503,539 568,221 General revenues: Sales Taxes 5,806,268 5,478,642 5,806,268 5,478,642 Other taxes 3,540,115 3,306,366 3,540,115 3,306,366 Grants and contributions not restricted to specific programs 152,676 149,746 152,676 149,746 Other 219,732 242,352 _________ _________ 219,732 242,352 Total revenues 20,092,970 18,238,012 1,169,096 1,093,794 21,262,066 19,331,806 Expenses: General government 546,996 510,674 546,996 510,674 Education 4,692,605 4,520,624 4,692,605 4,520,624 Health and social services 10,583,726 9,507,209 10,583,726 9,507,209 Law, justice and public safety 1,032,302 968,859 1,032,302 968,859 Recreation and resources development 479,251 376,734 479,251 376,734 Regulation of business and professions 81,940 64,109 81,940 64,109 Transportation 787,646 726,476 787,646 726,476 State shared taxes paid to local governments 647,654 641,271 647,654 641,271 Interest on long-term debt 51,819 50,610 51,819 50,610 Employment security 639,993 767,202 639,993 767,202 Insurance programs 416,871 379,661 416,871 379,661 Loan programs 1,737 2,273 1,737 2,273 Other __________ __________ 2,037 1,802 2,037 1,802 Total expenses 18,903,939 17,366,566 1,060,638 1,150,938 19,964,577 18,517,504 Increase (decrease) in net assets before contributions and transfers 1,189,031 871,446 108,458 (57,144) 1,297,489 814,302 Transfers (18,829) (18,881) 18,829 18,881 Contributions to permanent funds 351 381 _________ _________ 351 381Increase (decrease) in net assets 1,170,553 852,946 127,287 (38,263) 1,297,840 814,683 Net assets, July 1 19,111,268 18,258,322 1,232,628 1,270,891 20,343,896 19,529,213 Net assets, June 30 $ 20,281,821 $ 19,111,268 $ 1,359,915 $ 1,232,628 $ 21,641,736 $ 20,343,896
ag04m88
8
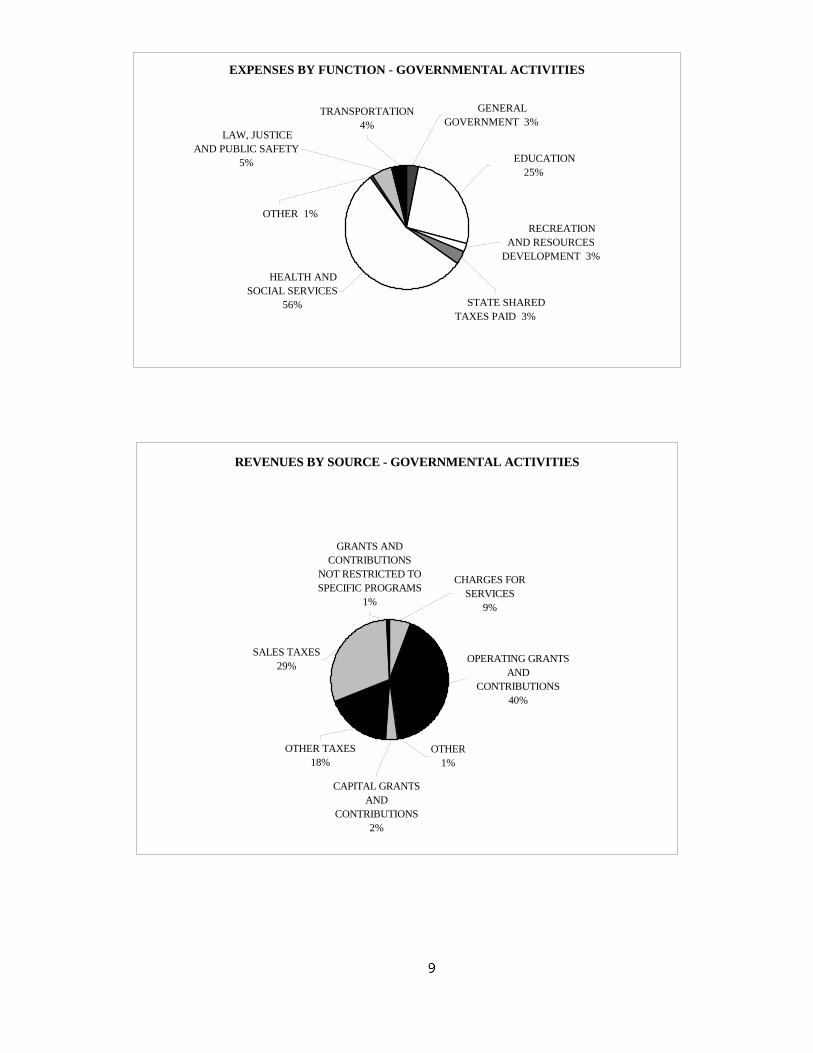
EXPENSES BY FUNCTION - GOVERNMENTAL ACTIVITIES
TRANSPORTATION
4%
HEALTH AND SOCIAL SERVICES
56% STATE SHARED TAXES PAID 3%
EDUCATION 25%
RECREATION AND RESOURCES
DEVELOPMENT 3%
GENERAL GOVERNMENT 3%
LAW, JUSTICE AND PUBLIC SAFETY
5%
OTHER 1%
REVENUES BY SOURCE - GOVERNMENTAL ACTIVITIES
SALES TAXES29%
OPERATING GRANTS AND
CONTRIBUTIONS40%
CAPITAL GRANTS AND
CONTRIBUTIONS2%
OTHER 1%
GRANTS AND CONTRIBUTIONS
NOT RESTRICTED TO SPECIFIC PROGRAMS
1%
CHARGES FOR SERVICES
9%
OTHER TAXES18%
ag04m88
9

THE STATE’S FUNDS Tax collections increased for the year and expenditures increased as well. Details are in the following paragraphs. The Revenue Fluctuation Reserve has been increased to $217 million or 1.6% of General Fund expenditures. $96.7 million was received from the federal government in fiscal year 2004 for tax relief. These funds were given to states to help fund budgetary deficits. The funds can be used to fund virtually any operating expense of state government. $35.3 million was used to fund current year expenditures. The remaining funds will be held in reserve for future expenditures. General fund revenue collections increased for the year by $1.4 billion. Sales tax collections increased by $157 million due to the improved economy. Franchise and excise tax collections were up 14% due to the recovering economy along with a rate increase that was effective September 1, 2002. This is the first full year the increase has been in effect. Business tax collections were up $54 million due to the tax rate changes that were effective September 1, 2002. This is the first full year that the increase was in effect. Hall income tax collections were up by 36% due to the improved economy. The State experienced an 9% increase or $581 million in federal revenue primarily due to an increase in expenditures within the TennCare program. The overall result of these variations showed an increase in total revenues collected from the previous year of 10.8%. General fund expenditures increased approximately $1 billion or 9%. $767 million of this increase was due to increased expenditures in the TennCare program resulting from increased pharmaceutical costs, managed care organization costs, and provider payments. In addition, Human Services experienced increased expenditures of $90 million. This increase was due to the increase in food stamp coupons distributed to citizens. Mental Health and Mental Retardation expenditures increased by $57 million, with community services increased by $42 million. This increase reflects the rising cost of community residential placements and associated medical costs as well as increased demand for services. Current assets in the General fund increased 31% due to a $625 million increase in cash. The State’s cash position was strengthened due to increased tax collections resulting from an improved economy. The fund balance of the general fund doubled due to the increased cash position of the State. The Education Trust Fund revenue increased $432.7 million for the year. The sales tax appropriated to the fund increased by $188.8 million and federal revenue collections were up by $122.7 million. In addition, the Education Trust Fund began receiving the net lottery proceeds from the Tennessee Education Lottery Corporation (TELC). The TELC established the lottery in January of this year and transferred $123.3 million to the Education Trust Fund to fund scholarships for Tennessee citizens to attend post-secondary educational institutions located in Tennessee. Of the $168.5 million Education Trust fund balance, $122.3 million is restricted for the distribution of these scholarships. Education Trust Fund expenditures increased approximately $198.3 million or 4.5%. Most of the increase was to maintain full funding of the Basic Education Program (BEP) formula, equalize teacher salaries, and provide for teacher salary increases and group health insurance increases for local education agencies ($104.4 million). In addition, expenditures increased due to additional phases of the No Child Left Behind Act being implemented ($56.6 million), increased funding for special education programs ($34.3 million), and additional students qualifying for school nutrition programs ($15.5 million). The revenues for the Highway Fund increased approximately $99.3 million (6.5%) while expenditures decreased by $34.7 million. The increase in revenues was due to increased fuel tax collections and increased federal reimbursements for highway projects and the decrease in expenditures occurred primarily because of required budgetary cuts in administrative expenses. The majority of the increase in fund balance of $42.3 million was reserved for ongoing maintenance and bridge replacement contracts and future state highway construction contracts. Premium increases and changes in benefit levels went into effect on January 1, 2004, for the Local Government Group Insurance Fund (Enterprise Fund) in an attempt to reduce the fund equity deficit in the fund at the beginning of fiscal year 2004. While these changes have reduced the deficit at June 30, 2004, the Local Government Group Insurance Fund remains in a deficit situation. Additional premium increases for the Local Government Group Insurance Funds will go into effect January 1, 2005, in anticipation of rising medical and insurance costs and to address the remaining deficit in the Local Government Group Insurance Fund. Also, premium increases will go into effect January 1, 2005, for the Employee Group Insurance Fund (an Internal Service Fund) and the Teacher Group (Enterprise Fund) in anticipation of rising medical and insurance costs. Since 1985 through fiscal year 2003, the Claims Award Fund (an Internal Service Fund) was used to account for the risk of losses from general liability, automobile liability, professional malpractice, and workers’ compensation. Financial activities relating to the state’s property insurance program were accounted for in the General Fund. Effective July 1, 2003, the property insurance program and the Claims Award Fund activities were consolidated into an Internal Service Fund called the
ag04m88
10

Risk Management Fund. This was done to obtain a consolidated picture of the State’s overall risk management activities and provide operational efficiencies. The total plan net assets of the pension trust funds were $25.6 billion, up over $1.8 billion from the prior year. As a result of the improved performance of the financial markets, the pension trust funds incurred a net investment gain of $2.18 billion. General Fund Budgetary Highlights Federal revenue estimates from original to final budget increased by $853 million primarily due to an increase in federal revenue for the TennCare program. In addition, significant variances between original and final budget were noted for TennCare and Human Services. The TennCare program experienced an increase in funding from original to final budget in the amount of $714 million. This was the result of increased expenditures resulting from increased pharmaceutical costs, managed care organization costs, and provider payments. The department of Human Services experienced an increase in funding from original to final budget in the amount of $142 million due to increased federal funding in the food stamp program. Both TennCare and Human Services appear to reflect significant favorable budgetary variances in expenditures from final budget to actual. This is due to timing differences of federal expenditures making it difficult to accurately project actual expenditures during budgetary planning. The general fund experienced increased tax collections of $352 million as compared to the final budget due to the improved economy. Federal revenue estimates for the final version of the budget were overstated by $458 million due to timing differences of expenditures making it difficult to accurately project actual expenditures during budgetary planning. Other revenue has a favorable variance of $342 million due to the fact that tobacco settlement and federal tax relief revenues were not included in the budget.
CAPITAL ASSET AND DEBT ADMINISTRATION Capital Assets The State’s investment in capital assets at June 30, 2004 of $19.179 billion, net of $988 million accumulated depreciation, consisted of the following:
Capital Assets—Primary Government Governmental Activities
(Expressed in Thousands) June 30, 2004 June 30, 2003 Land $ 955,713 $ 838,035 Infrastructure 16,007,143 15,463,371 Construction in progress 990,694 1,132,374 Structures and improvements 1,710,996 1,666,665 Machinery and equipment 502,220 489,858 Subtotal 20,166,766 19,590,303 Accumulated depreciation (987,943) (947,138) Total $ 19,178,823 $ 18,643,165 More detail of the activity during the fiscal year is presented in Note 5C to the financial statements. Capital assets, including those under construction, increased from fiscal year 2003 to 2004 by approximately 3 percent. The change was primarily due to purchases of land for highway right-of-ways and completion of segments of infrastructure — highways and bridges. Construction in progress for highways and bridges increased by $545.9 million and decreased (projects completed and capitalized) by $675.4 million. Infrastructure right-of-way acreage increased the land classification by $106.5 million. The structures and improvements increase of $58.2 million consisted largely of prison renovations ($9.3 million), state parks additions and improvements ($5.7 million), armory additions ($13.2 million), construction of highway rest areas and storage sheds ($7.1 million), communication tower replacements ($1.0 million), Children’s Services facilities ($5.2 million), completion of the Oak Ridge Computational Sciences building ($7.7 million), and other miscellaneous projects. The net change in machinery and equipment of $12.6 million resulted primarily from replacing aged equipment. In accordance with GASB 34, the State is eligible for and has adopted an alternative approach to depreciating its roadways and bridges. Under the modified approach, governments are permitted to expense the cost of preserving roadways and
ag04m88
11

bridges rather than to record a periodic charge for depreciation expense. Under the depreciation method, preservation expenses are capitalized. The State is responsible for approximately 14,000 miles of roadway and 8,071 bridges. The decision to use the modified approach was essentially made because the State has consistently maintained its infrastructure in what it considers to be a good condition. The most recent condition assessment, which is discussed in more detail in the Required Supplementary Information section (Page 84), indicated that bridges were rated at almost 5 points above the State’s established condition level and roadways were almost 16 points above the State’s benchmark level. Bridges are assessed biennially and roadways annually. The State’s capital outlay budget for the 2003-2004 fiscal year mirrors that of the past few years. Since very few new projects have been approved, the capital outlay budget consists of expenditures for maintenance of existing facilities (state and higher education institutions), projects funded by the Federal Government, and statutory requirements for prisons’ physical plant maintenance and additions. Debt Administration In accordance with the Constitution, the State has the authority to issue general obligation debt that is backed by the full faith and credit of the State. The Legislature authorizes a certain amount of debt each year and the State Funding Board has oversight responsibility to issue the debt for capital projects. Capital spending is also authorized by the Legislature and the State Building Commission has oversight responsibility for all capital projects exceeding $100 thousand (for new construction) and maintenance to existing facilities. The State issues Commercial Paper as a short-term financing mechanism for capital purposes and the Commercial Paper is typically redeemed with long-term bonds. The unissued balance by function (expressed in thousands) follows: Unissued Purpose June 30, 2004 Highway $ 800,500 Higher Education 9,278 Environment and Conservation 13,012 General Government 731,363 Local Development Authority 16,800 Total $ 1,570,953 More detail of the activity during the fiscal year is presented in Note 5H to the financial statements. The State’s outstanding general obligation debt consists of the following (expressed in thousands): Governmental Activities Business-Type Activities June 30, 2004 June 30, 2003 June 30, 2004 June 30, 2003 Bonds, net $ 1,141,026 $ 1,047,531 $ 8,071 $ 11,070 Commercial Paper 82,775 201,800 ___________ ___________ Total $ 1,223,801 $ 1,249,331 $ 8,071 $ 11,070 The State issued $151.855 million in tax-exempt and $22.18 million in taxable general obligation bonds during the fiscal year to redeem commercial paper, which is used to finance capital projects on a short-term basis. One half of the outstanding debt has been issued either for capital projects of two of the State’s major Component Units—University of Tennessee and Tennessee Board of Regents—or provided to local governments as capital grants; assets acquired with this debt belong to those entities. The State has not issued bonds to fund infrastructure since 1976; infrastructure has been funded on a pay-as-you-go basis. Additional information on long-term obligations is presented in Note 5H to the financial statements.
ag04m88
12

The State’s bond ratings have not changed since the previous year, although Moody’s and Standard & Poor’s changed their negative credit outlook to stable. This change reflects improvements in the State’s economy and actions taken by the State to create structural budget balance. The State’s bonds are rated AA, Aa2, and AA by Fitch Investors Service, Moody’s Investors Service, and Standard & Poor’s Rating Group, respectively. Under current State statutes, the general obligation debt issuances are subject to an annual legal debt service limitation based on a pledged portion of certain current year revenues. As of June 30, 2004, the State’s annual debt service limit of $578.6 million was well above the debt service required $143.7 million, with a legal debt service margin of $434.9 million.
FACTORS THAT WILL AFFECT THE FUTURE TennCare expenditures continue to increase at a rate far exceeding inflation. The Administration is currently reviewing its options on the level of benefits to be provided under the TennCare program. Beginning in August of 2004, lottery-funded scholarships are being awarded to eligible Tennessee students to attend post-secondary educational institutions located in Tennessee. The State is expected to award approximately $176.0 million of these scholarships during the fiscal year 2004-2005. The State lost an appeal about sufficiency of teacher pay equity provided in the State’s funding model for public education. The State Legislature will address the teacher pay funding issue in a future session.
REQUESTS FOR INFORMATION This financial report is designed to provide a general overview of the State of Tennessee’s finances for all those with an interest in the State’s finances. Questions concerning any of the information provided in this report or requests for additional financial information should be directed to the Department of Finance and Administration, Division of Accounts, 312 8th Avenue North, Suite 1400, Nashville, TN 37243.
ag04m88
13

This Page Intentionally Left Blank
ag04m88
14

___________________________________________________________________________________________ BASIC FINANCIAL STATEMENTS ___________________________________________________________________________________________
ag04m88
15

This Page Intentionally Left Blank
ag04m88
16

State of TennesseeStatement of Net Assets
June 30, 2004
(Expressed in Thousands)
Primary Government TotalGovernmental Business-Type Component
Assets Activities Activities Total UnitsCash and cash equivalents $ 1,804,676 $ 296,961 $ 2,101,637 $ 1,413,942Cash on deposit with fiscal agent 622,565 622,565 1Investments 214,887 214,887 1,066,510Investments with fiscal agent 5Receivables, net 2,236,103 129,115 2,365,218 420,888Internal balances 7,849 (7,849)Due from primary government 16,987Due from component units 66,729 12 66,741Inventories, at cost 25,525 12 25,537 13,834Prepayments 129 129 13,471Loans receivable, net 22,782 386,977 409,759 1,997,955Lease receivable 12,846 12,846Deferred charges and other 2,394 59 2,453 20,787Restricted assets: Cash and cash equivalents 18,511 18,511 6,840 Investments 200,474 Receivables, net 2,412
Capital assets: Land, at cost 955,713 955,713 141,062 Infrastructure 16,007,143 16,007,143 205,185 Structures and improvements, at cost 1,710,996 1,710,996 2,603,980 Machinery and equipment, at cost 502,220 502,220 704,858 Less-Accumulated depreciation (987,943) (987,943) (1,568,660) Construction in progress 990,694 990,694 244,547
Total assets 23,591,254 1,427,852 25,019,106 7,505,078
Liabilities Accounts payable and other current liabilities 1,268,858 52,456 1,321,314 261,348Due to primary government 66,741Due to component units 16,982 5 16,987Unearned revenue 249,178 7,336 256,514 114,800Payable from restricted assets 2,660 2,660Other 7,403 7,403 28,179Noncurrent liabilities: Due within one year 213,877 2,863 216,740 255,489 Due in more than one year 1,550,475 5,277 1,555,752 3,023,028
Total liabilities 3,309,433 67,937 3,377,370 3,749,585
Net assets Invested in capital assets, net of related debt 18,694,346 18,694,346 1,722,481Restricted for: Highway 151,029 151,029 Debt service 15,039 Capital projects 15,851 15,851 37,108 Lottery scholarships 122,282 122,282 Single family bond programs 384,955 Other 314,360 1,288,353 1,602,713 314,446 Permanent: Expendable 13,959 13,959 143,167 Nonexpendable 226,408 226,408 526,609Unrestricted 743,586 71,562 815,148 611,688 Total net assets $ 20,281,821 $ 1,359,915 $ 21,641,736 $ 3,755,493
The notes to the financial statements are an integral part of this statement.
ag04m88
17

State of TennesseeStatement of Activities
For the Year Ended June 30, 2004
(Expressed in Thousands)
Program Revenues Charges Operating Capital for Grants and Grants and
Functions/Programs Expenses Services Contributions ContributionsPrimary Government: Governmental activities: General government $ 546,996 $ 342,154 $ 64,019 $ 900 Education 4,692,605 16,966 868,705 Health and social services 10,583,726 857,951 6,751,950 113 Law, justice and public safety 1,032,302 313,386 113,683 2,986 Recreation and resources development 479,251 124,105 125,739 2,902 Regulation of business and professions 81,940 107,355 1,359 Transportation 787,646 13,636 169,632 496,638 State shared taxes paid to local governments 647,654 Interest on long-term debt 51,819
Total governmental activities 18,903,939 1,775,553 8,095,087 503,539 Business-type activities: Employment security 639,993 523,372 164,166 Insurance programs 416,871 422,584 696 Loan programs 1,737 12,733 43,415 Other 2,037 2,111 19
Total business-type activities 1,060,638 960,800 208,296
Total primary government $ 19,964,577 $ 2,736,353 $ 8,303,383 $ 503,539
Component units: Higher education institutions $ 2,955,170 $ 957,156 $ 941,746 $ 68,741 Loan programs 330,123 133,585 146,916 Lottery program 395,254 393,010 4,363 Other 84,884 26,990 58,383
Total component units $ 3,765,431 $ 1,510,741 $ 1,151,408 $ 68,741
General revenues: Taxes: Sales and use Fuel Business Other Payments from primary government Grants and contributions not restricted to specific programs Unrestricted investment earnings MiscellaneousContributions to permanent fundsTransfers
Total general revenues, contributions, and transfers
Change in net assetsNet assets, July 1
Net assets, June 30
The notes to the financial statements are an integral part of this statement.
ag04m88
18

Net (Expense) Revenue andChanges in Net Assets
Primary GovernmentGovernmental Business-type Component
Activities Activities Total Units
$ (139,923) $ (139,923) (3,806,934) (3,806,934)(2,973,712) (2,973,712)
(602,247) (602,247)(226,505) (226,505)
26,774 26,774(107,740) (107,740)(647,654) (647,654)
(51,819) (51,819)
(8,529,760) (8,529,760)
$ 47,545 47,5456,409 6,409
54,411 54,41193 93
108,458 108,458
(8,529,760) 108,458 (8,421,302)
$ (987,527)(49,622)
2,119489
(1,034,541)
5,806,268 5,806,268829,372 829,372
2,184,170 2,184,170526,573 526,573
1,087,991152,676 152,676 35,925
12,079 12,079 16,965207,653 207,653 8,854
351 351 27,736(18,829) 18,829
9,700,313 18,829 9,719,142 1,177,471
1,170,553 127,287 1,297,840 142,93019,111,268 1,232,628 20,343,896 3,612,563
$ 20,281,821 $ 1,359,915 $ 21,641,736 $ 3,755,493
ag04m88
19

This Page Intentionally Left Blank
ag04m88
20
_____________________________________________________________________________________________ GOVERNMENTAL FUND FINANCIAL STATEMENTS _____________________________________________________________________________________________ General Fund – The General Fund is maintained to account for all governmental financial resources and transactions not accounted for in another fund. Education Fund - This fund is maintained to account for revenues and expenditures associated with programs involving the Departments of Education and Higher Education. Funding for these programs is accomplished primarily from the dedicated sales and services taxes and federal monies received from the U. S. Department of Education. Highway Fund - This fund is maintained to account for revenues and expenditures associated with programs of the Department of Transportation. Funding of these programs is accomplished primarily from dedicated highway user taxes and funds received from the various federal transportation agencies. All federal funds accruing to the Highway Fund are received on a reimbursement basis covering costs incurred. It is the State's practice to appropriate matching dollars for jointly funded projects in the year of federal apportionment. This front-end state funding, together with multi-year disbursements on most projects, results in large cash balances in this fund. Effective July 1, 1986, the Department of Transportation began earning interest on certain unspent monies for a new highway construction program, while the General Fund earns the interest on the other highway program monies. Nonmajor Governmental Funds – Nonmajor governmental funds are presented by fund type in the supplementary section.
ag04m88
21

State of TennesseeBalance Sheet
Governmental FundsJune 30, 2004
(Expressed in Thousands) Nonmajor Total Governmental Governmental
General Education Highway Funds FundsAssetsCash and cash equivalents $ 853,208 $ 9 $ 150,905 $ 443,709 $ 1,447,831Investments 214,887 214,887Receivables, net 1,581,670 472,069 163,758 14,865 2,232,362Due from other funds 188,562 3 14 8 188,587Due from component units 2,881 62,163 1,067 66,111Inventories, at cost 12,874 5,663 18,537Prepayments 15 15Deferred charges and other 3,443 5,435 8,878Loans receivable, net 140 1,826 20,816 22,782Leases receivable 9,222 9,222 Restricted assets: Cash and cash equivalents 18,511 18,511
Total assets $ 2,652,015 $ 534,244 $ 327,601 $ 713,863 $ 4,227,723
Liabilities and fund balances Liabilities: Accounts payable and accruals $ 933,914 $ 126,549 $ 60,584 $ 47,080 $ 1,168,127 Due to other funds 13,576 180,231 1,222 320 195,349 Due to component units 9,540 721 6,721 16,982 Unearned revenue 343,336 58,247 9,743 12,947 424,273 Payable from restricted assets 2,660 2,660 Other 223 7,179 1 7,403
Total liabilities 1,300,589 365,748 78,728 69,729 1,814,794
Fund balances: Reserved for: Related assets 16,079 5,663 21,742 Encumbrances and contracts 7,197 687 58,313 36,478 102,675 Continuing appropriations 427,937 43,079 471,016 Specific purposes: Federal tax relief 104,304 104,304 Title and registration system 22,405 22,405 Judicial information systems 13,283 13,283 Alcohol drug addiction treatment 9,710 9,710 Commerce and Insurance regulatory boards 10,923 10,923 Lottery scholarships 122,282 122,282 Construction projects 156,151 160,349 316,500 Wildlife Resources 28,743 28,743 Environmental programs 33,381 33,381 Job skills 22,237 22,237 Enhanced 911 service 49,684 49,684 Parks acquisition 15,425 15,425 Community development 20,059 20,059 Other specific purposes 81,533 2,448 28,696 37,411 150,088 Permanent funds: Expendable 13,959 13,959 Nonexpendable 226,408 226,408 Unreserved: Designated for revenue fluctuations 217,000 217,000 Designated for other specific purposes 440,852 50 440,902 Undesignated 203 203
Total fund balances 1,351,426 168,496 248,873 644,134 2,412,929
Total liabilities and fund balances $ 2,652,015 $ 534,244 $ 327,601 $ 713,863
Amounts reported for governmental activities in the Statement of Net Assets are different because: Capital assets used in governmental activities are not financial resources and therefore are not reported in the funds. 18,784,646
Deferred charges are not available to pay for current-period expenditures and are therefore not reported in the funds. 439
Other long-term assets are not available to pay for current-period expenditures and therefore are deferred in the funds. 207,238
Internal Service Funds are used by management to charge the costs of various internal operations to individual funds. The assets and liabilities of Internal Service Funds are included in the governmental activities in the Statement of Net Assets. 411,064
Long-term liabilities, including bonds payable, are not due and payable in the current period and therefore are not reported in the funds. (1,534,495)
Net assets of governmental activities $ 20,281,821
The notes to the financial statements are an integral part of this statement.
ag04m88
22

State of TennesseeStatement of Revenues, Expenditures, and Changes in Fund Balances
Governmental FundsFor the Fiscal Year Ended June 30, 2004
(Expressed in Thousands) Nonmajor Total
Governmental GovernmentalGeneral Education Highway Funds Funds
Revenues Taxes: Sales $ 2,394,797 $ 3,348,886 $ 25,698 $ 41,403 $ 5,810,784 Fuel 14,375 723,077 91,984 829,436 Business 1,962,669 138,797 4,634 104,605 2,210,705 Other 491,268 110 15,053 506,431 Licenses, fines, fees, and permits 169,382 1,794 208,525 125,837 505,538 Interest on investments 14,182 9 19,911 34,102 Federal 7,024,459 724,776 638,943 29,356 8,417,534 Departmental services 1,988,170 6,997 34,171 41,914 2,071,252 Other 356,271 127,877 4,091 530 488,769
Total revenues 14,415,573 4,349,237 1,639,148 470,593 20,874,551
Expenditures Current: General government 380,558 19,511 400,069 Education 4,622,768 7,526 4,630,294 Health and social services 11,308,871 11,308,871 Law, justice and public safety 1,037,774 4,736 1,042,510 Recreation and resources development 319,885 159,358 479,243 Regulation of business and professions 56,683 31,897 88,580 Transportation 1,318,913 1,318,913 State shared taxes paid to local governments 362,895 284,759 647,654 Debt service: Principal 80,243 80,243 Interest 49,956 49,956 Debt issuance costs 1,945 1,945 Capital outlay 128,167 128,167
Total expenditures 13,466,666 4,622,768 1,603,672 483,339 20,176,445
Excess (deficiency) of revenues over (under) expenditures 948,907 (273,531) 35,476 (12,746) 698,106
Other financing sources (uses) Bonds and commercial paper issued 206,933 206,933 Commercial paper redeemed (155,796) (155,796) Premium on bond sale 6,485 6,485 Transfers in 121,510 400,185 74,000 65,369 661,064 Transfers out (484,549) (2,137) (67,104) (137,939) (691,729)
Total other financing sources (uses) (363,039) 398,048 6,896 (14,948) 26,957
Net change in fund balances 585,868 124,517 42,372 (27,694) 725,063
Fund balances, July 1 765,558 43,979 206,501 671,828 1,687,866
Fund balances, June 30 $ 1,351,426 $ 168,496 $ 248,873 $ 644,134 $ 2,412,929
The notes to the financial statements are an integral part of this statement.
ag04m88
23

State of TennesseeReconciliation of the Statement of Revenues, Expenditures,
and Changes in Fund Balances of Governmental FundsTo the Statement of Activities
For the Year Ended June 30, 2004
(Expressed in Thousands)
Net changes in fund balances - total governmental funds $ 725,063
Amounts reported for governmental activities in the Statement of Activities are different because:
Governmental funds report capital outlays as expenditures. However in the Statement of Activities the cost of those assets is allocated over their estimated useful lives as depreciation expense. This is the amount by which capital outlays exceeded depreciation in the current year. 666,460
Revenues in the Statement of Activities that do not provide current financial resources are not reported as revenues in the funds. (7,716)
The issuance of long-term debt (e.g., bonds, commercial paper) provides current financial resources to governmental funds, while the repayment of the principal of long-term debt consumes the current financial resources of governmental funds. Neither transaction, however, has any effect on net assets. Also, governmental funds report the effect of issuance costs, premiums, discounts, and similar items when debt is first issued, whereas these amounts are deferred and amortized in the Statement of Activities. This amount is the net effect of these differences in the treatment of long-term debt and related items. 24,422
Some expenses reported in the Statement of Activities do not require the use of current financial resources and therefore are not reported as expenditures in governmental funds. (298,663)
Internal service funds are used by management to charge the cost of certain activities, such as insurance and telecommunications, to individual funds. The net revenue (expense) of internal service funds is reported with governmental activities. 60,987
Changes in net assets of governmental activities $ 1,170,553
The notes to the financial statements are an integral part of this statement.
ag04m88
24
_____________________________________________________________________________________________ PROPRIETARY FUND FINANCIAL STATEMENTS _____________________________________________________________________________________________ Sewer Treatment Loan – Created in 1987, this fund provides loans to local governments and utility districts for the construction of sewage treatment facilities. The initial sources of the monies are federal grants and state appropriations. Employment Security Fund - This fund is maintained to account for the collection of unemployment insurance premiums from employers and the payment of unemployment benefits to eligible claimants. Funds are also received from the federal government for local office building construction, supplemental unemployment programs and work incentive payments. As required by law, all funds not necessary for current benefit payments are placed on deposit with the U.S. Treasury. Interest earned from these monies is retained in the fund. Administrative and operational expenses incurred by the Department of Labor and Workforce Development are expenditures of the General Fund. Nonmajor Enterprise Funds – Nonmajor Enterprise Funds are presented in the supplementary section. Internal Service Funds – Internal Service Funds are presented in the supplementary section.
ag04m88
25

State of TennesseeStatement of Net Assets
Proprietary FundsJune 30, 2004
(Expressed in Thousands)
Business Type Activities - Enterprise Funds Governmental
Sewer Nonmajor Activities-Treatment Employment Enterprise Internal
Assets Loan Security Funds Total Service FundsCurrent assets: Cash and cash equivalents $ 177,872 $ 119,089 $ 296,961 $ 356,845 Cash on deposit with fiscal agent $ 622,565 622,565 Receivables: Accounts receivable 2,530 2,530 4,043 Interest 21 5,047 5,068 Loans receivable-current 18,209 5,756 23,965 Other 121,517 121,517 Due from other funds 300 300 3,474 Due from component units 11 1 12 618 Inventory 12 12 6,988 Prepaid expenses 114
Total current assets 196,102 749,440 127,388 1,072,930 372,082 Noncurrent assets: Deferred charges 59 59 457 Loans receivable 315,101 47,911 363,012 Lease receivable 3,322
Capital assets: Land, at cost 54,379 Structures and improvements, at cost 417,374 Machinery and equipment, at cost 231,094 Less-accumulated depreciation (320,421) Construction in progress 11,751
Total capital assets, net of accumulated depreciation 394,177
Total noncurrent assets 315,101 47,970 363,071 397,956
Total assets 511,203 749,440 175,358 1,436,001 770,038
LiabilitiesCurrent liabilities: Accounts payable and accruals 9 11,271 41,204 52,484 77,514 Due to other funds 8,149 5 8,154 886 Due to component units 5 5 Lease obligations payable 75 Bonds payable-current 2,830 2,830 13,286 Unearned revenue 5,197 2,139 7,336 32,143 Other 35,982 Total current liabilities 9 24,622 46,178 70,809 159,886 Noncurrent liabilities: Lease obligations payable 326 Commercial paper payable 12,684 Bonds payable, net 5,241 5,241 127,589 Other noncurrent liabilities 36 36 58,489 Total noncurrent liabilities 5,277 5,277 199,088
Total liabilities 9 24,622 51,455 76,086 358,974
Net assets Invested in capital assets, net of related debt 240,217 Restricted 511,194 724,818 52,341 1,288,353 Unrestricted (deficit) 71,562 71,562 170,847
Total net assets $ 511,194 $ 724,818 $ 123,903 $ 1,359,915 $ 411,064
The notes to the financial statements are an integral part of this statement.
ag04m88
26

State of TennssseeStatement of Revenues, Expenses, and Changes in Fund Net Assets
Proprietary FundsFor the Fiscal Year Ended June 30, 2004
(Expressed in Thousands)
Business Type Activities - Enterprise FundsGovernmental
Sewer Nonmajor Activities-Treatment Employment Enterprise Internal
Loan Security Funds Total Service FundsOperating revenues Charges for services $ 11,525 $ 3,319 $ 14,844 $ 407,423 Investment income 1,717 393 2,110 Premiums $ 523,372 422,537 945,909 550,185 Other 47 47 67
Total operating revenues 13,242 523,372 426,296 962,910 957,675
Operating expenses Personal services 736 736 48,112 Contractual services 794 35,033 35,827 214,422 Materials and supplies 480 480 63,969 Rentals and insurance 273 273 40,721 Interest 483 483 Depreciation and amortization 10 10 29,880 Benefits 636,766 380,653 1,017,419 502,398 Other 3,227 2,157 5,384 3,707
Total operating expenses 794 639,993 419,825 1,060,612 903,209
Operating income (loss) 12,448 (116,621) 6,471 (97,702) 54,466
Nonoperating revenues (expenses) Taxes 3 Operating grants 24,701 137,193 16,579 178,473 Interest income 26,973 715 27,688 2,183 Interest expense (1) (1) (7,605)
Total nonoperating revenues (expenses) 24,701 164,166 17,293 206,160 (5,419)
Income (loss) before contributions and transfers 37,149 47,545 23,764 108,458 49,047
Capital contributions 104Transfers in 3,470 15,359 18,829 11,836
Change in net assets 40,619 47,545 39,123 127,287 60,987
Net assets, July 1 470,575 677,273 84,780 1,232,628 350,077
Net assets, June 30 $ 511,194 $ 724,818 $ 123,903 $ 1,359,915 $ 411,064
The notes to the financial statements are an integral part of this statement.
ag04m88
27
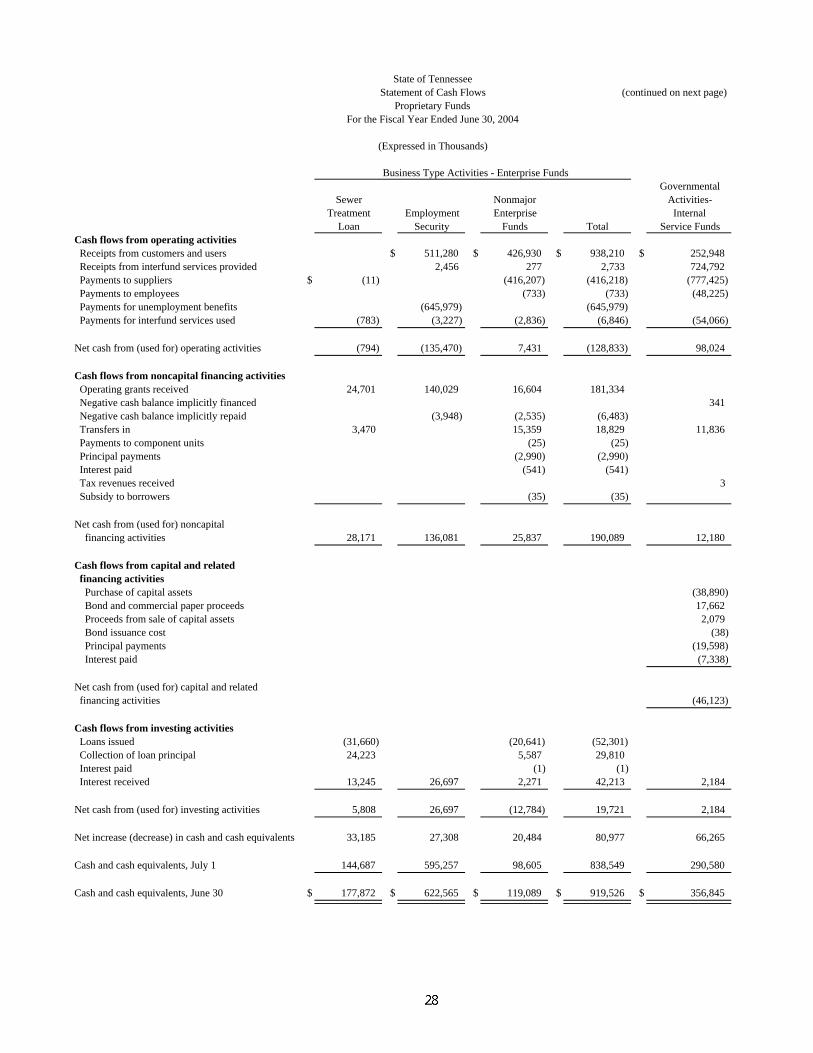
State of TennesseeStatement of Cash Flows (continued on next page)
Proprietary FundsFor the Fiscal Year Ended June 30, 2004
(Expressed in Thousands)
Business Type Activities - Enterprise FundsGovernmental
Sewer Nonmajor Activities-Treatment Employment Enterprise Internal
Loan Security Funds Total Service FundsCash flows from operating activities Receipts from customers and users $ 511,280 $ 426,930 $ 938,210 $ 252,948 Receipts from interfund services provided 2,456 277 2,733 724,792 Payments to suppliers $ (11) (416,207) (416,218) (777,425) Payments to employees (733) (733) (48,225) Payments for unemployment benefits (645,979) (645,979) Payments for interfund services used (783) (3,227) (2,836) (6,846) (54,066)
Net cash from (used for) operating activities (794) (135,470) 7,431 (128,833) 98,024
Cash flows from noncapital financing activities Operating grants received 24,701 140,029 16,604 181,334 Negative cash balance implicitly financed 341 Negative cash balance implicitly repaid (3,948) (2,535) (6,483) Transfers in 3,470 15,359 18,829 11,836 Payments to component units (25) (25) Principal payments (2,990) (2,990) Interest paid (541) (541) Tax revenues received 3 Subsidy to borrowers (35) (35)
Net cash from (used for) noncapital financing activities 28,171 136,081 25,837 190,089 12,180
Cash flows from capital and related financing activities Purchase of capital assets (38,890) Bond and commercial paper proceeds 17,662 Proceeds from sale of capital assets 2,079 Bond issuance cost (38) Principal payments (19,598) Interest paid (7,338)
Net cash from (used for) capital and related financing activities (46,123)
Cash flows from investing activities Loans issued (31,660) (20,641) (52,301) Collection of loan principal 24,223 5,587 29,810 Interest paid (1) (1) Interest received 13,245 26,697 2,271 42,213 2,184
Net cash from (used for) investing activities 5,808 26,697 (12,784) 19,721 2,184
Net increase (decrease) in cash and cash equivalents 33,185 27,308 20,484 80,977 66,265
Cash and cash equivalents, July 1 144,687 595,257 98,605 838,549 290,580
Cash and cash equivalents, June 30 $ 177,872 $ 622,565 $ 119,089 $ 919,526 $ 356,845
ag04m88
28

(continued from previous page) State of TennesseeStatement of Cash Flows
Proprietary FundsFor the Fiscal Year Ended June 30, 2004
(Expressed in Thousands)
Business Type Activities - Enterprise FundsGovernmental
Sewer Nonmajor Activities-Treatment Employment Enterprise Internal
Loan Security Funds Total Service FundsReconciliation of operating income to net cash provided (used) by operating activities
Operating income (loss) $ 12,448 $ (116,621) $ 6,471 $ (97,702) $ 54,466
Adjustments to reconcile operating income (loss) to net cash from operating activities: Depreciation and amortization 10 10 29,896 Loss on disposal of capital assets 377 Gain on disposal of capital assets (6) Bond issuance cost 38 Investment income (393) (393) Charges for services (11,525) (1,208) (12,733) Interest income (1,717) (1,717) Interest expense 483 483 Subsidy to borrowers 21 21 Changes in assets and liabilities: (Increase) decrease in accounts receivable (13,420) 389 (13,031) 997 (Increase) decrease in due from other funds 132 132 857 (Increase) decrease in due from component units 3 23 26 9 (Increase) decrease in inventories 6 6 (904) (Increase) decrease in prepaid expenses 47 Increase (decrease) in accounts payable (6,760) 1,248 (5,512) 9,408 Increase (decrease) in due to other funds (3) 2 (1) (39) Increase (decrease) in due to component units 6 (2) 4 Increase (decrease) in unearned revenue 1,193 381 1,574 2,878
Total adjustments (13,242) (18,849) 960 (31,131) 43,558
Net cash provided by (used for) operating activities $ (794) $ (135,470) $ 7,431 $ (128,833) $ 98,024
Noncash investing, capital and financing activities Contributed capital assets $ 104 Capital asset acquired by capital lease 411
Total noncash investing, capital and financing activities $ 515
The notes to the financial statements are an integral part of this statement.
ag04m88
29

This Page Intentionally Left Blank
ag04m88
30

___________________________________________________________________________________________ FIDUCIARY FUNDS FINANCIAL STATEMENTS ___________________________________________________________________________________________
Pension (and other Employee Benefit) Trust Funds – These are presented by fund in the supplementary section. Investment Trust Fund – This fund was created in July 1980 to account for local government deposits with the state treasurer and the related interest earnings. Through this program, the participating local governments achieve higher investment income by pooling their funds than they could realize individually. Private–Purpose Trust Funds – These are presented by fund in the supplementary section. Agency Funds – These are presented by fund in the supplementary section.
ag04m88
31

State of TennesseeStatement of Fiduciary Net Assets
Fiduciary FundsJune 30, 2004
(Expressed in Thousands)
Pension(and Other
Employee Benefit) Investment Private-Purpose AgencyTrust Funds Trust Fund Trust Funds Funds
AssetsCash and cash equivalents $ 1,288,139 $ 621,736 $ 40,077 $ 280,653Receivables: Taxes 57 260,399 Interest and dividends 136,355 2,019 268 Due from sale of investments 84,577 22,592 Foreign currency receivable 46,030 Due from other governments 23,581 Other 21,640
Total receivables 312,183 2,019 22,917 260,399 Due from other funds 4,009 10 8,009Due from component units 3,623 52Investments, at fair value: Short-term securities 564,645 824,248 Government bonds 10,867,976 33,094 Corporate bonds 1,878,197 Corporate stocks 10,276,723 Mutual funds 12,542 Real estate 463,383
Total investments 24,050,924 824,248 45,636
Total assets 25,658,878 1,448,003 108,640 549,113
LiabilitiesAccounts payable and accruals 25,305 22,551 491,086Foreign currency payable 46,519Amounts held in custody for others 58,027
Total liabilities 71,824 22,551 549,113
Net assetsHeld in trust for: Pension benefits 25,586,516 Employees' flexible benefits 538 Pool participants 1,448,003 Individuals, organizations and other governments 86,089
Total net assets $ 25,587,054 $ 1,448,003 $ 86,089 $ -
The notes to the financial statements are an integral part of this statement.
ag04m88
32
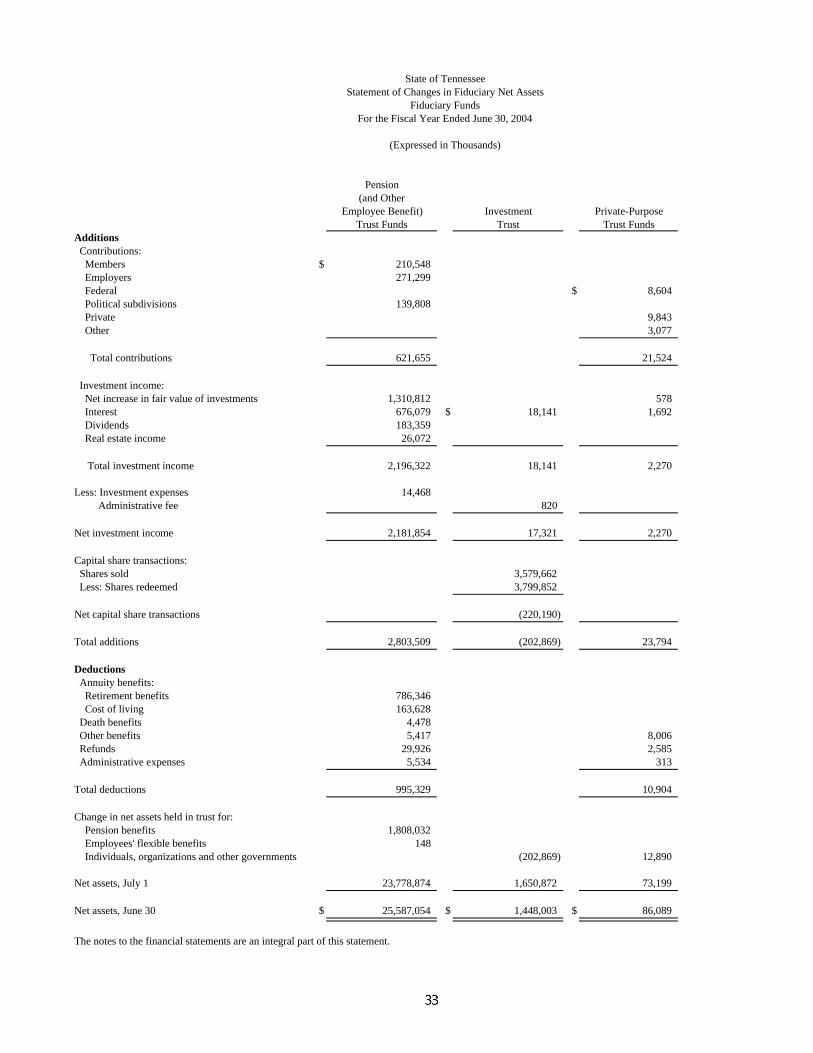
State of TennesseeStatement of Changes in Fiduciary Net Assets
Fiduciary FundsFor the Fiscal Year Ended June 30, 2004
(Expressed in Thousands)
Pension
(and Other Employee Benefit) Investment Private-Purpose
Trust Funds Trust Trust FundsAdditions Contributions: Members $ 210,548 Employers 271,299 Federal $ 8,604 Political subdivisions 139,808 Private 9,843 Other 3,077
Total contributions 621,655 21,524
Investment income: Net increase in fair value of investments 1,310,812 578 Interest 676,079 $ 18,141 1,692 Dividends 183,359 Real estate income 26,072
Total investment income 2,196,322 18,141 2,270
Less: Investment expenses 14,468 Administrative fee 820
Net investment income 2,181,854 17,321 2,270
Capital share transactions: Shares sold 3,579,662 Less: Shares redeemed 3,799,852
Net capital share transactions (220,190)
Total additions 2,803,509 (202,869) 23,794
Deductions Annuity benefits: Retirement benefits 786,346 Cost of living 163,628 Death benefits 4,478 Other benefits 5,417 8,006 Refunds 29,926 2,585 Administrative expenses 5,534 313
Total deductions 995,329 10,904
Change in net assets held in trust for: Pension benefits 1,808,032 Employees' flexible benefits 148 Individuals, organizations and other governments (202,869) 12,890
Net assets, July 1 23,778,874 1,650,872 73,199
Net assets, June 30 $ 25,587,054 $ 1,448,003 $ 86,089
The notes to the financial statements are an integral part of this statement.
ag04m88
33

State of Tennessee Comprehensive Annual Financial Report
For the Year Ended June 30, 2004
INDEX FOR THE NOTES Page NOTE 1 – Summary of significant accounting policies 35 A. Financial reporting entity 35 B. Government-wide and fund financial statements 37
C. Measurement focus, basis of accounting, and financial statement presentation 37
D. Assets, liabilities, and net assets or equity 38 NOTE 2 – Reconciliation of government-wide and fund financial statements 41
A. Explanation of certain differences between the governmental fund balance sheet and the government-wide statement of net assets 41
B. Explanation of certain differences between the governmental fund statement of revenues, expenditures, and changes in fund balances and the government-wide statement of activities 41
NOTE 3 – Stewardship, compliance and accountability 42 A. Budgetary process 42 B. Deficit fund equity 43 NOTE 4 – Accounting changes 43 NOTE 5 – Detailed notes on all funds 44 A. Deposits and investments 44 B. Accounts and notes receivable 51 C. Capital assets 52 D. Interfund balances 54 E. Transfers 55 F. Lease obligations 56 G. Lease receivables 57 H. Long term debt 58 I. Payables 61 J. Component units – condensed financial statements 61 K. Major component units – long term debt 64 L. Nonmajor component units – long term debt 67 M. Component Units – changes in long term obligations 70 N. Endowments – component units 71 NOTE 6 – Other information 71 A. Risk management 71 B. Related organizations 76 C. Jointly governed organizations 76 D. Joint ventures 77 E. Post employment health insurance benefits 77 F. Gain contingencies 78 G. Pension plans 78 H. Investment pool 80 I. Loan guarantees 80 J. Nashville correctional facilities revenue bonds 80 K. Litigation 80 L. Federal grants 81 M. Subsequent events 81
ag04m88
34
STATE OF TENNESSEE NOTES TO THE FINANCIAL STATEMENTS
JUNE 30, 2004
NOTE 1 – Summary of significant accounting policies
A. Financial reporting entity
Introduction - As required by generally accepted accounting principles, these financial statements present the primary government (the State) and its component units, entities for which the State is considered to be financially accountable. Discretely presented component units are reported in a separate column in the government-wide financial statements to emphasize they are legally separate from the primary government.
Discretely presented component units
1. The Tennessee Student Assistance Corporation (TSAC) (Governmental Fund Type) is responsible for
guaranteeing student loans under federal programs and administering federal and state grants and loans to students. The majority of the Board is either appointed by the Governor or are state officials. TSAC’s budget is approved by the State.
2. The Community Services Agencies (CSAs) (Governmental Fund Types) listed below are to provide a mechanism
to facilitate the provision of services for children and other citizens in need of services from state agencies: Davidson County Community Services Agency Knox County Community Services Agency Shelby County Community Services Agency Hamilton County Community Services Agency Northeast Community Services Agency East Tennessee Community Services Agency Upper Cumberland Community Services Agency Southeast Community Services Agency Mid-Cumberland Community Services Agency South Central Community Services Agency Northwest Community Services Agency Southwest Community Services Agency
The Boards for these CSAs are appointed by the Governor and the budget must be approved by the State. 3. The Tennessee Housing Development Agency (Proprietary Fund Type) is responsible for making loans and
mortgages to qualified sponsors, builders, developers and purchasers of low and moderate income family dwellings. The Board of the agency consists of state officials, appointees of the Governor, and appointees of the Speakers of the House and Senate. The agency budget is approved by the State.
4. The Tennessee Education Lottery Corporation (Proprietary Fund Type) was created by the General Assembly in
2003. The purpose of the corporation is to operate a state lottery with net proceeds to be given to the State to be used for education programs and purposes in accordance with the Constitution of Tennessee. The corporation is governed by a board of directors composed of seven directors appointed by the Governor.
5. The Tennessee Board of Regents (Proprietary Fund Type) is responsible for the operation of six universities,
thirteen community colleges and twenty-seven technology centers. The Board is comprised of state officials and appointees by the Governor and the State provides a substantial amount of funding.
6. The University of Tennessee Board of Trustees (Proprietary Fund Type) is responsible for the operation of the
University of Tennessee, located primarily on four campuses across the State. The Board is appointed by the Governor and the State provides a substantial amount of the funding.
ag04m88
35

STATE OF TENNESSEE NOTES TO THE FINANCIAL STATEMENTS (Continued)
JUNE 30, 2004
7. The Tennessee Local Development Authority (Proprietary Fund Type) provides financing assistance to local
governments through the issuance of bonds and notes. In addition, the Authority assists non-profit corporations in the construction of mental health, mental retardation, or alcohol and drug facilities. The majority of the Board consists of state officials; therefore, the State can impose its will on the Authority.
8. The Tennessee State Veterans’ Homes Board (Proprietary Fund Type) is responsible for the operation of
nursing homes for honorably discharged veterans of the United States armed forces. The Board is appointed by the Governor and its budget is approved by the State. In addition, the issuance of bonds must be approved by the State Funding Board.
9. The Child Care Facilities Corporation (Proprietary Fund Type) purpose is to create new child care slots in
Tennessee by guaranteeing loans, making direct loans, and making grants. The Board is comprised primarily of state officials. The State must approve the budget of the Corporation.
10. The Tennessee State School Bond Authority (Proprietary Fund Type) finances projects for the University of
Tennessee, Tennessee Board of Regents and the Tennessee Student Assistance Corporation. The Authority also finances improvement projects for qualifying K-12 schools in the State in conjunction with a federal government program. The Board of the Authority consists primarily of state officials; therefore, the State is able to impose its will on the organization.
11. The Tennessee Certified Cotton Growers’ Organization (Proprietary Fund Type) was formed to aid in the
eradication of the Boll Weevil. The majority of the Board is appointed by the Commissioner of the Department of Agriculture, and the State provides a substantial amount of funding.
Complete financial statements for each of the individual component units may be obtained at the following addresses: Tennessee Housing Development Agency Tennessee Local Development Authority 1114 Parkway Towers Suite 1600, James K. Polk Building 404 James Robertson Parkway Nashville, TN 37243 Nashville, TN 37243 Tennessee State Veterans’ Homes Board Tennessee State School Bond Authority 345 Compton Road Suite 1600, James K. Polk Building Murfreesboro, TN 37130 Nashville, TN 37243 University of Tennessee Tennessee Board of Regents Office of the Treasurer 1415 Murfreesboro Road, Suite 350 301 Andy Holt Tower Nashville, TN 37217 Knoxville, TN 37996-0100
Tennessee Education Lottery Corporation All others may be obtained at the following address: Plaza Tower Metro Center Finance & Administration 200 Athens Way Division of Accounts Nashville, TN 37228 14th Floor William R. Snodgrass Tennessee Tower 312 Eighth Avenue North Nashville, TN 37243-0298
ag04m88
36

STATE OF TENNESSEE NOTES TO THE FINANCIAL STATEMENTS (Continued)
JUNE 30, 2004
B. Government-wide and fund financial statements The government-wide financial statements (i.e., the statement of net assets and the statement of activities) report information on all of the nonfiduciary activities of the primary government and its component units. For the most part, the effect of interfund activity has been removed from these statements. Governmental activities, which normally are supported by taxes and intergovernmental revenues, are reported separately from business-type activities, which rely to a significant extent on fees and charges for support. Likewise, the primary government is reported separately from legally separate component units for which the primary government is financially accountable. The statement of activities demonstrates the degree to which the direct expenses of a given function or segment are offset by program revenues. Direct expenses are those that are clearly identifiable with a specific function or segment. Program revenues include 1) charges to customers or applicants who purchase, use, or directly benefit from goods, services, or privileges provided by a given function or segment and 2) grants and contributions that are restricted to meeting the operational or capital requirements of a particular function or segment. Taxes and other items not properly included among program revenues are reported instead as general revenues. Separate financial statements are provided for governmental funds, proprietary funds, and fiduciary funds, even though the latter are excluded from the government-wide financial statements. Major individual governmental funds and major individual enterprise funds are reported as separate columns in the fund financial statements.
C. Measurement focus, basis of accounting, and financial statement presentation The government-wide financial statements are reported using the economic resources measurement focus and the accrual basis of accounting, as are the proprietary fund and fiduciary fund financial statements. Revenues are recorded when earned and expenses are recorded when a liability is incurred, regardless of the timing of related cash flows. Grants and similar items are recognized as revenue as soon as all eligibility requirements imposed by the provider have been met. Governmental fund financial statements are reported using the current financial resources measurement focus and the modified accrual basis of accounting. Revenues are recognized as soon as they are both measurable and available. Revenues are considered to be available when they are collectible within the current period or soon enough thereafter to pay liabilities of the current period. Expenditures generally are recorded when a liability is incurred, as under accrual accounting. However, debt service expenditures, as well as expenditures related to compensated absences and claims and judgments, are typically recorded only when payment is due. Sales taxes, petroleum and vehicular related taxes and fees, and gross receipt taxes are considered to be available if received in the first 60 days of the new fiscal year. Federal grants, departmental services, tobacco settlement monies, and interest associated with the current fiscal period are all considered to be available if received in twelve months. All other revenue items are considered to be measurable and available only when cash is received by the State. The State reports the following major governmental funds:
The general fund is the State’s primary operating fund. It accounts for all financial resources of the general government, except those required to be accounted for in another fund. The education fund accounts for the financial resources associated with programs involving the Departments of Education and Higher Education. The highway fund accounts for the financial resources associated with the programs of the Department of Transportation.
ag04m88
37

STATE OF TENNESSEE NOTES TO THE FINANCIAL STATEMENTS (Continued)
JUNE 30, 2004
The State reports the following major proprietary funds: The sewer treatment loan fund accounts for loans made to local governments and utility districts for the construction of sewage treatment facilities. The employment security fund accounts for the collection of unemployment insurance premiums from employers and the payment of unemployment benefits to eligible claimants.
Additionally, the State reports the following fund types:
Internal service funds account for services provided to other departments or agencies of the State, or to other governments, on a cost reimbursement basis. The fiduciary fund types are used to account for resources legally held in trust.
Private-sector standards of accounting and financial reporting issued prior to December 1, 1989, generally are followed in both the government-wide and proprietary fund financial statements to the extent that those standards do not conflict with or contradict guidance of the Governmental Accounting Standards Board. Governments also have the option of following subsequent private-sector guidance for their business-type activities and enterprise funds, subject to this same limitation. The State has elected not to follow subsequent private-sector guidance. As a general rule, the effect of internal activity, interdepartmental revenues and expenditures (both direct and indirect expenditures), has been eliminated from the government-wide financial statements. An exception is that interfund services provided and used between functions have not been eliminated. Amounts reported as program revenues include 1) charges to customers or applicants for goods, services, or privileges provided, 2) operating grants and contributions, and 3) capital grants and contributions. Internally dedicated resources are reported as general revenues rather than as program revenues. Likewise, general revenues include all taxes. Proprietary funds distinguish operating revenues and expenses from nonoperating items. Operating revenues and expenses generally result from providing services and producing and delivering goods in connection with a proprietary fund’s principal ongoing operations. Operating expenses for enterprise funds and internal service funds include the cost of sales and services, administrative expenses, and depreciation on capital assets. Investment income of certain proprietary funds is classified as operating revenue because those transactions are a part of the funds’ principal ongoing operations. All revenues and expenses not meeting this definition are reported as nonoperating revenues and expenses. When both restricted and unrestricted resources are available for use, it is the State’s policy to use restricted resources first, then, unrestricted resources as they are needed.
D. Assets, liabilities, and net assets or equity
1. Deposits and investments — The State’s cash and cash equivalents includes demand accounts, petty cash and monies in cash management pools. The liquidity of the cash management pools is sufficient to cover any withdrawal request by a participant. This classification also includes short-term investments with a maturity date within three months of the date acquired by the State. These short-term investments, which are not part of the State Cash Pool, are stated at fair value. Investments in the State Cash Pool are stated at cost or amortized cost as this pool is a 2a7-like pool. Collateral, as required by law, is pledged by the various banks and government securities dealers to guarantee state funds placed with them. It is the State's policy to include cash management pools as cash.
ag04m88
38

STATE OF TENNESSEE NOTES TO THE FINANCIAL STATEMENTS (Continued)
JUNE 30, 2004
Investments not in the State Cash Pool are stated at fair value. Securities traded on a national or international exchange are valued at the last reported sales price at current exchange rates. Investments that do not have an established market are reported at estimated fair values. Investment income consists of realized and unrealized appreciation or depreciation in the fair value of investments. Interest income is recognized when earned. Securities and security transactions are recorded in the financial statements on trade-date basis.
2. Receivables and payables — All outstanding balances between funds are reported as “due to/from other funds.”
Any residual balances outstanding between the governmental activities and business-type activities are reported in the government-wide financial statements as “internal balances.” All receivables are shown net of an allowance for uncollectibles. Receivables in the State's governmental and fiduciary funds primarily consist of taxes, interest, departmental services and federal revenues, see Note 1C.
3. Inventories and prepaid items —Inventories of materials and supplies are determined by physical count and are valued at cost, principally using the first-in/first-out (FIFO) method. The average cost method is used for the Highway Fund (a Special Revenue Fund) and Motor Vehicle Management, Central Stores and General Services Printing (Internal Service Funds). The costs of governmental fund-type inventories are recorded as expenditures when consumed rather than when purchased.
Certain payments to vendors reflect costs applicable to future accounting periods and are recorded as prepaid items in both government-wide and fund financial statements.
4. Restricted assets — Proceeds of the State’s general obligation commercial paper program that remain unspent at year end are classified as restricted cash on the Statement of Net Assets. The commercial paper program provides short-term financing for the State’s capital projects.
Component units that issue revenue bonds – Tennessee Housing Development Authority, Tennessee State School Bond Authority, Tennessee Local Development Authority, and Veterans’ Homes Board – report restricted cash and investments to 1) satisfy bond covenant requirements, 2) reflect unspent bond, commercial paper, or note proceeds, and 3) reflect resources set aside to meet future debt service payments.
5. Capital assets — Capital assets, which include property, plant, equipment, and infrastructure assets (e.g., roads, bridges, sidewalks, and similar items) are reported in the applicable governmental or business-type activities columns in the government-wide financial statements. Capital assets, with the exception of infrastructure, are defined by the State as assets with an initial, individual cost of $5,000 or more and an estimated useful life in excess of two years. Infrastructure assets are capitalized regardless of cost or useful life. The costs of normal maintenance and repairs that do not add to the value of the asset or materially extend assets lives are not capitalized. Capitalized assets are recorded at historical cost or estimated historical cost if purchased or constructed. Donated capital assets are recorded at estimated fair market value at the date of donation. Capitalized assets, except for land and infrastructure, are depreciated over their useful lives.
The State holds certain assets such as works of art, historical documents, and artifacts that have not been capitalized or depreciated because the collections are protected and preserved for exhibition, education, or research and are considered to have inexhaustible useful lives. Major outlays for capital assets and improvements are capitalized as projects are constructed.
The State has elected to apply the modified approach to accounting for infrastructure—roadways and bridges. The modified approach is an alternative to depreciation that may be applied to infrastructure capital assets that meet certain requirements. Under the modified approach, depreciation expense is not recorded for these assets. Instead, costs for both maintenance and preservation of these assets should be expensed in the period incurred. Additions and improvements are capitalized.
ag04m88
39

STATE OF TENNESSEE NOTES TO THE FINANCIAL STATEMENTS (Continued)
JUNE 30, 2004
Property, plant, and equipment of the primary government are depreciated using the straight line method over the following estimated useful lives:
Assets Years Buildings 50 Building improvements 20 Machinery and Equipment 3-20
6. Compensated absences — It is the State’s policy to permit employees to accumulate earned but unused vacation and sick pay benefits. There is no liability for unpaid accumulated sick leave since the State’s policy is to pay this only if the employee is sick or upon death. All vacation pay is accrued when earned in the government-wide and proprietary fund financial statements.
7. Long-term obligations —In the government-wide financial statements, and proprietary fund types in the fund financial statements, long-term debt and other long-term obligations are reported as liabilities in the applicable governmental activities, business-type activities, or proprietary fund type statement of net assets. Bond premiums and discounts, as well as issuance costs, are deferred and amortized over the life of the bonds using the straight-line method. Bonds payable are reported net of the unamortized bond premium or discount and, when applicable, the deferred amount on refunding. Bond issuance costs are reported as deferred charges and amortized over the term of the related debt.
In the fund financial statements, governmental fund types recognize bond premiums and discounts, as well as bond issuance costs, during the current period. The face amount of debt issued is reported as other financing sources. Premiums received on debt issuances are reported as other financing sources while discounts on debt issuances are reported as other financing uses. Issuance costs, whether or not withheld from the actual debt proceeds received, are reported as debt service expenditures.
8. Restricted net assets — Restricted net assets consist of net assets in which constraints are placed on the use of those net assets by either external entities, such as creditors (debt covenants), grantors, contributors, and laws or regulations of other governments; or by constitutional provisions or enabling legislation of the State. Restrictions imposed by enabling legislation could be changed by future legislative action. Of the $2.132 billion restricted by the primary government, $585 million was by enabling legislation.
9. Fund equity — In the fund financial statements, governmental funds report reservations of fund balance for amounts that are not available for appropriation or are legally restricted by outside parties for use for a specific purpose. Designations of fund balance represent tentative management plans that are subject to change.
10. Fiscal year end — The fiscal year end of the primary government and component units is June 30, except for the Dairy Promotion Board, a special revenue fund; which has a December 31 year end. Also, the Certified Cotton Growers’ Organization, a component unit, has a December 31 year end.
11. Comparative data/reclassifications — Comparative total data for the prior year have not been presented.
ag04m88
40

STATE OF TENNESSEE NOTES TO THE FINANCIAL STATEMENTS (Continued)
JUNE 30, 2004
NOTE 2 – Reconciliation of government-wide and fund financial statements
A. Explanation of certain differences between the governmental fund balance sheet and the government-wide statement of net assets The governmental fund balance sheet includes a reconciliation between fund balance—total governmental funds and net assets—governmental activities as reported in the government-wide statement of net assets. One element of that reconciliation explains that “Long-term liabilities, including bonds payable, are not due and payable in the current period and therefore are not reported in the funds.” The details of this $1,534.495 million difference are as follows (expressed in thousands): Bonds payable $ 989,410 Plus: Premium on bonds issued (to be amortized as interest expense) 10,741 Less: Deferred charge for issuance costs (to be amortized over life of debt) (1,506) Commercial paper payable 70,091 Accrued interest payable 12,961 Capital leases payable 609 Claims and judgments 270,181 Compensated absences 173,122 Long-term accounts payable 8,886 Net adjustment to reduce fund balance—total governmental funds to arrive at net assets—governmental activities $ 1,534,495
B. Explanation of certain differences between the governmental fund statement of revenues, expenditures, and changes in fund balances and the government-wide statement of activities The governmental fund statement of revenues, expenditures, and changes in fund balances includes a reconciliation between net changes in fund balances – total governmental funds and changes in net assets of governmental activities as reported in the government-wide statement of activities. One element of that reconciliation explains that “Governmental funds report capital outlays as expenditures. However, in the statement of activities the cost of those assets is allocated over their estimated useful lives as depreciation expense.” The details of this $666.46 million difference are as follows (expressed in thousands): Capital outlay $ 718,242 Depreciation expense (51,782) Net adjustment to increase net changes in fund balances – total governmental funds to arrive at changes in net assets of governmental activities $ 666,460 Another element of that reconciliation states that “The issuance of long-term debt (e.g., bonds, commercial paper) provides current financial resources to governmental funds, while the repayment of the principal of long-term debt consumes the current financial resources of governmental funds. Neither transaction, however, has any effect on net assets. Also, governmental funds report the effect of issuance costs, premiums, discounts, and similar items when debt is first issued, whereas these amounts are deferred and amortized in the statement of activities.” The details of this $24.422 million difference are as follows (expressed in thousands):
ag04m88
41

STATE OF TENNESSEE NOTES TO THE FINANCIAL STATEMENTS (Continued)
JUNE 30, 2004
Debt issued or incurred: Issuance of general obligation bonds $ 167,702 Issuance of commercial paper 38,671 Bond premium capitalized 6,485 Bond cost of issuance capitalized (993) Principal repayments: General obligation debt (236,287) Net adjustment to increase net changes in fund balances – total governmental funds to arrive at changes in net assets of governmental activities $ 24,422 Another element of that reconciliation states that “Some expenses reported in the statement of activities do not require the use of current financial resources and therefore are not reported as expenditures in governmental funds.” The details of this $298.663 million difference are as follows (expressed in thousands): Compensated absences $ 709 Claims and judgments 158,749 Accrued interest 2,293 Capital lease (118) Amortization of deferred charge 40 Loss on disposal of capital assets 137,445 Amortization of issuance costs 73 Amortization of bond premiums (528) Net adjustment to decrease net changes in fund balances – total governmental funds to arrive at changes in net assets of governmental activities $ 298,663
NOTE 3 – Stewardship, compliance and accountability
A. Budgetary process
Legislation requires the Governor to present his proposed budget to the General Assembly at the beginning of each annual session. Annual budgets are adopted for the general fund, special revenue funds (except Fraud and Economic Crime, Community Development and Dairy Promotion Board), and debt service fund. The General Assembly enacts the budget through passage of specific departmental appropriations, the sum of which may not exceed estimated revenues. Before signing the Appropriations Act, the Governor may veto or reduce any specific appropriation, subject to legislative override. Once passed and signed, the budget becomes the State's financial plan for the coming year.
Budgetary control is maintained at the departmental level. Budget revisions during the year, reflecting program changes or intradepartmental transfers of an administrative nature, may be affected with certain executive and legislative branch approval. Only the legislature, however, may transfer appropriations between departments.
Unencumbered appropriations lapse at the end of each fiscal year, with the encumbered appropriations being carried forward to the next year. In order to provide sufficient funding for several programs during the year, supplemental appropriations of $96.839 million were required.
The State's annual budget is prepared on the modified accrual basis of accounting with several exceptions, principally the effect of encumbrance and contract obligations. Because these exceptions represent departures from generally accepted accounting principles (GAAP), actual amounts, in the accompanying budgetary comparison schedule, are presented on the budgetary basis.
ag04m88
42

STATE OF TENNESSEE NOTES TO THE FINANCIAL STATEMENTS (Continued)
JUNE 30, 2004
Encumbrance accounting is utilized for budgetary control purposes in governmental fund types. Encumbrances outstanding at year end are reported as reservations of fund balance for subsequent year expenditure.
B. Deficit fund equity The Local Government Group Insurance Fund, an Enterprise Fund, has a total net asset deficit of $5.77 million. This deficit was caused by escalating insurance costs. Rate hikes are scheduled to go into place effective January 1, 2005, to address the deficit.
The Certified Cotton Growers’ Organization, a component unit, has a total net asset deficit of $19.583 million. This deficit occurred because a substantial amount of funds were borrowed to fund the balance of program costs. The monies borrowed are to be repaid by December 15, 2013.
NOTE 4 – Accounting changes The following schedule enumerates adjustments for the fiscal year ending June 30, 2004 (expressed in thousands): 6/30/2003 Change in 6/30/2003 Net Assets Accounting Prior Period Net Assets As Reported Principles Adjustments As RestatedGovernment-wide statements: Primary Government Governmental activities $ 19,045,216 $ 76,636 $ (10,584) $ 19,111,268 Total primary government $ 19,045,216 $ 76,636 $ (10,584) $ 19,111,268 Government-wide statements: Component Units $ 3,268,779 $ 343,784 $ 3,612,563 Total component units $ 3,268,779 $ 343,784 $ 3,612,563
Prior Period Adjustments Primary Government Governmental activities Motor Vehicle Management - $10.584 million is a correction of an error resulting from the overstatement of capital assets (motorized vehicles) in previous years. There is no depreciation effect.
Change in Accounting Principle The State has implemented the Governmental Accounting Standards Board’s Technical Bulletin No. 2004-1, Tobacco Settlement Recognition and Financial Reporting Entity Issues. In addition to requirements not applicable to the State, the Technical Bulletin establishes an accrual period for governments to recognize tobacco settlement revenues based on the tobacco companies agreement. The effect on the State of implementing this standard is to accrue $76.636 million as a receivable and a revenue in the General Fund for estimated tobacco settlement payments for the period January through June 30. The State has also implemented the Governmental Accounting Standards Board’s Statement No. 39, Determining Whether Certain Organizations Are Component Units, which is effective for fiscal year June 30, 2004. This statement requires organizations that are separate from the state, and receive or hold resources that are almost entirely for the direct benefit of the state or its component units, be evaluated for inclusion in the state’s financial statements as a potential component unit. Primary government - The state’s analysis revealed that foundations that support state functions such as state recreational areas, are quantitatively immaterial to the state as a whole and are therefore, not included.
ag04m88
43

STATE OF TENNESSEE NOTES TO THE FINANCIAL STATEMENTS (Continued)
JUNE 30, 2004
Component units - The state’s higher education systems have foundations that are quantitatively significant; therefore, the foundations’ assets, liabilities, revenues, and expenses are required to be reported with those of the institutions they are supporting. The following reflects the effect on beginning net assets (expressed in thousands):
6/30/2003 Change in 6/30/2003 Net Assets Accounting Net Assets As Reported Principles As Restated University of Tennessee $ 1,561,387 $ 110,149 $ 1,671,536 Tennessee Board of Regents 1,288,233 233,635 1,521,868 Total Component Units $ 2,849,620 $ 343,784 $ 3,193,404
NOTE 5 – Detailed notes on all funds
A. Deposits and investments 1. Pooled investments – The Pooled Investment Fund, administered by the State Treasurer, is authorized by statute
to invest funds in accordance with policy guidelines approved by the State Funding Board. The current resolution of that Board gives the Treasurer approval to invest in collateralized certificates of deposit in authorized state depositories; prime commercial paper and prime banker's acceptances; bonds, notes and bills of the United States Treasury or other obligations guaranteed as to principal and interest by the United States or any of its agencies and in repurchase agreements for obligations of the United States or its agencies; and in certain obligations of the State. This resolution further states that the dollar weighted average maturity of the State Pooled Investment Fund shall not exceed 90 days and that no investment may be purchased with a remaining maturity of greater than 397 calendar days.
The State Pooled Investment Fund is also authorized by policy to contractually loan securities to investment brokers. The contract for a security loan provides that the fund loan specific securities from its holdings to the broker in return for collateral securities. Statute requires that the loaned securities be collateralized at 102% of their market value. There were no securities on loan from the State Pooled Investment Fund during fiscal year 2004.
Statutes require the state deposits be secured by collateral securities with a market value of 105% of the face of the deposit secured thereby after considering the applicable FDIC coverage, or the depository must be a member of the State Collateral Pool and the pool must have securities pledged which in total equal the required percentage established by the Collateral Pool Board.
Certificates of deposit are not placed or renewed with a financial institution until adequate collateral is pledged. Open accounts maintained for deposit of state revenues are collateralized on an estimate of the average daily balance in the account based on previous balances and monitored for variation to actual balances. The Treasurer is required, by statute, to evaluate the market value of required collateral monthly, and more frequently if market conditions require. Further, statutes provide the Commissioner of Financial Institutions to advise, on a timely basis, the Treasurer and the Commissioner of Finance and Administration of the condition of each state bank and state chartered savings and loan association, including his recommendations regarding its condition and safety as a state depository. Similar provisions apply to federally chartered banks and savings and loan associations designated as state depositories. This process ensures that institutions whose financial status is uncertain are monitored for collateral sufficiency. All repurchases are done with primary dealers in government securities which have executed a master repurchase agreement with the State. The policy guidelines approved by the State Funding Board require that the market value of the securities underlying the repurchase agreement be at least 102% of the cash investment. The policy also requires that collateral securities be marked-to-market daily and be maintained at a value equal to or greater than the cash investment. Prime commercial paper may be acquired from authorized broker dealers or directly from the issuer. There is no collateral requirement for prime commercial paper.
The State Pooled Investment Fund also invested in repurchase agreements during the year.
ag04m88
44

STATE OF TENNESSEE NOTES TO THE FINANCIAL STATEMENTS (Continued)
JUNE 30, 2004
The Tennessee Consolidated Retirement System (TCRS), in addition to the guidelines outlined for the Pooled Investment Fund, may invest in long-term investments. The TCRS may invest in bonds, debentures, preferred stock and common stock, real estate, and other good and solvent securities subject to the TCRS Board of Trustees approval. The Board has also authorized limited investments of securities in some foreign countries.
2. Valuation of investments
a. State Pooled Investment Fund – The SPIF is not registered with the Securities and Exchange Commission (SEC) as an investment company but, through its investment policy adopted by the State Funding Board, operates in a manner consistent with the SEC’s rule 2a7 of the Investment Company Act of 1940. Rule 2a7 allows SEC registered mutual funds to use amortized cost to report net assets in computing share prices. Likewise, the SPIF uses amortized cost accounting measures to report investments and share prices. During the fiscal year ended June 30, 2004, the State had not obtained or provided any legally binding guarantees to support the value of participant shares.
b. Other Investments – Investments not included in the SPIF are valued at fair value.
3. Securities lending — The TCRS and the Chairs of Excellence (COE), a permanent fund, are authorized by their investment policies, as adopted by their boards, to enter into collateralized securities lending agreements whereby the TCRS and COE loans its debt and equity securities for a fee to a select few of the highest quality securities firms and banks. Loans must be limited so the total amount on loan does not exceed 30 percent of the TCRS’ and COE’s assets. The TCRS’ and COE’s custodian bank manages the lending program and maintains the collateral on behalf of the TCRS and COE. The borrower must deliver cash collateral to the lending agent. Cash received as collateral may be reinvested by the lending agency in accordance with the investment policy, as further restricted under the TCRS and COE securities lending agreement. Collateral securities cannot be pledged or sold unless the borrower defaults.
The loaned securities are initially collateralized at 102 percent of their fair value for domestic securities and 105 percent for international. Collateral is marked-to-market daily and additional collateral is pledged by the borrower if the fair value of the collateral subsequently falls below 100 percent for domestic securities and 105 percent for international. Although there is no specific policy for matching the maturities of the collateral investments and the securities loans, all securities on loan can be terminated on demand by either the TCRS/COE or the borrower. At year-end, TCRS and COE had no securities on loan.
4. Asset-Backed Securities - The TCRS invests in collateralized mortgage obligations (CMOs), which are mortgage-backed securities. These securities are based on cash flows from interest and principal payments on underlying mortgages. Therefore, they are sensitive to prepayments by mortgagees, which may result from a decline in interest rates. The CMOs held were issued by quasi-U.S. governmental agencies. At June 30, 2004, there were no CMO’s held. The TCRS also invests in various asset-backed securities, representing ownership interests in trusts consisting of credit card or auto loan receivables. These securities are issued by organizations with AAA or AA credit ratings. TCRS invests in these securities primarily to enhance returns by taking advantage of opportunities available in this sector of the securities markets.
5. Derivatives – The TCRS may buy or sell equity index futures contracts for the purpose of making asset allocation changes in an efficient and cost effective manner and to improve liquidity. The futures contracts are limited to the S&P 500 Index, the S&P Midcap 400 Index and the Russell 2000 Index. The TCRS can increase (decrease) equity market exposure by buying (selling) the equity index future to obtain its target domestic equity allocation. Gains (losses) on equity index future hedge losses (gains) produced by any deviation from the TCRS’ target equity allocation.
The gains and losses resulting from daily fluctuations in the fair value of the outstanding futures contracts are settled daily, on the following day, and a receivable or payable is established for any unsettled gain or loss as of the financial statement date. At June 30, 2004, the TCRS was not under any futures contracts.
ag04m88
45
STATE OF TENNESSEE NOTES TO THE FINANCIAL STATEMENTS (Continued)
JUNE 30, 2004
The International securities expose the TCRS to potential losses due to a possible rise in the value of the US dollar. The TCRS investment managers can reduce foreign currency exposure by selling foreign currency forward contracts, at agreed terms and for future settlement, usually within a year. The manager will reverse the contract by buying the foreign currency before the settlement date. A gain (loss) on this transaction pair will hedge a loss (gain) on the currency movement of the international security. The TCRS can sell up to 80% of its foreign currency exposure into US dollars. The fair value of foreign currency forward contracts outstanding, as of June 30, 2004, has been reflected in the financial statements.
The TCRS is also authorized by investment policy to engage in the issuance of options. Activity is limited to selling covered call options. The TCRS had no options outstanding at June 30, 2004.
6. Deposits — Deposits with financial institutions are required to be categorized to indicate the level of risk assumed by the State. Category 1 consists of deposits that are insured or collateralized with securities held by the State or by its agent in the state's name. Category 2 consists of deposits collateralized with securities held by the pledging financial institution's trust department or agent in the state's name. Category 3 deposits are uncollateralized. This includes any bank balance that is collateralized with securities held by the pledging financial institution, or by its trust department or agent but not in the state's name.
At year end, the carrying amount of deposits in all funds was $2,150.360 million and the bank balance, including accrued interest, was $2,410.404 million. The total bank balance was (category 1) covered by insurance or collateral (at fair value) held in the state's name by independent custodial banks or in the Federal Reserve Bank in the state's account. There were no material amounts uncollateralized during the year ended June 30, 2004.
The carrying value of cash and investments includes $523.914 million of funds reported as component units.
Cash on deposit with fiscal agent includes $9.336 million of cash held in a custody account by State Street Bank under a contractual arrangement for master custody services. Monies with the custodial agent are not classified by credit risk, as the custody account relationship does not meet the definition for either a deposit with a financial institution or a security.
7. Investments - Investments are also required to be categorized to indicate the level of risk assumed by the State. Category 1 consists of investments that are insured or registered or for which the securities are held by the state or its agent in the State's name. Category 2 consists of uninsured and unregistered investments for which the securities are held by the counterparties' trust department or agent in the State's name. Category 3 includes uninsured and unregistered investments for which the securities are held by the counterparties' trust department or agent but not in the State's name. Investments are categorized below for all funds (expressed in thousands):
ag04m88
46

STATE OF TENNESSEE NOTES TO THE FINANCIAL STATEMENTS (Continued)
JUNE 30, 2004
PENSION TRUST, POOLED INVESTMENT, AND OTHER FUNDS _____________Category_____________ Fair Carrying Value _____1____ ___2___ ___3___ Amount__ 6/30/04 Cash Equivalents and Short-Term Investments: Commercial Paper $ 1,291,533 $ 1,291,533 $ 1,291,548 Government Securities 2,803,076 2,803,076 2,800,541 Total Cash Equivalents and Short-Term Investments 4,094,609 4,094,609 4,092,089 Long-Term Investments: Government Securities - not on loan 10,965,800 10,965,800 10,965,800 Corporate Bonds 1,919,785 1,919,785 1,919,785 Corporate Stocks 10,258,064 10,258,064 10,258,064 Total Long-Term Investments 23,143,649 23,143,649 23,143,649 Total $ 27,238,258 27,238,258 27,235,738 Investments not subject to categorization: Unsettled Investment Acquisitions: Corporate Bonds 2,012 2,012 Corporate Stocks 18,659 18,659 Mutual Funds 128,353 128,353 Real Estate 463,383 463,383 Unemployment Compensation Pool 622,565 622,565 Total Investments and Cash Equivalents $ 28,473,230 $ 28,470,710
ag04m88
47
STATE OF TENNESSEE NOTES TO THE FINANCIAL STATEMENTS (Continued)
JUNE 30, 2004
8. The various component units are generally governed by the same basic State statutes as the State’s investments
described above.
a. University of Tennessee
At year end, the carrying amount of deposits for the University of Tennessee was $175.550 million and the bank balance was $170.168 million. Of this balance, the entire amount was (category 1) insured or collateralized with securities held by the University or by its agent in the University’s name. During the year ended June 30, 2004, the University had uncollateralized deposits on several days of amounts up to $5.874 million.
The carrying value of cash and investments includes $155.119 million of foundation funds reported as component units by the University of Tennessee. The foundations utilize Financial Accounting Standards Board (FASB) accounting standards. Therefore, the schedule below does not reflect these funds.
The investments for the University of Tennessee are categorized below (expressed in thousands): _____________Category_____________ Fair Carrying Value _____1____ ___2___ ___3___ Amount 6/30/04 Cash Equivalents: Commercial Paper $ 60,955 $ 60,955 $ 60,955 Government Securities 183,326 183,326 183,326 Total Cash Equivalents 244,281 244,281 244,281 Investments: Government Securities 8,748 $ 24,115 32,863 32,863 Corporate Bonds 559 19,581 20,140 20,140 Corporate Stocks 116,879 7,047 123,926 123,926 Collateralized Mortgage Securities 1,484 1,484 1,484 Other 23 23 23 Assets with Trustees $ 4,416 4,416 4,416 International Securities Corporate Stocks 2,295 166 2,461 2,461 Total Investments 129,988 50,909 4,416 185,313 185,313 Total $ 374,269 $ 50,909 $ 4,416 429,594 429,594 Investments not subject to categorization: Limited Partnership-Venture Capital Funds 27,421 27,421 Real Estate Equity 26,031 26,031 Mutual Funds 204,937 204,937 Real Estate Gifts 3,420 3,420 Cash Equivalents - assets with bank as custodian 2,793 2,793 Investments in Hedge Funds 59,419 59,419 Total Investments and Cash Equivalents $ 753,615 $ 753,615
ag04m88
48

STATE OF TENNESSEE NOTES TO THE FINANCIAL STATEMENTS (Continued)
JUNE 30, 2004
b. Tennessee Board of Regents
At year end, the carrying amount of deposits for the Tennessee Board of Regents was $136.043 million and the bank balance was $153.273 million. Of the bank balance, $138.990 million was (category 1) covered by insurance or collateral (valued at market) held in the schools’ name by independent custodial banks or segregated in the Federal Reserve Bank in the schools’ name, $10.498 million was (category 2) collateralized with securities held by the pledging financial institution’s trust department or agent in the institution’s name, and $3.785 million was (category 3) uninsured and uncollateralized. In addition, at June 30, 2004, the schools had $300.227 million being held by the State in the Local Government Investment Pool.
The investments for the Tennessee Board of Regents are categorized below (expressed in thousands): _____________Category_____________ Fair Carrying Value _____1____ ___2___ ___3___ Amount_ 6/30/04 Investments: Commercial Paper $ 1,998 $ 167 $ 2,165 $ 2,165 Government Securities 69,702 2,531 $ 2,040 74,273 74,102 Corporate Bonds 7,987 1,347 3,338 12,672 12,672 Corporate Stocks 56,144 8,199 8,098 72,441 72,431 Other 1,439 125 2,002 3,566 3,566 Total Long-Term Investments $ 137,270 $ 12,369 $ 15,478 165,117 164,936
Investments not subject to categorization:
Mutual Funds 64,558 64,558 Other 474 474 Total Investments and Cash Equivalents $ 230,149 $ 229,968
ag04m88
49

STATE OF TENNESSEE NOTES TO THE FINANCIAL STATEMENTS (Continued)
JUNE 30, 2004
c. Tennessee Housing Development Agency
At June 30, 2004, the carrying amount of THDA’s deposits was $2.140 million, and the bank balance was $3.410 million. Of the bank balance, $1.344 million was insured and $2.066 million was collateralized with securities held by the pledging financial institution’s agent, but not in the agency’s name. In addition, at June 30, 2004, THDA had $2.362 million being held by the State in the State Pooled Investment Fund. On several days during the year, the amounts collateralized with securities held by the pledging financial institution’s agent but not in the agency’s name significantly exceeded the amount at year-end. The laws of the State of Tennessee require that collateral be pledged at 105% of the value of uninsured deposits. The agency bond resolution required deposits to be fully secured. The investments for the Tennessee Housing Development Agency are categorized below (expressed in thousands):
_____________Category_____________ Fair Carrying Value _____1____ ___2___ ___3___ Amount_ 6/30/04
Cash Equivalents and Short-Term Investments: Repurchase Agreements $ 80,000 $ 80,000 $ 80,000 Government Securities 273,367 273,367 273,367 Total Cash Equivalents and Short-Term Investments 353,367 353,367 353,367 Long-Term Investments Repurchase Agreements 15,000 15,000 15,000 Government Securities 364,380 364,380 364,380 Total Long-Term Investments 379,380 379,380 379,380 Total $ 732,747 732,747 732,747 Investments not subject to categorization: Mutual Fund 18,428 18,428 Total Investments and Cash Equivalents $ 751,175 $ 751,175
ag04m88
50

STATE OF TENNESSEE NOTES TO THE FINANCIAL STATEMENTS (Continued)
JUNE 30, 2004
B. Accounts and notes receivable
Receivables at June 30, 2004, for the State’s individual major funds and non-major and internal service funds in the aggregate, including the applicable allowances for uncollectible accounts, consist of the following (expressed in thousands):
Primary Government Allowance Total for Net Total Accounts Taxes Government Other Receivables Uncollectibles Receivables Governmental Activities: General $ 570,871 $ 635,063 $ 495,969 $ 4,305 $ 1,706,208 $ (124,538) $ 1,581,670 Education 2,517 392,265 104,651 499,433 (27,364) 472,069 Highway 140 65,942 97,676 163,758 163,758 Nonmajor governmental 174 8,067 5,265 1,697 15,203 (338) 14,865 Internal Service 3,505 _________ 292 ______2 3,799 (58) 3,741 Total—governmental activities $ 577,207 $ 1,101,337 $ 703,853 $ 6,004 $ 2,388,401 $ (152,298) $ 2,236,103 Amounts not expected to be collected within one year $ 66,480 Business-type Activities: Employment Security $ 41,345 $ 109,120 $ 2,275 $ 5,047 $ 157,787 $ (31,223) $ 126,564 Sewer Treatment Loan 21 21 21 Nonmajor enterprise 2,530 _________ _______ _______ 2,530 ________ 2,530 Total—business-type activities $ 43,875 $ 109,120 $ 2,275 $ 5,068 $ 160,338 $ (31,223) $ 129,115
ag04m88
51
STATE OF TENNESSEE NOTES TO THE FINANCIAL STATEMENTS (Continued)
JUNE 30, 2004
C. Capital assets Capital asset activity for the year ended June 30, 2004, was as follows (expressed in thousands):
Primary Government Beginning Ending Balance Increases Decreases BalanceGovernmental activities: Capital assets, not being depreciated: Land $ 838,035 $ 119,211 $ (1,533) $ 955,713 Infrastructure 15,463,371 677,192 (133,420) 16,007,143 Construction in progress 1,132,374 590,966 (732,646) 990,694 Total capital assets, not being depreciated 17,433,780 1,387,369 (867,599) 17,953,550 Capital assets, being depreciated: Structures and improvements 1,666,665 58,225 (13,894) 1,710,996 Machinery and equipment 489,858 46,028 (33,666) 502,220 Total capital assets being depreciated 2,156,523 104,253 (47,560) 2,213,216 Less accumulated depreciation for: Structures and improvements (614,078) (41,020) 12,355 (642,743) Machinery and equipment (333,060) (40,629) 28,489 (345,200) Total accumulated depreciation (947,138) (81,649) 40,844 (987,943) Total capital assets, being depreciated, net 1,209,385 22,604 (6,716) 1,225,273 Governmental activities capital assets, net $ 18,643,165 $ 1,409,973 $ (874,315) $ 19,178,823
Depreciation expense was charged to functions/programs of the primary government as follows (expressed in thousands):
Governmental activities: General Government $ 2,022 Education 1,762 Health and Social Services 6,578 Law, Justice and Public Safety 17,968 Recreation and Resource Development 10,537 Regulation of Business and Professions 106 Transportation 12,811 Capital assets held by the government’s internal service funds are charged to the various functions based on their usage of the assets 29,865 Total depreciation expense – governmental activities $ 81,649
Highway Construction Commitments — At June 30, 2004, the Department of Transportation had contractual commitments of approximately $660.8 million for construction of various highway projects. Funding of these future expenditures is expected to be provided from federal grants ($592.1 million) and general obligation bond proceeds ($68.7 million).
ag04m88
52

STATE OF TENNESSEE NOTES TO THE FINANCIAL STATEMENTS (Continued)
JUNE 30, 2004
Discretely Presented Component Units
Capital asset activity for the year ended June 30, 2004, for the discretely presented component units are as follows (expressed in thousands):
Beginning Ending Balance Increases Decreases Balance Capital assets, not being depreciated: Land $ 129,947 $ 5,396 $ (2,522) $ 132,821 Construction in progress 223,913 76,391 (122,750) 177,554 Total capital assets, not being depreciated 353,860 81,787 (125,272) 310,375 Capital assets, being depreciated: Infrastructure 197,395 11,407 (3,617) 205,185 Structures and improvements 2,418,030 140,879 (6,456) 2,552,453 Machinery and equipment 682,330 68,962 (48,660) 702,632 Total capital assets being depreciated 3,297,755 221,248 (58,733) 3,460,270 Less accumulated depreciation for: Infrastructure (95,361) (8,542) 55 (103,848) Structures and improvements (971,763) (65,280) 5,450 (1,031,593) Machinery and equipment (409,028) (61,721) 42,490 (428,259) Total accumulated depreciation (1,476,152) (135,543) 47,995 (1,563,700) Total capital assets, being depreciated, net 1,821,603 85,705 (10,738) 1,896,570 Total capital assets, net $ 2,175,463 $ 167,492 $ (136,010) $ 2,206,945
The University of Tennessee Foundations utilize FASB standards; therefore, only the June 30, 2004, balances are available as follows (expressed in thousands):
Ending Balance Capital assets, not being depreciated: Land $ 8,241 Construction in progress 66,993 Total capital assets, not being depreciated 75,234 Capital assets, being depreciated: Structures and improvements 51,527 Machinery and equipment 2,226 Total capital assets being depreciated 53,753 Less: Total accumulated depreciation (4,960) Total capital assets, being depreciated, net 48,793 Total capital assets, net $ 124,027
ag04m88
53

STATE OF TENNESSEE NOTES TO THE FINANCIAL STATEMENTS (Continued)
JUNE 30, 2004
D. Interfund balances
1. Interfund balances at June 30, 2004, consisted of the following (expressed in thousands):
D U E F R O M Nonmajor Internal General Employment Nonmajor Enterprise Service Fund Education Highway Security Governmental Funds Funds Total
General Fund $ 179,890 $ 1 $ 8,143 $ 1 $ 527 $ 188,562 D Education $ 3 3 U Highway 14 14 E Employment
Security 300 300 Nonmajor T Governmental 2 6 8 O Internal Service Funds 3,474 3,474
Fiduciary Funds 9,783 341 1,221 ________ $ 319 $ 5 359 12,028 Total $ 13,576 $ 180,231 $ 1,222 $ 8,149 $ 320 $ 5 $ 886 $ 204,389
Of the $179.890 million due to the General Fund from the Education Fund, $179.769 million resulted from a time lag between the dates that payments to local education agencies occur and taxes are received in the Education Fund. The $8.143 million due to the General Fund from Employment Security resulted from a time lag between the dates the funds are drawn and received from the Federal government. The amounts due to Fiduciary Funds resulted from a time lag in payment of payroll tax liabilities.
2. COMPONENT UNITS PAYABLES
Component Units accounts payable to the Primary Government at June 30, 2004, consisted of the following (expressed in thousands):
P A Y A B L E F R O M COMPONENT UNITS
Tennessee Housing Tennessee Tennessee University Nonmajor Development Education Board of of Component Agency Lottery Regents Tennessee Units Total P PRIMARY GOVERNMENT: A General Fund $ 26 $ 56 $ 20 $ 2,779 $ 2,881 Y Education Fund 61,546 427 190 62,163 A Employment Security 11 11 B Nonmajor Governmental Funds 490 577 1,067 L Nonmajor Enterprise Funds 1 1 E Internal Service Funds 437 12 169 618 Fiduciary Funds $ 65 ________ 2,075 1,418 117 3,675T O Total $ 65 $ 61,572 $ 3,485 $ 2,218 $ 3,076 $ 70,416
ag04m88
54

STATE OF TENNESSEE NOTES TO THE FINANCIAL STATEMENTS (Continued)
JUNE 30, 2004
3. COMPONENT UNITS RECEIVABLES
Component Units accounts receivable from the Primary Government at June 30, 2004, consisted of the following (expressed in thousands):
R E C E I V A B L E F R O M PRIMARY GOVERNMENT
Education Nonmajor Employment
R General Fund Fund Governmental Funds Security TotalE C COMPONENT UNITS: E I Tennessee Housing V Development Agency $ 1 $ 1 A Tennessee Education Lottery $ 5 5 B Tennessee Board of Regents 33 $ 219 $ 1,255 1,507 L University of Tennessee 502 5,466 5,968 E Nonmajor Component Units 9,506 _____ _________ ________ 9,506 T Total $ 9,540 $ 721 $ 6,721 $ 5 $ 16,987 O
E. Transfers Transfers between the various primary government funds for fiscal year ended June 30, 2004 are as follows (expressed in thousands):
Transfers In Nonmajor Nonmajor Internal Governmental Sewer Enterprise Service Transfers Out General Education Highway Funds Treatment Funds Funds Total General $ 400,185 $ 53,704 $ 3,470 $ 15,359 $ 11,831 $ 484,549 Education 2,132 5 2,137 Highway $ 67,104 67,104 Nonmajor Governmental Funds 54,406 _______ $ 74,000 9,533 ______ _______ _______ 137,939 Totals $ 121,510 $ 400,185 $ 74,000 $ 65,369 $ 3,470 $ 15,359 $ 11,836 $ 691,729 Transfers are used to (1) move revenues from the fund that statute or budget requires to collect them to the fund that statute or budget requires to expend them, (2) move receipts restricted to debt service from the funds collecting the receipts to the debt service fund as debt service payments become due and (3) use unrestricted resources from the general fund to finance various programs accounted for in other funds in accordance with statute or budgetary authorizations.
In the fiscal year ended June 30, 2004, the general fund transferred $484.5 million to other funds in accordance with statute or budgetary authorizations for the following purposes: $400.2 million to subsidize the activities of the education fund, $48.2 million for capital outlay expenditures, $31.5 million to provide appropriations to finance various programs in other funds, $4.0 million to provide for debt service payments that were due, and $600 thousand for payments for interfund services used.
ag04m88
55

STATE OF TENNESSEE NOTES TO THE FINANCIAL STATEMENTS (Continued)
JUNE 30, 2004
The highway fund received a transfer from the debt service fund for $74.0 million to cancel authorized and unissued highway bonds. These authorizations were originally recorded in the highway fund to fund a portion of their budget.
The highway fund transferred $65.8 million into the general fund for the purpose of funding the requirements of state government operations. The transfer is considered non-routine and inconsistent with the activities of the highway fund. This transfer was made in accordance with budgetary authority granted by the Legislature.
F. Lease obligations
Operating Lease Obligations — The State has entered into various operating leases for land, buildings and equipment. Most leases contain termination clauses providing for cancellation after 30, 60 or 90 days' written notice to lessors. In addition, most leases contain appropriation clauses indicating that continuation of the lease is subject to funding by the legislature. It is expected that in the normal course of business most of these leases will be replaced by similar leases. The State has also entered into various operating leases, which have non-cancelable lease terms. Below is a schedule of future minimum lease payments under these leases (expressed in thousands).
For the Year(s) Noncancelable Ended June 30 Operating Leases 2005 $ 11,317 2006 9,324 2007 7,372 2008 5,474 2009 5,288 2010-2014 13,922 Total Minimum Payments Required $ 52,697
Expenditures for rent under leases for the years ended June 30, 2004 and 2003, amounted to $35.8 million and $32.1 million, respectively.
Capital Lease Obligations – The State leases two buildings for vocational training centers, one in Carter County and the other in Dyersburg. The leases provide an option to purchase the buildings within the lease periods. These capital lease obligations are payable from resources of the General Fund. The effective interest rates are 5.1% and 4.78%. In addition, the Department of General Services leased imaging systems and printers with an option to purchase within the five-year lease periods. The effective interest rates of the equipment leases are 6.4% and 5%. These capital lease obligations are reported in the governmental activities column of the Statement of Net Assets. The following is an analysis of the leased property under capital leases (expressed in thousands).
Governmental Activities
Assets: Land $ 68 Buildings 1,215 Less: Accumulated Depreciation 150 1,065 Equipment 410 Less: Accumulated Depreciation 13 397 $ 1,530
ag04m88
56

STATE OF TENNESSEE NOTES TO THE FINANCIAL STATEMENTS (Continued)
JUNE 30, 2004
At June 30, 2004, minimum annual lease payments are as follows (expressed in thousands):
For the Year(s) Governmental Activities Lease Ended June 30 Obligation Payable 2005 $ 247 2006 247 2007 247 2008 247 2009 154 Total 1,142 Less - Interest 134 Present value of net minimum lease payments $ 1,008
G. Lease receivables
Operating Lease Receivables — The State, as the lessor, entered into an operating lease with Tennessee Golf, LLC for four golf courses built by the State to be operated by the lessee. The 21-year lease agreement, dated January 20, 1995, that required lease payments begin in January 2001 was amended on February 11, 2002, to extend the lease period to 30 years. In accordance with GASB Statement 13, this lease qualifies as a lease with scheduled rent increases. The golf courses are recorded as a governmental activities capital asset.
The State, as the lessor, entered into an operating lease with The Hassell Charitable Foundation for Ross Creek Golf Course, which was acquired by the State to be operated by the lessee. The 20-year lease agreement is dated September 12, 2003.
The following is a schedule by years of minimum future rentals on noncancelable leases as of June 30, 2004 (expressed in thousands): Year ending June 30 2005 $ 535 2006 1,611 2007 2,612 2008 2,652 2009 2,696 2010-2014 14,174 2015-2019 14,861 2020-2024 14,342 2025-2029 12,647 2030-2031 3,794 Total minimum future rentals $ 69,924 Capital Lease Receivable — The State, as the lessor, entered into a lease agreement with the Nashville/Davidson County Metropolitan Government (lessee) for the Farmers’ Market Facility. The lease term is 20 years with an option to renew the lease for an unlimited period of time. The agreement was signed in June 1995; an initial cash payment was made and the first of 19 payments began in fiscal year 1997. The State is subsidizing a part of the cost of this building.
The State, as lessor, entered into a lease agreement with the Nashville/Davidson County Metropolitan Government (lessee) for the Post-Mortem Facility. The lease term is 20 years beginning July 15, 2001, with an option to renew the lease for an unlimited period of time for a nominal amount. The State is subsidizing a part of the cost of this building.
ag04m88
57

STATE OF TENNESSEE NOTES TO THE FINANCIAL STATEMENTS (Continued)
JUNE 30, 2004
Minimum future lease payments to be received as of June 30, 2004 (expressed in thousands):
Year Ended June 30 Total 2005 $ 562 2006 560 2007 461 2008 457 2009 458 2010-2014 2,295 2015-2019 1,266 2020-2021 403 Total minimum future lease payments $ 6,462 Net investment in direct financing leases at June 30: Minimum lease payments receivable $ 6,462 Plus: deferred charges 704
Net investment in direct financing lease $ 7,166
H. Long term debt
1. General Obligation Bonds – Bonds Payable at June 30, 2004, are shown below (expressed in thousands):
_Amount_ Business-type Activities:
General obligation bonds, 5.0%, due in generally decreasing amounts of principal and interest ranging from $1.725 million in 2005 to $719 thousand in 2006 $ 2,295 General obligation refunding bonds, 1996 Series C, 4.6% to 5.0%, principal and interest due in amounts ranging from $1.498 million in 2005 to $986 thousand in 2010 5,889 8,184 Less: Unamortized bond refunding costs (113) Total Business-type Activities $ 8,071 Governmental Activities: General obligation bonds, 1.6% to 7.4%, due in generally decreasing amounts of principal and interest from $101.332 million in 2005 to $3.995 million in 2029 $ 872,477 General obligation refunding bonds, 1996 Series B, 4.6% to 6%, principal and interest due in amounts ranging from $20.137 million in 2005 to $3.911 million in 2011 60,815 General obligation refunding bonds, 1999 Series A, 3.75% to 5%, principal and interest due in amounts ranging from $30.524 million in 2005 to $5.398 million in 2015 210,040 1,143,332 Less: Unamortized bond refunding costs (2,306) Total Governmental Activities $ 1,141,026
General obligation bonds issued during the year ended June 30, 2004:
September 2003 – Series 2003A in the amount of $151.855 million Series 2003B in the amount of $22.18 million
ag04m88
58

STATE OF TENNESSEE NOTES TO THE FINANCIAL STATEMENTS (Continued)
JUNE 30, 2004
The $151.855 million general obligation bond issue represents tax exempt bonds maturing serially through 2025 at interest rates ranging from 3.0% to 5.125%. The bonds were sold at a premium of $6.767 million. The $22.18 million general obligation bond issue represents taxable bonds maturing serially through 2014 and term bonds maturing in 2017, 2020, and 2023 at interest rates ranging from 1.6% to 5.8%. The bonds were sold at a discount of $33 thousand. Proceeds of $162.625 million were used to redeem commercial paper.
2. General Obligation Commercial Paper – Governmental Activities Commercial Paper Payable at June 30, 2004, is shown below (expressed in thousands).
Commercial Paper General obligation commercial paper, interest rates ranging from .85% to 1.16% for tax $ 82,775 exempt and 1.09% to 1.2% for taxable, varying maturities
The full faith and credit of the State, together with certain tax revenues, are pledged to secure all general obligation bonds and commercial paper listed above.
In March 2000, the State instituted a general obligation commercial paper program to provide interim or short-term financing of various authorized capital projects. Commercial paper may be issued as federally taxable or tax exempt and constitute bond anticipation notes. The commercial paper is sold at par as interest-bearing obligations in minimum denominations of $100 thousand and integral multiples of one thousand in excess of such amount, with interest payable at maturity. The commercial paper has varying maturities of not more than 270 days from their respective dates of issuance. Interest rates vary depending on the market. The amount of principal outstanding may not exceed $250 million.
The State has entered into a Standby Commercial Paper Purchase Agreement with the Tennessee Consolidated Retirement System under which TCRS is obligated to purchase newly issued commercial paper issued to pay the principal of other commercial paper. The Program expires and the Standby Purchase Agreement terminates on April 1, 2010. At June 30, 2004, $82.775 million of commercial paper was outstanding ($76.975 million tax exempt and $5.8 million federally taxable). Commercial paper payable under this Program qualifies for reporting as a non-current liability because provisions in the Commercial Paper Resolution permit refinancing the paper on a long-term basis.
3. Debt Service Requirements to Maturity - Debt Service requirements to maturity for all general obligation bonds payable at June 30, 2004, are as follows (expressed in thousands):
For the Year(s) General Obligation Bonds Total _Ended June 30_ Principal Interest Requirements 2005 $ 98,707 $ 56,508 $ 155,215 2006 97,362 51,436 148,798 2007 86,547 46,523 133,070 2008 80,932 42,379 123,311 2009 80,542 38,563 119,105 2010-2014 368,386 136,102 504,488 2015-2019 232,303 55,807 288,110 2020-2024 89,972 14,177 104,149 2025-2029 16,765 3,622 20,387 _________ ________ ___________ $1,151,516 $ 445,117 $ 1,596,633
The above principal for bonds does not reflect a $2.419 million deduction from bonds payable for the deferred amount on refunding.
ag04m88
59
STATE OF TENNESSEE NOTES TO THE FINANCIAL STATEMENTS (Continued)
JUNE 30, 2004
4. General Obligation Bonds Authorized and Unissued - A summary of general obligation bonds authorized and unissued
at June 30, 2004, is shown below (expressed in thousands). It is anticipated that a significant amount of these bonds will not be issued but will be canceled because of sufficient fund balances.
Unissued Unissued Purpose July 1, 2003 Authorized Canceled June 30, 2004 Highway $ 715,500 $ 159,000 $ 74,000 $ 800,500 Higher Education 16,043 6,765 9,278 Environment and Conservation 18,077 5,065 13,012 General Government 558,575 354,880 182,092 731,363 Local Development Authority 19,300 2,500 16,800 Other 41 ________ 41 - Totals $ 1,327,536 $ 513,880 $ 270,463 $ 1,570,953
5. Changes in Long-Term Obligations - A summary of changes in long-term obligations for the year ended June 30, 2004,
follows (expressed in thousands).
Changes In Long-Term Obligations
Amounts Beginning Ending Due Within Balance Additions Reductions Balance One Year GOVERNMENTAL ACTIVITIES Bonds and Commercial Paper Payable: General Obligation Debt $ 1,251,868 $ 230,802 $ (256,563) $ 1,226,107 $ 95,090 Less Deferred Amount on Refundings (2,536) ________ 230 (2,306) ________ Total Bonds and Commercial Paper Payable 1,249,332 230,802 (256,333) 1,223,801 95,090 Capital Leases 788 402 (182) 1,008 200 Compensated Absences 176,009 118,608 (117,812) 176,805 82,605 Claims and Judgments 198,768 228,167 (64,197) 362,738 35,982 Governmental Activities Long-Term Obligations $ 1,624,897 $ 577,979 $ (438,524) $ 1,764,352 $ 213,877 BUSINESS-TYPE ACTIVITIES Bonds Payable $ 11,203 $ (3,019) $ 8,184 $ 2,830 Less Deferred Amount on Refundings (133) 20 (113) ________ Total Bonds Payable 11,070 (2,999) 8,071 2,830 Compensated Absences 59 $ 52 (42) 69 33 Business-Type Activities Long-Term Obligations $ 11,129 $ 52 $ (3,041) $ 8,140 $ 2,863 Governmental activities include all governmental funds and internal service funds. Typically, agencies accounted for in the General Fund and Special Revenue Funds liquidate compensated absences liabilities. Claims and judgments are obligations of Underground Storage Tanks and Highway Funds (special revenue funds), Risk Management (internal service fund) and the General Fund.
ag04m88
60

STATE OF TENNESSEE NOTES TO THE FINANCIAL STATEMENTS (Continued)
JUNE 30, 2004
I. Payables Payables as of June 30, 2004, were as follows (expressed in thousands):
Salaries and Accrued Total Vendors Benefits Interest Other PayablesGovernmental Activities: General $ 806,229 $ 61,537 $ 75,931 $ 943,697 Education 119,753 3,014 4,123 126,890 Highway 55,028 6,777 61,805 Nonmajor governmental 45,460 1,442 $ 13,025 433 60,360 Internal Service 74,138 1,968 ______ _______ 76,106 Total— governmental activities $ 1,100,608 $ 74,738 $ 13,025 $ 80,487 $ 1,268,858 Business-Type Activities: Employment Security $ 185 $ 11,086 $ 11,271 Sewer Treatment Loan 9 9 Nonmajor enterprise 32,939 $ 30 $ 131 8,076 41,176 Total—business-type activities $ 33,133 $ 30 $ 131 $ 19,162 $ 52,456
J. Component units – condensed financial statements
Below are the condensed financial statements of the component units for the State of Tennessee as of June 30, 2004 (expressed in thousands):
Condensed Statement of Net Assets Component Units
Housing Tennessee Board University Nonmajor Total Development Education of of Component Component Agency Lottery Regents Tennessee Units UnitsAssets Cash, Investments, and Other Assets $ 2,037,584 $ 80,253 $ 797,471 $ 1,350,294 $ 199,534 $ 4,465,136 Due from Primary Government 1 5 1,507 5,968 9,506 16,987 Due from Other Component Units 482,257 482,257 Restricted Assets 186,791 265 22,670 209,726 Capital Assets, Net 16 2,314 1,234,835 1,084,130 9,677 2,330,972 Total Assets 2,224,392 82,837 2,033,813 2,440,392 723,644 7,505,078 Liabilities Accounts Payable and Other Current Liabilities 41,478 17,968 116,714 172,116 25,567 373,843 Due to Primary Government 65 61,572 3,485 2,218 3,076 70,416 Due to Other Component Units 249,968 232,289 482,257 Long-Term Liabilities 1,784,774 983 77,562 283,190 676,560 2,823,069 Total Liabilities 1,826,317 80,523 447,729 689,813 705,203 3,749,585 Net Assets Invested in Capital Assets, Net of Related Debt 16 2,314 983,655 730,786 5,710 1,722,481 Restricted 388,913 2,314 283,881 744,765 1,451 1,421,324 Unrestricted 9,146 (2,314) 318,548 275,028 11,280 611,688 Total Net Assets $ 398,075 $ 2,314 $ 1,586,084 $ 1,750,579 $ 18,441 $ 3,755,493
ag04m88
61

STATE OF TENNESSEE NOTES TO THE FINANCIAL STATEMENTS (Continued)
JUNE 30, 2004
Condensed Statement of Activities Component Units
Program Revenues______________ Charges Operating Capital for Grants and Grants and Functions/Programs Expenses Services Contributions Contributions Component Units: Housing Development Agency $ 257,141 $ 105,937 $ 143,463 Tennessee Education Lottery 395,254 393,010 4,363 Board of Regents 1,576,409 563,166 364,753 $ 31,762 University of Tennessee 1,378,761 393,990 576,993 36,979 Nonmajor Component Units 157,866 54,638 61,836 _________ Total $ 3,765,431 $ 1,510,741 $ 1,151,408 $ 68,741
General Revenues: Payments from Primary Government Unrestricted Grants and Contributions Unrestricted Investment Earnings Miscellaneous Total General Revenues Contributions to Permanent Funds Change in Net Assets Net Assets – July 1 Net Assets – June 30
Significant transactions between the major component units–Tennessee Board of Regents (TBR), University of Tennessee (UT) and the Tennessee Education Lottery Corporation (TELC)–and the primary government consist of the following:
State appropriations from the Education Fund in the amount of $623.1 million were made to the TBR and $417.7 million to the UT. Capital project expenditures in the amount of $41.9 million were made for the TBR and $18.8 million to the UT in the form of expenditures in the capital projects fund for projects at these school systems. The TBR paid the primary government $13.6 million to reimburse the state for projects that were not a part of the capital appropriations.
The TELC generated net lottery proceeds of $123.3 million for the State’s Lottery for Education Account.
The most significant transaction among component units is that in which the Tennessee State School Bond Authority, a nonmajor component unit, makes loans to the University of Tennessee and the Tennessee Board of Regents to finance certain capital projects. At June 30, 2004, the Authority’s loan receivable (expressed in thousands) consisted of: Current NoncurrentTennessee Board of Regents $ 9,993 $ 237,786 University of Tennessee 12,427 217,661 Total $ 22,420 $ 455,447
ag04m88
62

STATE OF TENNESSEE NOTES TO THE FINANCIAL STATEMENTS (Continued)
JUNE 30, 2004
Net (Expense) Revenue and Changes in Net Assets________________ Housing Tennessee Board University Nonmajor Development Education of of Component Agency Lottery Regents Tennessee Units Total $ (7,741) $ (7,741) $ 2,119 2,119 $ (616,728) (616,728) $ (370,799) (370,799) _________ _______ ___________ ___________ $ (41,392) (41,392) (7,741) 2,119 (616,728) (370,799) (41,392) (1,034,541) 625,339 416,422 46,230 1,087,991 30,445 5,405 75 35,925 100 195 8,298 8,287 85 16,965 _________ _______ 8,854 __________ ________ 8,854 100 195 672,936 430,114 46,390 1,149,735 _________ _______ 8,008 19,728 ________ 27,736 (7,641) 2,314 64,216 79,043 4,998 142,930 405,716 _______ 1,521,868 1,671,536 13,443 3,612,563 $ 398,075 $ 2,314 $ 1,586,084 $ 1,750,579 $ 18,441 $ 3,755,493
ag04m88
63

STATE OF TENNESSEE NOTES TO THE FINANCIAL STATEMENTS (Continued)
JUNE 30, 2004
K. Major component units – long term debt
Tennessee Housing Development Agency (THDA) Bonds Payable and Notes Payable at June 30, 2004, are shown below (expressed in thousands):
Mortgage finance program revenue bonds, various Series, 1.1% to 7.93%, due in amounts of principal and interest ranging from $164.082 million in 2005 to $97.102 million in 2035 $ 1,500,168 Less: Unamortized bond refunding costs (10,869) Net Bonds Payable $ 1,489,299 Homeownership Program Convertible Drawdown Notes, at 1.206% interest rate due December 8, 2005 $ 273,240 The revenue bonds and notes listed above are not obligations of the State. They are secured by pledge from the facilities to which they relate and by certain other revenues, fees and assets of the THDA.
Bond sales during the year ended June 30, 2004, included the following issues:
July 2003 – Program bonds of $60 million September 2003 – Program bonds of $191.885 million November 2003 – Program Bonds of $75 million March 2004 – Program Bonds of $80 million
On July 31, 2003, the agency issued $60 million in Homeownership Program Bonds, Issue 2003 A & B and used $27.07 million to redeem notes. On September 4, 2003, the agency issued $191.885 million in Mortgage Finance Bonds, Issue 2003 A. On September 17, 2003, the agency used these bonds and other funds to redeem 1993 A bonds. On November 5, 2003, the agency issued $75 million in Homeownership Program Bonds, Issue 2003–3 A and B. On November 13, 2003, the agency used $37.555 million of these bonds to redeem notes. On March 4, 2004, the agency issued $80 million in Homeownership Program Bonds, Issue 2004–1. On March 11, 2004, the agency used $47.29 million of these bonds to redeem notes. Current Refundings During the year ended June 30, 2004, bonds were retired at par before maturity in the Mortgage Finance Program in the amount of $49.335 million and in the Homeownership Program in the amount of $91.623 million. The respective carrying values of the bonds were $49.016 million and $90.982 million. This resulted in an expense to the Mortgage Finance Program of $319 thousand and the Homeownership Program of $641 thousand. On July 1, 2003, the agency used $190.465 million of Single Family Mortgage Program Notes, 2002CN–1, to refund bonds previously issued in the Mortgage Finance Program and the Homeownership Program (this amount consists of $180.485 million early redemption and $9.980 million current maturities). The carrying amount of these bonds was $188.992 million. The refunding resulted in a difference of $1.473 million between the reacquisition price and the net carrying amount of the old debt. A portion of these notes were refunded with bonds on November 13, 2003, March 11, 2004, and after year-end.
ag04m88
64

STATE OF TENNESSEE NOTES TO THE FINANCIAL STATEMENTS (Continued)
JUNE 30, 2004
On July 31, 2003, the agency issued $60 million in Homeownership Program Bonds, Issue 2003–2 A and B. On August 14, 2003, the agency used $27.07 million of these bonds to partially refund the convertible drawdown notes, 2002CN-1, which were used January 2, 2003 to refund certain bonds previously issued in the Mortgage Finance Program and the Homeownership Program. The refunding reduced the agency’s debt service by $2.695 million over the next 28 years, and the agency realized an economic gain (the difference between the present values of the old and new debt service payments) of $4.924 million. On September 4, 2003, the agency issued $191.885 million in Mortgage Finance Program Bonds, Issue 2003 A to refund $152.67 million of the 1993 Series A bonds. Mortgage prepayments and excess reserves were used to call $39.25 million of the bonds at par. The carrying amount of these bonds was $191.219 million. A call premium of $3.053 million was paid on the redemption of these bonds. The refunding resulted in a difference of $3.754 million between the reacquisition price and the net carrying amount of the old debt. This difference, reported in the accompanying financial statements as a deduction from bonds payable, is being charged to operations through the year 2028. The refunding increased the agency’s debt service by $27.458 million over the next 25 years, but the agency realized an economic gain (the difference between the present values of the old and new debt service payments) of $7.5 million. On November 3, 2003, the agency used $89.355 million of Single Family Mortgage Program Notes, 2002CN–1, to refund bonds previously issued in the Mortgage Finance Program and the Homeownership Program. The carrying amount of these bonds was $88.676 million. The refunding resulted in a difference of $679 thousand between the reacquisition price and the net carrying amount of the old debt. Because notes were used to refund long-term bonds, neither the change in debt service nor the economic gain or loss disclosures are appropriate. On November 5, 2003, the agency issued $75 million in Homeownership Program Bonds, Issue 2003–3 A and B. On November 13, 2003, the agency used $37.555 million of these bonds to partially refund the convertible drawdown notes, 2002CN–1, which were used January 2, 2003 and July 1, 2003 to refund certain bonds previously issued in the Mortgage Finance Program and the Homeownership Program. The refunding increased the agency’s debt service by $6.528 million over the next 30 years, but the agency realized an economic gain (the difference between the present values of the old and new debt service payments) of $4 million. On January 2, 2004, the agency used $27.7 million of Single Family Mortgage Program Notes, 2002CN–1, to refund bonds previously issued in the Mortgage Finance Program and the Homeownership Program. The carrying amount of these bonds was $27.534 million. The refunding resulted in a difference of $166 thousand between the reacquisition price and the net carrying amount of the old debt. Because notes were used to refund long-term bonds, neither the change in debt service nor the economic gain or loss disclosures are appropriate. On March 4, 2004, the agency issued $80 million in Homeownership Program Bonds, Issue 2004–1. On March 11, 2004, the agency used $47.29 million of these bonds to partially refund the convertible drawdown notes, 2002CN–1, which were used July 1, 2003 to refund certain bonds previously issued in the Mortgage Finance Program. The refunding increased the agency’s debt service by $3.918 million over the next 22.5 years, but the agency realized an economic gain (the difference between the present values of the old and new debt service payments) of $5.638 million. On April 1, 2004, the agency used $26.565 million of Single Family Mortgage Program Notes, 2002CN–1, to refund bonds previously issued in the Mortgage Finance Program and the Homeownership Program. The carrying amount of these bonds was $26.372 million. The refunding resulted in a difference of $193 thousand between the reacquisition price and the net carrying amount of the old debt. Because notes were used to refund long-term bonds, neither the change in debt service nor the economic gain or loss disclosures are appropriate.
ag04m88
65

STATE OF TENNESSEE NOTES TO THE FINANCIAL STATEMENTS (Continued)
JUNE 30, 2004
Debt Service requirements to maturity for revenue bonds payable at June 30, 2004, are as follows (expressed in thousands):
For the Year(s) _____Revenue Bonds_____ Total Ended June 30_ Principal Interest Requirements 2005 $ 90,656 $ 73,426 $ 164,082 2006 51,568 72,984 124,552 2007 51,887 71,712 123,599 2008 50,166 70,279 120,445 2009 46,111 65,635 111,746 2010-2014 198,524 287,928 486,452 2015-2019 177,129 241,015 418,144 2020-2024 245,894 197,424 443,318 2025-2029 136,073 132,900 268,973 2030-2034 344,986 70,469 415,455 2035 94,610 2,492 97,102 $ 1,487,604 $ 1,286,264 $ 2,773,868
The above principal for revenue bonds is less than that presented on the accompanying financial statements by $1.695 million. Of this amount, $12.564 million represents accretion to date of interest on deep discount bonds in those years preceding the first principal payment on these bonds. This accretion has been reported above as interest in the years on which the bonds mature (2005-2009). In addition, $10.869 million, which is a deduction from bonds payable for the deferred amount on refundings, is not reflected in the above presentation. Notes Program The Single Family Mortgage Notes Trust Indenture, dated December 1, 1997 (the “Trust Indenture”), provides for the issuance of agency drawdown notes with a maximum aggregate principal amount of $65 million. On April 1, 1999 the Trust Indenture was supplemented providing for the maximum aggregate principal amount of $200 million. On December 1, 2002, the Trust Indenture was supplemented to provide a maximum aggregate principal amount of $450 million. The notes bear interest, payable on the second Thursday of each succeeding month with respect to the principal amount drawn down by the agency. The interest rate is equal to ninety percent (90%) of the bond equivalent yield as determined on the related rate date. On December 1, 2002, the interest rate was changed to ninety-nine percent (99%) of the bond equivalent yield as determined on the related rate date. The following table is a summary of the note activity for the year ended June 30, 2004 (expressed in thousands). Beginning Balance Additions Reductions Ending Balance $51,070 $334,085 $111,915 $273,240
The $273.24 million of notes outstanding at year end are Series 2002CN-1, which mature on December 8, 2005.
ag04m88
66

STATE OF TENNESSEE NOTES TO THE FINANCIAL STATEMENTS (Continued)
JUNE 30, 2004
L. Nonmajor component units – long term debt
Tennessee Local Development Authority (TLDA) Bonds Payable and Notes Payable at June 30, 2004, are shown below (expressed in thousands):
Revenue bonds, 1.95% to 5.125%, due in generally decreasing amounts of principal and interest from $4.511 million in 2005 to $16 thousand in 2022 $ 34,463
Less: Unamortized bond refunding costs __(1,689) Net Bonds Payable $ 32,774
Revenue bond anticipation notes, $48.134 million at 3% due May 31, 2005 $ 48,134
The revenue bonds and revenue bond anticipation notes listed above are not obligations of the State. They are secured by pledge of resources from the facilities to which they relate and by certain other revenues, fees and assets of the TLDA.
Prior Year Defeasance of Debt. In prior years, the authority defeased certain revenue bonds of the Community Provider Programs by placing the proceeds of general obligation notes in an irrevocable trust to provide for all future debt service payments on the defeased bonds. Accordingly, the trust account assets and the liability for the defeased bonds are not included in the authority's financial statements. On June 30, 2004, $8.305 million of bonds outstanding are considered defeased.
Debt Service requirements to maturity for TLDA’s revenue bonds payable at June 30, 2004, are as follows (expressed in thousands):
For the Year(s) _____Revenue Bonds_____ Total Ended June 30_ Principal Interest Requirements 2005 $ 2,922 $ 1,589 $ 4,511 2006 2,807 1,468 4,275 2007 2,457 1,357 3,814 2008 2,552 1,260 3,812 2009 2,667 1,145 3,812 2010-2014 12,467 3,951 16,418 2015-2019 7,973 1,128 9,101 2020-2022 618 51 669 __________ _________ ____________ $ 34,463 $ 11,949 $ 46,412
The above principal for revenue bonds does not reflect a $1.689 million deduction from bonds payable for the deferred amount on refunding.
ag04m88
67

STATE OF TENNESSEE NOTES TO THE FINANCIAL STATEMENTS (Continued)
JUNE 30, 2004
Tennessee State School Bond Authority (TSSBA)
Bonds and Commercial Paper Payable at June 30, 2004, are shown below (expressed in thousands):
Revenue bonds, various Series, 1.3% to 7.75%, due in decreasing amounts of principal and interest from $47.396 million in 2005 to $2.996 million in 2034 $ 536,763 Less: Unamortized bond refunding costs ___(9,378) Net Bonds Payable $ 527,385 Commercial paper, interest rates ranging from .75% to 1.28% for tax exempt and 1.03% to 1.28% for taxable varying maturities $ 32,156
The revenue bonds and commercial paper listed above are not obligations of the State. They are secured by pledge of resources from the facilities to which they relate and by certain other revenues, fees and assets of the TSSBA.
On December 23, 2003, the authority issued $2.445 million of Qualified Zone Academy Bonds (QZAB) to finance improvement loans for qualifying primary and secondary (K-12) schools in the state. The bonds are part of a federal government program administered by the Tennessee Department of Education in which a federal tax credit is given to investors in lieu of interest on bonds. On each December 23rd, the 2003 QZAB borrowers make annual principal payments into a bond fund held by the State Treasurer to pay the bonds at maturity on December 23, 2018.
On March 25, 2004, the authority issued three series of bonds–2004 Series A, B and C. 2004 Series B tax-exempt bonds in the amount of $60.575 million was issued to redeem $42.415 million of commercial paper and 2004 Series C taxable bonds in the amount of $37.23 million was used to redeem $8.98 million of commercial paper. The balance of the proceeds was used for new loans and to pay cost of issuance.
2004 Series A bonds were issued in the amount of $67.965 million for a current and an advance refunding. In addition to the bond proceeds, a $963 thousand debt service reserve contribution, $3.423 million in borrower prepayments, and $10 thousand equity contribution were used to currently refund $3.45 million of 1967 Series A bonds and $1.17 million of 1987 Series A bonds. In addition, a majority of the 1996 Series A bonds in the amount of $62.795 million were advance refunded. The monies were placed in an irrevocable trust and the bonds are considered to be defeased. The refundings resulted in a difference between reacquisition price and the net carrying amount of the old debt of $7.31 million for the advance refunding and $20 thousand for the current refunding. This amount is reported as a deduction from bonds payable and is being charged to operations through the year 2026 using the straight-line method. The refundings were completed to reduce the authority’s total debt service payments over the next 22 years by $6.028 million and to obtain an economic gain (difference between the present values of the old and new debt service payments) of $1.661 million.
Prior-Year Defeasance of Debt. In prior years, the authority defeased certain revenue bonds by placing the proceeds of new bonds in an irrevocable trust to provide for all future debt service payments on the old bonds. Accordingly, the trust account assets and the liability for the defeased bonds are not included in the authority's financial statements. On June 30, 2004, $38.39 million of bonds outstanding are considered defeased.
ag04m88
68

STATE OF TENNESSEE NOTES TO THE FINANCIAL STATEMENTS (Continued)
JUNE 30, 2004
Debt Service requirements to maturity for TSSBA’s revenue bonds payable at June 30, 2004, are as follows (expressed in thousands):
For the Year(s) Revenue Bonds Total Ended June 30 Principal Interest Requirements 2005 $ 21,205 $ 26,191 $ 47,396 2006 20,756 24,622 45,378 2007 21,065 23,786 44,851 2008 21,863 23,031 44,894 2009 22,726 22,202 44,928 2010-2014 118,673 88,140 206,813 2015-2019 112,085 61,775 173,860 2020-2024 91,458 38,425 129,883 2025-2029 66,642 18,378 85,020 2030-2034 31,971 3,871 35,842 $ 528,444 $ 330,421 $ 858,865
The above principal for revenue bonds is more than that presented on the accompanying financial statements by $1.059 million. Of this amount, $8.319 million represents accretion to date of interest on deep discount bonds in those years preceding the first principal payment on these bonds. This accretion has been reported above as interest in the years on which the bonds mature (2005-2010). In addition, $9.378 million, which is a deduction from bonds payable for the deferred amount on refunding, is not reflected in above presentation.
Commercial Paper Program. The Tennessee State School Bond Authority issues short-term debt to finance certain capital projects for the State of Tennessee's higher education institutions. The maximum amount of principal may not exceed $150 million. At June 30, 2004, $30.836 million of tax-exempt and $1.32 million of taxable commercial paper was outstanding. The commercial paper is a special obligation of the Authority. The commercial paper dealer is J. P. Morgan. Commercial paper principal and interest may be paid from: (i) the proceeds of draws on the Liquidity Facility, (ii) Available Revenues, (iii) the moneys and securities (if any) on deposit in the commercial paper and reimbursement account and in the Debt Service Fund, (iv) the moneys and securities (if any) on deposit in the Project Construction Account for such projects, and (v) the proceeds of bonds, notes or other evidences of indebtedness to the extent set aside to make such payments. The maturity of the paper may not exceed 270 days and the maximum interest rate may not exceed 12%. Interest rates vary ranging from .75% to 1.28% during the fiscal year. Upon maturity, the paper is remarketed by the commercial paper dealer, redeemed, or extinguished with long-term debt. The Commercial Paper bears interest at a variable rate that is paid upon maturity. The Commercial Paper liquidity provider, under an Advance Agreement, is Westdeutsche Landesbank Girozentrale, New York branch. The total available commitment is $152.25 million. The obligation of Westdeutsche Landesbank Girozentrale is to purchase unremarketed Commercial Paper. Commercial paper payable under this Program qualifies for reporting as a non-current liability because provisions in the Commercial Paper Resolution permit refinancing the paper on a long-term basis.
ag04m88
69

STATE OF TENNESSEE NOTES TO THE FINANCIAL STATEMENTS (Continued)
JUNE 30, 2004
M. Component units – changes in long term obligations
A summary of changes in long term obligations for the year ended June 30, 2004, follows (expressed in thousands). Changes In Long Term Obligations
Amounts Beginning Ending Due Within Balance Additions Reductions Balance One Year Revenue Bonds, Notes and Loans Payable: University of Tennessee Loans and Notes Payable $ 215,734 $ 142,524 $ (128,095) $ 230,163 $ 12,570 Tennessee Board of Regents Loans and Notes Payable 238,361 44,590 (31,782) 251,169 12,141 Tennessee Housing Development Agency Bonds Payable 1,776,991 413,846 (690,669) 1,500,168 95,459 Less Deferred Amount on Refunding (7,485) (4,246) 862 (10,869) Tennessee Housing Development Agency Notes Payable 51,070 334,085 (111,915) 273,240 Nonmajor Component Units Bonds, Notes, and Loans Payable 635,474 265,838 (214,755) 686,557 76,891 Less Deferred Amount on Refunding (4,086) (7,784) 351 (11,519) ________ Total Revenue Bonds, Notes and Loans Payable $ 2,906,059 $ 1,188,853 $ (1,176,003) $ 2,918,909 $ 197,061 University of Tennessee Compensated Absences 63,758 41,339 (42,125) 62,972 42,125 University of Tennessee Due to Grantors, Deferred Revenue, and Annuities Payable 60,402 1,518 (1,764) 60,156 Tennessee Board of Regents Compensated Absences 44,636 14,639 (15,326) 43,949 11,008 Tennessee Board of Regents Due to Grantors and Deferred Revenue 20,167 1,314 (1,250) 20,231 Tennessee Housing Development Agency Escrow Deposits, Arbitrage Rebate Payable, and Deferred Revenue 17,218 10,020 (5,575) 21,663 1,343 Tennessee Housing Development Agency Compensated Absences 627 334 (389) 572 275 Tennessee Education Lottery Deferred Lease 1,027 (44) 983 68 Nonmajor Component Units Compensated Absences 1,532 1,376 (1,413) 1,495 845 Nonmajor Component Units Capital Leases 129 2 (103) 28 20 Component Units Long-Term Obligations $ 3,114,528 $ 1,260,422 $ (1,243,992) $ 3,130,958 $ 252,745
ag04m88
70

STATE OF TENNESSEE NOTES TO THE FINANCIAL STATEMENTS (Continued)
JUNE 30, 2004
The Tennessee State School Bond Authority, a nonmajor component unit, issues revenue bonds to make loans to higher education institutions in the State. The nonmajor component units’ bonds payable includes the indebtedness on which the University of Tennessee and the Tennessee Board of Regents’ loans payable are based. The University of Tennessee component units are not included in the above schedule. At year end, University of Tennessee foundations’ long-term liabilities amounted to $147.56 million ($2.744 million due within one year).
N. Endowments – component units If a donor has not provided specific instructions to the University of Tennessee and the Tennessee Board of Regents institutions, state law permits each institution to authorize for expenditure the net appreciation (realized and unrealized) of the investments of endowment funds. When administering its power to spend net appreciation, the institution is required to consider the institution’s long-term and short-term needs, present and anticipated financial requirements, expected total return on its investments, price-level trends, and general economic conditions. Any net appreciation that is spent is required to be spent for the purposes for which the endowment was established. The University of Tennessee chooses to spend only a portion of the investment income (including changes in the value of investments) each year. Under the spending plan established by the University, 5 percent of a three-year moving average of the fair value of endowment investments has been authorized for expenditure. The remaining amount, if any, is retained to be used in future years when the amount computed using the spending plan exceeds the investment income. At June 30, 2004, net appreciation of $135.258 million is available to be spent, of which $130.516 million is restricted to specific purposes. While some Tennessee Board of Regents institutions/foundations spend all investment income, others choose to spend only a portion of the investment income (including changes in the value of investments) each year. Under the various spending plans established by each institution/foundation, different percentages and/or amounts have been authorized for expenditure. The remaining amounts, if any, are retained to be used in future years when the amounts computed using the spending plans exceed the investment income. At June 30, 2004, net appreciation of $7.909 million is available to be spent, of which $7.614 million is restricted to specific purposes.
NOTE 6 – Other information A. Risk management
1. Teacher Group Insurance - The Teacher Group Insurance Fund, a public entity risk pool, was established in January 1986 to provide a program of health insurance coverage for the teachers and other education system employees of the political subdivisions of the State. In accordance with Tennessee Code Annotated 8-27-302 all local education agencies are eligible to participate. Fund members at June 30, 2004, included 122 local education agencies and two education cooperatives, with 42,528 teachers and support personnel, and 3,861 retirees enrolled in one of three health care options: preferred provider organization plan (PPO), point of service plan (POS), or a health maintenance organization (HMO). The State retains an immaterial risk of loss by this fund.
The Teacher Group Insurance Fund assumes responsibility for: determining plan benefits and eligibility, establishing premiums sufficient to fund plan obligations, recording and reporting financial transactions accurately, reporting enrollment to vendors, processing of claims submitted for services provided to plan participants, communicating with plan participants, and complying with appropriate state and federal laws and regulations. Plan participants are required to: pay premiums on time, file claims for services received, report changes in eligibility of themselves or their dependents, and ensure that only eligible expenses are paid by the plan. Individuals who cancel coverage may be required to demonstrate a qualifying event to rejoin the plan. Employers must wait twenty-four months before rejoining the plan should the employer elect to withdraw from the plan. In the case of individuals or groups rejoining the plan, a preexisting condition exclusion currently applies.
ag04m88
71

STATE OF TENNESSEE NOTES TO THE FINANCIAL STATEMENTS (Continued)
JUNE 30, 2004
The Teacher Group Insurance Fund establishes claims liabilities for self-insured options based on estimates of the ultimate cost of claims that have been reported but not settled, and of claims that have been incurred but not reported. Teachers and providers have 13 months to file medical claims. The process used to compute claims liabilities does not necessarily result in an exact amount. Claims liabilities are recomputed periodically using actuarial and statistical techniques to produce current estimates. At June 30, 2004, the Local Education Insurance Committee had established a reserve requirement, based upon claims payments for the prior 12 months, of 10% for the PPO, POS and HMO options. Adjustments to claims liabilities are charged or credited to expense in the period in which they are made. The Teacher Group Insurance Fund considers investment income in determining if a premium deficiency exists.
The Teacher Group Insurance Fund issues separate financial statements that may be obtained by writing the Department of Finance and Administration, Division of Accounts, 312 Eighth Avenue North, 14th Floor William R. Snodgrass Tennessee Tower, Nashville, TN 37243-0298 or by calling (615) 741-0431.
As discussed above, the Teacher Group Insurance Fund establishes a liability for both reported and unreported insured events, which includes estimates of both future payments of losses and related claim adjustment expenses. The following represents changes in those aggregate liabilities during the past two years (expressed in thousands):
2004 2003 Unpaid Claims at Beginning of Year $ 22,823 $ 23,943 Incurred Claims: Provision for insured events of the current year 263,736 228,230 Increase (decrease) in provision for insured events of prior years 854 (4,939) Total Incurred Claims Expenses 264,590 223,291 Payments: Claims attributable to insured events of the current year 237,363 205,407 Claims attributable to insured events of prior years 23,677 19,004 Total Payments 261,040 224,411 Total Unpaid Claims at End of the Year $ 26,373 $ 22,823
2. Local Government Group Insurance - The Local Government Group Insurance Fund, a public entity risk pool, was established in July 1991 to provide a program of health insurance coverage for employees of local governments and quasi-governmental organizations that were established for the primary purpose of providing services for or on the behalf of state and local governments. In accordance with Tennessee Code Annotated 8-27-207 all local governments and quasi-governmental organizations described above are eligible to participate. Fund members at June 30, 2004, included 39 counties, 88 municipalities and 227 quasi-governmental organizations, with 15,260 employees and 418 retirees maintaining coverage through one of four options: preferred provider plan, PPO limited plan, point of service plan, or a health maintenance organization. The State does not retain any risk for losses by this fund.
The Local Government Group Insurance Fund assumes responsibility for: determining plan benefits and eligibility, establishing premiums sufficient to fund plan obligations, recording and reporting financial transactions accurately, reporting enrollment to vendors, the processing of claims submitted for services provided to plan participants, communicating with plan participants, and complying with appropriate state and federal laws and regulations. Plan participants are required to: pay premiums on time, file claims for services received, report changes in eligibility of themselves or their dependents, and ensure that only eligible expenses are paid by the plan. Individuals who cancel
ag04m88
72
STATE OF TENNESSEE NOTES TO THE FINANCIAL STATEMENTS (Continued)
JUNE 30, 2004
coverage may be required to demonstrate a qualifying event to rejoin the plan. Employers must wait twenty-four months before rejoining the plan should the employer elect to withdraw from the plan. In the case of individuals or groups rejoining the plan, a preexisting condition exclusion currently applies.
The Local Government Group Insurance Fund establishes claims liabilities for self-insured options based on estimates of the ultimate cost of claims that have been reported but not settled, and of claims that have been incurred but not reported. Employees and providers have 13 months to file medical claims. The process used to compute claims liabilities does not necessarily result in an exact amount. Claims liabilities are recomputed periodically using actuarial and statistical techniques to produce current estimates. At June 30, 2004, the Local Government Insurance Committee had established a reserve requirement, based upon claims payments for the prior 12 months, of 10% for the PPO, POS and HMO options. Adjustments to claims liabilities are charged or credited to expense in the period in which they are made. The Local Government Group Insurance Fund considers investment income in determining if a premium deficiency exists. The Local Government Group Insurance Fund issues separate financial statements that may be obtained by writing the Department of Finance and Administration, Division of Accounts, 312 Eighth Avenue North, 14th Floor William R. Snodgrass Tennessee Tower, Nashville, TN 37243-0298 or by calling (615) 741-0431.
As discussed above, the Local Government Group Insurance Fund establishes a liability for both reported and unreported insured events, which includes estimates of both future payments of losses and related claim adjustment expenses. The following represents changes in those aggregate liabilities during the past two years (expressed in thousands):
2004 2003 Unpaid Claims at Beginning of Year $ 10,984 $ 11,807 Incurred Claims: Provision for insured events of the current year 87,809 99,857 Increase (decrease) in provision for insured events of prior years (2,636) (2,177) Total Incurred Claims Expenses 85,173 97,680 Payments: Claims attributable to insured events of the current year 79,028 88,873 Claims attributable to insured events of prior years 8,348 9,630 Total Payments 87,376 98,503 Total Unpaid Claims at End of the Year $ 8,781 $ 10,984
3. Risk Management - It is the policy of the State not to purchase commercial insurance for the risks of losses for general liability, automobile liability, professional malpractice and workers' compensation. The State management believes it is more economical to manage its risks internally and set aside assets for claim settlement in its internal service fund, the Risk Management Fund (RMF). The State purchases commercial insurance for real property, flood, earthquake, and builder’s risk losses and surety bond coverage on the State’s officials and employees. The RMF is also responsible for claims for damages to state owned property up to the amount of the property insurance aggregate deductible amount. The insurance policy deductibles vary from $25,000 per occurrence to an aggregate of $7.5 million. All agencies and authorities of the State participate in RMF, except for the Dairy Promotion Board, Certified Cotton Growers’ Organization (a component unit) and the Tennessee Education Lottery Corporation (a component unit). RMF allocates the cost of providing claims servicing and claims payment by charging a premium to each agency based on a percentage of each organization's expected loss costs which include
ag04m88
73

STATE OF TENNESSEE NOTES TO THE FINANCIAL STATEMENTS (Continued)
JUNE 30, 2004
both experience and exposures. This charge considers recent trends in actual claims experience of the State as a whole.
RMF liabilities are reported when it is probable that a loss has occurred and the amount of that loss can be reasonably estimated. Liabilities include an amount for claims that have been incurred but not reported. Because actual claims liabilities depend on such complex factors as inflation, changes in legal doctrines, and damage awards, the process does not result in an exact amount. Claims liabilities are reevaluated annually to take into consideration recently settled claims, the frequency of claims, and other economic and social factors. At June 30, 2004, the present value of the casualty liability as actuarially determined was $84.739 million (discounted at 3.0%). An additional liability of $7.818 million for incurred property and other losses not considered in the actuary estimates has been included in the total claims liability at June 30, 2004. Changes in the balances of claims liabilities during fiscal years 2003 and 2004 were as follows (expressed in thousands):
Beginning Current Year Balance at of Fiscal Year Claims and Claim Fiscal Liability Changes in Estimates Payments Year-End 2002-2003 $ 80,910 $ 35,481 $ (29,054) $ 87,337 2003-2004 $ 87,337 $ 33,141 $ (27,921) $ 92,557
At June 30, 2004, RMF held $101.1 million in cash and cash equivalents designated for payment of these claims.
4. Employee Group Insurance - The Employee Group Insurance Fund, an entity other than a pool, was established in 1979 to provide a program of health insurance coverage for the employees of the State with the risk retained by the State, therefore it is accounted for as an Internal Service Fund. In accordance with Tennessee Code Annotated 8-27-201 all state employees, retirees, and former employees with work related injuries are eligible to participate. Fund members at June 30, 2004, included 65,802 employees and 6,602 retirees enrolled in one of three options: preferred provider organization plan (PPO), point of service plan (POS), or health maintenance organization (HMO).
The Employee Group Insurance Fund establishes claims liabilities for self-insured options based on estimates of the ultimate cost of claims that have been reported but not settled, and of claims that have been incurred but not reported. Employees and providers have 13 months to file medical claims. The process used to compute claims liabilities does not necessarily result in an exact amount. Claims liabilities are recomputed periodically using actuarial and statistical techniques to produce current estimates. At June 30, 2004, the State Insurance Committee had established a reserve requirement, based upon claims payments for the prior 12 months, of 10% for the PPO, POS and HMO options. Adjustments to claims liabilities are charged or credited to expense in the period in which they are made. The Employee Group Insurance Fund considers investment income in determining if a premium deficiency exists.
As discussed above, the Employee Group Insurance Fund establishes a liability for both reported and unreported insured events, which includes estimates of both future payments of losses and related claim adjustment expenses. The following represents changes in those aggregate liabilities during the past two years (expressed in thousands):
ag04m88
74

STATE OF TENNESSEE NOTES TO THE FINANCIAL STATEMENTS (Continued)
JUNE 30, 2004
2004 2003 Unpaid Claims at Beginning of Year $ 42,806 $ 45,537 Incurred Claims: Provision for insured events of the current year 476,729 428,064 Increase (decrease) in provision for insured events of prior years (3,206) (7,166) Total Incurred Claims Expenses 473,523 420,898 Payments: Claims attributable to insured events of the current year 429,056 385,258 Claims attributable to insured events of prior years 39,600 38,371 Total Payments 468,656 423,629 Total Unpaid Claims at End of the Year $ 47,673 $ 42,806
5. Medicare Supplement Insurance – In 1988, the State of Tennessee adopted legislation authorizing the provision of Medicare Supplement coverage for qualified retired state employees and teachers. Instituted in January 1989, the coverage was offered on a fully insured basis through December 2000. On January 1, 2001, the financial arrangement was converted to self-insured and a third plan option offered to participants.
In accordance with Tennessee Code Annotated 8-27-701, et. seq, the State Insurance Committee established a Medicare Supplement Insurance Fund, a public entity risk pool, on January 1, 2001. Fund members at June 30, 2004, include 22,497 retirees and dependents who selected one of three plan offerings; Plan One (NAIC Plan D), Plan Two (NAIC Plan H) and Plan Three (a PPO maintenance of benefit option).
The Medicare Supplement Insurance Fund assumes responsibility for determining plan benefits and eligibility, establishing premiums sufficient for fund plan obligations, recording and reporting financial transactions accurately, reporting enrollment to vendors, processing of claims submitted for services provided to plan participants, communicating with plan participants and complying with appropriate state and federal law and regulation. Plan participants are required to: pay premiums on time, provide for the filing of claims for services received, and report changes in eligibility of themselves and their dependents.
The Medicare Supplement Insurance Fund establishes claims liabilities for the self-insured coverage based on estimates of claims that have been reported but not settled, and of claims that have been incurred but not reported. Claims liabilities are recomputed periodically using actuarial and statistical techniques to produce current estimates. At June 30, 2004, reserve requirements were established of 14%, based upon claim payments for the prior 12 months. Adjustments to claims liabilities are charged or credited to expense in the period in which they are made. The Medicare Supplement Insurance Fund considers investment income in determining if a premium deficiency exists.
The Medicare Supplement Insurance Fund issues separate financial statements that may be obtained by writing the Department of Finance and Administration, Division of Accounts, 312 Eighth Avenue North, 14th Floor William R. Snodgrass Tennessee Tower, Nashville, TN 37243-0298 or by calling (615) 741-0431.
As discussed above, the Medicare Supplement Insurance Fund establishes a liability for both reported and unreported insured events, which includes estimates of both future payments of losses and related claim adjustment expenses. The following represents changes in those aggregate liabilities during the past two years (expressed in thousands):
ag04m88
75

STATE OF TENNESSEE NOTES TO THE FINANCIAL STATEMENTS (Continued)
JUNE 30, 2004
2004 2003 Unpaid Claims at Beginning of Year $ 5,533 $ 4,867 Incurred Claims: Provision for insured events of the current year 38,155 34,580 Increase (decrease) in provision for insured events of prior years (794) (169) Total Incurred Claims Expenses 37,361 34,411 Payments: Claims attributable to insured events of the current year 32,813 29,047 Claims attributable to insured events of prior years 4,739 4,698 Total Payments 37,552 33,745 Total Unpaid Claims at End of the Year $ 5,342 $ 5,533
B. Related organizations
The State’s officials are also responsible for appointing the members of the boards of other organizations, but the State’s accountability for these organizations does not extend beyond making appointments. The State appoints the board members of the Beech River Watershed Development Authority, Carroll County Watershed Authority, Goodwyn Institute Commission, Watkins Institute Commission, Tennessee Alliance for Fitness and Health, Tennessee Competitive Export Corporation, Insurance Guaranty Association, Tennessee Sports Hall of Fame, Local Neighborhood Development Corporations, Tennessee Holocaust Commission, Inc., and Sports Festival, Inc.
C. Jointly governed organizations
The State in conjunction with 34 other states and Puerto Rico are members of the Pest Control Compact.
The State in conjunction with 12 other states and Puerto Rico are members of the Southern Growth Policies Board. Tennessee paid $42,463 in fiscal year 2004 for membership dues. The Southern Regional Education Compact was entered into with 15 other states. Tennessee paid $18,000 in fiscal year 2004 for membership dues.
The Compact for Education was entered into with 49 other states, plus Puerto Rico, the Virgin Islands, American Samoa and District of Columbia. Tennessee paid $68,700 in fiscal year 2004 for membership dues.
The Interstate Mining Compact has 17 member states, including Tennessee. Tennessee paid $15,528 in fiscal year 2004 for membership dues. The Southern States Energy Board is comprised of 16 member states, including Tennessee, plus Puerto Rico and the Virgin Islands. Tennessee paid $34,267 in fiscal year 2004 for membership dues. The Southeast Interstate Low Level Radioactive Waste Compact has 7 member states, including Tennessee. The Chickasaw Trail Economic Development Compact has two member states in conjunction with one county in each State.
ag04m88
76

STATE OF TENNESSEE NOTES TO THE FINANCIAL STATEMENTS (Continued)
JUNE 30, 2004
D. Joint ventures
The State is a participant in a joint venture, the Tennessee-Tombigbee Waterway Development Compact, with the states of Alabama, Kentucky and Mississippi. The purpose of this compact is to promote the development of a navigable waterway connecting the Tennessee and Tombigbee Rivers and provide a nine foot navigable channel. The fiscal year end of the Tennessee Tombigbee Waterway is December 31. Financial statements for the Tennessee Tombigbee Waterway may be obtained at: P. O. Drawer 671, Columbus, MS 39703. Presented below is summary financial data for this joint venture (expressed in thousands): 2003 2002Current Assets $ 286 $ 271 Capital Assets 33 33 Total Assets 319 304 Invested in General Fixed Assets 33 33 Fund Balance 286 271 Total Liabilities and Fund Balance 319 304 Revenues 319 293 Expenditures 304 290 Excess of Revenues over (under) Expenditures 15 3 Beginning Fund Balance 271 268 Ending Fund Balance $ 286 $ 271
E. Post employment health insurance benefits
1. General - The State offers an opportunity to its employees and eligible retirees to participate in a self-insured
indemnity policy (preferred provider plan), a point of service plan, or health maintenance organizations. This post employment benefit is authorized under Tennessee Code Annotated 8-27-205. The indemnity policy provides benefits to plan participants in a comprehensive, major medical format involving a $300 calendar year deductible and a $1,300 per individual out-of-pocket limit. The plans incorporate typical provisions relating to utilization review, medical necessity, pre-existing conditions, coordination of benefits and subrogation of expenses. The plans offer benefit incentives for the use of designated providers and the plans maintain limitations on benefits provided for the treatment of mental illness and substance abuse.
2. Retirees - Retirees who are not yet eligible for Medicare benefits may continue participation in the plan subject to
certain length of service and participation requirements. Upon Medicare eligibility, the retiree is afforded the opportunity to participate in a self-insured supplement policy not associated with the plan. The State pays a service determined amount for retirees who participate in the state sponsored Medicare supplement policy.
The funds collected for the plan's operation are recorded in the employee group insurance account. The plan's premiums are intended to fund benefits on a pay-as-you-go basis and no specified reserves have been established to fund retiree health benefits. Current retiree premium rates are based upon the retiree’s length of service and range from 20 percent to 40 percent of the plan’s total premium. The State provides no direct funding of retiree health benefits.
During the 2003-2004 fiscal year, the State Plan provided approximately $55.6 million in benefits to an average of 6,433 retired employee participants.
ag04m88
77
STATE OF TENNESSEE NOTES TO THE FINANCIAL STATEMENTS (Continued)
JUNE 30, 2004
3. Cobra - Federal law requires large employers to continue health insurance benefits to employees who have
terminated employment for up to 18 months. The former employees must pay 102 percent of the total premium (employee plus employer share), funded on a pay as you go basis. Insurance coverage is not mandatory if the former employee is eligible for Medicare or has coverage with another group medical plan. The State covered an average of 266 former employees during fiscal year 2003-2004, and the State Plan paid approximately $2.5 million in benefits to this group.
F. Gain contingencies
In November 1998, Tennessee joined 45 other states, the District of Columbia and five territories in a settlement agreement against the nation's largest tobacco manufacturers, to seek redress against the tobacco companies for violations of state consumer and antitrust laws. The Master Settlement Agreement includes base payments to all states and territories totaling $206 billion from 1998 through 2023, and continues in perpetuity. Tennessee's share of the settlement is expected to be $4.8 billion through the year 2025. Third party lawsuits may affect future payments to Tennessee. Although Tennessee's share of the base payments may not change over time, the amount of the annual payment is subject to a number of modifications including adjustments for inflation and usage volumes. Some of the adjustments may result in increases in the payments (inflation, for example), while other adjustments will likely cause decreases in the payments (volume adjustments, for example). The net effect of these adjustments on future payments is unclear.
G. Pension plans
1. State Defined Benefit Plan - The State of Tennessee contributes to the State Employees, Teachers, and Higher Education Employees Pension Plan (SETHEEPP), a cost-sharing multiple employer defined benefit pension plan administered by the Tennessee Consolidated Retirement System (TCRS) and consisting of 140 participating employers. The TCRS provides retirement benefits as well as death and disability benefits to plan members and their beneficiaries. Benefits are determined by a formula using the member’s high five-year average salary and years of service. Members become eligible to retire at the age of 60 with five years of service or at any age with 30 years of service. A reduced retirement benefit is available to vested members who are at least 55 years of age or have 25 years of service. Disability benefits are available to active members with five years of service who become disabled and cannot engage in gainful employment. There is no service requirement for disability that is the result of an accident or injury occurring while the member was in the performance of duty. Members joining the plan on or after July 1, 1979 are vested after five years of service. Members joining prior to July 1, 1979 are vested after four years of service. Benefit provisions are established by state statute found in Title 8, Chapters 34-37 of the Tennessee Code Annotated (TCA). State statutes are amended by the Tennessee General Assembly. Cost of living adjustments (COLA) are provided each July based on the percentage change in the Consumer Price Index (CPI) during the previous calendar year. No COLA is granted if the CPI increases less than one-half percent; a COLA of one percent will be granted if the CPI increases between one-half percent and one percent; the maximum annual COLA is capped at three percent. The TCRS issues a publicly available financial report that includes financial statements and required supplementary information for SETHEEPP. That report may be obtained by writing to the Tennessee Treasury Department, Consolidated Retirement System, 10th Floor Andrew Jackson Building, Nashville, TN 37243-0230 or by calling (615) 741-7063.
Most plan members are noncontributory. The State of Tennessee is required to contribute at an actuarially determined rate. The current rate is 7.29% of annual covered payroll. The contribution requirements of the State of Tennessee are established and may be amended by the TCRS Board of Trustees. The State’s contributions to TCRS for the years ending June 30, 2004, 2003, and 2002, were $271.298 million, $264.321 million and $243.498 million respectively, equal to the required contributions for each year.
ag04m88
78

STATE OF TENNESSEE NOTES TO THE FINANCIAL STATEMENTS (Continued)
JUNE 30, 2004
2. Political Subdivision Defined Benefits Plan - TCRS administers the Political Subdivision Pension Plan (PSPP),
which is an agent multiple-employer defined benefit pension plan that covers employees of 418 participating political subdivisions. The PSPP provides retirement benefits as well as death and disability benefits to plan members and their beneficiaries. Benefits are determined by a formula using the member’s high five-year average salary and years of service. Members become eligible to retire at the age of 60 with five years of service or at any age with 30 years of service. A reduced retirement benefit is available to vested members who are at least 55 years of age or have 25 years of service. Disability benefits are available to active members with five years of service who become disabled and cannot engage in gainful employment. There is no service requirement for disability that is the result of an accident or injury occurring while the member was in the performance of duty. Members joining the plan prior to July 1, 1979, are vested after four years of service. Members joining on or after July 1, 1979, are vested upon completion of 10 years of service, unless five years vesting is authorized by resolution of the chief governing body. Benefit provisions are established and amended by state statute. Cost of living adjustments (COLA) are the same as provided by SETHEEPP except that the local government may elect (a) to provide no COLA benefits or (b) to provide COLA benefits under a non-compounding basis rather than the compounded basis applicable under SETHEEPP. Pursuant to Article Two, Section 24 of the Constitution of the State of Tennessee, the State cannot mandate costs on local governments. Any benefit improvement may be adopted by the governing body of a governmental entity participating in the TCRS.
The TCRS issues a publicly available financial report that includes financial statements and required supplementary information for PSPP. The PSPP report may be obtained by writing to the Tennessee Treasury Department, Consolidated Retirement System, 10th Floor Andrew Jackson Building, Nashville, TN 37243-0230 or by calling (615) 741-7063.
3. Defined Contribution Plan - The Optional Retirement Plan (ORP) as administered by the Tennessee Treasury Department is a defined contribution plan. The ORP was established by state statute in Title 8, Chapter 35, Part 4 of the TCA. This statute also sets out the plan provisions. State statutes are amended by the Tennessee General Assembly. The ORP was designed to provide benefits at retirement to faculty and staff of the Tennessee Board of Regents institutions and the University of Tennessee system who are exempt from the overtime provision of the Fair Labor Standards Act and who waive membership in the TCRS. In a defined contribution plan, benefits depend solely on amounts contributed to the plan plus investment earnings. Plan members are noncontributory. The State of Tennessee contributes 10% of the employee’s base salary up to the social security wage base and 11% above the social security wage base. The required contributions made by the State of Tennessee to the ORP were $74.7 million for the year ending June 30, 2004.
Members are immediately 100 percent vested in the employer contributions made pursuant to the ORP. The Treasury Department has selected three investment vendors who offer a variety of investment products in which members are responsible for selecting how the contributions are invested. Each member makes the decision when to reallocate future contributions or when to transfer funds from one investment product to another. Funds are held by the investment vendor in the name of the member, not in the name of the State of Tennessee. The State of Tennessee has no discretion over these funds other than to make the initial contributions. Accordingly, the State of Tennessee is not acting in a trustee capacity nor does it have a fiduciary responsibility for the funds held by the investment vendors.
4. Deferred Compensation - The State offers its employees two deferred compensation plans, one established pursuant to IRC Section 457 and the other pursuant to IRC Section 401(k). All costs of administering and funding these programs are the responsibility of plan participants.
The Section 401(k) and Section 457 plan assets remain the property of the contributing employees, they are not presented in the accompanying financial statements. IRC Sections 401(k) and 457 establish participation, contribution and withdrawal provisions for the plans. During the year ended June 30, 2004, contributions totaling $68.9 million were made by employees participating in the plans. Another $5.9 million was contributed by the State as matching contributions up to $20 per employee per month for the 401(k) plan match.
ag04m88
79

STATE OF TENNESSEE NOTES TO THE FINANCIAL STATEMENTS (Continued)
JUNE 30, 2004
H. Investment pool
The State Pooled Investment Fund (SPIF) is an external investment pool sponsored by the State of Tennessee. The external portion of SPIF is the Local Government Investment Pool (LGIP) and is reported as a separate investment trust fund. The internal portion, consisting of funds belonging to the State and its component units, has been included in the various funds and component units.
A copy of the SPIF report can be obtained by writing Tennessee Treasury Department, Accounting Division, 9th Floor Andrew Jackson Building, Nashville, TN 37243-0231 or by calling (615) 741-1337.
I. Loan guarantees
The Tennessee Student Assistance Corporation (TSAC), a component unit, operates the Guaranteed Student Loans Program. The U. S. Department of Education (USDE) reinsures the student loans up to 100% of their principal amounts. At June 30, 2004, TSAC was guarantor of $4.713 billion in student loans, substantially all of which were reinsured by the USDE. The State has no obligation under these student loan guarantees in the event of default.
J. Nashville correctional facilities revenue bonds
In June 1991, revenue bonds were issued by the Metropolitan Government of Nashville which were refunded in February 2002. The refunding bonds have an outstanding balance at June 30, 2004, of $13.53 million. These bonds are obligations of the Metropolitan Government of Nashville. The State is committed to pay Nashville for the housing of locally sentenced inmates, including debt service on the bonds.
K. Litigation
A class action suit has been brought against the State, alleging that the State has failed to provide services to individuals with mental retardation and other developmental disabilities, which they are entitled to under Medicaid. Presently the State limits the number of individuals served under the Home and Community-Based Services Waiver and the plaintiffs assert that this is a violation of the Medicaid Act.
The small school systems in the State have previously filed suit against the State challenging the constitutionality of the funding formula for elementary and secondary education. In declaring the State's K-12 Better Education Program and its funding formula constitutional, the State Supreme Court also stated that the State must equalize teachers' salaries according to the BEP formula. In response, the General Assembly enacted the Teachers Salary Equity Plan, which plaintiff small school systems have challenged as inadequate. The Supreme Court ruled in the plaintiffs’ favor and the Legislature must now address this issue. A lawsuit has been filed which challenges the constitutionality of certain deductions used in the calculation of the franchise tax base, as being a violation of the interstate commerce clause. Should the State lose this case, the State could be exposed to significant refunds of franchise tax collections. The State is also party to numerous other legal proceedings, many of which normally recur in governmental operations. Some of these lawsuits, including the three enumerated above, may have a future budgetary programmatic impact. They will be addressed in future budgets.
ag04m88
80
STATE OF TENNESSEE NOTES TO THE FINANCIAL STATEMENTS (Continued)
JUNE 30, 2004
L. Federal grants
The State receives significant financial assistance from the federal government in the form of grants and entitlements. The receipt of federal grants is generally conditioned upon compliance with terms and conditions of the grant agreements and applicable federal regulations. Substantially, all federal grants are subject to either federal single audits or financial and compliance audits by grantor agencies or their representatives. Questioned costs as a result of these audits may become disallowances after the appropriate review of federal agencies. Material disallowances are recognized as fund liabilities when the loss becomes probable and reasonably estimable.
The Centers for Medicare and Medicaid Services (CMS), formerly the Health Care Financing Administration (HCFA) performed a review of the provider taxes collected for the period beginning fiscal year 1992 through September 2000. The purpose of the review was to determine whether there was a positive correlation between the nursing home provider taxes and a state grant program for private pay patients of nursing homes (Grant Assistance Program). Because CMS believes there is a positive correlation between the nursing home provider taxes and the nursing home grant assistance program, it concluded that the provider taxes are impermissible resulting in a reduction in federal financial participation. On January 19, 2001, the State received a notice of disallowance for this tax for the period October 1, 1992 through September 30, 2000. On February 16, 2001, the State appealed the disallowance. On June 11, 2001, the State received a second notice of disallowance for the period October 1, 2000 through March 31, 2001. On July 6, 2001, the State appealed the second disallowance and the two disallowances have been consolidated for appeal. If the disallowances were ultimately upheld, then CMS would offset the disallowed amounts against future federal participation in TennCare. The State eliminated the Grant Assistance Program effective August 1, 2001, and does not believe that the collection of provider taxes after that date will be challenged by CMS. Other audits of the Medical Assistance Program (TennCare) have resulted in likely questioned costs that could be determined to be disallowances by the U.S. Department of Health and Human Services (HHS). These questioned costs relate to expenditures of resources for Certified Public Expenditures as it relates to Graduate Medical Education facilities and the allowable federal match for administrative expenditures related to one of the Behavioral Health Organizations. The ultimate liability to the federal government, is currently under dispute and if HHS were to impose a liability, the State would appeal the decision.
M. Subsequent events
Primary Government
Subsequent to June 30, the State issued $20 million in general obligation commercial paper. Also, in July 2004, the State issued 2004 Series A and B taxable general obligation bonds in the amount of $11.885 million and $42.95 million to refund 1997 Series B, 1999 Series C, and $8.125 million of 1998 Series A bonds. In September 2004, the State issued 2004 Series C tax-exempt general obligation bonds in the amount of $215.165 million to refund parts of 1996A, 1997A, 1998B, 1999B, 2000A, and 2002A Series bonds.
Component Units
Subsequent to June 30, Tennessee Housing Development Authority (THDA) issued $100 million of revenue bonds in July 2004. THDA called revenue bonds in the amount of $137.721 million and redeemed notes in the amount of $43.92 million through October. Also, in July the agency drew $39.185 million of Series 2002CN-1 Notes and in August the agency drew $34.145 million of Series 2004CN-1 Notes.
Subsequent to June 30, the Tennessee State School Bond Authority issued $13 million in commercial paper. On November 24, the Authority issued $12.6 million of Qualified Zone Academy Bonds.
ag04m88
81

This Page Intentionally Left Blank
ag04m88
82

___________________________________________________________________________________________ REQUIRED SUPPLEMENTARY INFORMATION ___________________________________________________________________________________________
ag04m88
83

STATE OF TENNESSEE REQUIRED SUPPLEMENTARY INFORMATION (RSI)
Infrastructure Assets Reported Using the Modified Approach ROADWAYS Measurement Scale The state uses a Maintenance Rating Index (MRI) that addresses all elements of the roadway system. A statistical sample of randomly selected highway segments, representative of the entire subsystem, are inspected annually and rated in accordance with the MRI criteria. The following elements are rated: traveled pavement; shoulders; various roadside elements such as debris, grass height, slope erosion, and fencing; drainage elements such as culverts, cross drain pipes, and drain inlets; and traffic services such as signage, pavement markings, and guardrails. The MRI is a numerical score from 1 to 100, with 100 being a perfect score. The average MRI of all the rated segments is the reported condition level. Established Condition Level The state intends to maintain roadways so that the reported condition level each year does not fall below 75. Assessed Conditions The following table presents the average MRI of all rated segments. For the Period Ended Maintenance Rating Index June 30, 2004 90.93 June 30, 2003 90.41 June 30, 2002 87.75 BRIDGES Measurement Scale The state maintains information on its 8,071 bridges in compliance with the National Bridge Inventory (NBI) guidelines established by the Federal Highway Administration. Bridges are inspected at least once every two years and the results are coded on a 0 to 9 scale (with 9 being the most desirable). A bridge coded 4 or less for its deck, superstructure, or substructure, or coded 2 or less for its structural evaluation or waterway adequacy is classified as “structurally deficient.” A structurally deficient bridge is inadequate to carry legal loads, whether caused by structural deterioration, obsolete design standards, or an insufficient waterway opening. A bridge coded 3 or less for its structural evaluation, deck geometry, vertical or horizontal underclearance, water adequacy, or approach roadway alignment is classified as “functionally obsolete.” A functionally obsolete bridge cannot properly accommodate the current traffic. Established Condition Level The state intends to maintain bridges so that 75 percent or more of the total deck area is not classified as structurally deficient or functionally obsolete. Assessed Conditions The following table presents the percentage of deck area whose condition assessment did not meet the criteria of structurally deficient or functionally obsolete according to the NBI. Percentage of Deck Area For the Two-Year Not Structurally Deficient Period Ended or Functionally Obsolete June 30, 2004 80.00% June 30, 2002 79.86% June 30, 2000 82.35%
ag04m88
84

STATE OF TENNESSEE REQUIRED SUPPLEMENTARY INFORMATION (RSI)
Infrastructure Assets Reported Using the Modified Approach (Continued)
ESTIMATED AND ACTUAL COSTS TO MAINTAIN The following table presents the state’s estimate of spending to preserve and maintain the roadways and bridges at, or above, the “Established Condition Level” cited above, and the actual amount spent (in thousands): For the Period Ended __________Roadways__________ ________Bridges______ ___June 30___ Estimated Actual Estimated Actual 2004 290,027 260,066 29,247 36,514 2003 289,516 285,459 28,787 39,557 2002 290,583 278,683 28,830 20,527 Actual and estimated maintenance/preservation expenses are determined using the accrual basis of accounting. Additional years will be reported when data is available.
ag04m88
85

State of TennesseeSchedule of Revenues, Expenditures, and Changes in Fund Balances - Budget and Actual
Required Supplementary InformationMajor Governmental Funds
For the Fiscal Year Ended June 30, 2004
(Expressed in Thousands)
General FundVariance With
Actual Final Budget -Budgeted Amounts (Budgetary Positive
Original Final Basis) (Negative)Sources of financial resources: Fund balances (budgetary basis), July 1 $ 758,285 $ 758,285 $ 758,285 Add: Prior year encumbrances reappropriated 7,274 7,274 7,274 Contract reserves reappropriated
Adjusted fund balances (budgetary basis), July 1 765,559 765,559 765,559
Revenues: Taxes 4,511,543 4,511,543 4,863,109 $ 351,566 Licenses, fines, fees, and permits 155,429 155,429 169,382 13,953 Interest on investments 10,000 10,000 14,182 4,182 Federal 6,629,236 7,482,163 7,024,459 (457,704) Departmental services 1,815,596 1,860,509 1,988,170 127,661 Other 14,347 14,347 356,271 341,924
Other financing sources: Transfers in 121,510 121,510 Bond authorizations
Total sources of financial resources 13,901,710 14,921,060 15,302,642 381,582
Uses of financial resources: Expenditures and encumbrances: General government Legislative 44,412 42,902 27,506 15,396 Secretary of State 39,235 40,424 33,075 7,349 Comptroller 67,053 72,364 67,411 4,953 Treasurer 34,259 35,553 32,174 3,379 Governor 12,243 8,213 5,171 3,042 Commissions 67,571 68,871 61,709 7,162 Finance and Administration 71,164 71,761 51,269 20,492 Personnel 9,967 12,962 10,481 2,481 General Services 19,375 19,341 17,172 2,169 Revenue 63,010 63,010 58,228 4,782 Miscellaneous Appropriations 33,086 27,457 17,296 10,161 Education Health and social services Veterans Affairs 3,221 3,221 3,077 144 Labor and Workforce Development 208,576 212,850 179,556 33,294 TennCare 7,333,127 8,047,359 7,631,267 416,092 Mental Health and Mental Retardation 839,652 878,531 829,010 49,521 Health 458,318 464,589 435,776 28,813 Human Services 1,596,936 1,738,833 1,687,682 51,151 Children's Services 561,875 584,113 544,186 39,927 Law, justice and public safety Judicial 205,786 208,580 198,904 9,676 Correction 542,906 534,897 500,030 34,867 Probation and Parole 58,092 58,092 54,978 3,114 Military 96,169 144,278 97,262 47,016 Bureau of Criminal Investigation 48,984 50,713 43,297 7,416 Safety 171,259 164,531 145,868 18,663 Recreation and resource development Agriculture 58,358 61,851 56,616 5,235 Tourist Development 12,072 12,072 11,876 196 Environment and Conservation 211,950 212,379 184,657 27,722 Economic and Community Development 99,444 99,444 68,748 30,696 Regulation of business and professions Commerce and Insurance 55,150 55,394 47,654 7,740 Financial Institutions 9,361 9,457 9,033 424 Transportation State Shared Taxes Paid to Local Governments 362,895 362,895 362,895 Other financing uses Transfers out 449,482 484,549 484,549 Total uses of financial resources 13,844,988 14,851,486 13,958,413 893,073
Fund balances (budgetary basis), June 30 $ 56,722 $ 69,574 $ 1,344,229 $ 1,274,655
ag04m88
86

Education Fund Highway FundVariance With Variance With
Actual Final Budget - Actual Final Budget -Budgeted Amounts (Budgetary Positive Budgeted Amounts (Budgetary Positive
Original Final Basis) (Negative) Original Final Basis) (Negative)
$ 43,979 $ 43,979 $ 43,979 $ 6,573 $ 6,573 $ 6,573
4,413 4,413 4,413195,515 195,515 195,515
43,979 43,979 43,979 206,501 206,501 206,501
3,425,500 3,425,500 3,487,793 $ 62,293 738,000 738,000 753,409 $ 15,4091,900 1,900 1,794 (106) 204,500 204,500 208,525 4,025
9 9713,985 899,093 724,776 (174,317) 710,959 2,585,121 638,943 (1,946,178)
9,270 12,029 6,997 (5,032) 35,781 46,165 34,171 (11,994)127,877 127,877 3,400 3,400 4,091 691
391,220 400,185 400,185 74,000 74,00074,000
4,585,854 4,782,686 4,793,401 10,715 1,973,141 3,857,687 1,919,649 (1,938,038)
4,652,509 4,851,413 4,623,456 227,957
1,643,518 3,535,744 1,562,073 1,973,671284,759 284,759 284,759
252 2,137 2,137 67,104 67,104 67,104
4,652,761 4,853,550 4,625,593 227,957 1,995,381 3,887,607 1,913,936 1,973,671
$ (66,907) $ (70,864) $ 167,808 $ 238,672 $ (22,240) $ (29,920) $ 5,713 $ 35,633
ag04m88
87

State of TennesseeRequired Supplementary InformationReconciliation of Budget to GAAP
Note to RSIFor the Fiscal Year Ended June 30, 2004
(Expressed in thousands)
Explanation of differences between budgetary inflows and outflows and GAAP revenues and expenditures
General Education HighwayFund Fund Fund
Sources of financial resourcesActual amounts (budgetary basis) $ 15,302,642 $ 4,793,401 $ 1,919,649
Differences - budget to GAAP: The fund balance at the beginning of the fiscal year is a budgetary resource but is not a current-year revenue for financial statement purposes. (765,559) (43,979) (206,501)
Transfers from other funds are inflows of budgetary resources, but are not revenues for financial statement purposes. (121,510) (400,185) (74,000)
Total revenues as reported on the Statement of Revenues, Expenditures, and Changes in Fund Balances - Governmental Funds $ 14,415,573 $ 4,349,237 $ 1,639,148
Uses of financial resourcesActual amounts (budgetary basis) $ 13,958,413 $ 4,625,593 $ 1,913,936
Differences - budget to GAAP: Encumbrances for supplies, equipment, and construction are reported in the year the order is placed for budgetary purposes, but in the year the goods or services are received for financial reporting purposes. (7,198) (688) (243,160)
Transfers to other funds are outflows of budgetary resources, but are not expenditures for financial statement purposes. (484,549) (2,137) (67,104)
Total expenditures as reported on the Statement of Revenues, Expenditures, and Changes in Fund Balances - Governmental Funds $ 13,466,666 $ 4,622,768 $ 1,603,672
ag04m88
88

SUPPLEMENTARY INFORMATION ___________________________________________________________________________________________ NONMAJOR GOVERNMENTAL FUNDS ___________________________________________________________________________________________
Special Revenue Funds – A description of these funds is found later in this section. Debt Service Fund - The Debt Service Fund is maintained to account for accumulation of resources for, and the payment of, principal and interest on general long-term debt. Capital Projects Fund – The Capital Projects Fund is maintained to account for the acquisition or construction of major governmental general fixed assets financed principally by long-term bonds. Permanent Funds – Description of these funds is found later in this section.
ag04m88
89
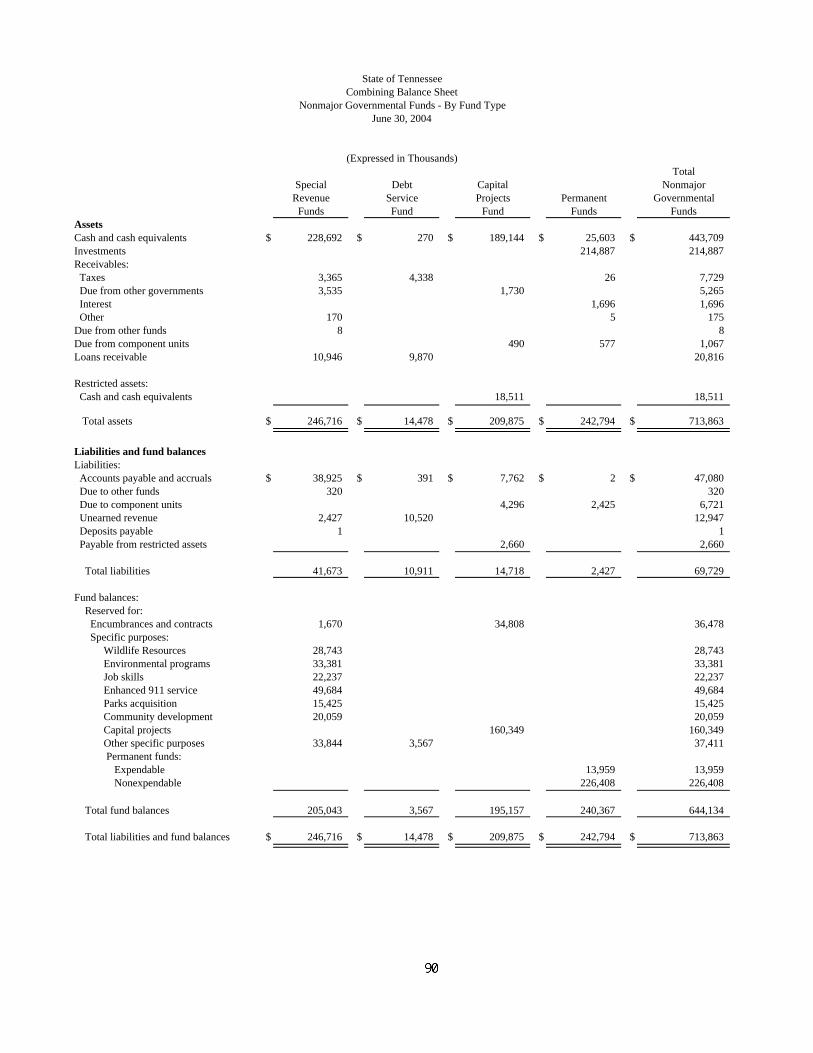
State of TennesseeCombining Balance Sheet
Nonmajor Governmental Funds - By Fund TypeJune 30, 2004
(Expressed in Thousands)Total
Special Debt Capital NonmajorRevenue Service Projects Permanent Governmental
Funds Fund Fund Funds FundsAssetsCash and cash equivalents $ 228,692 $ 270 $ 189,144 $ 25,603 $ 443,709Investments 214,887 214,887Receivables: Taxes 3,365 4,338 26 7,729 Due from other governments 3,535 1,730 5,265 Interest 1,696 1,696 Other 170 5 175Due from other funds 8 8Due from component units 490 577 1,067Loans receivable 10,946 9,870 20,816
Restricted assets: Cash and cash equivalents 18,511 18,511
Total assets $ 246,716 $ 14,478 $ 209,875 $ 242,794 $ 713,863
Liabilities and fund balancesLiabilities: Accounts payable and accruals $ 38,925 $ 391 $ 7,762 $ 2 $ 47,080 Due to other funds 320 320 Due to component units 4,296 2,425 6,721 Unearned revenue 2,427 10,520 12,947 Deposits payable 1 1 Payable from restricted assets 2,660 2,660
Total liabilities 41,673 10,911 14,718 2,427 69,729
Fund balances: Reserved for: Encumbrances and contracts 1,670 34,808 36,478 Specific purposes: Wildlife Resources 28,743 28,743 Environmental programs 33,381 33,381 Job skills 22,237 22,237 Enhanced 911 service 49,684 49,684 Parks acquisition 15,425 15,425 Community development 20,059 20,059 Capital projects 160,349 160,349 Other specific purposes 33,844 3,567 37,411 Permanent funds: Expendable 13,959 13,959 Nonexpendable 226,408 226,408
Total fund balances 205,043 3,567 195,157 240,367 644,134
Total liabilities and fund balances $ 246,716 $ 14,478 $ 209,875 $ 242,794 $ 713,863
ag04m88
90

State of TennesseeCombining Statement of Revenues, Expenditures, and Changes in Fund Balances
Nonmajor Governmental Funds - By Fund TypeFor the Fiscal Year Ended June 30, 2004
(Expressed in Thousands)
TotalSpecial Debt Capital Nonmajor
Revenue Service Projects Permanent GovernmentalFunds Fund Fund Funds Funds
Revenues Taxes: Sales $ 41,403 $ 41,403 Fuel $ 17,984 74,000 91,984 Business 5 104,600 104,605 Other 15,053 15,053 Licenses, fines, fees, and permits 120,399 2,668 $ 2,770 125,837 Interest on investments 2,741 17,170 19,911 Federal 25,241 $ 4,115 29,356 Departmental services 11,605 2,640 27,669 41,914 Other 511 19 530
Total revenues 193,539 225,311 31,784 19,959 470,593
Expenditures Current: General government 19,511 19,511 Education 7,526 7,526 Law, justice and public safety 4,736 4,736 Recreation and resources development 159,191 167 159,358 Regulation of business and professions 31,897 31,897 Debt service: Bond principal retirement 73,843 73,843 Commercial paper retirement 2,500 3,900 6,400 Bond interest 48,999 48,999 Commercial paper interest 957 957 Debt issuance costs 1,945 1,945 Capital outlay 128,167 128,167
Total expenditures 215,335 128,244 132,067 7,693 483,339
Excess (deficiency) of revenues over (under) expenditures (21,796) 97,067 (100,283) 12,266 (12,746)
Other financing sources (uses) Bond and commercial paper proceeds 206,933 206,933 Commercial paper redeemed (155,796) (155,796) Premium on bond sale 6,485 6,485 Transfers in 1,905 3,986 59,226 252 65,369 Transfers out (137,704) (235) (137,939)
Total other financing sources (uses) 1,905 (127,233) 110,128 252 (14,948)
Net changes in fund balances (19,891) (30,166) 9,845 12,518 (27,694)
Fund balances, July 1 224,934 33,733 185,312 227,849 671,828
Fund balances, June 30 $ 205,043 $ 3,567 $ 195,157 $ 240,367 $ 644,134
ag04m88
91

___________________________________________________________________________________________ NONMAJOR SPECIAL REVENUE FUNDS ___________________________________________________________________________________________ Specific revenues, earmarked to finance particular activities of government, are accounted for in the Special Revenue Funds. A brief description of each fund follows. Wildlife Resources Agency - This agency is responsible for the preservation, management, enhancement and protection of the state's wildlife resources and their environs. An additional responsibility is the enforcement of boating safety on state lakes and streams. Revenues are derived principally from hunting and fishing licenses, fees and permits. Criminal Injuries Compensation - The Treasury Department administers this fund for the award of compensation to victims (or their dependents) who suffer personal injury or death as a result of a criminal act. The primary revenue source is the privilege tax levied by the courts at the time of conviction of the offender. Solid Waste - This program is administered by the Department of Environment and Conservation. Revenues collected for a tipping fee on solid waste are used to provide grants to local governments to reduce the solid waste going into landfills. Job Skills - This program is administered by the Department of Economic and Community Development. Revenues are collected from a tax on employer's wages. The revenues will be used to enhance employment opportunites and to meet the needs of existing and new industries in the state. Environmental Protection - This program is administered by the Department of Environment and Conservation. Revenues collected from the various fees under the environmental protection fund are used to offset the cost of administering regulatory environmental programs. Hazardous Waste - This program is administered by the Department of Environment and Conservation. Revenues collected from applicants and holders of storage, treatment or disposal permits of hazardous waste are used to supervise the construction, operation, maintenance, closure and, where necessary, the post-closure care of hazardous waste facilities. Parks Acquisition - This program is administered jointly by the Departments of Environment and Conservation, Agriculture and Wildlife Resources. Revenues collected from the transfer of real property are used to acquire parks by both local and state governments.
Supreme Court Boards - This organization was formed by the Tennessee Supreme Court to consider and investigate any alleged ground for discipline or alleged incapacity of any attorney, and to provide continuing legal education for attorneys. Revenues are collected from attorneys. Underground Storage Tanks - This program is administered by the Department of Environment and Conservation. Revenues are collected primarily from a tax of four tenths of a cent per gallon on petroleum products and an annual fee on owners and operators of underground storage tanks containing petroleum substances. Enhanced Emergency 911 Service - This program is administered by the Department of Commerce and Insurance. Revenues are collected from a monthly fee on users of cellular telephone services. This fee is used to enhance the effectiveness of response times when a cellular user calls 911. Community Development – This fund is used to account for the federal monies received under the Community Development Block Grant Program. Driver Education - This program is designed and coordinated by the Department of Safety. Highway safety is promoted by providing driver education, instruction and training in schools, colleges and community organizations. The $2 fee for moving traffic violations is the source of funding for this program. Abandoned Land Program - This program is administered by the Department of Environment and Conservation. Revenues collected from surface mining permit fees and forfeited performance bonds are used to reclaim and restore lands affected by abandoned mining operations. Agricultural Non-Point Water Pollution - This program is administered by the Department of Agriculture. Revenues collected from the transfer of real property are used to abate pollution from agricultural sources. Regulatory Boards - This program is administered by the Department of Commerce and Insurance. Revenues are collected from fees assessed on licenses to real estate brokers, affiliate real estate brokers or auctioneers. These revenues are used to pay court judgments for violations by brokers, contractors or auctioneers of the applicable acts or of any rules promulgated by the appropriate officials.
ag04m88
92

Salvage Title Enforcement - This program is administered by the Department of Safety. Revenues are collected on the titlement of salvage vehicles and are used to enforce motor vehicle title and salvage laws and inspection of rebuilt vehicles. Dairy Promotion Board - This Board was formed to promote the consumption of milk and milk products. Revenue is derived from an assessment against commercial milk and milk product producers. Drycleaner’s Environmental Response - This program is administered by the Department of Environment and Conservation. Revenues collected from drycleaners are an annual registration fee and a fee for the various drycleaning solvents used. Agricultural Regulatory Fund - This program is administered by the Department of Agriculture. Revenues are collected from fees on the various agricultural related industries regulated by the department. These fees are then used in the administration of this regulatory function. Tennessee Regulatory Authority - The authority is responsible for executing and enforcing all statutes governing utilities. Revenues are derived principally from inspection and supervision fees. Small and Minority Telecommunication - This program provides loan guarantees and technical assistance to small and minority-owned telecommunication companies. Revenues collected during fiscal years 1997-2001, were derived from a fee on telecommunication service providers. Sex Offender Treatment Program - This program was formed to standardize the evaluation, identification, treatment and continued monitoring of sex offenders. Revenue is derived from a fine on those convicted of a sex offense. Fraud and Economic Crime - This program is administered by the District Attorneys General of the State. Revenues are collected from individuals prosecuted for bad checks. These monies are used to increase resources available to prosecute bad check cases.
ag04m88
93
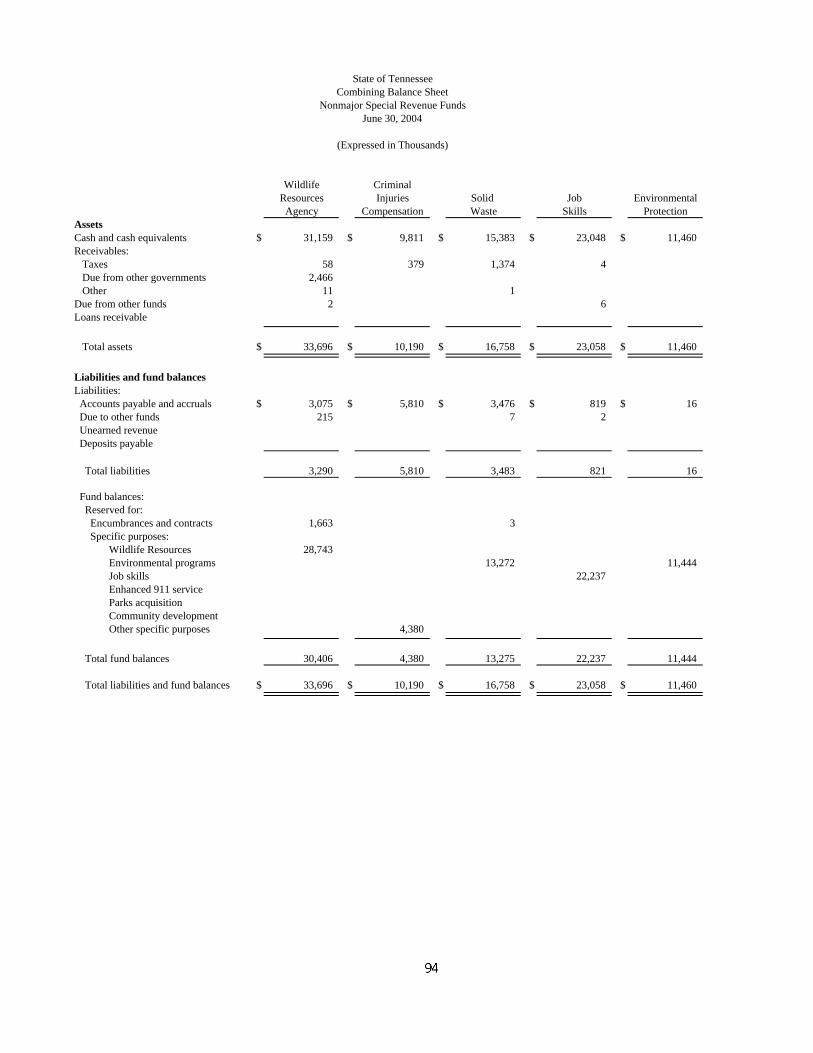
State of TennesseeCombining Balance Sheet
Nonmajor Special Revenue FundsJune 30, 2004
(Expressed in Thousands)
Wildlife Criminal
Resources Injuries Solid Job EnvironmentalAgency Compensation Waste Skills Protection
AssetsCash and cash equivalents $ 31,159 $ 9,811 $ 15,383 $ 23,048 $ 11,460Receivables: Taxes 58 379 1,374 4 Due from other governments 2,466 Other 11 1Due from other funds 2 6Loans receivable
Total assets $ 33,696 $ 10,190 $ 16,758 $ 23,058 $ 11,460
Liabilities and fund balancesLiabilities: Accounts payable and accruals $ 3,075 $ 5,810 $ 3,476 $ 819 $ 16 Due to other funds 215 7 2 Unearned revenue Deposits payable
Total liabilities 3,290 5,810 3,483 821 16 Fund balances: Reserved for: Encumbrances and contracts 1,663 3 Specific purposes: Wildlife Resources 28,743 Environmental programs 13,272 11,444 Job skills 22,237 Enhanced 911 service Parks acquisition Community development Other specific purposes 4,380
Total fund balances 30,406 4,380 13,275 22,237 11,444
Total liabilities and fund balances $ 33,696 $ 10,190 $ 16,758 $ 23,058 $ 11,460
ag04m88
94

(continued on next page)
Supreme Underground Enhanced
Hazardous Parks Court Storage Emergency Community DriverWaste Acquisition Boards Tanks 911 Service Development Education
$ 4,717 $ 17,834 $ 2,764 $ 7,644 $ 61,988 $ 9,113 $ 982
1,488 48229 350 287
151 1
10,946
$ 4,946 $ 18,184 $ 2,915 $ 9,420 $ 61,988 $ 20,059 $ 1,030
$ 1,407 $ 2,759 $ 66 $ 8,280 $ 12,301 $ 921 28 3 1
1,302 13 1,112
2,730 2,759 79 9,420 12,304 10
3
2,216
49,68415,425
$ 20,0592,836 1,017
2,216 15,425 2,836 49,684 20,059 1,020
$ 4,946 $ 18,184 $ 2,915 $ 9,420 $ 61,988 $ 20,059 $ 1,030
ag04m88
95

State of TennesseeCombining Balance Sheet
Nonmajor Special Revenue Funds (continued) June 30, 2004
(Expressed in Thousands)
Agricultural Abandoned Non-Point Salvage Dairy
Land Water Regulatory Title PromotionProgram Pollution Boards Enforcement Board
AssetsCash and cash equivalents $ 867 $ 1,270 $ 3,466 $ 210 $ 2Receivables: Taxes Due from other governments OtherDue from other fundsLoans receivable
Total assets $ 867 $ 1,270 $ 3,466 $ 210 $ 2
Liabilities and fund balancesLiabilities: Accounts payable and accruals $ 1 $ 132 $ 2 $ 10 $ 2 Due to other funds 4 Unearned revenue Deposits payable
Total liabilities 1 132 2 14 2 Fund balances: Reserved for: Encumbrances and contracts Specific purposes: Wildlife Resources Environmental programs 866 1,138 Job skills Enhanced 911 service Parks acquisition Community development Other specific purposes 3,464 196
Total fund balances 866 1,138 3,464 196
Total liabilities and fund balances $ 867 $ 1,270 $ 3,466 $ 210 $ 2
ag04m88
96

Total
Sex NonmajorDrycleaner's Agricultural Tennessee Small and Offender Fraud and Special
Environmental Regulatory Regulatory Minority Treatment Economic RevenueResponse Fund Authority Telecommunication Program Crime Funds
$ 5,019 $ 3,851 $ 4,988 $ 11,212 $ 142 $ 1,762 $ 228,692
14 3,365203 3,535
6 1708
10,946
$ 5,019 $ 3,851 $ 5,197 $ 11,212 $ 156 $ 1,762 $ 246,716
$ 571 $ 179 $ 10 $ 38,9252 37 320
2,4271 1
573 217 10 41,673
1 1,670
28,7434,445 33,381
22,23749,68415,42520,059
$ 3,851 4,980 $ 11,212 146 $ 1,762 33,844
4,446 3,851 4,980 11,212 146 1,762 205,043
$ 5,019 $ 3,851 $ 5,197 $ 11,212 $ 156 $ 1,762 $ 246,716
ag04m88
97

State of TennesseeCombining Statement of Revenues, Expenditures, and Changes in Fund Balances
Nonmajor Special Revenue FundsFor the Fiscal Year Ended June 30, 2004
(Expressed in Thousands)
Wildlife CriminalResources Injuries Solid Job EnvironmentalAgency Compensation Waste Skills Protection
Revenues Taxes: Fuel $ 515 Business $ 5 Other 1,422 $ 4,641 $ 5,611 Licenses, fines, fees, and permits 29,973 2,625 5,281 $ 32,145 Interest on investments 325 79 166 248 119 Federal 16,451 4,971 Departmental services 7,996 41 Other 509
Total revenues 56,682 12,825 11,099 253 32,264
Expenditures General government 12,623 Law, justice and public safety Recreation and resources development 65,802 12,104 1,513 32,035 Regulation of business and professions
Total expenditures 65,802 12,623 12,104 1,513 32,035
Excess (deficiency) of revenues over (under) expenditures (9,120) 202 (1,005) (1,260) 229
Other financing sources (uses) Transfers in 891
Total other financing sources (uses) 891
Net change in fund balances (8,229) 202 (1,005) (1,260) 229
Fund balances, July 1 38,635 4,178 14,280 23,497 11,215
Fund balances, June 30 $ 30,406 $ 4,380 $ 13,275 $ 22,237 $ 11,444
ag04m88
98

(continued on next page)
Supreme Underground Enhanced
Hazardous Parks Court Storage Emergency Community DriverWaste Acquisition Boards Tanks 911 Service Development Education
$ 17,469
$ 1,422$ 2,809 2,405 $ 32,233 $ 585
$ 48 207 26 66 598 $ 5831,530 656 1,2543,199 4 149 174
2
4,777 2,289 2,986 21,368 32,831 583 585
2,593 277
7,659 6,574 21,368 6,742
31,580
7,659 6,574 2,593 21,368 31,580 6,742 277
(2,882) (4,285) 393 1,251 (6,159) 308
1,014
1,014
(1,868) (4,285) 393 1,251 (6,159) 308
4,084 19,710 2,443 48,433 26,218 712
$ 2,216 $ 15,425 $ 2,836 $ - $ 49,684 $ 20,059 $ 1,020
ag04m88
99
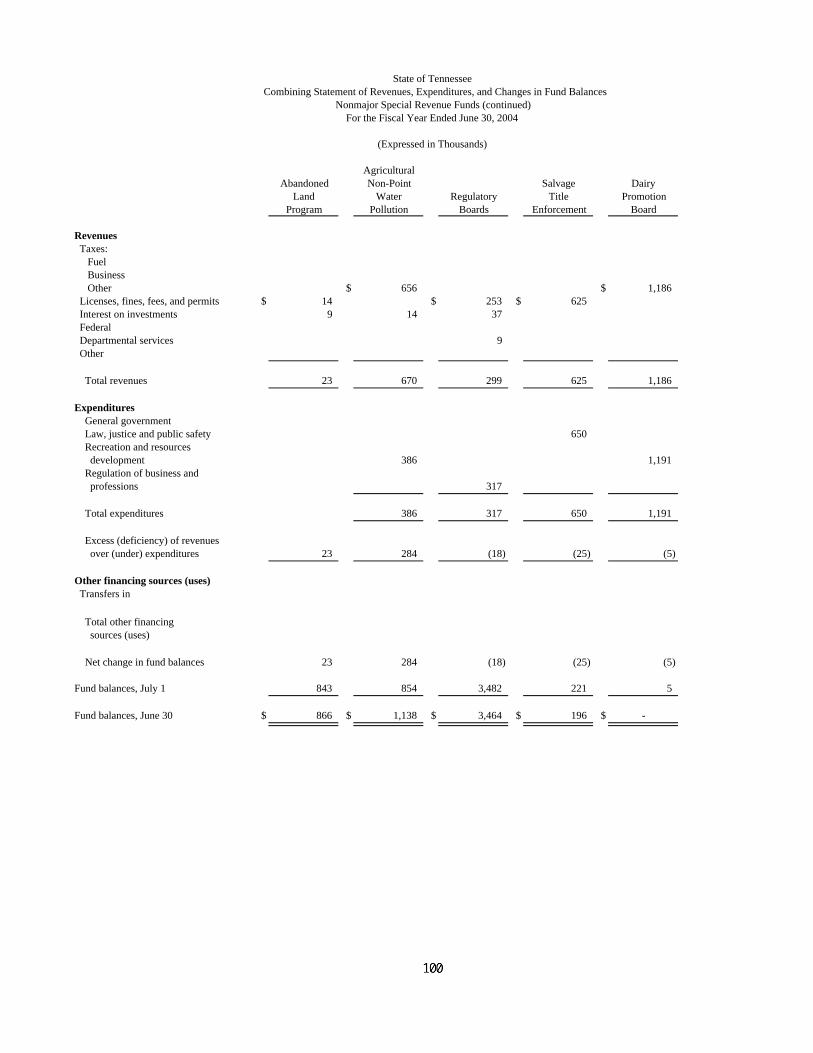
State of TennesseeCombining Statement of Revenues, Expenditures, and Changes in Fund Balances
Nonmajor Special Revenue Funds (continued)For the Fiscal Year Ended June 30, 2004
(Expressed in Thousands)
Agricultural Abandoned Non-Point Salvage Dairy
Land Water Regulatory Title PromotionProgram Pollution Boards Enforcement Board
Revenues Taxes: Fuel Business Other $ 656 $ 1,186 Licenses, fines, fees, and permits $ 14 $ 253 $ 625 Interest on investments 9 14 37 Federal Departmental services 9 Other
Total revenues 23 670 299 625 1,186
Expenditures General government Law, justice and public safety 650 Recreation and resources development 386 1,191 Regulation of business and professions 317
Total expenditures 386 317 650 1,191
Excess (deficiency) of revenues over (under) expenditures 23 284 (18) (25) (5)
Other financing sources (uses) Transfers in
Total other financing sources (uses)
Net change in fund balances 23 284 (18) (25) (5)
Fund balances, July 1 843 854 3,482 221 5
Fund balances, June 30 $ 866 $ 1,138 $ 3,464 $ 196 $ -
ag04m88
100

Total
Sex NonmajorDrycleaner's Agricultural Tennessee Small and Offender Fraud and Special
Environmental Regulatory Regulatory Minority Treatment Economic RevenueResponse Fund Authority Telecommunication Program Crime Funds
$ 17,984
5$ 115 15,053
$ 1,172 $ 2,739 $ 6,742 $ 798 120,39955 42 $ 118 1 2,74127 352 25,241
2 31 11,605511
1,254 2,781 7,096 118 146 799 193,539
6,867 21 19,511200 1,016 4,736
1,223 2,594 159,191
31,897
1,223 2,594 6,867 21 200 1,016 215,335
31 187 229 97 (54) (217) (21,796)
1,905
1,905
31 187 229 97 (54) (217) (19,891)
4,415 3,664 4,751 11,115 200 1,979 224,934
$ 4,446 $ 3,851 $ 4,980 $ 11,212 $ 146 $ 1,762 $ 205,043
ag04m88
101

State of TennesseeCombining Schedule of Revenues, Expenditures, and Changes in Fund Balances
Budget and Actual (Budgetary Basis)All Nonmajor Budgeted Special Revenue Funds
For the Fiscal Year Ended June 30, 2004
(Expressed in Thousands)
Wildlife Resources AgencyActual Variance -
(Budgetary FavorableBudget Basis) (Unfavorable)
Sources of financial resources: Fund balances (budgetary basis), July 1 $ 36,268 $ 36,268 Add: Prior year encumbrances liquidated 1,244 1,244
Adjusted fund balances (budgetary basis), July 1 37,512 37,512
Revenues: Taxes 2,173 1,937 $ (236) Licenses, fines, fees, and permits 34,427 29,973 (4,454) Interest on investments 325 325 Federal 23,417 16,451 (6,966) Departmental services 8,477 7,996 (481) Other
Other financing sources - transfers in 891 891
Total sources of financial resources 106,897 95,085 (11,812)
Uses of financial resources: Expenditures and encumbrances: Judicial Treasurer Commissions Correction Safety Agriculture Environment and Conservation Wildlife Resources 78,971 66,342 12,629 Economic and Community Development Commerce and Insurance Total uses of financial resources 78,971 66,342 12,629
Fund balances (budgetary basis), June 30 $ 27,926 $ 28,743 $ 817
ag04m88
102

(continued on next page)
Criminal Injuries Compensation Solid WasteActual Variance - Actual Variance -
(Budgetary Favorable (Budgetary FavorableBudget Basis) (Unfavorable) Budget Basis) (Unfavorable)
$ 4,178 $ 4,178 $ 14,280 $ 14,280
4,178 4,178 14,280 14,280
4,641 $ 4,641 5,568 5,611 $ 432,625 2,625 4,936 5,281 345
79 79 166 1664,451 4,971 520
234 41 (193)509 509
8,629 17,003 8,374 25,018 25,379 361
12,676 12,623 53
12,893 12,107 786
12,676 12,623 53 12,893 12,107 786
$ (4,047) $ 4,380 $ 8,427 $ 12,125 $ 13,272 $ 1,147
ag04m88
103

State of TennesseeCombining Schedule of Revenues, Expenditures, and Changes in Fund Balances
Budget and Actual (Budgetary Basis)All Nonmajor Budgeted Special Revenue Funds (continued)
For the Fiscal Year Ended June 30, 2004
(Expressed in Thousands)
Job SkillsActual Variance -
(Budgetary FavorableBudget Basis) (Unfavorable)
Sources of financial resources: Fund balances (budgetary basis), July 1 $ 23,497 $ 23,497 Add: Prior year encumbrances liquidated
Adjusted fund balances (budgetary basis), July 1 23,497 23,497
Revenues: Taxes 5 $ 5 Licenses, fines, fees, and permits Interest on investments 600 248 (352) Federal Departmental services Other
Other financing sources - transfers in
Total sources of financial resources 24,097 23,750 (347)
Uses of financial resources: Expenditures and encumbrances: Judicial Treasurer Commissions Correction Safety Agriculture Environment and Conservation Wildlife Resources Economic and Community Development 9,404 1,513 7,891 Commerce and Insurance Total uses of financial resources 9,404 1,513 7,891
Fund balances (budgetary basis), June 30 $ 14,693 $ 22,237 $ 7,544
ag04m88
104

(continued on next page)
Environmental Protection Hazardous WasteActual Variance - Actual Variance -
(Budgetary Favorable (Budgetary FavorableBudget Basis) (Unfavorable) Budget Basis) (Unfavorable)
$ 11,215 $ 11,215 $ 4,084 $ 4,084
11,215 11,215 4,084 4,084
37,146 32,145 $ (5,001)
119 119 48 $ 482,061 1,530 (531)3,593 3,199 (394)
1,014 1,014
48,361 43,479 (4,882) 10,752 9,875 (877)
37,146 32,035 5,111 11,023 7,659 3,364
37,146 32,035 5,111 11,023 7,659 3,364
$ 11,215 $ 11,444 $ 229 $ (271) $ 2,216 $ 2,487
ag04m88
105

State of TennesseeCombining Schedule of Revenues, Expenditures, and Changes in Fund Balances
Budget and Actual (Budgetary Basis)All Nonmajor Budgeted Special Revenue Funds (continued)
For the Fiscal Year Ended June 30, 2004
(Expressed in Thousands)
Parks AcquisitionActual Variance -
(Budgetary FavorableBudget Basis) (Unfavorable)
Sources of financial resources: Fund balances (budgetary basis), July 1 $ 19,710 $ 19,710 Add: Prior year encumbrances liquidated
Adjusted fund balances (budgetary basis), July 1 19,710 19,710
Revenues: Taxes 1,422 1,422 Licenses, fines, fees, and permits Interest on investments 207 $ 207 Federal 656 656 Departmental services 4 4 Other
Other financing sources - transfers in
Total sources of financial resources 21,132 21,999 867
Uses of financial resources: Expenditures and encumbrances: Judicial Treasurer Commissions Correction Safety Agriculture Environment and Conservation 7,162 6,574 588 Wildlife Resources Economic and Community Development Commerce and Insurance Total uses of financial resources 7,162 6,574 588
Fund balances (budgetary basis), June 30 $ 13,970 $ 15,425 $ 1,455
ag04m88
106

(continued on next page)
Supreme Court Boards Underground Storage TanksActual Variance - Actual Variance -
(Budgetary Favorable (Budgetary FavorableBudget Basis) (Unfavorable) Budget Basis) (Unfavorable)
$ 2,443 $ 2,443
2,443 2,443
$ 18,240 $ 17,469 $ (771)2,809 $ 2,809 3,050 2,405 (645)
26 26 66 66 2,248 1,254 (994)
149 149 174 1742 2
2,443 5,429 2,986 23,538 21,368 (2,170)
2,773 2,593 180
23,409 21,368 2,041
2,773 2,593 180 23,409 21,368 2,041
$ (330) $ 2,836 $ 3,166 $ 129 $ - $ (129)
ag04m88
107
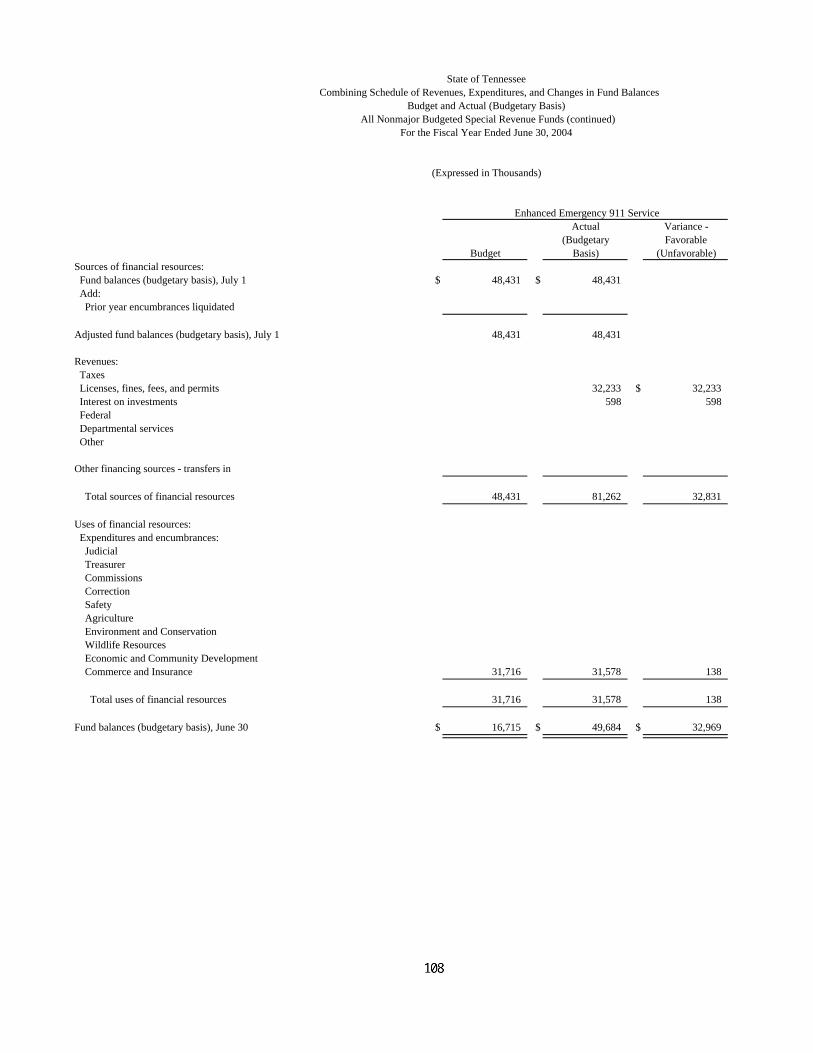
State of TennesseeCombining Schedule of Revenues, Expenditures, and Changes in Fund Balances
Budget and Actual (Budgetary Basis)All Nonmajor Budgeted Special Revenue Funds (continued)
For the Fiscal Year Ended June 30, 2004
(Expressed in Thousands)
Enhanced Emergency 911 ServiceActual Variance -
(Budgetary FavorableBudget Basis) (Unfavorable)
Sources of financial resources: Fund balances (budgetary basis), July 1 $ 48,431 $ 48,431 Add: Prior year encumbrances liquidated
Adjusted fund balances (budgetary basis), July 1 48,431 48,431
Revenues: Taxes Licenses, fines, fees, and permits 32,233 $ 32,233 Interest on investments 598 598 Federal Departmental services Other
Other financing sources - transfers in
Total sources of financial resources 48,431 81,262 32,831
Uses of financial resources: Expenditures and encumbrances: Judicial Treasurer Commissions Correction Safety Agriculture Environment and Conservation Wildlife Resources Economic and Community Development Commerce and Insurance 31,716 31,578 138 Total uses of financial resources 31,716 31,578 138
Fund balances (budgetary basis), June 30 $ 16,715 $ 49,684 $ 32,969
ag04m88
108

(continued on next page)
Driver Education Abandoned Land ProgramActual Variance - Actual Variance -
(Budgetary Favorable (Budgetary FavorableBudget Basis) (Unfavorable) Budget Basis) (Unfavorable)
$ 712 $ 712 $ 843 $ 843
712 712 843 843
418 585 $ 167 500 14 $ (486)
9 9
1,130 1,297 167 1,343 866 (477)
418 280 138
500 500
418 280 138 500 500
$ 712 $ 1,017 $ 305 $ 843 $ 866 $ 23
ag04m88
109

State of TennesseeCombining Schedule of Revenues, Expenditures, and Changes in Fund Balances
Budget and Actual (Budgetary Basis)All Nonmajor Budgeted Special Revenue Funds (continued)
For the Fiscal Year Ended June 30, 2004
(Expressed in Thousands)
Agricultural Non-Point Water PollutionActual Variance -
(Budgetary FavorableBudget Basis) (Unfavorable)
Sources of financial resources: Fund balances (budgetary basis), July 1 $ 854 $ 854 Add: Prior year encumbrances liquidated
Adjusted fund balances (budgetary basis), July 1 854 854
Revenues: Taxes 656 656 Licenses, fines, fees, and permits Interest on investments 100 14 $ (86) Federal Departmental services Other
Other financing sources - transfers in
Total sources of financial resources 1,610 1,524 (86)
Uses of financial resources: Expenditures and encumbrances: Judicial Treasurer Commissions Correction Safety Agriculture 756 386 370 Environment and Conservation Wildlife Resources Economic and Community Development Commerce and Insurance Total uses of financial resources 756 386 370
Fund balances (budgetary basis), June 30 $ 854 $ 1,138 $ 284
ag04m88
110

(continued on next page)
Regulatory Boards Salvage Title EnforcementActual Variance - Actual Variance -
(Budgetary Favorable (Budgetary FavorableBudget Basis) (Unfavorable) Budget Basis) (Unfavorable)
$ 3,482 $ 3,482 $ 214 $ 214
3,482 3,482 214 214
253 $ 253 758 625 $ (133)
37 37
9 9
3,482 3,781 299 972 839 (133)
758 643 115
366 317 49
366 317 49 758 643 115
$ 3,116 $ 3,464 $ 348 $ 214 $ 196 $ (18)
ag04m88
111

State of TennesseeCombining Schedule of Revenues, Expenditures, and Changes in Fund Balances
Budget and Actual (Budgetary Basis)All Nonmajor Budgeted Special Revenue Funds (continued)
For the Fiscal Year Ended June 30, 2004
(Expressed in Thousands)
Drycleaner's Environmental ResponseActual Variance -
(Budgetary FavorableBudget Basis) (Unfavorable)
Sources of financial resources: Fund balances (budgetary basis), July 1 $ 4,414 $ 4,414 Add: Prior year encumbrances liquidated
Adjusted fund balances (budgetary basis), July 1 4,414 4,414
Revenues: Taxes Licenses, fines, fees, and permits 2,447 1,172 $ (1,275) Interest on investments 55 55 Federal 27 27 Departmental services Other
Other financing sources - transfers in
Total sources of financial resources 6,861 5,668 (1,193)
Uses of financial resources: Expenditures and encumbrances: Judicial Treasurer Commissions Correction Safety Agriculture Environment and Conservation 2,447 1,223 1,224 Wildlife Resources Economic and Community Development Commerce and Insurance Total uses of financial resources 2,447 1,223 1,224
Fund balances (budgetary basis), June 30 $ 4,414 $ 4,445 $ 31
ag04m88
112

(continued on next page)
Agricultural Regulatory Fund Tennessee Regulatory AuthorityActual Variance - Actual Variance -
(Budgetary Favorable (Budgetary FavorableBudget Basis) (Unfavorable) Budget Basis) (Unfavorable)
$ 3,664 $ 3,664 $ 4,751 $ 4,751
3,664 3,664 4,751 4,751
2,354 2,739 $ 385 7,048 6,742 $ (306)
120 42 (78)350 352 2
4 2 (2)
6,138 6,445 307 12,153 11,847 (306)
7,402 6,867 535
2,824 2,594 230
2,824 2,594 230 7,402 6,867 535
$ 3,314 $ 3,851 $ 537 $ 4,751 $ 4,980 $ 229
ag04m88
113

State of TennesseeCombining Schedule of Revenues, Expenditures, and Changes in Fund Balances
Budget and Actual (Budgetary Basis)All Nonmajor Budgeted Special Revenue Funds (continued)
For the Fiscal Year Ended June 30, 2004
(Expressed in Thousands)
Small and Minority TelecommunicationActual Variance -
(Budgetary FavorableBudget Basis) (Unfavorable)
Sources of financial resources: Fund balances (budgetary basis), July 1 $ 11,115 $ 11,115 Add: Prior year encumbrances liquidated
Adjusted fund balances (budgetary basis), July 1 11,115 11,115
Revenues: Taxes Licenses, fines, fees, and permits Interest on investments 80 118 $ 38 Federal Departmental services Other
Other financing sources - transfers in
Total sources of financial resources 11,195 11,233 38
Uses of financial resources: Expenditures and encumbrances: Judicial Treasurer Commissions Correction Safety Agriculture Environment and Conservation Wildlife Resources Economic and Community Development 80 21 59 Commerce and Insurance Total uses of financial resources 80 21 59
Fund balances (budgetary basis), June 30 $ 11,115 $ 11,212 $ 97
ag04m88
114
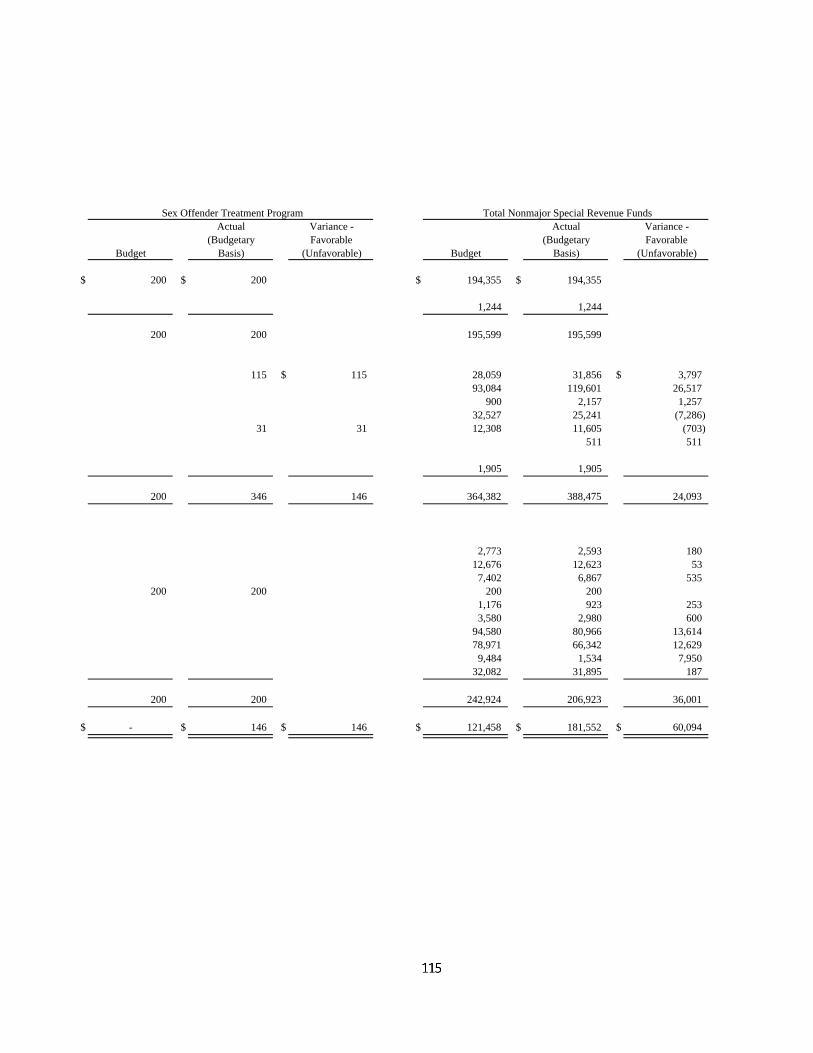
Sex Offender Treatment Program Total Nonmajor Special Revenue FundsActual Variance - Actual Variance -
(Budgetary Favorable (Budgetary FavorableBudget Basis) (Unfavorable) Budget Basis) (Unfavorable)
$ 200 $ 200 $ 194,355 $ 194,355
1,244 1,244
200 200 195,599 195,599
115 $ 115 28,059 31,856 $ 3,79793,084 119,601 26,517
900 2,157 1,25732,527 25,241 (7,286)
31 31 12,308 11,605 (703)511 511
1,905 1,905
200 346 146 364,382 388,475 24,093
2,773 2,593 18012,676 12,623 53
7,402 6,867 535200 200 200 200
1,176 923 2533,580 2,980 600
94,580 80,966 13,61478,971 66,342 12,629
9,484 1,534 7,95032,082 31,895 187
200 200 242,924 206,923 36,001
$ - $ 146 $ 146 $ 121,458 $ 181,552 $ 60,094
ag04m88
115
___________________________________________________________________________________________ DEBT SERVICE FUND ___________________________________________________________________________________________
The Debt Service Fund is maintained to account for accumulation of resources for and the payment of principal and interest on general long-term debt.
ag04m88
116

State of TennesseeSchedule of Revenues, Expenditures, and Changes in Fund Balances
Budget and Actual (Budgetary Basis)Debt Service Fund
For the Fiscal Year Ended June 30, 2004
(Expressed in Thousands)
Debt Service FundActual Variance -
(Budgetary FavorableBudget Basis) (Unfavorable)
Sources of financial resources: Fund balances (budgetary basis), July 1 $ 33,733 $ 33,733
Revenues: Taxes 219,300 220,003 $ 703 Licenses, fines, fees, and permits 2,700 2,668 (32) Other 2,640 2,640
Other financing sources Transfers in 3,986 3,986 Bond Premium 6,485 6,485
Total sources of financial resources 266,204 269,515 3,311
Uses of financial resources: Expenditures and encumbrances: Debt Service 231,387 128,244 103,143
Other financing uses - transfers out 137,704 137,704 Total uses of financial resources 369,091 265,948 103,143
Fund balances (budgetary basis), June 30 $ (102,887) $ 3,567 $ 106,454
ag04m88
117

This Page Intentionally Left Blank
ag04m88
118

_____________________________________________________________________________________________ PERMANENT FUNDS _____________________________________________________________________________________________
Chairs of Excellence Fund – This fund was created by the General Assembly in 1986. Its purpose is to endow faculty chairs at the Tennessee Board of Regents and University of Tennessee campuses in order to attract more highly qualified professors. For a chair to be established, private contributions which a school collects are matched by monies the state has appropriated to fund this program. The chair also receives the interest earned from investment of these matched monies. Academic Scholars Fund – This fund is used to account for the academic scholars program administered by Tennessee Student Assistance Corporation. An endowment was established in 1986 to provide scholarships to superior students from the interest earnings. Other – Various smaller funds that are legally restricted to the extent that only earnings, not principal can be spent.
ag04m88
119

State of TennesseeCombining Balance Sheet
Permanent FundsJune 30, 2004
(Expressed in Thousands)
TotalChairs of Academic PermanentExcellence Scholars Other Funds
AssetsCash and cash equivalents $ 3,387 $ 6 $ 22,210 $ 25,603Investments 211,740 3,147 214,887Receivables: Taxes 26 26 Interest 1,696 1,696 Other 5 5Due from component units 577 577
Total assets $ 217,400 $ 3,153 $ 22,241 $ 242,794
Liabilities and fund balancesLiabilities: Accounts payable and accruals $ 2 $ 2 Due to component units $ 2,425 2,425 Total liabilities 2,425 2 2,427
Fund balances: Reserved for: Expendable 12,292 446 $ 1,221 13,959 Nonexpendable 202,683 2,705 21,020 226,408
Total fund balances 214,975 3,151 22,241 240,367
Total liabilities and fund balances $ 217,400 $ 3,153 $ 22,241 $ 242,794
ag04m88
120
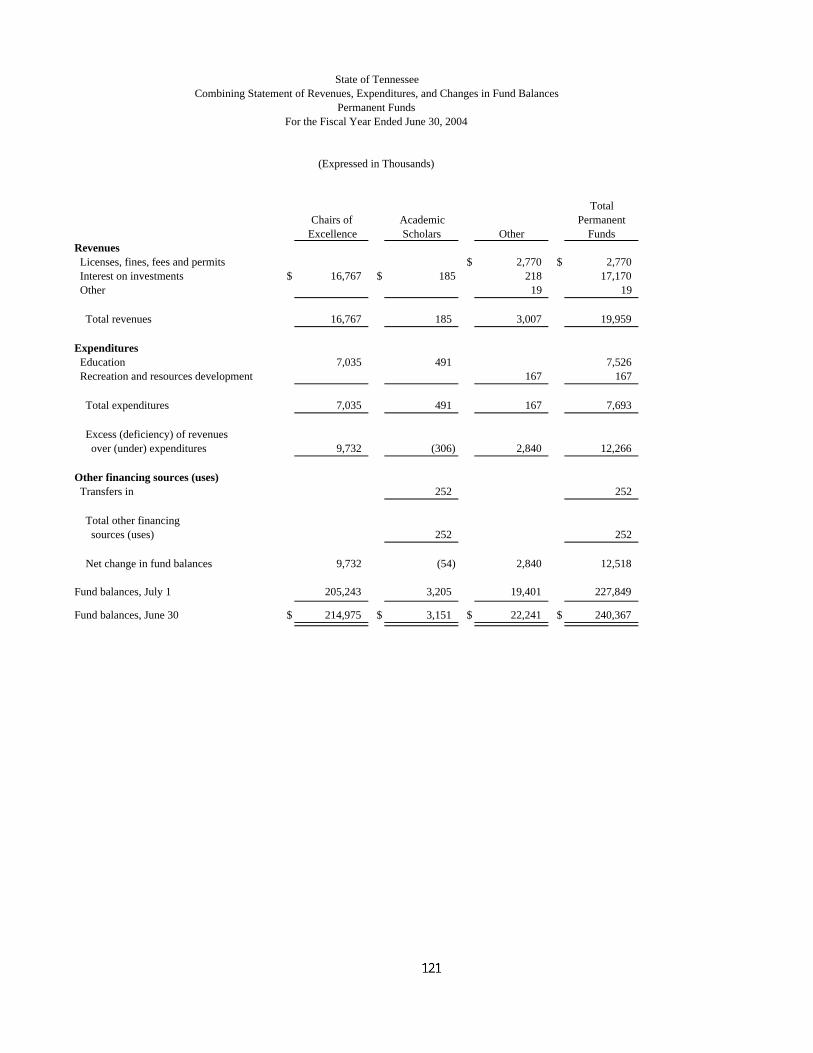
State of TennesseeCombining Statement of Revenues, Expenditures, and Changes in Fund Balances
Permanent FundsFor the Fiscal Year Ended June 30, 2004
(Expressed in Thousands)
Total
Chairs of Academic PermanentExcellence Scholars Other Funds
Revenues Licenses, fines, fees and permits $ 2,770 $ 2,770 Interest on investments $ 16,767 $ 185 218 17,170 Other 19 19
Total revenues 16,767 185 3,007 19,959
Expenditures Education 7,035 491 7,526 Recreation and resources development 167 167
Total expenditures 7,035 491 167 7,693
Excess (deficiency) of revenues over (under) expenditures 9,732 (306) 2,840 12,266
Other financing sources (uses) Transfers in 252 252
Total other financing sources (uses) 252 252
Net change in fund balances 9,732 (54) 2,840 12,518
Fund balances, July 1 205,243 3,205 19,401 227,849 Fund balances, June 30 $ 214,975 $ 3,151 $ 22,241 $ 240,367
ag04m88
121

This Page Intentionally Left Blank
ag04m88
122

_____________________________________________________________________________________________ GENERAL FUND SUPPLEMENTARY SCHEDULES _____________________________________________________________________________________________
___________________________________________________________________________________________
ag04m88
123

State of TennesseeComparative Schedules of Revenues by Source
General FundFor the Fiscal Years Ended June 30, 2004 and 2003
(Expressed in Thousands)
For the Year EndedRevenues by Source June 30, 2004 June 30, 2003
Taxes: Sales and use $ 2,394,797 $ 2,237,499
Gasoline 10,537 8,633 Motor fuel 3,180 2,947 Gasoline inspection 658 636
Total fuel taxes 14,375 12,216
Franchise 492,650 457,984 Excise 600,553 504,476 Gross receipts 216,679 214,457 Beer 15,206 14,923 Alcoholic beverage 35,705 34,059 Mixed drink 21,017 20,501 Tobacco 644 622 Business 94,925 40,482 Insurance companies premium 327,030 302,387 Retaliatory 5,100 5,406 Workers compensation premium 51,141 41,366 Medicaid provider 100,230 101,700 Other 1,789 1,516
Total business taxes 1,962,669 1,739,879
Income 139,992 102,939 Privilege 259,977 216,423 Inheritance and estate 90,718 83,148 Other 581 581
Total other taxes 491,268 403,091 Total taxes 4,863,109 4,392,685
Licenses, fines, fees and permits: Motor vehicle registration 41,149 39,830 Motor vehicle title registration fees 8,616 8,387 Drivers licenses 22,744 22,193 Arrests, fines and fees 9,821 9,299 Regulatory board fees 28,902 31,767 Other 58,150 51,282
Total licenses, fines, fees and permits 169,382 162,758
Interest on investments 14,182 13,639
Federal - earned by state departments 7,024,459 6,442,962
Departmental services: Charges to the public 345,369 340,956 Interdepartmental charges 956,969 958,947 Charges to cities, counties, etc. 685,832 317,823
Total departmental services 1,988,170 1,617,726
Federal tax relief 96,733 96,733Other 259,538 278,630
Total revenues by source $ 14,415,573 $ 13,005,133
ag04m88
124

State of TennesseeComparative Schedules of Expenditures by Function and Department
General FundFor the Fiscal Years Ended June 30, 2004 and 2003
(Expressed in Thousands)
For the Year EndedJune 30, 2004 June 30, 2003
Expenditures by function and department
General government: Legislative $ 27,506 $ 27,197 Secretary of State 32,819 28,414 Comptroller 67,071 69,075 Treasurer 32,174 34,056 Governor 5,171 3,957 Commissions 61,663 60,231 Finance and Administration 51,269 54,509 Personnel 10,481 10,176 General Services 17,172 17,283 Revenue 58,177 57,684 Miscellaneous Appropriations 17,055 12,875
Total general government 380,558 375,457
Health and social services: Veterans Affairs 3,077 3,277 Labor and Workforce Development 179,386 185,943 TennCare 7,631,266 6,864,487 Mental Health and Mental Retardation 828,372 771,531 Health 435,043 402,666 Human Services 1,687,674 1,597,681 Children's Services 544,053 517,097
Total health and social services 11,308,871 10,342,682
Law, justice and public safety: Judicial 198,904 192,298 Correction 498,383 472,882 Probation and Paroles 54,942 55,268 Military 97,097 52,971 Bureau of Criminal Investigation 43,245 45,225 Safety 145,203 145,347
Total law, justice and public safety 1,037,774 963,991
Recreation and resources development: Agriculture 56,131 52,495 Tourist Development 11,875 12,231 Environment and Conservation 183,151 160,154 Economic and Community Development 68,728 62,061
Total recreation and resources development 319,885 286,941
Regulation of business and professions: Commerce and Insurance 47,649 45,952 Financial Institutions 9,034 8,630
Total regulation of business and professions 56,683 54,582
State shared taxes paid to local governments 362,895 360,801
Total expenditures by function and department $ 13,466,666 $ 12,384,454
ag04m88
125

This Page Intentionally Left Blank
ag04m88
126

___________________________________________________________________________________________ NONMAJOR ENTERPRISE FUNDS ___________________________________________________________________________________________ The Enterprise Funds are used to account for the operations of state agencies that provide goods or services to the general public on a user charge basis. The state's nonmajor enterprise operations are described below. State Loan Program - Operated since the early 1970's through the Department of Environment and Conservation, this program has provided financial assistance to local governments and utility districts for the construction of sewage treatment, solid waste recovery and waterworks facilities. In order for these borrowing entities to generate funds necessary to repay the loans, the imposition of a user's fee by the local systems was authorized. In order to finance this program, general obligation bonds were sold which, although remaining full faith and credit obligations of the state, are being retired from resources of this fund. Future financing for this program will be generated from the sale of revenue bonds or notes by the Local Development Authority. Energy Loan Program - Created in 1988, this program makes loans to small businesses and local governments to improve energy efficiency. Teacher Group Insurance - Established in January 1986, this fund is used to account for revenues received and claims paid on behalf of teachers of political subdivisions of the state who have elected coverage under a group medical plan similar to that offered state employees. Local Government Group Insurance - Established in July 1991, this fund is used to account for revenues received and claims paid on behalf of employees of local governments and quasi-governmental organizations established for the primary purpose of providing services for or on the behalf of state and local governments. This plan is similar to the plan offered to state employees.
Drinking Water Loan – Created in 1998, this fund provides loans to local governments and utility districts for the improvement of drinking water systems. The initial sources of the monies are federal grants and state appropriations. Grain Indemnity - This program is administered by the Department of Agriculture. Revenues are collected from fees on grain sold by producers. These revenues are to be used to protect commodity producers in the event of the financial failure of a commodity dealer or warehouseman. Property Utilization, a division of the Department of General Services - This agency receives surplus federal property and redistributes it to civil defense units, health and educational institutions and other eligible donees within the state. The agency collects fees from the donees to offset operating costs. In addition, this agency handles surplus property by the various State agencies. Medicare Supplement Insurance – Established in January 2001, this fund is used to account for revenues received and claims paid on behalf of retirees who are eligible for medicare coverage and elect coverage under the Medicare Supplement Insurance Plan. Client Protection – This fund was created by the Tennessee Supreme Court to protect clients from dishonest conduct by attorneys. Revenue is mainly generated through annual registration fees for attorneys.
ag04m88
127

State of TennesseeCombining Statement of Net Assets
Nonmajor Enterprise FundsJune 30, 2004
(Expressed in Thousands) Local
State Teacher GovernmentLoan Energy Loan Group Group
Assets Program Program Insurance InsuranceCurrent assets: Cash and cash equivalents $ 3,500 $ 20,144 $ 46,267 $ 2,628 Receivables: Accounts receivable 1,444 504 Loans receivable-current 2,830 1,513 Due from component units Inventory
Total current assets 6,330 21,657 47,711 3,132 Noncurrent assets: Deferred charges 59 Loans receivable 5,199 4,404
Total noncurrent assets 5,258 4,404 Total assets 11,588 26,061 47,711 3,132
LiabilitiesCurrent liabilities: Accounts payable and accruals 479 26,379 8,786 Due to other funds Bonds payable-current 2,830 Unearned revenue 1,244 112 Total current liabilities 3,309 27,623 8,898 Noncurrent liabilities: Bonds payable, net 5,241 Other noncurrent liabilities Total noncurrent liabilities 5,241
Total liabilities 8,550 27,623 8,898
Net assets Restricted Unrestricted (deficit) 3,038 26,061 20,088 (5,766)
Total net assets $ 3,038 $ 26,061 $ 20,088 $ (5,766)
ag04m88
128

Total
Medicare NonmajorDrinking Grain Property Supplement Client Enterprise
Water Indemnity Utilization Insurance Protection Funds
$ 12,625 $ 3,543 $ 365 $ 28,251 $ 1,766 $ 119,089
118 464 2,5301,413 5,756
1 112 12
14,038 3,543 496 28,715 1,766 127,388
5938,308 47,911
38,308 47,970
52,346 3,543 496 28,715 1,766 175,358
5 207 5,348 41,2045 5
2,830783 2,139
5 212 6,131 46,178
5,24136 36
36 5,277
5 248 6,131 51,455
52,341 52,341 3,543 248 22,584 1,766 71,562
$ 52,341 $ 3,543 $ 248 $ 22,584 $ 1,766 $ 123,903
ag04m88
129
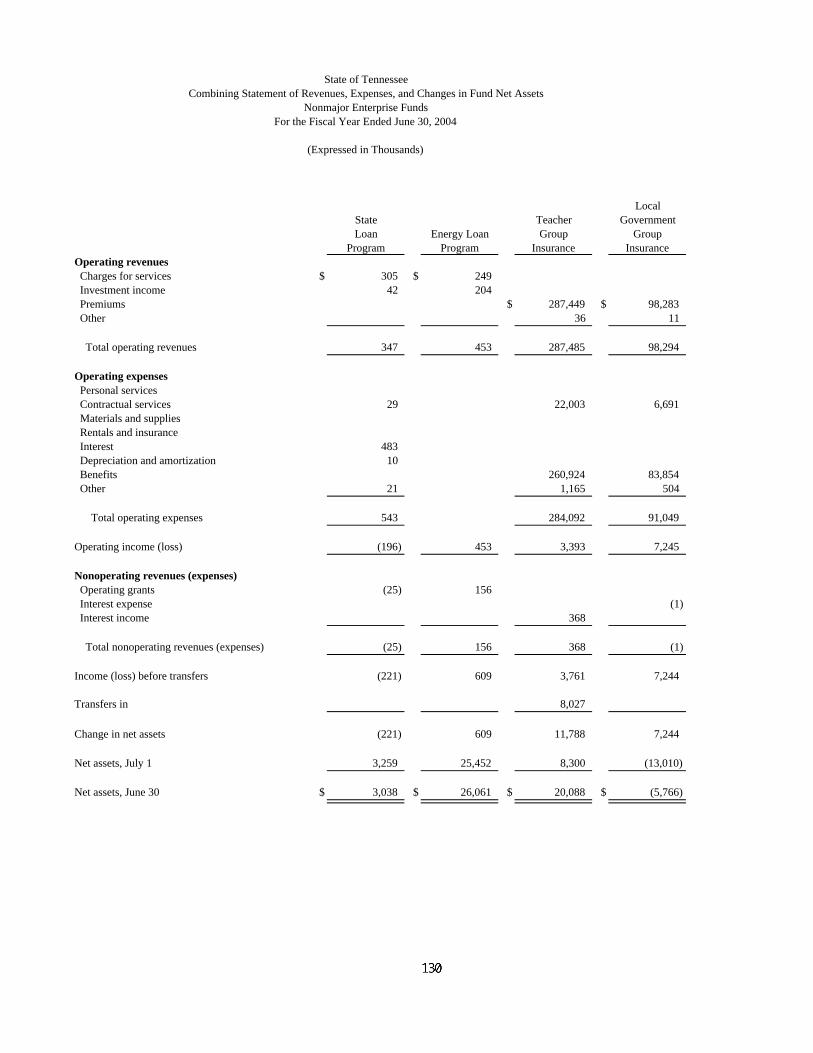
State of TennesseeCombining Statement of Revenues, Expenses, and Changes in Fund Net Assets
Nonmajor Enterprise FundsFor the Fiscal Year Ended June 30, 2004
(Expressed in Thousands)
Local
State Teacher GovernmentLoan Energy Loan Group Group
Program Program Insurance InsuranceOperating revenues Charges for services $ 305 $ 249 Investment income 42 204 Premiums $ 287,449 $ 98,283 Other 36 11
Total operating revenues 347 453 287,485 98,294
Operating expenses Personal services Contractual services 29 22,003 6,691 Materials and supplies Rentals and insurance Interest 483 Depreciation and amortization 10 Benefits 260,924 83,854 Other 21 1,165 504
Total operating expenses 543 284,092 91,049
Operating income (loss) (196) 453 3,393 7,245
Nonoperating revenues (expenses) Operating grants (25) 156 Interest expense (1) Interest income 368
Total nonoperating revenues (expenses) (25) 156 368 (1)
Income (loss) before transfers (221) 609 3,761 7,244
Transfers in 8,027
Change in net assets (221) 609 11,788 7,244
Net assets, July 1 3,259 25,452 8,300 (13,010)
Net assets, June 30 $ 3,038 $ 26,061 $ 20,088 $ (5,766)
ag04m88
130

Total
Medicare NonmajorDrinking Grain Property Supplement Client Enterprise
Water Indemnity Utilization Insurance Protection Funds
$ 654 $ 1,955 $ 156 $ 3,319 147 393
$ 36,805 422,53747
801 1,955 36,805 156 426,296
736 736375 429 5,438 68 35,033
480 480273 273
48310
35,875 380,653$ 117 49 299 2 2,157
375 117 1,967 41,612 70 419,825
426 (117) (12) (4,807) 86 6,471
16,448 16,579(1)
38 290 19 715
16,448 38 290 19 17,293
16,874 (79) (12) (4,517) 105 23,764
1,679 5,653 15,359
18,553 (79) (12) 1,136 105 39,123
33,788 3,622 260 21,448 1,661 84,780
$ 52,341 $ 3,543 $ 248 $ 22,584 $ 1,766 $ 123,903
ag04m88
131

State of TennesseeCombining Statement of Cash Flows
Nonmajor Enterprise FundsFor the Fiscal Year Ended June 30, 2004
(Expressed in Thousands) Local
State Teacher GovernmentLoan Energy Loan Group Group
Program Program Insurance InsuranceCash flows from operating activities Receipts from customers and users $ 289,531 $ 98,903 Receipts from interfund services provided Payments to suppliers (280,644) (93,236) Payments to employees Payments for interfund services used $ (29) (1,165) (503)
Net cash from (used for) operating activities (29) 7,722 5,164
Cash flows from noncapital financing activities Operating grants received $ 156 Negative cash balance implicitly repaid (2,535) Transfers in 8,027 Payments to component units (25) Principal payments (2,990) Interest paid (541) Subsidy to borrowers (35)
Net cash from (used for) noncapital financing activities (3,591) 156 8,027 (2,535)
Cash flows from investing activities Loans issued (696) Collection of loan principal 3,149 1,678 Interest paid (1) Interest received 347 409 368
Net cash from (used for) investing activities 3,496 1,391 368 (1)
Net increase (decrease) in cash and cash equivalents (124) 1,547 16,117 2,628
Cash and cash equivalents, July 1 3,624 18,597 30,150 -
Cash and cash equivalents, June 30 $ 3,500 $ 20,144 $ 46,267 $ 2,628
Reconciliation of operating income to net cash provided (used) by operating activities
Operating income (loss) $ (196) $ 453 $ 3,393 $ 7,245Adjustments to reconcile operating income (loss) to net cash from operating activities: Depreciation and amortization 10 Investment income (42) (204) Charges for services (305) (249) Interest expense 483 Subsidy to borrowers 21 Changes in assets and liabilities: (Increase) decrease in accounts receivable 520 155 (Increase) decrease in due from component units 19 (Increase) decrease in inventories Increase (decrease) in accounts payable 3,556 (2,242) Increase (decrease) in due to other funds Increase (decrease) in due to component units (2) Increase (decrease) in unearned revenue 253 (11)
Total adjustments 167 (453) 4,329 (2,081)
Net cash provided by (used for) operating activities $ (29) $ - $ 7,722 $ 5,164
ag04m88
132

TotalMedicare Nonmajor
Drinking Grain Property Supplement Client EnterpriseWater Indemnity Utilization Insurance Protection Funds
$ 1,623 $ 36,717 $ 156 $ 426,930277 277
$ (29) $ (117) (615) (41,498) (68) (416,207)(731) (2) (733)
(346) (494) (299) (2,836)
(375) (117) 60 (5,080) 86 7,431
16,448 16,604(2,535)
1,679 5,653 15,359(25)
(2,990)(541)
(35)
18,127 5,653 25,837
(19,945) (20,641)760 5,587
(1)800 38 290 19 2,271
(18,385) 38 290 19 (12,784)
(633) (79) 60 863 105 20,484
13,258 3,622 305 27,388 1,661 98,605
$ 12,625 $ 3,543 $ 365 $ 28,251 $ 1,766 $ 119,089
$ 426 $ (117) $ (12) $ (4,807) $ 86 $ 6,471
10(147) (393)(654) (1,208)
48321
(59) (227) 3894 236 6
119 (185) 1,2482 2
(2)139 381
(801) 72 (273) 960
$ (375) $ (117) $ 60 $ (5,080) $ 86 $ 7,431
ag04m88
133

This Page Intentionally Left Blank
ag04m88
134

___________________________________________________________________________________________ INTERNAL SERVICE FUNDS ___________________________________________________________________________________________ Internal Service Funds are used to account for the operations of state agencies that provide goods or services to other state agencies on a cost-reimbursement basis. The following operations are included in these funds: Office for Information Resources, a division of the Department of Finance and Administration - This division functions as the data and voice service bureau for state government. Risk Management - This fund, administered by the Treasury Department, is used to pay awards for claims made against the state and for damage to state owned property. Motor Vehicle Management, a division of the Department of General Services – This division is responsible for administering a uniform program for the operation and maintenance of all state vehicles. General Services Printing, a division of the Department of General Services - This agency operates a printing facility to provide such services as general printing, typesetting and binding for state agencies located in Nashville. In addition, this division provides photographic services to the various state agencies. Facilities Revolving Fund - This fund was created in 1989 to provide for the maintenance, repair and total housing needs of state government. This fund was phased in. The first year it included only downtown Nashville office space. In fiscal year 90-91, the fund expanded to include all office and warehouse space in Davidson, Knox, Madison, Shelby, Washington, Hamilton, and Sullivan counties. In fiscal year 91-92, the fund encompassed all office and warehouse space in the state, except institutional space. Employee Group Insurance Fund - Established in January 1978, this fund is used to account for transactions pertaining to the state's self-insured group medical plan. Prior to 1978, medical insurance was provided by a private carrier. Group life and accident insurance premiums paid to a private insurance company are also recorded in this fund.
Food Services, a division of the Department of General Services - This division is responsible for the preparation and distribution of certain food to the various state institutions. This consists of food that is cooked and then immediately frozen and is then reheated at the institution. Postal Services, a division of the Department of General Services - This agency processes and distributes incoming, outgoing and interdepartmental mail for state agencies located in Nashville. Capitol Print Shop, a division of the Office of the Comptroller - This facility is responsible for providing printing, mailing and other office services for the state agencies located in the Capitol. Purchasing, a division of the Department of General Services - This agency is responsible for the procurement of supplies, equipment and certain specialized services. Central Stores, a division of the Department of General Services - This agency is responsible for the purchasing and distribution of office supplies to all state government and quasi-governmental entities that opt to use this service. Records Management, a division of the Department of General Services - This division is responsible for the retention and disposal of official records. Division of Accounts, a division of the Department of Finance and Administration – This division is responsible for the centralized accounting function for the state. TRICOR - Tennessee Rehabilitative Initiative in Correction manages correctional industry, agriculture, and service operations. Its purpose is to employ and train inmates and provide products and services to state agencies, local governments, and not-for profit organizations.
___________________________________________________________________________________________
ag04m88
135

State of TennesseeCombining Statement of Net Assets
Internal Service FundsJune 30, 2004
(Expressed in Thousands)
Office for Motor General Facilities Employee
Information Risk Vehicle Services Revolving GroupAssets Resources Management Management Printing Fund InsuranceCurrent assets: Cash and cash equivalents $ 76,552 $ 101,059 $ 6,224 $ 105 $ 37,892 $ 118,853 Accounts receivable 463 597 304 2,115 Due from other funds 3,445 29 Due from component units 456 137 6 Inventories, at cost 741 9 88 Prepaid expenses
Total current assets 81,657 101,196 6,836 193 38,225 120,968
Noncurrent assets: Deferred charges 457 Lease receivable 3,322
Capital assets: Land, at cost 54,164 Structures and improvements, at cost 401,622 Machinery and equipment, at cost 89,573 126,520 1,312 403 Less-accumulated depreciation (70,007) (74,330) (761) (163,461) Construction in progress 11,751
Total capital assets, net of accumulated depreciation 19,566 52,190 551 304,479
Total noncurrent assets 19,566 52,190 551 308,258
Total assets 101,223 101,196 59,026 744 346,483 120,968
LiabilitiesCurrent liabilities: Accounts payable and accruals: Accounts payable 15,662 448 1,284 54 5,755 48,516 Accrued payroll and related deductions 1,968 99 124 Due to other funds 224 8 12 Lease obligations payable 66 Bonds payable- current 13,286 Unearned revenue 16 7 1,423 19 30,672 Other 35,982
Total current liabilities 17,870 36,437 2,814 275 19,041 79,188 Noncurrent liabilities: Lease obligations payable 291 Commercial paper payable 12,684 Bonds payable, net 127,589 Other noncurrent liabilities 1,036 56,575 67 78
Total noncurrent liabilities 1,036 56,575 67 369 140,273
Total liabilities 18,906 93,012 2,881 644 159,314 79,188
Net assets Invested in capital assets, net of related debt 19,566 52,190 194 150,920 Unrestricted (deficit) 62,751 8,184 3,955 (94) 36,249 41,780
Total net assets $ 82,317 $ 8,184 $ 56,145 $ 100 $ 187,169 $ 41,780
ag04m88
136

Capitol TotalFood Postal Print Central Records Division of Internal
Services Services Shop Purchasing Stores Management Accounts TRICOR Service Funds
$ 1,192 $ 638 $ 258 $ 371 $ 188 $ 3,808 $ 9,705 $ 356,84522 1 541 4,043
3,474 19 618
349 26 $ 993 4,782 6,98894 20 114
1,214 1,081 304 371 993 188 3,809 15,047 372,082
4573,322
215 54,37915,752 417,374
3,343 2,110 797 23 7 235 45 6,726 231,094(5,548) (2,030) (723) (3) (7) (189) (27) (3,335) (320,421)
11,751
13,762 80 74 20 - 46 18 3,391 394,177
13,762 80 74 20 46 18 3,391 397,956
14,976 1,161 378 391 993 234 3,827 18,438 770,038
556 29 6 8 354 15 8 1,443 74,138
15 128 22 121 45 44 287 523 3,3761 12 14 531 5 32 47 886
9 7513,286
6 32,14335,982
572 169 28 143 930 73 327 2,019 159,886
35 32612,684
127,58911 78 20 66 25 26 157 350 58,489
11 78 20 66 25 61 157 350 199,088
583 247 48 209 955 134 484 2,369 358,974
13,762 80 74 20 2 18 3,391 240,217631 834 256 162 38 98 3,325 12,678 170,847
$ 14,393 $ 914 $ 330 $ 182 $ 38 $ 100 $ 3,343 $ 16,069 $ 411,064
ag04m88
137

State of TennesseeCombining Statement of Revenues, Expenses, and Changes in Fund Net Assets
Internal Service FundsFor the Fiscal Year Ended June 30, 2004
(Expressed in Thousands)
Office
for Motor General Facilities EmployeeInformation Risk Vehicle Services Revolving GroupResources Management Management Printing Fund Insurance
Operating revenues Charges for services $ 141,848 $ 63,084 $ 27,015 $ 3,531 $ 104,583 Premiums $ 550,185 Other 6 61
Total operating revenues 141,848 63,084 27,015 3,537 104,583 550,246
Operating expenses Personal services 27,632 1,273 1,780 Contractual services 94,488 8,401 1,283 798 52,617 39,699 Materials and supplies 15,696 13,167 772 5,484 Rentals and insurance 3,720 1,737 377 378 24,333 7,852 Depreciation and amortization 6,937 11,910 113 9,667 Benefits 33,141 469,257 Other 252 57 13 120 2,491
Total operating expenses 148,725 43,279 28,067 3,854 92,221 519,299
Operating income (loss) (6,877) 19,805 (1,052) (317) 12,362 30,947
Nonoperating revenues (expenses Taxes 3 Interest income 800 431 952 Interest expense (2) (7,601)
Total nonoperating revenues (expenses) 803 (2) (7,170) 952
Income (loss) before contributions and transfers (6,877) 20,608 (1,052) (319) 5,192 31,899
Capital contributions 4 100Transfers in 2,586 3,271 4,558 233 683 483
Change in net assets (4,287) 23,879 3,506 (86) 5,975 32,382
Net assets, July 1 86,604 (15,695) 52,639 186 181,194 9,398
Net assets, June 30 $ 82,317 $ 8,184 $ 56,145 $ 100 $ 187,169 $ 41,780
ag04m88
138

Capitol TotalFood Postal Print Central Records Division of Internal
Services Services Shop Purchasing Stores Management Accounts TRICOR Service Funds
$ 4,200 $ 16,096 $ 837 $ 3,738 $ 7,740 $ 1,230 $ 9,960 $ 23,561 $ 407,423 550,185
67
4,200 16,096 837 3,738 7,740 1,230 9,960 23,561 957,675
181 1,905 510 1,799 746 721 4,252 7,313 48,1123,958 747 332 1,738 908 253 5,739 3,461 214,422
2 12,413 107 38 5,874 7 24 10,385 63,96930 434 27 156 417 213 201 846 40,721
638 81 66 3 26 9 430 29,880502,398
146 34 20 23 48 13 490 3,707
4,955 15,614 1,042 3,754 7,968 1,268 10,238 22,925 903,209
(755) 482 (205) (16) (228) (38) (278) 636 54,466
32,183
(2) (7,605)
(2) (5,419)
(755) 482 (205) (16) (228) (40) (278) 636 49,047
10422 11,836
(755) 482 (205) 6 (228) (40) (278) 636 60,987
15,148 432 535 176 266 140 3,621 15,433 350,077
$ 14,393 $ 914 $ 330 $ 182 $ 38 $ 100 $ 3,343 $ 16,069 $ 411,064
ag04m88
139

State of TennesseeCombining Statement of Cash Flows
Internal Service FundsFor the Fiscal Year Ended June 30, 2004
(Expressed in Thousands)
Officefor Motor General Facilities Employee
Information Risk Vehicle Services Revolving GroupResources Management Management Printing Fund Insurance
Cash flows from operating activities Receipts from customers and users $ 4,640 $ 18,099 $ 496 $ 68 $ 1,547 $ 221,288 Receipts from interfund services provided 138,243 44,849 27,114 3,464 103,008 347,523 Payments to suppliers (98,601) (32,253) (12,574) (1,209) (65,802) (527,184) Payments to employees (27,484) (1,296) (1,804) Payments for interfund services used (13,100) (5,786) (4,895) (776) (16,712) (2,492)
Net cash from (used for) operating activities 3,698 24,909 8,845 (257) 22,041 39,135
Cash flows from noncapital financing activities Negative cash balance implicitly financed Transfers in 2,586 3,271 4,558 233 683 483 Tax revenues received 3
Net cash from (used for) noncapital financing activities 2,586 3,274 4,558 233 683 483
Cash flows from capital and related financing activities Purchase of capital assets (10,086) (16,843) (10,906) Bond and commercial paper proceeds 17,662 Proceeds from sale of capital assets 1,777 302 Bond issuance cost (38) Principal payments (5) (19,573) Interest paid (1) (7,335)
Net cash from (used for) capital and related financing activities (10,086) (15,066) (6) (19,888)
Cash flows from investing activities Interest received 801 431 952
Net cash from (used for) investing activities 801 431 952
Net increase (decrease) in cash and cash equivalents (3,802) 28,984 (1,663) (30) 3,267 40,570
Cash and cash equivalents, July 1 80,354 72,075 7,887 135 34,625 78,283
Cash and cash equivalents, June 30 $ 76,552 $ 101,059 $ 6,224 $ 105 $ 37,892 $ 118,853
Reconciliation of operating income to net cash provided (used) by operating activities Operating income (loss) $ (6,877) $ 19,805 $ (1,052) $ (317) $ 12,362 $ 30,947Adjustments to reconcile operating income (loss) to net cash from operating activities: Depreciation and amortization 6,937 11,910 113 9,683 Loss on disposal of capital assets 91 39 64 Gain on disposal of capital assets (6) Bond issuance cost 38 Changes in assets and liabilities: (Increase) decrease in accounts receivable 27 (12) 946 (Increase) decrease in due from other funds 886 (29) (Increase) decrease in due from component units 145 (138) (2) (Increase) decrease in inventories 93 1 (7) (Increase) decrease in prepaid expenses 75 Increase (decrease) in accounts payable 2,295 5,240 (2,656) (39) (51) 4,960 Increase (decrease) in due to other funds 50 (1) (1) (26) Increase (decrease) in unearned revenue (24) 2 618 2,282
Total adjustments 10,575 5,104 9,897 60 9,679 8,188
Net cash provided by (used for) operating activities $ 3,698 $ 24,909 $ 8,845 $ (257) $ 22,041 $ 39,135
Noncash investing, capital and financing activities Contributed capital assets $ 4 $ 100 Capital asset acquired by capital lease $ 363
Total noncash investing, capital and financing activities $ 4 $ 363 $ 100
ag04m88
140

Capitol TotalFood Postal Print Central Records Division of Internal
Services Services Shop Purchasing Stores Management Accounts TRICOR Service Funds
$ 535 $ 165 $ 13 $ 23 $ 50 $ 24 $ 526 $ 5,474 $ 252,9483,682 15,931 824 3,716 7,690 1,206 9,435 18,107 724,792
(3,830) (13,013) (428) (386) (6,338) (50) (945) (14,812) (777,425)(184) (1,935) (512) (1,810) (749) (722) (4,257) (7,472) (48,225)(106) (654) (37) (1,560) (994) (418) (5,185) (1,351) (54,066)
97 494 (140) (17) (341) 40 (426) (54) 98,024
341 34122 11,836
3
22 341 12,180
(23) (1,032) (38,890)17,662
2,079(38)
(20) (19,598)(2) (7,338)
(23) (22) (1,032) (46,123)
2,184
2,184
97 494 (140) (18) 18 (426) (1,086) 66,265
1,095 144 398 389 - 170 4,234 10,791 290,580
$ 1,192 $ 638 $ 258 $ 371 $ - $ 188 $ 3,808 $ 9,705 $ 356,845
$ (755) $ 482 $ (205) $ (16) $ (228) $ (38) $ (278) $ 636 $ 54,466
638 81 66 3 26 9 430 29,896139 43 1 377
(6)38
16 1 1 18 997
8574 9
(32) 5 (223) (741) (904)(29) 1 47
59 (7) (7) (5) 111 9 (97) (404) 9,408(1) (1) (61) 2 (39)
2,878
852 12 65 (1) (113) 78 (148) (690) 43,558
$ 97 $ 494 $ (140) $ (17) $ (341) $ 40 $ (426) $ (54) $ 98,024
$ 104$ 48 411
48 $ 515
ag04m88
141

This Page Intentionally Left Blank
ag04m88
142

___________________________________________________________________________________________ FIDUCIARY FUNDS ___________________________________________________________________________________________ The Fiduciary Funds are used to account for assets held by the state in a fiduciary capacity. Pension and Other Employee Benefit Trust:
Pension Trust Fund - The Tennessee Consolidated Retirement System was established in July 1972 superseding seven former retirement systems. The accounts of each superseded system were transferred to the new system wherein separate accounting is maintained for assets and liabilities attributable to the various classes of members and beneficiaries. Benefits under the system are funded by contributions of members and employers. Effective July 1981, contributions of up to 5% of the retirement credible compensation of most classes of state employees, formerly paid by those employees, were assumed by the state pursuant to non-contributory legislation. The level of contributions is determined by actuarial valuation, the latest having been performed as of July 1, 2003. As of that date there were 198,917 active members and 83,121 retired members representing a 2.2% and 6.9% increase, respectively, since the previous actuarial valuation in 2001. Employee Flexible Benefits - Established in January 1988, this fund is used to account for monies contributed by employees under the IRC Section 125 cafeteria plan.
Private-Purpose Trust Funds: Baccalaureate Education - This trust was created by the General Assembly in 1996, for the purpose of allowing parents and other interested persons to purchase tuition units on behalf of a designated beneficiary. These units entitle the beneficiary to the payment of qualified tuition, room and board, fees, costs of books, supplies and equipment required for the enrollment or attendance at any accredited public or private, in-state or out-of-state institution. Children in State Custody – This fund accounts for monies held and used for the benefit of children in the custody of the state. Monies held are from various sources including the Social Security Administration. Oak Ridge Monitoring – Created in 2000 through a consent order won by the state with the United States Department of Energy (DOE), this fund is used to account for monies paid annually through fiscal year 2014 by the federal government to the state for future expenses at the Environmental Management Waste Management Facility at Oak Ridge. After the federal landfill is closed, the income generated from the corpus is to be used for monitoring and maintenance of the facility to ensure there is no radioactive leakage.
Duck River Water Supply – This fund accounts for monies received from the Tennessee Valley Authority to be held for the various Duck River utility districts. Other – Other trust arrangements under which the principal and income benefit individuals or private organizations.
Agency Funds:
Local Government Fund - The purpose of the Local Government Fund is to serve as a clearing mechanism for state-shared taxes and other funds distributed to the various counties and cities of the state. Contingent Revenue Fund - This fund is used to account for refundable deposits and other receipts held in trust until the state has the right to transfer them to operating funds or until there is proper authorization to disburse them directly to others.
ag04m88
143

State of TennesseeCombining Statement of Fiduciary Net Assets
Pension and Other Employee Benefit Trust FundsJune 30, 2004
(Expressed in Thousands)
State Employees, TotalTeachers, Higher Political Pension
Education Employees Subdivisions Other (and OtherPension Plan Pension Plan Total Employee Employee Benefit)(SETHEEPP) (PSPP) Pension Benefit Trust Trust Funds
AssetsCash and cash equivalents $ 1,102,225 $ 185,470 $ 1,287,695 $ 444 $ 1,288,139
Receivables: Member contributions 17,686 3,954 21,640 21,640 Employer contributions 12,473 11,108 23,581 23,581 Accrued interest 100,997 16,995 117,992 117,992 Accrued dividends 15,718 2,645 18,363 18,363 Foreign currency 39,400 6,630 46,030 46,030 Investments sold 72,395 12,182 84,577 84,577
Total receivables 258,669 53,514 312,183 312,183 Due from other funds 3,813 3,813 196 4,009Due from component units 3,620 3,620 3 3,623
Investments, at fair value: Short term securities 483,318 81,327 564,645 564,645 Government bonds 9,302,636 1,565,340 10,867,976 10,867,976 Corporate bonds 1,607,676 270,521 1,878,197 1,878,197 Corporate stocks 8,796,542 1,480,181 10,276,723 10,276,723 Real estate 396,641 66,742 463,383 463,383 Total investments 20,586,813 3,464,111 24,050,924 24,050,924 Total assets 21,955,140 3,703,095 25,658,235 643 25,658,878
Liabilities Accounts payable and accruals 20,641 4,559 25,200 105 25,305 Foreign currency payable 39,819 6,700 46,519 46,519
Total liabilities 60,460 11,259 71,719 105 71,824
Net assetsHeld in trust for: Pension benefits 21,894,680 3,691,836 25,586,516 25,586,516 Employees' flexible benefits 538 538
Total net assets $ 21,894,680 $ 3,691,836 $ 25,586,516 $ 538 $ 25,587,054
ag04m88
144

State of TennesseeCombining Statement of Changes in Fiduciary Net Assets
Pension and Other Employee Benefit Trust FundsFor the Fiscal Year Ended June 30, 2004
(Expressed in Thousands)
State Employees, TotalTeachers, Higher Political Other Pension
Education Employees Subdivisions Employee (and OtherPension Plan Pension Plan Total Benefit Employee Benefit)(SETHEEPP) (PSPP) Pension Trust Fund Trust Funds
Additions Contributions: Members $ 154,333 $ 50,650 $ 204,983 $ 5,565 $ 210,548 Employers 271,299 271,299 271,299 Political subdivisions 139,808 139,808 139,808
Total contributions 425,632 190,458 616,090 5,565 621,655
Investment income: Net increase in fair value of investments 1,124,041 186,771 1,310,812 1,310,812 Interest 579,748 96,331 676,079 676,079 Dividends 157,233 26,126 183,359 183,359 Real estate income 22,357 3,715 26,072 26,072
Total investment income 1,883,379 312,943 2,196,322 2,196,322
Less: Investment expenses 12,406 2,062 14,468 14,468
Net investment income 1,870,973 310,881 2,181,854 2,181,854
Total additions 2,296,605 501,339 2,797,944 5,565 2,803,509
Deductions Annuity benefits: Retirement benefits 678,022 108,324 786,346 786,346 Cost of living 145,768 17,860 163,628 163,628 Death benefits 3,149 1,329 4,478 4,478 Other benefits 5,417 5,417 Refunds 15,305 14,621 29,926 29,926 Administrative expenses 2,935 2,599 5,534 5,534
Total deductions 845,179 144,733 989,912 5,417 995,329
Change in net assets held in trust for: Pension benefits 1,451,426 356,606 1,808,032 1,808,032 Employees' flexible benefits 148 148
Net assets, July 1 20,443,254 3,335,230 23,778,484 390 23,778,874
Net assets, June 30 $ 21,894,680 $ 3,691,836 $ 25,586,516 $ 538 $ 25,587,054
ag04m88
145

State of TennesseeCombining Statement of Fiduciary Net Assets
Private-Purpose Trust FundsJune 30, 2004
(Expressed in Thousands)
Children TotalBaccalaureate in State Oak Ridge Duck River Private-Purpose
Education Custody Monitoring Water Supply Other Trust FundsAssets Cash and cash equivalents $ 5,321 $ 19,785 $ 4,171 $ 9,684 $ 1,116 $ 40,077
Receivables: Taxes 57 57 Interest and dividends 268 268 Due from sale of investments 22,592 22,592
Total receivables 22,860 57 22,917
Due from other funds 10 10 Investments, at fair value: Government bonds 33,094 33,094 Mutual funds 12,542 12,542
Total investments 45,636 45,636
Total assets 73,827 19,785 4,171 9,684 1,173 108,640
Liabilities Accounts payable and accruals 22,432 119 22,551
Total liabilities 22,432 119 22,551
Net assetsHeld in trust for: Individuals, organizations and other governments $ 51,395 $ 19,666 $ 4,171 $ 9,684 $ 1,173 $ 86,089
ag04m88
146

State of TennesseeCombining Statement of Changes in Fiduciary Net Assets
Private-Purpose Trust FundsFor the Fiscal Year Ended June 30, 2004
(Expressed in Thousands)
Children Total
Baccalaureate in State Oak Ridge Duck River Private-PurposeEducation Custody Monitoring Water Supply Other Trust Funds
Additions Contributions: Federal $ 7,604 $ 1,000 $ 8,604 Private $ 9,256 $ 587 9,843 Other 2,982 95 3,077
Total contributions 9,256 10,586 1,000 682 21,524
Investment income: Net increase in fair value of investments 578 578 Interest 1,345 193 40 $ 103 11 1,692
Total investment income 1,923 193 40 103 11 2,270
Total additions 11,179 10,779 1,040 103 693 23,794
Deductions Payments made under trust agreements 2,182 5,040 89 695 8,006 Refunds 296 2,289 2,585 Administrative expenses 313 313
Total deductions 2,791 7,329 89 695 10,904
Change in net assets held in trust for: Individuals, organizations and other governments 8,388 3,450 1,040 14 (2) 12,890
Net assets, July 1 43,007 16,216 3,131 9,670 1,175 73,199
Net assets, June 30 $ 51,395 $ 19,666 $ 4,171 $ 9,684 $ 1,173 $ 86,089
ag04m88
147

State of TennesseeCombining Statement of Fiduciary Net Assets
Agency FundsJune 30, 2004
(Expressed in Thousands)
TotalLocal Contingent Agency
Government Revenue FundsAssetsCash and cash equivalents $ 212,700 $ 67,953 $ 280,653Receivables: Taxes 260,399 260,399Due from other funds 8,009 8,009Due from component units 52 52
Total assets 473,099 76,014 549,113
Liabilities Accounts payable and accruals 473,099 17,987 491,086Amounts held in custody for others 58,027 58,027
Total liabilities $ 473,099 $ 76,014 $ 549,113
ag04m88
148

State of TennesseeCombining Statement of Changes in Assets and Liabilities
All Agency FundsFor the Fiscal Year Ended June 30, 2004
(Expressed in Thousands)
Balance BalanceLocal Government Fund July 1, 2003 Additions Deductions June 30, 2004
Assets
Cash and cash equivalents $ 216,970 $ 2,836,999 $ 2,841,269 $ 212,700Accounts receivable 253,435 278,637 271,673 260,399
Total assets $ 470,405 $ 3,115,636 $ 3,112,942 $ 473,099
Liabilities
Accounts payable and accruals $ 470,405 $ 2,508,768 $ 2,506,074 $ 473,099
Total liabilities $ 470,405 $ 2,508,768 $ 2,506,074 $ 473,099
Contingent Revenue Fund
Assets
Cash and cash equivalents $ 72,448 $ 1,299,660 $ 1,304,155 $ 67,953Due from other funds 7,916 8,108 8,015 8,009Due from component units 47 52 47 52
Total assets $ 80,411 $ 1,307,820 $ 1,312,217 $ 76,014
Liabilities
Accounts payable and accruals $ 17,778 $ 302,247 $ 302,038 $ 17,987Amount held in custody for others 62,633 660,791 665,397 58,027
Total liabilities $ 80,411 $ 963,038 $ 967,435 $ 76,014
Totals- All Agency Funds
Assets
Cash and cash equivalents $ 289,418 $ 4,136,659 $ 4,145,424 $ 280,653Accounts receivable 253,435 278,637 271,673 260,399Due from other funds 7,916 8,108 8,015 8,009Due from component units 47 52 47 52
Total assets $ 550,816 $ 4,423,456 $ 4,425,159 $ 549,113
Liabilities
Accounts payable and accruals $ 488,183 $ 2,811,015 $ 2,808,112 $ 491,086Amount held in custody for others 62,633 660,791 665,397 58,027
Total liabilities $ 550,816 $ 3,471,806 $ 3,473,509 $ 549,113
ag04m88
149

___________________________________________________________________________________________ COMPONENT UNITS ___________________________________________________________________________________________ Tennessee Student Assistance Corporation - This fund is used to account for the guaranteed loans program administered by Tennessee Student Assistance Corporation (TSAC). Community Services Agencies - In 1989, the Legislature created twelve Community Services Agencies which are to provide a mechanism to coordinate health care for indigents. In 1996, the title and focus of these agencies changed to that of facilitating the providing of services to children and other citizens from state agencies. The State has significant oversight responsibilities for these agencies, therefore, they have been incorporated into the Comprehensive Annual Financial Report. The twelve Community Services Agencies are: Northeast Community Services Agency East Tennessee Community Services Agency Upper Cumberland Community Services Agency Southeast Community Services Agency Mid-Cumberland Community Services Agency South Central Community Services Agency Northwest Community Services Agency Southwest Community Services Agency Davidson County Community Services Agency Knox County Community Services Agency Shelby County Community Services Agency Hamilton County Community Services Agency Housing Development Agency - Created by the legislature in 1973, the purpose of this agency is to improve the quality of housing available to lower and moderate income Tennesseans. This objective is accomplished in part by (1) making funds available for loans for residential construction or rehabilitation, (2) making or participating in the making of insured mortgage loans and (3) purchasing existing mortgages from lending institutions. These programs are funded primarily from the sale of revenue bonds or notes. Tennessee Education Lottery Corporation – Created by the General Assembly in 2003, the purpose of the corporation is to operate a state lottery with net proceeds to be given to the State to be used for educational programs and purposes in accordance with the Constitution of Tennessee. Tennessee Board of Regents - The Tennessee University and Community College System was created by the General Assembly in 1972. Its member institutions (six universities, thirteen community colleges, and twenty-seven technology centers) serve the state and its citizenry by providing education opportunities, research, continuing education and public activities. As a system, the institutions span the state and operate as a coordinated network of public education with each campus offering unique characteristics and services. The system consists of the following institutions:
UNIVERSITIES Austin Peay State University Clarksville East Tennessee State University Johnson City Middle Tennessee State University Murfreesboro Tennessee State University Nashville Tennessee Technological University Cookeville University of Memphis Memphis
COMMUNITY COLLEGES Chattanooga State Technical Community College Chattanooga Cleveland State Community College Cleveland Columbia State Community College Columbia Dyersburg State Community College Dyersburg Jackson State Community College Jackson Motlow State Community College Tullahoma Nashville State Technical Community College Nashville Northeast State Technical Community College Blountville Pellissippi State Technical Community College Knoxville Roane State Community College Harriman Southwest Tennessee Community College Memphis Volunteer State Community College Gallatin Walters State Community College Morristown
TECHNOLOGY CENTERS
Athens McKenzie Chattanooga McMinnville Covington Memphis Crossville Morristown Crump Murfreesboro Dickson Nashville Elizabethton Newbern Harriman Oneida Hartsville Paris Hohenwald Pulaski Jacksboro Ripley Jackson Shelbyville Knoxville Whiteville Livingston The purpose of the technology centers is to provide occupational and technical training for current and future employees of existing and prospective industries and businesses of this state. The University of Tennessee Board of Trustees - The University of Tennessee was first established in 1794 by the Legislature of the Federal Territory. Since that time, it has grown into an institution of twenty-four different colleges and schools. The locations of its four primary campuses, various experimental stations and extension services have made the university state-wide in physical presence as well as in services. The main campus is located in Knoxville. The other primary campuses are located in Memphis, Martin and Chattanooga.
ag04m88
150

Local Development Authority - This authority was created in 1978 for the purpose of providing to local governments, through the issuing of revenue bonds or notes, the financing assistance previously provided by the State Loan Program. The Authority has also issued bonds to assist non-profit corporations in the construction of mental health, mental retardation, or alcohol and drug facilities. In addition, the Authority may assist small business concerns in financing pollution control facilities, farmers in financing certain capital improvements and airport authorities and municipal airports in financing improvements. Veterans' Homes Board - Created in 1988, the primary purpose of the homes is to provide support and care for honorably discharged veterans of the United States Armed Forces. The revenue sources are the Veterans' Administration, Medicaid, and a user fee. Child Care Facilities - This organization was formed to create new child care slots in Tennessee by guaranteeing loans, making direct loans, and making grants. The sources of revenues are interest on loans made and grants from the federal government.
Tennessee State School Bond Authority (TSSBA) - Established in 1965, the TSSBA provides a mechanism for financing building projects for the state's universities. Agreements are executed between the governing boards of the institutions and the TSSBA, and revenue bonds are issued using the constructed facilities as collateral. Charges levied on the universities provide the funds necessary for payment of principal and interest on bonds. In addition, the Authority issues Qualified Zone Academy Bonds, which are part of a federal government program to finance loans to qualifying K-12 schools in the state. Certified Cotton Growers’ Organization - This organization was formed to aid in the eradication of the boll weevil. Revenues are collected from assessments on cotton growers and from state appropriations.
ag04m88
151

State of TennesseeCombining Statement of Net Assets
Component UnitsJune 30, 2004
(Expressed in Thousands)
Governmental Fund TypesTennessee
StudentAssistance East Upper Mid-
Corporation Northeast Tennessee Cumberland Southeast CumberlandAssetsCash and cash equivalents $ 2,666 $ 445 $ 1,175 $ 306 $ 659 $ 404Cash on deposit with fiscal agentInvestmentsInvestments with fiscal agentReceivables, net 317 30 14 60 7 23Due from primary government 883 1,113 266 958 1,057Inventories, at costPrepayments 8 1 2 22Loans receivable 5,904Deferred charges and other
Restricted assets: Cash and cash equivalents Investments Receivables, net
Capital assets: Land, at cost Infrastructure Structures and improvements, at cost Machinery and equipment, at cost 20 31 168 66 87 242 Less accumulated depreciation (20) (25) (131) (30) (68) (197) Construction in progress
Total assets 8,887 1,364 2,347 669 1,645 1,551
Liabilities Accounts payable and accruals 2,098 392 471 208 233 1,173Due to primary government 14 353 217 32 491 30Unearned revenue 127Advance from federal government 423OtherNoncurrent liabilities: Due within one year 56 87 90 54 37 96 Due in more than one year 60 108 49 53 39 106
Total liabilities 2,778 940 827 347 800 1,405
Net assets Invested in capital assets, net of related debt 6 36 28 19 11Restricted for: Debt service Capital projects Single family bond programs Other Permanent and endowment: Expendable NonexpendableUnrestricted 6,109 418 1,484 294 826 135
Total net assets $ 6,109 $ 424 $ 1,520 $ 322 $ 845 $ 146
ag04m88
152

Governmental Fund Types
South Davidson Knox Shelby HamiltonCentral Northwest Southwest County County County County
$ 240 $ 480 $ 542 $ 444 $ 127 $ 231 $ 280
25 2 273 1 28 521 530 542 631 373 2,346 286
1 2 7 5 1 2
26 36 36 55 318 28(21) (23) (31) (48) (259) (22)
767 1,050 1,098 1,348 513 2,665 574
153 181 324 1,085 188 1,184 151148 384 255 45 89 32
31 76 101 48 159 2832 66 83 18 28 30
364 707 763 1,085 299 1,460 241
5 12 5 56 6
398 331 330 263 214 1,149 327
$ 403 $ 343 $ 335 $ 263 $ 214 $ 1,205 $ 333
(continued on next page)
ag04m88
153
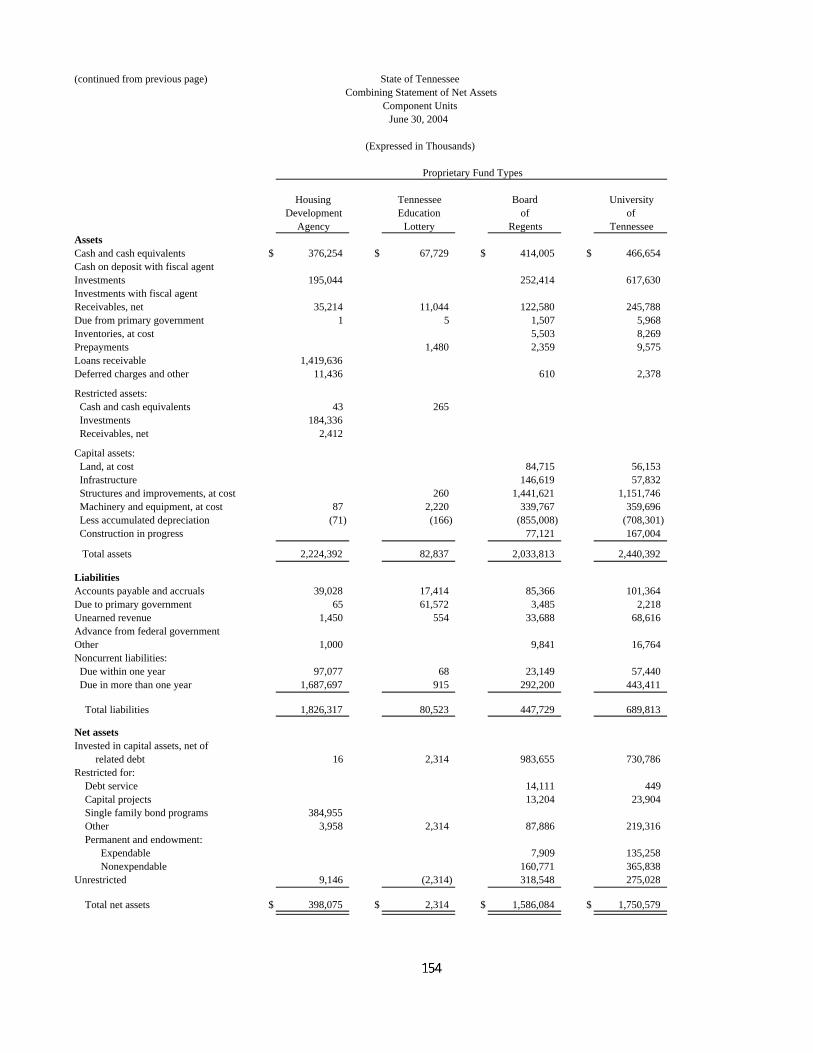
(continued from previous page) State of TennesseeCombining Statement of Net Assets
Component UnitsJune 30, 2004
(Expressed in Thousands)
Proprietary Fund Types
Housing Tennessee Board UniversityDevelopment Education of of
Agency Lottery Regents TennesseeAssetsCash and cash equivalents $ 376,254 $ 67,729 $ 414,005 $ 466,654Cash on deposit with fiscal agentInvestments 195,044 252,414 617,630Investments with fiscal agentReceivables, net 35,214 11,044 122,580 245,788Due from primary government 1 5 1,507 5,968Inventories, at cost 5,503 8,269Prepayments 1,480 2,359 9,575Loans receivable 1,419,636Deferred charges and other 11,436 610 2,378
Restricted assets: Cash and cash equivalents 43 265 Investments 184,336 Receivables, net 2,412
Capital assets: Land, at cost 84,715 56,153 Infrastructure 146,619 57,832 Structures and improvements, at cost 260 1,441,621 1,151,746 Machinery and equipment, at cost 87 2,220 339,767 359,696 Less accumulated depreciation (71) (166) (855,008) (708,301) Construction in progress 77,121 167,004
Total assets 2,224,392 82,837 2,033,813 2,440,392
LiabilitiesAccounts payable and accruals 39,028 17,414 85,366 101,364Due to primary government 65 61,572 3,485 2,218Unearned revenue 1,450 554 33,688 68,616Advance from federal government Other 1,000 9,841 16,764Noncurrent liabilities: Due within one year 97,077 68 23,149 57,440 Due in more than one year 1,687,697 915 292,200 443,411
Total liabilities 1,826,317 80,523 447,729 689,813
Net assetsInvested in capital assets, net of related debt 16 2,314 983,655 730,786Restricted for: Debt service 14,111 449 Capital projects 13,204 23,904 Single family bond programs 384,955 Other 3,958 2,314 87,886 219,316 Permanent and endowment: Expendable 7,909 135,258 Nonexpendable 160,771 365,838Unrestricted 9,146 (2,314) 318,548 275,028
Total net assets $ 398,075 $ 2,314 $ 1,586,084 $ 1,750,579
ag04m88
154

Proprietary Fund Types State
Local Veterans' School Certified TotalDevelopment Homes Child Care Bond Cotton Component
Authority Board Facilities Authority Growers' Units
$ 15,269 $ 3,079 $ 9 $ 58,222 $ 4,722 $ 1,413,942 1 1
1,393 29 1,066,5105 5
226 285 403 4,395 173 420,888 16,987
62 13,8346 13,471
77,144 28 495,243 1,997,955339 58 5,496 470 20,787
1,233 5,299 6,8404,537 11,601 200,474
2,412
194 141,062734 205,185
10,353 2,603,9801,975 704,858
(4,239) (1,568,660)422 244,547
98,908 14,191 440 580,262 5,365 7,505,078
1,052 1,210 127 4,176 95 257,673
985 1 70,416 10,365 114,800
423133 18 27,756
51,054 160 5 22,420 3,253 255,48935,654 3,753 5 537,121 21,600 3,023,028
87,760 6,241 156 574,082 24,948 3,749,585
5,526 1,722,481
479 15,03937,108
384,955351 621 314,446
143,167526,609
10,797 1,324 284 6,180 (19,583) 611,688
$ 11,148 $ 7,950 $ 284 $ 6,180 $ (19,583) $ 3,755,493
ag04m88
155

State of TennesseeCombining Statement of Activities
Component UnitsFor the Year Ended June 30, 2004
(Expressed in Thousands)Net
(Expense)Program Revenues Revenue
Charges Operating Capital and Changes for Grants and Grants and in
Functions/Programs Expenses Services Contributions Contributions Net AssetsComponent units Higher education institutions: Board of Regents $ 1,576,409 $ 563,166 $ 364,753 $ 31,762 $ (616,728) University of Tennessee 1,378,761 393,990 576,993 36,979 (370,799)
Total higher education institutions 2,955,170 957,156 941,746 68,741 (987,527)
Loan programs: Tennessee Student Assistance Corporation 45,440 1,780 2,328 (41,332) Housing Development Agency 257,141 105,937 143,463 (7,741) Local Development Authority 3,726 2,911 359 (456) Child Care Facilities 447 1 343 (103) State School Bond Authority 23,369 22,956 423 10
Total loan programs 330,123 133,585 146,916 (49,622)
Lottery program 395,254 393,010 4,363 2,119
Other programs: Northeast 5,967 496 5,370 (101) East Tennessee 6,938 629 6,327 18 Upper Cumberland 4,078 355 3,613 (110) Southeast 3,415 389 2,997 (29) Mid-Cumberland 8,268 735 7,564 31 South Central 3,190 275 2,894 (21) Northwest 4,118 122 3,954 (42) Southwest 6,018 163 5,802 (53) Davidson County 5,498 5,485 (13) Knox County 2,780 2,776 (4) Shelby County 7,799 533 7,271 5 Hamilton County 2,358 2,352 (6) Veterans' Homes Board 12,489 12,126 46 (317) Certified Cotton Growers' 11,968 11,167 1,932 1,131
Total other programs 84,884 26,990 58,383 489
Total $ 3,765,431 $ 1,510,741 $ 1,151,408 $ 68,741 $ (1,034,541)
ag04m88
156

General RevenuesPayments Contributions
from Unrestricted Unrestricted to Change Net NetPrimary Grants and Investment Permanent In Net Assets Assets
Government Contributions Earnings Miscellaneous Funds Assets July 1 June 30
$ 625,339 $ 30,445 $ 8,298 $ 8,854 $ 8,008 $ 64,216 $ 1,521,868 $ 1,586,084416,422 5,405 8,287 19,728 79,043 1,671,536 1,750,579
1,041,761 35,850 16,585 8,854 27,736 143,259 3,193,404 3,336,663
42,035 703 5,406 6,109100 (7,641) 405,716 398,075
25 (431) 11,579 11,148(103) 387 284
10 6,170 6,180
42,060 100 (7,462) 429,258 421,796
195 2,314 - 2,314
3 (98) 522 42413 31 1,489 1,520
42 4 (64) 386 32224 7 2 843 845
2 33 113 1469 2 (10) 413 403
5 (37) 380 3435 (48) 383 3353 (10) 273 2631 (3) 217 2143 8 1,197 1,2053 (3) 336 333
75 (242) 8,192 7,9504,095 34 5,260 (24,843) (19,583)
4,170 75 85 4,819 (10,099) (5,280)
$ 1,087,991 $ 35,925 $ 16,965 $ 8,854 $ 27,736 $ 142,930 $ 3,612,563 $ 3,755,493
ag04m88
157

State of TennesseeCombining Statement of Revenues, Expenditures, and Changes in Fund Balances
Governmental Fund Type Component UnitsFor the Fiscal Year Ended June 30, 2004
(Expressed in Thousands)
Tennessee Student
Assistance East Upper Mid-Corporation Northeast Tennessee Cumberland Southeast Cumberland
Revenues Interest on investments $ 3 $ 13 $ 4 $ 7 $ 2 Federal $ 2,328 677 170 356 Departmental services 43,804 5,866 6,949 3,333 3,240 7,940 Other 8 2
Total revenues 46,132 5,869 6,970 4,014 3,417 8,300
Expenditures Education 45,399 Health and social services 5,944 6,912 4,064 3,428 8,223
Total expenditures 45,399 5,944 6,912 4,064 3,428 8,223
Excess (deficiency) of revenues over (under) expenditures 733 (75) 58 (50) (11) 77
Fund balances, July 1 5,492 689 1,564 443 913 227
Fund balances, June 30 $ 6,225 $ 614 $ 1,622 $ 393 $ 902 $ 304
Reconciliation to net assets:
Fund balances per above $ 6,225 $ 614 $ 1,622 $ 393 $ 902 $ 304
Capital assets used in governmental activities are not financial resources and therefore are not reported in the funds. 6 36 36 19 45
Long-term liabilities are not due and payable in the current period and therefore are not reported in in the fund. (116) (196) (138) (107) (76) (203)
Net assets on Statement of Net Assets $ 6,109 $ 424 $ 1,520 $ 322 $ 845 $ 146
ag04m88
158

Total Governmental
Fund TypeSouth Davidson Knox Shelby Hamilton Component
Central Northwest Southwest County County County County Units
$ 2 $ 5 $ 5 $ 3 $ 1 $ 3 $ 3 $ 51
9 82 3,6223,178 4,076 5,965 5,476 2,776 7,680 2,352 102,635
10
3,180 4,081 5,970 5,488 2,777 7,765 2,355 106,318
45,3993,195 4,111 6,013 5,498 2,782 7,749 2,356 60,275
3,195 4,111 6,013 5,498 2,782 7,749 2,356 105,674
(15) (30) (43) (10) (5) 16 (1) 644
475 502 557 273 278 1,318 387 13,118
$ 460 $ 472 $ 514 $ 263 $ 273 $ 1,334 $ 386 $ 13,762
$ 460 $ 472 $ 514 $ 263 $ 273 $ 1,334 $ 386 $ 13,762
6 12 5 7 58 5 235
(63) (141) (184) (66) (187) (58) (1,535)
$ 403 $ 343 $ 335 $ 263 $ 214 $ 1,205 $ 333 $ 12,462
ag04m88
159

State of TennesseeCombining Statement of Revenues, Expenses, and Changes in Fund Net Assets
Proprietary Fund Type Component UnitsFor the Fiscal Year Ended June 30, 2004
(Expressed in Thousands)
Housing Tennessee Board UniversityDevelopment Education of of
Agency Lottery Regents TennesseeOperating revenues Charges for services $ 103,549 $ 392,741 $ 731,604 $ 775,162 Investment income (67) 2,063 4,099 Other 2,388 269 35,778 28,704
Total operating revenues 105,870 393,010 769,445 807,965
Operating expenses Personal services 8,702 5,787 984,041 972,755 Contractual services 1,560 39,915 Mortgage service fees 5,135 Materials and supplies 559 402,023 293,540 Rentals and insurance 1,035 843 Interest 83,326 Depreciation and amortization 672 166 67,923 64,396 Lottery prizes 216,972 Nursing home services Scholarships and fellowships 107,613 15,211 Other 6,342 6,228
Total operating expenses 107,331 269,911 1,561,600 1,345,902
Operating income (loss) (1,461) 123,099 (792,155) (537,937)
Nonoperating revenues (expenses Grant income 143,630 159,304 48,051 Grant expense (149,810) Interest expense (21) (11,731) (11,782) Interest income 195 30,603 89,387 Payments from primary government 625,339 416,422 Grants and contributions 3,946 Gifts 11,185 35,327 Payments to primary government (125,322) Other 4,363 2,694 (17,038)
Total nonoperating revenues (expenses) (6,180) (120,785) 817,394 564,313 Income (loss) before capital grants and contributions (7,641) 2,314 25,239 26,376
Capital payments from primary government 27,686 21,725Capital grants and gifts 4,076 15,253Additions to permanent endowments 8,008 19,728Other (793) (4,039)
Change in net assets (7,641) 2,314 64,216 79,043
Net assets, July 1 405,716 - 1,521,868 1,671,536
Net assets, June 30 $ 398,075 $ 2,314 $ 1,586,084 $ 1,750,579
ag04m88
160

Total State Proprietary
Local Veterans' School Certified Fund TypeDevelopment Homes Child Care Bond Cotton Component
Authority Board Facilities Authority Growers' Units
$ 2,911 $ 12,116 $ 1 $ 22,956 $ 11,167 $ 2,052,207359 2 423 6,879
10 67,149
3,270 12,126 3 23,379 11,167 2,126,235
89 1,971,374425 527 10,094 52,521
5,1351 696,1231 1,879
2,860 22,273 108,45926 436 229 133,848
216,97211,658 11,658
122,824415 15 340 42 13,382
3,726 12,094 106 23,369 10,136 3,334,175
(456) 32 (103) 10 1,031 (1,207,940)
341 351,326(341) (150,151)
(225) (1,832) (25,591)46 34 120,265
25 4,095 1,045,8811,932 5,878
75 46,587(125,322)
(170) (10,151)
25 (274) 4,229 1,258,722
(431) (242) (103) 10 5,260 50,782
49,41119,32927,736(4,832)
(431) (242) (103) 10 5,260 142,426
11,579 8,192 387 6,170 (24,843) 3,600,605
$ 11,148 $ 7,950 $ 284 $ 6,180 $ (19,583) $ 3,743,031
ag04m88
161

State of TennesseeStatement of Fiduciary Net Assets
Component UnitsTennessee Student Assistance Corporation
Federal Family Education Loan Trust June 30, 2004
(Expressed in Thousands)
AssetsCash and cash equivalents $ 62,937
Receivables: Federal 1,236 Loans 16,713
Total receivables 17,949 Total assets 80,886
Liabilities Accounts payable and accruals 2,128
Total liabilities 2,128
Net assetsHeld in trust for student loans $ 78,758
ag04m88
162
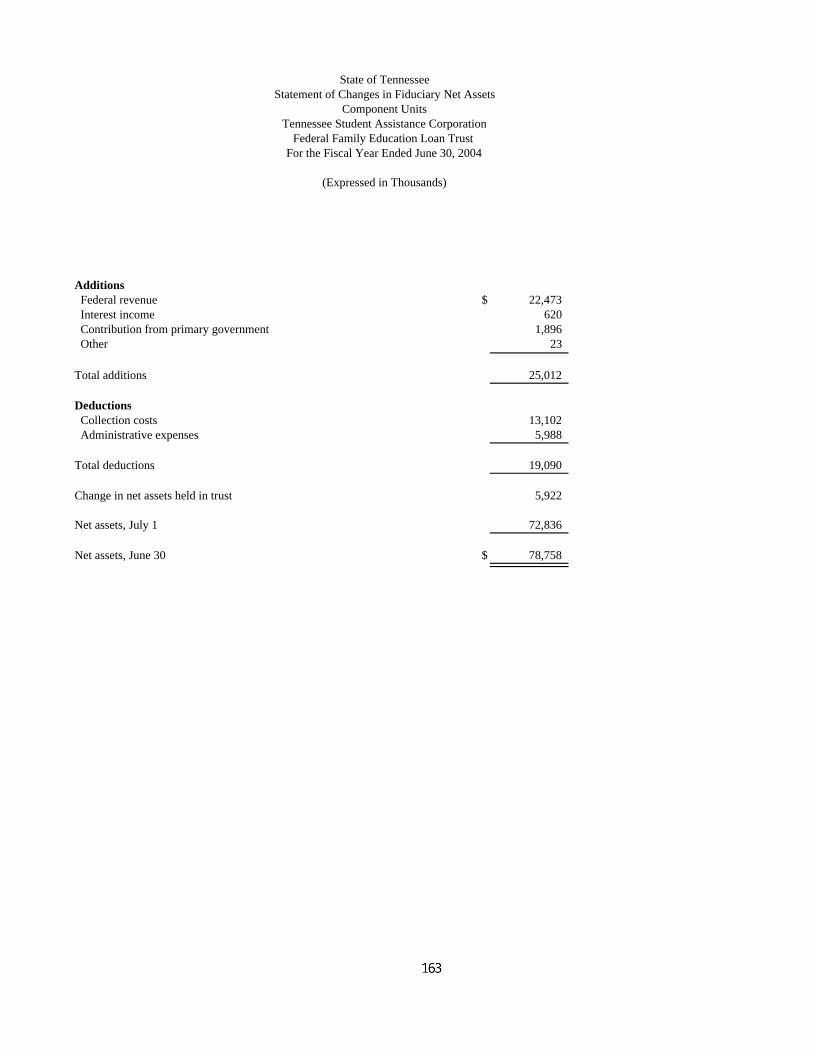
State of TennesseeStatement of Changes in Fiduciary Net Assets
Component UnitsTennessee Student Assistance Corporation
Federal Family Education Loan Trust For the Fiscal Year Ended June 30, 2004
(Expressed in Thousands)
Additions Federal revenue $ 22,473 Interest income 620 Contribution from primary government 1,896 Other 23
Total additions 25,012
Deductions Collection costs 13,102 Administrative expenses 5,988
Total deductions 19,090
Change in net assets held in trust 5,922
Net assets, July 1 72,836
Net assets, June 30 $ 78,758
ag04m88
163

___________________________________________________________________________________________ SUPPLEMENTARY SCHEDULES ___________________________________________________________________________________________
ag04m88
164

State of Tennessee Schedule 1Debt Service Requirements to Maturity
General Obligation BondsJune 30, 2004
(Expressed in Thousands)
General Long-Term Debt State Loan Program Fund Debt (Note 1) Facilities Revolving Fund Debt (Note 2)For the Total Total Total
Year Ended Require- Require- Require-June 30 Principal Interest ments Principal Interest ments Principal Interest ments
2005 $ 82,386 $ 49,296 $ 131,682 $ 2,859 $ 363 $ 3,222 $ 13,462 $ 6,849 $ 20,3112006 82,248 45,068 127,316 1,674 222 1,896 13,440 6,146 19,5862007 73,659 40,913 114,572 864 140 1,004 12,024 5,470 17,4942008 68,444 37,382 105,826 899 101 1,000 11,589 4,896 16,4852009 68,064 34,156 102,220 929 60 989 11,549 4,347 15,8962010 66,539 30,905 97,444 959 27 986 10,480 3,814 14,2942011 66,408 27,642 94,050 10,446 3,310 13,7562012 62,706 24,340 87,046 10,408 2,798 13,2062013 62,930 21,188 84,118 10,378 2,286 12,6642014 57,016 18,019 75,035 10,117 1,774 11,8912015 52,494 15,152 67,646 6,528 1,297 7,8252016 48,328 12,509 60,837 5,527 1,079 6,6062017 43,896 10,086 53,982 4,404 803 5,2072018 36,491 7,878 44,369 3,674 581 4,2552019 27,768 6,027 33,795 3,193 395 3,5882020 24,162 4,615 28,777 3,035 236 3,2712021 18,684 3,391 22,075 1,145 88 1,2332022 18,732 2,562 21,294 1,133 46 1,1792023 11,323 1,764 13,087 331 8 3392024 11,108 1,461 12,569 318 5 3232025 3,065 1,134 4,1992026 3,260 941 4,2012027 3,255 740 3,9952028 3,465 532 3,9972029 3,720 275 3,995
TOTALS $ 1,000,151 $ 397,976 $ 1,398,127 $ 8,184 $ 913 $ 9,097 $ 143,181 $ 46,228 $ 189,409
Note 1: Tennessee State Loan Program principal is more than that presented in the accompanying financial statements by $113 thousand, which is a deduction from bonds payable for the deferred amount on refunding.
Note 2: Facilities Revolving Fund principal is more than that presented in the accompanying financial statements by $2.306 million, which is a deduction from bonds payable for the deferred amount on refunding.
ag04m88
165

State of Tennessee Schedule 2Schedule of Outstanding Debt
All Fund TypesFor the Last Five Fiscal Years
(Expressed in Thousands)
June 30
2000 2001 2002 2003 2004
Enterprise Funds: State Loan Program General Obligation Bonds $ 20,347 $ 17,213 $ 13,924 $ 11,070 $ 8,071
Internal Service Funds: General Obligation Commercial Paper 38,754 9,485 4,131 7,936 12,684 Facilities Revolving Fund General Obligation Bonds 125,448 150,747 160,181 147,197 140,875
164,202 160,232 164,312 155,133 153,559
General Long-Term Debt: General Obligation Bonds 858,273 898,709 974,700 900,334 1,000,151 General Obligation Commercial Paper 209,746 240,515 106,569 193,864 70,091
1,068,019 1,139,224 1,081,269 1,094,198 1,070,242
Totals for Primary Government $ 1,252,568 $ 1,316,669 $ 1,259,505 $ 1,260,401 $ 1,231,872
State of Tennessee Schedule 3Schedule of General Obligation
Commercial Paper Outstanding- By PurposeAll Fund TypesJune 30, 2004
(Expressed in Thousands)
General Obligation Commercial Paper - Tax Exempt $ 76,975 Purpose: To finance the construction, improvements, repairs, and replacements o
buildings and facilities and the acquisition of land, equipment and otherproperty of the state.
General Obligation Commercial Paper - Taxable Purpose: To finance improvements to Mental Health and Mental Retardation Facilities 5,800
Total Outstanding $ 82,775
ag04m88
166

State of Tennessee Schedule 4Schedule of Outstanding Debt
Component UnitsFor the Last Five Fiscal Years
(Expressed in Thousands)
June 30
2000 2001 2002 2003 2004
Component units: Mid-Cumberland Community Services Agency notes $ 23 Certified Cotton Growers' notes $ 7,530 $ 23,704 $ 32,306 $ 29,386 24,853 Local Development Authority notes 37,631 45,025 51,513 48,950 48,134 Local Development Authority bonds 58,263 54,559 50,664 43,644 32,774 Tennessee Housing Development Agency bonds 1,872,661 1,850,495 1,820,394 1,769,506 1,489,299 Tennessee Housing Development Agency notes 31,180 84,865 67,909 51,070 273,240 Veterans' Homes Board loan 4,053 Veterans' Homes Board bonds 4,887 4,730 4,567 4,400 Tennessee State School Bond Authority bonds 271,814 359,225 471,136 449,809 527,385 Tennessee State School Bond Authority commercial paper 102,700 60,277 13,757 46,747 32,156 University of Tennessee notes 51 31 10 75 University of Tennessee bonds 147,561 Board of Regents notes 1,778 798 1,284 688 746 Board of Regents bonds 1,175 872 551 236 80
$ 2,389,670 $ 2,484,581 $ 2,514,091 $ 2,444,436 $ 2,580,379
ag04m88
167

___________________________________________________________________________________________ TATISTICAL AND S ECONOMIC DATA ___________________________________________________________________________________________ The Statistical Data are presented to give report users a better historical perspective and assist in assessing current financial status and trends of the governmental unit. Economic Data are presented to allow a broader understanding of the economic and social environment in which State government operates.
ag04m88
168

Table IState of Tennessee
Revenues by Source and Transfers InAll Governmental Fund Types
For the Last Ten Years
(Expressed in Thousands)
For the Year Ended June 30Sources 1995 1996 1997 1998 1999 2000 2001 2002 2003 2004
Taxes $ 5,970,140 $ 6,237,102 $ 6,604,037 $ 6,967,790 $ 7,212,642 $ 7,778,475 $ 7,900,810 $ 7,718,442 $ 8,695,598 $ 9,357,356
Licenses, fines, fees and permits 333,097 345,148 353,516 370,419 392,261 423,614 435,886 460,920 480,629 505,538
Interest on investments 36,580 24,183 19,296 35,977 47,683 53,819 92,127 36,618 28,429 34,102
Federal 4,209,340 4,335,071 4,636,905 4,831,199 5,124,273 5,537,353 6,184,126 6,694,648 7,646,384 8,417,534
Departmental services 1,198,117 1,258,672 1,034,678 1,129,859 1,282,634 1,512,483 1,748,165 1,607,251 1,716,159 2,071,252
Other 37,725 21,113 22,624 47,537 40,155 352,183 356,029 444,450 384,536 488,769
Transfers in 495,467 485,767 580,618 545,432 565,885 472,275 567,901 766,097 679,743 661,064
Total revenues and transfers in- all governmental fund types $ 12,280,466 $ 12,707,056 $ 13,251,674 $ 13,928,213 $ 14,665,533 $ 16,130,202 $ 17,285,044 $ 17,728,426 $ 19,631,478 $ 21,535,615
Table IIState of Tennessee
Expenditures by Function and Transfers OutAll Governmental Fund Types
For the Last Ten Years
(Expressed in Thousands)
For the Year Ended June 30Function 1995 1996 1997 1998 1999 2000 2001 2002 2003 2004
General government $ 290,305 $ 282,149 $ 287,635 $ 289,194 $ 345,746 $ 330,255 $ 349,278 $ 358,523 $ 392,747 $ 400,069
Education 2,283,546 2,368,196 2,535,513 2,731,599 2,859,303 2,947,577 3,059,538 4,218,637 4,432,071 4,630,294 Health and social services 5,615,339 5,790,343 5,829,651 6,094,595 6,596,034 7,446,923 8,641,777 9,250,026 10,342,682 11,308,871 Law, justice and public safety 717,364 729,663 694,610 742,714 825,010 872,353 897,805 914,307 970,042 1,042,510
Recreation and resources development 355,166 365,586 385,673 372,119 382,614 429,389 419,423 446,137 442,915 479,243
Regulation of business and professions 34,922 36,919 41,598 41,402 46,346 49,325 57,988 65,040 71,109 88,580
Transportation 1,003,796 1,023,381 1,079,683 1,145,536 1,164,776 1,271,170 1,269,773 1,311,654 1,357,941 1,318,913
State shared taxes paid to local governments 534,641 550,633 572,821 607,070 629,904 653,989 681,151 686,515 641,271 647,654
Debt service 93,400 94,575 92,286 100,556 111,530 123,783 122,221 123,707 126,722 132,144
Capital outlay 164,059 98,335 79,769 121,651 105,889 70,866 55,679 145,590 132,949 128,167
Transfers out 1,471,327 1,518,869 1,651,160 1,563,095 1,693,625 1,619,425 1,748,989 787,813 708,252 691,729
Total expenditures and transfers out - all governmental fund types $ 12,563,865 $ 12,858,649 $ 13,250,399 $ 13,809,531 $ 14,760,777 $ 15,815,055 $ 17,303,622 $ 18,307,949 $ 19,618,701 $ 20,868,174
Note: The Governmental Fund Types include General, Education, Highway, Special Revenue, Debt Service, Capital Projects and Permanent Funds.
ag04m88
169

Table IIIState of Tennessee
Tax Revenues by SourceAll Governmental Fund Types
For the Last Ten Years
(Expressed in Thousands)
For the Year Ended June 30Tax Revenue 1995 1996 1997 1998 1999 2000 2001 2002 2003 2004
Sales and use $ 3,475,229 $ 3,681,461 $ 3,904,964 $ 4,099,928 $ 4,346,209 $ 4,600,658 $ 4,643,337 $ 4,647,768 $ 5,459,444 $ 5,810,784
Services 513 424 Gasoline 543,170 551,347 558,629 579,162 584,249 576,640 569,422 575,349 600,138 599,327 Motor fuel 120,876 125,177 125,397 131,632 140,887 152,771 173,418 151,034 155,403 167,731
Petroleum products 39,384 39,209 39,132 40,289 41,614 60,432 61,487 61,624 60,858 62,378
Income 101,285 114,750 128,273 161,304 160,352 179,904 199,397 171,073 102,939 139,992
Privilege 115,122 130,135 139,019 150,564 166,074 177,244 181,175 205,029 237,772 272,416
Gross receipts 180,012 175,878 188,202 188,808 197,542 213,147 229,210 230,582 216,536 219,129
Alcoholic beverage 66,201 67,595 69,869 71,522 74,736 77,221 79,854 81,616 90,237 93,866
Franchise 273,519 280,056 399,482 313,342 318,666 519,879 467,900 428,590 475,985 510,650
Excise 516,052 537,597 493,785 592,848 572,567 563,163 634,902 537,711 595,715 687,153
Inheritance and estate 55,665 60,356 58,970 121,847 83,198 94,704 89,676 104,481 83,148 90,718
Tobacco 85,160 85,371 85,449 86,093 84,492 82,540 82,814 85,596 114,717 119,689
Insurance companies premiums 211,302 204,557 224,099 243,355 242,849 271,194 280,561 265,473 302,388 327,031
Medicaid provider 115,263 110,853 115,755 118,885 117,366 116,190 115,909 100,976 101,700 100,229
Other 71,387 72,336 73,012 68,211 81,841 92,788 91,748 71,540 98,618 156,263
Total tax revenues- all governmental fund types $ 5,970,140 $ 6,237,102 $ 6,604,037 $ 6,967,790 $ 7,212,642 $ 7,778,475 $ 7,900,810 $ 7,718,442 $ 8,695,598 $ 9,357,356
ag04m88
170

STATE OF TENNESSEE DESCRIPTION OF TAX SOURCES
ALL GOVERNMENTAL FUND TYPES JUNE 30, 2004
Presented below is a brief description of the state’s principal tax sources as shown in the preceding table. SALES AND USE TAX – The retail sales and use tax, imposed in 1947, is the state’s leading source of revenue. The current rate of 7.0% on most non-food items was made effective July 15, 2002. The rate on food remains at 6%. There is an additional tax of 2.75% on the sale or use of any single article on the amount in excess of $1,600 up to $3,200. The tax is applied to the sale, use, consumption, distribution, lease or rental of tangible personal property and certain services and, effective July 1, 1984, was extended to include most admission and amusement charges. Political subdivisions, governmental agencies, charitable and religious groups, non-profit organizations and certain items of tangible personal property, including prescription drugs, are exempt. SERVICES TAX – The services tax was enacted as of July 1, 1992. Vendors are taxed at a rate of 6.75% for services provided such as repairs to equipment, installation of equipment and certain other specific services. This act repeals the state and local use tax on services and amusements as well as exempting certain services from the tax altogether. The services tax expired December 31, 1993. GASOLINE TAX – The gasoline tax was first enacted in 1923. The tax was increased to 20 cents per gallon on July 1, 1989, and is charged on each gallon of gasoline or distillate refined, manufactured, sold, stored or distributed in Tennessee, as well as gasoline or distillate imported into the state. Refunds are granted on gasoline used for agricultural purposes, while political subdivisions and governmental agencies are exempt. MOTOR FUEL TAX – The motor fuel tax was enacted in 1941. The tax was imposed on the sale of diesel fuel and as of April 1, 1990 the current rate is 17 cents per gallon. Effective July 1, 1984, a tax was levied on motor vehicles powered by liquified gas at rates ranging from $70 for passenger cars to $114 for the largest trucks. Owners of commercial vehicles may be charged additional tax based on number of miles driven in Tennessee. Effective April 1, 1989, out of state residents are taxed at a rate of 14 cents per gallon of liquified gas. SPECIAL PETROLEUM PRODUCTS TAX – The special Petroleum Products Tax (formerly Gasoline Inspection Fee) was first enacted in 1899 for the purpose of assuring that gasoline and oil sold in the state met certain minimum standards. The rate was 1 cent per gallon in 1967 and went to 1.4 cents per gallon on May 1, 1990 when the 0.4 cent per gallon environmental assurance fee was added. Both are imposed on volatile substances having certain gravity levels, which are produced from petroleum, natural gas, oil shales, or coal. INCOME TAX – Although Tennessee does not levy a general personal income tax, income derived from dividends and interest on stocks and bonds has been subject to tax since 1929. The tax rate is 6% on dividends from stocks, and interest on bonds, subject to an exemption of $1,250 for individuals and $2,500 for joint tax returns. Blind persons, pension trusts, profit-sharing trusts and qualifying low income persons 65 years of age or older are exempt from the tax. PRIVILEGE TAX – The first state privilege tax in Tennessee was levied in 1799. During the ensuing 125 years, 132 business activities were made subject to the tax. Virtually all of these business-related privilege taxes were abolished in 1971 and re-enacted as part of other taxes. Currently, the privilege tax base is provided from litigation taxes, realty transfer, mortgage taxes, marriage license fees, professional taxes, tire taxes, auto rental taxes, bail bond fees, and auto oil tax. GROSS RECEIPTS TAXES – There have been numerous additions, deletions and alterations in the group of taxable privileges comprising the gross receipts tax since it was first imposed in 1937. Currently, the tax covers bottlers, mixing bars, utilities, and firearms. TVA payments “in lieu of taxes” based on power sales in Tennessee make up over 85% of collections. ALCOHOLIC BEVERAGE TAX – The alcoholic beverage tax was enacted in 1939, authorizing the sale of alcoholic beverages in counties and municipalities in Tennessee if approved by local referendum. It provided for a system of state licensing fees and established a gallonage tax on wines and liquors sold in the state. Currently, the tax is levied at the rate of $4.40 per gallon on distilled spirits and $1.21 per gallon on wines, with additional fees for regulatory purposes and for the issuance of licenses and permits. FRANCHISE TAX – The franchise tax, first collected in 1937, imposes an annual tax for the privilege of engaging in business in the form of a corporation, Limited Liability Corporation and Limited Liability Partnership in the state. The tax is levied at the rate of .25% of the greater of net worth or real and tangible property on domestic and foreign corporations operating in Tennessee. EXCISE TAX – The excise tax originated in 1923 and has always been a major revenue source. The tax is presently applied at the rate of 6.5% on annual net earnings from business corporations, co-operatives conducted for profit, joint stock associations, business trusts, state banks, national banks and savings and loan associations. INHERITANCE, ESTATE AND GIFT TAXES – The inheritance tax was first enacted in 1891. Originally, the tax was applicable only to property going to collateral heirs, but was extended to direct heirs in 1909. The tax applies to all property, real and personal, with certain exemptions. TOBACCO TAXES – Tobacco taxes were first levied in 1925. The present tax equates to 20 cents per pack of 20 cigarettes and 6.6% of the wholesale cost for all other tobacco products. INSURANCE COMPANY PREMIUM TAX – This tax, first enacted in 1945, is applied to gross premiums paid by or for policyholders residing in this state or on property located in the state. The rate is 1.75% for domestic life insurance companies, 2% for foreign life insurance companies, 2.5% for property and casualty insurance companies and 4% for workers compensation premiums. MEDICAID PROVIDER TAX – The Hospital Medicaid Provider Tax has been in effect since July 1, 1989. The tax is directly proportional to the hospital’s Medicaid utilization rate, low income utilization rate, or large volume of Medicaid days per year. The Nursing Home Medicaid Provider Tax, which has been in effect since July 1, 1990, is based on the number of licensed beds physically located in the state.
ag04m88
171

State of Tennessee Table IVRatio of Net General Long-Term Debt to Assessed Value and Net Debt Per Capita
For the Last Ten Years
(Expressed in Thousands except Ratio and Per Capita Data)
For the General Long-Term Debt Net General Long-Term DebtYear Ended Assessed Total Less Debt Ratio to Per
June 30 Population Value (Note) Service Fund Net Assessed Value Capita
1995 5,256 $ 53,915,000 $ 669,061 $ 5,217 $ 663,844 1.23% $ 126.301996 5,327 56,072,000 712,020 961 711,059 1.27% 133.481997 5,398 61,648,000 881,983 4,531 877,452 1.42% 162.551998 5,470 71,292,000 919,670 4,356 915,314 1.28% 167.331999 5,524 75,561,000 1,073,097 1,335 1,071,762 1.42% 194.022000 5,750 78,568,000 1,068,019 2,750 1,065,269 1.36% 185.262001 5,776 89,194,000 1,139,224 3,407 1,135,817 1.27% 196.642002 5,833 92,726,000 1,081,269 4,527 1,076,742 1.16% 184.592003 5,878 94,642,000 (Est) 1,094,198 33,733 1,060,465 1.12% 180.412004 5,919 (Est) 95,712,000 (Est) 1,070,242 3,567 1,066,675 1.11% 180.21
Note: Total General Long-term debt does not include State Loan Program and Facilities Revolving FundGeneral Obligation Bonds, Notes and Commercial Paper as follows:
Year Bonds, Notes and Commercial Paper1995 $ 232,2761996 210,6841997 208,0061998 212,2391999 190,6042000 184,5492001 177,4452002 178,2362003 166,2032004 161,630
These obligations are reported as debt of those enterprises in the accompanying financial statements.Table V
State of TennesseeComputation of Legal Debt Margin
June 30, 2004
(Expressed in Thousands)
Legal debt service limit (2004 pledged revenues of $867,914/150%) $ 578,609
Less - 2004 debt service required on all general long-term debt, including State Loan Program and Facilities Revolving Fund general obligation bonds 143,702
Legal debt service margin $ 434,907
Collections for Fiscal Year 2004All
Portion Governmental PledgedPledged Fund Types Amount
Calculation of 2004 pledged revenues as above: Gasoline tax 29.3 % $ 599,326 $ 175,603 Petroleum products fee All 62,378 62,378 Motor vehicle registration fee One-half 238,565 119,283 Franchise tax All 510,650 510,650
Totals $ 1,410,919 $ 867,914
Note: Pledged revenues for the last five years are shown below:
Fiscal Pledged PercentYear Revenues Increase (Decrease)2000 $ 870,302 37.72001 802,023 (7.8)2002 768,696 (4.2)2003 825,316 7.42004 867,914 5.2
ag04m88
172

Table VIState of Tennessee
Ratio of Annual Debt Service for GeneralLong-Term Debt to Total Expenditures
All Governmental Fund TypesFor the Last Ten Fiscal Years
(Expressed in Thousands except for Ratio Data)
For the YearEnded June 30 Debt Service Total Expenditures Ratio
1995 $ 93,400 $ 10,557,897 0.881996 94,575 10,789,147 0.881997 92,286 11,026,418 0.841998 100,556 11,639,366 0.861999 111,530 12,437,248 0.902000 123,783 13,541,641 0.912001 122,221 15,554,633 0.792002 123,707 17,520,136 0.712003 126,722 18,910,449 0.672004 128,244 20,176,445 0.64
Table VIIState of Tennessee
Schedule of Revenue Bond CoverageComponent Units
Tennessee Housing Development Agency FundFor the Last Ten Fiscal Years
(Expressed in Thousands except for Coverage)
For the Year Dedicated Related Net Available Debt ServiceEnded June 30 Revenues Expenses For Debt Service Requirements Coverage
1995 $ 133,765 $ 4,518 $ 129,247 $ 106,750 1.211996 141,056 4,779 136,277 113,969 1.201997 197,309 5,041 192,268 162,327 1.181998 332,821 4,784 328,037 294,861 1.111999 308,454 4,843 303,611 271,574 1.122000 248,647 5,836 242,811 208,377 1.172001 257,258 6,070 251,188 218,726 1.152002 180,894 7,360 173,534 138,870 1.252003 222,312 7,737 214,575 181,901 1.182004 179,774 10,904 168,870 115,780 1.46
State of TennesseeSchedule of Revenue Bond Coverage
Component UnitsCollege and University FundsFor the Last Ten Fiscal Years
(Expressed in Thousands except for Coverage)
TennesseeFor the Year Fees and State School Other Than
Ended June 30 Charges Bond Authority Authority Total Coverage
1995 $ 836,722 $ 29,664 $ 346 $ 30,010 27.91996 865,204 29,810 352 30,162 28.71997 908,072 35,993 275 36,268 25.01998 908,650 38,182 272 38,454 23.61999 1,016,422 35,837 204 36,041 28.22000 835,841 29,760 784 30,544 27.42001 859,417 33,454 498 33,952 25.32002 936,385 45,616 488 46,104 20.32003 957,897 45,761 497 46,258 20.72004 945,682 47,397 503 47,900 19.7
ag04m88
ag04m88
173

Table VIIIState of Tennessee
Schedule of Fees/Charges, Legislative Appropriations and Debt ServiceComponent Units
College and University FundsFor the Last Ten Years
(Expressed in Thousands)
University of TennesseePrior and Subordinate Debt Service
Fiscal Total Fees Legislative Debt Service Requirements RequirementsYear and Charges Appropriations (Non-Authority) (Authority Bonds)
1995 $ 555,363 $ 359,941 $ 21 $ 21,6921996 563,302 369,853 21 21,7491997 587,138 374,249 21 26,8911998 592,661 367,938 21 28,6571999 622,109 373,207 21 24,4312000 410,086 375,872 21 16,8722001 401,918 408,671 21 18,6282002 438,956 406,146 21 24,8042003 413,632 409,612 24,5082004 417,191 406,033 75 25,317
Austin Peay State UniversityPrior and Subordinate Debt Service
Fiscal Total Fees Legislative Debt Service Requirements RequirementsYear and Charges Appropriations (Non-Authority) (Authority Bonds)
1995 $ 17,722 $ 24,610 $ 48 $ 5351996 18,235 25,209 48 5351997 19,178 25,733 48 6411998 20,420 25,559 48 6721999 23,188 27,444 48 6512000 24,288 28,001 48 6492001 26,555 28,051 48 6492002 33,157 30,484 48 1,5162003 36,201 31,100 48 1,5152004 33,058 30,712 48 2,242
East Tennessee State UniversityPrior and Subordinate Debt Service
Fiscal Total Fees Legislative Debt Service Requirements RequirementsYear and Charges Appropriations (Non-Authority) (Authority Bonds)
1995 $ 46,563 $ 65,530 $ 1,6361996 49,502 67,549 1,6361997 53,232 68,469 1,5971998 57,826 67,202 1,5881999 64,652 70,814 1,7432000 64,386 72,837 $ 258 1,9542001 59,516 75,937 261 1,9162002 65,342 77,965 261 2,6082003 68,805 79,735 319 2,6092004 77,570 79,247 315 2,824
University of MemphisPrior and Subordinate Debt Service
Fiscal Total Fees Legislative Debt Service Requirements RequirementsYear and Charges Appropriations (Non-Authority) (Authority Bonds)
1995 $ 67,576 $ 88,120 $ 2,4441996 72,587 90,400 2,4511997 75,167 91,212 2,8891998 80,625 89,924 2,9911999 93,593 93,576 3,0542000 102,186 94,289 2,3532001 114,031 97,499 3,7772002 120,196 99,786 6,3342003 127,638 102,139 6,2912004 128,880 100,602 5,609
ag04m88
174

Middle Tennessee State UniversityPrior and Subordinate Debt Service
Fiscal Total Fees Legislative Debt Service Requirements RequirementsYear and Charges Appropriations (Non-Authority) (Authority Bonds)
1995 $ 49,083 $ 60,371 $ 1,1641996 54,128 61,920 1,1661997 57,341 63,529 1,6681998 62,814 64,469 1,8721999 70,530 70,576 3,3572000 78,317 73,273 4,8862001 86,328 76,159 5,4722002 98,031 77,990 6,5372003 93,953 83,208 6,5402004 98,844 81,057 6,937
Tennessee State UniversityPrior and Subordinate Debt Service
Fiscal Total Fees Legislative Debt Service Requirements RequirementsYear and Charges Appropriations (Non-Authority) (Authority Bonds)
1995 $ 26,481 $ 30,567 $ 135 $ 1,0151996 31,231 31,477 135 1,1001997 34,352 32,227 135 1,1571998 39,141 32,052 135 1,2571999 46,423 35,597 66 1,4702000 52,156 36,337 66 2,0562001 54,979 34,843 66 2,1932002 45,119 35,067 66 3,1372003 57,939 39,040 3,1362004 53,840 40,621 3,001
Tennessee Technological UniversityPrior and Subordinate Debt Service
Fiscal Total Fees Legislative Debt Service Requirements RequirementsYear and Charges Appropriations (Non-Authority) (Authority Bonds)
1995 $ 26,204 $ 37,473 $ 1,1781996 26,110 38,452 1,1731997 27,208 38,164 1,1501998 28,831 37,699 1,1451999 31,616 39,259 1,0752000 33,791 38,938 8442001 37,065 43,568 6392002 41,311 40,392 4152003 53,518 45,813 8972004 47,194 40,165 1,168
Chattanooga State Technical Community CollegePrior and Subordinate Debt Service
Fiscal Total Fees Legislative Debt Service Requirements RequirementsYear and Charges Appropriations (Non-Authority) (Authority Bonds)
1995 $ 7,961 $ 17,822 $ 711996 8,701 18,284 741997 9,032 18,514 711998 9,818 18,589 681999 10,453 19,602 692000 11,074 20,234 722001 11,650 20,684 69 $ 342002 12,380 21,233 70 732003 13,428 21,108 60 732004 11,937 20,979 65 73
(continued on next page)
ag04m88
175

Table VIIIState of Tennessee
Schedule of Fees/Charges, Legislative Appropriations and Debt Service (continued)Component Units
College and University FundsFor the Last Ten Years
(Expressed in Thousands)
Columbia State Community CollegePrior and Subordinate Debt Service
Fiscal Total Fees Legislative Debt Service Requirements RequirementsYear and Charges Appropriations (Non-Authority) (Authority Bonds)
1995 $ 4,150 $ 8,1501996 4,605 8,3611997 4,966 8,6701998 5,753 9,0691999 6,615 10,1432000 6,836 10,6752001 7,294 11,0162002 13,136 11,4372003 14,921 11,540 2004 10,799 11,344 $ 17
Nashville State Technical Community CollegePrior and Subordinate Debt Service
Fiscal Total Fees Legislative Debt Service Requirements RequirementsYear and Charges Appropriations (Non-Authority) (Authority Bonds)
1995 $ 4,019 $ 9,5851996 4,300 9,7161997 4,777 9,6771998 6,260 9,8641999 6,816 11,0922000 7,474 11,6552001 8,322 12,168 2002 8,254 12,525 $ 132003 13,519 13,099 132004 12,202 12,730 13
Roane State Community CollegePrior and Subordinate Debt Service
Fiscal Total Fees Legislative Debt Service Requirements RequirementsYear and Charges Appropriations (Non-Authority) (Authority Bonds)
1995 $ 5,418 $ 13,1771996 5,349 13,5091997 5,878 13,6491998 6,268 13,4411999 6,940 14,2542000 7,565 14,879 $ 332001 7,697 15,524 332002 8,589 15,771 2003 9,532 15,7792004 7,473 15,518
Southwest Tennessee Community CollegePrior and Subordinate Debt Service
Fiscal Total Fees Legislative Debt Service Requirements RequirementsYear and Charges Appropriations (Non-Authority) (Authority Bonds)
1995 $ 8,853 $ 17,549 1996 9,250 17,9881997 9,712 18,1741998 9,837 17,8981999 9,991 18,527 $ 562000 10,838 18,464 1462001 18,325 34,451 1462002 19,022 35,175 1792003 21,839 34,827 1792004 16,472 34,191 179
ag04m88
176

Volunteer State Community CollegePrior and Subordinate Debt Service
Fiscal Total Fees Legislative Debt Service Requirements RequirementsYear and Charges Appropriations (Non-Authority) (Authority Bonds)
1995 $ 10,909 $ 11,2261996 11,309 11,5041997 12,855 12,0291998 13,046 13,2321999 15,088 14,3232000 17,843 14,9472001 15,567 15,394 2002 15,060 15,8622003 12,941 15,8132004 9,395 15,417 $ 17
Walters State Community CollegePrior and Subordinate Debt Service
Fiscal Total Fees Legislative Debt Service Requirements RequirementsYear and Charges Appropriations (Non-Authority) (Authority Bonds)
1995 $ 6,420 $ 12,018 1996 6,595 12,3081997 7,236 12,6581998 8,350 13,1321999 8,408 14,2652000 9,001 14,767 $ 2862001 10,170 15,173 2002 17,832 15,595 882003 20,031 16,045 702004 20,827 15,821
ag04m88
177

State of Tennessee Table IXStudent Fees and Charges
For Institutions with Tennessee State School Bond Authority DebtComponent Units
College and University FundsFor the Fiscal Year Ended June 30, 2004
Debt In-State Non-Resident Average AverageService Student Student Board Room
Institution Fees Tuition Tuition Charge Charge
University of Tennessee- Knoxville $ 148 $ 4,450 $ 13,532 $ 2,288 $ 2,820University of Tennessee- Chattanooga 220 3,852 11,504 1,000 2,800University of Tennessee- Martin 174 3,830 11,480 1,950 2,050University of Tennessee- Memphis 54 6,044 17,606 4,320Austin Peay State University 274 3,132 7,932 1,646 3,400East Tennessee State University 160 3,132 7,932 1,900 2,000University of Memphis 120 3,502 8,154 1,850 2,520Middle Tennessee State University 166 3,132 7,932 2,100 2,756Tennessee State University 130 3,132 7,932 2,460 1,570Tennessee Technological University 68 3,132 7,932 2,550 2,520Chattanooga State Technical Community College 1,824 5,464Columbia State Community College 1,824 5,464Nashville State Technical Community College 1,824 5,464Roane State Community College 1,824 5,464Southwest Tennessee Community College 1,824 5,464Volunteer State Community College 1,824 5,464Walters State Community College 1,824 5,464
State of Tennessee Table XPrincipal Amount of Debt Outstanding by Institution
Component UnitsCollege and University Funds
June 30, 2004
First SecondProgram Program Commercial Non-Authority Total
Institution Bonds Bonds Paper Debt Debt
University of Tennessee $ 23,113 $ 242,168 $ 12,231 $ 75 $ 277,587Austin Peay State University 1,184 28,893 1,343 48 31,468East Tennessee State University 242 27,943 76 315 28,576University of Memphis 889 51,049 1,444 53,382Middle Tennessee State University 852 82,029 5,229 88,110Tennessee State University 6,191 24,568 380 31,139Tennessee Technological University 81 12,279 12,360Chattanooga State Technical Community College 607 4,430 65 5,102Columbia State Community College 144 144Nashville State Technical Community College 82 82Roane State Community College 75 75Southwest Tennessee Community College 1,693 1,693Volunteer State Community College 140 140Walters State Community College 536 536
$ 32,552 $ 471,595 $ 25,744 $ 503 $ 530,394
ag04m88
178

State of TennesseeEconomic Characteristics*
Tennessee's Economic Growth
The economic future for Tennessee remains bright. Characteristics of the state which have been identified as important reasons why firms have chosen Tennessee sites include work-force related factors such as worker productivity, right-to-work laws and low unionization, as well as access tomarkets and pro-business attitude of the state. Other factors include relatively inexpensive energy, plentiful natural resources and sun-belt location.
(Expressed in Millions)
Year Personal Income Disposable Personal Income1994 $106,855 $95,8281995 114,260 101,9141996 119,287 106,3191997 125,456 111,5811998 134,242 119,4911999 141,118 125,7042000 149,936 133,5012001 154,130 138,9752002 158,717 146,3592003 164,461 (Est) 153,717 (Est)
Tennessee Employment by Sector
(Expressed in Thousands)Percentage Change
1993 1998 2003 (Est) (From 1993 to 2003)
Manufacturing 502.8 498.6 414.2 -17.6%Construction 95.7 121.4 110.0 14.9%Mining 5.1 5.3 4.4 -13.7%Trade 382.5 437.1 439.1 14.8%Services 513.5 652.3 723.3 40.9%Finance, insurance and real estate 115.1 136.6 139.6 21.3%Transportation, communication and public utilities 111.0 127.1 134.4 21.1%Federal government 55.7 50.8 52.2 -6.3%State & local government 306.3 334.7 360.7 17.8% Total all sectors 2,087.7 2,363.9 2,377.9 13.9%
Tennessee Average Annual Wage by SectorPercentage Change
1993 1998 2003 (Est) (From 1993 to 2003)
Manufacturing $29,492 $32,322 $40,388 36.9%Construction 27,408 31,194 37,852 38.1%Mining 34,257 45,412 36,853 7.6%Trade 19,268 21,560 69,253 259.4%Services 24,288 26,859 96,607 297.8%Finance, insurance and real estate 32,153 38,854 47,431 47.5%Transportation, communication and public utilities 33,133 33,335 41,608 25.6%Federal government 41,238 42,282 52,090 26.3%State & local government 22,573 24,600 29,600 31.1% Average all sectors $25,473 $28,016 $45,168 77.3%
* Except as otherwise noted, the source for all economic information presented is An Economic Report to the Governor of the State of Tennessee on the State's Economic Outlook (January 2004) developed by the Center for Business and Economic Research, College of Business Administration, The University of Tennessee, Knoxville. The source for disposable personal income is the U.S. Department of Commerce, Bureau of Economic Analysis.
ag04m88
179

Manufacturing
Manufacturing investment in Tennessee totaled $2.3 billion in 2003, marking the twenty-first consecutive billion dollar year for the state. The combined new plant and expansion projects announced are expected to create 15,780 new job opportunities. The tables which follow indicate the state's manufacturing employment and industrial expansion.
Tennessee Manufacturing Employment
(Expressed in Thousands)
Percentage Change1993 1998 2003 (Est) (From 1993 to 2003)
Durables: Furniture & fixtures 30.0 27.4 20.3 -32.3% Fabricated metals 46.4 45.3 41.0 -11.6% Machinery 31.9 41.4 33.1 3.8% Electrical equipment 26.3 29.8 23.3 -11.4% Transportation equipment 57.3 65.4 60.6 5.8% Other 80.0 87.6 73.3 -8.4%
Total durables 271.9 296.9 251.6 -7.5%
Nondurables: Food 33.3 33.2 36.3 9.0% Textiles 19.3 17.9 10.7 -44.6% Apparel 55.5 29.5 9.6 -82.7% Paper 20.7 21.0 19.1 -7.7% Printing & publishing 24.4 25.1 20.3 -16.8% Chemicals 36.8 32.5 28.0 -23.9% Rubber & plastics 28.1 31.6 29.1 3.6% Other 13.0 10.9 9.4 -27.7%
Total nondurables 231.1 201.7 162.5 -29.7%
Totals 503.0 498.6 414.1 -17.7%
ag04m88
180

Industrial Growth in Tennessee
New Plants and Expansions
1994 1995 1996 1997 1998 1999 2000 2001 2002 2003
Number: New 81 80 105 80 63 80 66 56 57 35 Expansions 886 864 703 961 1,290 1,041 1,065 825 613 600
967 944 808 1,041 1,353 1,121 1,131 881 670 635
Investment(In thousands): New $694,517 $1,005,577 $571,098 $463,844 $270,164 $754,807 $539,320 $527,879 $1,446,033 $320,600 Expansion 1,787,295 2,254,233 3,232,541 2,400,932 3,035,618 2,960,216 4,413,085 3,508,749 2,272,410 2,007,678
$2,481,812 $3,259,810 $3,803,639 $2,864,776 $3,305,782 $3,715,023 $4,952,405 $4,036,628 $3,718,443 $2,328,278
Job opportunities: New 9,538 4,862 8,588 4,904 3,310 6,410 5,636 3,964 3,915 3,211 Expansions 16,779 12,485 14,321 14,639 19,793 20,256 21,377 11,840 11,528 12,569
26,317 17,347 22,909 19,543 23,103 26,666 27,013 15,804 15,443 15,780
Top Fifty Tennessee Companies
(Ranked by Number of Employees in Tennessee)
Number of Number ofCompany Employees Company Employees
1. Wal-Mart Associates, Inc. 35,700 26. Sears Roebuck and Company 4,1002. Federal Express, Inc. 33,700 27. Home Depot Co. 4,0003. Vanderbilt University/Hospital 18,000 28. Wellmont Health System 3,9004. Kroger Limited Partnership, Inc. 11,800 29. UT-Battelle, LLC 3,8005. Lebonheur Childrens Medical Center 8,000 30. Blue Cross Blue Shield of TN 3,7006. United Parcel Service 7,600 31. Carrier Corp. (Collierville) 3,7007. Eastman Chemical Company 7,500 32. The Gap, Inc. 3,7008. Nissan Motor Mfg. Corp. USA 7,100 33. O'Charleys, Inc. 3,7009. Saturn Corporation 6,700 34. K-Mart Corporation 3,700
10. U. S. Xpress, Inc. 6,500 35. Union Planters Bank National Assoc. 3,60011. Cracker Barrel Old Country Stores 6,200 36. International Paper Co. 3,60012. Centennial Medical Center (HCA) 6,000 37. Connecticut General Life Insurance 3,40013. Randstad Staffing Svcs, USA, Inc. 5,400 38. Bi-Lo LP 3,30014. First Tennessee Bank 5,200 39. Bridgestone/Firestone Corporation 3,20015. Covenant Transport Inc. 5,100 40. Food Lion, Inc 3,20016. Gaylord Entertainment Co. 5,000 41. Quebecor World 3,20017. K-VA-T Food Stores Inc. 4,900 42. Autozone, Inc. 3,10018. Lowe's Home Centers, Inc. 4,900 43. GMRI, Inc 3,10019. Walgreen Co. 4,800 44. Memorial Hospital 3,10020. BWXT Y-12 LLC 4,700 45. St. Thomas Hospital 3,10021. Baptist Memorial Hospital 4,600 46. Staffmark East, LLC 3,10022. Mountain State Health Alliance 4,500 47. Target Stores 2,90023. Bellsouth Telecommunications, Inc. 4,400 48. Goodyear Tire & Rubber Company 2,90024. National Health Corp. 4,300 49. Adecco USA, Inc 2,80025. Spherion Corp. 4,200 50. J. C. Penney Co. Inc. 2,600
Source: Tennessee Department of Economic and Community Development.
ag04m88
181

Agriculture
Important export commodities such as soybeans, tobacco, feed grains, cotton, and greenhouse and nursery products are among the top income earners for Tennessee farmers.
Cash Receipts
(Expressed in Millions)
1994 1995 1996 1997 1998 1999 2000 2001 2002 2003 (Est)
Crops $1,199.9 $1,227.8 $1,374.1 $1,245.2 $1,166.1 $956.5 $1,006.9 $988.4 $1,120.3 $1,267.8Meat animals 498.4 420.2 463.0 485.4 435.7 423.1 477.4 455.5 377.5 473.5Dairy products 247.4 239.4 253.6 225.6 236.9 222.8 193.2 215.5 172.9 159.6Poultry and eggs 197.0 203.4 251.7 256.8 306.1 294.5 258.4 395.3 300.2 354.2
$2,142.7 $2,090.8 $2,342.4 $2,213.0 $2,144.8 $1,896.9 $1,935.9 $2,054.7 $1,970.9 $2,255.1
Population and Employment Trend
The state's population has grown steadily in recent history by over one-half of 1% per year.
(Expressed in Thousands except Unemployment Rates)
1994 1995 1996 1997 1998 1999 2000 2001 2002 2003 (Est) Population 5,176 5,256 5,327 5,398 5,470 5,524 5,750 5,776 5,833 5,878Average labor force 2,663 2,712 2,759 2,708 2,760 2,819 2,798 2,818 2,926 2,910Average total employment 2,536 2,571 2,623 2,562 2,644 2,705 2,688 2,692 2,776 2,741Average unemployment 127 141 136 146 116 114 110 126 150 169TN Unemployment rate 4.8% 5.2% 5.1% 5.4% 4.2% 4.0% 3.9% 4.4% 5.1% 5.8%U.S. Unemployment rate 6.1% 5.6% 5.4% 4.9% 4.5% 4.2% 4.0% 4.8% 5.8% 6.0%
Bank Deposits, Sales and Effective Buying Income(Expressed
(Expressed in Millions) in Thousands)
Effective BuyingBank Income
Year Deposits Sales Median Household
1994 $48,531 $53,778 $31.81995 52,321 57,917 29.11996 57,219 60,661 39.41997 54,302 66,030 31.51998 76,542 66,259 32.01999 64,966 72,328 33.62000 62,113 74,651 34.62001 73,051 74,521 34.02002 79,206 74,808 34.62003 82,125 76,996 34.3
New Privately Owned Housing Units Authorized in Permit-Issuing PlacesValuation of Building Permits Issued
(Expressed in Thousands)
Year Valuation Year Valuation
1994 $2,538,773 1999 $3,835,3031995 2,838,290 2000 3,377,6291996 3,334,419 2001 3,540,1781997 3,103,939 2002 3,961,2091998 3,613,835 2003 4,478,748
Source: The Tennessee Econometric Model, Tennessee Department of Labor and Workforce Development Labor Summary, Sales and Marketing Management, Center for Business and Economic Research, College of Business Administration, The University of Tennessee, Tennessee Agricultural Statistics Service Cash Receipts Estimates and Tennessee Department of Financial Institutions Annual Report.
ag04m88
182

Population, Tax Base and Personal Income
(Expressed in Thousands)
Appraised/Assessed Estimated Current Personal Per Capita
Year Population Value Value Income Income
1994 5,176 $51,686,000 $176,895,000 $106,855,000 $20.61995 5,256 53,915,000 191,993,000 114,260,000 21.71996 5,327 56,072,000 207,352,000 119,287,000 22.41997 5,398 61,648,000 228,083,000 125,456,000 23.21998 5,470 71,292,000 249,897,000 134,282,000 24.51999 5,524 75,561,000 270,007,000 141,046,000 25.52000 5,750 78,568,000 290,633,000 149,936,000 26.12001 5,776 89,194,000 313,276,000 164,130,000 28.42002 5,833 92,726,000 323,092,000 158,717,000 27.22003 5,878 94,642,000 (Est) 341,336,000 (Est) 164,461,000 (Est) 28.0
Public School Enrollment Grades K-12
Grades Grades Grades Grades TotalAcademic Year K-3 4-6 7-9 10-12 K-12
1994-95 300,440 213,703 222,982 179,552 916,6771995-96 308,006 215,579 225,154 180,969 929,7081996-97 316,094 217,823 226,287 183,852 944,0561997-98 320,784 221,651 227,097 187,172 956,7041998-99 314,781 221,913 226,859 187,313 950,8661999-2000 317,830 232,230 232,616 191,050 973,7262000-2001 311,184 234,407 230,094 190,849 966,5342001-2002 297,072 228,790 225,930 187,110 938,9022002-2003 296,940 227,897 232,813 190,363 948,0132003-2004 297,732 224,197 236,435 191,321 949,685
Higher Education Enrollment
1994 1995 1996 1997 1998 1999 2000 2001 2002 2003
Universities: Austin Peay State 5,740 5,763 6,072 5,968 5,816 5,717 5,670 5,769 6,079 6,278 East Tennessee State 9,312 9,355 9,450 9,549 9,792 9,392 9,112 9,271 9,664 9,936 Middle Tennessee State 14,226 14,504 14,916 15,455 15,655 16,164 16,330 17,125 18,151 18,735 Tennessee State 6,438 6,787 7,007 7,168 7,383 7,616 7,419 7,425 7,703 7,716 Tennessee Technological 7,353 7,303 7,230 7,287 7,112 7,221 7,208 7,372 7,554 7,509 University of Memphis 15,177 15,495 15,001 15,452 15,771 15,894 15,599 15,890 15,696 15,720 University of Tennessee: Chattanooga 6,438 6,540 6,608 6,816 7,040 7,019 6,832 6,955 7,050 7,138 Knoxville 21,575 21,454 21,528 21,819 22,476 23,277 22,960 23,269 23,291 22,730 Martin 5,308 5,497 5,376 5,607 5,480 5,268 5,310 5,379 5,311 5,265
Total universities 91,567 92,698 93,188 95,121 96,525 97,568 96,440 98,455 100,499 101,027
Community colleges: Chattanooga State Tech 5,144 4,982 5,427 5,227 5,140 5,037 4,832 5,269 5,264 5,186 Cleveland State 1,929 2,204 2,111 2,376 2,176 2,158 2,083 2,318 2,200 2,224 Columbia State 2,331 2,501 2,639 2,820 2,947 2,906 2,788 2,984 3,108 3,082 Dyersburg State 1,380 1,373 1,531 1,533 1,522 1,434 1,561 1,577 1,657 1,819 Jackson State 2,088 2,155 2,223 2,328 2,416 2,547 2,513 2,658 2,713 2,743 Motlow State 2,133 2,077 2,116 2,287 2,273 2,220 2,199 2,441 2,556 2,436 Nashville State Tech 2,749 2,778 3,112 3,357 3,492 3,523 3,545 3,631 3,757 3,769 Northeast State Tech 2,372 2,314 2,459 2,422 2,513 2,600 2,606 2,879 2,968 3,112 Pellissippi State Tech 4,866 4,768 5,003 5,217 5,258 5,078 5,077 5,151 5,208 5,013 Roane State 3,614 3,591 3,688 3,720 3,675 3,796 3,473 3,647 3,767 3,775 Southwest Tennessee* 9,416 9,019 8,640 7,852 7,359 7,334 7,056 7,743 7,141 7,361 Volunteer State 3,783 3,904 4,129 4,236 4,198 4,104 4,136 4,295 4,525 4,426 Walters State 3,602 3,507 3,731 3,807 3,666 3,593 3,664 3,909 3,867 4,067
Total community colleges 45,407 45,173 46,809 47,182 46,635 46,330 45,533 48,502 48,731 49,013
Total all institutions 136,974 137,871 139,997 142,303 143,160 143,898 141,973 146,957 149,230 150,040
* Effective July 1, 2000 State Technical Institute at Memphis (STIM) and Shelby State Community College (SSCC) were consolidated to form Southwest Tennessee Community College (STCC).
Sources: The Tennessee Econometric Model, State Board of Equalization, Tennessee Department of Education and the Higher Education Commission.
ag04m88
183

This Page Intentionally Left Blank
ag04m88
184

INDEX TO SECURITIES AND EXCHANGE COMMISSION (SEC) DISCLOSURES
General Obligation Debt: Page # Collections of Special Taxes 124
Total Sales and Use Tax Collections 170
Allocation of Sales and Use Tax to Debt Service 91
General Obligation Bonds Outstanding, and Authorized and Unissued 58-60, 165
General Obligation Commercial Paper Outstanding 59, 166
General Obligation Bonds Outstanding by Fiscal Year of Maturity 165
Outstanding Indebtedness of State Agencies and Authorities 58-59 165-166
Revenues by Source - All Governmental Fund Types 169
Expenditures by Function - All Governmental Fund Types 169
Tax Revenues by Source - All Governmental Fund Types 170
Ratio of Net General Long-Term Debt to Assessed Value and Net Debt Per Capita 172
Computation of Legal Debt Service Margin 172
Ratio of Annual Debt Service for General Long-Term Debt to Total Expenditures - All Governmental Fund Types 173 Component Unit Debt: Page # Tennessee Housing Development Agency: Schedule of Revenue Bond Coverage 173 College and University Funds: Schedule of Revenue Bond Coverage 173 Tennessee State School Bond Authority: Outstanding Bonds 68-69, 167 Student Fees and Charges by Institution 178 Schedules of Outstanding Debt by Institution 178 Total Equated Full-Time Student Enrollment by Institution 183 Schedule of Fees/Charges, Legislative Appropriations and Debt Service by Institution 174-177
ag04m88
185

_______________________________________ ACKNOWLEDGMENTS _____________________________________
DEPARTMENT OF FINANCE AND ADMINISTRATION
DIVISION OF ACCOUNTS
CHIEF OF ACCOUNTS PAYROLL CASH MANAGEMENT PATRICE STEINHART, CPA JAN SYLVIS, CPA* JAMIE BAILEY ANNETTE WHITE HARRY BROUGHMAN PAM HUGHES MELISSA HACKER TERRI RACARD TERRI KING DON SHELTON POLICY DEVELOPMENT MARY MALLORY REGGIE MARABLE REVENUE MAXIMIZATIONJACK HILL DONNA NICELY ROSALYN POPE CAROLYN SHEPHERD DOTTIE HAGOOD LARRY VOYTA CHRISTA MARTIN
STATE-WIDE ACCOUNTING ADMINISTRATION GENERAL LEDGER PRE-AUDIT CLYDE PHILLIPS, CPA* KEN WINTER, CPA* Inactive LARRY PERRY, CPA* ANN COLLETT, CPA* TRACY BROWN* AMANDA ADAMS MIKE CORRICELLI, CPA* CORA LEE DAUGHERTY TOM CAREY KRISTI COUCH, CPA* WANDA DRIGGERS BECKY CLARK LYNN CUMMINGS, CPA* SUZE GRIMES-SHARPE KAREN FREE MICHELLE ELLIOTT, CPA* CHRISTIE HEDGES* CLARISA GOMEZ ELLEN FELLMAN, CPA* TARA MASON NAJAT KANAKRIEH RHONDA HICKS, CPA LINDA MILLER CAROLYN NIFONG TERRY MASON JENNIFER PEARSON, CPA,* Inactive BOBBIE PERRY JUANITA MCCRARY* HELEN THOMAS GLENN PERRY DIANNE MCKAY, CPA* GLENDA TIDWELL LAURA POOLE TAMMY MILLER, CPA MARINEA WHITE* DEBORAH WOODALL PEGGY SEAY, CPA* MARGARET WALKER, CPA* ELAINE WERNER, CPA FINANCIAL CONTROL STARS DEVELOPMENT REPORTING RICHARD NICKS, CPA* DAVID DEALY NANCY SUTTON DUSTIN GREEN, CPA* JERRI ANDERSON* GEORGE CROSSWHITE TONY JARRETT CARRIE BLAIR* VIVIAN KAAIHUE* TARA LEWIS BOB LAWSON, CPA*, Inactive RANDY ROSS* JAN OSBORNE* CINDY RITTENBERRY* MARGARET WAYNICK FRANCINE VAUGHN TIM WELLS, CPA WANDA WILSON LISA WELLS SHERITA WOODS* *PREPARER OF COMPREHENSIVE ANNUAL FINANCIAL REPORT
ag04m88
186