Comprehensive Annual Financial Report For the Fiscal … · Governmental Funds to ... Schedule of...
128
Comprehensive Annual Financial Report For the Fiscal Year Ended June 30, 2008 Waukee Community School District 560 S E University Avenue Waukee, Iowa 50263
Transcript of Comprehensive Annual Financial Report For the Fiscal … · Governmental Funds to ... Schedule of...

Comprehensive Annual Financial Report
For the Fiscal Year Ended June 30, 2008
Waukee Community School District 560 S E University Avenue
Waukee, Iowa 50263


WAUKEE COMMUNITY SCHOOL DISTRICT TABLE OF CONTENTS
June 30, 2008 INTRODUCTORY SECTION Page Superintendent’s Introduction 1 Letter of Transmittal 3-8 Organizational Chart 9 Board of Education and Attorney 10 School District Administration 11 Consultants, Advisers, and Official Depositories 12 Certificate of Excellence in Financial Reporting 12-a FINANCIAL SECTION Independent Auditor's Report 13-14 Management’s Discussion and Analysis (MD&A) 15-21 Basic Financial Statements: Exhibit Government-Wide Financial Statements: Statement of Net Assets A 24-25 Statement of Activities B 26-29 Governmental Fund Financial Statements: Balance Sheet C 30 Reconciliation of the Balance Sheet - Governmental Funds to the Statement of Net Assets D 31 Statement of Revenues, Expenditures and Changes in Fund Balances E 32-33 Reconciliation of the Statement of Revenues, Expenditures And Changes in Fund Balances - Governmental Funds To the Statement of Activities F 34 Proprietary Funds Financial Statements: Statement of Net Assets G 35 Statement of Revenues, Expenses and Changes in Net Assets H 36 Statement of Cash Flows I 37 Fiduciary Fund Financial Statements: Statement of Fiduciary Net Assets J 38 Statement of Changes in Fiduciary Net Assets K 39 Notes to Financial Statements 40-56 Required Supplementary Information: Budgetary Comparison Schedule of Revenues, Expenditures and Changes in Balances - Budget and Actual - All Governmental Funds and Proprietary Funds 58-59 Notes to Required Supplementary Information - Budgetary Reporting 60 Other Supplementary Information: Schedule Combining and Individual Fund Financial Statements and Schedules: Non-major Governmental Funds: Combining Balance Sheet 1 62 Combining Schedule of Revenues, Expenditures and Changes in Fund Balances 2 63-65 Internal Service Funds: Combining Schedule of Net Assets 3 66 Combining Schedule of Revenues, Expenses and Changes in Net Assets 4 67-68 Combining Schedule of Cash Flows 5 69

Table of Contents, continued from previous page Schedule Page
Other Financial Schedules: Schedule of Changes in Special Revenue Fund, Student Activity Accounts 6 70-71 Schedule of Changes in Fiduciary Assets and Liabilities – Agency Fund 7 72 Schedule of Revenues by Source and Expenditures by Function - All Governmental Funds 8 73 STATISTICAL SECTION (UNAUDITED) Net assets by component 75 Changes in net assets 76-77 Fund balances, Governmental Funds 78-79 Changes in fund balances, Governmental Funds and Debt Service Ratio 80-81 General Fund revenues, by source 82 General Fund expenditures, by program 83 Government-wide revenues 84 Government-wide expenses, by function 85 Comparison of growth in general fund revenue, expenditures, enrollment, assessed valuation and tax rate 86-87 Ratio of financial condition 88 Property tax levies and collections 89 Taxable and 100% values of property 90-91 Property tax rates per $1,000 of assessed valuation, direct and overlapping governments 92 Tax rates by fund 93 Comparison of Taxes and Intergovernmental Revenue 94-95 Taxable assessed valuation by property type 96-97 Principal taxpayers in the Waukee Community School District 98 Comparative Ratio of general bonded debt to assessed values and bonded debt per capita 99 Ratio of annual debt service expenditures for general bonded debt to total general fund expenditures 100 Computation of overlapping and direct debt 101 Legal debt margin information 102-103 General analysis of facilities, classrooms and staffing 104-105 District staffing levels 106 District and area unemployment rates 107 Summary of historical retail sales 108 Principal employers in the District 109 District population 110 Certified resident student enrollment by grade 111 Operating cost per pupil 112 Iowa School Cash Anticipation Program (ISCAP) 113 COMPLIANCE SECTION Schedule of Expenditures of Federal Awards 117 Independent Auditor's Report on Internal Control over Financial Reporting and on Compliance and Other Matters Based on an Audit of Financial Statements Performed in Accordance with Government Auditing Standards 119-120 Independent Auditor’s Report on Compliance with Requirements Applicable to Each Major Program and on Internal Control over Compliance in Accordance with OMB Circular A-133 121-122 Schedule of Findings and Questioned Costs 123-124
Waukee Schools
1
DAVID W. WILKERSON, PH.D. Superintendent (515) 987-5161
Fax (515) 987-2701 [email protected]
Central Administration Office: 560 SE University, Waukee, IA 50263
February 16, 2009
We are a District with a dedication to all students and an unwavering commitment to a
quality educational program. That commitment, along with a strong sense of community
defines the work of the Board of Education for the Waukee Community School District. In
a time of ongoing funding restrictions and changing financial models, achieving these
goals is a significant challenge.
Our shared vision statement is “to deliver appropriate educational programs for our
students, recognizing that all involved – students, teachers, and family – share in the
responsibility for learning.” Honoring our vision keeps us focused on moving forward,
closing any gap that may exist between our current reality and our vision. The District’s
Guiding Principles and Mission Statement guide the allocation of resources to achieve our
goals.
Iowa continues to fall short of fully funding the education formula for K-12 schools. In
Waukee, we will continue to allocate available resources to fulfill our mission and our
commitment to students.
This report is a comprehensive financial record of the District for the fiscal year ended
June 30, 2008. It reflects the conditions that have enabled the Waukee Community
School District to maintain a favorable and improving financial picture – even during a
period of challenging growth. Among the enabling conditions are:
We have a highly dedicated and skilled team of teachers, staff, and administrators.
We have a highly effective Board of Education and a very supportive community.
We work in an atmosphere where everyone is encouraged to work at their highest
level in a collaborative environment.
As you examine this report, you will see a pattern of on-going financial strength that we
hope to continue into the future. We welcome your questions and suggestions. We will
continue to learn together to build on our success as a learning community for the future.
Respectfully Submitted,
David J. Wilkerson, Ph.D.
Superintendent

2

Waukee Schools
3
R. DUANE VAN GORP Executive Director of Admin. Services
(515) 987-5161 Fax (515) 987-2701
[email protected] Central Administration Office: 560 SE University, Waukee, IA 50263
February 16, 2009 Members of the Board of Education Waukee Community School District Waukee, Iowa The Comprehensive Annual Financial Report (CAFR) for the Waukee Community School District for the fiscal year ended June 30, 2008 is submitted herewith. Responsibility for accuracy of the data presented and the completeness and fairness of the presentation, including all disclosures, rests with the District Office of Administrative Services. We believe the data is accurately presented, in all material respects; that the data is presented to fairly set forth the financial position of the governmental activities, business-type activities, each major fund, the aggregate remaining fund information and the respective changes in financial position and cash flows where applicable; and that all necessary disclosures have been included in order to enable the reader to gain the maximum understanding of the District’s financial affairs. The Comprehensive Financial Annual Report is presented in three sections: introductory, financial and statistical. The introductory section, which is un-audited, includes this transmittal letter and a list of principal District officials, an organizational chart and the Association of School Business Officials International Certificate of Excellence in Financial Reporting. The financial section includes the management’s discussion and analysis, audited basic financial statements, required supplementary information and the combining and individual fund financial statements and schedules, as well as the independent auditor’s report. The statistical section, which is un-audited, includes selected financial and demographic information, generally presented on a multi-year basis. We encourage readers to refer to all three sections of the report, including the Management’s Discussion and Analysis in the financial section, which gives a more detailed summary of the District’s financial performance. The District is required to undergo an annual single audit in conformity with the provisions of the Single Audit Act of 1984 and U. S. Office of Management and Budget Circular A-133, Audits of State and Local Governments. The report includes all funds and account groups of the Waukee Community School District. The Waukee Community School District has no component units that meet the Governmental Accounting Standards Board criteria. The District provides a full range of services including instructional, administrative, transportation, food service, maintenance of sites and facilities, custodial, clerical, extra and co-curricular and athletic and activities.

4
This CAFR has been prepared using the guidelines recommended by the Association of School Business Officials International (ASBO). Certificates of Excellence are awarded to school systems that have presented their CAFR to the ASBO Panel of Review for critical review and evaluation. Receiving the award is recognition that a school system has met the highest standards of excellence in school financial reporting. The standards used in the “Certificate of Excellence Program” are based on generally accepted accounting principles (GAAP) as promulgated by the Governmental Accounting Standards Board (GASB). We will actively pursue this award through the efforts of the entire Waukee Team. The Waukee Community School District received this certificate for its comprehensive annual financial report for the fiscal years ending June 30, 2004, 2005 and 2006. A copy of the certificate is included in the introductory section of this report.
BASIS OF ACCOUNTING The District’s accounting records were maintained on a modified accrual basis. These accounting policies are enumerated in the notes to the financial statements. All the District’s funds are presented in this report and have been audited by the District’s independent certified public accountants, Van Maanen & Associates, P.C. The chart of accounts used by the District is in conformance with the Uniform Accounting System for Iowa Schools and Area Education Agencies issued November 1975 and updated in 2006, by the Iowa Department of Education. The chart of accounts manual is updated on an annual basis. The District is in full compliance with these requirements.
ECONOMIC CONDITION AND OUTLOOK The District is located in the central part of the state, within the larger Des Moines metropolitan area and ranks as one of the top growth areas of the country. The economic condition and outlook is stable. The Waukee Community School District has been and is currently the fastest growing school district in the state of Iowa and the growth projections are expected to continue. Student increases of over 900 students have been recorded in the past two years. Taxable assessed value continues to grow at an extremely rapid pace. The economy in the state continues to show growth. This growth has had a positive affect on employment with the greater Des Moines area unemployment rate under 4.0%. Retail sales in the greater Des Moines have leveled but remain strong. The City of West Des Moines recorded an all time record high for building permits during the past year. District taxable assessed valuations have continued steady growth to reach $2.3 billion for January 2008 values.
5
Based on conservative projections, this trend is expected to continue. While having a positive impact, the growth also presents significant challenges for the District. The District utilizes the optional instructional support levy at a level deemed appropriate and will need to continue a high level of efficient use of human resources and facilities. Retail sales, building permits and population increases in the western suburbs far exceed that of any other location in the metropolitan area or in the State of Iowa. An article in the September 27, 2007 edition of the Des Moines Register quoted a report from the Bureau of Economic Analysis showing the Des Moines Metropolitan area ranking 24th in the United States in terms of gross domestic product. The report also showed the area as the fastest growing municipal economy in the country increasing 7.2% since 2004. Retail, commercial and residential property values continue to grow at record pace. Assessed values of the District are conservatively projected to increase by 10% or more in the near term. In the fall of 2004, a new 250-acre retail shopping mall opened within the boundaries of the District and is expected to generate eighty million dollars in revenue annually. Wells Fargo opened its national mortgage headquarters in West Des Moines and currently employs in excess of 1,000. Aviva is currently building its North American headquarters within the boundaries of our school district with employment projections rivaling Wells Fargo. Areas surrounding the Jordan Creek Town Center continue to grow and add new retail and commercial property. The schools of Dallas County passed a one-cent sales tax on all covered retail sales in the county. All the schools in Dallas County on a per pupil basis will share the revenue from this sales tax. The Waukee Community School District is the largest district in Dallas County with over one-half of the county’s students. That percentage of total students in the county will continue to increase on an annual basis with the District receiving a larger percentage of the total sales tax annually.
MAJOR INITIATIVES Current yearCurrent yearCurrent yearCurrent year. During the year, the District implemented a six-year plan for facilities and continued to utilize a three-year plan for finances. The District’s rapid growth, limited resources and the need to clearly outline and prioritize site and facility needs in chronological order necessitate the plans. Specifically, the District completed an $11.0 million addition to the sixth and seventh grade Middle School, and began construction on a $4.0 million addition to our current 8-9 building to be completed in the fall of 2009. Future ConsiderationsFuture ConsiderationsFuture ConsiderationsFuture Considerations. The six-year facility plan and accompanying demographic information concluded that student enrollment and tax base would continue to increase at a rapid pace. This study, along with annual enrollment projections to estimate space needs, has indicated the need for a K-5 elementary facility and a 6-8 grade middle school facility to open in the fall of 2010. A 750 student K-5 facility is also slated to open in the fall of 2010 that would replace the current Waukee Elementary school, which is the oldest building in the District having first been built in the early 1900’s. Additional space at the current high school will probably be needed by the fall of 2012. The District is involved with local developers concerning land purchases for future school sites on an ongoing basis. Revenues from a $70 million referendum passed in March of 2008 will fund the above projects.
6
A 300-400 seat Theater Arts Performance Center is in the design stage and should open in the fall of 2010. This project will be financed by selling $4.0 million in Capital Loan Notes against the Physical Plant and Equipment Levy.
DEBT ADMINISTRATION
The ratio of net indebtedness to assessed valuation and the amount of indebtedness per capita are useful indicators of the District’s debt position. The 2008 fiscal year data shows a total outstanding indebtedness on June 30 of $89,345,000 with a ratio of debt to 100% taxable, actual, assessed valuation of 3.00%. During FY 2008, $13,215,000 of outstanding debt was paid and an additional $17,165,000 of new debt issued. In the near future, as assessed valuation and District population rise and total indebtedness decrease, these economic indicators will reflect a very favorable financial position. The above indebtedness of $89,345,000 is a result of general obligation bonds issued July 1997, July 1998, June 1999, April 2000, March 2001, April 2002, November 2002, May 2003, June 2004, February 2005, March 2005 and March 2008. Capital loan notes were issued in February of 2006 and Sales Tax Revenue Bonds were issued in April of 2007.
RISK MANAGEMENT Waukee Community School District is exposed to various risks of loss related to torts, theft, damage to and destruction of assets, error and omissions, injuries to employees and natural disasters. The District assumes liability for any deductibles and claims in excess of coverage limitations. Settled claims from these risks have not exceeded commercial insurance coverage in any of the past three fiscal years.
FINANCIAL INFORMATION Management of the District is responsible for establishing and maintaining an internal control designed to ensure that its capital assets are protected from loss, theft or misuse and to ensure that accounting data are compiled to allow for the preparation of the basic financial statements in accordance with accounting principles generally accepted in the United State of America. The internal control is designed to provide reasonable, but not absolute, assurances that these objectives are met. The concept of reasonable assurance recognizes that the cost of a control should not exceed the benefits likely to be derived and the valuation of costs and benefits requires estimates and judgments by management. Single Audit. As a recipient of federal, state and county financial assistance, the District also is responsible for ensuring that an adequate internal control is in place to ensure compliance with applicable laws and regulations related to those programs. This internal control is subject to periodic evaluation by management and external auditors.

7
As a part of the District’s single audit, described earlier, tests are made to determine the adequacy of the internal control over financial reporting and its compliance with applicable laws and regulations, including those related to major federal awards programs. The results of the District’s single audit for the fiscal year ended June 30, 2008, provided no instances of material weaknesses in the internal control or violations of applicable laws and regulations. Budgetary Controls. In addition, the District maintains budgetary controls. The objective of these budgetary controls is to ensure compliance with legal provisions embodied in the annual appropriated budget approved by the Board of Education. Activities of the General Fund, special revenue funds, Debt Service Fund, enterprise fund and capital projects funds are included in the annual appropriated budget. Project length financial plans are adopted for the capital projects funds and budgeted accordingly on an annual basis. The level of budgetary control (that is, the level at which expenditures cannot legally exceed the appropriated amount) is established by program level for all funds combined rather than at the individual fund level. The District also maintains an encumbrance accounting system as one technique of accomplishing budgetary control. Encumbered amounts lapse at the fiscal year’s end. However, encumbrances generally are re-appropriated as part of the following year’s budget. As demonstrated by the statements and schedules included in the financial section of this report, the District continues to meet its responsibility for sound financial management.
BASIS OF PRESENTATION The charts and accounts used by the District have been prepared in conformity with accounting principles generally accepted in the United States of America as prescribed by the Governmental Accounting Standards Board and Audits of State and Local Governmental Units issued by the American Institute of Certified Public Accountants. In addition, the District’s accounting records conform to the Uniform Accounting System for Iowa Schools, Chapter 11 of the Code of Iowa and Area Educational Agencies issued by the Department of Education, state of Iowa. The chart of accounts manual is updated annually and the District is in full compliance with these requirements.
CASH MANAGEMENT Cash, while temporarily idle during the year, was invested in time deposits and money market accounts. Interest rates ranged from less than 1% to just over 4.0% during the year, compared to the highest rate of 5.134% for the previous year. While interest amounts have decreased this year this aspect of the District’s finances has continues in it’s importance in recent years as we have sought to maximize the yield on our investments without forfeiting the use of fund balances.

8
OTHER INFORMATION Independent Audit. The accounting firm of Van Maanen & Associates, P.C. was selected to perform the annual audit in accordance with Chapter 11 of the Code of Iowa. In addition to meeting the requirements set forth in state statutes, the audit was designed to meet the requirements of the federal Single Audit Act Amendments of 1996 and related OMB Circular A-133. The auditor’s report on the basic financial statements, combining and individual fund statements and other schedules is included in the financial section of this report.
ACKNOWLEDGEMENT The preparation of this report on a timely basis could not have been accomplished without the effort of the accounting staff and our auditors, Van Maanen & Associates, P.C. We would like to express our appreciation to all staff members who assisted and contributed to this report. Also, appreciation is expressed for the interest and support of the Board of Education in conducting the financial operations of The District in a most responsible and progressive manner. Respectfully submitted,
David J. Wilkerson, Ph.D. R. Duane Van Gorp, RSBO Superintendent Executive Director of Administrative Services

9
WAUKEE COMMUNITY SCHOOL DISTRICT

10
Waukee Community School District
Board of Education and Attorney
Board of Education (Before September, 2008 Election)
Term Name Title Expires
Tracy Lepeltak President 2009
Wayne Cooper Vice President 2009
Pat De Mouth Board Member 2009
Russ Wiesley Board Member 2009
Larry Lyon Board Member 2008
Peggy Pierce Board Member 2008
Jerry Ripperger Board Member 2008
Board of Education (After September, 2008 Election)
Wayne Cooper President 2009
Larry Lyon Vice President 2008
Pat De Mouth Board Member 2009
Tracy Lepeltak Board Member 2009
Russ Wiesley Board Member 2009
Peggy Pierce Board Member 2008
Jerry Ripperger Board Member 2008
Board Attorney Ahlers & Cooney, P.C. School Attorney Indefinite
11
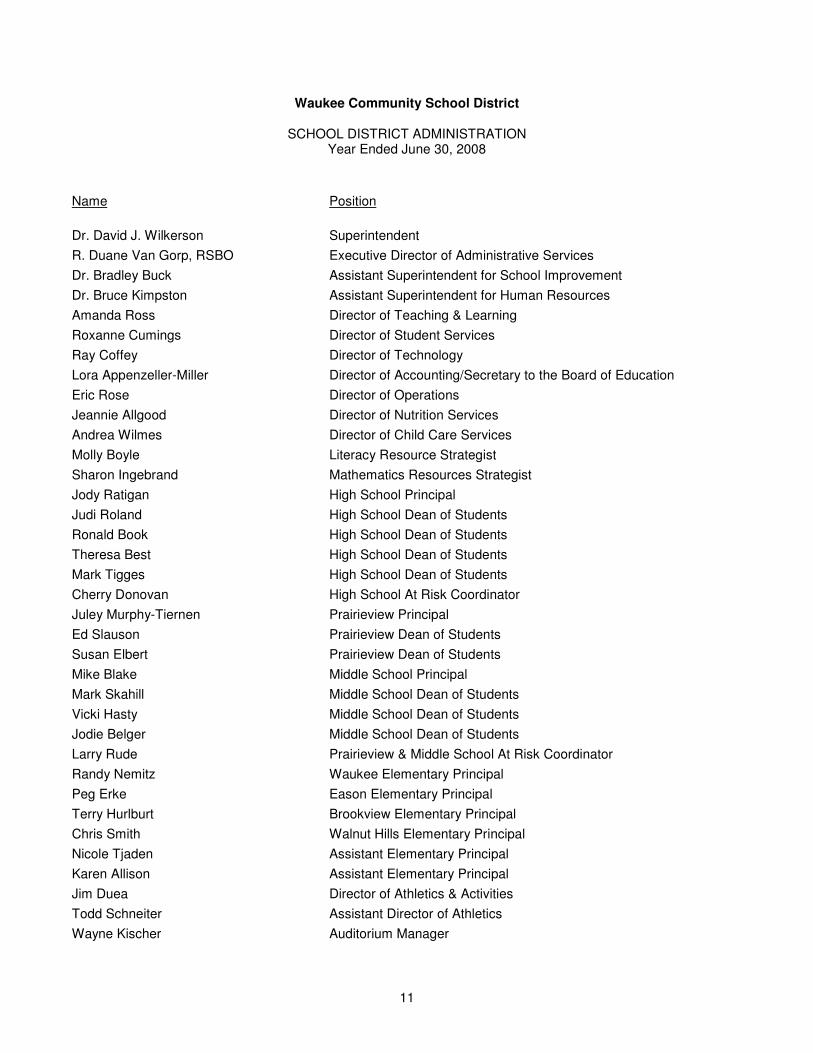
Waukee Community School District
SCHOOL DISTRICT ADMINISTRATION Year Ended June 30, 2008
Name Position
Dr. David J. Wilkerson Superintendent
R. Duane Van Gorp, RSBO Executive Director of Administrative Services
Dr. Bradley Buck Assistant Superintendent for School Improvement
Dr. Bruce Kimpston Assistant Superintendent for Human Resources
Amanda Ross Director of Teaching & Learning
Roxanne Cumings Director of Student Services
Ray Coffey Director of Technology
Lora Appenzeller-Miller Director of Accounting/Secretary to the Board of Education
Eric Rose Director of Operations
Jeannie Allgood Director of Nutrition Services
Andrea Wilmes Director of Child Care Services
Molly Boyle Literacy Resource Strategist
Sharon Ingebrand Mathematics Resources Strategist
Jody Ratigan High School Principal
Judi Roland High School Dean of Students
Ronald Book High School Dean of Students
Theresa Best High School Dean of Students
Mark Tigges High School Dean of Students
Cherry Donovan High School At Risk Coordinator
Juley Murphy-Tiernen Prairieview Principal
Ed Slauson Prairieview Dean of Students
Susan Elbert Prairieview Dean of Students
Mike Blake Middle School Principal
Mark Skahill Middle School Dean of Students
Vicki Hasty Middle School Dean of Students
Jodie Belger Middle School Dean of Students
Larry Rude Prairieview & Middle School At Risk Coordinator
Randy Nemitz Waukee Elementary Principal
Peg Erke Eason Elementary Principal
Terry Hurlburt Brookview Elementary Principal
Chris Smith Walnut Hills Elementary Principal
Nicole Tjaden Assistant Elementary Principal
Karen Allison Assistant Elementary Principal
Jim Duea Director of Athletics & Activities
Todd Schneiter Assistant Director of Athletics
Wayne Kischer Auditorium Manager

12
Waukee Community School District Consultants, Advisers, and Official Depositories
Consultants and Advisors: Official Depositories:
Certified Public Accountants: Wells Fargo, Iowa
Van Maanen & Associates, P.C. 110 Highway 6
705 Main St. Waukee, Iowa 50263
Pella, IA 50219
First American Bank
Bond Attorney: 12333 University Avenue
Ahlers & Cooney, P.C. P.O. Box 71156
100 Court Avenue, Suite 600 Clive, Iowa 50325
Des Moines, Iowa 50309-2231
Iowa School Joint Investment Trust
Financial Consultant: P.O. Box 71158
Piper Jaffrey Clive Iowa 50325-0158
700 Walnut Street, Suite 1300
Des Moines, Iowa 50309-3800 IPAS Education
1415 28th St., Suite 200
General Counsel: Century Building
Ahlers & Cooney, P.C. West Des Moines, Iowa 50266-1456
100 Court Avenue, Suite 600
Des Moines, Iowa 50309-2231
Property/Casualty Insurance Agent:
Insurance Associates
2501 Westown Parkway, Suite 1104
West Des Moines, Iowa 50266-1438
Benefits Insurance Broker:
Mercer Advantage
1776 West Lakes Parkway - SS2
West Des Moines, Iowa 50266

12-a

12-b

13
Independent Auditor's Report
To the Board of Education Waukee Community School District Waukee, Iowa We have audited the accompanying financial statements of the governmental activities, the business-type activities, each major fund, and the aggregate remaining fund information of Waukee Community School District, Iowa, as of and for the year ended June 30, 2008, which collectively comprise the District's basic financial statements listed in the table of contents. These financial statements are the responsibility of District officials. Our responsibility is to express opinions on these basic financial statements based on our audit.
We conducted our audit in accordance with U.S. generally accepted auditing standards and the standards applicable to financial audits contained in Government Auditing Standards, issued by the Comptroller General of the United States. Those standards require that we plan and perform the audit to obtain reasonable assurance about whether the financial statements are free of material misstatement. An audit includes examining, on a test basis, evidence supporting the amounts and disclosures in the financial statements. An audit also includes assessing the accounting principles used and significant estimates made by management, as well as evaluating the overall financial statement presentation. We believe that our audit provides a reasonable basis for our opinions.
In our opinion, the financial statements referred to above present fairly, in all material respects, the respective financial position of the governmental activities, the business-type activities, each major fund, and the aggregate remaining fund information of Waukee Community School District as of June 30, 2008, and the respective changes in financial position and cash flows, where applicable, for the year then ended in conformity with U.S. generally accepted accounting principles.
In accordance with Government Auditing Standards, we have also issued our report dated January 9, 2009 on our consideration of Waukee Community School District’s internal control over financial reporting and our tests of its compliance with certain provisions of laws, regulations, contracts and grant agreements and other matters. The purpose of that report is to describe the scope of our testing of internal control over financial reporting and compliance and the results of that testing, and not to provide an opinion on the internal control over financial reporting or on compliance. That report is an integral part of an audit performed in accordance with Government Auditing Standards and should be considered in assessing the results of our audit.
The Management’s Discussion and Analysis and budgetary comparison information on pages 15 through 21 and 58 through 60 are not required parts of the basic financial statements, but are supplementary information required by the Governmental Accounting Standards Board. We have applied certain limited procedures, which consisted principally of inquiries of management regarding the methods of measurement and presentation of the required supplementary information. We did not audit the information and express no opinion on it.
705 Main St.Pella, IA 50219641-628-3737

14
Our audit was conducted for the purpose of forming opinions on the financial statements that collectively comprise Waukee Community School District’s basic financial statements. A different accounting firm audited, in accordance with the standards referred to in the second paragraph of this report, the financial statements for the two years ended June 30, 2006 (which are not presented herein) and expressed unqualified opinions on those financial statements. We audited, in accordance with the standards referred to in the second paragraph of this report, the financial statements for the year ended June 30, 2007 (which are not presented herein) and expressed unqualified opinions on those financial statements. Other supplementary information included in Schedules 1 through 8, and the Schedule of Expenditures of Federal Awards required by U.S. Office of Management and Budget (OMB) Circular A-133, Audits of States, Local Governments, and Non-Profit Organizations, is presented for purposes of additional analysis and is not a required part of the basic financial statements. Such information has been subjected to the auditing procedures applied in our audit of the basic financial statements and, in our opinion, is fairly stated in all material respects in relation to the basic financial statements taken as a whole.
The statistical information listed in the table of contents is not necessary for a fair presentation of the basic financial statements, but is presented as additional analytical data. This information is unaudited and we do not express an opinion on it.
Van Maanen & Associates, P.C. Certified Public Accountants January 9, 2009

15
WAUKEE COMMUNITY SCHOOL DISTRICT
Management Discussion and Analysis For Fiscal Year Ended June 30, 2008
It is with great pleasure we present to you the financial picture of Waukee Community School District. We offer readers of the District’s financial statements this narrative overview and analysis of the financial activities of the Waukee Community School District for the fiscal year ended June 30, 2008. We encourage readers to consider the information presented here in conjunction with additional information that we have furnished in our letter of transmittal. Professional standards require the inclusion of certain comparative information in the Management’s Discussion and Analysis (MD&A). However, in the year of implementation, certain omissions are allowed. Subsequent MD&A’s will include all required comparative information. Financial Highlights The District showed an increase in net assets of $10,441,661 during the year ended June 30, 2008. Total revenues for the fiscal year ended June 30, 2008 of $61,469,450 were comprised of General Revenues in the amount of $51,479,750 and program revenues totaling $9,989,700. As of June 30, 2008, unreserved, undesignated fund balance for the General Fund was $6,804,838 or 16.56% of General Fund expenditures. The financial solvency ratio for the year ended June 30, 2008 was 15.68%, which is an increase of 3.55% over the previous year. This increase is attributed to unreserved fund balance keeping pace with revenue increases and a favorable ration of total revenues to total expenditures. The Waukee Community School District’s total long-term bonded debt increased by $3,950,000 due to the issuance of general obligation bonds issued in March of 2008. Overview of the Financial Statements This discussion and analysis is intended to serve as an introduction to the Waukee Community School District’s basic financial statements. The District’s basic financial statements comprise three components: 1) government-wide financial statements, 2) fund financial statements and 3) notes to the financial statements. This report also contains other supplementary information in addition to the basic financial statements themselves. Government-wide financial statements - The government-wide financial statements are designed to provide readers with a broad overview of Waukee Community School District’s finances in a manner similar to a private-sector business. The statement of net assets presents information on all Waukee Community School District’s assets and liabilities, with the difference between the two reported as net assets. Over time, increases and decreases in net assets may serve as a useful indicator of whether the financial position of the District is improving or deteriorating. The statement of activities presents information showing how the District’s net assets changed during the most recent fiscal year. All changes in net assets are reported as soon as the underlying event giving rise to the changes occurs, regardless of the timing of related cash flows. Thus, revenues and expenses are reported in this statement for some items that will only result in cash flows in future fiscal periods (e.g., uncollected taxes and earned but unused vacation leave). Both of the government-wide financial statements reflect functions of the Waukee Community School District that are principally supported by taxes and intergovernmental revenues (governmental activities). The governmental activities of the District include instruction, support services, non-instructional services, other and interest on long-term debt. Business type activities are those that the District charges a fee to help cover the costs such as School Nutrition. The government-wide financial statements include only Waukee Community School District. There are no other organizations or agencies whose financial statements should be combined and presented with the financial statements of the District.

16
Fund financial statements – A fund is a grouping of related accounts that is used to maintain control over resources that have been segregated for specific activities or objectives. The Waukee Community School District, like other state and local governments, uses fund accounting to ensure and demonstrate compliance with finance-related legal requirements. All of the funds of the District can be divided into three categories: governmental funds, proprietary fund and fiduciary funds. Governmental funds – Governmental funds are used to account for essentially the same functions reported as governmental activities in the government-wide financial statements. However, unlike government-wide financial statements, governmental fund financial statements focus on near-term inflows and outflows of spendable resources, as well as on balances of spendable resources available at the end of the fiscal year. Such information may be useful in evaluating a government’s near-term financial requirements. Because the focus of governmental funds is narrower than that of the government-wide financial statements, it is useful to compare the information presented for governmental funds with similar information presented for governmental activities in the government-wide statements. By doing so, readers may better understand the long-term impact of the government’s near-term financing decisions. Both the governmental fund balance sheet and the governmental fund statement of revenues, expenditures and changes in fund balances provide a reconciliation to facilitate this comparison between governmental funds and governmental activities. The Waukee Community School District maintains six individual governmental funds. Information is presented separately in the governmental fund balance sheet and in the governmental fund statement of revenues, expenditures and changes in fund balances for the General Fund, Debt Service and Capital Projects Funds, which are considered to be major funds. Data from the other governmental funds are combined into a single, aggregated presentation. Individual fund data for each of the non-major governmental funds is provided in the form of combining statements elsewhere in this report. The basic governmental fund financial statements can be found on pages 30 through 34 of this report. Proprietary fund – The District maintains only one type of proprietary fund, the enterprise fund. Enterprise funds are used to report the same functions presented as business-type activities in the government-wide financial statements. The District maintains one enterprise fund. The basic proprietary fund financial statements can be found on pages 35 through 37 of this report. Fiduciary funds – Fiduciary funds are used to account for resources held for the benefit of parties outside the government. Fiduciary funds are not reflected in the government-wide financial statement because the resources of those funds are not available to support the Waukee Community School District’s own programs. The fiduciary funds of the District are agency funds. Agency funds are custodial in nature and do not involve measurement of results of operation. The basic fiduciary fund financial statements can be found on pages 38 through 39 of this report. Notes to the financial statements – The notes provide additional information that is essential to a full understanding of the data provided in the government-wide and fund financial statements. Other information – In addition to the basic financial statements and accompanying notes, this report also presents certain required supplementary information concerning the Waukee Community School District’s budgetary comparison. Required supplemental information can be found on pages 58 and 60 of this report. The combining statements referred to earlier in connection with non-major governmental funds are presented immediately following the required supplementary information.

17
Government-Wide Financial Analysis As noted earlier, net assets may serve over time as a useful indicator of a government’s financial position. The District’s total net assets have increased from a year ago from $28,149,303 to $38,590,964. A significant portion of the District’s total assets reflects it investment in capital assets. The District uses these capital assets to provide educational services; consequently, these assets are not available for future spending. The District’s net assets invested in capital assets, net of related debt, was $19,405,037. Although the District’s investment in its capital assets is reported net of related debt, it should be noted that the resources needed to repay this debt must be provided from other sources since the capital assets themselves cannot be used to liquidate these liabilities.
The restricted portion of the District’s net assets (25.7%) represents resources that are subject to external restrictions on how they may be used. These restrictions include $133,903 for special restricted purposes, $2,033,495 for Physical Plant and Equipment, $7,259,134 for Capital Projects and $423,123 for other special revenue purposes. The remaining balance of unrestricted net assets may be used to meet the government’s ongoing obligations to students and creditors. At the end of the current fiscal year, the Waukee Community School District is able to report positive balances in all three categories of net assets. The same situation held true for the prior fiscal year. The District’s total net assets increased by $10,441,661, or 37.1%, during the current fiscal year. The total invested in capital assets net of related debt increased 33.2%. The governmental activities net assets increased by $9,678,840. Business type activities increased by $762,821. The increase in governmental activities net assets is mainly attributable to less than expected budgeted expenditures during a time that the District is growing dramatically and investing heavily in capital assets.
Table 1
Statement of Net Assets
Total Change
June 30,
2008 2007 2008 2007 2008 2007 2007-2008
Current and other assets 69,826,802$ 60,702,342 1,217,661 1,003,298 71,044,463 61,705,640 15.1%
Capital assets 97,335,773 86,215,826 1,073,417 512,885 98,409,190 86,728,711 13.5%Total assets 167,162,575 146,918,168 2,291,078 1,516,183 169,453,653 148,434,351 14.2%
Long-term debt outstanding 89,345,000 82,194,466 - - 89,345,000 82,194,466 8.7%
Other liabilities 41,451,155 38,036,122 66,534 54,460 41,517,689 38,090,582 9.0%
Total liabilities 130,796,155 120,230,588 66,534 54,460 130,862,689 120,285,048 8.8%
Net assets:Invested in capital assets,
net of related debt 18,331,620 14,051,616 1,073,417 736,602 19,405,037 14,788,218 31.2%
Restricted 9,922,010 7,820,732 - - 9,922,010 7,820,732 26.9%
Unrestricted 8,112,790 4,815,232 1,151,127 725,121 9,263,917 5,540,353 67.2%Total net assets 36,366,420$ 26,687,580 2,224,544 1,461,723 38,590,964 28,149,303 37.1%
Governmental activities Business type activities Total
June 30, June 30, June 30,
18
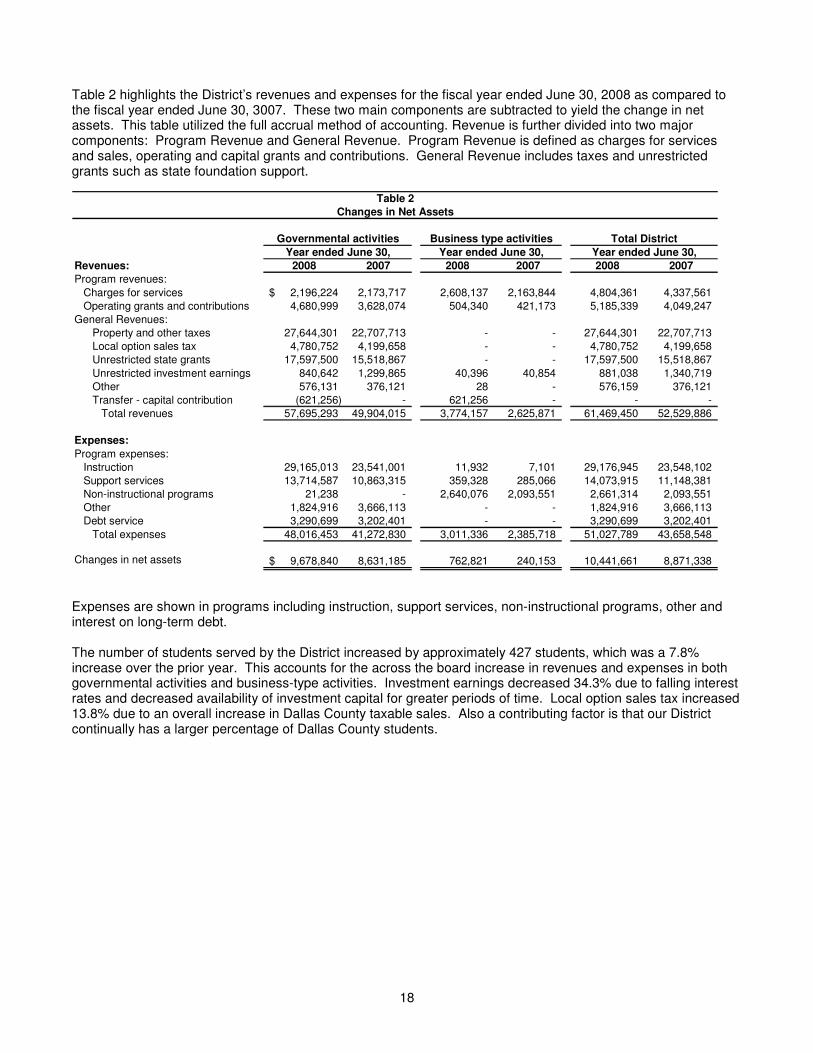
Table 2 highlights the District’s revenues and expenses for the fiscal year ended June 30, 2008 as compared to the fiscal year ended June 30, 3007. These two main components are subtracted to yield the change in net assets. This table utilized the full accrual method of accounting. Revenue is further divided into two major components: Program Revenue and General Revenue. Program Revenue is defined as charges for services and sales, operating and capital grants and contributions. General Revenue includes taxes and unrestricted grants such as state foundation support.
Expenses are shown in programs including instruction, support services, non-instructional programs, other and interest on long-term debt.
The number of students served by the District increased by approximately 427 students, which was a 7.8% increase over the prior year. This accounts for the across the board increase in revenues and expenses in both governmental activities and business-type activities. Investment earnings decreased 34.3% due to falling interest rates and decreased availability of investment capital for greater periods of time. Local option sales tax increased 13.8% due to an overall increase in Dallas County taxable sales. Also a contributing factor is that our District continually has a larger percentage of Dallas County students.
Year ended June 30, Year ended June 30, Year ended June 30,
Revenues: 2008 2007 2008 2007 2008 2007
Program revenues:
Charges for services 2,196,224$ 2,173,717 2,608,137 2,163,844 4,804,361 4,337,561
Operating grants and contributions 4,680,999 3,628,074 504,340 421,173 5,185,339 4,049,247
General Revenues:
Property and other taxes 27,644,301 22,707,713 - - 27,644,301 22,707,713
Local option sales tax 4,780,752 4,199,658 - - 4,780,752 4,199,658
Unrestricted state grants 17,597,500 15,518,867 - - 17,597,500 15,518,867
Unrestricted investment earnings 840,642 1,299,865 40,396 40,854 881,038 1,340,719
Other 576,131 376,121 28 - 576,159 376,121
Transfer - capital contribution (621,256) - 621,256 - - -
Total revenues 57,695,293 49,904,015 3,774,157 2,625,871 61,469,450 52,529,886
Expenses:
Program expenses:
Instruction 29,165,013 23,541,001 11,932 7,101 29,176,945 23,548,102
Support services 13,714,587 10,863,315 359,328 285,066 14,073,915 11,148,381
Non-instructional programs 21,238 - 2,640,076 2,093,551 2,661,314 2,093,551
Other 1,824,916 3,666,113 - - 1,824,916 3,666,113
Debt service 3,290,699 3,202,401 - - 3,290,699 3,202,401
Total expenses 48,016,453 41,272,830 3,011,336 2,385,718 51,027,789 43,658,548
Changes in net assets 9,678,840$ 8,631,185 762,821 240,153 10,441,661 8,871,338
Table 2
Governmental activities Business type activities Total District
Changes in Net Assets

19
Table 3 below discloses cost of services for governmental and business-type activities. The total cost of services column contains all costs related to the programs and the net cost column shows how much of the total amount is not covered by program revenues. Succinctly put, net costs are costs that must be covered by state aid and local taxes. The difference in these two columns would represent restricted grants and services. Net Cost of services is 85.6% of total cost of services in 2008.
Financial Analysis of the Government’s Funds As noted earlier, the Waukee Community School District uses fund accounting to ensure and demonstrate compliance with finance-related legal requirements. Governmental Funds – The focus of the Waukee Community School District’s governmental funds is to provide information on near-term inflows, outflows and balances of spendable resources. Such information is useful in assessing the District’s financing requirements. In particular, unreserved fund balance may serve as a useful measure of a government’s net resources available for spending at the end of the fiscal year. As of the end of the current fiscal year, the Waukee Community School District’s governmental funds reported combined ending balances of $29,960,980, an increase of $2,648,122 in comparison with the prior year. Approximately 22.7% of this total amount, or $6,804,838, constitutes unreserved fund balance and is available for spending at the government’s discretion. The remainder of the fund balance is reserved to indicate that it is not available for new spending because it has already been committed for 1) inventories $36,681; 2) state grants $97,222; 3) General Fund $92,506: 4) Debt Service $9,432,642; 5) Capital Projects $10,340,847 and for 5) non-major, special revenue funds $3,156,244. The General Fund is the chief operating fund of the District. At the end of the current fiscal year, unreserved fund balance of the General Fund was $6,804,838 while total fund balance reached $7,031,247. As a measure of the General Fund’s liquidity, it may be useful to compare both unreserved fund balance and the total fund balance to total fund expenditures. Unreserved fund balance represents 16.56% of total General Fund expenditures. The fund balance of the District’s General Fund increased $2,305,646 during the current fiscal year. The key factor in this was a concentrated effort to continue a trend of upward financial stability as evidenced by an increasing fund balance and financial solvency ratio. The District’s other major funds include the Debt Service Fund and the Capital Projects Fund. The Debt Service fund balance increased $609,839 due to accumulation of local taxes needed to make future interest payments as they come due. The Capital Projects fund balance decreased by $1,778,983.
Table 3
Governmental Activities
Programs
Total Cost of
Services
Net Cost of
Services
Instruction 29,165,013$ 24,236,783
Support Services 13,714,587 13,462,184 Noninstructional programs 21,238 21,238
Other 1,824,916 128,326
Debt Service 3,290,699 3,290,699 48,016,453$ 41,139,230

20
Budgetary Highlights As allowed by GASB Statement No. 41, Budgetary Comparison-Schedules – Perspective Differences, the District presents budgetary comparison schedules as required supplementary information based on the program structure of four functional areas as required by state statute for its legally adopted budget. In accordance with the Code of Iowa, the Board of Education annually adopts a program budget for all funds except agency funds as described in the note to required supplementary information. A comparison of the actual expenditures/expenses of the District’s budgeted funds with the final budget amounts is as follows:
The positive variance of $2,513,255 was a result of a concentrated and successful effort to maximize revenues and control expenses. Capital Assets and Debt Administration The following table shows ending balances of capital assets invested in various categories. The District recognized a total net increase of $31,101,418. The increase can be attributed to extensive land purchases and three major construction projects in progress at year’s end.
Debt As of June 30, 2008, the Waukee Community School District had general obligation and capital loan notes outstanding totaling $89,345,000. In the current year, the District paid $13,215,000 in principal and $3,097,409 in interest. As of June 30, 2008, the District’s available debt limit was $149,054,083 which leaves a legal debt margin of $59,709,083 once the current year applicable general obligation and capital loan debt is applied. Additional information about the District’s long-term debt can be found in note 5 to the financial statements.
Budget
Original and
Final Actual Variance
Instruction 23,973,470$ 27,367,942 (3,394,472)
Support Services 21,007,269 14,778,922 6,228,347
Noninstructional programs 2,700,000 2,670,031 29,969 Other 34,118,468 31,098,039 3,020,429
81,799,207$ 75,914,934 5,884,273
Table 4
Capital Assets,
Net of Depreciation
2008 2007
Land 4,939,976$ 4,939,976
Construction in progress 5,280,004 21,240,044
Buildings and improvements 85,353,072 58,687,046
Furniture and equipment 1,762,721 1,348,760
Total 97,335,773$ 86,215,826
Governmental activities
June 30,

21
Economic Factors and Next Year’s Budgets and Rates The District is located in the central part of the state, approximately 15 miles west of the city of Des Moines. The District, comprised totally in Dallas County, Iowa, is one of the fastest growing counties in the nation. The District is the fastest growing school district in the State of Iowa. The September 2007 certified student enrollment increased 412.7 students over the previous year. The economic condition and outlook of the District is one of great optimism. Over the past seven years the total taxable assessed value in the District has increased $1.2B. The taxable assessed value has increased 109% in the last five fiscal years. For the current fiscal year, taxable assessed value in the District increased $350,567,879 or 22.9%. Based on conservative estimates this trend is expected to continue and probably accelerate in the immediate future. The eastern portions of Dallas County are experiencing tremendous growth in both residential and commercial development. The collection of the Dallas County local option sales tax, a one cent tax on all covered retail sales began in January of 2004 and generated $4.78 million dollars in fiscal 2008. An estimated $5.2 million dollars is expected to be generated in 2009. The one-cent sales tax will continue through December of 2013. This tremendous growth, while having a positive impact, also presents significant challenges for the District. The District is utilizing the optional instructional support levy to its fullest and will need to continue its high level of efficient use of human resources and facilities. Retail sales, building permits and population increases in the western suburbs far exceed that of any other location in the metropolitan area or in the State of Iowa. Dallas County is one of the fastest growing county in the country. These increases are projected to continue if economic conditions remain favorable. The past year saw the State of Iowa’s economic downturn began to turn in a positive direction. Revenue projections at the state level increased again for the third consecutive year. While the District has faced reductions in funding for state aid and other state-funded programs in previous years, the future looks brighter with the 2008 legislature setting allowable growth for the 2008-09 and 2009-10 fiscal years at 4%. We are optimistic about the State of Iowa’s financial outlook. As the national economy continues to strengthen, state revenues usually follow the same upward direction. Requests for Information These financial statements and discussions are designed to provide our students, citizens, taxpayers, investors and creditors with a complete disclosure of the District’s finances and to demonstrate a high degree of accountability for the public dollars entrusted to us. If you have questions about this report or need additional information, please write Mr. R. Duane Van Gorp, Executive Director of Administrative Services, Waukee Community School District, 560 S.E. University Avenue, Waukee, Iowa, 50263.

22

23
Basic Financial Statements

Exhibit A
WAUKEE COMMUNITY SCHOOL DISTRICT
STATEMENT OF NET ASSETS
June 30, 2008
Governmental Business Type Total Primary
Activities Activities Government
Assets
Current Assets:
Cash and cash equivalents:
Revenue bond reserve 1,890,000$ - 1,890,000
Other 32,622,442 1,161,763 33,784,205
Receivables:
Property tax:
Delinquent 231,151 - 231,151
Succeeding year 33,731,694 - 33,731,694
Accounts 81,902 9,243 91,145
Due from other governments 1,105,495 - 1,105,495
Inventories 36,681 46,655 83,336
Total current assets 69,699,365 1,217,661 70,917,026
Non-current assets:
Bond discounts, unamortized 127,437 - 127,437
Capital assets:
Land and improvements 4,939,976 - 4,939,976
Buildings and improvements 98,148,912 - 98,148,912
Vehicles, furniture and equipment 3,075,320 1,803,298 4,878,618
Construction in progress 5,280,004 - 5,280,004
Accumulated depreciation (14,108,439) (729,881) (14,838,320)
Total capital assets 97,335,773 1,073,417 98,409,190
Total non-current assets 97,463,210 1,073,417 98,536,627
Total assets 167,162,575 2,291,078 169,453,653
Liabilities
Current liabilities:
Accounts payable 2,020,251 14,213 2,034,464
Salaries and benefits payable 3,848,266 14,271 3,862,537
Accrued interest payable 673,361 - 673,361
Unearned revenue:
Succeeding year property tax 33,731,694 - 33,731,694
Other - 38,050 38,050
Capital loan notes payable 1,380,000 - 1,380,000
Revenue bonds payable 2,475,000 - 2,475,000
General obligation bonds payable 4,990,000 - 4,990,000
Early retirement payable 114,788 - 114,788
Compensated absences 144,816 - 144,816
Total current liabilities 49,378,176 66,534 49,444,710
Non-current liabilities:
Capital loan notes payable 11,195,000 - 11,195,000
Revenue bonds payable 13,925,000 - 13,925,000
General obligation bonds payable 55,380,000 - 55,380,000
Unamortized premium 405,496 - 405,496
Early retirement payable 512,483 - 512,483
Total non-current liabilities 81,417,979 - 81,417,979
Total liabilities 130,796,155 66,534 130,862,689
24

Exhibit A
WAUKEE COMMUNITY SCHOOL DISTRICT
STATEMENT OF NET ASSETS
June 30, 2008
Governmental Business Type Total Primary
Activities Activities Government
Continued from previous page
Net Assets
Invested in capital assets, net of related debt 18,331,620 1,073,417 19,405,037
Restricted for:
Management levy 72,355 - 72,355
Physical plant and equipment levy 2,033,495 - 2,033,495
Other special revenue purposes 423,123 - 423,123
Capital projects 7,259,134 - 7,259,134
Other purposes 133,903 - 133,903
Unrestricted 8,112,790 1,151,127 9,263,917 Total net assets 36,366,420$ 2,224,544 38,590,964
See notes to basic financial statements.
25

Exhibit B
WAUKEE COMMUNITY SCHOOL DISTRICT
STATEMENT OF ACTIVITIES
Year ended June 30, 2008
Program Revenues
Expenses
Charges for
Service
Operating
Grants,
Contributions and
Restricted
Interest
Capital Grants
and Contributions
Functions/Programs
Governmental activities:
Instruction:
Regular instruction 21,860,933$ 1,176,679 2,375,683 -
Special instruction 4,916,730 248,398 475,620 -
Other instruction 2,387,350 632,611 19,239 -
29,165,013 2,057,688 2,870,542 -
Support Service:
Student services 2,514,754 - - -
Instructional staff services 1,715,851 - - -
Administration services 3,638,974 - - -
Operating and maintenance of plant services 3,862,484 71,158 - -
Transportation services 1,982,524 67,378 113,867 -
13,714,587 138,536 113,867 -
Non-instructional programs:
Enterprise operations 21,238 - - -
Other expenditures:
Debt service - interest 3,290,699 - - -
AEA flowthrough 1,696,590 - 1,696,590 -
Depreciation (unallocated) * 128,326 - - -
5,115,615 - 1,696,590 -
Total governmental activities 48,016,453 2,196,224 4,680,999 -
Business type activities:
Instruction:
Regular instruction 11,932 - - -
Support services:
Administration services 348,150 - - -
Operating and maintenance of plant services 4,620 - - -
Transportation services 6,558 - - -
359,328 - - -
Non-instructional programs:
Food service operations 2,133,551 1,908,746 504,340 -
Daycare operations 506,525 699,391 - -
2,640,076 2,608,137 504,340 -
Total business type activities 3,011,336 2,608,137 504,340 -
Total primary governmental activities 51,027,789$ 4,804,361 5,185,339 -
26

Exhibit B
Governmental
Activities
Business Type
Activities
Total Primary
Government
(18,308,571) - (18,308,571)
(4,192,712) - (4,192,712)
(1,735,500) - (1,735,500)
(24,236,783) - (24,236,783)
(2,514,754) - (2,514,754)
(1,715,851) - (1,715,851)
(3,638,974) - (3,638,974)
(3,791,326) - (3,791,326)
(1,801,279) - (1,801,279)
(13,462,184) - (13,462,184)
(21,238) - (21,238)
(3,290,699) - (3,290,699)
- - -
(128,326) - (128,326)
(3,419,025) - (3,419,025)
(41,139,230) - (41,139,230)
- (11,932) (11,932)
- (348,150) (348,150)
- (4,620) (4,620)
- (6,558) (6,558)
- (359,328) (359,328)
- 279,535 279,535
- 192,866 192,866
- 472,401 472,401
- 101,141 101,141
(41,139,230) 101,141 (41,038,089)
Net (Expense) Revenue and Changes in Net
Assets
27

Exhibit B
WAUKEE COMMUNITY SCHOOL DISTRICT
STATEMENT OF ACTIVITIES
Year ended June 30, 2008
Program Revenues
Expenses
Charges for
Service
Operating
Grants,
Contributions and
Restricted
Interest
Capital Grants
and Contributions
Totals continued from previous pages 51,027,789$ 4,804,361 5,185,339
General Revenues:
Property tax levied for:
General purposes
Debt service
Capital outlay
Local option sales and services tax
Unrestricted state grants
Grants and contributions not restricted to specific programs
Unrestricted investment earnings
Other
Transfers - capital contribution
Total general revenues, capital contributions and transfers
Change in net assets
Net assets beginning of year
Net assets end of year
* This amount excludes the depreciation that is included in the direct expense of the various programs.
See notes to basic financial statements.
28
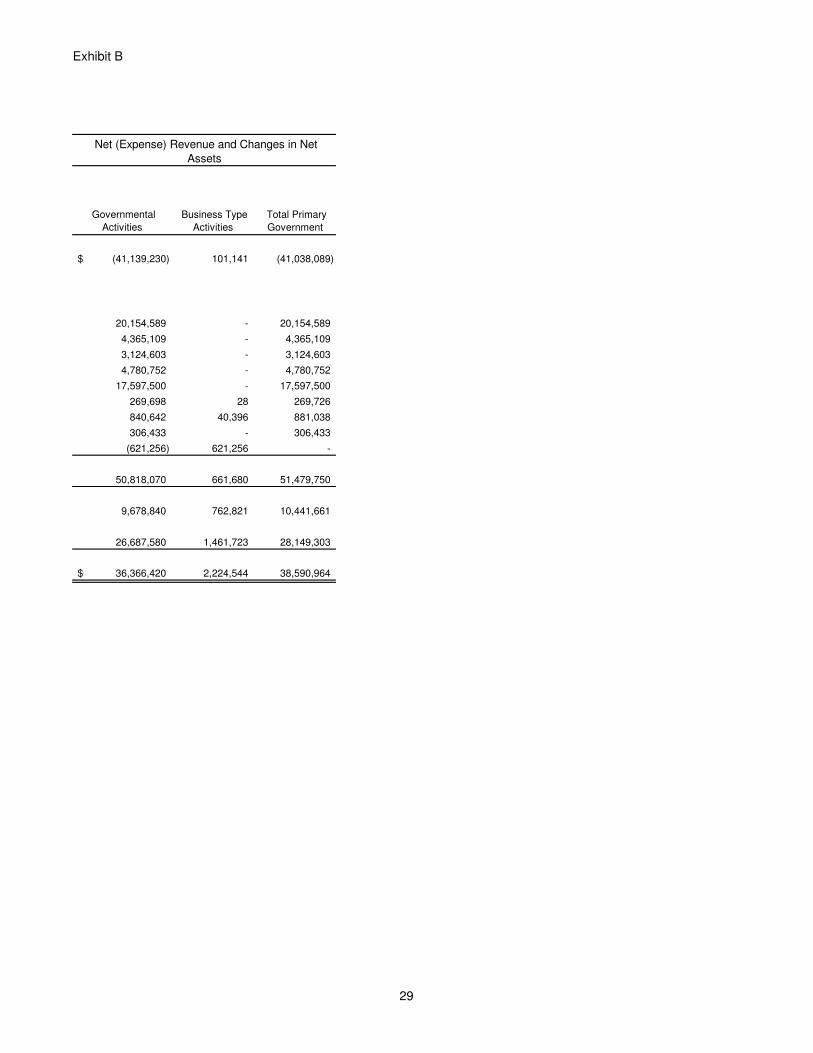
Exhibit B
Governmental
Activities
Business Type
Activities
Total Primary
Government
Net (Expense) Revenue and Changes in Net
Assets
(41,139,230)$ 101,141 (41,038,089)
20,154,589 - 20,154,589
4,365,109 - 4,365,109
3,124,603 - 3,124,603
4,780,752 - 4,780,752
17,597,500 - 17,597,500
269,698 28 269,726
840,642 40,396 881,038
306,433 - 306,433
(621,256) 621,256 -
50,818,070 661,680 51,479,750
9,678,840 762,821 10,441,661
26,687,580 1,461,723 28,149,303
36,366,420$ 2,224,544 38,590,964
29

Exhibit C
WAUKEE COMMUNITY SCHOOL DISTRICT
BALANCE SHEET
GOVERNMENTAL FUNDS
June 30, 2008
Non-major
Debt Capital Governmental
General Service Projects Funds Total
Assets
Cash and pooled investments
Revenue bond reserve -$ - 1,890,000 - 1,890,000
Other 11,167,356 2,131,082 16,040,212 3,170,809 32,509,459
Receivables:
Property tax:
Current year delinquent 178,470 42,426 - 10,255 231,151
Succeeding year 21,622,344 7,499,922 - 4,609,428 33,731,694
Accounts 23,557 - 1,442 31,712 56,711
Due from other governments 309,308 - 796,187 - 1,105,495
Inventories 36,681 - - - 36,681
Total assets 33,337,716$ 9,673,430 18,727,841 7,822,204 69,561,191
Liabilities and Fund Balances
Liabilities:
Accounts payable 835,859$ - 1,127,860 56,532 2,020,251
Salaries and benefits payable 3,848,266 - - - 3,848,266
Deferred revenue:
Succeeding year property tax 21,622,344 7,499,922 - 4,609,428 33,731,694
Total liabilities 26,306,469 7,499,922 1,127,860 4,665,960 39,600,211
Fund balances:
Reserved for:
Inventories 36,681 - - - 36,681
State grants 97,222 - - - 97,222
Debt service - 2,173,508 7,259,134 - 9,432,642
Unreserved:
Designated for:
School program projects 92,506 - - - 92,506
Undesignated, reported in:
General fund 6,804,838 - - - 6,804,838
Capital projects fund - - 10,340,847 - 10,340,847
Special revenue funds: - - - - -
Management fund - - - 699,626 699,626
Student activity fund - - - 423,123 423,123
Physical plant and equipment fund - - - 2,033,495 2,033,495
Total fund balances 7,031,247 2,173,508 17,599,981 3,156,244 29,960,980
Total liabilities and fund balances 33,337,716$ 9,673,430 18,727,841 7,822,204 69,561,191
See notes to basic financial statements.
30
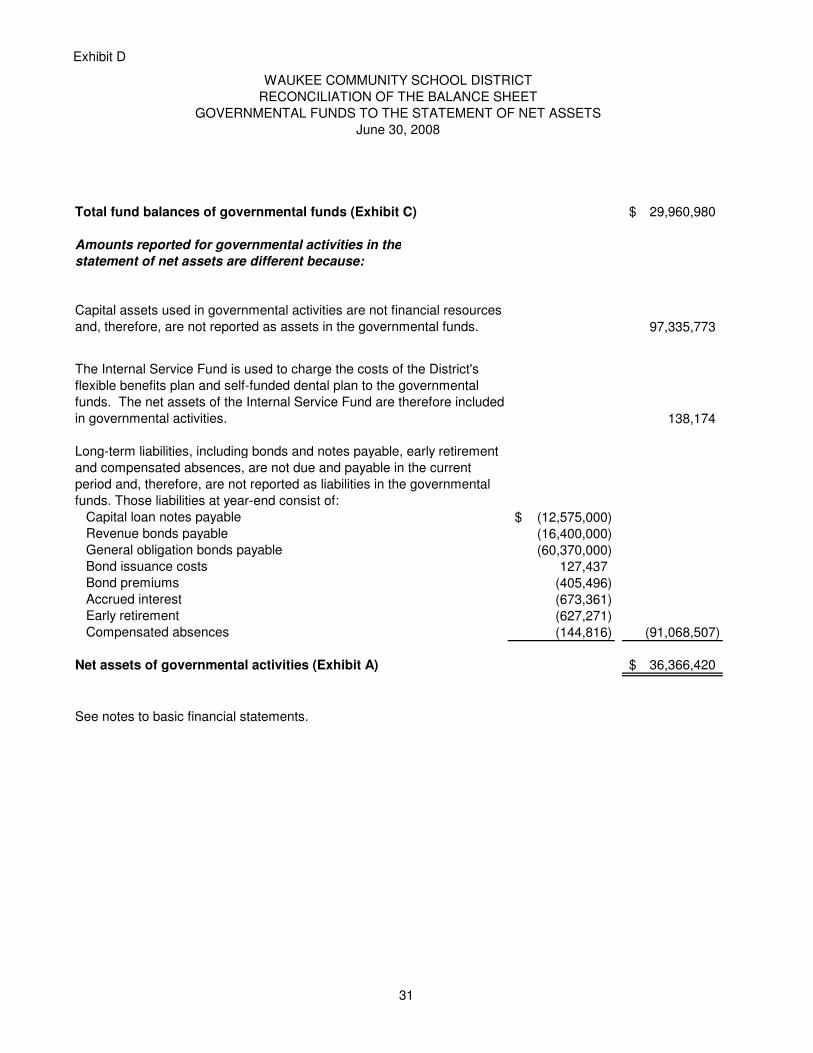
Exhibit D
WAUKEE COMMUNITY SCHOOL DISTRICT
RECONCILIATION OF THE BALANCE SHEET
GOVERNMENTAL FUNDS TO THE STATEMENT OF NET ASSETS
June 30, 2008
Total fund balances of governmental funds (Exhibit C) 29,960,980$
Amounts reported for governmental activities in the
statement of net assets are different because:
Capital assets used in governmental activities are not financial resources
and, therefore, are not reported as assets in the governmental funds. 97,335,773
The Internal Service Fund is used to charge the costs of the District's
flexible benefits plan and self-funded dental plan to the governmental
funds. The net assets of the Internal Service Fund are therefore included
in governmental activities. 138,174
Long-term liabilities, including bonds and notes payable, early retirement
and compensated absences, are not due and payable in the current
period and, therefore, are not reported as liabilities in the governmental
funds. Those liabilities at year-end consist of:
Capital loan notes payable (12,575,000)$ Revenue bonds payable (16,400,000) General obligation bonds payable (60,370,000) Bond issuance costs 127,437 Bond premiums (405,496) Accrued interest (673,361) Early retirement (627,271) Compensated absences (144,816) (91,068,507)
Net assets of governmental activities (Exhibit A) 36,366,420$
See notes to basic financial statements.
31

Exhibit E
WAUKEE COMMUNITY SCHOOL DISTRICT
STATEMENT OF REVENUES, EXPENDITURES AND CHANGES IN FUND BALANCES
GOVERNMENTAL FUNDS
Year ended June 30, 2008
Non-major
Debt Capital Governmental
General Service Projects Funds Total
Revenues:
Local sources:
Local tax 19,059,387$ 4,365,109 4,780,752 4,219,805 32,425,053
Tuition 1,175,066 - - - 1,175,066
Other 870,294 39,391 551,800 971,153 2,432,638
State sources 21,802,799 743 - 750 21,804,292
Federal sources 479,500 - - - 479,500
Total revenues 43,387,046 4,405,243 5,332,552 5,191,708 58,316,549
Expenditures:
Current:
Instruction:
Regular instruction 19,691,613 - 94,625 254,061 20,040,299
Special instruction 4,926,113 - - - 4,926,113
Other instruction 1,567,462 - - 822,136 2,389,598
26,185,188 - 94,625 1,076,197 27,356,010
Support services:
Student services 1,686,981 817,293 14,184 2,518,458
Instructional staff services 2,443,174 - 7,136 2,450,310
Administration services 3,499,512 16,009 35,977 87,661 3,639,159
Operation and maintenance of plant services 3,564,931 - 264,839 3,829,770
Transportation services 1,981,897 - - 1,981,897
13,176,495 16,009 853,270 373,820 14,419,594
Non-instructional programs:
Enterprise operations 23,127 - - 6,828 29,955
23,127 - - 6,828 29,955
Capital outlay:
Facilities acquisition - - 12,705,866 374,474 13,080,340
Debt service:
Principal - 13,215,000 - - 13,215,000
Interest - 3,097,409 - - 3,097,409
Fiscal charges - 8,700 - - 8,700
AEA flowthrough 1,696,590 - - - 1,696,590
1,696,590 16,321,109 12,705,866 374,474 31,098,039
Total expenditures 41,081,400 16,337,118 13,653,761 1,831,319 72,903,598
Excess (deficiency) of revenues over
(under) expenditures 2,305,646 (11,931,875) (8,321,209) 3,360,389 (14,587,049)
32

Exhibit E
WAUKEE COMMUNITY SCHOOL DISTRICT
STATEMENT OF REVENUES, EXPENDITURES AND CHANGES IN FUND BALANCES
GOVERNMENTAL FUNDS
Year ended June 30, 2008
Non-major
Debt Capital Governmental
General Service Projects Funds Total
Continued from previous page
Other financing sources (uses):
Interfund transfers in - 5,327,082 - - 5,327,082
Interfund transfers out - - (3,478,313) (1,848,769) (5,327,082)
Refunding bonds issued - 7,165,000 - - 7,165,000
General obligation bonds issued - - 10,000,000 - 10,000,000
Premium on sale of bonds - 88,404 117,581 - 205,985
Discount on sale of bonds - (38,772) (97,042) - (135,814)
Total other financing sources (uses) - 12,541,714 6,542,226 (1,848,769) 17,235,171
Net change in fund balances 2,305,646 609,839 (1,778,983) 1,511,620 2,648,122
Fund balances beginning of year 4,725,601 1,563,669 19,378,964 1,644,624 27,312,858
Fund balances end of year 7,031,247$ 2,173,508 17,599,981 3,156,244 29,960,980
See notes to basic financial statements.
33

Exhibit F
WAUKEE COMMUNITY SCHOOL DISTRICT
RECONCILIATION OF THE STATEMENT OF REVENUES, EXPENDITURES AND
CHANGES IN FUND BALANCES
GOVERNMENTAL FUNDS TO THE STATEMENT OF ACTIVITIES
Year ended June 30, 2008
Net change in fund balances - total governmental funds (Exhibit E) 2,648,122$
Amounts reported for governmental activities in the
statement of activities are different because:
Capital outlays to purchase or build capital assets are reported in governmental funds
as expenditures. However, those costs are reported in the Statement of Net Assets and
are allocated over their estimated useful lives as depreciation expense in the Statement
of Activities. The amounts of capital outlays and depreciation expense in the year are
as follows:
Expenditures for capital assets 13,209,951$
Depreciation expense (2,090,004) 11,119,947
Proceeds from issuing long-term liabilities provide current financial resources to
governmental funds, but increases long-term liabilities in the Statement of Net Assets.
Repayment of long-term debt liabilities is an expenditure in the governmental funds, but
the repayment reduces long-term liabilities in the Statement of Net Assets. Also,
governmental funds report the effect of issuance costs and premiums, whereas these
amounts are deferred in and amortized in the Statement of Activities. Current year items
are as follows:
Proceeds from issuing general obligation bonds (17,165,000)
Premiums on general obligation issuance (205,985)
Discounts on general obligation issuance 135,814
Repayments of bond and note principal 13,215,000
Amortization of premiums and discounts 43,904 (3,976,267)
Interest on long-term debt in the Statement of Activities differs from the amount reported
in the governmental funds because interest is recorded as an expenditure in the funds
when due. In the Statement of Activities, interest expense is recognized as the interest
accrues, regardless of when it is due. (184,590)
Some expenses reported in the Statement of Activities do not require the use of current
financial resources and, therefore, are not reported as expenditures in the governmental
funds.
Early retirement (7,728)
Compensated absences (4,414) (12,142)
The change in net assets of the Internal Service Funds represent an undercharge to the
governmental funds served and, therefore, increases expenses in the Statement of
Activities. 83,770
Change in net assets of governmental activities (Exhibit B) 9,678,840$
See notes to basic financial statements.
34

Exhibit G
June 30, 2008
Business Type Governmental
Activities Activities
Non-major
Enterprise Internal Service
Funds Fund
Assets
Current assets:
Cash and cash equivalents 1,161,763$ 112,983
Receivables:
Accounts 9,243 25,191
Inventories 46,655 -
Total current assets 1,217,661 138,174
Non-current assets:
Capital assets:
Equipment 1,803,298 -
Accumulated depreciation (729,881) -
Total noncurrent assets 1,073,417 -
Total assets 2,291,078 138,174
Liabilities
Current liabilities:
Accounts payable 14,213 -
Salaries and benefits payable 14,271 -
Deferred revenue 38,050 -
Total current liabilities 66,534 -
Net Assets
Invested in capital assets 1,073,417 -
Unrestricted 1,151,127 138,174 Total net assets 2,224,544$ 138,174
See notes to basic financial statements.
WAUKEE COMMUNITY SCHOOL DISTRICT
STATEMENT OF NET ASSETS
PROPRIETARY FUNDS
35

Exhibit H
WAUKEE COMMUNITY SCHOOL DISTRICTSTATEMENT OF REVENUES, EXPENSES AND CHANGES IN NET ASSETS
PROPRIETARY FUNDSYear ended June 30, 2008
Business Type GovernmentalActivities Activities
Non-majorEnterprise Internal Service
Funds FundOperating revenue:
Local sources:Charges for services 2,608,137$ 553,296
Operating expenses:Instructional programs:
Regular instruction 11,932 - Support services:
Administration services 348,150 - Operation and maintenance of plant services 4,620 - Transportation services 6,558 -
359,328 - Non-instructional programs:
Food service operations:Depreciation 143,628 - Other 1,989,923 -
2,133,551 - Other enterprise operations:
Depreciation 1,153 - Other 505,372 470,444
506,525 470,444 2,640,076 470,444
Total operating expenses 3,011,336 470,444
Operating income (loss) (403,199) 82,852
Non-operating revenues:Interest on investments 40,396 918 Contributions 28 State sources 22,964 - Federal sources 481,376 -
Total non-operating revenues 544,764 918
Net income before capital contributions 141,565 83,770
Capital contributions 621,256 -
Change in net assets 762,821 83,770
Net assets beginning of year 1,461,723 54,404
Net assets end of year 2,224,544$ 138,174
See notes to basic financial statements.
36

Exhibit I
WAUKEE COMMUNITY SCHOOL DISTRICT
STATEMENT OF CASH FLOWS
PROPRIETARY FUNDS
Year ended June 30, 2008
Business Type Governmental
Activities Activities
Non-major
Enterprise Internal Service
Funds Fund
Cash flows from operating activities:
Cash received from sale of lunches and breakfasts 1,920,073$ -
Cash received from miscellaneous operating activities 693,721 528,105
Cash payments to employees for services (1,592,855) (482,139)
Cash payments to suppliers for goods or services (1,172,533) -
Net cash used by operating activities (151,594) 45,966
Cash flows from non-capital financing activities:
Contributions - noncapital 28 -
State grants received 22,964 -
Federal grants received 376,962 -
Net cash provided by non-capital financing activities 399,954 -
Cash flows from capital and related financing activities:
Capital contributions 621,256 -
Acquisition of capital assets (705,313) -
Net cash used in capital and related financing activities (84,057) -
Cash flows from investing activities:
Interest on investments 40,396 918
Net increase in cash and cash equivalents 204,699 46,884
Cash and cash equivalents at beginning of year 957,064 66,099
Cash and cash equivalents at end of year 1,161,763$ 112,983
Reconciliation of operating income (loss) to net cash used by
operating activities:
Operating income (loss) (403,199)$ 13,698
Adjustments to reconcile operating income (loss) to
net cash used by operating activities:
Commodities used 104,414 -
Depreciation 144,781 -
Decrease (Increase) in accounts receivable (683) 35
(Increase) in inventories (8,981) -
Increase (decrease) in accounts payable 5,862 (14,146)
(Decrease) in salaries and benefits payable (128) -
Increase in deferred revenue 6,340 - Net cash used by operating activities (151,594)$ (413)
Reconciliation of cash and cash equivalents at year end to
specific assets included on Combined Balance Sheet:
Current assets:
Cash and investments 1,161,763$ 112,983 Cash and cash equivalents at year end 1,161,763$ 112,983
Non-cash investing, capital and financing activities:
During the year ended June 30, 2008, the District received federal commodities valued at $104,414.
See notes to basic financial statements.
37

Exhibit J
WAUKEE COMMUNITY SCHOOL DISTRICT
STATEMENT OF FIDUCIARY NET ASSETS
FIDUCIARY FUNDS
June 30, 2008
Private Purpose
Trust
Scholarship Agency
Assets
Cash and pooled investments 229,604$ 9,675
Total assets 229,604 9,675
Liabilities:
Accounts payable - 10
Other payables - 9,665
Total liabilities - 9,675
Net assets
Assets held in trust for scholarships 229,604 -
Total net assets 229,604$ -
See notes to financial statements.
38
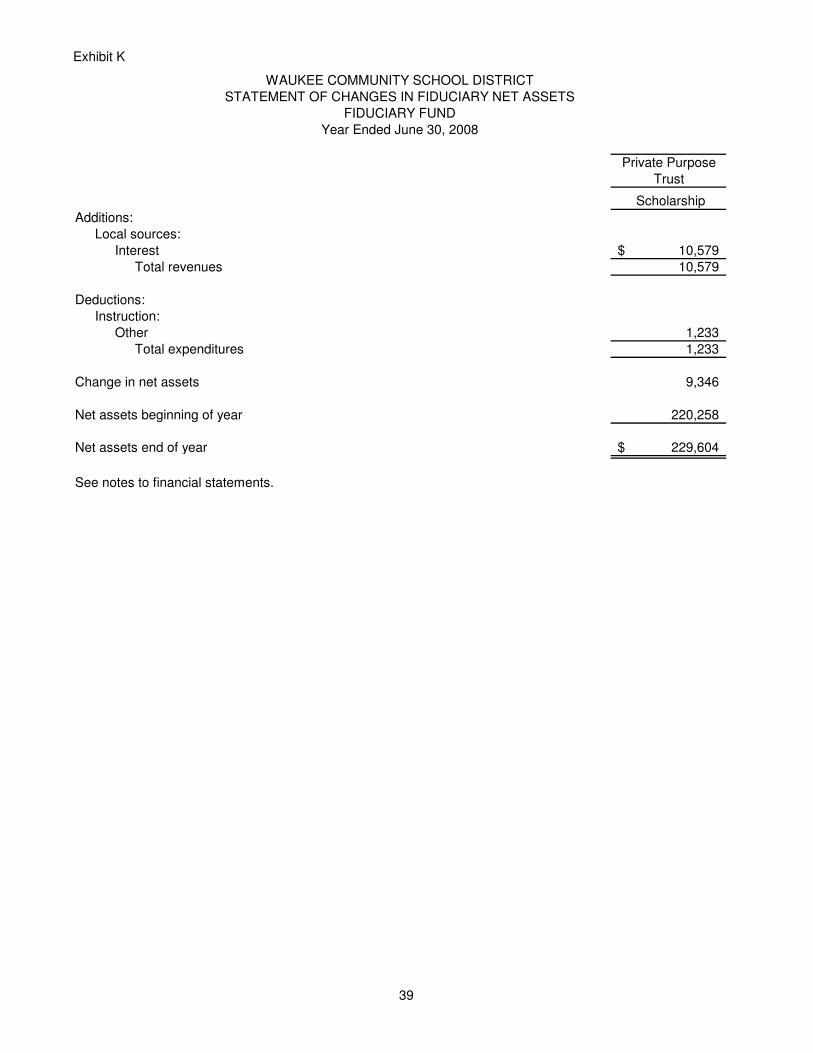
Exhibit K
WAUKEE COMMUNITY SCHOOL DISTRICT
STATEMENT OF CHANGES IN FIDUCIARY NET ASSETS
FIDUCIARY FUND
Year Ended June 30, 2008
Private Purpose
Trust
Scholarship
Additions:
Local sources:
Interest 10,579$
Total revenues 10,579
Deductions:
Instruction:
Other 1,233
Total expenditures 1,233
Change in net assets 9,346
Net assets beginning of year 220,258
Net assets end of year 229,604$
See notes to financial statements.
39

WAUKEE COMMUNITY SCHOOL DISTRICT
NOTES TO FINANCIAL STATEMENTS Year Ended June 30, 2008
40
(1) Summary of Significant Accounting Policies
The Waukee Community School District is a political subdivision of the State of Iowa and operates public schools for children in grades kindergarten through twelve and special education pre-kindergarten. Additionally, the District either operates or sponsors various adult education programs. These courses include remedial education as well as vocational and recreational courses. The geographic area served includes the city of Waukee, Iowa; portions of the cities of West Des Moines, Clive and Urbandale, and the agricultural territory in Dallas County. The District is governed by a Board of Education whose members are elected on a non-partisan basis.
The District’s financial statements are prepared in conformity with U.S. generally accepted accounting principles as prescribed by the Governmental Accounting Standards Board.
A. Reporting Entity
For financial reporting purposes, Waukee Community School District has included all funds, organizations, agencies, boards, commissions and authorities. The District has also considered all potential component units for which it is financially accountable, and other organizations for which the nature and significance of their relationship with the District are such that exclusion would cause the District's financial statements to be misleading or incomplete. The Governmental Accounting Standards Board has set forth criteria to be considered in determining financial accountability. These criteria include appointing a voting majority of an organization's governing body, and (1) the ability of the District to impose its will on that organization or (2) the potential for the organization to provide specific benefits to, or impose specific financial burdens on the District. Waukee Community School District has no component units which meet the Governmental Accounting Standards Board criteria. Jointly Governed Organization – The District participates in a jointly governed organization that provides services to the District but does not meet the criteria of a joint venture since there is no ongoing financial interest or responsibility by the participating governments. The District is a member of the Dallas County Assessor’s Conference Board.
B. Basis of Presentation
Government-wide Financial Statements - The Statement of Net Assets and the Statement of Activities report information on all of the non-fiduciary activities of the District. For the most part, the effect of interfund activity has been removed from these statements. Interfund services provided and used are not eliminated in the process of consolidation. Governmental activities, which normally are supported by tax and intergovernmental revenues, are reported separately from business type activities, which rely to a significant extent on fees and charges for service.
The Statement of Net Assets presents the District’s non-fiduciary assets and liabilities, with the difference reported as net assets. Net assets are reported in three categories:
Invested in capital assets, net of related debt consists of capital assets, net of accumulated depreciation and reduced by outstanding balances for bonds, notes, and other debt that are attributed to the acquisition, construction, or improvement of those assets.
Restricted net assets result when constraints placed on net asset use are either externally imposed or imposed by law through constitutional provisions or enabling legislation.
Unrestricted net assets consist of net assets that do not meet the definition of the two preceding categories. Unrestricted net assets often have constraints on resources that are imposed by management, but can be removed or modified.

WAUKEE COMMUNITY SCHOOL DISTRICT
NOTES TO FINANCIAL STATEMENTS Year Ended June 30, 2008
41
(1) Summary of Significant Accounting Policies (continued from previous page) B. Basis of Presentation (continued from previous page)
The Statement of Activities demonstrates the degree to which the direct expenses of a given function or segment are offset by program revenues. Direct expenses are those that are clearly identifiable with a specific function. Program revenues include 1) charges to customers or applicants who purchase, use, or directly benefit from goods, services, or privileges provided by a given function and 2) grants, contributions and interest that are restricted to meeting the operational or capital requirements of a particular function. Property tax and other items not properly included among program revenues are reported instead as general revenues.
Fund Financial Statements - Separate financial statements are provided for governmental, proprietary, and fiduciary funds, even though the latter are excluded from the government-wide financial statements. Major individual governmental funds are reported as separate columns in the fund financial statements. All remaining governmental funds are aggregated and reported as other non-major governmental funds.
Fund accounting - The accounts of the District are organized on the basis of funds, each of which is considered to be a separate accounting entity. The operations of each fund are accounted for by providing a separate set of self-balancing accounts which comprise its assets, liabilities, reserves, fund balance/net assets, revenues and expenditures or expenses, as appropriate. The District has the following funds:
Governmental Fund Types: Governmental fund types are those funds through which most governmental functions typically are financed. Governmental fund reporting focuses on the sources, uses and balances of current financial resources. Expendable assets are assigned to the various governmental funds according to the purposes for which they may or must be used. Current liabilities are assigned to the fund from which they will be paid. The difference between governmental fund assets and liabilities is reported as fund balance. The following are the District’s major governmental funds:
General Fund: The General Fund accounts for all sources used to finance District operation and maintenance, except those required to be accounted for in another fund. Debt Service Fund: The Debt Service Fund is utilized to account for the payment of interest and principal on the District’s general long-term debt. Capital Projects Fund: The Capital Projects Fund is used to account for all resources used in the acquisition and construction of capital facilities.
The other governmental funds of the District are considered non-major and are as follows:
Special Revenue Funds: The Special Revenue Funds account for the revenue sources that are legally restricted to expenditures for specific purposes. These funds consist of the following:
Student Activity Funds: This fund accounts for transactions that occur due to student-related activities from groups and organizations such as athletic and activity events, fundraising and other extra-curricular or co-curricular activities. Management Fund: This fund is authorized by Iowa Code Section 298.4 and accounts for transactions related to unemployment, early retirement, judgments and settlements and the cost of liability insurance as it relates to property and casualty.

WAUKEE COMMUNITY SCHOOL DISTRICT
NOTES TO FINANCIAL STATEMENTS Year Ended June 30, 2008
42
(1) Summary of Significant Accounting Policies (continued from previous page) B. Basis of Presentation (continued from previous page)
Special Revenue Funds (continued from previous page) Physical Plant and Equipment Levy (PPEL) Fund: This fund is authorized by Iowa Code 298.2 and accounts for transactions related to the improvement of facilities and grounds, construction of school houses, certain equipment expenditures and other expenditures authorized in Iowa Code 298.3.
Proprietary Fund Types: Proprietary fund types are used to account for the District’s ongoing organizations and activities which are similar to those often found in the private sector. The measurement focus is upon income determination, financial position and cash flows. The following are the District’s proprietary funds:
Enterprise Funds: Enterprise funds are used to account for those operations that are financed and operated in a manner similar to private business or where the District has decided that the determination of revenues earned, costs incurred and/or net income is necessary for management accountability. In accordance with Governmental Accounting Standards Board (GASB) Statement No. 20, Accounting and Financial Reporting for Proprietary Funds and Other Governmental Entities that Use Proprietary Fund Accounting, the District has elected to apply all applicable Financial Accounting Standards Board (FASB) pronouncements, issued on or before November 30, 1989, except for those pronouncements which conflict with or contradict GASB pronouncements. The following enterprise funds of the District are considered non-major:
School Nutrition Fund: This fund accounts for transactions related to the school lunch, breakfast and summer food programs authorized by Iowa Code 283A. Daycare Fund: This fund accounts for transactions for before and after school child care and summer child care programs authorized by Iowa Code 298A.12 and 279.49.
The following enterprise funds of the District are considered major:
Internal Service Funds: This includes the Flexible Benefits Fund and the Self-Funded Dental Plan Fund which are used to account for the flexible benefits program and the dental insurance plan offered by the District.
Fiduciary Fund Types: Fiduciary funds account for assets held by the District in a trustee or agency capacity for the benefit of others and cannot be used to support District activities. The District has the following fiduciary fund type:
Private Purpose Trust Fund: This fund accounts for assets held by the District under trust agreements with restrictions of income earned to be used to benefit individuals through scholarship awards. Agency Fund: This fund accounts for assets held by the District as an agent for individuals, private organizations and other governments. The Agency Fund is custodial in nature, assets equal liabilities, and does not involve measurement of results of operations.

WAUKEE COMMUNITY SCHOOL DISTRICT
NOTES TO FINANCIAL STATEMENTS Year Ended June 30, 2008
43
(1) Summary of Significant Accounting Policies (continued from previous page) C. Measurement Focus and Basis of Accounting
The government-wide, proprietary and fiduciary fund financial statements are reported using the economic resources measurement focus and the accrual basis of accounting. Revenues are recorded when earned and expenses are recorded when a liability is incurred, regardless of the timing of related cash flows. Property tax is recognized as revenue in the year for which it is levied. Grants and similar items are recognized as revenue as soon as all eligibility requirements imposed by the provider have been satisfied.
Governmental fund financial statements are reported using the current financial resources measurement focus and the modified accrual basis of accounting. Revenues are recognized as soon as they are both measurable and available. Revenues are considered to be available when they are collectible within the current period or soon enough thereafter to pay liabilities of the current period. For this purpose, the government considers revenues to be available if they are collected within 60 days after year end.
Property tax, intergovernmental revenues (shared revenues, grants and reimbursements from other governments) and interest associated with the current fiscal period are all considered to be susceptible to accrual. All other revenue items are considered to be measurable and available only when cash is received by the District.
Expenditures generally are recorded when a liability is incurred, as under accrual accounting. However, principal and interest on long-term debt, claims and judgments, and compensated absences are recognized as expenditures only when payment is due. Capital asset acquisitions are reported as expenditures in governmental funds. Proceeds of general long-term debt and acquisitions under capital leases are reported as other financing sources.
Under terms of grant agreements, the District funds certain programs by a combination of specific cost-reimbursement grants and general revenues. Thus, when program expenses are incurred, there are both restricted and unrestricted net assets available to finance the program. It is the District’s policy to first apply cost-reimbursement grant resources to such programs, and then general revenues.
All proprietary funds of the District apply all applicable GASB pronouncements as well as the following pronouncements issued on or before November 30, 1989, unless these pronouncements conflict with or contradict GASB pronouncements: Financial Accounting Standards Board Statements and Interpretations, Accounting Principles Board Opinions, and Accounting Research Bulletins of the Committee on Accounting Procedure.
Proprietary funds distinguish operating revenues and expenses from non-operating items. Operating revenues and expenses generally result from providing services and producing and delivering goods in connection with a proprietary fund’s principal ongoing operations. The principal operating revenues of the District’s Enterprise Funds are charges to customers for sales and services. Operating expenses for enterprise funds include the cost of sales and services, administrative expenses, and depreciation on capital assets. All revenues and expenses not meeting this definition are reported as non-operating revenues and expenses.
The District maintains its financial records on the cash basis. The financial statements of the District are prepared by making memorandum adjusting entries to the cash basis financial records.

WAUKEE COMMUNITY SCHOOL DISTRICT
NOTES TO FINANCIAL STATEMENTS Year Ended June 30, 2008
44
(1) Summary of Significant Accounting Policies (continued from previous page) D. Assets, Liabilities and Fund Equity
The following accounting policies are followed in preparing the financial statements:
Cash, Pooled Investments and Cash Equivalents – The cash balances of most District funds are pooled and invested. Investments are stated at fair value except for the investments in the Iowa Schools Joint Investment Trust and IPAS Education, which are valued at amortized cost, and non-negotiable certificates of deposit, which are stated at cost. For purposes of the statement of cash flows, all short-term cash investments that are highly liquid are considered to be cash equivalents. Cash equivalents are readily convertible to known amounts of cash, and at the day of purchase, have a maturity date no longer than three months. Property Tax Receivable – Property tax in the governmental funds are accounted for using the modified accrual basis of accounting.
Property tax receivable is recognized in these funds on the levy or lien date, which is the date that the tax asking is certified by the Board of Education. Delinquent property tax receivable represents unpaid taxes for the current and prior years. The succeeding year property tax receivable represents taxes certified by the Board of Education to be collected in the next fiscal year for the purposes set out in the budget for the next fiscal year. By statute, the District is required to certify its budget in April of each year for the subsequent fiscal year. However, by statute, the tax asking and budget certification for the following fiscal year becomes effective on the first day of that year. Although the succeeding year property tax receivable has been recorded, the related revenue is deferred in both the Government-wide and fund financial statements and will not be recognized as revenue until the year for which it is levied.
Property tax revenue recognized in these funds become due and collectible in September and March of the fiscal year with a 1½% per month penalty for delinquent payments; is based on January 1, 2006 assessed property valuations; is for the tax accrual period July 1, 2007 through June 30, 2008 and reflects the tax asking contained in the budget certified to the County Board of Supervisors in April, 2007. Interfund Receivables and Payables – During the course of its operations, the District may have certain transactions between funds or pooled cash balances. At June 30, 2008 there were no interfund receivable or payable amounts to report.
Due from Other Governments – Due from other governments represents amounts due from the State of Iowa, various shared revenues, grants and reimbursements from other governments.
Inventories – Inventories are valued at cost using the first-in, first-out method for purchased items and government commodities. Inventories of proprietary funds are recorded as expenses when consumed rather than when purchased or received.
Capital Assets – Capital assets, which include property, furniture, and equipment, are reported in the
applicable governmental or business type activities columns in the government-wide Statement of Net Assets. Capital assets are recorded at historical cost. Donated capital assets are recorded at estimated fair market value at the date of donation. The costs of normal maintenance and repairs that do not add to the value of the asset or materially extend asset lives are not capitalized. Capital assets are defined by the District as assets with an initial, individual cost in excess of the following thresholds and estimated useful lives in excess of two years.

WAUKEE COMMUNITY SCHOOL DISTRICT
NOTES TO FINANCIAL STATEMENTS Year Ended June 30, 2008
45
(1) Summary of Significant Accounting Policies (continued from previous page) Capital Assets (continued from previous page) Asset Class Amount Land $ 2,500 Buildings 2,500 Improvements other than buildings 2,500 Furniture and equipment: School Nutrition Fund equipment 500 Other furniture and equipment 2,500 Capital assets (with the exception of land and construction in progress, which are not depreciated) are
depreciated using the straight line method over the following estimated useful lives: Estimated Useful Lives Asset Class (In Years) Buildings 50 years Improvements other than buildings 20 years Furniture and equipment 5-20 years
Salaries and Benefits Payable - Payroll and related expenditures for teachers with annual contracts corresponding to the current school year, which are payable in July and August, have been accrued as liabilities.
Deferred and Unearned Revenue - Although certain revenues are measurable, they are not available. Available means collected within the current period or expected to be collected soon enough thereafter to be used to pay liabilities of the current period. Deferred revenue in the governmental fund financial statements represent the amount of assets that have been recognized, but the related revenue has not been recognized since the assets are not collected within the current period or expected to be collected soon enough thereafter to be used to pay liabilities of the current period. Deferred revenue consists of the succeeding year’s property tax receivable. Unearned revenue on the Statement of Net Assets consists of the succeeding year’s property tax receivable that will not be recognized as revenue until the year for which it is levied and other unearned proceeds. Compensated Absences – District employees accumulate a limited amount of earned but unused vacation for subsequent use or for payment upon termination, death or retirement. A liability is recorded when incurred in the government-wide financial statements. A liability for these amounts is reported in governmental fund financial statements only for employees that have resigned or retired. The compensated absences liability has been computed based on rates of pay in effect at June 30, 2008. The compensated absences liability attributable to the governmental activities will be paid primarily by the General Fund.
Long-term Liabilities – In the government-wide financial statements, long-term debt and other long-term obligations are reported as liabilities in the governmental activities column in the Statement of Net Assets.

WAUKEE COMMUNITY SCHOOL DISTRICT
NOTES TO FINANCIAL STATEMENTS Year Ended June 30, 2008
46
(1) Summary of Significant Accounting Policies (continued from previous page) D. Assets, Liabilities and Fund Equity (continued from previous page)
Fund Equity – In the governmental fund financial statements, reservations of fund balance are reported for
amounts not available for appropriation or legally restricted by outside parties for use for a specific purpose. Designations of fund balance represent tentative plans for future use of financial resources that are subject to change.
Restricted Net Assets – In the government-wide Statement of Net Assets, net assets are reported as restricted when constraints placed on net asset use are either externally imposed by creditors, grantors, contributors or laws and regulations of other governments or imposed by law through constitutional provisions or enabling legislation.
E. Budgets and Budgetary Accounting
As allowed by GASB Statement No. 41, Budgetary Comparison Schedules - Perspective Differences, the District presents budgetary comparison schedules as required supplementary information based on the program structure of four functional areas as required by state statute for its legally adopted budget. During the year ended June 30, 2008, expenditures in the instruction functional area exceeded the amount budgeted.
(2) Cash and Pooled Investments
As of June 30, 2008, the carrying amount of the District’s bank deposits and pooled investments totaled $35,674,205 with actual bank balances of $1,260,283 and investment balances of $34,413,922. Of the bank balances, $300,000 was covered by federal depository insurance and $960,283 was collateralized by the State Sinking Fund in accordance with Chapter 12C of the Code of Iowa. This chapter provides for additional assessments against the depositories to insure there will be no loss of public funds.
The District is authorized by statute to invest public funds in obligations of the United States government, its agencies and instrumentalities; certificates of deposit or other evidences of deposit at federally insured depository institutions approved by the Board of Education; prime eligible bankers acceptances; certain high rated commercial paper; perfected repurchase agreements; certain registered open-end management investment companies; certain joint investment trusts; and warrants or improvement certificates of a drainage district. At June 30, 2008, the District had investments in the following:
Type
Amortized
Cost/Fair Value
Iowa Schools Joint Investment Trust - Diversified Portfolio 1,277,810$
IPASeducation 29,462,456 Money Market Mutual Fund 3,473,656
Negotiable Certificates of Deposit 200,000 34,413,922$

WAUKEE COMMUNITY SCHOOL DISTRICT
NOTES TO FINANCIAL STATEMENTS Year Ended June 30, 2008
47
(2) Cash and Pooled Investments (continued from previous page)
The investments in the Iowa Schools Joint Investment Trust and IPASeducation are valued at an amortized cost pursuant to Rule 2a-7 under the Investment Company Act of 1940. The negotiable certificates of deposit and money market mutual fund are stated at fair value.
Credit risk. The investments in the Iowa Schools Joint Investment Trust were rated Aaa by Moody’s Investors Service. The investments in IPASeducation and the money market mutual fund are unrated.
(3) Interfund Transfers
The detail of interfund transfers for the year ended June 30, 2008 is as follows:
Transfers generally move revenues from the fund statutorily required to collect the resources to the fund statutorily required to expend the resources
Transfer to Transfer from Amount
Debt Service Fund Physical Plant and Equipment Levy 1,848,769$
Debt Service Fund Capital Projects Fund 3,478,313 5,327,082$

WAUKEE COMMUNITY SCHOOL DISTRICT
NOTES TO FINANCIAL STATEMENTS Year Ended June 30, 2008
48
(4) Capital Assets
Capital assets activity for the year ended June 30, 2008 is as follows:
Balance Balance
Beginning End of
of Year Additions Reductions YearGovernmental activities:
Capital assets not being depreciated:
Land 4,939,976$ - 4,939,976 Construction in progress 21,240,044 13,080,340 29,040,380 5,280,004
Total capital assets not being depreciated 26,180,020 13,080,340 29,040,380 10,219,980
Capital assets being depreciated:
Buildings 66,073,226 28,419,124 - 94,492,350
Improvements other than buildings 3,656,562 - - 3,656,562 Furniture and equipment 2,324,453 750,867 - 3,075,320
Total capital assets being depreciated 72,054,241 29,169,991 - 101,224,232
Less accumulated depreciation for:
Buildings 9,661,324 1,599,751 - 11,261,075
Improvements other than buildings 1,381,418 153,347 - 1,534,765
Furniture and equipment 975,693 336,906 - 1,312,599 Total accumulated depreciation 12,018,435 2,090,004 - 14,108,439
Total capital assets being depreciated, net 60,035,806 27,079,987 - 87,115,793
Governmental activities capital assets, net 86,215,826$ 40,160,327 29,040,380 97,335,773
Business type activities:
Furniture and equipment 1,097,985$ 705,313 - 1,803,298
Less accumulated depreciation 585,100 144,781 - 729,881 Business-type activities capital assets, net 512,885$ 560,532 - 1,073,417
Depreciation expense was charged by the District as follows: Governmental activities:
Instruction:
Regular 1,849,654$ Special ed 1,045$
Other 1,045
Support services: Student services 209
Instructional staff services 19,228
Administration 52,250
Operation and maintenance of plant 37,620 Transportation 627
1,961,678
Unallocated 128,326 Total depreciation expense - governmental activities 2,090,004$
Business type activities: Food services 143,628$
Community Daycare 1,153 144,781$

WAUKEE COMMUNITY SCHOOL DISTRICT
NOTES TO FINANCIAL STATEMENTS Year Ended June 30, 2008
49
(5) Long-Term Liabilities
Changes in long-term liabilities for the year ended June 30, 2008 are summarized as follows:
Capital Loan Notes Payable Details of the District’s June 30, 2008 capital loan note indebtedness are as follows:
Revenue Bonds Details of the District's June 30, 2008 School Infrastructure Local Option Sales and Services Tax Revenue Bond indebtedness is as follows:
The local option sales and services tax revenue bonds were issued for the purpose of defraying a portion of the cost of school infrastructure. The bonds are payable solely from the proceeds of the local option sales and services tax revenues received by the District. The bonds are not a general obligation of the District. However, the debt is subject to the constitutional debt limitation of the District.
Capital Loan Note of February 1, 2006Year ended June 30, Rates Principal Interest Total
2009 3.50% 1,380,000$ 471,819 1,851,819
2010 3.50% 1,430,000 423,519 1,853,519
2011 3.50% 1,480,000 373,469 1,853,469
2012 3.625% 1,535,000 321,669 1,856,669
2013 3.750% 1,590,000 266,025 1,856,025
2014 4.000% 1,655,000 206,400 1,861,400
2015 4.000% 1,720,000 140,200 1,860,200
2016 4.000% 1,785,000 71,400 1,856,400 Total 12,575,000$ 2,274,501 14,849,501
LOSST Revenue Bond of January 1, 2007Year ended June 30, Rates Principal Interest Total
2009 4.00% 2,475,000$ 690,812 3,165,812
2010 4.25% 2,570,000 591,812 3,161,812 2011 4.25% 2,675,000 482,588 3,157,588
2012 4.250% 2,780,000 368,900 3,148,900
2013 4.250% 2,890,000 250,750 3,140,750
2014 4.250% 3,010,000 127,926 3,137,926 Total 16,400,000$ 2,512,788 18,912,788
Balance Balance Due
Beginning End of Within
of Year Additions Reductions Year One Year
Capital loan notes 13,905,000$ - 1,330,000 12,575,000 1,380,000
Revenue bonds 18,900,000 - 2,500,000 16,400,000 2,475,000
General obligation bonds 52,590,000 17,165,000 9,385,000 60,370,000 4,990,000
Early retirement 619,543 194,597 186,869 627,271 114,788
Compensated absences 140,402 4,414 - 144,816 144,816 86,154,945$ 17,364,011 13,401,869 90,117,087 9,104,604

WAUKEE COMMUNITY SCHOOL DISTRICT
NOTES TO FINANCIAL STATEMENTS Year Ended June 30, 2008
50
(5) Long-Term Liabilities (continued from previous page) The resolution providing for the issuance of the local option sales and services tax revenue bonds includes the following provisions: a) $1,890,000 of the proceeds from the issuance of the revenue bonds shall be deposited to a Reserve Account
to be used solely for the purpose of paying principal and interest on the bonds if insufficient money is available in the Sinking Account. The balance of the proceeds shall be deposited to the Project Account.
b) All proceeds from the local option sales and services tax shall be placed in a Revenue Account. c) Monies in the Revenue Account shall be disbursed to make deposits into a Sinking Account to pay the
principal and interest requirements of the revenue bonds for the fiscal year. d) Any monies remaining in the Revenue Account after the required transfer to the Sinking Account may be
transferred to the Project Account to be used for any lawful purpose. The District complied with all of the revenue bond provisions during the year ended June 30, 2008.
Bonds Payable Details of the District’s June 30, 2008 general obligation bonded indebtedness are as follows: (5) Long-Term Liabilities (continued from previous page)
March 1, 2001 IssueYear ended June 30, Rates Principal Interest Total
2009 4.30% 125,000$ 121,880 246,880
2010 4.40% 130,000 116,505 246,505
2011 4.50% 135,000 110,785 245,785
2012 4.60% 140,000 104,710 244,710 2013 4.70% 145,000 98,270 243,270
2014 4.80% 150,000 91,455 241,455
2015 4.85% 155,000 84,255 239,255
2016 4.90% 160,000 76,738 236,738 2017 4.95% 205,000 68,898 273,898
2018 5.00% 215,000 58,750 273,750
2019 5.00% 415,000 48,000 463,000
2020 5.00% 545,000 27,250 572,250 Subtotal 2,520,000 1,007,496 3,527,496

WAUKEE COMMUNITY SCHOOL DISTRICT
NOTES TO FINANCIAL STATEMENTS Year Ended June 30, 2008
51
(5) Long-Term Liabilities (continued from previous page)
Bonds Payable (continued from previous page)
April 1, 2002 IssueYear ended June 30, Rates Principal Interest Total
2009 4.000% 195,000$ 262,421 457,421
2010 4.000% 200,000 254,621 454,621 2011 4.050% 210,000 246,621 456,621
2012 4.150% 220,000 238,116 458,116 2013 4.250% 230,000 228,986 458,986 2014 4.300% 240,000 219,211 459,211
2015 4.400% 250,000 208,892 458,892 2016 4.500% 260,000 197,891 457,891
2017 4.600% 435,000 186,191 621,191 2018 4.625% 515,000 166,181 681,181
2019 4.700% 750,000 142,363 892,363 2020 4.750% 1,050,000 107,113 1,157,113
2021 4.750% 1,205,000 57,238 1,262,238 Subtotal 5,760,000 2,515,845 8,275,845
November 15, 2002 IssueYear ended June 30, Rates Principal Interest Total
2009 3.000% 595,000$ 134,825 729,825
2010 3.250% 640,000 116,975 756,975 2011 3.300% 640,000 96,175 736,175
2012 3.400% 680,000 75,055 755,055 2013 3.600% 100,000 51,935 151,935
2014 3.800% 105,000 48,335 153,335 2015 4.000% 110,000 44,345 154,345
2016 4.000% 115,000 39,945 154,945 2017 4.100% 120,000 35,345 155,345
2018 4.200% 125,000 30,425 155,425 2019 4.300% 130,000 25,175 155,175
2020 4.400% 140,000 19,585 159,585 2021 4.500% 145,000 13,425 158,425 2022 4.600% 150,000 6,900 156,900
Subtotal 3,795,000 738,445 4,533,445
June 1, 2003 IssueYear ended June 30, Rates Principal Interest Total
2009 2.750% 105,000$ 321,945 426,945
2010 3.000% 110,000 319,058 429,058 2011 3.000% 110,000 315,758 425,758
2012 3.100% 120,000 312,458 432,458 2013 3.250% 100,000 308,738 408,738
2014 3.350% 100,000 305,488 405,488 2015 3.450% 100,000 302,138 402,138
2016 3.550% 105,000 298,688 403,688 2017 3.650% 105,000 294,960 399,960
2018 3.750% 110,000 291,128 401,128 2019 3.850% 205,000 287,003 492,003
2020 3.900% 1,200,000 279,110 1,479,110 2021 4.000% 1,730,000 232,310 1,962,310
2022 4.000% 1,915,000 163,110 2,078,110 2023 4.100% 2,110,000 86,510 2,196,510
Subtotal 8,225,000 4,118,402 12,343,402
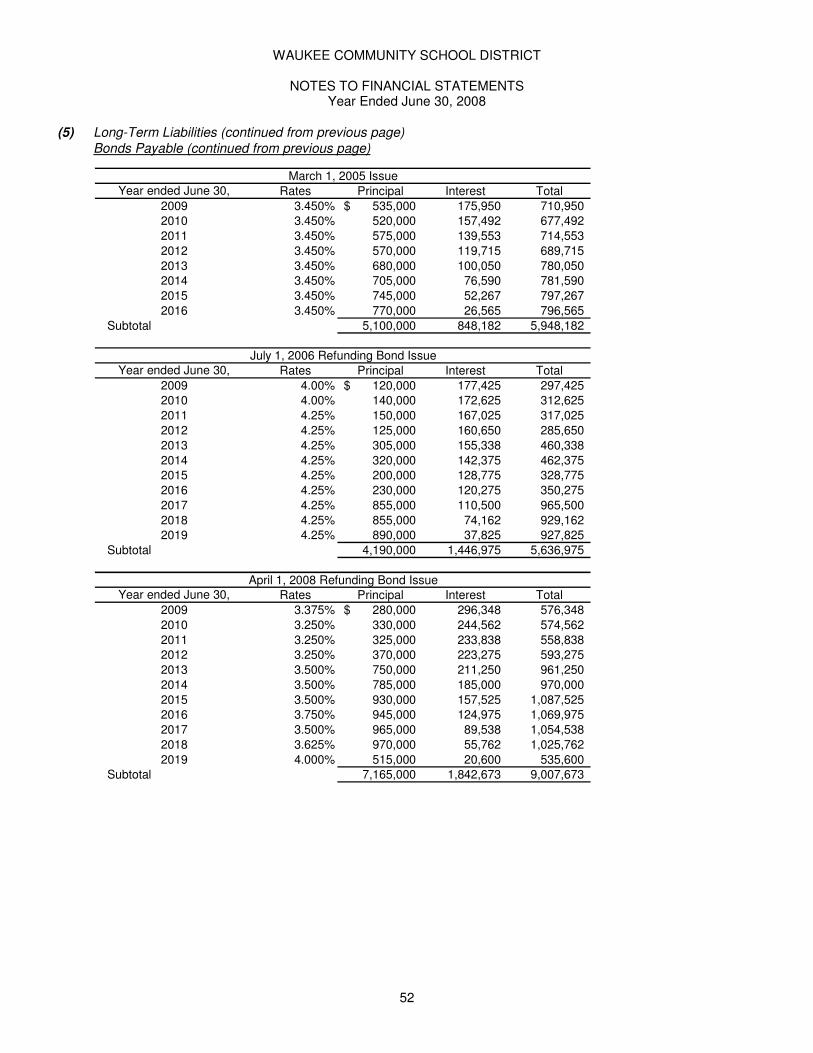
WAUKEE COMMUNITY SCHOOL DISTRICT
NOTES TO FINANCIAL STATEMENTS Year Ended June 30, 2008
52
(5) Long-Term Liabilities (continued from previous page)
Bonds Payable (continued from previous page)
March 1, 2005 IssueYear ended June 30, Rates Principal Interest Total
2009 3.450% 535,000$ 175,950 710,950 2010 3.450% 520,000 157,492 677,492
2011 3.450% 575,000 139,553 714,553
2012 3.450% 570,000 119,715 689,715
2013 3.450% 680,000 100,050 780,050 2014 3.450% 705,000 76,590 781,590
2015 3.450% 745,000 52,267 797,267
2016 3.450% 770,000 26,565 796,565
Subtotal 5,100,000 848,182 5,948,182
July 1, 2006 Refunding Bond IssueYear ended June 30, Rates Principal Interest Total
2009 4.00% 120,000$ 177,425 297,425 2010 4.00% 140,000 172,625 312,625
2011 4.25% 150,000 167,025 317,025
2012 4.25% 125,000 160,650 285,650
2013 4.25% 305,000 155,338 460,338
2014 4.25% 320,000 142,375 462,375 2015 4.25% 200,000 128,775 328,775
2016 4.25% 230,000 120,275 350,275
2017 4.25% 855,000 110,500 965,500
2018 4.25% 855,000 74,162 929,162 2019 4.25% 890,000 37,825 927,825
Subtotal 4,190,000 1,446,975 5,636,975
April 1, 2008 Refunding Bond IssueYear ended June 30, Rates Principal Interest Total
2009 3.375% 280,000$ 296,348 576,348
2010 3.250% 330,000 244,562 574,562
2011 3.250% 325,000 233,838 558,838 2012 3.250% 370,000 223,275 593,275
2013 3.500% 750,000 211,250 961,250
2014 3.500% 785,000 185,000 970,000
2015 3.500% 930,000 157,525 1,087,525 2016 3.750% 945,000 124,975 1,069,975
2017 3.500% 965,000 89,538 1,054,538
2018 3.625% 970,000 55,762 1,025,762
2019 4.000% 515,000 20,600 535,600 Subtotal 7,165,000 1,842,673 9,007,673

WAUKEE COMMUNITY SCHOOL DISTRICT
NOTES TO FINANCIAL STATEMENTS Year Ended June 30, 2008
53
(5) Long-Term Liabilities (continued from previous page)
Bonds Payable (continued from previous page)
April 1, 2008 IssueYear ended June 30, Rates Principal Interest Total
2009 4.500% 2,700,000$ 450,000 3,150,000
2010 4.500% 250,000 328,500 578,500
2011 4.500% 265,000 317,250 582,250
2012 4.500% 275,000 305,326 580,326
2013 4.500% 285,000 292,950 577,950
2014 4.500% 300,000 280,126 580,126
2015 4.500% 315,000 266,626 581,626
2016 4.500% 325,000 252,450 577,450
2017 4.500% 340,000 237,826 577,826
2018 4.500% 355,000 222,526 577,526
2019 4.500% 375,000 206,550 581,550
2020 4.500% 390,000 189,676 579,676
2021 4.500% 410,000 172,126 582,126
2022 4.500% 425,000 153,676 578,676
2023 4.500% 445,000 134,550 579,550
2024 4.500% 465,000 114,526 579,526
2025 4.500% 485,000 93,600 578,600
2026 4.500% 510,000 71,776 581,776
2027 4.500% 530,000 48,826 578,826
2028 4.500% 555,000 24,976 579,976
Subtotal 10,000,000$ 4,163,862 14,163,862
TotalsYear ended June 30, Principal Interest Total
2009 4,990,000$ 2,505,519$ 7,495,519
2010 2,660,000 2,262,213 4,922,213
2011 2,745,000 2,165,855 4,910,855
2012 2,905,000 2,066,993 4,971,993
2013 2,995,000 1,961,554 4,956,554
2014 3,110,000 1,848,718 4,958,718
2015 3,215,000 1,730,560 4,945,560
2016 3,325,000 1,608,585 4,933,585
2017 3,460,000 1,479,030 4,939,030
2018 3,585,000 1,338,282 4,923,282
2019 3,725,000 1,189,798 4,914,798
2020 3,965,000 1,027,362 4,992,362
2021 4,130,000 853,344 4,983,344
2022 4,320,000 675,071 4,995,071
2023 4,490,000 493,150 4,983,150
2024 4,670,000 302,526 4,972,526
2025 485,000 93,600 578,600
2026 510,000 71,776 581,776
2027 530,000 48,826 578,826
2028 555,000 24,976 579,976 Total 60,370,000$ 23,747,738 84,117,738

WAUKEE COMMUNITY SCHOOL DISTRICT
NOTES TO FINANCIAL STATEMENTS Year Ended June 30, 2008
54
(5) Long-Term Liabilities (continued from previous page)
Advance Refunding – During the current year, the District issued $7,165,000 of refunding bonds to provide the resources for an advance refunding on the District’s bonds dated July 1, 1997, July 1, 1998 and June 1, 1999. This advance refunding was undertaken to reduce total debt service payments over the next 12 years by $624,517 and resulted in an economic gain of approximately $609,517. Early Retirement
The District offers a voluntary early retirement plan to its employees. Eligible employees must be at least age fifty-five but less than sixty-one years old and employees must have completed ten years of continuous service to the District. Employees must complete an application which is required to be approved by the Board of Education.
The early retirement incentive for each eligible employee is equal to 30% of the average of the employee s highest three years of salary. In addition, the District will pay an amount equal to the medical insurance single premium of the first year of retirement towards the cost of medical insurance until the employee reaches the age of sixty-five. The early retirement cash benefits will be paid in July following the start of retirement. Early retirement benefits are paid by the Special Revenue, Management Levy Fund.
At June 30, 2008, the District has obligations to 33 participants with a total liability of $627,271. Actual early retirement expenditures for the year ended June 30, 2008 totaled $186,869. The long-term portion of early retirement is recorded as a long-term liability of the Governmental Activities in the government-wide financial statements.
(6) Operating Leases
The District is obligated under equipment leases for two trucks and for several copiers. These leases are accounted for as operating leases. Operating leases do not give rise to property rights or lease obligations and therefore are not included as capital assets or long-term liabilities in the District-wide financial statements. The agreements provide for monthly lease payments of $815 for the trucks and monthly lease payments of $12,322
for the copiers.
The total annual lease payments under the lease agreements are as follows:
The total payments under the lease agreements for the year ended June 30, 2008 were $54,485.
Truck Copier
Year ending June 30, Leases Leases Total
2009 5,197$ 49,288 54,485 5,197$ 49,288 54,485

WAUKEE COMMUNITY SCHOOL DISTRICT
NOTES TO FINANCIAL STATEMENTS Year Ended June 30, 2008
55
(7) Pension and Retirement Benefits
The District contributes to the Iowa Public Employees Retirement System (IPERS) which is a cost-sharing multiple-employer defined benefit pension plan administered by the State of Iowa. IPERS provides retirement and death benefits which are established by State statute to plan members and beneficiaries. IPERS issues a publicly available financial report that includes financial statements and required supplementary information. The report may be obtained by writing to IPERS, P.O. Box 9117, Des Moines, Iowa, 50306-9117. Plan members are required to contribute 3.90% of their annual covered salary and the District is required to contribute 6.05% of annual covered payroll for the year ended June 30, 2008. Plan members were required to contribute 3.70% of their annual salary and the District was required to contribute 5.75% of annual covered payroll for the years ended June 30, 2007 and 2006. Contribution requirements are established by State statute. The District’s contributions to IPERS for the years ended June 30, 2008, 2007 and 2006 were $1,542,080, $1,233,735, and $1,042,037, respectively, equal to the required contributions for each year.
(8) Risk Management
Waukee Community School District is exposed to various risks of loss related to torts; theft; damage to and destruction of assets; errors and omissions; injuries to employees; and natural disasters. These risks are covered by the purchase of commercial insurance. The District assumes liability for any deductibles and claims in excess of coverage limitations. During the year ended June 30, 2008, there were no significant reductions in coverage. Settled claims from these risks have not exceeded commercial insurance coverage in any of the past three fiscal years.
Partial Self-Funded Dental Insurance Plan The District began a partial self-funded dental insurance plan during the year ended June 30, 2005. The plan is administered through a service agreement with Seabury and Smith. The District assumes liability for a maximum of the first $1,000 of dental claims for each employee who participates in the plan. Employees participating in the plan are charged a premium each year to cover any estimated costs of the plan. The District reports the plan in the Internal Service, Self-Funded Dental Plan Fund. There was no claims liability at June 30, 2008. A reconciliation of changes in the aggregate liabilities for claims for the year ended June 30, 2008 is as follows:
(9) Area Education Agency
The District is required by the Code of Iowa to budget for its share of special education support, media and educational services provided through the area education agency. The District's actual amount for this purpose totaled $1,696,590 for the year ended June 30, 2008 and is recorded in the General Fund by making a memorandum adjusting entry to the financial statements.
(10) Construction Commitments
The District entered into a contract totaling $10,162,419 for the construction of a BA/SB Complex and a stadium upgrade for the middle school. As of June 30, 2008, costs of $5,280,004 had been incurred against the contracts. The balance of $4,882,415 remaining at June 30, 2008 will be paid as work on the projects progresses.
Unpaid claims at July 1, 2007 -$
Incurred claims 218,527
Payment 218,527 Unpaid claims at June 30, 2008 -$

WAUKEE COMMUNITY SCHOOL DISTRICT
NOTES TO FINANCIAL STATEMENTS Year Ended June 30, 2008
56
(11) Contingency
The District has three ongoing lawsuits. The proceedings are still in the litigation stage and their outcomes cannot be determined at this time.
(12) Disaggregation of Receivables and Payables
Receivables and payables are disaggregated on the face of the basic financial statements. All receivables are expected to be collected within the next year.

57
Required Supplementary Information

WAUKEE COMMUNITY SCHOOL DISTRICT
BUDGETARY COMPARISON SCHEDULE OF REVENUES, EXPENDITURES AND CHANGES
IN BALANCES - BUDGET AND ACTUAL
ALL GOVERNMENTAL FUNDS AND PROPRIETARY FUNDS
REQUIRED SUPPLEMENTARY INFORMATION
Year ended June 30, 2008
Governmental Proprietary
Funds Funds
Actual Actual
Revenues:
Local sources 36,032,757$ 2,648,561
State sources 21,804,292 22,964
Federal sources 479,500 481,376
Total revenues 58,316,549 3,152,901
Expenditures:
Instruction 27,356,010 11,932
Support services 14,419,594 359,328
Noninstructional programs 29,955 2,640,076
Other expenditures 31,098,039 -
Total expenditures 72,903,598 3,011,336
Excess (deficiency) of revenues over
(under) expenditures (14,587,049) 141,565
Other financing sources, net 17,235,171 621,256
Excess of revenues and other financing sources over
expenditures and other financing uses 2,648,122 762,821
Balances beginning of year 27,312,858 1,461,723
Balances end of year 29,960,980$ 2,224,544
See accompanying independent auditor's report.
58

Budgeted Final to Actual
Amounts Variance-
Original and Positive
Total Actual Final (Negative)
38,681,318 33,970,805 4,710,513
21,827,256 21,516,090 311,166
960,876 710,000 250,876
61,469,450 56,196,895 5,272,555
27,367,942 23,973,470 (3,394,472)
14,778,922 21,007,269 6,228,347
2,670,031 2,700,000 29,969
31,098,039 34,118,468 3,020,429
75,914,934 81,799,207 5,884,273
(14,445,484) (25,602,312) 11,156,828
17,856,427 70,000,000 (52,143,573)
3,410,943 44,397,688 (40,986,745)
28,774,581 22,963,093 5,811,488
32,185,524 67,360,781 (35,175,257)
59

60
WAUKEE COMMUNITY SCHOOL DISTRICT NOTES TO REQUIRED SUPPLEMENTARY INFORMATION - BUDGETARY REPORTING
Year ended June 30, 2008
(1) Basis of Presentation
The District operates within the budget requirements for school districts as specified by state law and as prescribed by the Iowa Department of Management. Budgets are prepared in accordance with accounting principles generally accepted in the United States of America (GAAP).
For the fiscal year beginning July 1, a proposed budget is adopted by the Board and filed with the County Auditor no later than April 15. The budget is certified by the County Auditor to the Department of Management.
Once adopted, the budget can be amended by the Board. The amendment must be published and a public hearing conducted prior to the amendment. Any amendments must be certified to the County Auditor no later than May 31. The proposed expenditure budget is advertised in the local newspaper, together with a notice of public hearing.
The legal level of budgetary control (that is, the level at which expenditures cannot legally exceed the appropriated amount) is the functional area for a budgeted governmental, enterprise and private purpose trust funds in total, rather than by individual fund type. Formal and legal budgetary control is based on four major classes of expenditures known as functional areas. These four functional areas are instruction, support services, non-instructional programs and other expenditures. During the year ended June 30, 2008, the District over-expended the instruction functional area by $3,394,472. The Code of Iowa also provides that District expenditures in the General Fund may not exceed the amount authorized by the school finance formula. Authorized expenditures cannot exceed the lesser of the certified budget plus any allowable amendments, or the authorized budget, which is the sum of the District's cost for that year plus the actual miscellaneous income received for that year plus the actual unspent balance from the preceding year. Appropriations, as adopted and amended, lapse at the end of the fiscal year.
The District is required by the Code of Iowa to budget for its share of media, education services and special education support provided through the local area education agency. The District's actual amount for this purpose totaled $1,696,590 for the year ended June 30, 2008.

61
Other Supplementary Information

Schedule 1
WAUKEE COMMUNITY SCHOOL DISTRICT
COMBINING BALANCE SHEET
NON-MAJOR GOVERNMENTAL FUNDS
June 30, 2008
Physical
Plant and
Student Equipment
Management Activity Levy Total
Assets
Current Assets:
Cash and pooled investments 689,730$ 469,709 2,011,370 3,170,809
Receivables:
Property tax:
Current year delinquent 10,255 - - 10,255
Succeeding year 999,997 - 3,609,431 4,609,428
Accounts - 1,451 30,261 31,712 Total assets 1,699,982$ 471,160 5,651,062 7,822,204
Liabilities and Fund Balances
Current Liabilities:
Accounts payable 359$ 48,037 8,136 56,532
Deferred revenue:
Succeeding year property tax 999,997 - 3,609,431 4,609,428
Total liabilities 1,000,356 48,037 3,617,567 4,665,960
Fund balances:
Unreserved, undesignated 699,626 423,123 2,033,495 3,156,244
Total liabilities and fund balances 1,699,982$ 471,160 5,651,062 7,822,204
See accompanying independent auditor's report.
62

Schedule 2
WAUKEE COMMUNITY SCHOOL DISTRICT
COMBINING SCHEDULE OF REVENUES, EXPENDITURES AND CHANGES IN FUND BALANCES
NON-MAJOR GOVERNMENTAL FUNDS
Year ended June 30, 2008
Management
Student
Activity
Physical Plant
and Equipment
Levy Total
Revenues:
Local sources:
Local tax:
Property tax 1,085,244$ - 3,102,316 4,187,560
Excise taxes 8,755 - 19,500 28,255
Other taxes 1,203 - 2,787 3,990
1,095,202 - 3,124,603 4,219,805
Other local sources:
Interest on investments 7,775 16,147 54,800 78,722
Student activities - 622,577 - 622,577
Donations - 106,163 - 106,163
Other local revenue 59,826 103,865 - 163,691
67,601 848,752 54,800 971,153
1,162,803 848,752 3,179,403 5,190,958
State sources:
Revenue in lieu of taxes :
Military credit 218 - 532 750
Total revenues 1,163,021 848,752 3,179,935 5,191,708
Expenditures:
Current:
Instruction:
Regular instruction:
Benefits 213,449 - - 213,449
Property - - 40,612 40,612
213,449 - 40,612 254,061
Co-curricular instruction:
Salaries - 19,974 - 19,974
Benefits - 2,737 - 2,737
Purchased services - 91,170 - 91,170
Supplies - 601,272 - 601,272
Property - 21,329 - 21,329
Other - 85,654 - 85,654
- 822,136 - 822,136
Total instruction 213,449 822,136 40,612 1,076,197
63

Schedule 2
WAUKEE COMMUNITY SCHOOL DISTRICT
COMBINING SCHEDULE OF REVENUES, EXPENDITURES AND CHANGES IN FUND BALANCES
NON-MAJOR GOVERNMENTAL FUNDS
Year ended June 30, 2008
Management
Student
Activity
Physical Plant
and Equipment
Levy Total
Continued from previous page
Expenditures:
Current:
Support Services:
Student support:
Benefits 14,184 - - 14,184
Instructional staff support:
Purchased services 7,136 - - 7,136
7,136 - - 7,136
General administration:
Benefits 5,855 - - 5,855
Purchased services 10,547 - - 10,547
16,402 - - 16,402
Building administration:
Benefits 63,766 - - 63,766
63,766 - - 63,766
Business administration:
Benefits 7,318 - - 7,318
Purchased services - 108 - 108
Supplies - 67 - 67
7,318 175 - 7,493
Plant operation and maintenance:
Benefits 49,799 - - 49,799
Purchased services 215,040 - - 215,040
264,839 - - 264,839
Total support services 373,645 175 - 373,820
Non-instructional Programs:
Food services
Benefits 6,828 - - 6,828
Total non-instructional programs 6,828 - - 6,828
64

Schedule 2
WAUKEE COMMUNITY SCHOOL DISTRICT
COMBINING SCHEDULE OF REVENUES, EXPENDITURES AND CHANGES IN FUND BALANCES
NON-MAJOR GOVERNMENTAL FUNDS
Year ended June 30, 2008
Management
Student
Activity
Physical Plant
and Equipment
Levy Total
Continued from previous page
Expenditures:
Capital outlay:
Other expenditures:
Facilities acquisition:
Purchased services - - 244,554 244,554
Supplies - - 3,658 3,658
Property - - 126,262 126,262
- - 374,474 374,474
Total expenditures 593,922 822,311 415,086 1,831,319
Excess of revenues over expenditures 569,099 26,441 2,764,849 3,360,389
Other financing uses:
Operating transfers out - - (1,848,769) (1,848,769)
Total other financing uses - - (1,848,769) (1,848,769)
Excess of revenues over expenditures and
other financing uses 569,099 26,441 916,080 1,511,620
Fund balances beginning of year 130,527 396,682 1,117,415 1,644,624
Fund balances end of year 699,626$ 423,123 2,033,495 3,156,244
See accompanying independent auditor's report.
65

Schedule 3
WAUKEE COMMUNITY SCHOOL DISTRICT
COMBINING SCHEDULE OF NET ASSETS
PROPRIETARY FUNDS
June 30, 2008
School Community Flexible Self-funded
Nutrition Daycare Total Benefits Dental Plan Total
Assets
Current assets:
Cash and pooled investments 825,295$ 336,468 1,161,763 53,808 59,175 112,983
Receivables:
Accounts 1,423 7,820 9,243 25,079 112 25,191
Inventories 46,655 - 46,655 - - -
Total current assets 873,373 344,288 1,217,661 78,887 59,287 138,174
Noncurrent assets:
Capital assets:
Equipment 1,784,440 18,858 1,803,298 - - -
Accumulated depreciation (726,472) (3,409) (729,881) - - -
Total noncurrent assets 1,057,968 15,449 1,073,417 - - -
Total assets 1,931,341 359,737 2,291,078 78,887 59,287 138,174
Liabilities
Current liabilities:
Accounts payable 7,061 7,152 14,213 - - -
Salaries and benefits payable 14,271 - 14,271 - - -
Deferred revenue 38,050 - 38,050 - - -
Total current liabilities 59,382 7,152 66,534 - - -
Net Assets
Invested in capital assets 1,057,968 15,449 1,073,417 - - -
Unrestricted 813,991 337,136 1,151,127 78,887 59,287 138,174 Total net assets 1,871,959$ 352,585 2,224,544 78,887 59,287 138,174
See accompanying independent auditor's report.
Nonmajor Enterprise Funds Internal Service Funds
Business Type Activities Governmental Activities
66

Schedule 4
School Community Flexible Self-funded
Nutrition Daycare Total Benefits Dental Plan Total
Operating revenue:
Local sources:
Charges for services 1,908,746$ 699,391 2,608,137 306,511 246,785 553,296
Operating expenses:
Instructional programs:
Regular instruction:
Supplies - 1,334 1,334 - - -
Other - 10,598 10,598 - - -
- 11,932 11,932 - - -
Support services:
Administration services:
Salaries 236,057 - 236,057 - - -
Benefits 68,579 - 68,579 - - -
Purchased services 32,811 10,703 43,514 - - -
337,447 10,703 348,150 - - -
Operation and maintenance:
Supplies 4,620 - 4,620 - - -
4,620 - 4,620 - - -
Transportation services:
Purchased services - 6,558 6,558 - - -
- 6,558 6,558 - - -
342,067 17,261 359,328 - - -
Non-instructional programs:
Food service operations:
Salaries 633,911 - 633,911 - - -
Benefits 185,718 - 185,718
Purchased services 50,134 - 50,134
Supplies 1,119,925 - 1,119,925
Other 235 - 235
Depreciation 143,628 - 143,628 - - -
2,133,551 - 2,133,551 - - -
Other enterprise operations:
Salaries - 392,853 392,853 - - -
Benefits - 75,609 75,609 251,917 218,527 470,444
Purchased services - - - - - -
Supplies - 36,910 36,910 - - -
Other - - - - - -
Depreciation - 1,153 1,153 - - -
- 506,525 506,525 251,917 218,527 470,444
2,133,551 506,525 2,640,076 251,917 218,527 470,444
Total operating expenses 2,475,618 535,718 3,011,336 251,917 218,527 470,444
Operating income (loss) (566,872) 163,673 (403,199) 54,594 28,258 82,852
WAUKEE COMMUNITY SCHOOL DISTRICT
COMBINING SCHEDULE OF REVENUES, EXPENSES AND CHANGES IN NET ASSETS
PROPRIETARY FUNDS
Year ended June 30, 2008
Business Type Activities Governmental Activities
Nonmajor Enterprise Funds Internal Service Funds
67

Schedule 4
School Community Flexible Self-funded
Nutrition Daycare Total Benefits Dental Plan Total
WAUKEE COMMUNITY SCHOOL DISTRICT
COMBINING SCHEDULE OF REVENUES, EXPENSES AND CHANGES IN NET ASSETS
PROPRIETARY FUNDS
Year ended June 30, 2008
Business Type Activities Governmental Activities
Nonmajor Enterprise Funds Internal Service Funds
Non-operating revenues:
Interest on investments 30,670 9,726 40,396 918 - 918
Contributions - 28 28 - - -
State sources 22,964 - 22,964 - - -
Federal sources 376,962 376,962 - - -
Federal food commodities revenue 104,414 - 104,414 - - -
Total non-operating revenues 535,010 9,754 544,764 918 - 918
Net income (loss) before capital contributions (31,862) 173,427 141,565 55,512 28,258 83,770
Capital contributions 621,256 - 621,256 - - -
Chenges in net assets 589,394 173,427 762,821 55,512 28,258 83,770
Net assets beginning of year 1,282,565 179,158 1,461,723 23,375 31,029 54,404
Net assets end of year 1,871,959$ 352,585 2,224,544 78,887 59,287 138,174
See accompanying independent auditor's report.
68

Schedule 5
WAUKEE COMMUNITY SCHOOL DISTRICT
COMBINING SCHEDULE OF CASH FLOWS
PROPRIETARY FUNDS
Year ended June 30, 2008
School Community Flexible Self-funded
Nutrition Daycare Total Benefits Dental Plan Total
Cash flows from operating activities:
Cash received from sale of lunches and breakfasts 1,920,073$ - 1,920,073 - - -
Cash received from miscellaneous operating activities - 693,721 693,721 281,432 246,673 528,105
Cash payments to employees for services (1,115,896) (476,959) (1,592,855) (263,612) (218,527) (482,139)
Cash payments to suppliers for goods or services (1,109,993) (62,540) (1,172,533) - - -
Net cash used by operating activities (305,816) 154,222 (151,594) 17,820 28,146 45,966
Cash flows from non-capital financing activities:
Contributions - noncapital - 28 28 - - -
State grants received 22,964 - 22,964 - - -
Federal grants received 376,962 - 376,962 - - -
Net cash provided by non-capital financing activities 399,926 28 399,954 - - -
Cash flows from capital and related financing activities:
Capital contributions 621,256 - 621,256 - - -
Acquisition of capital assets (701,495) (3,818) (705,313) - - -
Net cash used in capital and related financing activities (80,239) (3,818) (84,057) - - -
Cash flows from investing activities:
Interest on investments 30,670 9,726 40,396 918 - 918
Net increase in cash and cash equivalents 44,541 160,158 204,699 18,738 28,146 46,884
Cash and cash equivalents at beginning of year 780,754 176,310 957,064 35,070 31,029 66,099
Cash and cash equivalents at end of year 825,295$ 336,468 1,161,763 53,808 59,175 112,983
Reconciliation of operating income (loss) to net cash provided
(used) by operating activities:
Operating income (loss) (566,872)$ 163,673 (403,199) 54,594 28,258 82,852
Adjustments to reconcile operating income (loss) to
net cash provided (used) by operating activities:
Commodities used 104,414 - 104,414 - - -
Depreciation 143,628 1,153 144,781 - - -
Decrease (Increase) in accounts receivable 4,987 (5,670) (683) (25,079) (112) (25,191)
(Increase) in inventories (8,981) - (8,981) - - -
Increase (decrease) in accounts payable 2,299 3,563 5,862 (11,695) - (11,695)
Increase (decrease) in salaries and benefits payable 8,369 (8,497) (128) - - -
Increase in deferred revenue 6,340 - 6,340 - - - Net cash provided (used) by operating activities (305,816)$ 154,222 (151,594) 17,820 28,146 45,966
Reconciliation of cash and cash equivalents at year end to
specific assets included on Combined Balance Sheet:
Current assets:
Cash and investments 825,295$ 336,468 1,161,763 53,808 59,175 112,983 Cash and cash equivalents at year end 825,295$ 336,468 1,161,763 53,808 59,175 112,983
Non-cash investing, capital and financing activities:
During the year ended June 30, 2008, the District received federal commodities valued at $104,414.
See notes to basic financial statements.
Business Type Activities Governmental Activities
Nonmajor Enterprise Funds Internal Service Funds
69

Schedule 6
Balance Balance
Beginning Expendi- End
Account of Year Revenues tures of Year
High School:
Ambassadors 78$ - - 78
Annual 23,688 31,262 31,204 23,746
Art Club 197 105 159 143
Athletics 43,512 234,893 272,463 5,942
Auditorium 181 - - 181
Band Resale 757 5,739 6,496 -
Baseball 2,559 9,423 5,900 6,082
Baseball/Softball Facility 22,305 3,312 1,848 23,769
Best Buddies 171 169 340 -
Boys Basketball 8,112 30,324 31,115 7,321
Boys Cross Country 561 3,046 1,679 1,928
Boys Golf 599 1,263 1,160 702
Boys Soccer 1,100 6,150 7,043 207
Boys Track 847 5,239 4,702 1,384
Cheerleaders 8,026 28,411 29,565 6,872
Class of 2005 2,942 - - 2,942
Class of 2006 2,620 - - 2,620
Class of 2007 5,759 - 4,244 1,515
Class of 2008 7,227 4,902 7,814 4,315
Class of 2009 8,386 8,135 9,546 6,975
Class of 2010 3,891 3,900 1,200 6,591
Class of 2011 - 4,645 - 4,645
Dance/Drill Team 4,874 15,730 10,772 9,832
Drama 235 2,855 1,917 1,173
Drumline 73 - - 73
Electrathon 59 1,000 746 313
FCCLA Club - 3,642 3,446 196
Flag Team/Color Guard 51 1,125 1,176 -
Football 1,324 45,153 40,156 6,321
Foreign Language Camp - 237 63 174
German/International Club 674 2,717 2,937 454
Girls Basketball 4,540 11,065 12,261 3,344
Girls Cross Country 923 2,346 2,454 815
Girls Golf - 2,383 2,195 188
Girls Soccer 3,470 7,487 5,975 4,982
Girls Track - 4,395 4,395 -
HS Improvement 7,755 8,894 9,787 6,862
HS Musical 4,219 10,438 13,446 1,211
Interest 34,780 16,147 1,330 49,597
National Honor Society 266 100 121 245
Pep Club 167 - - 167
SADD 436 - - 436
SELF Room 87 1,132 362 857
Skills USA 672 - - 672
Softball 3,584 12,237 15,821 -
Speech 2,389 - 754 1,635
Student Council 1,817 6,118 7,935 -
Vocal Music 1,934 8,816 7,823 2,927
WAUKEE COMMUNITY SCHOOL DISTRICT
SCHEDULE OF CHANGES IN SPECIAL REVENUE FUND, STUDENT ACTIVITY ACCOUNTS
Year ended June 30, 2008
70

Schedule 6
Balance Balance
Beginning Expendi- End
Account of Year Revenues tures of Year
WAUKEE COMMUNITY SCHOOL DISTRICT
SCHEDULE OF CHANGES IN SPECIAL REVENUE FUND, STUDENT ACTIVITY ACCOUNTS
Year ended June 30, 2008
Volleyball 5,691 19,894 12,785 12,800
Weight Room 660 500 719 441
Wrestling - 10,356 10,356 -
Youth for Safe Schools 380 - - 380
Prairieview:
Art Club 1,618 525 74 2,069
Athletic Resale 8,761 19,403 20,100 8,064
Band Resale - 294 294 -
Concessions 292 - - 292
Dance Team 1,301 - - 1,301
Drama - 2,570 2,313 257
Drama Troupe 2,000 1,386 150 3,236
Improvement Fund 9,379 10,114 11,021 8,472
Student Council 810 - - 810
Swing Choir 471 - - 471
Yearbook 9,929 11,771 21,700 -
Middle School:
6th Grade 130 - - 130
7th Grade 135 - - 135
8th Grade 204 - - 204
Athletic Resale 1,931 - - 1,931
Band 917 1,843 589 2,171
Concessions 1,171 - - 1,171
Drama/Speech/Musical 6,350 4,018 2,146 8,222
Improvement Fund 11,211 83,462 58,565 36,108
MS SELF 550 - - 550
Swing Choir 5,253 3,606 1,130 7,729
Yearbook 3,963 12,392 10,238 6,117
Elementary:
BV Band 89 - - 89
BV Improvement 17,053 17,793 15,839 19,007
BV Student Council 2,022 1,950 1,345 2,627
Eason Band Resale 300 - - 300
Eason Fine Arts 3,347 10,077 6,613 6,811
Eason Improvement 18,038 19,741 19,344 18,435
Eason Playground Project 2,871 - - 2,871
Eason Student Council 2,150 - - 2,150
MG Improvement - 33,709 26,407 7,302
WE Band Resale 409 - 404 5
WE Fine Art 165 - - 165
WE Improvement 33,873 11,785 17,854 27,804
WE Playground 2,710 - - 2,710
WE Student Council 4,774 - - 4,774
WH Band 96 36 - 132
WH Improvement 17,831 26,592 19,975 24,448 Total 396,682$ 848,752 822,311 423,123
See accompanying independent auditor's report.
71
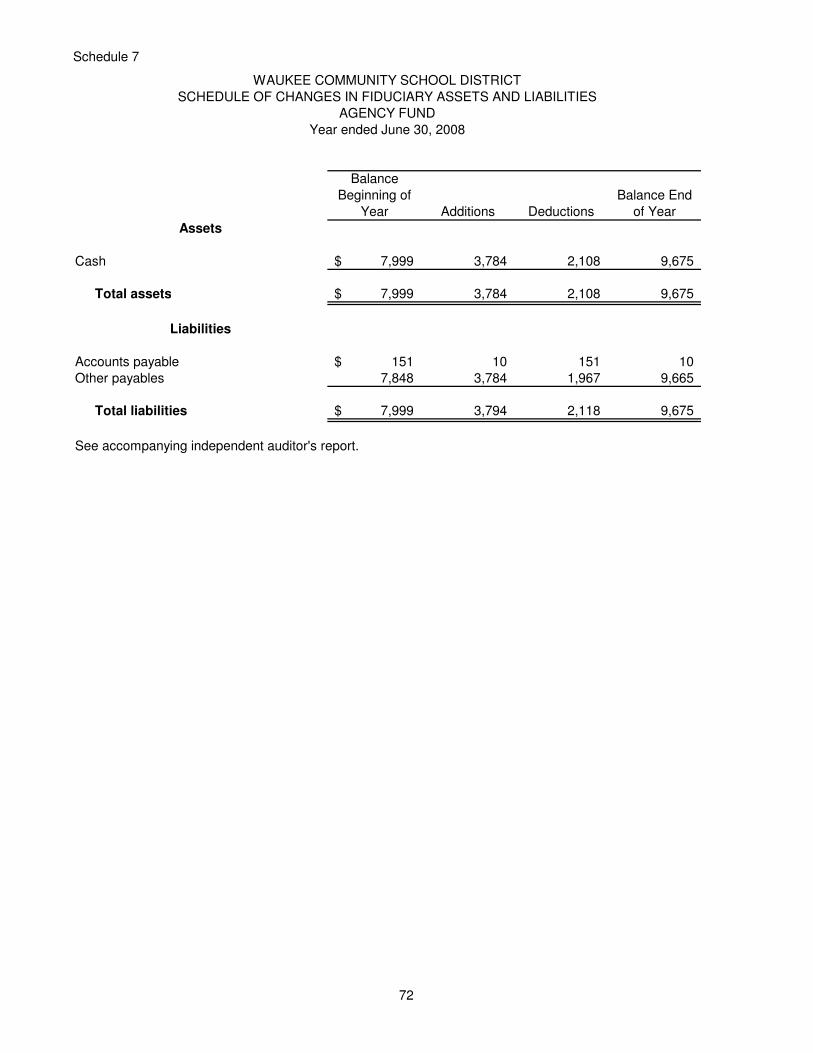
Schedule 7
WAUKEE COMMUNITY SCHOOL DISTRICT
SCHEDULE OF CHANGES IN FIDUCIARY ASSETS AND LIABILITIES
AGENCY FUND
Year ended June 30, 2008
Balance
Beginning of
Year Additions Deductions
Balance End
of Year
Assets
Cash 7,999$ 3,784 2,108 9,675
Total assets 7,999$ 3,784 2,108 9,675
Liabilities
Accounts payable 151$ 10 151 10
Other payables 7,848 3,784 1,967 9,665
Total liabilities 7,999$ 3,794 2,118 9,675
See accompanying independent auditor's report.
72

Schedule 8
WAUKEE COMMUNITY SCHOOL DISTRICT
SCHEDULE OF REVENUES BY SOURCE AND EXPENDITURES BY FUNCTION
ALL GOVERNMENTAL FUNDS
FOR THE LAST SIX YEARS
Modified Accrual Basis
2008 2007 2006 2005 2004 2003
Revenues:
Local sources:
Local tax 32,425,053$ 26,907,371 21,898,342 18,724,901 14,220,453 12,501,101
Tuition 1,175,066 1,209,866 1,267,893 1,176,813 1,258,916 1,274,538
Other 2,432,638 2,604,416 1,935,241 1,383,507 914,311 959,469
State sources 21,804,292 18,700,021 16,110,389 13,424,393 10,926,968 9,691,405
Federal sources 479,500 485,203 437,201 407,377 254,243 207,125 Total 58,316,549$ 49,906,877 41,649,066 35,116,991 27,574,891 24,633,638
Expenditures:
Instruction:
Regular instruction 20,040,299$ 16,944,785 14,497,759 12,045,774 10,074,061 9,180,177
Special instruction 4,926,113 4,233,291 3,387,132 3,061,467 2,679,023 2,303,872
Other instruction 2,389,598 2,147,056 2,096,796 1,896,088 1,443,770 1,354,138
Support services:
Student services 2,518,458 1,413,137 1,289,559 1,274,069 983,108 927,615
Instructional staff services 2,450,310 1,631,053 1,393,248 1,475,734 1,331,528 604,992
Administration services 3,639,159 2,909,779 2,711,319 2,270,519 1,965,351 1,515,229
Operation and maintenance of 3,829,770 3,023,278 2,764,387 2,114,247 1,584,289 1,567,336
plant services
Transportation services 1,981,897 1,853,584 1,590,878 1,097,493 874,909 762,357
Non-instructional programs 29,955 265 - - 369 352
Other expenditures:
Capital outlay:
Facilities acquisition 13,080,340 21,356,585 5,593,186 11,528,812 16,567,624 5,343,943
Debt Service:
Principal 13,215,000 3,100,000 2,230,000 8,335,000 2,290,000 2,090,000
Interest 3,097,409 3,166,074 2,500,741 2,391,214 2,082,149 1,900,449
Fiscal charges 8,700 4,800 90,809 86,343 96,130 -
AEA flowthrough 1,696,590 1,434,517 1,198,063 995,297 823,781 770,245
Total 72,903,598$ 63,218,204 41,343,877 48,572,057 42,796,092 28,320,705
See accompanying independent auditor's report.
73

74

WAUKEE COMMUNITY SCHOOL DISTRICT
NET ASSETS BY COMPONENT
Last Six Fiscal Years
(Unaudited)
Year ended June 30,
2008 2007 2006 2005 2004 2003
Governmental activities:
Invested in capital assets, net of related debt 18,331,620$ 14,051,616$ 10,019,928$ 8,282,400$ 6,054,028$ 3,651,585$
Restricted 9,922,010 7,820,732 6,441,728 2,627,733 729,161 947,466
Unrestricted 8,112,790 4,815,232 1,594,739 705,403 1,162,141 1,141,673
Total governmental activities net assets 36,366,420$ 26,687,580$ 18,056,395$ 11,615,536$ 7,945,330$ 5,740,724$
Business type activities:
Invested in capital assets 1,073,417$ 736,602$ 578,088$ 548,174$ 377,917$ 403,898$
Restricted - - - - - -
Unrestricted 1,151,127 725,121 643,482 459,532 508,045 344,362
Total business type activities net assets 2,224,544$ 1,461,723$ 1,221,570$ 1,007,706$ 885,962$ 748,260$
Total
Invested in capital assets, net of related debt 19,405,037$ 14,788,218$ 10,598,016$ 8,830,574$ 6,431,945$ 4,055,483$
Restricted 9,922,010 7,820,732 6,441,728 2,627,733 729,161 947,466
Unrestricted 9,263,917 5,540,353 2,238,221 1,164,935 1,670,186 1,486,035
Total net assets 38,590,964$ 28,149,303$ 19,277,965$ 12,623,242$ 8,831,292$ 6,488,984$
Note: The District began to report accrual information when it implemented GASB Statement 34
in the year ended June 30, 2003.
Source: District Records
75
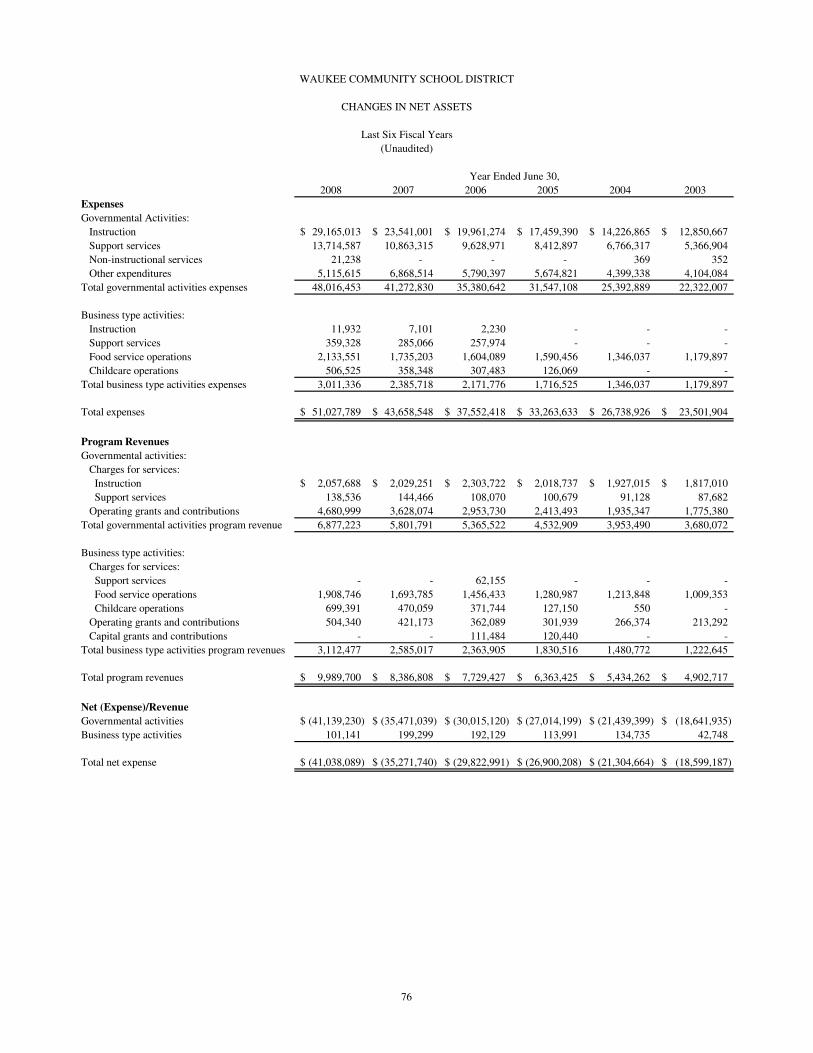
WAUKEE COMMUNITY SCHOOL DISTRICT
CHANGES IN NET ASSETS
Last Six Fiscal Years
(Unaudited)
Year Ended June 30,
2008 2007 2006 2005 2004 2003
Expenses
Governmental Activities:
Instruction 29,165,013$ 23,541,001$ 19,961,274$ 17,459,390$ 14,226,865$ 12,850,667$
Support services 13,714,587 10,863,315 9,628,971 8,412,897 6,766,317 5,366,904
Non-instructional services 21,238 - - - 369 352
Other expenditures 5,115,615 6,868,514 5,790,397 5,674,821 4,399,338 4,104,084
Total governmental activities expenses 48,016,453 41,272,830 35,380,642 31,547,108 25,392,889 22,322,007
Business type activities:
Instruction 11,932 7,101 2,230 - - -
Support services 359,328 285,066 257,974 - - -
Food service operations 2,133,551 1,735,203 1,604,089 1,590,456 1,346,037 1,179,897
Childcare operations 506,525 358,348 307,483 126,069 - -
Total business type activities expenses 3,011,336 2,385,718 2,171,776 1,716,525 1,346,037 1,179,897
Total expenses 51,027,789$ 43,658,548$ 37,552,418$ 33,263,633$ 26,738,926$ 23,501,904$
Program Revenues
Governmental activities:
Charges for services:
Instruction 2,057,688$ 2,029,251$ 2,303,722$ 2,018,737$ 1,927,015$ 1,817,010$
Support services 138,536 144,466 108,070 100,679 91,128 87,682
Operating grants and contributions 4,680,999 3,628,074 2,953,730 2,413,493 1,935,347 1,775,380
Total governmental activities program revenue 6,877,223 5,801,791 5,365,522 4,532,909 3,953,490 3,680,072
Business type activities:
Charges for services:
Support services - - 62,155 - - -
Food service operations 1,908,746 1,693,785 1,456,433 1,280,987 1,213,848 1,009,353
Childcare operations 699,391 470,059 371,744 127,150 550 -
Operating grants and contributions 504,340 421,173 362,089 301,939 266,374 213,292
Capital grants and contributions - - 111,484 120,440 - -
Total business type activities program revenues 3,112,477 2,585,017 2,363,905 1,830,516 1,480,772 1,222,645
Total program revenues 9,989,700$ 8,386,808$ 7,729,427$ 6,363,425$ 5,434,262$ 4,902,717$
Net (Expense)/Revenue
Governmental activities (41,139,230)$ (35,471,039)$ (30,015,120)$ (27,014,199)$ (21,439,399)$ (18,641,935)$
Business type activities 101,141 199,299 192,129 113,991 134,735 42,748
Total net expense (41,038,089)$ (35,271,740)$ (29,822,991)$ (26,900,208)$ (21,304,664)$ (18,599,187)$
76

WAUKEE COMMUNITY SCHOOL DISTRICT
CHANGES IN NET ASSETS
Last Six Fiscal Years
(Unaudited)
Year Ended June 30,
2008 2007 2006 2005 2004 2003
General Revenues
Governmental activities:
Property taxes 27,644,301$ 22,707,713$ 18,435,237$ 15,992,732$ 13,672,507$ 12,481,271$
Local option sales & services tax 4,780,752 4,199,658 3,467,268 2,736,191 551,705 -
Unrestricted state grants 17,867,198 15,518,867 13,589,697 11,414,256 9,242,108 8,119,410
Investment earnings 840,642 1,299,865 602,452 191,461 87,440 246,574
Other 306,433 376,121 361,325 327,606 68,942 106,411
Total governmental activities 51,439,326 44,102,224 36,455,979 30,662,246 23,622,702 20,953,666
Business type activities:
Investment earnings 40,396 40,854 21,735 7,753 2,967 2,401
Other 28 - - - - -
Total business type activities 40,424 40,854 21,735 7,753 2,967 2,401
Total general revenues 51,479,750$ 44,143,078$ 36,477,714$ 30,669,999$ 23,625,669$ 20,956,067$
Change in Net Assets
Governmental activities 9,678,840$ 8,631,185$ 6,440,859$ 3,648,047$ 2,183,303$ 2,311,731$
Business type activities 762,821 240,153 192,129 113,991 134,735 42,748
Total change in net assets 10,441,661$ 8,871,338$ 6,632,988$ 3,762,038$ 2,318,038$ 2,354,479$
Note: District began to report accrual information when it implemented GASB Statement 34 in the year ended June 30, 2003.
Source: District Records
77

WAUKEE COMMUNITY SCHOOL DISTRICT
FUND BALANCES, GOVERNMENTAL FUNDS
Last Ten Fiscal Years
(Unaudited)
Year ended June 30,
2008 2007 2006 2005 2004 2003
General fund:
Reserved 133,903$ 195,644$ 146,376$ 110,352$ 39,845$ 48,057$
Unreserved 6,897,344 4,529,957 2,267,031 1,373,853 1,181,262 1,194,658
Total general fund 7,031,247$ 4,725,601$ 2,413,407$ 1,484,205$ 1,221,107$ 1,242,715$
All other governmental funds:
Reserved 9,432,642$ 3,453,669$ 233,849$ 189,164$ 118,999$ 76,887$
Unreserved:
Special revenue funds 3,156,244 1,644,624 1,533,833 1,200,280 729,161 947,466
Capital projects funds 10,340,847 17,488,964 17,107,276 2,906,073 5,725,357 11,576,873
Total all other government funds 22,929,733$ 22,587,257$ 18,874,958$ 4,295,517$ 6,573,517$ 12,601,226$
Source: District Records
78

Year ended June 30,
2002 2001 2000 1999
36,956$ 48,735$ 70,503$ 28,800$
179,544 291,047 930,902 719,120
216,500$ 339,782$ 1,001,405$ 747,920$
179,915$ 278,459$ 192,727$ 71,367$
558,969 220,474 319,433 423,192
5,807,706 1,304,593 4,062,495 1,819,623
6,546,590$ 1,803,526$ 4,574,655$ 2,314,182$
79

WAUKEE COMMUNITY SCHOOL DISTRICT
CHANGES IN FUND BALANCES, GOVERNMENTAL FUNDS AND DEBT SERVICE RATIO
Last Ten Fiscal Years
(Unaudited)
Year Ended June 30,
2008 2007 2006 2005 2004 2003
Revenues:
Local sources: -$ -$ -$ -$ -$ -$
Local tax 32,425,053 26,907,371 21,898,342 18,724,901 14,220,453 12,501,101
Tuition 1,175,066 1,209,866 1,267,893 1,176,813 1,258,916 1,274,538
Other 2,432,638 2,604,416 1,935,241 1,383,507 914,311 959,469
State sources 21,804,292 18,700,021 16,110,389 13,424,393 10,926,968 9,691,405
Federal sources 479,500 485,203 437,201 407,377 254,243 207,125
Total revenues 58,316,549 49,906,877 41,649,066 35,116,991 27,574,891 24,633,638
Expenditures:
Current:
Instruction - - - - - -
Regular instruction 20,040,299 16,944,785 14,497,759 12,045,774 10,074,061 9,180,177
Special instruction 4,926,113 4,233,291 3,387,132 3,061,467 2,679,023 2,303,872
Other instruction 2,389,598 2,147,056 2,096,796 1,896,088 1,443,770 1,354,138
Support services: - - - - - -
Student services 2,518,458 1,413,137 1,289,559 1,274,069 983,108 927,615
Instructional services 2,450,310 1,631,053 1,393,248 1,475,734 1,331,528 604,992
Administrative services 3,639,159 2,909,779 2,711,319 2,270,519 1,965,351 1,515,229
Operation & plant maintenance services 3,829,770 3,023,278 2,764,387 2,114,247 1,584,289 1,567,336
Transportation services 1,981,897 1,853,584 1,560,878 1,097,493 874,909 762,357
Non-instructional services 29,955 265 - - 369 352
Other expenditures:
Capital outlay:
Facilities acquisition 13,080,340 21,356,585 5,593,186 11,528,812 16,567,624 5,343,943
Debt service:
Principal 13,215,000 3,100,000 2,230,000 8,335,000 2,290,000 2,090,000
Interest 3,097,409 3,166,074 2,500,741 2,391,214 2,082,149 1,900,449
Fiscal charges 8,700 4,800 90,809 86,343 96,130 262,182
AEA flowthrough 1,696,590 1,434,517 1,198,063 995,297 823,781 770,240
Total expenditures 72,903,598 63,218,204 41,313,877 48,572,057 42,796,092 28,582,882
Other financing sources (uses):
Sale of equipment - 100 50 1,900 1,300 100
Sale of real property - - 26,000 - - -
Interfund transfers in - 3,101,062 15,831,166 763,808 775,552 798,543
Interfund transfers out - (3,101,062) (15,831,160) (763,808) (775,552) (798,543)
Bonds refunded - (4,285,000) - - - -
Bonds and notes issued - 23,335,000 15,000,000 11,390,000 9,175,000 15,520,000
Premium on bonds and notes issued - 285,720 147,404 48,264 - (4,490,000)
- 19,335,820 15,173,460 11,440,164 9,176,300 11,030,100
Net change in fund balance (14,587,049)$ 6,024,493$ 15,508,649$ (2,014,902)$ (6,044,901)$ 7,080,856$
Total expenditures 72,903,598$ 63,218,204$ 41,313,877$ 48,572,057$ 42,796,092$ 28,582,882$
Less: capital expenditures - (20,735,371) (5,293,151) (10,817,069) (16,095,655) (5,035,469)
Non-capital expenditures 72,903,598 42,482,833 36,020,726 37,754,988 26,700,437 23,547,413
Debt service expenditures 16,321,109 6,270,874 4,821,550 10,812,557 4,468,279 4,252,631
Debt service expenditures as a percentage
of non-capital expenditures 22.39% 14.76% 13.39% 28.64% 16.73% 18.06%
Source: District Records Note: From 1999 to 2002, detail on revenues and expenses are not available.
Only category totals are reported.
80

2002 2001 2000 1999
12,666,930$ 10,913,375$ 9,306,517$ 7,576,841$
8,327,266 7,211,697 6,607,086 5,240,723
211,068 123,955 97,274 68,096
21,205,264 18,249,027 16,010,877 12,885,660
11,661,522 9,774,551 8,121,560 7,063,483
4,627,598 4,360,841 3,963,641 3,366,045
6,627 7,019 4,770 3,026
132,697 412,486 343,684 365,067
2,936,634 9,839,806 3,100,486 5,065,856
3,601,867 3,068,083 2,261,885 1,904,735
662,430 583,993 500,313 438,740
23,629,375 28,046,779 18,296,339 18,206,952
2,565 - 4,420 8,926
41,328 - 95,000 -
767,870 3,549,536 601,340 383,437
(776,239) (3,549,536) (601,340) (383,437)
- - - -
7,000,000 6,365,000 4,660,000 7,200,000
7,035,524 6,365,000 4,759,420 7,208,926
4,611,413$ (3,432,752)$ 2,473,958$ 1,887,634$
23,629,375$ 28,046,779$ 18,296,339$ 18,206,952$
(2,936,634) (9,839,806) (3,100,486) (5,065,856)
20,692,741 18,206,973 15,195,853 13,141,096
3,601,867 3,068,083 2,261,885 1,904,735
17.41% 16.85% 14.88% 14.49%
81

WAUKEE COMMUNITY SCHOOL DISTRICT
GENERAL FUND REVENUES, BY SOURCE
Last Ten Fiscal Years
(Unaudited)
Local
Year Ended June 30, Taxes Miscellaneous State Federal Total
2008 19,059,387$ 2,045,360$ 21,802,799$ 479,500$ 43,387,046$
2007 15,417,932 2,022,140 18,698,603 485,203 36,623,878
2006 12,101,584 1,874,439 16,108,939 433,391 30,518,353
2005 9,993,328 1,599,569 13,422,857 407,377 25,423,131
2004 8,349,264 1,576,846 10,925,564 254,243 21,105,917
2003 7,866,729 1,600,125 9,690,094 207,125 19,364,073
2002 6,385,468 1,292,631 8,326,003 211,068 16,215,170
2001 5,312,002 1,040,571 7,177,234 123,955 13,653,762
2000 4,828,889 991,394 6,587,414 97,274 12,504,971
1999 4,410,095 837,260 5,230,494 68,096 10,545,945
Source: District records
82

WAUKEE COMMUNITY SCHOOL DISTRICT
GENERAL FUND EXPENDITURES, BY PROGRAM
Last Ten Fiscal Years
(Unaudited)
Support Non-Instructional Other
Year Ended June 30, Instruction Services Programs Expenditures Total
2008 26,185,188$ 13,176,495$ 23,127$ 1,696,590$ 41,081,400$
2007 22,370,355 10,506,812 - 1,434,517 34,311,684
2006 18,800,131 9,594,770 - 1,198,063 29,592,964
2005 16,051,064 8,115,572 - 995,297 25,161,933
2004 13,601,413 6,696,788 - 824,908 21,123,109
2003 12,339,194 5,228,519 - 770,245 18,337,958
2002 11,156,200 4,530,756 - 662,430 16,349,386
2001 9,404,186 4,291,717 - 583,993 14,279,896
2000 7,825,779 3,894,325 - 500,313 12,220,417
1999 6,805,818 3,304,633 - 438,740 10,549,191
Source: District records
83

WAUKEE COMMUNITY SCHOOL DISTRICT
GOVERNMENT-WIDE REVENUES
Last Ten Fiscal Years
(Unaudited)
Program Revenues
Year ended
June 30,
Charges for
Services &
Sales
Operating
Grants &
Contributions
Capital Grants
&
Contributions Taxes
Other Local
Sources State Sources
Investment
Earings Miscellaneous Total
2008 4,804,361$ 5,185,339$ -$ 32,425,053$ 306,433$ 17,867,226$ 881,038$ -$ 61,469,450$
2007 4,337,561 4,049,247 - 26,907,371 188,662 15,518,867 1,340,719 52,342,427
2006 4,302,124 3,315,819 111,484 21,902,505 361,325 13,589,697 624,187 44,207,141
2005 3,527,553 2,715,432 120,440 18,728,923 327,606 11,414,256 199,214 - 37,033,424
2004 3,232,541 2,201,721 - 13,672,507 620,647 9,242,108 90,407 - 29,059,931
*2003 2,914,045 1,998,672 - 12,481,271 106,411 8,119,410 248,975 - 25,868,784
* Fiscal year 2003 was the first year of government-wide financial statements.
Source: District records
84
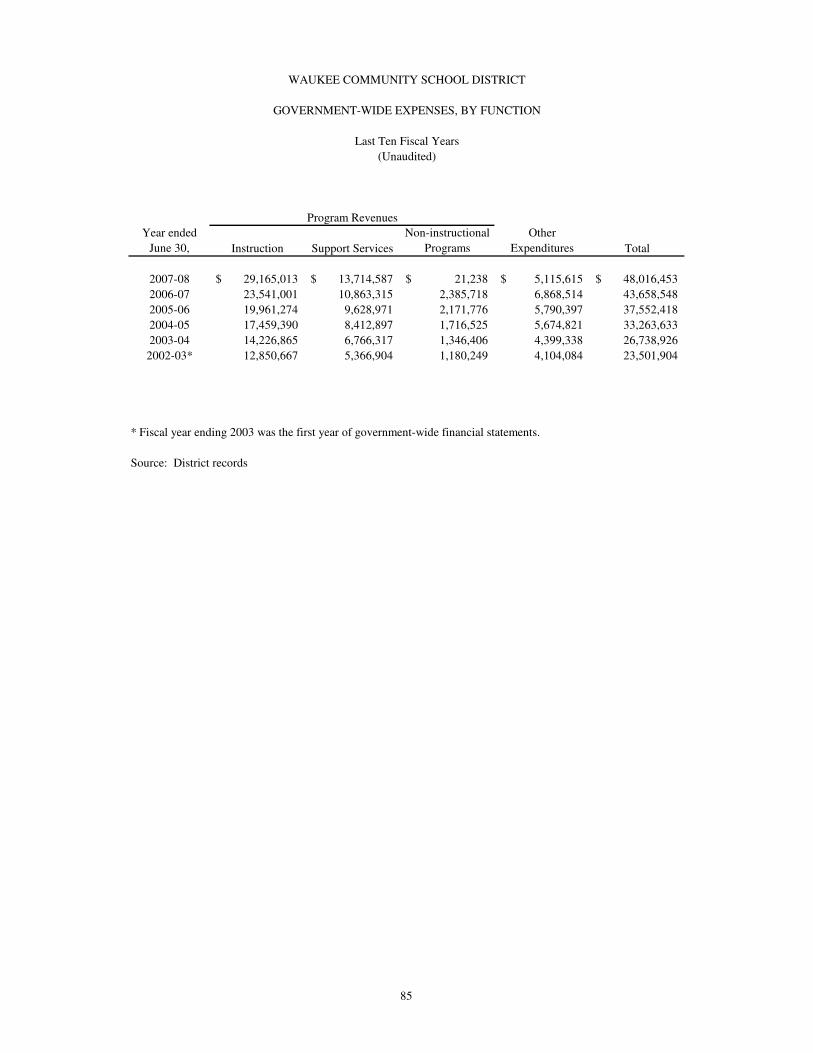
WAUKEE COMMUNITY SCHOOL DISTRICT
GOVERNMENT-WIDE EXPENSES, BY FUNCTION
Last Ten Fiscal Years
(Unaudited)
Program Revenues
Year ended
June 30, Instruction Support Services
Non-instructional
Programs
Other
Expenditures Total
2007-08 29,165,013$ 13,714,587$ 21,238$ 5,115,615$ 48,016,453$
2006-07 23,541,001 10,863,315 2,385,718 6,868,514 43,658,548
2005-06 19,961,274 9,628,971 2,171,776 5,790,397 37,552,418
2004-05 17,459,390 8,412,897 1,716,525 5,674,821 33,263,633
2003-04 14,226,865 6,766,317 1,346,406 4,399,338 26,738,926
2002-03* 12,850,667 5,366,904 1,180,249 4,104,084 23,501,904
* Fiscal year ending 2003 was the first year of government-wide financial statements.
Source: District records
85

WAUKEE COMMUNITY SCHOOL DISTRICT
COMPARISON OF GROWTH IN GENERAL FUND REVENUE, EXPENDITURES, ENROLLMENT,
ENROLLMENT, ASSESSED VALUATION AND TAX RATE
Last Ten Fiscal Years
(Unaudited)
Year Ended June 30, Revenue Growth Expenditures Growth Budget Enrollment Growth
2008 43,387,046$ 18.47% 41,081,400$ 19.73% 5,458.0 7.06%
2007 36,623,878 19.99% 34,311,684 15.95% 5,098.0 11.07%
2006 30,522,161 20.05% 29,592,960 17.61% 4,590.0 12.83%
2005 25,425,031 20.50% 25,161,933 18.62% 4,068.0 12.19%
2004 21,099,617 8.96% 21,212,982 15.68% 3,626.0 16.52%
2003 19,364,073 19.42% 18,337,958 12.16% 3,112.0 12.43%
2002 16,215,170 18.76% 16,349,386 14.21% 2,768.0 15.29%
2001 13,653,762 9.19% 14,315,385 14.01% 2,401.0 13.25%
2000 12,504,971 18.58% 12,555,906 18.62% 2,120.0 11.52%
1999 10,545,945 13.87% 10,584,680 16.37% 1,901.0 10.65%
Source: District records
86

Assessed Value Growth Tax Rate Growth
1,467,046,188$ 22.76% 13.04865$ 0.89%
1,195,088,331 22.33% 12.93403 4.52%
976,966,148 15.70% 12.37520 4.68%
844,423,567 18.07% 11.82216 1.10%
715,197,303 8.86% 11.69320 -2.33%
656,966,876 18.46% 11.97257 4.08%
554,596,339 21.07% 11.50340 0.03%
458,079,902 8.48% 11.49978 0.80%
422,277,389 18.15% 11.40850 -6.92%
357,410,386 13.61% 12.25670 1.75%
87

WAUKEE COMMUNITY SCHOOL DISTRICT
RATIO OF FINANCIAL CONDITION (General Fund)
Last Ten Fiscal Years
(Unaudited)
Year Ended June 30,
2008 2007 2006 2005 2004 2003 2002 2001 2000 1999
Days net Cash Ratio 97.86 84.81 64.79 59.09 56.9 56.8 37.7 43.4 59.2 57.8
cash
average daily disbursements
Increased Revenue versus Increased Expenditures 1.00 1.29 1.15 1.07 0.63 1.58 0.77 0.68 1.56 0.93
current year revenue minus prior year revenue
current year expenditures-prior year expenditures
Financial Solvency Ratios 15.68% 12.13% 7.08% 5.404% 5.597% 6.169% 1.107% 1.986% 7.022% 6.751%
current year UD,UR Fund Balance*
current year actual revenue
*UD,UR=Undesignated, Unreserved
Source: District records
88

WAUKEE COMMUNITY SCHOOL DISTRICT
PROPERTY TAX LEVIES AND COLLECTIONS
Last Ten Fiscal Years
(Unaudited)
Collection Year General Fund Management Debt Service PPEL Total
Property Tax Levies
2008 19,142,972$ 1,100,006$ 4,393,433$ 3,144,865$ 27,781,276$
2007 15,457,308 500,501 4,270,762 2,559,417 22,787,988
2006 12,090,151 399,999 3,970,419 1,954,603 18,415,172
2005 9,978,351 300,000 4,030,904 1,662,167 15,971,422
2004 8,362,946 180,000 3,649,603 1,505,078 13,697,627
2003 7,874,784 165,000 3,094,666 1,367,044 12,501,494
2002 6,386,307 140,000 2,817,647 1,165,426 10,509,380
2001 5,267,646 120,000 2,341,461 965,491 8,694,598
2000 4,942,602 90,000 2,033,072 705,204 7,770,878
1999 4,383,257 80,000 1,521,300 357,361 6,341,918
Property Tax Collections
2008 18,885,364$ 1,085,244$ 4,307,301$ 3,102,316$ 27,380,225$
2007 15,417,932 498,717 4,246,299 2,544,765 22,707,713
2006 12,080,450 399,673 3,967,366 1,953,106 18,400,595
2005 9,973,356 299,712 4,024,352 1,661,063 15,958,483
2004 8,349,264 179,706 3,639,048 1,500,730 13,668,748
2003 7,866,729 165,496 3,093,356 1,375,520 12,501,101
2002 6,385,468 140,125 2,819,360 1,166,134 10,511,087
2001 5,312,002 121,008 2,341,268 965,411 8,739,689
2000 4,828,889 90,212 2,036,661 706,862 7,662,624
1999 4,410,095 80,547 1,525,021 359,811 6,375,474
Percentage Collected
2008 98.65% 98.66% 98.04% 98.65% 98.56%
2007 99.75% 99.64% 99.43% 99.43% 99.65%
2006 99.92% 99.92% 99.92% 99.92% 99.92%
2005 99.95% 99.90% 99.84% 99.93% 99.92%
2004 99.84% 99.84% 99.71% 99.71% 99.79%
2003 99.90% 100.30% 99.96% 100.62% 100.00%
2002 99.99% 100.09% 100.06% 100.06% 100.02%
2001 100.84% 100.84% 99.99% 99.99% 100.52%
2000 97.70% 100.24% 100.18% 100.24% 98.61%
1999 100.61% 100.68% 100.24% 100.69% 100.53%
Source: District records
Dallas County, Iowa does not track delinquent taxes to a specific year if payment is made after the fiscal year closes.
89

WAUKEE COMMUNITY SCHOOL DISTRICT
TAXABLE AND 100% VALUES OF PROPERTY
Last Ten Fiscal Years
(Unaudited)
Real Property Personal Property
Levy Collection
Year Year Taxable 100% Value Taxable 100% Value
2006 2007-08 1,858,042,043$ 2,950,899,982$ -$ -$
2005 2006-07 1,510,070,351 2,419,304,099 - -
2004 2005-06 1,148,316,166 1,868,579,752 - -
2003 2004-05 973,280,228 1,558,524,097 - -
2002 2003-04 881,545,202 1,347,854,822 - -
2001 2002-03 800,649,806 1,217,989,973 742,846 742,846
2000 2001-02 672,278,192 975,065,887 6,503,826 6,503,826
1999 2000-01 555,403,963 826,165,160 7,654,857 7,654,857
1998 1999-00 477,596,640 693,246,007 8,430,119 8,430,119
1997 1998-99 408,170,193 612,369,624 10,398,704 10,398,704
Gas and Electric was broken out of total utilites in fiscal year 2000 due to change in state law.
Gas and Electric is no longer subject to property tax, but instead pay utility replacement tax.
Includes Tax Increment Financing Valuations
Source: County Audtior's Office
90

Railroads & Utilities w/o Gas &
Electric Gas & Electric Total Ratio of Total
Taxable Value to
Taxable 100% Value Taxable 100% Value Taxable 100% Value 100% Value
13,116,350$ 13,116,350$ 11,994,305$ 17,065,329$ 1,883,152,698$ 2,981,081,661$ 63.17%
15,444,126 15,465,927 7,070,342 8,407,740 1,532,584,819 2,443,177,766 62.73%
15,095,138 15,095,138 7,009,675 7,750,790 1,170,420,979 1,891,425,680 61.88%
14,464,885 14,464,885 7,564,751 7,564,751 995,309,864 1,580,553,733 62.97%
12,181,126 12,181,126 7,517,646 7,517,646 901,243,974 1,367,553,594 65.90%
15,058,875 15,106,417 7,526,984 7,526,984 823,978,511 1,241,366,220 66.38%
11,519,941 11,519,941 7,557,884 7,557,884 697,859,843 1,000,647,538 69.74%
15,100,018 15,100,018 - - 578,158,838 848,920,035 68.11%
15,966,459 15,966,459 - - 501,993,218 717,642,585 69.95%
17,249,249 17,249,249 - - 435,818,146 640,017,577 68.09%
91

WAUKEE COMMUNITY SCHOOL DISTRICT
PROPERTY TAX RATES PER $1,000 ASSESSED VALUATION, DIRECT AND OVERLAPPING GOVERNMENTS
Last Ten Fiscal Years
Area XI Ratio
Levy Collection Dallas Dallas Co Community Waukee WCSD
Year Year County Hospital State College City Special CSD Total to Total
City of Waukee
2006 2007-08 7.19259$ 2.96959$ 0.00350$ 0.60276$ 13.50004$ -$ 17.80148$ 42.06996$ 42.314%
2005 2006-07 8.90138 1.13685 0.00400 0.68488 13.50004 - 17.84693 42.07408 42.418%
2004 2005-06 6.15571 0.68223 0.00400 0.68408 13.50039 - 17.84693 38.87334 45.910%
2003 2004-05 6.11761 0.74992 0.00400 0.59856 13.50039 - 17.89346 38.86394 46.041%
2002 2003-04 6.22792 0.78378 0.00400 0.58184 13.50010 - 17.66440 38.76204 45.571%
2001 2002-03 6.27223 0.85556 0.00500 0.54584 13.50032 - 17.66350 38.84245 45.475%
2000 2001-02 6.26865 0.85556 0.00500 0.54454 13.50000 - 17.47522 38.64897 45.215%
1999 2000-01 6.07606 0.61980 0.00500 0.54506 13.50000 - 17.49678 38.24270 45.752%
1998 1999-00 6.70965 0.61981 0.00500 0.52451 14.24965 - 17.63776 39.74638 44.376%
1997 1998-99 6.69435 0.61980 0.00500 0.50551 11.54002 - 16.98053 36.34521 46.720%
City of Clive
2006 2007-08 7.19259$ 2.96959$ 0.00350$ 0.60276$ 9.53783 0.07294$ 17.80148$ 38.1807$ 46.624%
2005 2006-07 8.90138 1.13685 0.00400 0.68488 9.24927 - 17.84693 37.82331 47.185%
2004 2005-06 6.15571 0.68223 0.00400 0.68408 9.24927 - 17.84693 34.62222 51.548%
2003 2004-05 6.11761 0.74992 0.00400 0.59856 8.82714 - 17.89346 34.19069 52.334%
2002 2003-04 6.22792 0.78378 0.00400 0.58184 8.92149 - 17.66440 34.18343 51.675%
2001 2002-03 6.27223 0.85556 0.00500 0.54584 8.96811 - 17.66350 34.31024 51.482%
2000 2001-02 6.26865 0.85556 0.00500 0.54454 8.45221 - 17.47522 33.60118 52.008%
1999 2000-01 6.07606 0.61980 0.00500 0.54506 7.91104 - 17.49678 32.65374 53.583%
1998 1999-00 6.70965 0.61981 0.00500 0.52451 7.91330 - 17.63776 33.41003 52.792%
1997 1998-99 6.69435 0.61980 0.00500 0.50551 7.70014 - 16.98053 32.50533 52.239%
City of Urbandale 7.19259
2006 2007-08 7.19259$ 2.96959$ 0.00350$ 0.60276$ 9.22000$ 0.17216$ 17.80148$ 37.96208$ 46.893%
2005 2006-07 8.90138 1.13685 0.00400 0.68488 9.07393 0.13129 17.84693 37.77926 47.240%
2004 2005-06 6.15571 0.68223 0.00400 0.68408 9.07393 - 17.84693 34.44688 51.810%
2003 2004-05 6.11761 0.74992 0.00400 0.59856 9.07306 0.41222 17.89346 34.84883 51.346%
2002 2003-04 6.22792 0.78378 0.00400 0.58184 9.07000 0.42528 17.66440 34.75722 50.822%
2001 2002-03 6.27223 0.85556 0.00500 0.54584 8.97000 0.41734 17.66350 34.72947 50.860%
2000 2001-02 6.26865 0.85556 0.00500 0.54454 8.96096 0.35432 17.47522 34.46425 50.705%
1999 2000-01 6.07606 0.61980 0.00500 0.54506 8.97000 0.39163 17.49678 34.10433 51.304%
1998 1999-00 6.70965 0.61981 0.00500 0.52451 8.83994 0.42847 17.63776 34.76514 50.734%
1997 1998-99 6.69435 0.61980 0.00500 0.50551 8.49000 0.45088 16.98053 33.74607 50.319%
City of West Des Moines
2006 2007-08 7.19259$ 2.96959$ 0.00350$ 0.60276$ 12.04999$ 0.33240$ 17.80148$ 40.95231$ 43.469%
2005 2006-07 8.90138 1.13685 0.00400 0.68488 11.95000 0.27070 17.84693 40.79474 43.748%
2004 2005-06 6.15571 0.68223 0.00400 0.68408 11.95000 - 17.84693 37.32295 47.818%
2003 2004-05 6.11761 0.74992 0.00400 0.59856 11.72777 - 17.89346 37.09132 48.242%
2002 2003-04 6.22792 0.78378 0.00400 0.58184 11.60021 - 17.66440 36.86215 47.920%
2001 2002-03 6.27223 0.85556 0.00500 0.54584 11.60003 - 17.66350 36.94216 47.814%
2000 2001-02 6.26865 0.85556 0.00500 0.54454 10.90002 - 17.47522 36.04899 48.476%
1999 2000-01 6.07606 0.61980 0.00500 0.54506 10.90000 - 17.49678 35.64270 49.089%
1998 1999-00 6.70965 0.61981 0.00500 0.52451 10.89994 - 17.63776 36.39667 48.460%
1997 1998-99 6.69435 0.61980 0.00500 0.50551 10.90000 - 16.98053 35.70519 47.558%
Source: County Auditor's Office
92

WAUKEE COMMUNITY SCHOOL DISTRICT
TAX RATES BY FUND
Last Ten Fiscal Years
(Unaudited)
Debt
Fiscal Year Genreal Management PPEL Service Total
2007-08 13.04865$ 0.74981$ 1.67000$ 2.33302$ 17.80148$
2006-07 12.93403 0.41838 1.67000 2.78664 17.80905
2005-06 12.37520 0.40943 1.67000 3.39230 17.84693
2004-05 11.82216 0.35527 1.67000 4.04603 17.89346
2003-04 11.69320 0.25168 1.67000 4.04952 17.66440
2002-03 11.97257 0.25115 1.67000 3.75576 17.64948
2001-02 11.50340 0.25244 1.67000 4.03755 17.46339
2000-01 11.49978 0.26197 1.67000 4.05000 17.48175
1999-00 11.40850 0.21313 1.67000 4.05000 17.34163
1998-99 12.25670 0.22386 1.00000 3.49107 16.97163
Source: District records
93

WAUKEE COMMUNITY SCHOOL DISTRICT
COMPARISON OF TAXES AND INTERGOVERNMENTAL REVENUE
Last Ten Fiscal Years
(Unaudited)
Year ended June 30,
2008 2007 2006 2005 2004
Local:
General and special revenue funds 26,294,962$ 21,357,278$ 17,196,267$ 14,255,091$ 12,136,114$
Debt service and capital project funds 9,737,795 9,364,375 7,905,208 7,030,130 4,258,524
36,032,757 30,721,653 25,101,475 21,285,221 16,394,638
Inter-governmental revenues:
State sources 21,804,292 18,700,021 16,110,389 13,424,393 10,926,010
Federal sources 479,500 485,203 437,201 407,377 254,243
22,283,792 19,185,224 16,547,590 13,831,770 11,180,253
Totals 58,316,549$ 49,906,877$ 41,649,065$ 35,116,991$ 27,574,891$
Source: District records
94

Year ended June 30,
2003 2002 2001 2000 1999
11,479,225$ 9,390,499$ 7,813,067$ 6,973,173$ 5,942,738$
3,256,755 5,774,171 3,123,907 2,346,790 1,642,352
14,735,980 15,164,670 10,936,974 9,319,963 7,585,090
9,690,533 8,326,407 7,188,098 6,593,640 5,232,474
207,125 211,068 123,955 97,274 68,096
9,897,658 8,537,475 7,312,053 6,690,914 5,300,570
24,633,638$ 23,702,145$ 18,249,027$ 16,010,877$ 12,885,660$
95

WAUKEE COMMUNITY SCHOOL DISTRICT
TAXABLE ASSESSED VALUATION BY PROPERTY TYPE*
Last Ten Fiscal Years
(Unaudited)
Collection Year 2008 2007 2006 2005 2004
Residential 894,414,446$ 74.8% 736,708,613$ 61.6% 577,276,665$ 59.1% 479,166,040$ 56.7% 416,743,673$ 49.4%
Agricultural 13,510,560 1.1% 13,910,270 1.2% 14,009,200 1.4% 14,475,120 1.7% 22,181,850 2.6%
Commercial 530,841,969 44.4% 418,658,441 35.0% 359,914,916 36.8% 325,193,663 38.5% 250,761,836 29.7%
Industrial 4,865,916 0.4% 4,851,390 0.4% 4,851,390 0.5% 4,718,460 0.6% 4,564,480 0.5%
Personal - 0.0% - 0.0% - 0.0% - 0.0% - 0.0%
Railroads 1,281,039 0.1% 2,545,804 0.2% 2,598,624 0.3% 2,451,043 0.3% 2,334,361 0.3%
Utilities w/o Gas & Electric 11,835,311 1.0% 12,898,322 1.1% 12,496,514 1.3% 12,013,842 1.4% 12,181,126 1.4%
Gas & Electric 11,994,305 1.0% 7,070,342 0.6% 7,009,675 0.7% 7,564,751 0.9% 7,517,646 0.9%
Sub-Total 1,468,743,546 1,196,643,182 978,156,984 845,582,919 716,284,972
(Military Credit) (1,697,358) (1,554,851) (1,190,836) (1,159,353) (1,087,669)
Totals 1,467,046,188$ 1,195,088,331$ 976,966,148$ 844,423,566$ 715,197,303$
* Does not include TIF Valuation
Source: County Auditor and District records
96

2003 2002 2001 2000 1999
385,758,428$ 53.9% 343,169,499$ 52.2% 262,101,456$ 47.3% 231,838,458$ 50.6% 202,424,528$ 47.9%
22,470,600 3.1% 22,591,480 3.4% 22,083,027 3.1% 21,276,910 4.6% 20,673,726 4.9%
221,993,653 31.0% 159,965,881 24.3% 147,944,604 20.7% 141,742,851 30.9% 101,577,343 24.1%
4,452,610 0.6% 4,319,690 0.7% 4,186,760 0.6% 3,969,890 0.9% 3,974,870 0.9%
742,846 0.1% 6,503,826 1.0% 7,654,857 1.1% 8,430,119 1.8% 10,398,704 2.5%
2,084,530 0.3% 1,955,070 0.3% - 0.0% - 0.0% - 0.0%
12,974,345 1.8% 9,564,871 1.5% 15,100,018 2.1% 15,966,459 3.5% 17,249,249 4.1%
7,526,984 1.1% 7,557,884 1.2% - 0.0% - 0.0% - 0.0%
658,003,996 555,628,201 459,070,722 423,224,687 356,298,420
(1,037,120) (1,031,862) (990,820) (947,298) (888,034)
656,966,876$ 554,596,339$ 458,079,902$ 422,277,389$ 355,410,386$
97

WAUKEE COMMUNITY SCHOOL DISTRICT
PRINCIPAL TAXPAYERS IN THE WAUKEE COMMUNITY SCHOOL DISTRICT
June 30, 2008
(Unaudited)
Percent of Total
Taxpayer 2007 Taxable Values Assessed Value
Wells Fargo Home Mortgage, Inc. 194,964,583$ 10.87%
GCP Jordan Creek LLC 174,282,507 9.72%
CCOPILLC 51,790,814 2.89%
Dallas County Partners II 31,640,092 1.76%
West Lakes Development Company 20,419,116 1.14%
Wal-Mart Real Estate Business Trust 15,578,143 0.87%
Northwood Village Ltd 14,635,593 0.82%
Sherman Hills Real Estate Partnership LLP 14,600,478 0.81%
Moody National M Des Moines IA, LLC 13,787,569 0.77%
Dallas County Partners 13,361,239 0.75%
Total 545,060,134$
Total Taxable Assessed Value 1,792,848,425$
98

WAUKEE COMMUNITY SCHOOL DISTRICT
COMPARATIVE RATIO OF GENERAL BONDED DEBT TO ASSESSED VALUE AND BONDED DEBT PER CAPITA
Last Ten Fiscal Years
(Unaudited)
100% Debt to
Fiscal Year Actual Legal Debt Assessed Debt per
of Collection Population* Value Limit(5%) Indebtedness Value Capita
2007-08 37,750 2,981,081,661$ 149,054,083$ 89,345,000$ 3.00% 2,367$
2006-07 30,650 2,443,177,766 122,158,888 89,590,000 3.67% 2,923
2005-06 23,678 1,891,425,680 94,571,284 64,825,000 3.43% 2,738
2004-05 22,428 1,580,553,733 79,027,687 56,675,000 3.59% 2,527
2003-04 15,500 1,367,553,594 68,377,680 52,195,000 3.82% 3,367
2002-03 14,607 1,241,366,220 62,068,311 44,640,000 3.60% 3,056
2001-02 13,780 1,000,647,538 50,032,377 35,060,000 3.50% 2,544
2000-01 13,000 848,920,035 42,446,002 29,375,000 3.46% 2,260
1999-00 12,264 717,642,585 35,882,129 26,790,000 3.73% 2,184
1998-99 11,570 640,017,577 32,000,879 23,000,000 3.59% 1,988
* District populations estimated from 2000 Census.
Source: District Records
99

WAUKEE COMMUNITY SCHOOL DISTRICT
RATION OF ANNUAL DEBT SERVICE EXPENDITURES FOR GENERAL BONDED DEBT
TO TOTAL GENERAL FUND EXPENDITURES
Last Ten Fiscal Years
(Unaudited)
Year ended
June 30, Principal Interest Total Debt Service Total Expenditures *
Ratio of Debt
Service to Total
Expenditures
2006-07 13,215,000$ 3,097,409$ 16,312,409 41,081,400$ 39.71%
2005-06 7,385,000 3,166,074 10,551,074 34,311,684 30.75%
2004-05 7,640,000 2,324,006 9,964,006 25,161,933 39.60%
2003-04 1,620,000 1,983,926 3,603,926 21,123,109 17.06%
2002-03 2,155,000 1,773,021 3,928,021 18,337,959 21.42%
2001-02 1,315,000 1,515,146 2,830,146 16,349,386 17.31%
2000-01 955,000 1,378,872 2,333,872 14,279,896 16.34%
1999-00 870,000 1,148,125 2,018,125 12,220,417 16.51%
1998-99 675,000 984,923 1,659,923 10,549,191 15.74%
1997-98 560,000 862,095 1,422,095 9,084,867 15.65%
Source: District records
100

WAUKEE COMMUNITY SCHOOL DISTRICT
COMPUTATION OF OVERLAPPING AND DIRECT DEBT
As of June 30, 2008
(Unaudited)
Taxable Valuation Percent in G. O. Waukee CSD
Taxable Valuation Within District District Debt Share of the Debt
Dallas County 3,289,325,172$ 2,161,335,943$ 65.71% 17,840,000$ 11,722,232$
City of Waukee 467,323,747 464,442,743 99.38% 26,051,237 25,890,634
City of Clive 1,139,461,736 207,810,987 18.24% 45,625,000 8,320,926
City of Grimes 325,132,546 50,541 0.02% 8,980,000 1,396
City of Urbandale 2,216,391,458 269,986,070 12.18% 44,370,000 5,404,858
City of West Des Moines 3,820,324,623 1,159,290,576 30.35% 123,389,079 37,442,838
Area XI Des Moines Area Community College 31,982,412,298 2,161,335,943 6.76% 82,815,000 5,596,546
Total District Share of Overlapping Debt 349,070,316$ 94,379,430$
Direct, Waukee Community School District:
General Obligation 100.00% 60,370,000$ 60,370,000$
Sales Tax Revenue Bonds 100.00% 16,400,000 16,400,000
Capital Loan Notes 100.00% 12,575,000 12,575,000
Total District Direct Debt 89,345,000$ 89,345,000$
Source: District records, County Auditor's office, City of Waukee, City of Clive, City of Grimes, City of Urbandale,
City of West Des Moines, Area XI Des Moines Area Community College.
101

WAUKEE COMMUNITY SCHOOL DISTRICT
LEGAL DEBT MARGIN INFORMATION
Last Ten Fiscal Years
(Unaudited)
Year ended June 30,
2008 2007 2006 2005 2004
Assessed value of property 2,981,081,661$ 2,443,177,766$ 1,891,425,600$ 1,580,553,733$ 1,367,553,594$
Debt limit-5% of 100% assessed value 149,054,083 122,158,888 94,571,280 79,027,687 68,377,680
Amount of debt applicable to debt limit:
General obligation bonds 60,370,000 56,785,000 54,445,000 55,945,000 52,195,000
Sales tax revenue bonds 16,400,000 18,900,000
Capital loan notes 12,575,000 13,905,000 15,000,000 730,000 1,425,000
Total debt applicable to debt limit 89,345,000 89,590,000 69,445,000 56,675,000 53,620,000
Legal debt margin 59,709,083 32,568,888 25,126,280 22,352,687 14,757,680
Legal debt margin as a percentage of debt limit 40.06% 26.66% 26.57% 28.28% 21.58%
Source: District Records
102

Year ended June 30,
2003 2002 2001 2000 1999
1,241,366,220$ 1,000,646,538$ 848,920,035$ 717,642,585$ 640,017,577$
62,068,311 50,032,327 42,446,002 35,882,129 32,000,879
44,640,000 35,060,000 29,375,000 26,790,000 23,000,000
2,095,000 2,735,000 - 1,070,000 1,225,000
46,735,000 37,795,000 29,375,000 27,860,000 24,225,000
15,333,311 12,237,327 13,071,002 8,022,129 7,775,879
24.70% 24.46% 30.79% 22.36% 24.30%
103

WAUKEE COMMUNITY SCHOOL DISTRICT
GENERAL ANALYSIS OF FACILITIES, CLASSROOMS AND STAFFING
June 30, 2008
(Unaudited)
Name of School Dates of Construction Grades Served
Elementary Schools:
Waukee 1917, 1957, 1974, 1979, 1987, 1999 PK-5 and Special Education
Brookview 2001, 2002, 2004 K-5 and Special Education
Eason 1994, 2002 K-5 and Special Education
Walnut Hills 2005 PK-5 and Special Education
Maple Grove 2007 PK-5 and Special Education
Waukee Middle School 1974, 1977, 1987, 1994, 6-7 and Special Education
1997, 1999, 2008
Prairieview 8-9 Building 2004 8-9 and Special Education
Waukee High School 1997, 2000, 2001, 2007 10-12 and Special Education
District Wide
Other facilities - non-student occupancy:
YMCA 2000, 2001
Waukee Elementary Annex 1932, 1995
District Administration 2003, 2007
District Central Receiving/Transportation Facility 2003
Source: District records
104

Building
Served
Enrollment Certified Pupil/Teacher Number of Teaching
Sept. 2008 Staff Ratio Classrooms Sections
643 48.0 13.40 38 33
676 41.0 16.49 25 27
609 37.3 16.35 30 27
779 42.0 18.55 37 30
669 36.0 18.58 37 24
3,376 204.3 16.53 167 141
882 62.3 14.15 39 -
694 54.7 12.69 46 -
926 66.160 14.00 77 -
5,878 387.420 15.17 329 141
105

WAUKEE COMMUNITY SCHOOL DISTRICT
DISTRICT STAFFING LEVELS
Last Ten Fiscal Years
(Unaudited)
2008 2007 2006 2005 2004 2003 2002 2001 2000 1999
Administration:
Superintendent 1.0 1.0 1.0 1.0 1.0 1.0 1.0 1.0 1.0 1.0
Principal 8.0 7.0 6.0 5.0 5.0 5.0 5.0 4.0 4.0 4.0
Associate Principal 2.0 2.0 4.0 3.0 1.0 -
Other Administrators 6.0 6.0 4.0 5.0 5.0 3.0 3.0 3.0 3.0 3.0
Total Administration 17.0 16.0 15.0 14.0 12.0 9.0 9.0 8.0 8.0 8.0
Other Professionals - 0.6 1.0 1.0 2.0 2.0
Instruction:
Teacher 357.44 318.33 288.5 258.6 229.1 207.7 192.5 165.7 143.3 134.5
Curriculum Specialist 2.0 2.0 2.0 2.0 1.0 1.0
Counselor 17.0 15.0 14.0 13.0 11.0 11.0 10.0 9.0 8.0 7.0
Title I 2.0 2.0 1.5 1.5 1.0
Media Specialist 7.0 7.0 6.0 5.0 5.0 5.0 5.0 3.0 3.0 3.0
Total Instruction 385.44 344.33 312.0 280.1 247.1 224.7 207.5 177.7 154.3 144.5
Professional, Other:
Nurse 9.0 7.0 7.0 6.5 4.8 4.8 4.8 4.0 3.5 3.3
Other Professional 9.5 8.5 6.5 6.1 5.0 4.0 3.8 2.0 1.0 1.0
Total Professional, Other 18.5 15.5 13.5 12.6 9.8 8.8 8.5 6.0 4.5 4.3
Support Personnel:
Office/Clerical 28.0 26.0 23.0 20.0 16.9 15.8 12.3 14.5 12.5 9.0
Crafts/Trades 4.0 4.0 2.0 1.0 1.0 1.0 1.0 1.0 1.0
Teacher Associates 96.500 84.601 63.3 61.7 56.9 42.2 42.8 37.5 32.0 26.2
Other Support Personnel 72.300 61.719 57.3 57.1 57.1 39.4 40.0 21.0 20.5 16.7
Total Support Personnel 200.8 176.3 145.7 139.8 131.9 98.4 96.0 74.0 66.0 51.9
Totals 621.7 552.2 486.2 446.4 400.8 341.5 322.0 266.7 234.8 210.7
Source: District records
106

WAUKEE COMMUNITY SCHOOL DISTRICT
DISTRICT AND AREA UNEMPLOYMENT RATES
Last Ten Fiscal Years
(Unaudited)
Dallas County
Year Ended June 30, Des Moines Area
Median
Household
Income
Average
Household
Income
Per Capita
Income State of Iowa
Per Capita
Income
2008 4.1% 4.6%
2007 3.1% 3.4%
2006 2.9% 59,435$ 74,925$ 29,144$ 3.6% 33,236$
2005 4.0% 4.8%
2004 4.1% 4.1%
2003 3.6% 4.2%
2002 3.4% 4.0%
2001 2.1% 3.3%
2000 2.0% 2.6%
1999 1.9% 2.5%
Source: Iowa Workforce Development, ESRI, US Bureau of the Census of Population and Housing,
US Bureau of Economic Analysis.
Data for 2006 is the latest data available.
107
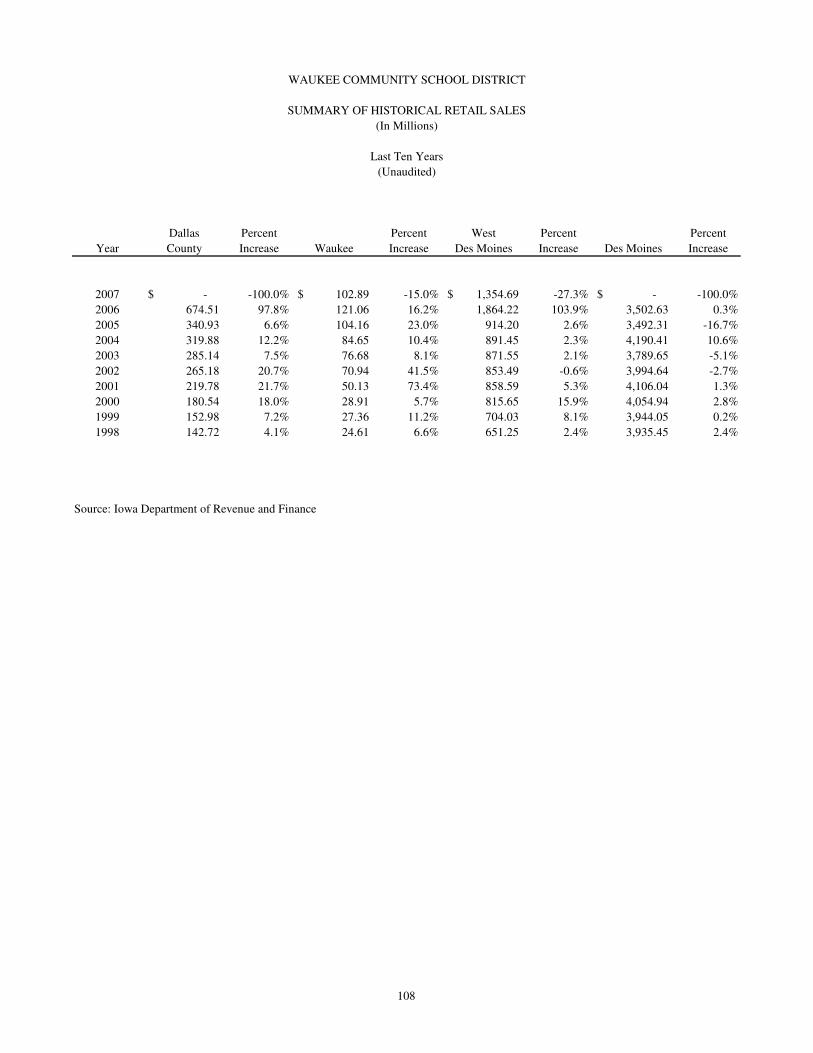
WAUKEE COMMUNITY SCHOOL DISTRICT
SUMMARY OF HISTORICAL RETAIL SALES
(In Millions)
Last Ten Years
(Unaudited)
Dallas Percent Percent West Percent Percent
Year County Increase Waukee Increase Des Moines Increase Des Moines Increase
2007 -$ -100.0% 102.89$ -15.0% 1,354.69$ -27.3% -$ -100.0%
2006 674.51 97.8% 121.06 16.2% 1,864.22 103.9% 3,502.63 0.3%
2005 340.93 6.6% 104.16 23.0% 914.20 2.6% 3,492.31 -16.7%
2004 319.88 12.2% 84.65 10.4% 891.45 2.3% 4,190.41 10.6%
2003 285.14 7.5% 76.68 8.1% 871.55 2.1% 3,789.65 -5.1%
2002 265.18 20.7% 70.94 41.5% 853.49 -0.6% 3,994.64 -2.7%
2001 219.78 21.7% 50.13 73.4% 858.59 5.3% 4,106.04 1.3%
2000 180.54 18.0% 28.91 5.7% 815.65 15.9% 4,054.94 2.8%
1999 152.98 7.2% 27.36 11.2% 704.03 8.1% 3,944.05 0.2%
1998 142.72 4.1% 24.61 6.6% 651.25 2.4% 3,935.45 2.4%
Source: Iowa Department of Revenue and Finance
108

WAUKEE COMMUNITY SCHOOL DISTRICT
PRINCIPAL EMPLOYERS IN THE DISTRICT
Current year and 11 years ago
(Unaudited)
Presented below is a list of employers located within the Waukee Community School District, the type of business
conducted and an approximate number of employees for each.
2008 1997
District Employers Product/Service Employees % of Total Employees % of Total
Wells Fargo Mortgage & Financial Financial 3,247 32.8% -
Hy-Vee Food Supplier 1,500 15.2% -
West Des Moines School Education 1,200 12.1% -
Iowa Farm Bureau Agriculture 1,117 11.3% -
Marsh Insurance Benefit Insurance 950 9.6% -
Guide One Insurance 642 6.5% -
Iowa Foundation for Medical Care Insurance 623 6.3% -
Waukee Community School District Education 622 6.3% 200 100.0%
Total 9,901 200
2008 1997
Larger employers in the area Product/Service Employees % of Total Employees % of Total
Principal Financial Group Insurance 7,600 17.0% 17,501 36.7%
State of Iowa Government 6,749 15.1% 7,500 15.7%
United State Government Government 6,100 13.7% 6,000 12.6%
Iowa Health System Health Care 4,018 9.0% - -
Des Moines Ind. School District Education 5,325 11.9% 4,662 9.8%
Communication Data Service, Inc Data Entry 1,200 2.7% - -
Mercy Hospital Medical Center Health Care 6,200 13.9% 4,650 9.7%
United Parcel Service Delivery 1,600 3.6% 2,183 4.6%
Wellmark Blue Cross Blue Shield Insurance 2,066 4.6% 1,755 3.7%
Bridgestone-Firestone Manufacturing 1,800 4.0% 2,500 5.2%
Pioneer Hybrid Agricultural Sales 2,000 4.5% 950 2.0%
Total 44,658 47,701
Source: City Chambers of Commerce
109

WAUKEE COMMUNITY SCHOOL DISTRICT
DISTRICT POPULATION
June 30, 2008
(Unaudited)
Census Year Waukee Clive Urbandale West Des Moines
1980 2,227 6,064 17,869 21,894
1990 2,512 7,462 23,500 31,702
2000 5,126 12,855 29,072 46,403
Source: City Chambers of Commerce
110

WAUKEE COMMUNITY SCHOOL DISTRICT
CERTIFIED RESIDENT STUDENT ENROLLMENT BY GRADE
Last Ten Fiscal Years
(Unaudited)
Grade 2008 2007 2006 2005 2004 2003 2002 2001 2000 1999
PK 24 29 26 22 26 24 14 14 * *
K 595 555 549 522 433 445 321 327 259 243
1 568 577 544 459 467 350 346 276 239 187
2 584 549 480 486 368 377 296 255 198 189
3 570 507 499 390 403 319 262 222 204 190
4 513 510 413 423 347 276 241 215 222 161
5 522 427 446 362 297 260 233 230 165 163
6 431 449 376 310 292 244 256 185 182 155
7 451 367 319 316 260 265 199 192 175 157
8 378 321 324 265 274 224 220 188 168 154
9 316 317 273 296 234 244 189 179 165 146
10 308 283 319 252 263 198 190 174 150 142
11 304 313 262 268 198 202 182 165 153 123
12 321 254 268 219 206 198 163 146 121 110
District Served Enrollment 5885.0 5458.0 5098.0 4590.0 4068.0 3626.0 3112.0 2768.0 2401.0 2120.0
Open Enrollment/Tuition In 175.0 199.0 219 232 225 236 237.0 186 141 159
Open Enrollment/Tuition Out 257.4 229.3 196.6 170 187.1 172.8 148.7 131.8 125.4 122
(includes Home & Alt. School Students)
Certified Resident Enrollment 5,967.4 5,488.3 5,075.6 4,528.0 4,030.1 3,562.8 3,023.7 2,713.8 2,385.4 2,083.0
* No Data Available
Source: District Records
111

WAUKEE COMMUNITY SCHOOL DISTRICT
OPERATING COST PER PUPIL
Last Ten Fiscal Years
(Unaudited)
Daily Operating Cost
Fiscal Year Total Costs* Membership per Pupil
2007-08 41,081,400$ 5,441 7,550$
2006-07 34,311,684 5,065 6,774
2005-06 29,592,960 4,617 6,410
2004-05 25,161,933 4,058 6,201
2003-04 21,123,109 3,685 5,732
2002-03 18,337,958 3,138 5,844
2001-02 16,349,386 2,801 5,837
2000-01 14,279,896 2,461 5,802
1999-00 12,220,417 2,160 5,658
1998-99 10,549,191 1,840 5,733
*Includes only General Fund expenditures.
Source: District records
112

WAUKEE COMMUNITY SCHOOL DISTRICT
IOWA SCHOOL ANTICIPATION PROGRAM (ISCAP)
Last Ten Fiscal Years
(Unaudited)
Principal of
Year Ended June 30, Certificates Issued
2007-08 -$
2006-07 -
2005-06 -
2004-05 -
2003-04 -
2002-03 2,275,000
2001-02 2,049,000
2000-01 1,433,000
1999-00 945,000
1998-99 865,000
Source: District records
113


WAUKEE COMMUNITY SCHOOL DISTRICT
SCHEDULE OF EXPENDITURES OF FEDERAL AWARDS
Year ended June 30, 2008
CFDA Grant
Grantor/Program Number Number Expenditures
Indirect:
U.S. Department of Agriculture:
Iowa Department of Education:
Food Distribution (non-cash) 10.550 FY 08 104,414$
School Nutrition Cluster Programs:
School Breakfast Program 10.553 FY 08 45,432
National School Lunch Program 10.555 FY 08 331,530
376,962
U.S. Department of Education:
Iowa Department of Education:
Title I Grants to Local Educational Agencies 84.010 FY 08 144,196
Vocational Education - Basic Grants to States 84.048 FY 08 18,750
Safe and Drug-Free Schools and Communities-
State Grants 84.184 FY 08 10,658
Grants for State Assessments and Related Activities 84.369 FY 08 35,252
Heartland Area Education Agency
Special Education - Grants to States 84.027 FY 08 255,455
Total 945,687$
of the Waukee Community School District and is presented on the accrual or modified accrual basis of
accounting. The information on this schedule is presented in accordance with the requirements of OMB Circular
A-133, Audits of States, Local Governments, and Non-Profit Organizations. Therefore, some amounts presented
in this schedule may differ from amounts presented in, or used in the preparation of, the basic financial statements.
See accompanying independent auditor's report.
Basis of Presentation - The Schedule of Expenditures of Federal Awards includes the federal grant activity
117

118

119
Independent Auditor's Report on Internal Control over
Financial Reporting and on Compliance and Other Matters Based on an Audit of Financial Statements Performed in Accordance with
Government Auditing Standards To the Board of Education of Waukee Community School District: We have audited the accompanying financial statements of the governmental activities, the business type activities, each major fund and the aggregate remaining fund information of the Waukee Community School District, Waukee, Iowa, as of and for the year ended June 30, 2008, which collectively comprise the District’s basic financial statements listed in the table of contents and have issued our report thereon dated January 9, 2009. We conducted our audit in accordance with U.S. generally accepted auditing standards and the standards applicable to financial audits contained in Government Auditing Standards, issued by the Comptroller General of the United States. Internal Control Over Financial Reporting In planning and performing our audit, we considered Waukee Community School District’s internal control over financial reporting as a basis for designing our auditing procedures for the purpose of expressing our opinions on the financial statements, but not for the purpose of expressing our opinion on the effectiveness of Waukee Community School District’s internal control over financial reporting. Accordingly, we do not express an opinion on the effectiveness of Waukee Community School District’s internal control over financial reporting.
Our consideration of internal control over financial reporting was for the limited purpose described in the preceding paragraph and would not necessarily identify all deficiencies in internal control over financial reporting that might be significant deficiencies or material weaknesses. We identified no deficiencies in internal control over financial reporting that we consider to be significant deficiencies and no deficiencies we consider to be material weaknesses.
A control deficiency exists when the design or operation of the control does not allow management or employees, in the normal course of performing their assigned functions, to prevent or detect misstatements on a timely basis. A significant deficiency is a control deficiency, or combination of control deficiencies, that adversely affects Waukee Community School District’s ability to initiate, authorize, record, process, or report financial data reliably in accordance with U.S. generally accepted accounting principles such that there is more than a remote likelihood a misstatement of Waukee Community School District’s financial statements that is more than inconsequential will not be prevented or detected by Waukee Community School District’s internal control.
A material weakness is a significant deficiency, or combination of significant deficiencies that results in more than a remote likelihood a material misstatement of the financial statements will not be prevented or detected by Waukee Community School District’s internal control.
705 Main St.Pella, IA 50219641-628-3737

120
Our consideration of the internal control over financial reporting was for the limited purpose described in the first paragraph of this section and would not necessarily identify all deficiencies in the internal control that might be significant deficiencies and, accordingly, would not necessarily disclose all significant deficiencies that are also considered to be material weaknesses.
Compliance and Other Matters As part of obtaining reasonable assurance about whether Waukee Community School District’s financial statements are free of material misstatement, we performed tests of its compliance with certain provisions of laws, regulations, contracts and grant agreements, non-compliance with which could have a direct and material effect on the determination of financial statement amounts. However, providing an opinion on compliance with those provisions was not an objective of our audit and, accordingly, we do not express such an opinion. The results of our tests disclosed no instances of non-compliance or other matters that are required to be reported under Government Auditing Standards. However, we noted certain immaterial instances of non-compliance or other matters that are described in Part IV of the accompanying Schedule of Findings and Questioned Costs.
Comments involving statutory and other legal matters about the District’s operations for the year ended June 30, 2008 are based exclusively on knowledge obtained from procedures performed during our audit of the financial statements of the District. Since our audit was based on tests and samples, not all transactions that might have had an impact on the comments were necessarily audited. The comments involving statutory and other legal matters are not intended to constitute legal interpretations of those statutes.
Waukee Community School District’s responses to findings identified in our audit are described in the accompanying Schedule of Findings and Questioned Costs. While we have expressed our conclusions on the District’s responses, we did not audit Waukee Community School District’s responses and, accordingly, we express no opinion on them.
This report, a public record by law, is intended solely for the information and use of the officials, employees and citizens of Waukee Community School District and other parties to whom Waukee Community School District may report, including federal awarding agencies and pass-through entities. This report is not intended to be and should not be used by anyone other than these specified parties. We would like to acknowledge the many courtesies and assistance extended to us by personnel of Waukee Community School District during the course of our audit. Should you have any questions concerning any of the
above matters, we shall be pleased to discuss them with you at your convenience.
Van Maanen & Associates, P.C. Certified Public Accountants January 9, 2009
121
Independent Auditor's Report on Compliance with Requirements Applicable to Each Major Program and on Internal Control over Compliance
in Accordance with OMB Circular A-133
To the Board of Education of Waukee Community School District: Compliance We have audited the compliance of Waukee Community School District with the types of compliance requirements described in U.S. Office of Management and Budget (OMB) Circular A-133 Compliance Supplement that are applicable to each of its major federal programs for the year ended June 30, 2008. Waukee Community School District's major federal programs are identified in Part I of the accompanying Schedule of Findings and Questioned Costs. Compliance with the requirements of laws, regulations, contracts and grant agreements applicable to each of its major federal programs is the responsibility of Waukee Community School District's management. Our responsibility is to express an opinion on Waukee Community School District's compliance based on our audit. We conducted our audit of compliance in accordance with U.S. generally accepted auditing standards, the standards applicable to financial audits contained in Government Auditing Standards, issued by the Comptroller General of the United States, and OMB Circular A-133, Audits of States, Local Governments, and Non-Profit
Organizations. Those standards and OMB Circular A-133 require that we plan and perform the audit to obtain reasonable assurance about whether non-compliance with the types of compliance requirements referred to above that could have a direct and material effect on a major federal program occurred. An audit includes examining, on a test basis, evidence about Waukee Community School District's compliance with those requirements and performing such other procedures as we considered necessary in the circumstances. We believe our audit provides a reasonable basis for our opinion. Our audit does not provide a legal determination on Waukee Community School District's compliance with those requirements. In our opinion, Waukee Community School District complied, in all material respects, with the requirements referred to above that are applicable to each of its major federal programs for the year ended June 30, 2008. Internal Control Over Compliance The management of Waukee Community School District is responsible for establishing and maintaining effective internal control over compliance with requirements of laws, regulations, contracts and grant agreements applicable to federal programs. In planning and performing our audit, we considered Waukee Community School District’s internal control over compliance with requirements that could have a direct and material effect on a major federal program in order to determine our auditing procedures for the purpose of expressing our opinion on compliance, but not for the purpose of expressing an opinion on the effectiveness of internal control over compliance. Accordingly, we do not express an opinion on the effectiveness of Waukee Community School District’s internal control over compliance.
705 Main St.Pella, IA 50219641-628-3737

122
Our consideration of internal control over compliance was for the limited purpose described in the preceding paragraph and would not necessarily identify all deficiencies in the District’s internal control that might be significant deficiencies or material weaknesses as defined below. We identified no deficiency in internal control over compliance that we consider to be a material weakness.
A control deficiency in the District’s internal control over compliance exists when the design or operation of a control does not allow management or employees, in the normal course of performing their assigned functions, to prevent or detect noncompliance with a type of compliance requirement of a federal program on a timely basis. A significant deficiency is a control deficiency, or combination of control deficiencies, that adversely affects the District’s ability to administer a federal program such that there is more than a remote likelihood noncompliance with a type of compliance requirement of a federal program that is more than inconsequential will not be prevented or detected by the District’s internal control.
A material weakness is a significant deficiency, or combination of significant deficiencies, that results in more than a remote likelihood material noncompliance with a type of compliance requirement of a federal program will not be prevented or detected by the District’s internal control. We noted no deficiency in internal control over compliance that we consider to be a material weakness.
Waukee Community School District’s responses to the findings identified in our audit are described in the accompanying Schedule of Findings and Questioned Costs. While we expressed our conclusions on the District’s responses, we did not audit Waukee Community School District’s responses and, accordingly, we express no opinion on them.
This report, a public record by law, is intended solely for the information and use of the officials, employees and citizens of Waukee Community School District and other parties to whom Waukee Community School District may report, including federal awarding agencies and pass-through entities. This report is not intended to be and should not be used by anyone other than these specified parties.
Van Maanen & Associates, P.C. Certified Public Accountants January 9, 2009

WAUKEE COMMUNITY SCHOOL DISTRICT
SCHEDULE OF FINDINGS AND QUESTIONED COSTS
Year ended June 30, 2008
123
Part I: Summary of the Independent Auditor’s Results (a) Unqualified opinions were issued on the financial statements. (b) No significant deficiencies in internal control over financial reporting were disclosed by the audit of the
financial statements, including material weaknesses. (c) The audit did not disclose any non-compliance which is material to the financial statements. (d) No significant deficiencies in internal control over the major programs were disclosed by the audit of
the financial statements. (e) An unqualified opinion was issued on compliance with requirements applicable to each major program. (f) The audit disclosed no audit findings which were required to be reported in accordance with Office of
Management and Budget Circular A-133, Section .510(a). (g) Major programs were as follows: - CFDA Number 84.010 – Title I Grants to Local Educational Agencies - Clustered programs: - CFDA Number 10.553 - School Breakfast Program - CFDA Number 10.555 - National School Lunch Program (h) The dollar threshold used to distinguish between Type A and Type B programs was $300,000. (i) Waukee Community School District qualified as a low-risk auditee. Part II: Findings Related to the Financial Statements INSTANCES OF NON-COMPLIANCE No matters were noted. SIGNIFICANT DEFICIENCIES No matters were noted. Part III: Findings and Questioned Costs for Federal Awards INSTANCES OF NON-COMPLIANCE No matters were noted.
SIGNIFICANT DEFICIENCIES
No matters were noted.

WAUKEE COMMUNITY SCHOOL DISTRICT
SCHEDULE OF FINDINGS AND QUESTIONED COSTS
Year ended June 30, 2008
124
Part IV: Other Findings Related to Required Statutory Reporting IV-A-08 Certified Budget - Expenditures for the year ended June 30, 2008, exceeded the amended certified
budget amounts in the instruction function. Recommendation – The certified budget should have been amended in accordance with Chapter
24.9 of the Code of Iowa before expenditures were allowed to exceed the budget. Response – Future budgets will be amended in sufficient amounts to ensure the certified budget is
not exceeded. Conclusion – Response accepted. IV-B-08 Questionable Expenditures - No expenditures were noted that may not meet the requirements of
public purpose as defined in an Attorney General’s opinion dated April 25, 1979. IV-C-08 Travel Expense - No expenditures of District money for travel expenses of spouses of District
officials or employees were noted. No travel advances to District officials or employees were noted. IV-D-08 Business Transactions - No business transactions between the District and District officials or
employees were noted. IV-E-08 Bond Coverage - Surety bond coverage of District officials and employees is in accordance with
statutory provisions. The amount of coverage should be reviewed annually to ensure that coverage is adequate for current operations.
IV-F-08 Board Minutes - No transactions were noted requiring Board approval which had not been
approved by the Board. IV-G-08 Certified Enrollment - No variances were noted in the basic enrollment data certified to the
Department of Education. IV-H-08 Deposits and Investments - No instances of noncompliance were noted with the deposit and
investment provisions of Chapter 12B and 12C of the Code of Iowa and the District’s investment policy.
IV-I-08 Certified Annual Report - The Certified Annual Report was filed with the Department of Education
timely and we noted no significant deficiencies in the amounts reported.