
Comprehensive Annual Financial Report City of Dayton, Ohio
200
Transcript of Comprehensive Annual Financial Report City of Dayton, Ohio

City of Dayton, Ohio Comprehensive Annual Financial Report January 1, 2009 • December 31, 2009

The Five Stars represent the fi ve members of the Dayton City Commission. The largest star in the center is elevated to designate the Mayor.
The Star in the center of the crest represents Dayton’s City Manager and highlights the city manager form of government.
Nan Whaley
Commissioner
Joey D. Williams
Commissioner
Gary D. Leitzell
Mayor
Dean Lovelace
Commissioner
Matt Joseph
Commissioner
Timothy H. Riordan
City Manager

CITY OF DAYTON, OHIO Comprehensive Annual Financial Report For the Year Ended December 31, 2009 PREPARED BY: Department of Finance Cheryl J. Garrett, Director Bejoy John, Deputy Finance Director Candy H. Carr, Financial Services Supervisor
MISSION STATEMENT as stewards of the public trust,
our mission is to provide leadership,
excellent services and participatory government
to enhance the quality of life and
sense of community for all who live, work,
raise families, or conduct business in Dayton.

The Gear is a icon for Dayton’s manufacturing and inventions. Dayton holds more patents than any other City.
Dayton seems to be moving from the manufacturing industry of yesteryear, to becoming a force in the high-tech global information technologies marketplace.
INT
RO
DU
CT
OR
Y

THIS PAGE IS INTENTIONALLY LEFT BLANK

I 1
CITY OF DAYTON, OHIO
COMPREHENSIVE ANNUAL FINANCIAL REPORT FOR THE YEAR ENDED DECEMBER 31, 2009
Table of Contents
Title Page INTRODUCTORY SECTION Table of Contents . . . . . . . . . . . . . . . . . . . . . . . . . . . . . . . . . . . . . . . . . . . . . . . . . . . . . . . . . . . I 1-4 Letter of Transmittal . . . . . . . . . . . . . . . . . . . . . . . . . . . . . . . . . . . . . . . . . . . . . . . . . . . . . . . . I 5-8 Organization of the City of Dayton . . . . . . . . . . . . . . . . . . . . . . . . . . . . . . . . . . . . . . . . . . . . . . . . I 9 List of Elected and Appointed Officials. . . . . . . . . . . . . . . . . . . . . . . . . . . . . . . . . . . . . . . . . . . I 10 Certificate of Achievement for Excellence in Financial Reporting. . . . . . . . . . .
. . . . . . . . . . . . . . . . . . I 11
FINANCIAL SECTION Independent Auditors’ Report . . . . . . . . . . . . . . . . . . . . . . . . . . . . . . . . . . . . . . . . . . . . . . F 1-2 Management’s Discussion and Analysis . . . . . . . . . . . . . . . . . . . . . . . . . . . . . . . . . . . . . . . . F 3-26 Basic Financial Statements: Government-wide Financial Statements: Statement of Net Assets . . . . . . . . . . . . . . . . . . . . . . . . . . . . . . . . . . . . . . . . . . . . . . F 28-29 Statement of Activities . . . . . . . . . . . . . . . . . . . . . . . . . . . . . . . . . . . . . . . . . . . . . . F 30-31
Fund Financial Statements: Balance Sheet - Governmental Funds . . . . . . . . . . . . . . . . . . . . . . . . . . . . . . . . . . . . . . F 32
Reconciliation of Total Governmental Fund Balances to Net Assets of Governmental Activities. . . . . . . . . . . . . . . . . . . . . . . . . . . . . . . . . . . . . . . . . . .
F 33
Statement of Revenues, Expenditures and Changes in Fund Balances - Governmental Funds . . . . . . . . . . . . . . . . . . . . . . . . . . . . . . . . . . . . . .
F 34
Reconciliation of the Statement of Revenues, Expenditures and Changes in Fund Balances of Governmental Funds to the Statement of Activities. . . . . . . . . . . . . . . . . . . . . .
F 35
Statement of Revenues, Expenditures and Changes in
Fund Balance - Budget and Actual (Non-GAAP Budgetary Basis) - General Fund . . . . . . . . . . . . . . . . . . . . . . . . . . . . . . . . . . . . . . . . . . . . . . . . . . F 36 Statement of Net Assets - Proprietary Funds . . . . . . . . . . . . . . . . . . . . . . . . . . . . . . . . . . . F 38-41 Statement of Revenues, Expenses and Changes in Net Assets - Proprietary Funds . . . . . . . . . . . . . . . . . . . . . . . . . . . . . . . . . . . . . . . . . F 42-43 Statement of Cash Flows - Proprietary Funds . . . . . . . . . . . . . . . . . . . . . . . . . . . . . . . . . . F 44-47 Statement of Fiduciary Assets and Liabilities - Agency Funds. . . . . . . . . . . . . . . . . . . . . . . . . . F 48
Index of Notes to the Basic Financial Statements . . . . . . . . . . . . . . . . . . . . . . . . . . . . . . . . . F 49-50
Notes to the Basic Financial Statements. . . . . . . . . . . . . . . . . . . . . . . . . . . . . . . . . . . . . . . F 51-100

I 2
CITY OF DAYTON, OHIO
COMPREHENSIVE ANNUAL FINANCIAL REPORT FOR THE YEAR ENDED DECEMBER 31, 2009
Table of Contents
(Continued)
Combining Statements and Individual Fund Schedules: Combining Statements - Nonmajor Governmental Funds Fund Descriptions . . . . . . . . . . . . . . . . . . . . . . . . . . . . . . . . . . . . . . . . . . . . . . . F 103 Schedule of Revenues, Expenditures and Changes in Fund Balance - Budget and Actual (Non-GAAP Budgetary Basis) - General Fund . . . . . . . . . . . . . . . . . . . .F 104 Combining Balance Sheet - Nonmajor Governmental Funds . . . . . . . . . . . . . . . . . . . . . . . . F 105 Combining Statement of Revenues, Expenditures and Changes in Fund Balances - Nonmajor Governmental Funds . . . . . . . . . . . . . . . . . . . . . . . . . . . . . F 106 Combining Balance Sheet - Nonmajor Special Revenue Funds . . . . . . . . . . . . . . . . . . . .F 108-109
Combining Statement of Revenues, Expenditures and Changes in Fund Balances - Nonmajor Special Revenue Funds . . . . . . . . . . . . . . . . . . . . . . . . . . . . F 110-111
Schedule of Revenues, Expenditures, and Changes in Fund Balance -
Budget and Actual (Non-GAAP Budgetary Basis) - Street Fund. . . . . . . . . . . . . . . . . . . . . . .F 112
Schedule of Revenues, Expenditures, and Changes in Fund Balance - Budget and Actual (Non-GAAP Budgetary Basis) –
Highway Maintenance Fund. . . . . . . . . . . . . . . . . . . . . . . . . . . . . . . . . . . . . . . . .F 113
Schedule of Revenues, Expenditures, and Changes in Fund Balance - Budget and Actual (Non-GAAP Budgetary Basis) – Other Special Revenue Fund . . . . . . . . . . . . . . . . . . . . . . . . . . . . . . . . . . . . . . . . . . . . . . . . F 114
Schedule of Revenues, Expenditures, and Changes in Fund Balance -Budget and Actual (Non-GAAP Budgetary Basis) - Miscellaneous Grants Fund. . . . . . . . . . . . . . . . . . F 115 Schedule of Revenues, Expenditures, and Changes in Fund Balance -Budget and Actual (Non-GAAP Budgetary Basis) - Permanent Fund. . . . . . . . . . . . . . . . . . . . . . . . F 116
Schedule of Revenues, Expenditures, and Changes in Fund Balance - Budget and Actual (Non-GAAP Budgetary Basis) - Debt Service Fund . . . . . . . . . . . . . . . . . F 117
Combining Statements - Nonmajor Enterprise Funds Fund Descriptions. . . . . . . . . . . . . . . . . . . . . . . . . . . . . . . . . . . . . . . . . . . . . . .
F 118
Combining Statement of Net Assets - Nonmajor Enterprise Funds . . . . . . . . . . . . . . . . . . . . . . F 119 Combining Statement of Revenues, Expenses and Changes in Net Assets - Nonmajor Enterprise Funds . . . . . . . . . . . . . . . . . . . . . . . . . . . . . . . . . . . F 120 Combining Statement of Cash Flows – Nonmajor Enterprise Funds. . . . . . . . . . . . . . . . . . . . . . F 121

I 3
CITY OF DAYTON, OHIO
COMPREHENSIVE ANNUAL FINANCIAL REPORT
FOR THE YEAR ENDED DECEMBER 31, 2009
Table of Contents (Continued)
Combining Statements – Internal Service Funds Fund Descriptions . . . . . . . . . . . . . . . . . . . . . . . . . . . . . . . . . . . . . . . . . . . . . . .
F 122
Combining Statement of Net Assets - Internal Service Funds . . . . . . . . . . . . . . . . . . . . . . . . . F 123 Combining Statement of Revenues, Expenses and Changes in Net Assets - Internal Service Funds . . . . . . . . . . . . . . . . . . . . . . . . . . . . . . . . . . . . F 124 Combining Statement of Cash Flows - Internal Service Funds . . . . . . . . . . . . . . . . . . . . . . . . F 125 Combining Statements - Fiduciary Funds Fund Descriptions . . . . . . . . . . . . . . . . . . . . . . . . . . . . . . . . . . . . . . . . . . . . . . .
F 126
Combining Statement of Changes in Assets and Liabilities - Agency Funds . . . . . . . . . . . . . . . . . . . . . . . . . . . . . . . . . . . . . . . . . . . . . . . . . . F 127-130
STATISTICAL SECTION
Statistical Section Table of Contents. . . . . . . . . . . . . . . . . . . . . . . . . . . . . . . . . . . . . . . . . . .S 3 Net Assets by Component – Last Eight Fiscal Years. . . . . . . . . . . . . . . . . . . . . . . . . . . . . . . . . .S 4-5 Changes in Net Assets – Last Eight Fiscal Years. . . . . . . . . . . . . . . . . . . . . . . . . . . . . . . . . . . .S 6-9 Fund Balances, Governmental Funds – Last Ten Fiscal Years. . . . . . . . . . . . . . . . . . . . . . . . . . . . S 10-11 Changes in Fund Balances, Governmental Funds – Last Ten Fiscal Years. . . . . . . . . . . . . . . . . . . . . . S 12-13 Income Tax Revenue – Last Ten Fiscal Years . . . . . . . . . . . . . . . . . . . . . . . . . . . . . . . . . . . . S 14 Property Tax Levies and Collections – Last Ten Fiscal Years . . . . . . . . . . . . . . . . . . . . . . . . . . . . .S 15 Assessed and Estimated Actual Value of Taxable Property – Last Ten Fiscal Years. . . . . . . . . . . . . . . . . S 16-17 Property Tax Rates – Direct and Overlapping Governments – Last Ten Fiscal Years. . . . . . . . . . . . . . . . .S 18-19 Principal Property Tax Payers – Current Year and Nine Years Ago. . . . . . . . . . . . . . . . . . . . . . . . . .S 20 Special Assessment Billings and Collections – Last Ten Fiscal Years . . . . . . . . . . . . . . . . . . . . . . . .S 21 Ratios of Outstanding Debt By Type – Last Ten Fiscal Years . . . . . . . . . . . . . . . . . . . . . . . . . . . . .S 22-23 Computation of Legal Debt Margin – Last Ten Fiscal Years. . . . . . . . . . . . . . . . . . . . . . . . . . . . . . . . . .S 24-25 Ratio of Net General Obligation Bonded Debt to Assessed Value and Net General Obligation Bonded Debt Per Capita – Last Ten Fiscal Years. . . . . . . . . . . . . . . . . . . . . . . . . . . . .S 26

I 4
CITY OF DAYTON, OHIO
COMPREHENSIVE ANNUAL FINANCIAL REPORT FOR THE YEAR ENDED DECEMBER 31, 2009
Table of Contents
(Continued)
Ratio of Annual Debt Service Expenditures For General Obligation Bonded Debt To Total General Governmental Expenditures – Last Ten Fiscal Years. . . . . . . . . . . . . . . . . . . . . . . . S 27 Computation of Direct and Overlapping Debt – December 31, 2009. . . . . . . . . . . . . . . . . . . . . . . . . S 28 Water Enterprise Revenue Bond Coverage – Last Ten Fiscal Years . . . . . . . . . . . . . . . . . . . . . . . S 29 Dayton International Airport Enterprise Revenue Bond Coverage – Last Ten Fiscal Years. . . . . . . . . . . . . . . . . . . . . . . . . . . . . . . . . . . . . . . . . . . . . . . . . . . . . . . . . . . S 30 Business Indicators – Last Ten Fiscal Years . . . . . . . . . . . . . . . . . . . . . . . . . . . . . . . . . . . . . . S 31 Growth in Land Area – Selected Years . . . . . . . . . . . . . . . . . . . . . . . . . . . . . . . . . . . . . . S 32
Principal Employers – Current Year and Nine Years Ago. . . . . . . . . . . . . . . . . . . . . . . . . . . . . . S 33 Estimated Civilian Labor Force and Annual Average Unemployment Rates – Last Ten Fiscal Years. . . . . . . . S 34 Estimated Per Capita Income and Personal Income – Last Ten Fiscal Years. . . . . . . . . . . . . . . . . . . . . S 35 Dayton Metropolitan Statistical Area Employment, Nonagricultural Wage and Salary Employment in Selected Industries – Last Ten Fiscal Years. . . . . . . . . . . . . . . . . . . . . . . . . . . . S 36-37 Full Time Equivalent City Government Employees By Function/Program – Last Eight Fiscal Years. . . . . . . . S 38 School Enrollment Trends in Montgomery County – Last Ten Fiscal Years. . . . . . . . . . . . . . . . . . . . . S 39 City of Dayton and Montgomery County, Ohio - Land Area – December 31, 2009. . . . . . . . . . . . . . . . . S 40 Building Permits Issued – Last Ten Fiscal Years. . . . . . . . . . . . . . . . . . . . . . . . . . . . . . . . . . . S 41 Average Cost of Housing Construction – Last Ten Fiscal Years. . . . . . . . . . . . . . . . . . . . . . . . . . . S 42 Operating Indicators and Capital Asset Statistics – Last Ten Fiscal Years. . . . . . . . . . . . . . . . . . . . . . S 43

I 5
June 30, 2010 The Honorable Mayor, Members of the City Commission, the City Manager, and the Citizens of the City of Dayton, Ohio We are pleased to submit the Comprehensive Annual Financial Report (CAFR) of the City of Dayton, Ohio for the fiscal year ended December 31, 2009. The City’s Charter, Sections 44 and 78, prescribes the required accounting, audit and examination procedures for the City of Dayton. Clark, Schaefer and Hackett, Certified Public Accountants, studies the City’s system of internal control, conducts such tests that are necessary under the circumstances and renders an opinion based upon the statements when taken in whole. The City has again received an unqualified opinion from the independent auditor that the financial statements are presented fairly. The opinion letter is included in the Financial Section of this report. State law requires that every general-purpose local government publish within six months of the close of each fiscal year a complete set of audited financial statements. The CAFR was prepared using Generally Accepted Accounting Principals (GAAP) as applied to governmental units and contains all disclosures necessary to enable the reader to understand the City’s financial affairs. Responsibility for both the accuracy of the data and completeness and fairness of the presentation rests with the management of the City. The City’s accounting system provides reasonable, but not absolute, assurance regarding the safeguarding of assets against loss from unauthorized use or disposition and the reliability of financial records for preparing financial statements and maintaining accountability for assets. The concept of reasonable assurance recognizes that the cost of internal control should not exceed the benefits likely to be derived and that the evaluation of costs and benefits require estimates and judgments by management. This transmittal letter is designed to provide historical information about the City, as well as complement the required Management’s Discussion and Analysis (MD&A). GAAP requires that management provide a narrative introduction, overview, and analysis to accompany the basic financial statements. The City’s MD&A, which focuses on the government-wide statements, can be found immediately following the report of the independent auditors. PROFILE OF THE CITY OF DAYTON Dayton was founded on April 1, 1796 by a small group of US settlers seven years before the admission of Ohio to the Union in 1803. The town was incorporated in 1805 and given its name after Jonathan Dayton, a captain in the American Revolutionary War and youngest signer of the U.S. Constitution. In 1797, Daniel C. Cooper laid out the Mad River Road, the first overland connection between Cincinnati, Ohio and Dayton. This opened up the "Mad River Country" at Dayton and the upper Miami Valley to settlement. The Dayton City Commission is comprised of the Mayor and four City Commissioners. They are elected at-large on a non-partisan basis for four-year overlapping terms. All policy items are decided by the City Commission, which is empowered by the City Charter to pass ordinances and resolutions, adopt regulations and appoint the City Manager. Dayton is a city in southwestern Ohio. It is the county seat and the largest city in Montgomery County. Dayton is a part of several other communities called the Greater Dayton area which includes the communities of Vandalia, Trotwood, Kettering, Centerville, Beavercreek, Fairborn, West Carrollton, Huber Heights, Troy, and Miamisburg. The 2009 population estimate of Dayton was 154,200. The estimate for the Greater Dayton Area had a population of 542,237.

I 6
The City provides a full range of services that include water supply and treatment, sewer and storm water maintenance, wastewater treatment, airport services, fire and emergency medical services, police protection, convention center, building inspection, neighborhood support, recreation and parks, golf, street and bridge maintenance, waste collection, and a municipal court system. The City has included in the CAFR all of the funds for which it is financially accountable. The City has one component unit: Citywide Development Corporation that is shown as a separate discrete component unit. The City is associated with eight jointly governed organizations. They include the Miami Valley Regional Planning Commission, the Miami Valley Fire/EMS Alliance, the Economic Development/Government Equity Program, the Montgomery County Family and Children First Council, the Hazardous Material Response Team, the Miami Valley Emergency Management Agency, the Butler Township-Dayton JEDD, and the Miami Township-Dayton JEDD. The annual budget serves as the foundation for the City of Dayton’s financial planning and control. City Commission is required to adopt the original budget not before the second Monday in January and the final budget by no later than the close of the fiscal year. The budget is prepared by fund, function and department. Department heads may make certain appropriation transfers within a department (so long as they are within the same fund). LOCAL ECONOMY The City of Dayton has a rich history with its citizens contributing controlled powered flight, the automobile self-starter, the cash register, and micro-encapsulation to the world. The City is working to reposition its economy to compete globally in the future with a diversified knowledge-based economy. Spurred by the City's 2007 revised economic development goals in the City's most recent citywide planning effort (CitiPlan, the 20/20 Vision and Focus 2010), the City is concentrating development efforts on the following industries to transform its economic base:
• Aerospace Research and Development • Data Management Incubator, Sensors & Radio Frequency Identification (RFID) Technologies • Healthcare
Due to the proximity of Wright Patterson Air Force Base (WPAFB) to the City and the location of the University of Dayton within the City, the City and the region have a large concentration of science and engineering PhDs and information-technology workers in the overall workforce. WPAFB, along with the University, and the resource pool that they attract could be a major catalyst in the transformation of the local economic base. WPAFB is the largest single-site employer in the State. Occupying more than 8,000 acres with a combined military and civilian employment of approximately 22,000, WPAFB is one of the largest research and development centers in the country. WPAFB is home to the Air Force Materiel Command, which includes the Sensors Directorate and the Propulsion Directorate. The Sensors Directorate, with an annual budget of $110 million, conducts research, test and evaluation, acquisition management services and logistics support for Air Force weapons systems. As a result of military base realignments, the City and region expects to benefit by the transition of approximately 1,200 jobs (1,100 jobs after departing missions are taken into account) to WPAFB with the consolidation of the Human Effectiveness and Sensors Directorates at WPAFB. The Propulsion Directorate, with an annual budget of $380 million, provides propulsion technologies to aircraft, rockets and spacecrafts and conducts related research and development. The City is focusing on the healthcare industry as an area of potential growth with area hospitals employing more than 14,700 people. Four of the area hospitals are the driving force behind revitalization efforts with the City to create vibrant sustainable communities.

I 7
CareSource, an Ohio nonprofit managed health care plan provider, completed construction and now occupies its new $55 million, 324,000 square foot headquarters in the Central Business District within the City of Dayton. The City supported development in this area with the construction of a new $20 million, seven floor, 1,200-space parking garage. The City and its development partner, CityWide Development Corporation, are redeveloping the former General Motors manufacturing site in the northeast quadrant of the City's downtown area into a high-technology office campus to be known as Tech Town. On this 30-acre Brownfield redevelopment site, the City has constructed a 42,000-square foot building that was completed on June 30, 2009, opened on August 1, 2009 and was fully leased. A second building is currently being designed. The plan is for a 60,000 square foot structure with construction commencing in spring 2010 and completion scheduled for spring 2011. Tech Town’s proximity to WPAFB allows the City to attract businesses that wish to locate near WPAFB. The City recently announced the creation of the Dayton Economic Attraction Program to assist businesses that are expanding in the City. Companies located downtown would receive an annual grant equal to 75% of payroll taxes for three years for the net new jobs greater than five created in a calendar year. Companies located in one of the City’s targeted cluster groups outside of the Central Business District may receive an annual grant equal to 50% of payroll taxes for three years for net new jobs greater than five created in a calendar year. Jobs created in the Dayton Economic Attraction Program must pay a living wage as defined by the City’s Living Wage ordinance, which is approximately $11 per hour. LONG-TERM FINANCIAL PLANNING Moody’s Investors Services confirmed Dayton’s general obligation bond credit rating at A1 and upgraded our non-tax revenue debt rating from A3 to A2 has been maintained. In addition, Standard and Poor’s announced that it retained Dayton’s A+ rating. Both announcements signal their confidence in Dayton’s financial management practices and long-term stability. Based on the City of Dayton FOCUS 2010 Report, the City is to maintain financial stability by maintaining its well documented reputation of sound financial management and leadership and will focus internal resources on process improvements and automation to increase revenue collections and explore expanded assessments for selected services. This is an opportunity for growth which stands as a continuous benchmark by which all major initiatives are measured against. RELEVANT FINANCIAL POLICIES The City’s long-standing policy is to maintain minimum reserve levels equal to six to ten weeks of operating expenses. The City Commission’s policy is to apply the General Fund balance only to the following limited purposes: one-time strategic investments yielding a significant number of jobs; one-time strategic investments in technology to reduce operating costs; and to weather a recession or economic shock during a maximum 18-month period. Consistent with City policy to maintain the General Fund reserve and not increase the City income tax, City management took action to increase General Fund revenues, reduce General Fund expenses and renew the City of Dayton’s earnings tax. The City was also able to retain important property tax credits for senior citizens and disabled residents of our community. The earnings tax renewal means the City of Dayton has maintained the same earnings tax rate for at least 30 years.

I 8
AWARDS AND ACKNOWLEDGEMENTS This was the 27th consecutive year that the Government Finance Officers Association of the United States and Canada (GFOA) has awarded the Certificate of Achievement for Excellence in Financial Reporting to the City of Dayton for its CAFR for the year ended December 31, 2008. The Certificate of Achievement is a prestigious national award recognizing conformance with the highest standards for preparation of state and local government financial reports. In order to be awarded a Certificate of Achievement, a governmental unit must publish an easily readable and organized Comprehensive Annual Financial Report, whose contents conform to program standards judged by the GFOA. This report must satisfy both Generally Accepted Accounting Principles (GAAP) and applicable legal requirements. A Certificate of Achievement is valid for a period of one year. We believe that our current Comprehensive Annual Financial Report continues to conform to the Certificate of Achievement program requirements, and the 2009 CAFR has been submitted to the GFOA for their review. We hereby acknowledge a sincere extension of gratitude to all who contributed their time and effort towards the completion of this 2009 CAFR assignment. My appreciation is extended to the City Commission Office, the City Manager’s Office, City department heads, and all City employees responsible for contributing to the sound financial position of the City. I would like to acknowledge the efforts of the Accounting and Treasury staff, other members of the Finance Department and our consultant, Julian and Grube, Inc., all of whom contributed to the development of the CAFR. Respectively submitted,
Cheryl J. Garrett Finance Director Secretary of the Board of Sinking Fund Trustees
Assi
stan
t City
Man
ager
Ope
rati
ons
& P
erso
nnel
Assi
stan
t City
Man
ager
Str
ateg
ic D
evel
opm
ent
Dep
uty
City
Man
ager
Cit
y M
anag
erP
ublic
Aff
airs
Avi
atio
nAd
minis
tratio
n & F
inanc
eOp
erati
ons &
Fac
ilities
Ma
nage
ment
Plan
ning &
Eng
ineer
ingAi
rcraft
Res
cue &
Fire
fighti
ngAi
rpor
t Poli
ce
Off
ice
ofE
cono
mic
D
evel
opm
ent
Cen
tral
S
ervi
ces
Infor
matio
n Tec
hnolo
gy
Servi
ces/
Repr
oduc
tion
Purch
asing
Facil
ities M
anag
emen
t
Bui
ldin
g S
ervi
ces
Build
ing In
spec
tion
Hous
ing In
spec
tion
Con
vent
ion
Cen
ter
Oper
ation
sSa
les/M
arke
ting
Fina
nce
Reve
nue &
Tax
ation
Acco
untin
g and
Tre
asur
y
Pla
nnin
g &
C
omm
unit
y D
evel
opm
ent
Citiz
en P
artic
ipatio
nCo
mmun
ity A
ffairs
Hous
ing &
Neig
hbor
hood
De
velop
ment
Plan
ning
Fire
Emer
genc
y Ser
vices
Stra
tegic
Prog
rams
&
Safet
ySu
ppor
t Ser
vices
&
Reso
urce
s Man
agem
ent
Hum
an
Res
ourc
esEm
ploye
e Rela
tions
Em
ploye
e Ser
vices
Pol
ice
Admi
nistra
tive S
ervic
esPa
trol O
pera
tions
Spec
ial In
vesti
gatio
nsPr
ofess
ional
Stan
dard
s
Pub
lic W
orks
Civil
Eng
ineer
ingFle
et Ma
nage
ment
Stre
et Ma
inten
ance
Was
te Co
llecti
onR
ecre
atio
n &
Y
outh
Ser
vice
sAd
minis
tratio
nRe
creati
on &
You
th Se
rvice
sGo
lf
Wat
erAd
minis
tratio
nEn
viron
menta
l Ma
nage
ment
Sewe
r Main
tenan
ceW
astew
ater T
reatm
ent
Wate
r Dist
ributi
onW
ater E
ngine
ering
Wate
r Sup
ply/T
reatm
ent
Den
otes
Pol
icy
Coo
rdin
atio
n T
eam
Mem
ber
The
Polic
y C
oord
inat
ion
Team
is
con
vene
d by
the
City
M
anag
er to
dis
cuss
var
ious
is
sues
.
Off
ice
ofM
anag
emen
t &
Bud
get
Law
Civil
Crim
inal
Cit
yWid
e D
evel
opm
ent
Cor
pora
tion
Cit
izen
s of
Day
ton
Cit
y C
omm
issi
onC
LER
K
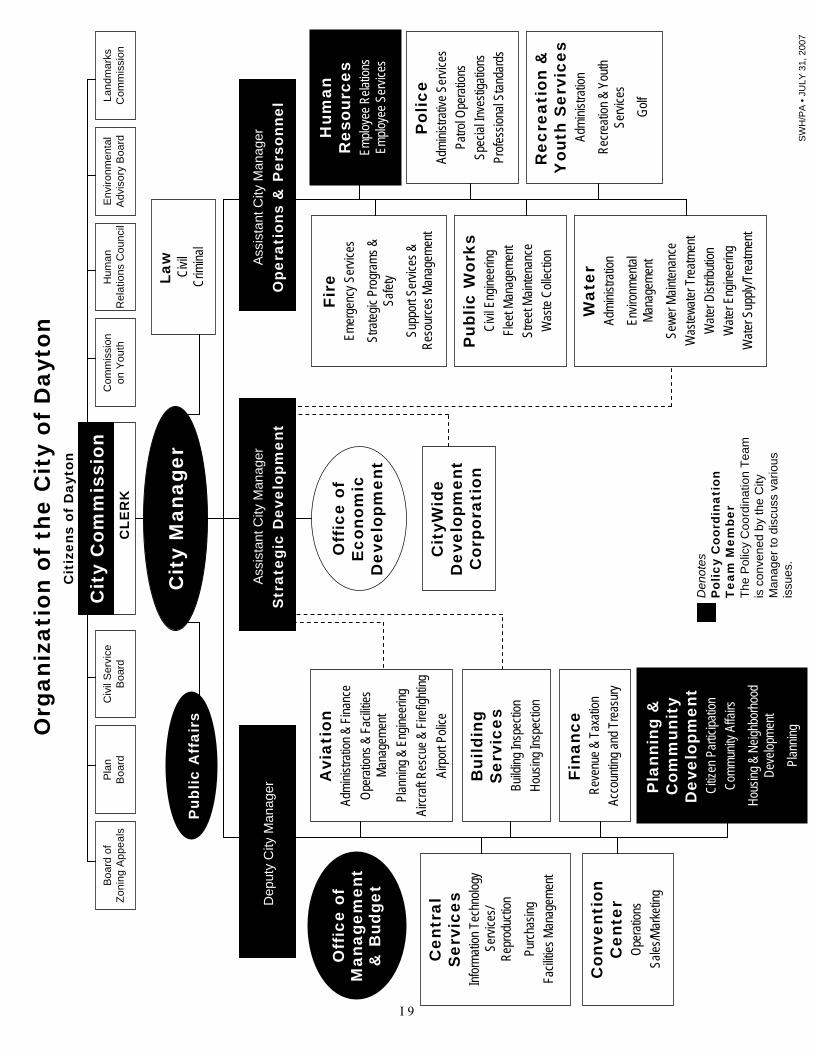
Org
aniz
atio
n of
the
Cit
y of
Day
ton
Env
ironm
enta
l A
dvis
ory
Boa
rdC
omm
issi
on
on Y
outh
Hum
an
Rel
atio
ns C
ounc
ilLa
ndm
arks
Com
mis
sion
Civ
il S
ervi
ceB
oard
Boa
rd o
fZo
ning
App
eals
Pla
n B
oard
SWH
/PA
• JU
LY 3
1, 2
007
I 9

I 10
CITY OF DAYTON, OHIO
LIST OF ELECTED AND APPOINTED OFFICIALS FOR THE YEAR ENDED DECEMBER 31, 2009
ELECTED OFFICIALS
Mayor Rhine McLin Commissioner Matt Joseph Commissioner Dean Lovelace Commissioner Nan Whaley Commissioner Joey D. Williams
APPOINTED OFFICIALS
City Manager Timothy H. Riordan Deputy City Manager Stanley Earley
Asst. City Manager ~ Strategic Development Shelley Dickstein Director ~ Aviation Iftikhar Ahmad
Acting Director ~ Building Services Michael Cromartie Director ~ Central Services Pete Hager Secretary and Chief Examiner ~ Civil Service Giselle Johnson Executive Asst. to the Commission ~ City Commission Kery Gray Director ~ Dayton Convention Center Bart Shaw Director ~ Finance Cheryl J. Garrett Director & Chief ~ Fire Herbert Redden, II Executive Director ~ Human Relations Council Tom Wahlrab Acting Director ~ Human Resources Wanda Smith Director ~ Law John Danish Director ~ Management & Budget Barbara LaBrier Director ~ Planning & Community Development John Gower Director & Chief ~ Police Richard Biehl Director ~ Public Affairs Thomas Biedenharn Director ~ Public Works Fred Stovall Acting Director ~ Recreation & Youth Services C. LaShea Smith Director ~ Water Tammi Clements

I 11
THIS PAGE IS INTENTIONALLY LEFT BLANK

The Wings celebrate Dayton as the birthplace of Aviation with the invention of the airplane in 1903 by Daytonians Wilbur and Orville Wright.
Dayton invented aviation and continues to grow in inventions paving the way in fl ight through space and beyond. Dayton is also the home to the world’s second largest International Air Show.
FINA
NC
IAL

THIS PAGE IS INTENTIONALLY LEFT BLANK

2525 north limestone street, ste. 103 springfield, oh 45503
www.cshco.comp. 937.399.2000 f. 937.399.5433
cincinnati | columbus | dayton | middletown | springfield
INDEPENDENT AUDITORS’ REPORT
City Commission City of Dayton, Ohio
We have audited the accompanying financial statements of the governmental activities, the business-type activities, the discretely presented component unit, each major fund, and the aggregate remaining fund information of the City of Dayton, Ohio (the City) as of and for the year ended December 31, 2009, which collectively comprise the City’s basic financial statements as listed in the table of contents. These financial statements are the responsibility of the City’s management. Our responsibility is to express opinions on these financial statements based on our audit. We did not audit the financial statements of the City Wide Development Corporation, the City’s only discretely presented component unit. Those financial statements were audited by other auditors whose report thereon has been furnished to us, and our opinion, insofar as it relates to the amounts included for the discretely presented component unit, is based on the report of the other auditors.
We conducted our audit in accordance with auditing standards generally accepted in the United States of America and the standards applicable to financial audits contained in Government Auditing Standards,issued by the Comptroller General of the United States. Those standards require that we plan and perform the audit to obtain reasonable assurance about whether the financial statements are free of material misstatement. An audit includes examining, on a test basis, evidence supporting the amounts and disclosures in the financial statements. An audit also includes assessing the accounting principles used and significant estimates made by management, as well as evaluating the overall financial statement presentation. We believe that our audit and the report of other auditors provide a reasonable basis for our opinions.
In our opinion, based on our audit and the report of other auditors, the financial statements referred to above present fairly, in all material respects, the respective financial position of the governmental activities, the business-type activities, the discretely presented component unit, each major fund, and the aggregate remaining fund information of the City of Dayton, Ohio as of December 31, 2009, and the respective change in financial position and cash flows, where applicable, thereof and the budgetary comparison for the General Fund for the year then ended in conformity with accounting principles generally accepted in the United States of America.
In accordance with Government Auditing Standards, we have also issued our report dated June 30, 2010 on our consideration of the City’s internal control over financial reporting and on our tests of its compliance with certain provisions of laws, regulations, contracts, grant agreements and other matters. The purpose of that report is to describe the scope of our testing of internal control over financial reporting and compliance and the results of that testing, and not to provide an opinion on the internal control over financial reporting or on compliance. That report is an integral part of an audit performed in accordance with Government Auditing Standards and should be considered in assessing the results of our audit.
F 1

Management’s Discussion and Analysis on pages F-3 through F-26 is not a required part of the basic financial statements but is supplementary information required by the Governmental Accounting Standards Board. We have applied certain limited procedures, which consisted principally of inquires of management regarding the methods of measurement and presentation of the supplementary information. However, we did not audit the information and express no opinion on it.
Our audit was conducted for the purpose of forming opinions on the financial statements that collectively comprise the City’s basic financial statements. The introductory section, combining and individual non-major fund financial statements and schedules, and the statistical sections are presented for purposes of additional analysis and are not a required part of the basic financial statements. The combining and individual non-major fund financial statements and schedules have been subjected to the auditing procedures applied in the audit of the basic financial statements and, in our opinion, are fairly stated in all material respects in relation to the basic financial statements taken as a whole. The introductory and statistical sections have not been subjected to the auditing procedures applied in the audit of the basic financial statements and, accordingly, we express no opinion on them.
Springfield, Ohio June 30, 2010
F 2

CITY OF DAYTON, OHIO
MANAGEMENT’S DISCUSSION AND ANALYSIS FOR THE YEAR ENDED DECEMBER 31, 2009
F 3
The management’s discussion and analysis of the City of Dayton’s (the “City”) financial performance provides an overall review of the City’s financial activities for the fiscal year ended December 31, 2009. The intent of this discussion and analysis is to look at the City’s financial performance as a whole; readers should also review the basic financial statements and the notes to the basic financial statements to enhance their understanding of the City’s financial performance. Financial Highlights Key financial highlights for 2009 are as follows:
The total net assets of the City increased $22,312,130. Net assets of the City were restated as described in Note 3.C. Net assets of governmental activities increased $10,763,563 or 2.72% over 2008 and net assets of business-type activities increased $11,548,567 or 2.16% over 2008.
General revenues accounted for $139,700,633 or 63.90% of total governmental activities revenue. Program
specific revenues accounted for $78,906,238 or 36.10% of total governmental activities revenue.
The City had $207,180,347 in expenses related to governmental activities; $78,906,238 of these expenses were offset by program specific charges for services, grants or contributions. The remaining expenses of the governmental activities of $128,274,109 were offset by general revenues (primarily property taxes, income taxes and unrestricted grants and entitlements) of $139,700,633.
The general fund had revenues and other financing sources of $153,467,273 in 2009. This represents a decrease
of $19,545,609 from 2008 revenues. The expenditures and other financing uses of the general fund, which totaled $161,223,163 in 2009, decreased $10,161,788 from 2008. The net decrease in fund balance for the general fund was $7,755,890 or 17.79%.
The debt service major fund had $33,305,970 in revenues and other financing sources and $34,210,470 in
expenditures and other financing uses in 2009. The fund balance in the debt service fund was $42,188,046, a 2.10% decrease from 2008. The fund balance of the debt service fund was restated as described in Note 3.C.
The capital improvements major fund had $35,861,323 in revenues and other financing sources and
$47,271,547 in expenditures in 2009. The fund balance for the capital improvements fund decreased $11,410,224 or 69.57%.
Net assets for the business-type activities, which are made up of the Dayton International Airport, water, sewer,
storm water and golf enterprise funds, increased in 2009 by $11,548,567.
The Dayton International Airport enterprise fund had $30,655,950 in operating revenues and $38,063,817 in operating expenses in 2009. The Dayton International Airport enterprise fund also had non-operating revenues of $471,666, non-operating expenses of $2,082,373, capital contributions of $16,881,998 and transfers in of $149,758. The net assets of the Dayton International Airport enterprise fund increased $8,013,182 or 3.27%.
The water enterprise fund had $47,743,750 in operating revenues and $45,517,470 in operating expenses in
2009. The water enterprise fund also had non-operating revenues of $244,902, capital contributions of $216,235 and transfers in of $261,063. The net assets of the water enterprise fund increased $2,948,480 or 1.82%.
The sewer enterprise fund had $30,998,739 in operating revenues and $31,458,777 in operating expenses in
2009. The sewer enterprise fund also had non-operating expenses of $451,675 and transfers in of $104,586. The net assets of the sewer enterprise fund decreased $807,127 or 0.76%.

CITY OF DAYTON, OHIO
MANAGEMENT’S DISCUSSION AND ANALYSIS FOR THE YEAR ENDED DECEMBER 31, 2009
F 4
In the general fund, the actual revenues and other financing sources came in $324,080 lower than they were in the final budget and actual expenditures and other financing uses were $14,510,347 less than the amount in the final budget. Budgeted revenues and other financing sources decreased $11,840,487 from the original to the final budget. Budgeted expenditures and other financing uses increased $4,680,500 from the original to the final budget.
Using this Comprehensive Annual Financial Report This annual report consists of a series of financial statements and notes to those statements. These statements are organized so the reader can understand the City as a financial whole, an entire operating entity. The statements then proceed to provide an increasingly detailed look at specific financial activities. The Statement of Net Assets and Statement of Activities provide information about the activities of the whole City, presenting both an aggregate view of the City’s finances and a longer-term view of those finances. Fund financial statements provide the next level of detail. For governmental funds, these statements tell how services were financed in the short-term as well as what remains for future spending. The fund financial statements also look at the City’s most significant funds with all other nonmajor funds presented in total in one column. Reporting the City as a Whole Statement of Net Assets and the Statement of Activities While this document contains a large number of funds used by the City to provide programs and activities, the view of the City as a whole looks at all financial transactions and asks the question, “How did we do financially during 2009?” The statement of net assets and the statement of activities answer this question. These statements include all assets and liabilities using the accrual basis of accounting similar to the accounting used by most private-sector companies. This basis of accounting will take into account all of the current year’s revenues and expenses regardless of when cash is received or paid. These two statements report the City’s net assets and changes in those assets. This change in net assets is important because it tells the reader that, for the City as a whole, the financial position of the City has improved or diminished. The causes of this change may be the result of many factors, some financial, some not. Non-financial factors include the City’s property tax base, current property tax laws in Ohio restricting revenue growth, facility conditions, required community programs and other factors. In the statement of net assets and the statement of activities, the City is divided into two distinct kinds of activities: Governmental Activities - Most of the City’s programs and services are reported here including police, fire, street and highway maintenance, HUD program operations, community and economic development and general administration. These services are funded primarily by property and income taxes and intergovernmental revenues including federal and state grants and other shared revenues. Business-Type Activities - These services are provided on a charge for goods or services basis to recover all or a significant portion of the expenses of the goods or services provided. The City’s airport, water, sewer, storm water and golf operations are reported here.

CITY OF DAYTON, OHIO
MANAGEMENT’S DISCUSSION AND ANALYSIS FOR THE YEAR ENDED DECEMBER 31, 2009
F 5
Reporting the City’s Most Significant Funds Fund Financial Statements A fund is a grouping of related accounts that is used to maintain control over resources that have been segregated for specific activities or objectives. The City, like other state and local governments, uses fund accounting to ensure and demonstrate compliance with finance-related legal requirements. All of the funds of the City can be divided into three categories: governmental funds, proprietary funds, and fiduciary funds. Fund financial reports provide detailed information about the City’s major funds. The City uses many funds to account for a multitude of financial transactions. However, these fund financial statements focus on the City’s most significant funds. The analysis of the City’s major governmental and proprietary funds begins on page F 11. Governmental Funds Governmental funds are used to account for essentially the same functions reported as governmental activities in the government-wide financial statements. However, unlike the government-wide financial statements, governmental fund financial statements focus on near-term inflows and outflows of spendable resources, as well as on balances of spendable resources available at the end of the fiscal year. Such information may be useful in evaluating a government’s near-term financing requirements. Because the focus of the governmental funds is narrower than that of the government-wide financial statements, it is useful to compare the information presented for governmental funds with similar information presented for governmental activities in the government-wide financial statements. By doing so, the readers may better understand the long-term impact of the government’s near-term financing decisions. Both the governmental fund balance sheet and the governmental fund statement of revenues, expenditures, and changes in fund balances provide a reconciliation to facilitate this comparison between governmental funds and governmental activities. The City maintains a multitude of individual governmental funds. The City has segregated these funds into major and nonmajor funds. The City’s major governmental funds are the general fund, debt service fund and capital improvements fund. Information for major funds is presented separately in the governmental fund balance sheet and in the governmental statement of revenues, expenditures, and changes in fund balances. Data from the other governmental funds are combined into a single, aggregated presentation. The basic governmental fund financial statements can be found on pages F 32 - F 36 of this report and further detail on the City’s major and nonmajor governmental funds can by found in Note 2 of this report. Proprietary Funds The City maintains two different types of proprietary funds. Enterprise funds are used to report the same functions presented as business-type activities in the government-wide financial statements. The City uses enterprise funds to account for its airport, water, sewer, storm water and golf operations. The City reports the airport fund, water fund and sewer fund as major enterprise funds. These major funds are presented separately in the proprietary fund financial statements. The storm water fund and the golf fund are considered nonmajor funds and are combined into a single, aggregated presentation in the proprietary fund financial statements. Internal service funds are an accounting device used to accumulate and allocate costs internally among the City’s various functions. The basic proprietary fund financial statements can be found on pages F 38 - F 47 of this report.

CITY OF DAYTON, OHIO
MANAGEMENT’S DISCUSSION AND ANALYSIS FOR THE YEAR ENDED DECEMBER 31, 2009
F 6
Fiduciary Funds Fiduciary funds are used to account for resources held for the benefit of parties outside the City. Fiduciary funds are not reflected in the government-wide financial statement because the resources of those funds are not available to support the City’s own programs. The accounting used for fiduciary funds is much like that used for proprietary funds. Agency funds are the City’s only fiduciary fund type. The basic fiduciary fund financial statement can be found on page F 48 of this report. Notes to the Basic Financial Statements The notes provide additional information that is essential to a full understanding of the data provided in the government-wide and fund financial statements. These notes to the basic financial statements can be found on pages F 49 - F 100 of this report. Government-Wide Financial Analysis The Statement of Net Assets provides the perspective of the City as a whole. The table below provides a summary of the City’s net assets at December 31, 2009 compared to December 31, 2008. The net assets of the governmental activities and business-type activities at December 31, 2008 have been restated as described in Note 3.C.
Net Assets
(Restated) (Restated)Governmental Governmental Business-Type Business-Type
Activities Activities Activities Activities Total Total 2009 2008 2009 2008 2009 2008
AssetsCurrent and other assets 196,749,735$ 212,510,422$ 173,692,600$ 161,178,669$ 370,442,335$ 373,689,091$
Capital assets, net 361,678,430 334,356,820 452,305,552 443,464,998 813,983,982 777,821,818
Total assets 558,428,165 546,867,242 625,998,152 604,643,667 1,184,426,317 1,151,510,909
LiabilitiesLong-term liabilities outstanding 113,205,254 111,689,872 64,452,228 57,600,610 177,657,482 169,290,482 Other liabilities 38,708,040 39,426,062 15,435,931 12,481,631 54,143,971 51,907,693
Total liabilities 151,913,294 151,115,934 79,888,159 70,082,241 231,801,453 221,198,175
Net AssetsInvested in capital assets, net of related debt 304,910,802 282,480,043 401,965,547 389,630,233 706,876,349 672,110,276 Restricted 91,563,337 96,325,940 - - 91,563,337 96,325,940 Unrestricted 10,040,732 16,945,325 144,144,446 144,931,193 154,185,178 161,876,518
Total net assets 406,514,871$ 395,751,308$ 546,109,993$ 534,561,426$ 952,624,864$ 930,312,734$
Over time, net assets can serve as a useful indicator of a government’s financial position. At December 31, 2009, the City’s assets exceeded liabilities by $952,624,864. At year-end, net assets were $406,514,871 and $546,109,993 for the governmental activities and the business-type activities, respectively.

CITY OF DAYTON, OHIO
MANAGEMENT’S DISCUSSION AND ANALYSIS FOR THE YEAR ENDED DECEMBER 31, 2009
F 7
Capital assets reported on the government-wide statements represent the largest portion of the City’s assets. At year-end, capital assets represented 68.72% of total assets. Capital assets include land, construction in progress (CIP), land improvements, buildings and improvements, furniture, fixtures and equipment, vehicles and infrastructure. Capital assets, net of related debt to acquire the assets at December 31, 2009, were $304,910,802 and $401,965,547 in the governmental activities and business-type activities, respectively. These capital assets are used to provide services to citizens and are not available for future spending. Although the City’s investment in capital assets is reported net of related debt, it should be noted that the resources to repay the debt must be provided from other sources, since capital assets may not be used to liquidate these liabilities. As of December 31, 2009, the City is able to report positive balances in all three categories of net assets, both for the government as a whole, as well as for its separate governmental and business-type activities. A portion of the City’s net assets, $91,563,337, represents resources that are subject to external restriction on how they may be used. In the governmental activities, the remaining balance of unrestricted net assets of $10,040,732 may be used to meet the government’s ongoing obligations to citizens and creditors. The table on the next page shows the changes in net assets for 2009 and 2008. The net assets for governmental activities and business-type activities at December 31, 2008 have been restated as described in Note 3.C. Other expenses for 2008 have been reclassified to leadership and quality of life expenses to conform to 2009’s presentation.
THIS SPACE LEFT BLANK INTENTIONALLY

CITY OF DAYTON, OHIO
MANAGEMENT’S DISCUSSION AND ANALYSIS FOR THE YEAR ENDED DECEMBER 31, 2009
F 8
Change in Net Assets
(Restated) (Restated)Governmental Governmental Business-Type Business-Type
Activities Activities Activities Activities Total Total 2009 2008 2009 2008 2009 2008
RevenuesProgram revenues: Charges for services and sales 28,987,368$ 28,910,674$ 119,732,135$ 120,390,047$ 148,719,503$ 149,300,721$ Operating grants and contributions 24,147,823 20,423,979 - - 24,147,823 20,423,979 Capital grants and contributions 25,771,047 13,489,575 17,098,233 21,316,626 42,869,280 34,806,201
Total program revenues 78,906,238 62,824,228 136,830,368 141,706,673 215,736,606 204,530,901
General revenues: Property taxes 19,070,860 24,167,118 - - 19,070,860 24,167,118 Income taxes 99,817,917 108,868,331 - - 99,817,917 108,868,331 Unrestricted grants 14,827,230 17,912,684 - - 14,827,230 17,912,684 Interest 1,311,141 5,340,622 716,568 2,764,220 2,027,709 8,104,842 Miscellaneous 4,673,485 11,889,101 - - 4,673,485 11,889,101
Total general revenues 139,700,633 168,177,856 716,568 2,764,220 140,417,201 170,942,076
Total revenues 218,606,871 231,002,084 137,546,936 144,470,893 356,153,807 375,472,977
Expenses: Downtown 5,182,850 5,570,112 - - 5,182,850 5,570,112 Youth, education and human services 2,264,862 2,583,667 - - 2,264,862 2,583,667 Community development 21,342,171 21,460,067 - - 21,342,171 21,460,067 Economic development 14,263,940 9,810,580 - - 14,263,940 9,810,580 Leadership and quality of life 47,091,889 49,247,083 - - 47,091,889 49,247,083 Corporate responsibility 17,707,683 17,442,665 - - 17,707,683 17,442,665 Public safety and justice 95,706,450 101,533,014 - - 95,706,450 101,533,014 Interest and fiscal charges 3,620,502 4,849,682 - - 3,620,502 4,849,682 Dayton International Airport - - 40,310,513 31,958,820 40,310,513 31,958,820 Water - - 45,672,640 45,811,605 45,672,640 45,811,605 Sewer - - 31,994,865 30,855,192 31,994,865 30,855,192 Other business-type activities: Golf - - 3,281,384 3,196,937 3,281,384 3,196,937 Storm water - - 5,401,928 5,090,241 5,401,928 5,090,241
Total expenses 207,180,347 212,496,870 126,661,330 116,912,795 333,841,677 329,409,665
Increase in net assets before transfers 11,426,524 18,505,214 10,885,606 27,558,098 22,312,130 46,063,312
Transfers (662,961) 344,798 662,961 (344,798) - -
Change in net assets 10,763,563 18,850,012 11,548,567 27,213,300 22,312,130 46,063,312
Net assets at beginningof year (restated) 395,751,308 376,901,296 534,561,426 507,348,126 930,312,734 884,249,422
Net assets at end of year 406,514,871$ 395,751,308$ 546,109,993$ 534,561,426$ 952,624,864$ 930,312,734$

CITY OF DAYTON, OHIO
MANAGEMENT’S DISCUSSION AND ANALYSIS FOR THE YEAR ENDED DECEMBER 31, 2009
F 9
Governmental Activities Governmental activities net assets increased $10,763,563 in 2009. This slight increase of 2.72% is due to the City’s continuing efforts to reduce costs and increase operational efficiency. Public safety and justice, which primarily supports the operations of the police and fire departments accounted for $95,706,450 of the total expenses of the City. These expenses were partially funded by $17,398,578 in direct charges to users of the services. Leadership and quality of life expenses totaled $47,091,889. Leadership and quality of life expenses were partially funded by $4,411,912 in direct charges to users of the services. The state and federal government contributed to the City a total of $24,147,823 in operating grants and contributions and $25,771,047 in capital grants and contributions. These revenues are restricted to a particular program or purpose. Of the total operating grants and contributions, $6,190,345 subsidized leadership and quality of life and $13,306,998 subsidized community development and neighborhoods. Of the total capital grants and contributions, $14,510,035 subsidized economic development programs. General revenues totaled $139,700,633, and amounted to 63.90% of total governmental revenues. These revenues primarily consist of property and income tax revenue of $118,888,777. The other primary source of general revenues is grants and entitlements not restricted to specific programs, including local government and local government revenue assistance, making up $14,827,230. The statement of activities shows the cost of program services and the charges for services and grants offsetting those services. The following table shows, for governmental activities, the total cost of services and the net cost of services. That is, it identifies the cost of these services supported by tax revenue and unrestricted State grants and entitlements. As can be seen in the Graph below, the City is highly dependent upon property and income taxes as well as unrestricted grants and entitlements to support its governmental activities. Other expenses for 2008 have been reclassified to leadership and quality of life expenses to conform to 2009’s presentation.
Governmental Activities – Program Revenues vs. Total Expenses
$207,180,347 $212,496,870
$78,906,238 $62,824,228$-
$50,000,000
$100,000,000
$150,000,000
$200,000,000
$250,000,000
2009 2008
Program Revenues Expenses

CITY OF DAYTON, OHIO
MANAGEMENT’S DISCUSSION AND ANALYSIS FOR THE YEAR ENDED DECEMBER 31, 2009
F 10
Governmental Activities
Total Cost of Net Cost of Total Cost of Net Cost ofServices Services Services Services
2009 2009 2008 2008 Program Expenses: Downtown 5,182,850$ 4,505,990$ 5,570,112$ 5,000,053$ Youth, education and human services 2,264,862 1,931,366 2,583,667 138,794 Community development and neighborhoods 21,342,171 4,611,308 21,460,067 12,822,220 Economic development 14,263,940 (2,611,522) 9,810,580 (6,027,307) Leadership and quality of life 47,091,889 26,552,929 49,247,083 37,067,269 Corporate responsibility 17,707,683 14,772,471 17,442,665 14,512,507 Public safety and justice 95,706,450 74,891,065 101,533,014 81,309,424 Interest and fiscal charges 3,620,502 3,620,502 4,849,682 4,849,682
Total Expenses 207,180,347$ 128,274,109$ 212,496,870$ 149,672,642$
The dependence upon general revenues for governmental activities is apparent, with 61.91% of expenses supported through taxes and other general revenues.
Governmental Activities – General and Program Revenues
$139,700,633$168,177,856
$78,906,238$62,824,228
$-$25,000,000$50,000,000$75,000,000
$100,000,000$125,000,000$150,000,000$175,000,000
2009 2008
Program Revenues General Revenues

CITY OF DAYTON, OHIO
MANAGEMENT’S DISCUSSION AND ANALYSIS FOR THE YEAR ENDED DECEMBER 31, 2009
F 11
Business-Type Activities Business-type activities include the Dayton International Airport, water, sewer, storm water and golf enterprise funds. These programs had program revenues of $136,830,368, general revenues of $716,568 and expenses of $126,661,330 for 2009. The graph below shows the business-type activities assets, liabilities and net assets at year-end.
Net Assets in Business - Type Activities
$625,998,152 $604,643,667
$546,109,993 $534,561,426
$79,888,159 $70,082,241$-
$200,000,000
$400,000,000
$600,000,000
$800,000,000
2009 2008 (restated)
Liabilities Net Assets Assets
Financial Analysis of the Government’s Funds As noted earlier, the City uses fund accounting to ensure and demonstrate compliance with finance-related legal requirements. Governmental Funds The focus of the City’s governmental funds is to provide information on near-term inflows, outflows, and balances of spendable resources. Such information is useful in assessing the City’s financing requirements. In particular, unreserved fund balance may serve as a useful measure of the City’s net resources available for spending at year-end. The City’s governmental funds (as presented on the balance sheet on page F 32) reported a combined fund balance of $106,535,267 which is $18,459,878 lower than last year’s total of $124,995,145 (restated). The debt service fund balance includes $25,700,000 reserved for loans. The capital improvement fund balance includes $5,393,043 reserved for advances to the component unit. The schedule below indicates the fund balances and the total change in fund balances as of December 31, 2009 for all major and nonmajor governmental funds. The debt service fund balance at December 31, 2008 has been restated as described in Note 3.C.
(Restated)Fund Balances Fund Balances Increase/ 12/31/09 12/31/08 (Decrease)
Major Funds: General 35,838,414$ 43,594,304$ (7,755,890)$ Debt service 42,188,046 43,092,546 (904,500) Capital improvement 4,991,626 16,401,850 (11,410,224) Other nonmajor governmental funds 23,517,181 21,906,445 1,610,736
Total 106,535,267$ 124,995,145$ (18,459,878)$

CITY OF DAYTON, OHIO
MANAGEMENT’S DISCUSSION AND ANALYSIS FOR THE YEAR ENDED DECEMBER 31, 2009
F 12
General Fund The City’s general fund balance decreased $7,755,890. The City underwent a variety of cost saving measures, including offering voluntary termination benefits, to reduce the number of City employees and reduce the associated personnel costs. The City’s ability to control costs enabled the fund balance in the general fund to remain stable despite an overall decrease in revenues. The decrease in revenues is primarily due to the decrease in tax revenue as a result of the economic recession. The table that follows assists in illustrating the revenues of the general fund.
2009 2008 Amount Amount
RevenuesTaxes 122,933,570$ 135,152,156$ (9.04) %Charges for services 23,368,644 22,900,500 2.04 %Licenses and permits 1,585,081 1,803,864 (12.13) %Fines and forfeitures 1,604,520 1,805,640 (11.14) %Investment income 1,745,338 4,638,962 (62.38) %Special assessments 189,434 286,250 (33.82) %Intergovernmental 1,097,695 1,314,139 (16.47) %Other 138,078 5,111,371 (97.30) %
Total 152,662,360$ 173,012,882$ (11.76) %
Percentage Change
Overall revenues of the general fund decreased $20,350,522 or 11.76%. The most significant decreases were in the areas of tax revenue and other revenue. Tax revenue decreased $12,218,586 or 9.04%. This decrease is mainly the result of lower municipal income tax collections. The decrease in other revenue is the result of decrease in indirect costs and miscellaneous revenues. Investment income decreased $2,893,624 or 62.38%. This decrease is the result of lower interest rates earned on investments compared to 2008.
Revenues – 2009
Investment Income1.14%Fines and Forfeitures
1.05%
Licenses and permits1.04%
Charges for Services15.31%
Intergovernmental0.72%
Other Revenues0.09%
Special assessment0.12%
Taxes80.53%
CITY OF DAYTON, OHIO
MANAGEMENT’S DISCUSSION AND ANALYSIS FOR THE YEAR ENDED DECEMBER 31, 2009
F 13
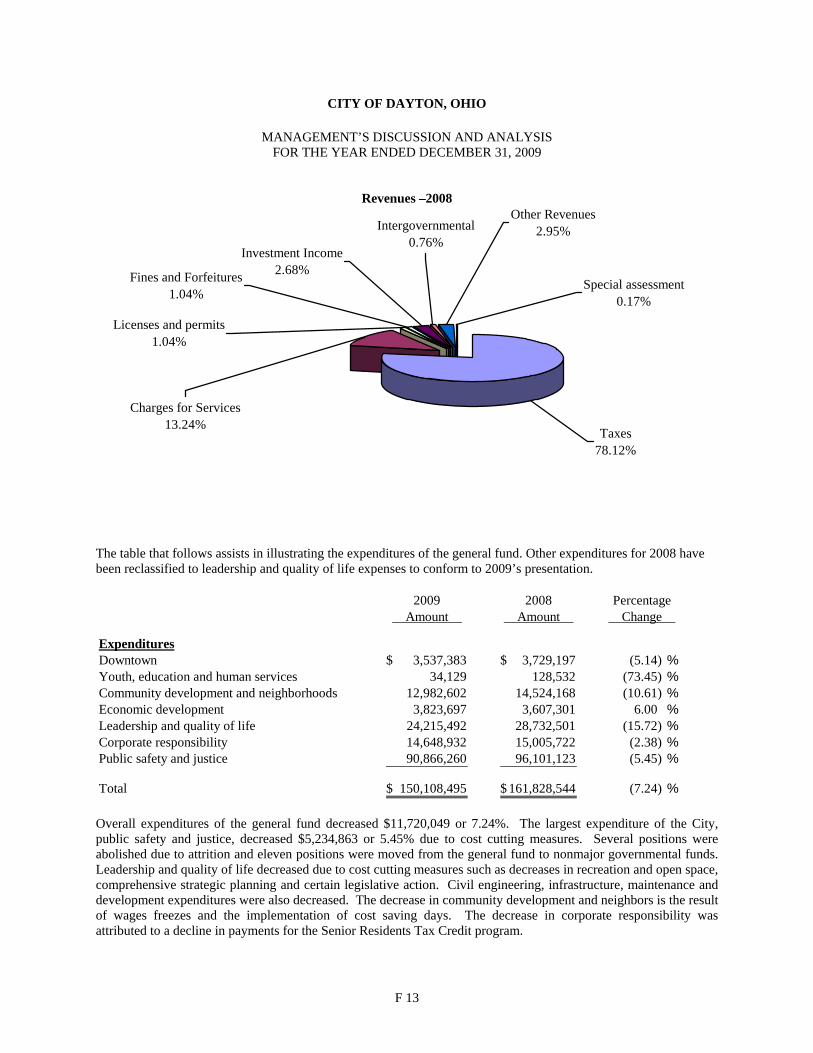
Revenues –2008
Investment Income2.68%Fines and Forfeitures
1.04%
Licenses and permits1.04%
Charges for Services13.24%
Intergovernmental0.76%
Other Revenues2.95%
Special assessment0.17%
Taxes78.12%
The table that follows assists in illustrating the expenditures of the general fund. Other expenditures for 2008 have been reclassified to leadership and quality of life expenses to conform to 2009’s presentation.
2009 2008 Amount Amount
ExpendituresDowntown 3,537,383$ 3,729,197$ (5.14) %Youth, education and human services 34,129 128,532 (73.45) %Community development and neighborhoods 12,982,602 14,524,168 (10.61) %Economic development 3,823,697 3,607,301 6.00 %Leadership and quality of life 24,215,492 28,732,501 (15.72) %Corporate responsibility 14,648,932 15,005,722 (2.38) %Public safety and justice 90,866,260 96,101,123 (5.45) %
Total 150,108,495$ 161,828,544$ (7.24) %
Percentage Change
Overall expenditures of the general fund decreased $11,720,049 or 7.24%. The largest expenditure of the City, public safety and justice, decreased $5,234,863 or 5.45% due to cost cutting measures. Several positions were abolished due to attrition and eleven positions were moved from the general fund to nonmajor governmental funds. Leadership and quality of life decreased due to cost cutting measures such as decreases in recreation and open space, comprehensive strategic planning and certain legislative action. Civil engineering, infrastructure, maintenance and development expenditures were also decreased. The decrease in community development and neighbors is the result of wages freezes and the implementation of cost saving days. The decrease in corporate responsibility was attributed to a decline in payments for the Senior Residents Tax Credit program.

CITY OF DAYTON, OHIO
MANAGEMENT’S DISCUSSION AND ANALYSIS FOR THE YEAR ENDED DECEMBER 31, 2009
F 14
Expenditures - 2009
Economic development
2.55%
Leadership and quality o f life
16.13%
Corporate responsibility
9.76%
Youth, education and
human services
0.02%
Community development
and neighborhoods
8.65%
Downtown2.36%
Public safety and justice
60.53%
Expenditures - 2008
Economic development
2.23%
Leadership and quality o f life
17.75%
Corporate responsibility
9.27%
Youth, education and
human services
0.08%
Community development
and neighborhoods
8.98%
Downtown2.30%
Public safety and justice
59.39%
CITY OF DAYTON, OHIO
MANAGEMENT’S DISCUSSION AND ANALYSIS FOR THE YEAR ENDED DECEMBER 31, 2009
F 15
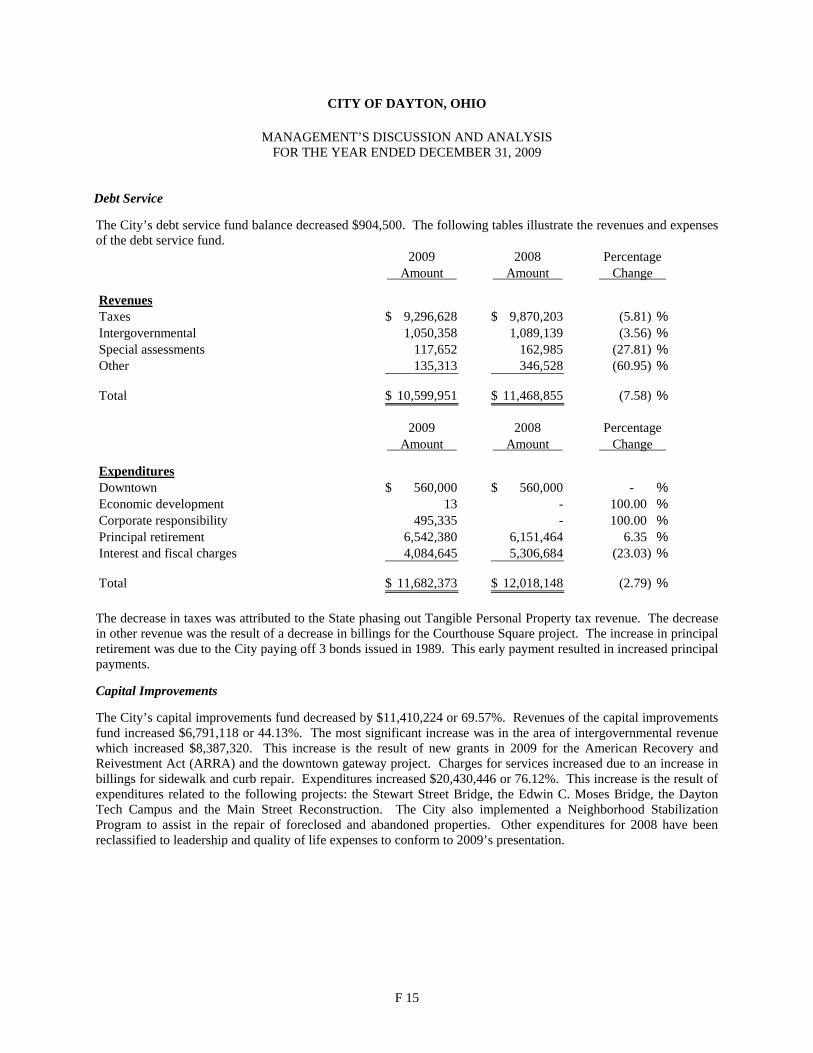
Debt Service The City’s debt service fund balance decreased $904,500. The following tables illustrate the revenues and expenses of the debt service fund.
2009 2008 Amount Amount
RevenuesTaxes 9,296,628$ 9,870,203$ (5.81) %Intergovernmental 1,050,358 1,089,139 (3.56) %Special assessments 117,652 162,985 (27.81) %Other 135,313 346,528 (60.95) %
Total 10,599,951$ 11,468,855$ (7.58) %
Percentage Change
2009 2008 Amount Amount
ExpendituresDowntown 560,000$ 560,000$ - %Economic development 13 - 100.00 %Corporate responsibility 495,335 - 100.00 %Principal retirement 6,542,380 6,151,464 6.35 %Interest and fiscal charges 4,084,645 5,306,684 (23.03) %
Total 11,682,373$ 12,018,148$ (2.79) %
Percentage Change
The decrease in taxes was attributed to the State phasing out Tangible Personal Property tax revenue. The decrease in other revenue was the result of a decrease in billings for the Courthouse Square project. The increase in principal retirement was due to the City paying off 3 bonds issued in 1989. This early payment resulted in increased principal payments. Capital Improvements The City’s capital improvements fund decreased by $11,410,224 or 69.57%. Revenues of the capital improvements fund increased $6,791,118 or 44.13%. The most significant increase was in the area of intergovernmental revenue which increased $8,387,320. This increase is the result of new grants in 2009 for the American Recovery and Reivestment Act (ARRA) and the downtown gateway project. Charges for services increased due to an increase in billings for sidewalk and curb repair. Expenditures increased $20,430,446 or 76.12%. This increase is the result of expenditures related to the following projects: the Stewart Street Bridge, the Edwin C. Moses Bridge, the Dayton Tech Campus and the Main Street Reconstruction. The City also implemented a Neighborhood Stabilization Program to assist in the repair of foreclosed and abandoned properties. Other expenditures for 2008 have been reclassified to leadership and quality of life expenses to conform to 2009’s presentation.

CITY OF DAYTON, OHIO
MANAGEMENT’S DISCUSSION AND ANALYSIS FOR THE YEAR ENDED DECEMBER 31, 2009
F 16
2009 2008 Amount Amount
RevenuesTaxes 1,106,009$ 1,355,313$ (18.39) %Charges for services 324,881 89,219 264.14 %Licenses and permits 36,156 10,699 237.94 %Intergovenmental 18,114,720 9,727,400 86.22 %Special assessments 12,800 12,329 3.82 %Other 2,586,514 4,195,002 (38.34) %
Total 22,181,080$ 15,389,962$ 44.13 %
Percentage Change
2009 2008 Amount Amount Change
ExpendituresDowntown 46,405$ -$ 100.00 %Youth, education and human services 24,984 - 100.00 %Community development and neighbors 593,719 13,532 4,287.52 %Economic development 6,417,920 1,960,529 227.36 %Leadership and quality of life 5,202,610 14,412 35,999.15 %Corporate responsibility 890 - 100.00 %Public safety and justice 27,377 - 100.00 %Capital outlay 34,887,179 24,852,628 40.38 %Debt service 70,463 - 100.00 %
Total 47,271,547$ 26,841,101$ 76.12 %
Percentage
Budgeting Highlights – General Fund The City’s budgeting process is prescribed by the Ohio Revised Code (ORC) and the City of Dayton Charter. Essentially the budget is a representation of the City’s various adopted appropriations. The annual expenditure budget is limited by the amount of anticipated revenues and available cash balances certified by the Budget Commission in accordance with the ORC. Given that City’s plans or priorities may change during the year or economic conditions may improve or deteriorate, revisions to the original budget are customary and necessary. For instance, if budgeted revenues are adjusted during the course of the year due to actual activity, then the appropriations should be adjusted accordingly. In addition, if funding priorities change during the fiscal year, resources may be reallocated from one activity to another, necessitating a corresponding change in budget. Budgetary information is presented for the general fund on page F 36. With respect to changes to the general fund, the final budget reflects revenues that were $8.8 million less than the original budget. Actual revenues were $8.9 million or 5.4% under the original budget and $149,080 or 0.1% less than the final budget. Six revenue categories realized variances in excess of 10%, largely as a result of the worst recession since the Great Depression. The first was state-shared taxes with actual revenues registering 13.6% or $2.1 million under the original budget and just 1.0% over the final budget. State taxes distributed to local governments retreated as a consequence of the deep national recession. Licenses and permits experienced receipts over budget by 12.4% compared to the original budget and 5.8% less than the final budget. Building and other permits floundered in the face of declining real property values. Intergovernmental revenues were $212,479 under original budget or 15.8% due to lower levels of homestead rollback. Special assessments revenue for 2009 was $30,634 or 19.3% higher than the final estimate.
CITY OF DAYTON, OHIO
MANAGEMENT’S DISCUSSION AND ANALYSIS FOR THE YEAR ENDED DECEMBER 31, 2009
F 17
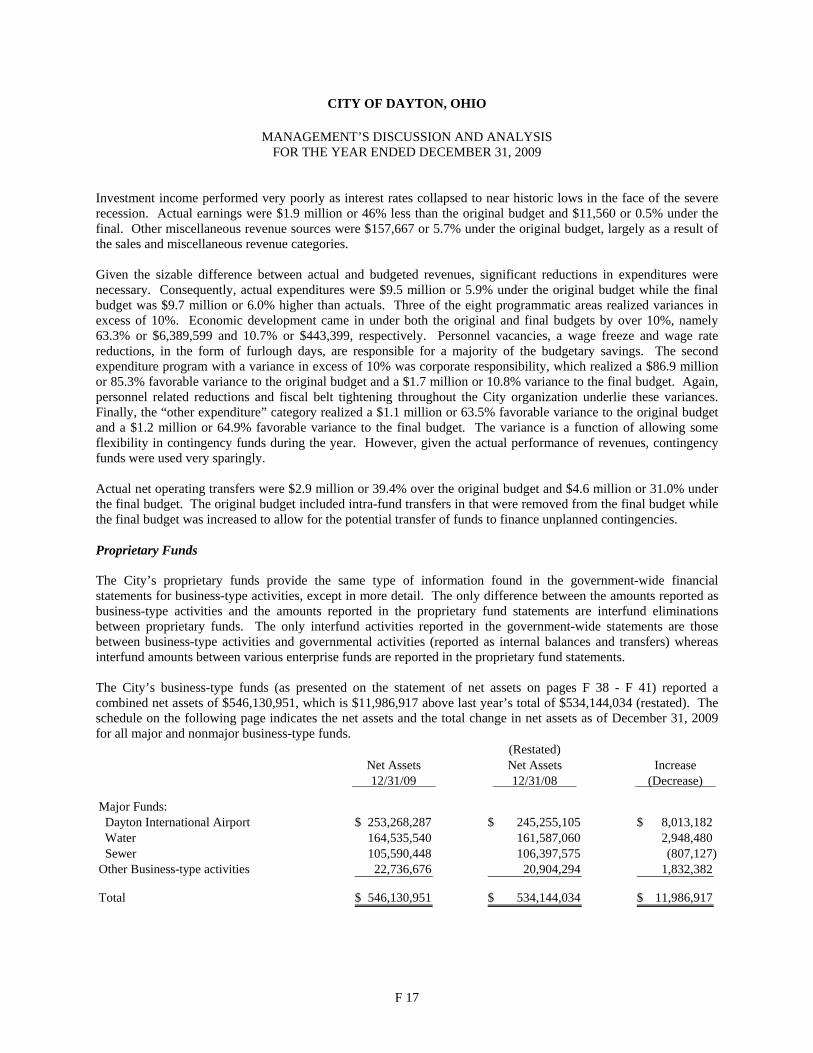
Investment income performed very poorly as interest rates collapsed to near historic lows in the face of the severe recession. Actual earnings were $1.9 million or 46% less than the original budget and $11,560 or 0.5% under the final. Other miscellaneous revenue sources were $157,667 or 5.7% under the original budget, largely as a result of the sales and miscellaneous revenue categories. Given the sizable difference between actual and budgeted revenues, significant reductions in expenditures were necessary. Consequently, actual expenditures were $9.5 million or 5.9% under the original budget while the final budget was $9.7 million or 6.0% higher than actuals. Three of the eight programmatic areas realized variances in excess of 10%. Economic development came in under both the original and final budgets by over 10%, namely 63.3% or $6,389,599 and 10.7% or $443,399, respectively. Personnel vacancies, a wage freeze and wage rate reductions, in the form of furlough days, are responsible for a majority of the budgetary savings. The second expenditure program with a variance in excess of 10% was corporate responsibility, which realized a $86.9 million or 85.3% favorable variance to the original budget and a $1.7 million or 10.8% variance to the final budget. Again, personnel related reductions and fiscal belt tightening throughout the City organization underlie these variances. Finally, the “other expenditure” category realized a $1.1 million or 63.5% favorable variance to the original budget and a $1.2 million or 64.9% favorable variance to the final budget. The variance is a function of allowing some flexibility in contingency funds during the year. However, given the actual performance of revenues, contingency funds were used very sparingly. Actual net operating transfers were $2.9 million or 39.4% over the original budget and $4.6 million or 31.0% under the final budget. The original budget included intra-fund transfers in that were removed from the final budget while the final budget was increased to allow for the potential transfer of funds to finance unplanned contingencies. Proprietary Funds The City’s proprietary funds provide the same type of information found in the government-wide financial statements for business-type activities, except in more detail. The only difference between the amounts reported as business-type activities and the amounts reported in the proprietary fund statements are interfund eliminations between proprietary funds. The only interfund activities reported in the government-wide statements are those between business-type activities and governmental activities (reported as internal balances and transfers) whereas interfund amounts between various enterprise funds are reported in the proprietary fund statements. The City’s business-type funds (as presented on the statement of net assets on pages F 38 - F 41) reported a combined net assets of $546,130,951, which is $11,986,917 above last year’s total of $534,144,034 (restated). The schedule on the following page indicates the net assets and the total change in net assets as of December 31, 2009 for all major and nonmajor business-type funds.
(Restated)Net Assets Net Assets Increase
12/31/09 12/31/08 (Decrease)
Major Funds: Dayton International Airport 253,268,287$ 245,255,105$ 8,013,182$ Water 164,535,540 161,587,060 2,948,480 Sewer 105,590,448 106,397,575 (807,127) Other Business-type activities 22,736,676 20,904,294 1,832,382
Total 546,130,951$ 534,144,034$ 11,986,917$

CITY OF DAYTON, OHIO
MANAGEMENT’S DISCUSSION AND ANALYSIS FOR THE YEAR ENDED DECEMBER 31, 2009
F 18
Dayton International Airport The City’s Dayton International Airport net assets increased $8,013,182 due mainly to capital contributions made to the fund. The following tables illustrate the revenues and expenses of the Dayton International Airport fund.
2009 2008 Amount Amount
Operating RevenuesCharges for services 24,943,894$ 24,199,137$ 3.08 %Other 5,712,056 6,868,281 (16.83) %
Total 30,655,950$ 31,067,418$ (1.32) %
Percentage Change
Operating revenues of the DIA fund decreased $411,468. This decrease is mainly the result of decreased revenues for customer facility charges for auto rentals as well as a decrease in other miscellaneous revenues.
2009 2008 Amount Amount
Operating ExpensesPersonal services 8,357,108$ 9,179,423$ (8.96) %Benefit payments 3,069,251 2,723,465 12.70 %Contractual services 12,219,435 3,662,022 233.68 %Materials and supplies 716,302 932,089 (23.15) %Utilities 1,977,538 1,832,641 7.91 %Depreciation 9,461,860 8,973,698 5.44 %Other 2,262,323 2,568,210 (11.91) %
Total 38,063,817$ 29,871,548$ 27.42 %
Percentage Change
Operating expenses increased $8,192,269 or 27.42%. This increase is due to an increase in contractual services. Contractual services increased $8,557,413 or 233.68% due to an increase in other professional services related to security system upgrades, land use studies and non-capitalized expenses related to a new airport parking garage.
2009 2008 Amount Amount
Nonoperating Revenues (Expenses)Interest revenue 471,666$ 1,790,431$ (73.66) %Interest expense and fiscal charges (2,082,373) (2,211,477) (5.84) %Loss of sale of capital assets - (29,828) (100.00) %Capital contributions 16,881,998 21,316,626 (20.80) %
Total 15,271,291$ 20,865,752$ (26.81) %
Percentage Change
Other operating revenues and expenses decreased $5,594,461 due to a decrease in interest revenue and capital contributions. Interest revenue decreased due to lower interest rates earned on investments as well as a decrease in the cash balance of the fund. Capital contributions decreased due to lower federal grant money received for construction projects at the airport as well as a decrease in passenger facility charges.

CITY OF DAYTON, OHIO
MANAGEMENT’S DISCUSSION AND ANALYSIS FOR THE YEAR ENDED DECEMBER 31, 2009
F 19
Water The City’s water fund net assets increased by $2,948,480 or 1.82%.
2009 2008 Amount Amount
Operating RevenuesCharges for services 45,148,024$ 45,382,902$ (0.52) %Other 2,595,726 3,561,718 (27.12) %
Total 47,743,750$ 48,944,620$ (2.45) %
Percentage Change
Operating revenues decreased $1,200,870 or 2.45%. The most significant decrease was in other revenues which decreased 27.12%. This decrease is mainly due to a decrease in administrative overhead revenues received by the water fund.
2009 2008 Amount Amount
Operating ExpensesPersonal services 14,713,456$ 15,395,093$ (4.43) %Benefit payments 5,400,719 5,170,299 4.46 %Contractual services 5,784,173 3,685,395 56.95 %Materials and supplies 4,812,093 6,008,238 (19.91) %Utilities 6,238,060 6,729,124 (7.30) %Depreciation 6,450,497 6,343,172 1.69 %Other 2,118,472 2,426,838 (12.71) %
Total 45,517,470$ 45,758,159$ (0.53) %
Percentage Change
Operating expenses decreased $240,689 or 0.53%. This decrease is the result of cost cutting measures in the area of personal services and materials and supplies expenses.
2009 2008 Amount Amount
Nonoperating Revenues (Expenses)Interest revenue 244,902$ 973,789$ (74.85) %Loss of sale of capital assets - (239,581) (100.00) %Capital contributions 216,235 - 100.00 %
Total 461,137$ 734,208$ (37.19) %
Percentage Change
Interest revenue of the water fund decreased $728,887 due to a decrease in interest rates earned on investments.

CITY OF DAYTON, OHIO
MANAGEMENT’S DISCUSSION AND ANALYSIS FOR THE YEAR ENDED DECEMBER 31, 2009
F 20
Sewer The City’s sewer fund net assets decreased $807,127 or 0.76% during 2009.
2009 2008 Amount Amount
Operating RevenuesCharges for services 30,527,482$ 29,612,848$ 3.09 %Other 471,257 785,309 (39.99) %
Total 30,998,739$ 30,398,157$ 1.98 %
Percentage Change
Operating revenues increased $600,582 or 1.98% due mainly to an increase in consumption during 2009. Other operating revenues declined due to reduced meter sewer flows from other jurisdictions and customers outside the City.
2009 2008 Amount Amount
Operating ExpensesPersonal services 6,889,500$ 7,328,269$ (5.99) %Benefit payments 2,505,752 2,125,066 17.91 %Contractual services 8,376,418 6,800,395 23.18 %Materials and supplies 2,298,382 2,119,791 8.42 %Utilities 2,968,559 3,692,392 (19.60) %Depreciation 7,722,188 7,463,018 3.47 %Other 697,978 670,923 4.03 %
Total 31,458,777$ 30,199,854$ 4.17 %
Percentage Change
Operating expenses increased $1,258,923 or 4.17% due mainly to an increase in contractual service expenses. This increase is mainly the result of increased sludge disposal fees and other professional service fees.
2009 2008 Amount Amount
Nonoperating ExpensesInterest expense and fiscal charges (451,675)$ (455,715)$ 0.89 %Loss on disposal of capital assets - (284,086) 100.00 %
Total (451,675)$ (739,801)$ 38.95 %
Percentage Change

CITY OF DAYTON, OHIO
MANAGEMENT’S DISCUSSION AND ANALYSIS FOR THE YEAR ENDED DECEMBER 31, 2009
F 21
Capital Assets and Debt Administration Capital Assets At December 31, 2009, the City had $813,983,982 (net of accumulated depreciation) invested in land, buildings and improvements, improvements other than buildings, equipment, vehicles, infrastructure and construction in progress (CIP). Of this total, $361,678,430 was reported in governmental activities and $452,305,552 was reported in business-type activities. See Note 10 in the basic financial statements for additional capital asset disclosure. The following table shows December 31, 2009 balances compared to December 31, 2008:
Capital Assets at December 31 (Net of Depreciation)
Governmental Governmental Business-Type Business-Type
Activities Activities Activities Activities Total Total 2009 2008 2009 2008 2009 2008
Land 66,987,820$ 64,248,442$ 42,879,702$ 42,663,240$ 109,867,522$ 106,911,682$ Construction in progress 42,902,447 9,915,488 43,686,959 24,809,724 86,589,406 34,725,212 Buildings and improvements 41,978,496 43,233,493 85,322,858 87,665,083 127,301,354 130,898,576 Improvements other than buildings 17,627,152 18,830,388 260,845,685 267,683,200 278,472,837 286,513,588 Equipment 7,134,633 7,632,609 6,864,677 7,654,579 13,999,310 15,287,188 Vehicles 11,645,189 13,623,073 12,705,671 12,989,172 24,350,860 26,612,245 Infrastructure 173,402,693 176,873,327 - - 173,402,693 176,873,327
Total 361,678,430$ 334,356,820$ 452,305,552$ 443,464,998$ 813,983,982$ 777,821,818$
The following graphs show the breakdown of governmental capital assets by category for 2009 and 2008.
Capital Assets - Governmental Activities 2009
Infrastructure47.95%
Vehicles3.22%Equipment
1.97%
I.O.T.B.4.87%
Buildings & imp.
11.61%
Land18.52%
CIP11.86%
Capital Assets - Governmental Activities 2008
Infrastructure52.90%
Vehicles4.07%
Equipment2.28%
I.O.T.B.5.63%
Buildings & imp.
12.93%
Land19.22% CIP
2.97% The City’s largest capital asset category is infrastructure which includes roads, bridges, culverts, sidewalks, curbs, annexed roadways, right-of-way, street lighting, and traffic signals. These items are immovable and of value only to the City, however, the annual cost of purchasing these items is quite significant. The net book value of the City’s infrastructure (cost less accumulated depreciation) represents approximately 47.95% of the City’s total governmental capital assets.
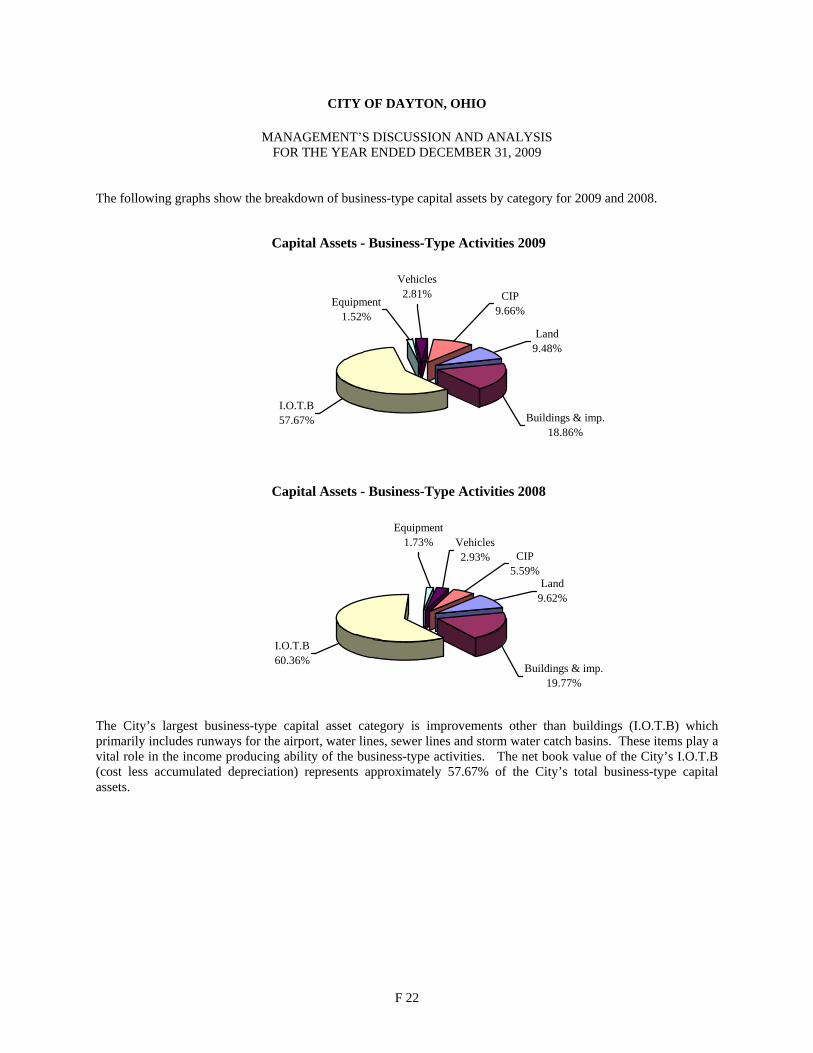
CITY OF DAYTON, OHIO
MANAGEMENT’S DISCUSSION AND ANALYSIS FOR THE YEAR ENDED DECEMBER 31, 2009
F 22
The following graphs show the breakdown of business-type capital assets by category for 2009 and 2008.
Capital Assets - Business-Type Activities 2009
Vehicles2.81%
Land9.48%
CIP9.66%
Buildings & imp.18.86%
Equipment1.52%
I.O.T.B57.67%
Capital Assets - Business-Type Activities 2008
Vehicles2.93%
Land9.62%
CIP5.59%
Buildings & imp.19.77%
Equipment1.73%
I.O.T.B60.36%
The City’s largest business-type capital asset category is improvements other than buildings (I.O.T.B) which primarily includes runways for the airport, water lines, sewer lines and storm water catch basins. These items play a vital role in the income producing ability of the business-type activities. The net book value of the City’s I.O.T.B (cost less accumulated depreciation) represents approximately 57.67% of the City’s total business-type capital assets.

CITY OF DAYTON, OHIO
MANAGEMENT’S DISCUSSION AND ANALYSIS FOR THE YEAR ENDED DECEMBER 31, 2009
F 23
Debt Administration The City had the following long-term obligations outstanding at December 31, 2009 and 2008:
Governmental GovernmentalActivities Activities
2009 2008
General obligation bonds 56,284,054$ 49,441,334$ Revenue bonds 39,925,000 40,500,000 Special assessment bonds 299,500 409,600
Total bonds 96,508,554 90,350,934
OPWC loans 197,334 208,176 Capital lease obligations - 1,494,000
Total long-term obligations 96,705,888$ 92,053,110$
Business-type Business-typeActivities Activities
2009 2008
General obligation bonds 12,195,946$ 1,653,666$ Revenue bonds 36,980,000 38,095,000
Total bonds 49,175,946 39,748,666
DIA Long-term Notes 485,000 1,885,000
Total Notes 485,000 1,885,000
OWDA loans 11,118,492 11,774,364 OPWC loans 550,000 600,000
Total loans 11,668,492 12,374,364
Total long-term obligations 61,329,438$ 54,008,030$ See Notes 11, 12 and 13 in the basic financial statements for additional disclosures and detail regarding the City’s debt activity.

CITY OF DAYTON, OHIO
MANAGEMENT’S DISCUSSION AND ANALYSIS FOR THE YEAR ENDED DECEMBER 31, 2009
F 24
A comparison of the long-term obligations by category is depicted in the chart below.
GovernmentalBusiness-Type
$49,175,946
485,000
$11,668,492
$96,508,554
-$197,334
-10,000,00020,000,000
30,000,000
40,000,000
50,000,000
60,000,000
70,000,000
80,000,000
90,000,000
100,000,000
Long-term obligations
LoansNotesBonds
Economic Factors and the 2010 Budget To borrow a metaphor, it appears as though the worst of the economic tsunami has passed. As in the aftermath of most cataclysmic storms, our nation is now counting the casualties and taking stock of the damages. Although the worst may now be over, the recent downturn, known now as the “Great Recession”, has created a pervasive and persistent legacy in the collective psyche of our nation and much of the world. The balance sheets of many American families as well as American business, will take years to be restored, as will their confidence. What presaged the recent recession was a housing asset bubble that was the result of lax lending standards, unchecked risk taking and old fashioned greed. When an unprecedented number of mortgages began to default, many of which had been securitized into mortgage-backed securities, the problem moved from Main Street to Wall Street. The solvency of the entire financial industry was in question and the stock market sold off sharply. With the prospect of job loss looming large and with the value of their assets sinking daily, consumers retreated from the malls and shopping centers. Businesses responded in kind with the lay-off of millions of workers and the recessionary cycle became entrenched. It would soon become the longest recession on record. And yet recovery is underway in many parts of our nation. Gross Domestic Product (GDP), or the broadest measure of economic activity, has grown for 3 consecutive quarters, consumers are shopping again, and inchoate job growth can now be seen. Nevertheless, the U.S. is a large and diverse country and growth and prosperity has never been evenly distributed. The industrial Midwest was the first to enter the recession and will likely be among the last out. Dayton, for its part, has not seen job growth since prior to the 2001 recession and is at its lowest employment level since the mid-1980s. Montgomery County, in which Dayton is the county seat, has experienced an astonishing 20% decline in jobs since 2000, with about 50% of the loss coming from the previously well-paid manufacturing sector. Budget planning in uncertain times such as these is indeed challenging. The 2010 budget was developed at a time when economic recovery for our nation seemed possible, but exactly when and to what extent and magnitude, could only be guessed. Certainly, the efforts of the Federal Reserve with its trillions of dollars in new lending facilities together with the stimulus provided by the American Recovery and Reinvestment Act have lessened the blow. However, City officials recognized that it may be years or even longer, before the Dayton region rebounds to its previous employment peaks.

CITY OF DAYTON, OHIO
MANAGEMENT’S DISCUSSION AND ANALYSIS FOR THE YEAR ENDED DECEMBER 31, 2009
F 25
0
1,000
2,000
3,000
4,000
5,000
6,000
Civil Mortgage Foreclosure Filings
360
365
370
375
380
385
390
395
400
405
410
415
420
425
430
435
440
Jan Feb Mar Apr May Jun Jul Aug Sep Oct Nov Dec
2000200120022003200420052006200720082009
Dayton MSA Total Non‐Farm Employment(Seasonally Adjusted, In Thousands)
Employment Unlike most of the nation, the Dayton region has been mired in economic decline for a decade. In other words, our region did not recover from the last recession in 2001 as the graph to the right illustrates. In fact, employment levels have not been this low for 25 years—or stated differently, for a generation. The major cause of the economic malaise can be summed up in one word: manufacturing. Since 1990, manufacturing employment is down an astonishing 42,700 or over 52%. The magnitude of the loss suggests a local manufacturing depression. Regrettably, with the closing of many local plants, these jobs are gone for good. Job losses during the recession have not been limited to just manufacturing. Every sector except Education & Health Services and Leisure & Hospitality has experienced declines. Unemployment in the Dayton metropolitan area currently stands at 12.3% of the workforce while the City is even higher at 13.4%. Given that the City’s major revenue source is the income tax, the protracted downturn and loss of jobs has negatively impacted City revenues. Property Values As mentioned above, what precipitated the current downturn were the mortgage foreclosure crisis and the resulting plunge in property values that subtracted trillions of dollars in equity from the U.S. housing market. Although much of the Midwest did not participate in the rapid price appreciation experienced in such markets as Las Vegas, Miami, Phoenix and Los Angeles, we weren’t immune to the devastating aftermath.

CITY OF DAYTON, OHIO
MANAGEMENT’S DISCUSSION AND ANALYSIS FOR THE YEAR ENDED DECEMBER 31, 2009
F 26
500,000,000
600,000,000
700,000,000
800,000,000
900,000,000
1,000,000,000
1,100,000,000
1,200,000,000
1,300,000,000
1,400,000,000
City of Dayton Residential Property Values(in current dollars)
Data Source for Actual Values: Montgomery County Auditor's Office
Reval.
Triennial
Reval.Reval.
Reval.
* Revaluation ** Triennial Update
TriennialReval.
As the graph above depicts, foreclosures in Montgomery County began to escalate in the late 1990s, peaked at just over 5,000 for three consecutive years and then improved to 4,703 filings in 2009. Despite the recent improvement, current levels represent an almost five-fold increase from 1995. Consequently, assessed residential property values have fallen for the last two years as shown in the adjacent graph and delinquencies have been steadily rising. Both of these factors have depressed 2010 property tax revenues for the City and will continue to do so in the future.
Local Government Revenue Sharing The impact of the economic downturn on State of Ohio tax sources, and hence revenue-sharing with local governments, has been dramatic. The Local Government Fund is composed of 3.68% of all General Revenue Fund (GRF) tax sources distributed to municipalities based on a locally approved formula. For the State fiscal year ending on June 30, 2009, GRF tax receipts were down 12% and State projections for 2010 expect further declines. Governor Strickland’s council of economic advisers’ forecast projects job losses continuing until State fiscal year 2011. This forecast does not bode well for the City’s second largest general fund revenue source. Next Year’s Budget and Rates Despite the very difficult economic conditions faced by the City organization, the unencumbered general fund balance on a budgetary basis is expected to remain within the minimum policy parameter level of 6 weeks of operating reserves. Contacting the City’s Financial Management This financial report is designed to provide our citizens, taxpayers, and investors and creditors with a general overview of the City’s finances and to show the City’s accountability for the money it receives. If you have questions about this report or need additional financial information contact Cheryl Garrett, Finance Director, City of Dayton, 101 West Third Street, P.O. box 22, Dayton, OH 45401-0022, or visit our website at www.cityofdayton.org.

BASICFINANCIAL STATEMENTS
F 27

Governmental Business-type ComponentActivities Activities Total Unit
Assets:Equity in pooled cash and cash equivalents . . . . . . . . . . $ 77,919,025 $ 143,444,065 $ 221,363,090 $ 188,983 Investments . . . . . . . . . . . . . . . . . . . . . . . . . . 93,150 - 93,150 275,000 Receivables (net of allowances for uncollectibles):
Property and other local taxes. . . . . . . . . . . . . . . . 22,398,893 - 22,398,893 - Municipal income taxes . . . . . . . . . . . . . . . . . . 15,287,978 - 15,287,978 - Accounts . . . . . . . . . . . . . . . . . . . . . . . . . . 3,967,710 15,163,666 19,131,376 180,060 Contracts . . . . . . . . . . . . . . . . . . . . . . . . . . - - - 1,267,985 Special assessments. . . . . . . . . . . . . . . . . . . . . 1,202,383 912,180 2,114,563 - Accrued interest . . . . . . . . . . . . . . . . . . . . . . 515,168 400,198 915,366 1,979,562 Loans. . . . . . . . . . . . . . . . . . . . . . . . . . . . 25,700,000 - 25,700,000 20,661,501 Other . . . . . . . . . . . . . . . . . . . . . . . . . . . . - - - 103,484
Internal balances. . . . . . . . . . . . . . . . . . . . . . . . 1,016,435 (1,016,435) - - Due from other governments . . . . . . . . . . . . . . . . . 32,805,411 6,101,221 38,906,632 - Prepayments. . . . . . . . . . . . . . . . . . . . . . . . . . 444,888 246,653 691,541 110,774 Materials and supplies inventory. . . . . . . . . . . . . . . . - 1,855,998 1,855,998 - Inventory held for resale . . . . . . . . . . . . . . . . . . . . 671,729 - 671,729 - Deposits. . . . . . . . . . . . . . . . . . . . . . . . . . . . - - - 10,704 Advances to component unit. . . . . . . . . . . . . . . . . . 13,194,307 1,777,778 14,972,085 - Unamortized bond issue costs . . . . . . . . . . . . . . . . 1,530,767 1,712,676 3,243,443 - Restricted assets: Equity in pooled cash and cash equivalents . . . . . . . . . . - 80,548 80,548 742,099 Cash with fiscal and escrow agents . . . . . . . . . . . . . . 1,891 3,014,052 3,015,943 - Equity investments. . . . . . . . . . . . . . . . . . . . . . . - - - 1,659,081 Deferred bond costs . . . . . . . . . . . . . . . . . . . . . - - - 57,455 Capital assets:
Land and construction in progress. . . . . . . . . . . . . . 109,890,267 86,566,661 196,456,928 - Depreciable capital assets, net . . . . . . . . . . . . . . . 251,788,163 365,738,891 617,527,054 14,417,529 Total capital assets. . . . . . . . . . . . . . . . . . . . . . 361,678,430 452,305,552 813,983,982 14,417,529
Total assets. . . . . . . . . . . . . . . . . . . . . . . . . . . 558,428,165 625,998,152 1,184,426,317 41,654,217
- - Continued
CITY OF DAYTON, OHIO
DECEMBER 31, 2009STATEMENT OF NET ASSETS
SEE ACCOMPANYING NOTES TO THE BASIC FINANCIAL STATEMENTS
Primary Government
F 28

Governmental Business-type ComponentActivities Activities Total Unit
Liabilities: Accounts payable. . . . . . . . . . . . . . . . . . . . . . $ 1,433,159 $ 3,134,667 $ 4,567,826 $ 261,024 Contracts payable. . . . . . . . . . . . . . . . . . . . . . 5,405,554 6,460,876 11,866,430 - Airline settlement payable. . . . . . . . . . . . . . . . . . - 978,556 978,556 Accrued wages and benefits . . . . . . . . . . . . . . . . 3,559,892 1,081,579 4,641,471 - Retainage payable . . . . . . . . . . . . . . . . . . . . . 2,781,702 2,490,305 5,272,007 - Grants payable . . . . . . . . . . . . . . . . . . . . . . . - - - 387,864 Due to other governments . . . . . . . . . . . . . . . . . 7,567,231 788,851 8,356,082 - Unearned revenue . . . . . . . . . . . . . . . . . . . . . 17,663,406 - 17,663,406 - Accrued interest payable. . . . . . . . . . . . . . . . . . 297,096 219,226 516,322 14,706 Accrued liabilities and other payables . . . . . . . . . . . . - - - 1,932,736 Advances from primary government. . . . . . . . . . . . . - - - 14,972,085 Payable from restricted assets: Utility deposits . . . . . . . . . . . . . . . . . . . . . . - 80,548 80,548 - Accrued interest payable . . . . . . . . . . . . . . . . . - 201,323 201,323 - Long-term liabilities:
Due within one year. . . . . . . . . . . . . . . . . . . 13,976,270 4,651,837 18,628,107 1,720,508 Due in more than one year . . . . . . . . . . . . . . . 99,228,984 59,800,391 159,029,375 9,325,902
Total liabilities . . . . . . . . . . . . . . . . . . . . . . 151,913,294 79,888,159 231,801,453 28,614,825 Minority interest - - - 9,848
Net assets: Invested in capital assets, net of related debt . . . . . . . 304,910,802 401,965,547 706,876,349 11,809,640 Restricted for:
Permanent fund: Expendable. . . . . . . . . . . . . . . . . . . . . . 76,354 - 76,354 - Nonexpendable. . . . . . . . . . . . . . . . . . . . 102,228 - 102,228 - Capital projects. . . . . . . . . . . . . . . . . . . . . 19,926,984 - 19,926,984 - Debt service . . . . . . . . . . . . . . . . . . . . . . 45,589,396 - 45,589,396 - Housing and urban development. . . . . . . . . . . . . 5,378,296 - 5,378,296 - Special projects . . . . . . . . . . . . . . . . . . . . 12,560,397 - 12,560,397 - Street and highway projects. . . . . . . . . . . . . . . 3,013,380 - 3,013,380 - Program income from revolving loans. . . . . . . . . . - - - 742,099 Other purposes. . . . . . . . . . . . . . . . . . . . . 4,916,302 - 4,916,302 -
Unrestricted. . . . . . . . . . . . . . . . . . . . . . . . 10,040,732 144,144,446 154,185,178 477,805
Total net assets . . . . . . . . . . . . . . . . . . . . . . $ 406,514,871 $ 546,109,993 $ 952,624,864 $ 13,029,544
SEE ACCOMPANYING NOTES TO THE BASIC FINANCIAL STATEMENTS
CITY OF DAYTON, OHIO
STATEMENT OF NET ASSETS (CONTINUED)DECEMBER 31, 2009
Primary Government
F 29

Operating Grants Capital GrantsCharges for and and
Expenses Services Contributions ContributionsPrimary Government: Governmental Activities:
Downtown. . . . . . . . . . . . . . . . . . . . . . . 5,182,850$ 588,229$ -$ 88,631$ Youth, education and human services. . . . . . . . . . 2,264,862 7,618 278,160 47,718 Community development and neighborhoods . . . . . . 21,342,171 2,289,894 13,306,998 1,133,971 Economic development . . . . . . . . . . . . . . . . . 14,263,940 1,438,105 927,322 14,510,035 Leadership and quality of life . . . . . . . . . . . . . . 47,091,889 4,411,912 6,190,345 9,936,703 Corporate responsibility. . . . . . . . . . . . . . . . . 17,707,683 2,853,032 80,480 1,700 Public safety and justice. . . . . . . . . . . . . . . . . 95,706,450 17,398,578 3,364,518 52,289 Interest and fiscal charges. . . . . . . . . . . . . . . 3,620,502 - - -
Total governmental activities . . . . . . . . . . . . . . 207,180,347 28,987,368 24,147,823 25,771,047 Business-type Activities:
Dayton International Airport . . . . . . . . . . . . . 40,310,513 30,655,950 - 16,881,998 Water . . . . . . . . . . . . . . . . . . . . . . . . . 45,672,640 47,743,750 - 216,235 Sewer . . . . . . . . . . . . . . . . . . . . . . . . . 31,994,865 30,998,739 - - Other business-type activities: Golf. . . . . . . . . . . . . . . . . . . . . . . . . 3,281,384 3,250,241 - - Storm Water. . . . . . . . . . . . . . . . . . . . . 5,401,928 7,083,455 - -
Total business-type activities . . . . . . . . . . . . . . 126,661,330 119,732,135 - 17,098,233
Total primary government . . . . . . . . . . . . . . . 333,841,677$ 148,719,503$ 24,147,823$ 42,869,280$
Component Unit: CityWide Development Corporation . . . . . . . . . 6,849,121$ 2,904,567$ -$ 3,726,077$
Change in net assets . . . . . . . . . . . . . . . . . . . . . . . . . . . . . . .
Net assets, January 1 (restated) . . . . . . . . . . . . . . . . . . . . . . . .
Transfers . . . . . . . . . . . . . . . . . . . . . . . . . . . . . . . . . . . . .
Total general revenues . . . . . . . . . . . . . . . . . . . . . . . . . . . . . .
CITY OF DAYTON, OHIO
Miscellaneous . . . . . . . . . . . . . . . . . . . . . . . . . . . . . . . . . .
FOR THE YEAR ENDED DECEMBER 31, 2009
Capital projects . . . . . . . . . . . . . . . . . . . . . . . . . . . . . . . .
General purposes. . . . . . . . . . . . . . . . . . . . . . . . . . . . . . . .
General Revenues:
Debt service . . . . . . . . . . . . . . . . . . . . . . . . . . . . . . . . . .
STATEMENT OF ACTIVITIES
Property taxes levied for:
Program Revenues
SEE ACCOMPANYING NOTES TO THE BASIC FINANCIAL STATEMENTS
Total general revenues and transfers. . . . . . . . . . . . . . . . . . . . . . .
General purposes. . . . . . . . . . . . . . . . . . . . . . . . . . . . . . . .Income taxes levied for:
Grants and entitlements not restricted to specific programs . . . . . . . . . . . .
Net assets, December 31 . . . . . . . . . . . . . . . . . . . . . . . . . . . .
Investment earnings . . . . . . . . . . . . . . . . . . . . . . . . . . . . . . .
F 30

Primary GovernmentGovernmental Business-type Component
Activities Activities Total Unit
(4,505,990)$ -$ (4,505,990)$ -$ (1,931,366) - (1,931,366) - (4,611,308) - (4,611,308) - 2,611,522 - 2,611,522 -
(26,552,929) - (26,552,929) - (14,772,471) - (14,772,471) - (74,891,065) - (74,891,065) -
(3,620,502) - (3,620,502) -
(128,274,109) - (128,274,109) -
- 7,227,435 7,227,435 - - 2,287,345 2,287,345 - - (996,126) (996,126) -
- (31,143) (31,143) - - 1,681,527 1,681,527 -
- 10,169,038 10,169,038 -
(128,274,109) 10,169,038 (118,105,071) -
- - - (218,477)
9,274,153 - 9,274,153 - 8,690,698 - 8,690,698 - 1,106,009 - 1,106,009 -
99,817,917 - 99,817,917 - 14,827,230 - 14,827,230 -
1,311,141 716,568 2,027,709 28,044 4,673,485 - 4,673,485 -
139,700,633 716,568 140,417,201 28,044
(662,961) 662,961 - -
139,037,672 1,379,529 140,417,201 28,044
10,763,563 11,548,567 22,312,130 (190,433)
395,751,308 534,561,426 930,312,734 13,219,977
$ 406,514,871 $ 546,109,993 $ 952,624,864 $ 13,029,544
Net (Expense) Revenue and Changes in Net Assets
F 31

Other Total Capital Governmental Governmental
General Debt Service Improvements Funds FundsAssets:
Equity in pooled cash and cash equivalents . . . . . $ 30,231,610 $ 15,576,635 $ 1,231,530 $ 16,195,183 $ 63,234,958 Investments . . . . . . . . . . . . . . . . . . . . . - - - 93,150 93,150 Receivables (net of allowance for uncollectibles):
Property and other local taxes . . . . . . . . . . . 11,217,134 11,181,759 - - 22,398,893 Municipal income taxes . . . . . . . . . . . . . . 15,287,978 - - - 15,287,978 Accounts . . . . . . . . . . . . . . . . . . . . . 3,713,707 25,000 60,466 153,862 3,953,035 Special assessments. . . . . . . . . . . . . . . . 159,640 787,825 - 254,918 1,202,383 Accrued interest . . . . . . . . . . . . . . . . . 484,686 12,541 9,428 8,513 515,168 Loans . . . . . . . . . . . . . . . . . . . . . . . - 25,700,000 - - 25,700,000 Interfund loans . . . . . . . . . . . . . . . . . . 1,797,311 - - - 1,797,311
Due from other funds . . . . . . . . . . . . . . . . 47,909 - 2,506 9,912 60,327 Due from other governments . . . . . . . . . . . . 7,187,570 533,207 17,811,918 7,245,969 32,778,664 Prepayments. . . . . . . . . . . . . . . . . . . . . 410,916 - 11,941 786 423,643 Advances from other funds . . . . . . . . . . . . . - 912,306 - - 912,306 Advances to component unit . . . . . . . . . . . . - - 5,393,043 7,801,264 13,194,307 Restricted assets: Cash with fiscal and escrow agents . . . . . . . . - 1,891 - - 1,891
Total assets . . . . . . . . . . . . . . . . . . . . . $ 70,538,461 $ 54,731,164 $ 24,520,832 $ 31,763,557 $ 181,554,014
Liabilities:Accounts payable . . . . . . . . . . . . . . . . . . $ 992,458 $ 7,684 $ 13,087 $ 238,982 $ 1,252,211 Contracts payable . . . . . . . . . . . . . . . . . . 700,445 - 1,811,219 2,893,890 5,405,554 Accrued wages and benefits. . . . . . . . . . . . . 3,267,803 2,038 7,392 160,648 3,437,881 Retainage payable. . . . . . . . . . . . . . . . . . - - 2,760,243 21,459 2,781,702 Interfund loans payable . . . . . . . . . . . . . . . - - - 1,397,311 1,397,311 Due to other funds . . . . . . . . . . . . . . . . . 78,285 3,247 1,907 40,051 123,490 Due to other governments . . . . . . . . . . . . . . 5,745,215 - - - 5,745,215 Claimants payable. . . . . . . . . . . . . . . . . . 3,647 - - - 3,647 Deferred revenue . . . . . . . . . . . . . . . . . . 15,080,491 3,698,446 14,935,358 3,494,035 37,208,330 Unearned revenue . . . . . . . . . . . . . . . . . . 8,831,703 8,831,703 - - 17,663,406
Total liabilities . . . . . . . . . . . . . . . . . . . . 34,700,047 12,543,118 19,529,206 8,246,376 75,018,747
Fund Balances:Reserved for encumbrances. . . . . . . . . . . . . . 3,027,913 39,491 20,728,704 23,812,974 47,609,082 Reserved for prepayments . . . . . . . . . . . . . . 410,916 - 11,941 786 423,643 Reserved for claims . . . . . . . . . . . . . . . . . . 132,987 - - - 132,987 Reserved for advances . . . . . . . . . . . . . . . . - 912,306 - - 912,306 Reserved for advances to component unit. . . . . . . - - 5,393,043 7,801,264 13,194,307 Reserved for debt service. . . . . . . . . . . . . . . - 15,536,249 - - 15,536,249 Reserved for contributions to permanent fund . . . . - - - 102,228 102,228 Reserved for loans . . . . . . . . . . . . . . . . . . - 25,700,000 - - 25,700,000 Unreserved, designated for various projects, reported in:
General fund . . . . . . . . . . . . . . . . . . . . 6,585,539 - - - 6,585,539 Special revenue funds. . . . . . . . . . . . . . . . - - - 398,848 398,848 Unreserved, undesignated (deficit), reported in: General fund . . . . . . . . . . . . . . . . . . . 25,681,059 - - - 25,681,059 Special revenue funds . . . . . . . . . . . . . . - - - (8,675,221) (8,675,221) Permanent fund . . . . . . . . . . . . . . . . . - - - 76,302 76,302 Capital projects funds . . . . . . . . . . . . . . - - (21,142,062) - (21,142,062)
Total fund balances . . . . . . . . . . . . . . . . . 35,838,414 42,188,046 4,991,626 23,517,181 106,535,267
Total liabilities and fund balances . . . . . . . . . . $ 70,538,461 $ 54,731,164 $ 24,520,832 $ 31,763,557 $ 181,554,014
SEE ACCOMPANYING NOTES TO THE BASIC FINANCIAL STATEMENTS
CITY OF DAYTON, OHIO
BALANCE SHEETGOVERNMENTAL FUNDS
DECEMBER 31, 2009
F 32

Total governmental fund balances 106,535,267$
Amounts reported for governmental activities in the statement of net assets are different because:
Capital assets used in governmental activities (excluding internal service funds capital assets) are not financial resources and therefore are not reported in the funds. 360,431,997
Other long-term assets are not available to pay for current period expenditures and therefore are deferred in the funds. Property and other local taxes receivable 4,700,112$ Municipal income taxes receivable 6,605,375 Accounts receivable 1,609,975 Special assessments receivable 1,202,383 Accrued interest receivable 96,880 Due from other governments 22,993,605 Total 37,208,330
Unamortized premiums/discounts on bond issuances are not recognized in the funds (584,038)
Unamortized bond issuance costs are not recognized in the funds. 1,530,767
Unamortized deferred charges on refundings are not recorded in the funds. 1,077,053
Internal service funds are used by management to charge the costs of fleet management fire fleet management, stores and reproduction, workers' compensation, and plumbing to individual funds. The assets and liabilities of the internal service funds are included in governmental activities on the statement of net assets. The net assets of the internal service funds, including internal balances of $20,958, are: 7,678,326
In the statement of net assets interest is accrued on bonds, whereas in governmental funds, interest is accrued when due. (297,096)
Long-term liabilities, including bonds and compensated absences are not due and payable in the current period and therefore are not reported in the funds (exclusive of internal service fund liabilities). Special assessment bonds (299,500) General obligation bonds (56,284,054) Revenue bonds (39,925,000) Compensated absences (9,180,674) OPWC loan (197,334) Pollution remediation obligations (1,179,173) Total (107,065,735)
Net assets of governmental activities 406,514,871$
DECEMBER 31, 2009
SEE ACCOMPANYING NOTES TO THE BASIC FINANCIAL STATEMENTS
CITY OF DAYTON, OHIO
RECONCILIATION OF TOTAL GOVERNMENTAL FUND BALANCES TONET ASSETS OF GOVERNMENTAL ACTIVITIES
F 33

Other Total Capital Governmental Governmental
General Debt Service Improvements Funds FundsRevenues:
Municipal income taxes. . . . . . . . . . . . . 99,831,456$ -$ -$ -$ 99,831,456$ Property and other taxes . . . . . . . . . . . . 9,880,083 9,296,628 1,106,009 - 20,282,720 State shared taxes. . . . . . . . . . . . . . . . 13,222,031 - - 5,674,831 18,896,862 Charges for services . . . . . . . . . . . . . . 23,368,644 - 324,881 1,344,208 25,037,733 Licenses and permits . . . . . . . . . . . . . . 1,585,081 - 36,156 9,082 1,630,319 Fines and forfeitures . . . . . . . . . . . . . . 1,604,520 - - 501,669 2,106,189 Intergovernmental . . . . . . . . . . . . . . . 1,097,695 1,050,358 18,114,720 19,436,678 39,699,451 Special assessments . . . . . . . . . . . . . . 189,434 117,652 12,800 102,722 422,608 Investment income . . . . . . . . . . . . . . . 2,788,668 57,832 42,617 38,540 2,927,657 Decrease in FMV of investments. . . . . . . . . (1,043,330) (22,519) (19,018) (997) (1,085,864) Other . . . . . . . . . . . . . . . . . . . . . . 138,078 100,000 2,562,915 1,847,492 4,648,485 Total revenues . . . . . . . . . . . . . . . . . 152,662,360 10,599,951 22,181,080 28,954,225 214,397,616
Expenditures: Current:
Downtown . . . . . . . . . . . . . . . . . . . 3,537,383 560,000 46,405 - 4,143,788 Youth, education and human services. . . . . . 34,129 - 24,984 2,221,124 2,280,237 Community development and neighborhoods. . 12,982,602 - 593,719 8,683,280 22,259,601 Economic development . . . . . . . . . . . . . 3,823,697 13 6,417,920 4,806,270 15,047,900 Leadership and quality of life . . . . . . . . . . 24,215,492 - 5,202,610 11,573,309 40,991,411 Corporate responsibility. . . . . . . . . . . . . 14,648,932 495,335 890 1,980,002 17,125,159 Public safety and justice . . . . . . . . . . . . 90,866,260 - 27,377 4,347,213 95,240,850
Capital outlay . . . . . . . . . . . . . . . . . . - - 34,887,179 21,459 34,908,638 Debt service:
Principal retirement . . . . . . . . . . . . . . - 6,542,380 10,842 1,494,000 8,047,222 Interest and fiscal charges . . . . . . . . . . . - 3,498,169 59,621 - 3,557,790 Bond issuance costs . . . . . . . . . . . . . . - 586,476 - - 586,476
Total expenditures . . . . . . . . . . . . . . . . 150,108,495 11,682,373 47,271,547 35,126,657 244,189,072
Excess (deficiency) of revenues over (under) expenditures . . . . . . . . . 2,553,865 (1,082,422) (25,090,467) (6,172,432) (29,791,456)
Other financing sources (uses):Sale of bonds. . . . . . . . . . . . . . . . . . - 22,337,868 12,070,243 - 34,408,111 Payment to refund bond escrow agent . . . . . - (22,528,097) - - (22,528,097) Premium on bond issuance. . . . . . . . . . . - 311,474 - - 311,474 Transfers in . . . . . . . . . . . . . . . . . . 804,913 56,677 1,610,000 9,346,913 11,818,503 Transfers out . . . . . . . . . . . . . . . . . (11,114,668) - - (1,563,745) (12,678,413)
Total other financing sources (uses) . . . . . . . (10,309,755) 177,922 13,680,243 7,783,168 11,331,578
Net change in fund balances . . . . . . . . . . . (7,755,890) (904,500) (11,410,224) 1,610,736 (18,459,878)
Fund balances at beginning of year (restated) . 43,594,304 43,092,546 16,401,850 21,906,445 124,995,145 Fund balances at end of year. . . . . . . . . . 35,838,414$ 42,188,046$ 4,991,626$ 23,517,181$ 106,535,267$
SEE ACCOMPANYING NOTES TO THE BASIC FINANCIAL STATEMENTS
CITY OF DAYTON, OHIO
STATEMENT OF REVENUES, EXPENDITURES AND CHANGES IN FUND BALANCESGOVERNMENTAL FUNDS
FOR THE YEAR ENDED DECEMBER 31, 2009
F 34
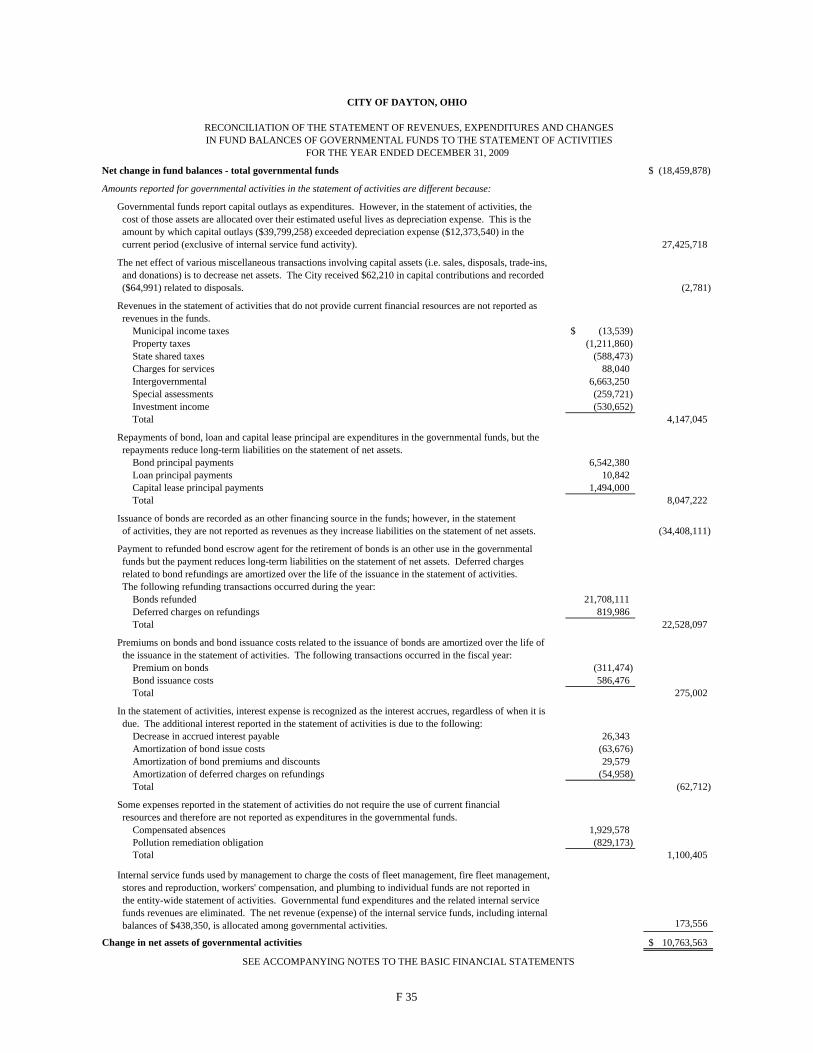
Net change in fund balances - total governmental funds (18,459,878)$
Amounts reported for governmental activities in the statement of activities are different because:
Governmental funds report capital outlays as expenditures. However, in the statement of activities, the cost of those assets are allocated over their estimated useful lives as depreciation expense. This is the amount by which capital outlays ($39,799,258) exceeded depreciation expense ($12,373,540) in the current period (exclusive of internal service fund activity). 27,425,718 The net effect of various miscellaneous transactions involving capital assets (i.e. sales, disposals, trade-ins, and donations) is to decrease net assets. The City received $62,210 in capital contributions and recorded ($64,991) related to disposals. (2,781)
Revenues in the statement of activities that do not provide current financial resources are not reported as revenues in the funds.
Municipal income taxes (13,539)$ Property taxes (1,211,860) State shared taxes (588,473) Charges for services 88,040 Intergovernmental 6,663,250 Special assessments (259,721) Investment income (530,652) Total 4,147,045
Repayments of bond, loan and capital lease principal are expenditures in the governmental funds, but the repayments reduce long-term liabilities on the statement of net assets.
Bond principal payments 6,542,380 Loan principal payments 10,842 Capital lease principal payments 1,494,000 Total 8,047,222
Issuance of bonds are recorded as an other financing source in the funds; however, in the statement of activities, they are not reported as revenues as they increase liabilities on the statement of net assets. (34,408,111)
Payment to refunded bond escrow agent for the retirement of bonds is an other use in the governmental funds but the payment reduces long-term liabilities on the statement of net assets. Deferred charges related to bond refundings are amortized over the life of the issuance in the statement of activities. The following refunding transactions occurred during the year:
Bonds refunded 21,708,111 Deferred charges on refundings 819,986 Total 22,528,097
Premiums on bonds and bond issuance costs related to the issuance of bonds are amortized over the life of the issuance in the statement of activities. The following transactions occurred in the fiscal year:
Premium on bonds (311,474) Bond issuance costs 586,476 Total 275,002
In the statement of activities, interest expense is recognized as the interest accrues, regardless of when it is due. The additional interest reported in the statement of activities is due to the following:
Decrease in accrued interest payable 26,343 Amortization of bond issue costs (63,676) Amortization of bond premiums and discounts 29,579 Amortization of deferred charges on refundings (54,958) Total (62,712)
Some expenses reported in the statement of activities do not require the use of current financial resources and therefore are not reported as expenditures in the governmental funds.
Compensated absences 1,929,578 Pollution remediation obligation (829,173) Total 1,100,405
Internal service funds used by management to charge the costs of fleet management, fire fleet management, stores and reproduction, workers' compensation, and plumbing to individual funds are not reported in the entity-wide statement of activities. Governmental fund expenditures and the related internal service funds revenues are eliminated. The net revenue (expense) of the internal service funds, including internal balances of $438,350, is allocated among governmental activities. 173,556
Change in net assets of governmental activities 10,763,563$
SEE ACCOMPANYING NOTES TO THE BASIC FINANCIAL STATEMENTS
FOR THE YEAR ENDED DECEMBER 31, 2009
CITY OF DAYTON, OHIO
RECONCILIATION OF THE STATEMENT OF REVENUES, EXPENDITURES AND CHANGESIN FUND BALANCES OF GOVERNMENTAL FUNDS TO THE STATEMENT OF ACTIVITIES
F 35

Variance withFinal Budget
PositiveOriginal Final Actual (Negative)
Revenues:Municipal income taxes . . . . . . . . . . . . . . . 105,417,700$ 101,368,300$ 100,430,248$ (938,052)$ Property and other local taxes . . . . . . . . . . . . 10,145,900 9,896,200 9,883,262 (12,938) State shared taxes . . . . . . . . . . . . . . . . . . 15,678,500 13,409,300 13,545,039 135,739 Charges for services . . . . . . . . . . . . . . . . . 22,824,800 23,249,500 23,475,636 226,136 Licenses and permits. . . . . . . . . . . . . . . . . 1,410,700 1,683,000 1,585,081 (97,919) Fines and forfeitures. . . . . . . . . . . . . . . . . 1,768,000 1,551,700 1,663,326 111,626 Intergovernmental . . . . . . . . . . . . . . . . . . 1,345,300 1,132,800 1,132,821 21 Special assessments . . . . . . . . . . . . . . . . . 200,000 158,800 189,434 30,634 Investment income . . . . . . . . . . . . . . . . . 4,058,300 2,202,500 2,190,940 (11,560) Other . . . . . . . . . . . . . . . . . . . . . . . . 2,769,100 2,204,200 2,611,433 407,233 Total revenues. . . . . . . . . . . . . . . . . . . . . 165,618,300 156,856,300 156,707,220 (149,080)
Expenditures: Current:
Downtown . . . . . . . . . . . . . . . . . . . . . 13,058,300 3,449,900 3,614,200 (164,300) Youth, education and human services. . . . . . . . . - - 37,541 (37,541) Community development and neighborhoods. . . . . 8,858,100 14,041,600 13,375,287 666,313 Economic development . . . . . . . . . . . . . . . 10,089,100 4,142,900 3,699,501 443,399 Leadership and quality of life . . . . . . . . . . . . . 32,824,000 27,227,200 25,000,543 2,226,657 Corporate responsibility. . . . . . . . . . . . . . . 94,899,100 15,638,600 13,951,228 1,687,372 Public safety and justice . . . . . . . . . . . . . . . 1,910,800 97,344,000 92,471,285 4,872,715 Total expenditures. . . . . . . . . . . . . . . . . . 161,639,400 161,844,200 152,149,585 9,694,615
Excess (deficiency) of revenues over (under) expenditures . . . . . . . . . . . . . . 3,978,900 (4,987,900) 4,557,635 9,545,535
Other financing sources (uses):
Transfers in . . . . . . . . . . . . . . . . . . . . . 4,058,400 979,913 804,913 (175,000) Transfers out . . . . . . . . . . . . . . . . . . . . (11,454,700) (15,930,400) (11,114,668) 4,815,732 Total other financing sources (uses) . . . . . . . . . (7,396,300) (14,950,487) (10,309,755) 4,640,732
Net change in fund balance. . . . . . . . . . . . . . (3,417,400) (19,938,387) (5,752,120) 14,186,267
Fund balance at beginning of year. . . . . 21,909,052 21,909,052 21,909,052 - Prior year encumbrances appropriated. . . . . . . 2,506,696 2,506,696 2,506,696 -
Fund balance at end of year. . . . . . . . . . . . . 20,998,348 $ 4,477,361 $ 18,663,628 $ 14,186,267
CITY OF DAYTON, OHIO
STATEMENT OF REVENUES, EXPENDITURES AND CHANGES INFUND BALANCE - BUDGET AND ACTUAL (NON-GAAP BUDGETARY BASIS)
GENERAL FUND
SEE ACCOMPANYING NOTES TO THE BASIC FINANCIAL STATEMENTS
FOR THE YEAR ENDED DECEMBER 31, 2009
Budgeted Amounts
F 36
THIS PAGE IS INTENTIONALLY LEFT BLANK
F 37

DaytonInternational Airport Water Sewer
Assets:Current assets:
Equity in pooled cash and cash equivalents . . . . . 65,609,389$ 42,745,764$ 27,946,905$ Receivables (net of allowance for uncollectibles):
Special assessments . . . . . . . . . . . . . . . - - 488,679 Accounts . . . . . . . . . . . . . . . . . . . . . 2,603,818 6,571,994 4,516,181 Accrued interest . . . . . . . . . . . . . . . . . 267,561 132,637 -
Due from other funds . . . . . . . . . . . . . . . . - 3,442,957 5,533 Due from other governments . . . . . . . . . . . . 6,087,370 13,851 - Prepayments. . . . . . . . . . . . . . . . . . . . 83,465 118,771 44,417 Materials and supplies inventory . . . . . . . . . . 32,941 1,823,057 - Inventory held for resale . . . . . . . . . . . . . . - - - Restricted assets:
Equity in pooled cash and cash equivalents . . . . . - 80,548 - Cash with fiscal and escrow agents. . . . . . . . . 3,014,052 - -
Total current assets 77,698,596 54,929,579 33,001,715
Noncurrent assets:Advances to component unit. . . . . . . . . . . . . - 1,777,778 - Unamortized bond issuance costs. . . . . . . . . . . 1,704,857 - - Capital assets:
Land and construction in progress . . . . . . . . . 73,364,380 8,961,233 3,588,621 Depreciable capital assets, net . . . . . . . . . . 159,401,453 103,485,534 86,468,652 Total capital assets . . . . . . . . . . . . . . . . 232,765,833 112,446,767 90,057,273 Total noncurrent assets . . . . . . . . . . . . . 234,470,690 114,224,545 90,057,273
Total assets. . . . . . . . . . . . . . . . . . . . . . 312,169,286 169,154,124 123,058,988
SEE ACCOMPANYING NOTES TO THE BASIC FINANCIAL STATEMENTS
CITY OF DAYTON, OHIO
Business-type Activities -
DECEMBER 31,2009PROPRIETARY FUNDS
STATEMENT OF NET ASSETS
F 38

GovernmentalActivities -
Other InternalEnterprise Total Service Funds
7,142,007$ 143,444,065$ 14,684,067$
423,501 912,180 - 1,471,673 15,163,666 14,675
- 400,198 - 14,884 3,463,374 147,317
- 6,101,221 26,747 - 246,653 21,245 - 1,855,998 - - - 671,729
- 80,548 - - 3,014,052 -
9,052,065 174,681,955 15,565,780
- 1,777,778 - 7,819 1,712,676 -
652,427 86,566,661 75,000 16,383,252 365,738,891 1,171,433 17,035,679 452,305,552 1,246,433 17,043,498 455,796,006 1,246,433
26,095,563 630,477,961 16,812,213 - - Continued
Enterprise Funds
F 39

DaytonInternational Airport Water Sewer
Liabilities:Current liabilities:
Accounts payable . . . . . . . . . . . . . . . . . 324,948 1,607,336 1,144,134 Contracts payable . . . . . . . . . . . . . . . . . 5,128,347 744,974 586,220 Airline settlement payable. . . . . . . . . . . . . . . . . . 978,556 - - Accrued wages and benefits . . . . . . . . . . . . 286,380 471,417 224,196 Compensated absences - current. . . . . . . . . . 408,171 774,257 325,155 Retainage payable . . . . . . . . . . . . . . . . . 2,380,005 11,015 99,285 Interfund loans payable. . . . . . . . . . . . . . . . - - - Accrued interest payable. . . . . . . . . . . . . . 1,993 - 210,767 Due to other funds . . . . . . . . . . . . . . . . . 8,450 73,505 2,898,349 Due to other governments . . . . . . . . . . . . . 675,673 112,736 - Claims payable - current. . . . . . . . . . . . . . - - - General obligation notes payable - current. . . . . 485,000 - - General obligation bonds payable - current. . . . . 350,000 - - OWPC loan payable - current. . . . . . . . . . . - - 50,000 OWDA loan payable - current. . . . . . . . . . . - - 676,715 Payable from restricted assets:
Utility deposits . . . . . . . . . . . . . . . . . - 80,548 - Accrued interest payable . . . . . . . . . . . . 201,323 - - Revenue bonds - current. . . . . . . . . . . . . 1,155,000 - - Total current liabilities. . . . . . . . . . . . . . 12,383,846 3,875,788 6,214,821
Noncurrent liabilities:Compensated absences. . . . . . . . . . . . . . 391,586 742,796 311,942 Advances from other funds . . . . . . . . . . . . - - - Claims payable . . . . . . . . . . . . . . . . . . - - - General obligation bonds payable . . . . . . . . . 10,470,000 - - Revenue bonds payable (net of unamortized discounts and deferred amount on refunding). . . . . . . . 35,655,567 - - OPWC loan payable . . . . . . . . . . . . . . . - - 500,000 OWDA loan payable . . . . . . . . . . . . . . . - - 10,441,777
Total noncurrent liabilities. . . . . . . . . . . 46,517,153 742,796 11,253,719
Total liabilities . . . . . . . . . . . . . . . . . . . . 58,900,999 4,618,584 17,468,540
Net assets: Invested in capital assets, net of related debt . . . . 195,470,266 112,446,767 78,388,781 Unrestricted. . . . . . . . . . . . . . . . . . . . 57,798,021 52,088,773 27,201,667
Total net assets . . . . . . . . . . . . . . . . . . . 253,268,287$ 164,535,540$ 105,590,448$
Adjustment to reflect the consolidation of the internal service funds activities related to enterprise funds.
CITY OF DAYTON, OHIO
STATEMENT OF NET ASSETSPROPRIETARY FUNDS (CONTINUED)
SEE ACCOMPANYING NOTES TO THE BASIC FINANCIAL STATEMENTS
Net assets of business-type activities.
Business-type Activities
DECEMBER 31,2009
F 40

GovernmentalActivities -
Other InternalEnterprise Total Service Funds
58,249 3,134,667 180,948 1,335 6,460,876 -
- 978,556 - 99,586 1,081,579 122,011
172,666 1,680,249 172,933 - 2,490,305 - - - 400,000
6,466 219,226 - 566,241 3,546,545 983
442 788,851 1,822,016 - - 77,924 - 485,000 -
254,873 604,873 - - 50,000 - - 676,715 -
- 80,548 - - 201,323 - - 1,155,000 -
1,159,858 23,634,313 2,776,815
165,650 1,611,974 165,906 912,306 912,306 -
- - 6,212,124 1,121,073 11,591,073 -
- 35,655,567 - - 500,000 - - 10,441,777 -
2,199,029 60,712,697 6,378,030
3,358,887 84,347,010 9,154,845
15,659,733 401,965,547 1,246,433
7,076,943 144,165,404 6,410,935 22,736,676$ 546,130,951 7,657,368$
(20,958)
$ 546,109,993
Enterprise Funds
F 41

DaytonInternational Airport Water Sewer
Operating revenues:Charges for services . . . . . . . . . . . . . . . . . $ 24,943,894 $ 45,148,024 $ 30,527,482 Other. . . . . . . . . . . . . . . . . . . . . . . . . 5,712,056 2,595,726 471,257
Total operating revenues . . . . . . . . . . . . . . . . 30,655,950 47,743,750 30,998,739
Operating expenses:Personal services . . . . . . . . . . . . . . . . . . 8,357,108 14,713,456 6,889,500 Benefit payments . . . . . . . . . . . . . . . . . . 3,069,251 5,400,719 2,505,752 Contractual services. . . . . . . . . . . . . . . . . 12,219,435 5,784,173 8,376,418 Materials and supplies . . . . . . . . . . . . . . . 716,302 4,812,093 2,298,382 Utilities . . . . . . . . . . . . . . . . . . . . . . . 1,977,538 6,238,060 2,968,559 Cost of sales . . . . . . . . . . . . . . . . . . . . - - - Depreciation . . . . . . . . . . . . . . . . . . . . 9,461,860 6,450,497 7,722,188 Claims. . . . . . . . . . . . . . . . . . . . . . . . - - - Other . . . . . . . . . . . . . . . . . . . . . . . . 2,262,323 2,118,472 697,978
Total operating expenses. . . . . . . . . . . . . . . . 38,063,817 45,517,470 31,458,777
Operating income (loss) . . . . . . . . . . . . . . . . (7,407,867) 2,226,280 (460,038)
Nonoperating revenues (expenses):Interest revenue . . . . . . . . . . . . . . . . . . . 961,972 454,096 - Decrease in fair market value of investments . . . . . (490,306) (209,194) - Interest expense and fiscal charges. . . . . . . . . . (2,082,373) - (451,675)
Total nonoperating revenues (expenses) . . . . . . . . (1,610,707) 244,902 (451,675)
Income (loss) before capital contributions and transfers . . . . . . . . . . . . . . . . . . . . . (9,018,574) 2,471,182 (911,713)
Capital contributions . . . . . . . . . . . . . . . . . 16,881,998 216,235 - Transfers in. . . . . . . . . . . . . . . . . . . . . . 149,758 261,063 104,586 Transfers out . . . . . . . . . . . . . . . . . . . . - - -
Changes in net assets . . . . . . . . . . . . . . . . . . 8,013,182 2,948,480 (807,127)
Net assets, January 1 (restated) . . . . . . . . . . . . 245,255,105 161,587,060 106,397,575
Net assets, December 31. . . . . . . . . . . . . . . . $ 253,268,287 $ 164,535,540 $ 105,590,448
SEE ACCOMPANYING NOTES TO THE BASIC FINANCIAL STATEMENTS
Changes in net assets of business-type activities.
PROPRIETARY FUNDS
Adjustment to reflect the consolidation of the internal service funds activities related to enterprise funds.
Business-type Activities -
FOR THE YEAR ENDED DECEMBER 31, 2009
CITY OF DAYTON, OHIO
STATEMENT OF REVENUES, EXPENSES ANDCHANGES IN NET ASSETS
F 42

Governmental Activities -
Other InternalEnterprise Total Service Funds
$ 10,275,606 $ 110,895,006 $ 12,756,226 58,090 8,837,129 289,967
10,333,696 119,732,135 13,046,193
3,518,736 33,478,800 3,763,422 1,287,443 12,263,165 1,417,744 2,088,272 28,468,298 1,291,712 536,916 8,363,693 2,112,292 214,732 11,398,889 22,430 - - 1,808,931 687,355 24,321,900 101,327 - - 2,961,161 226,844 5,305,617 28,917
8,560,298 123,600,362 13,507,936
1,773,398 (3,868,227) (461,743)
- 1,416,068 - - (699,500) - (88,570) (2,622,618) -
(88,570) (1,906,050) -
1,684,828 (5,774,277) (461,743)
- 17,098,233 - 204,231 719,638 196,949 (56,677) (56,677) -
1,832,382 11,986,917 (264,794)
20,904,294 7,922,162
$ 22,736,676 $ 7,657,368
(438,350)
$ 11,548,567
Enterprise Funds
F 43

DaytonInternational Airport Water Sewer
Cash flows from operating activities:Cash received from customers . . . . . . . . . . . . . 24,566,761$ 45,606,303$ 30,642,982$ Cash received from interfund services provided. . . . . - - - Cash received from other operating revenues . . . . . 5,805,803 2,554,082 465,724 Cash payments for personal services . . . . . . . . . (8,568,557) (15,207,394) (6,973,529) Cash payments for fringe benefits . . . . . . . . . . . (3,112,588) (5,458,060) (2,526,817) Cash payments for contract services. . . . . . . . . . (11,282,124) (5,343,600) (8,444,376) Cash payments for materials and supplies. . . . . . . (721,505) (4,734,430) (2,331,750) Cash payments for cost of goods sold. . . . . . . . . - - - Cash payments for utilities . . . . . . . . . . . . . . (1,986,257) (6,443,868) (2,846,083) Cash payments for claims . . . . . . . . . . . . . . . - - - Cash payments for other operating expenses . . . . . (2,264,665) (2,177,816) (689,530)
Net cash provided by operating activities. . . . . . . 2,436,868 8,795,217 7,296,621
Cash flows from noncapital financing activities:Cash received from advance to component unit . . . . - 881,703 - Cash payments from advance to component unit . . . . . . . . . . . . . . . . . . - (625,855) - Cash received from interfund loans. . . . . . . . . . . - - - Transfers in. . . . . . . . . . . . . . . . . . . . . . 149,758 261,063 104,586 Transfers out. . . . . . . . . . . . . . . . . . . . . - - -
Net cash provided bynoncapital financing activities. . . . . . . . . . . 149,758 516,911 104,586
Cash flows from capital and related financing activities:Acquisition of capital assets . . . . . . . . . . . . . (23,917,089) (5,245,243) (1,352,944) Capital contributions . . . . . . . . . . . . . . . . . 11,597,228 216,235 - Bond issuance costs . . . . . . . . . . . . . . . . . (130,000) - - Payment to refunded bond escrow agent . . . . . . . - - - Sale of general obligation bonds. . . . . . . . . . . . 10,820,000 - - Principal paid on notes . . . . . . . . . . . . . . . . (1,400,000) - - Interest paid on notes. . . . . . . . . . . . . . . . . (94,250) - - Principal paid on bonds. . . . . . . . . . . . . . . . (1,115,000) - - Interest paid on bonds . . . . . . . . . . . . . . . . . (1,860,958) - - Principal paid on loans . . . . . . . . . . . . . . . . - - (705,872) Interest paid on loans. . . . . . . . . . . . . . . . . - - (463,620)
Net cash used in capital and related financing activities. . . . . . . . . . . . (6,100,069) (5,029,008) (2,522,436)
Cash flows from investing activities: Interest received . . . . . . . . . . . . . . . . . . . 649,167 296,549 -
Net cash provided by investing activities . . . . . . . 649,167 296,549 -
Net increase (decrease) in cash and cash equivalents . . (2,864,276) 4,579,669 4,878,771
Cash and cash equivalents at beginning of year . . . . . . . . . . . . . . . . . . . . . . . . . 71,487,717 38,246,643 23,068,134
Cash and cash equivalents at end of year. . . . . . . $ 68,623,441 $ 42,826,312 $ 27,946,905
SEE ACCOMPANYING NOTES TO THE BASIC FINANCIAL STATEMENTS
CITY OF DAYTON, OHIO
Business-type Activities -
PROPRIETARY FUNDSFOR THE YEAR ENDED DECEMBER 31, 2009
STATEMENT OF CASH FLOWS
F 44

GovernmentalActivities -
Other InternalEnterprise Total Service Funds
10,110,710$ 110,926,756$ -$ - - 12,869,170
43,206 8,868,815 289,967 (3,599,213) (34,348,693) (3,877,896) (1,297,111) (12,394,576) (1,435,780) (2,079,724) (27,149,824) (1,315,428)
(542,187) (8,329,872) (2,101,642) - - (1,813,464)
(216,855) (11,493,063) (24,286) - - (2,243,896)
(227,332) (5,359,343) (29,076) 2,191,494 20,720,200 317,669
- 881,703 -
- (625,855) - 68,723 68,723 -
204,231 719,638 196,949 (56,677) (56,677) -
216,277 987,532 196,949
(385,474) (30,900,750) - - 11,813,463 - - (130,000) -
(771,889) (771,889) - 771,889 11,591,889 -
- (1,400,000) - - (94,250) -
(277,720) (1,392,720) - (72,508) (1,933,466) -
- (705,872) - - (463,620) -
(735,702) (14,387,215) -
- 945,716 - - 945,716 -
1,672,069 8,266,233 514,618
5,469,938 138,272,432 14,169,449
$ 7,142,007 $ 146,538,665 $ 14,684,067
- - continued
Enterprise Funds
F 45

DaytonInternational Airport Water Sewer
Reconciliation of operating income (loss) to net cash provided by operating activities:
Operating income (loss) . . . . . . . . . . . . . . . . . (7,407,867)$ 2,226,280$ (460,038)$
Adjustments: Depreciation . . . . . . . . . . . . . . . . . . . . . 9,461,860 6,450,497 7,722,188
Changes in assets and liabilities: (Increase) decrease in accounts receivable . . . . . . (246,938) 458,550 196,105 Decrease (increase) in due from other funds . . . . . - (78,382) (5,533) Decrease (increase) in prepaid assets . . . . . . . . . 22,790 14,892 (27,393) (Increase) decrease in due from other governments . . (36,448) 28,117 - Decrease in special assessments receivable. . . . . . - - (80,605) (Increase) in materials and supplies inventory. . . . . . (2,003) (74,104) - (Increase) in inventory held for resale. . . . . . . . - - - Increase (decrease) in accounts payable . . . . . . . (791,490) 374,967 118,164 Increase (decrease) in contracts payable. . . . . . . . (984,676) 85,893 (169,033) Increase in airline settlement payable. . . . . . . . . 978,556 - - Increase (decrease) in retainage payable. . . . . . . . 1,690,129 (110,243) (8,596) (Decrease) in accrued wages and benefits. . . . . . . . . (153,701) (239,000) (81,250) Increase (decrease) in due to other funds. . . . . . . . 8,241 (38,774) 116,908 Increase (decrease) in due to other governments . . . (500) 453 (452) (Decrease) in voluntary termination benefits payable. . . (26,428) (160,121) (10,821) Increase in utility deposits. . . . . . . . . . . . . . - 8,350 - (Decrease) in compensated absences payable . . . . . . . . . . . . . . . . . . (74,657) (152,158) (13,023) Increase in claims payable . . . . . . . . . . . . . . - - -
Net cash provided by operating activities. . . . . . . . . $ 2,436,868 $ 8,795,217 $ 7,296,621
Non-cash transactions:
SEE ACCOMPANYING NOTES TO THE BASIC FINANCIAL STATEMENTS
FOR THE YEAR ENDED DECEMBER 31, 2009PROPRIETARY FUNDS (CONTINUED)
At December 31, 2009, the Water, Sewer and Dayton International Airport enterprise funds purchased $255,170, $688,659 and $6,531,307,respectively, in capital assets on account. At December 31, 2008, the Water, Sewer, Dayton International Airport and Storm Sewer enterprisefunds purchased $350,388, $325,910, $4,444,664 and $92,470, respectively, in capital assets on account.
During 2009, the Dayton International Airport received $1,179,336 in capital grants, which was recognized as a receivable in 2008. A receivablein the amount of $6,464,106 has been recorded for capital grants in 2009.
STATEMENT OF CASH FLOWS
CITY OF DAYTON, OHIO
Business-type Activities -
F 46

GovernmentalActivities -
Other InternalEnterprise Total Service Funds
1,773,398$ (3,868,227)$ (461,743)$
687,355 24,321,900 101,327
(91,009) 316,708 (8,518) (14,884) (98,799) 118,315
- 10,289 1,641 13,635 5,304 3,147
(87,522) (168,127) - - (76,107) - - - (4,533)
41,878 (256,481) 58,219 (1,449) (1,069,265) (49,500)
- 978,556 - (34,888) 1,536,402 - (53,731) (527,682) (58,681) (4,875) 81,500 (25,441)
- (499) (305,584) (22,875) (220,245) (13,135)
- 8,350 -
(13,539) (253,377) (60,694) - - 1,022,849
$ 2,191,494 $ 20,720,200 $ 317,669
Enterprise Funds
F 47

Agency
Assets:Equity in pooled cash and cash equivalents . . . . . . . $ 5,411,900 Cash and cash equivalents with fiscal agent . . . . . . . 761,040 Investments with fiscal agent . . . . . . . . . . . . . . 4,216,194 Receivables (net of allowance for uncollectibles):
Accounts . . . . . . . . . . . . . . . . . . . . . . 324,684
Total assets . . . . . . . . . . . . . . . . . . . . . . $ 10,713,818
Liabilities:Accounts payable. . . . . . . . . . . . . . . . . . . $ 55,405 Due to other governments . . . . . . . . . . . . . . . 1,732,719 Due to others. . . . . . . . . . . . . . . . . . . . . . 3,805,143 Withholdings and deposits . . . . . . . . . . . . . . . 5,120,551
Total liabilities . . . . . . . . . . . . . . . . . . . . $ 10,713,818
SEE ACCOMPANYING NOTES TO THE BASIC FINANCIAL STATEMENTS
CITY OF DAYTON, OHIO
STATEMENT OF FIDUCIARY ASSETS AND LIABILITIESAGENCY FUNDS
DECEMBER 31, 2009
F 48

F 49
CITY OF DAYTON, OHIO
Index of Notes to the Basic Financial Statements For the Year Ended December 31, 2009
Note 1 - Description of the City .................................................................................................................... F 51 Note 2 - Summary of Significant Accounting Policies
A. Reporting Entity .............................................................................................................................. F 51 - 54 B. Basis of Presentation ....................................................................................................................... F 54 - 55 C. Fund Accounting ............................................................................................................................. F 55 - 56 D. Measurement Focus......................................................................................................................... F 57 E. Basis of Accounting ........................................................................................................................ F 57 - 58 F. Budgetary Process ........................................................................................................................... F 58 - 59 G. Cash and Cash Equivalents ............................................................................................................. F 60 H. Inventory of Supplies ...................................................................................................................... F 60 I. Restricted Assets ............................................................................................................................. F 61 J. Capital Assets.................................................................................................................................. F 61 K. Interfund Balances........................................................................................................................... F 62 L. Prepayments .................................................................................................................................... F 62 M. Compensated Absences................................................................................................................... F 62 N. Accrued Liabilities and Long-Term Obligations............................................................................. F 63 O. Unamortized Issuance Costs/Bond Premium and Discount/Accounting Gain or Loss ................... F 63 P. Interfund Activity............................................................................................................................ F 63 Q. Fund Balance Reserves ................................................................................................................... F 64 R. Fund Designations........................................................................................................................... F 64 S. Estimates ......................................................................................................................................... F 65 T. Contributions of Capital .................................................................................................................. F 65 U. Net Assets........................................................................................................................................ F 65
Note 3 - Accountability and Compliance
A. Change in Accounting Principles .................................................................................................... F 65 - 66 B. Compliance ..................................................................................................................................... F 66 C. Prior Period Adjustments ................................................................................................................ F 66
Note 4 - Deposits and Investments
Description ...................................................................................................................................... F 66 - 68 A. Cash on hand ................................................................................................................................... F 68 B. Deposits with Financial Institutions ................................................................................................ F 68 C. Investments ..................................................................................................................................... F 69 - 70 D. Reconciliation of Cash and Investments to the Statement of Net Assets ........................................ F 70
Note 5 - Interfund Transactions
A. Due from/to other funds .................................................................................................................. F 71 B. Interfund balances……… ............................................................................................................... F 71 C. Advances to component unit and advances from primary government........................................... F 72 D. Interfund transfers ........................................................................................................................... F 72 E. Advances to/from other funds ......................................................................................................... F 73
Note 6 - Property Taxes................................................................................................................................. F 73 - 74 Note 7 - Income Tax...................................................................................................................................... F 74 Note 8 - Receivables...................................................................................................................................... F 75

F 50
Note 9 - Loans Receivable
A. Riverfront Area Redevelopment Enterprises, Inc............................................................................ F 75 B. Dayton-Montgomery County Port Authority .................................................................................. F 76
Note 10 - Capital Assets
A. Governmental activities capital assets............................................................................................. F 76 - 77 B. Business-type activities capital assets ............................................................................................. F 77 - 78 C. Outstanding contractual commitments ............................................................................................ F 78
Note 11 - Capital Leases – Lessee Disclosure. .............................................................................................. F 78 Note 12 - Operating Lease – Lessee and Lessor Disclosure.......................................................................... F 79 Note 13 - Long-Term Obligations
A. Governmental activities................................................................................................................... F 80 - 85 B. Business-type obligations................................................................................................................ F 86 - 89
Note 14 - Risk Management
A. Property and Liability...................................................................................................................... F 89 - 90 B. Workers’ Compensation.................................................................................................................. F 90 - 91
Note 15 - Other Employee Benefits
A. Compensated Absences................................................................................................................... F 91 B. Voluntary Termination Benefits...................................................................................................... F 91 - 92 C. Insurance Benefits ........................................................................................................................... F 92 D. Deferred Compensation Plans ......................................................................................................... F 92
Note 16 - Pension Plans
A. Ohio Public Employees Retirement System.................................................................................... F 92 - 93 B. Ohio Police and Fire Pension Fund................................................................................................. F 93
Note 17 - Postretirement Benefit Plans
A. Ohio Public Employees Retirement System.................................................................................... F 94 B. Ohio Police and Fire Pension Fund................................................................................................. F 95 - 96
Note 18 - Budgetary Basis of Accounting ..................................................................................................... F 96 Note 19 - Conduit Debt Obligations .............................................................................................................. F 96 Note 20 - Discretely Presented Component Unit
A. Basis of Accounting ........................................................................................................................ F 97 B. Deposits and Investments................................................................................................................ F 97 C. Notes Payable Advance from Primary Government ....................................................................... F 98 D. Bonds Payable ................................................................................................................................. F 98 E. Loans Payable ................................................................................................................................. F 99 F. Operating Lease .............................................................................................................................. F 99 - 100
Note 21- Contingencies
A. Litigation ......................................................................................................................................... F 100 B. Grants .............................................................................................................................................. F 100
Note 22 – Subsequent Events ........................................................................................................................ F 100

CITY OF DAYTON, OHIO
NOTES TO THE BASIC FINANCIAL STATEMENTS FOR THE YEAR ENDED DECEMBER 31, 2009
F 51
NOTE 1 - DESCRIPTION OF THE CITY
The City of Dayton (the “City”) is located in Montgomery County in southwestern Ohio approximately seventy-six miles west of Columbus and fifty-four miles north of Cincinnati. The City charter was approved in 1913 and the City became the first large community in the United States to adopt the Commission-Manager Plan form of government. Subsequent amendments to the charter have been made. Legislative power is vested in a five-member commission, one of the members being the Mayor. The City Manager is the chief executive officer and the head of the administrative agencies of the City. The City Manager appoints all department heads, except the Secretary of the Civil Service Board and the Director of the Human Relations Council, who are appointed by the City Commission.
NOTE 2 - SUMMARY OF SIGNIFICANT ACCOUNTING POLICIES
The basic financial statements (BFS) of the City have been prepared in conformity with accounting principles generally accepted in the United States of America (GAAP) as applied to local governmental units. The Governmental Accounting Standards Board (GASB) is the accepted standard-setting body for establishing governmental accounting and financial principles. The City also applies Financial Accounting Standards Board (FASB) guidance issued on or before November 30, 1989, to its governmental and business-type activities and to its proprietary funds provided they do not conflict with or contradict GASB pronouncements. The City has the option to also apply FASB guidance issued after November 30, 1989 to its business-type activities and enterprise funds, subject to this same limitation. The City has elected not to apply these FASB guidance. The most significant of the City’s accounting policies are described below. A. Reporting Entity
A reporting entity is comprised of the primary government, component units and other organizations that are included to ensure that the financial statements of the City are not misleading. The primary government consists of all funds, departments and agencies that are not legally separate from the City. For the City, this includes providing water supply and treatment, sewer and storm water maintenance, wastewater treatment, airport services, fire and emergency medical services, police protection, a convention center, building inspection, neighborhood support, recreation and parks, golf, street and bridge maintenance, waste collection and a municipal court.
Component units are legally separate organizations for which the City is financially accountable. The City is financially accountable for an organization if the City appoints a voting majority of the organization's Governing Board and (1) the City is able to significantly influence the programs or services performed or provided by the organization; or (2) the City is legally entitled to or can otherwise access the organization's resources; or (3) the City is legally obligated or has otherwise assumed the responsibility to finance the deficits of, or provide financial support to, the organization; or (4) the City is obligated for the debt of the organization. Component units may also include organizations that are fiscally dependent on the City in that the City approves their budget, the issuance of their debt or the levying of their taxes for the organization.

CITY OF DAYTON, OHIO
NOTES TO THE BASIC FINANCIAL STATEMENTS FOR THE YEAR ENDED DECEMBER 31, 2009
F 52
NOTE 2 - SUMMARY OF SIGNIFICANT ACCOUNTING POLICIES - (Continued) Based on the foregoing criteria, the financial activities of the following potential component units have been reflected in the accompanying BFS as follows:
DISCRETELY PRESENTED COMPONENT UNIT
The City has included one discretely presented component unit, the CityWide Development Corporation (CWDC), as part of this report. CWDC was established in 1972 as a private, non-profit development organization which supports the City in a number of ways - primarily as its development financing arm. CWDC's relationship with the City is established via its stated mission: fostering economic development through creating and retaining jobs for City residents, providing administrative support to assist in neighborhood development, increasing tax revenues, and improving the Dayton area economy. Because the City appoints all members of CWDC's Board of Trustees and is empowered to remove them at will, CWDC is a component unit of the City. CWDC issues separately audited financial statements with a December 31 year end. Its most recently audited financial statements may be obtained from Citywide Development Corporation, 8 North Main Street, Dayton, Ohio 45402-1916. Further disclosures for the discretely presented component unit can be found in Note 20.
JOINTLY GOVERNED ORGANIZATIONS
Miami Valley Regional Planning Commission - The Miami Valley Regional Planning Commission (the Commission) is a jointly governed organization between Preble, Clark, Clinton, Darke, Greene, Miami and Montgomery Counties, the City of Dayton, City of Riverside, City of New Carlisle and the City of Huber Heights. The Commission prepares plans, including studies, maps, recommendations, and reports concerning the physical, environmental, social, economic, and governmental characteristics, functions, and services of the region. These reports show recommendations for systems of transportation, highways, parks and recreational facilities, water supply, sewage disposal, garbage disposal, civic centers and other public improvements and land uses which affect the development of the region. The degree of control exercised by any participating government is limited to its representation on the Board. Members of the Board are as follows: the officers of the Commission (elected by member representatives), the immediate past Chair of the Commission, the Commission member representing the City of Dayton, the Commission member representing each of the respective member counties, the representatives selected by each county caucus, a nongovernmental member and two at-large representatives. Payments to the Commission are made from the general fund. The City contributed $76,442 for the operation of the Commission during 2009. Financial information can be obtained from Nora Lake, Executive Director, at 40 West Fourth Street, Dayton, Ohio 45402.
Miami Valley Fire/EMS Alliance - The Miami Valley Fire/EMS Alliance (the Alliance) is a jointly
governed organization between municipal corporations and townships in Montgomery, Greene and Warren Counties. The purpose of the Alliance is to foster cooperation among the political subdivisions by promoting programs and recommending matters which will result in more efficient methods of delivering fire and emergency medical services in the region. The Board of the Alliance is made up of a representative appointed by the City of Dayton, a representative appointed by the members who are provided Fire/EMS Services by volunteers, two representatives appointed by the members who are provided Fire/EMS Services by a combination of full time employees and volunteers and a representative appointed by the members who are provided Fire/EMS Services by full time employees. Payments to the Alliance are made from the general fund. The City contributed $39,883 for the operation of the Alliance during 2009. Financial information can be obtained from Mike Hoverland, Director, at 444 W. Third Street, Suite 13-204, Dayton, Ohio 45402.

CITY OF DAYTON, OHIO
NOTES TO THE BASIC FINANCIAL STATEMENTS FOR THE YEAR ENDED DECEMBER 31, 2009
F 53
NOTE 2 - SUMMARY OF SIGNIFICANT ACCOUNTING POLICIES - (Continued)
Miami Township-Dayton Joint Economic Development District - In an effort to promote regional growth and economic development, the City has entered into a contract with Miami Township to create a Joint Economic Development District (JEDD). The City entered into a separate contract with Miami Township in July, 2005. In accordance with State law, the Districts Board of Trustees levied a 1.75% income tax effective January 1, 2008. The proceeds of that tax are allocated, in accordance with the contract, primarily to the Township. In consideration for its receipt of a share of the District’s income taxes, the City will receive 50% of the property tax revenue from parcels located within the District. The Township will utilize these JEDD revenues, in part, to construct infrastructure and improvement near the Dayton-Wright Brothers Airport. The City received $72,866 in revenues through the JEDD in 2009. Butler Township-Dayton Joint Economic Development District - In an effort to promote regional growth and economic development, the City has entered into a contract with Butler Township to create a Joint Economic Development District (JEDD). The City entered into a separate contract with Butler Township in July, 2006. In accordance with State Law, the Districts Board of Trustees levied a 1.75% income tax effective in 2008. The proceeds of that tax are allocated, in accordance with the contract, to the Township. In consideration for its receipt of a share of the District’s income taxes, the City will receive 50% of the property tax revenue from parcels located within the District. The District will utilize these JEDD revenues to facilitate economic development to create or preserve jobs and employment opportunities and to improve economic welfare. The City received $11,633 in revenues through the JEDD in 2009.
Economic Development/Government Equity Program - The Economic Development/Government Equity Program (ED/GE) was established pursuant to Ohio Revised Code Chapter 307 for the purpose of developing and promoting plans and programs designed to assure that County resources are efficiently used, economic growth is properly balanced, and that County economic development is coordinated with that of the State of Ohio and other local governments. Members include villages, township, and cities within Montgomery County, and Montgomery County itself. Cooperation and coordination between the members is intended to promote economic health and improve the economic opportunities of the people in Montgomery County by assisting in the establishment or expansion within the County of industrial, commercial or research facilities and by creating and preserving job and employment opportunities for the people of the County. The ED/GE Advisory Committee, made up of alternating member entities representatives, decides which proposed projects will be granted each year. Sales tax revenues, set aside by Montgomery County, are used to fund the projects. Members annually contribute to or receive benefits based on an elaborate zero-based formula designed to distribute growth in contributing communities to those communities experiencing less economic growth. Any member in default of paying its contributions will be liable for the amount of the contribution, any interest accrued, and penalties. During this time, the member will not be entitled to any allocations from ED/GE. Payments to ED/GE are made from the general fund.
The City did not contribute to the operation of ED/GE during 2009. Financial information can be obtained from Linda Gum, Administrative Assistant, at 451 West Third Street, Dayton, Ohio 45402.

CITY OF DAYTON, OHIO
NOTES TO THE BASIC FINANCIAL STATEMENTS FOR THE YEAR ENDED DECEMBER 31, 2009
F 54
NOTE 2 - SUMMARY OF SIGNIFICANT ACCOUNTING POLICIES - (Continued)
Montgomery County Family and Children First Council - The City participates in the Montgomery County Family and Children First Council. The Council coordinates and integrates those services within Montgomery County which are available for families and children and establishes a comprehensive, coordinated, multi-disciplinary, interagency system for the delivery of such services in order to more effectively meet the needs of families and children. The Council is governed by a board of nineteen trustees, one of which is the Mayor of the City of Dayton. The City did not contribute to the operation of the Council during 2009. Financial information can be obtained from Sue Daily, Executive Director, at 451 West Third Street, P.O. Box 972, Dayton, Ohio 45422-3100.
Hazardous Material Response Team - The City is a member of a Hazardous Material Response Team ("HAZMAT") which is a jointly governed organization with other local governments. The organization was created to provide hazardous material response protection and mutual assistance in the event of a hazardous material incident.
The HAZMAT Advisory Board oversees the operation of HAZMAT and consists of representatives from sixteen organizations. The City's ability to affect operations is limited to its representation on the Board.
The Board established hazardous materials incident response guidelines to provide for response procedures in the event of an incident. In the event of a hazardous material incident within any local government that is a member of this organization, the other members will respond to render assistance. The funding for the operation of the response team is through contributions from each entity. In addition, the persons or company responsible for any hazardous materials emergency is required by State law to reimburse the team any costs associated with clean up. There is no explicit and measurable equity interest in HAZMAT. During 2009, the City contributed $23,765 to HAZMAT. Financial information can be obtained from Edwin Kovar, Executive Director at 4200 Lake Center Drive, Trotwood, Ohio 45426.
Miami Valley Emergency Management Agency - The Miami Valley Emergency Management Agency (the Agency) is a jointly governed organization between various political subdivisions in Montgomery and Greene Counties. The purpose of the Agency is to help provide emergency management preparedness which includes training and incident mitigation. The fourteen members Board of the Agency is made up of a representative appointed by the City of Dayton.
The funding for the operation of the Agency is through contributions from each participating entity. Payments to the Agency are made from the general fund. The City contributed $33,236 for the operation of the Agency during 2009. Financial information can be obtained from Edwin Kovar, Executive Director at 4200 Lake Center Drive, Trotwood, Ohio 45426.
B. Basis of Presentation
The City’s basic financial statements consist of government-wide statements, including a statement of
net assets and a statement of activities, and fund financial statements which provide a more detailed level of financial information.
Government-wide Financial Statements - The statement of net assets and the statement of activities display information about the City as a whole. These statements include the financial activities of the primary government, except for fiduciary funds. The activities of the internal service funds are eliminated to avoid “doubling up” revenues and expenses. The statements distinguish between those activities of the City that are governmental and those that are considered business-type activities.

CITY OF DAYTON, OHIO
NOTES TO THE BASIC FINANCIAL STATEMENTS FOR THE YEAR ENDED DECEMBER 31, 2009
F 55
NOTE 2 - SUMMARY OF SIGNIFICANT ACCOUNTING POLICIES - (Continued) The statement of net assets presents the financial condition of the governmental and business-type activities of the City at year end. The statement of activities presents a comparison between direct expenses and program revenues for each program or function of the City’s governmental activities and for the business-type activities of the City. Direct expenses are those that are specifically associated with a service, program or department and therefore clearly identifiable to a particular function. Program revenues include charges paid by the recipient of the goods or services offered by the program, grants and contributions that are restricted to meeting the operational or capital requirements of a particular program and interest earned on grants that is required to be used to support a particular program. Revenues which are not classified as program revenues are presented as general revenues of the City, with certain limited exceptions. The comparison of direct expenses with program revenues identifies the extent to which each business segment or governmental function is self-financing or draws from the general revenues of the City.
Fund Financial Statements - During the year, the City segregates transactions related to certain City functions or activities in separate funds in order to aid financial management and to demonstrate legal compliance. Fund financial statements are designed to present financial information of the City at this more detailed level. The focus of governmental and enterprise fund financial statements is on major funds. Each major fund is presented in a separate column. Nonmajor funds are aggregated and presented in a single column. The internal service funds are presented in a single column on the face of the proprietary fund statements. Fiduciary funds are reported by type.
C. Fund Accounting
The City uses funds to maintain its financial records during the year. A fund is defined as a fiscal and accounting entity with a self balancing set of accounts. There are three categories of funds: governmental, proprietary and fiduciary.
Governmental Funds - Governmental funds are those through which most governmental functions typically are financed. Governmental fund reporting focuses on the sources, uses and balances of current financial resources. Expendable assets are assigned to the various governmental funds according to the purposes for which they may or must be used. Current liabilities are assigned to the fund from which they will be paid. The difference between governmental fund assets and liabilities is reported as fund balance. The following are the City's major governmental funds:
General fund - The general fund accounts for all financial resources except those required to be accounted for in another fund.
Debt service fund - To account for various revenues collected for payment of general obligation
debt principal, interest and related costs.
Capital improvements fund - To account for resources used to purchase equipment and construct capital assets.
Other governmental funds of the City are used to account for grants and other resources whose use is restricted to a particular purpose. These funds are nonmajor funds whose activity has been aggregated and presented in a single column in the BFS.

CITY OF DAYTON, OHIO
NOTES TO THE BASIC FINANCIAL STATEMENTS FOR THE YEAR ENDED DECEMBER 31, 2009
F 56
NOTE 2 - SUMMARY OF SIGNIFICANT ACCOUNTING POLICIES - (Continued)
Proprietary Funds - Proprietary fund reporting focuses on changes in net assets, financial position and cash flows. Proprietary funds are classified as either enterprise or internal service.
Enterprise Funds - The enterprise funds may be used to account for any activity for which a fee is charged to external users for goods or services. The following are the City’s major enterprise funds:
Dayton International Airport - To account for the provision of air traffic, primarily commercial, including air freight. Revenues are derived from landing fees, concessionaire fees, and space rentals. The Dayton-Wright Brothers Airport is included in this fund.
Water - To account for the provision of water service and water pollution control activities of the City. The Department also provides water services to several areas outside the City. Revenue is generated by charges for services including those to other departments of the City. The water supply is maintained through the development of well fields, storage facilities and pumping.
Sewer - To account for the provision of sanitary sewer service to the residential, commercial, and industrial consumers of the City and various communities within the Dayton Metropolitan area. The charges for services are based on the City’s needs for the cost of service and expenses of improvements to expand the capacity to meet the Environmental Protection Agency (EPA) standards.
Other enterprise funds of the City are used to account for the provision of storm sewers to the residents of the City and to account for the operations of the City’s six golf courses. These funds are nonmajor funds whose activity has been aggregated and presented in a single column in the BFS.
Internal Service Funds - The internal service funds account for the financing of services provided by one department or agency to other departments or agencies of the City on a cost-reimbursement basis. The City’s internal service funds include programs for fleet maintenance, fire fleet maintenance, plumbing services, workers’ compensation and stores and reproduction services.
Fiduciary Funds - Fiduciary fund reporting focuses on net assets and changes in net assets. The fiduciary fund category is split into four classifications: pension trust funds, investment trust funds, private-purpose trust funds and agency funds. Trust funds are used to account for assets held by the City under a trust agreement for individuals, private organizations, or other governments and are therefore not available to support the City’s own programs. Agency funds are custodial in nature (assets equal liabilities) and do not involve measurement of results of operations. The City’s only fiduciary funds are agency funds which are used to account for items such as building permit surcharge, prisoner’s personal accounts, performance bonds, and as well as other situations where the City’s role is purely custodial, such as the receipt, temporary investment, and remittance of fiduciary resources to individuals, private organizations, and other governments.

CITY OF DAYTON, OHIO
NOTES TO THE BASIC FINANCIAL STATEMENTS FOR THE YEAR ENDED DECEMBER 31, 2009
F 57
NOTE 2 - SUMMARY OF SIGNIFICANT ACCOUNTING POLICIES - (Continued) D. Measurement Focus
Government-wide Financial Statements - The government-wide and proprietary fund financial statements are prepared using the economic resources measurement focus. All assets and all liabilities associated with the operation of the City are included on the statement of net assets. Fund Financial Statements - All governmental funds are accounted for using a flow of current financial resources measurement focus. With this measurement focus, only current assets and current liabilities generally are included on the balance sheet. The statement of revenues, expenditures and changes in fund balances reports on the sources (i.e., revenues and other financing sources) and uses (i.e., expenditures and other financing uses) of current financial resources. This approach differs from the manner in which the governmental activities of the government-wide financial statements are prepared. Governmental fund financial statements therefore include reconciliations with brief explanations to better identify the relationship between the government-wide statements and the statements for governmental funds.
Like the government-wide statements, all proprietary funds are accounted for on a flow of economic resources measurement focus. All assets and all liabilities associated with the operation of these funds are included on the statement of net assets. The statement of changes in fund net assets presents increases (i.e., revenues) and decreases (i.e., expenses) in total net assets. The statement of cash flows provides information about how the City finances and meets the cash flow needs of its proprietary activities. Proprietary funds distinguish operating revenues and expenses from nonoperating items. Operating revenues are those revenues that are generated directly from the primary activity of the proprietary funds. For the City, these revenues are charges for services for the airport, water, sewer, storm water and golf enterprise funds and charges for services to other departments for goods and services provided by the internal service funds for fleet management, fire fleet management, stores and reproduction services, a Workers’ Compensation program and plumbing shop services. Operating expenses are necessary costs incurred to provide the goods or services that are the primary activity of the fund. Agency funds do not report a measurement focus as they do not report operations.
E. Basis of Accounting
Basis of accounting determines when transactions are recorded in the financial records and reported on the financial statements. The government-wide and proprietary fund financial statements are prepared using the accrual basis of accounting. The governmental funds use the modified accrual basis of accounting. Differences in the accrual and modified accrual basis of accounting arise in the recognition of revenue, the recording of deferred revenue and in the presentation of expenses versus expenditures.
Revenues - Exchange and Nonexchange Transactions - Revenues resulting from exchange transactions, in which each party gives and receives essentially equal value, are recorded on the accrual basis when the exchange takes place. On a modified accrual basis, revenue is recorded in the fiscal year in which the resources are measurable and become available. Available means that the resources will be collected within the current fiscal year or are expected to be collected soon enough thereafter to be used to pay liabilities of the current fiscal year. For the City, available means expected to be received within sixty days of year end.

CITY OF DAYTON, OHIO
NOTES TO THE BASIC FINANCIAL STATEMENTS FOR THE YEAR ENDED DECEMBER 31, 2009
F 58
NOTE 2 - SUMMARY OF SIGNIFICANT ACCOUNTING POLICIES - (Continued)
Nonexchange transactions, in which the City receives value without directly giving equal value in return, include income taxes, property taxes, grants, entitlements and donations. On an accrual basis, revenue from income taxes is recognized in the period in which the income is earned (See Note 7). Revenue from property taxes is recognized in the year for which the taxes are levied (See Note 6). Revenue from grants, entitlements and donations is recognized in the year in which all eligibility requirements have been satisfied. Eligibility requirements include timing requirements, which specify the year when the resources are required to be used or the year when use is first permitted, matching requirements, in which the City must provide local resources to be used for a specified purpose, and expenditure requirements, in which the resources are provided to the City on a reimbursement basis. On a modified accrual basis, revenue from nonexchange transactions must also be available before it can be recognized. Under the modified accrual basis, the following revenue sources are considered to be both measurable and available at year end: income tax, State-levied locally shared taxes (including gasoline tax, local government funds and permissive tax), fines and forfeitures, interest, grants, fees and rentals.
Unearned Revenue and Deferred Revenue - Unearned revenue and deferred revenue arise when assets are recognized before revenue recognition criteria have been satisfied.
Property taxes for which there is an enforceable legal claim as of December 31, 2009, but which were levied to finance year 2010 operations, and other revenues received in advance of the year for which they were intended to finance, have been recorded as unearned revenue.
On governmental fund financial statements, receivables that will not be collected within the available period have been reported as deferred revenue. Income taxes and special assessments not received within the available period, grants and entitlements received before the eligibility requirements are met, and delinquent property taxes due at December 31, 2009, are recorded as deferred revenue.
Expenses/Expenditures - On the accrual basis of accounting, expenses are recognized at the time they are incurred.
The measurement focus of governmental fund accounting is on decreases in net financial resources (expenditures) rather than expenses. Expenditures are generally recognized in the accounting period in which the related fund liability is incurred, if measurable. Allocations of cost, such as depreciation and amortization, are not recognized in governmental funds.
F. Budgetary Process
The budgetary process is prescribed by provisions of the Ohio Revised Code and entails the preparation of budgetary documents within an established timetable. The major documents prepared are the tax budget, the certificate of estimated resources, and the appropriation ordinance, all of which are prepared on the budgetary basis of accounting. The certificate of estimated resources and the appropriations ordinance are subject to amendment throughout the year with the legal restriction that appropriations cannot exceed estimated resources, as certified.

CITY OF DAYTON, OHIO
NOTES TO THE BASIC FINANCIAL STATEMENTS FOR THE YEAR ENDED DECEMBER 31, 2009
F 59
NOTE 2 - SUMMARY OF SIGNIFICANT ACCOUNTING POLICIES - (Continued) All funds, except agency funds, are legally required to be budgeted. The Capital Improvement fund and the HUD Programs fund (a nonmajor governmental fund), pursuant to the City's charter, are not required to be budgeted annually. These funds' appropriations, after their initial appropriations by Council at the time capital monies/grants are received (bond proceeds, etc.), remain intact until they are expended or modified by Council. Such monies are appropriated on a project level with specific identification of each project being budgeted.
The City prepares its budget on a non-GAAP budgetary basis which is the modified accrual basis with certain exceptions. The legal level of budgetary control is at the department level. Budgetary modifications at this level may only be made by resolution of the City Commission. Estimated Resources - The County Budget Commission determines if the budget substantiates a need to levy all or part of previously authorized taxes and reviews estimated revenue. The Budget Commission certifies its actions to the City by October 1. As part of this certification, the City receives the official certificate of estimated resources, which states the projected revenues of each fund. Prior to December 31, the City must revise its budget so that the total contemplated expenditures from any fund during the ensuing year will not exceed the amount available as stated in the certificate of estimated resources. The revised budget then serves as the basis for the annual appropriation ordinance. On or about January 1, the certificate of estimated resources is amended to include unencumbered fund balances at December 31 of the preceding year. The certificate may be further amended during the year if the fiscal officer determines, and the Budget Commission agrees, that an estimate needs to be either increased or decreased. The amounts reported on the budgetary statements reflect the amounts in the final amended official certificate of estimated resources issued during 2009.
Appropriations - A temporary appropriation measure to control expenditures may be passed on or about January 1 of each year for the period from January 1 to March 31. The annual appropriation ordinance must be passed by April 1 of each year for the period January 1 to December 31. The appropriation ordinance fixes spending authority at the fund and department level. The appropriation ordinance may be amended during the year as new information becomes available, provided that total fund appropriations do not exceed current estimated resources, as certified. The allocation of appropriations between line items within a department may be modified with approval of the City Manager. All other modifications may only be made by ordinance of City Commission. During the year, several supplemental appropriation measures were passed, however none of them were significant. The budget figures which appear in the statements of budgetary comparisons represent the final appropriation amounts, including all amendments and modifications.
Encumbrances - As part of formal budgetary control, purchase orders, contracts and other commitments for the expenditure of monies are recorded as the equivalent of expenditures on the non-GAAP budgetary basis in order to reserve that portion of the applicable appropriation and to determine and maintain legal compliance. The Ohio Revised Code prohibits expenditures plus encumbrances from exceeding appropriations. On the GAAP basis, encumbrances outstanding at year end are reported as reservations of fund balances for subsequent-year expenditures for governmental funds.
Lapsing of Appropriations - At the close of each year, the unencumbered balance of each appropriation reverts to the respective fund from which it was appropriated and becomes subject to future appropriations. The encumbered appropriation balance is carried forward to the succeeding calendar year.

CITY OF DAYTON, OHIO
NOTES TO THE BASIC FINANCIAL STATEMENTS FOR THE YEAR ENDED DECEMBER 31, 2009
F 60
NOTE 2 - SUMMARY OF SIGNIFICANT ACCOUNTING POLICIES - (Continued)
G. Cash and Cash Equivalents
Cash balances of the City's funds, except cash and cash equivalents and investments held by fiscal agents, are pooled and invested in order to provide improved cash management. Each fund's interest in the pool is presented as “equity in pooled cash and cash equivalents” and “investments” on the statement of net assets. The HUD Programs fund (a nonmajor governmental fund) had expended amounts greater than its share of the cash management pool of cash and cash equivalents. This fund had a negative cash balance at year-end that was eliminated by a short-term interfund loan from the general fund. This loan is classified as an “interfund loan receivable” and “interfund loan payable” on the fund financial statements (See Note 5.B.). During 2009, investments were limited to federal agency securities, U.S. Treasury notes, City owned debt, U.S. Government money market mutual funds, Dayton Power and Light stock, non-negotiable certificates of deposit and the State Treasury Asset Reserve of Ohio (STAR Ohio). Except for non-participating investment contracts, investments are stated at fair value which is based on quoted market prices. For U.S. Government money market mutual funds, fair value is determined by the fund's share price at December 31, 2009. Non-participating investment contracts, such as non-negotiable certificates of deposit, are reported at cost.
STAR Ohio is an investment pool managed by the State Treasurer's office which allows governments within the State to pool their funds for investment purposes. STAR Ohio is not registered with the SEC as an investment company, but does operate in a manner consistent with Rule 2a7 of the Investment Company Act of 1940. Investments in STAR Ohio are valued at STAR Ohio's shares price which is the price the investment could be sold for on December 31, 2009.
For purposes of the statement of cash flows and for presentation on the financial statements, the City's cash management pool and investments with original maturities of three months or less are considered to be cash and cash equivalents. Investments not part of the cash management pool, with an initial maturity of more than three months, are reported as investments.
The City utilizes a financial institution to service bonded debt as principal and interest payments become due. The balance in these accounts along with reserves held for replacement and improvement for enterprise funds, money held by the municipal court and money in the executive savings plan are shown as "cash and cash equivalents with fiscal agents" and "investments with fiscal agents ".
Interest income is distributed to the funds according to City Ordinance and statutory requirements. Interest revenue earned during 2009 was $2,788,668 in the general fund, which includes $2,161,112 assigned from other City funds.
H. Inventory of Supplies
Inventories are presented at the lower of cost or market on a first-in, first-out basis and are expensed when used.

CITY OF DAYTON, OHIO
NOTES TO THE BASIC FINANCIAL STATEMENTS FOR THE YEAR ENDED DECEMBER 31, 2009
F 61
NOTE 2 - SUMMARY OF SIGNIFICANT ACCOUNTING POLICIES - (Continued)
I. Restricted Assets
Restricted assets are those which are legally restricted in their use by bond indentures, or other legal instruments. Restricted assets in the enterprise funds include “equity in pooled cash and cash equivalents” and “cash with fiscal and escrow agents”. The “equity in pooled cash and cash equivalents” represent utility deposits held by the City. The “cash with fiscal and escrow agents” are the proceeds from revenue bond issues that are required by the bond indenture to be held by a financial services corporation. Restricted assets in the debt service fund include “cash and cash equivalents with fiscal agents”. This represents the residual proceeds from baseball bonds issued during 2000 after the loan was made to Riverfront Area Redevelopment Enterprises, Inc., that are being held in U.S. Government money market mutual funds. This money is restricted for the interest payments on the baseball revenue bonds.
J. Capital Assets
General capital assets are those assets not specifically related to activities reported in the proprietary funds. These assets generally result from expenditures in the governmental funds. These assets are reported in the governmental activities column of the government-wide statement of net assets, but are not reported in the governmental fund financial statements. Capital assets utilized by the proprietary funds are reported both in the business-type activities column of the government-wide statement of net assets and in the respective funds.
All capital assets are capitalized at cost (or estimated historical cost) and updated for additions and retirements during the year. Donated capital assets are recorded at their fair market values as of the date received. The City maintains a capitalization threshold of $5,000. The City’s infrastructure consists of bridges, curbs, lighting, sidewalks, and roads. Improvements are capitalized; the costs of normal maintenance and repairs that do not add to the value of the asset or materially extend an asset’s life are not. Interest incurred during the construction of capital assets is capitalized in the proprietary funds.
All reported capital assets are depreciated except for land and construction in progress. Improvements are depreciated over the remaining useful lives of the related capital assets. Useful lives for infrastructure were estimated based on the City’s historical records of necessary improvements and replacement. Depreciation is computed using the straight-line method over the following useful lives:
Governmental Business-Type Activities Activities Description Estimated Lives Estimated Lives Improvements other than buildings 10 - 25 years 10 - 25 years Buildings and improvements 30 - 50 years 30 - 50 years Furniture, fixtures and equipment 3 - 15 years 3 - 15 years Vehicles 3 - 25 years 3 - 25 years Infrastructure 20 - 50 years 20 - 50 years

CITY OF DAYTON, OHIO
NOTES TO THE BASIC FINANCIAL STATEMENTS FOR THE YEAR ENDED DECEMBER 31, 2009
F 62
NOTE 2 - SUMMARY OF SIGNIFICANT ACCOUNTING POLICIES - (Continued) K. Interfund Balances
On fund financial statements, receivables and payables resulting from short-term interfund loans are classified as “interfund loans receivable/payable”. On fund financial statements, long-term interfund loans are classified as “advances to/from other funds” on the balance sheet and are equally offset by a fund balance reserve account which indicates that they do not constitute available expendable resources. All other outstanding balances outstanding between funds are reported as “due to/from other funds”. These amounts are eliminated in the governmental and business-type activities columns of the statement of net assets, except for any net residual amounts due between governmental and business-type activities, which are presented as internal balances. Advances made from the City to its discretely presented component unit are reported on both the government-wide and fund financial statements as “advances to component unit”.
L. Prepayments
Payments made to vendors for services that will benefit periods beyond December 31, 2009, are recorded as prepaid items using the consumption method by recording a current asset for the prepaid amount at the time of the purchase and the expenditure/expense in the year in which services are consumed.
M. Compensated Absences
The City follows the provisions of Governmental Accounting Standards Board Statement No. 16 “Accounting for Compensated Absences”. Vacation and compensatory time benefits are accrued as a liability as the benefits are earned if the employees' rights to receive compensation are attributable to services already rendered and it is probable that the City will compensate the employees for the benefits through paid time off or some other means. The City records a liability for accumulated unused vacation time and compensatory time when earned for all employees with more than one year of service. Sick leave benefits are accrued using the termination method. An accrual for earned sick leave is made to the extent that it is probable that benefits will result in termination payments. The liability is an estimate based on the City's past experience of making termination payments. The total liability for vacation and sick leave payments has been calculated using pay rates in effect at the balance sheet date, and reduced to the maximum payment allowed by labor contract and/or statute, plus applicable additional salary related payments. City employees are granted vacation and sick leave in varying amounts. In the event of termination, an employee is reimbursed for accumulated vacation and sick leave at various rates.
The entire compensated absence liability is reported on the government-wide financial statements.
On governmental fund financial statements, compensated absences are recognized as liabilities and expenditures to the extent payments come due each period upon the occurrence of employee resignations and retirements. These amounts are recorded in the account “compensated absences payable” in the fund from which the employees who have accumulated leave are paid. The noncurrent portion of the liability is not reported. For proprietary funds, the entire amount of compensated absences is reported as a fund liability.

CITY OF DAYTON, OHIO
NOTES TO THE BASIC FINANCIAL STATEMENTS FOR THE YEAR ENDED DECEMBER 31, 2009
F 63
NOTE 2 - SUMMARY OF SIGNIFICANT ACCOUNTING POLICIES - (Continued)
N. Accrued Liabilities and Long-Term Obligations
All payables, accrued liabilities and long-term obligations payable from governmental funds are reported in the government-wide financial statements and all payables, accrued liabilities and long-term obligations payable from proprietary funds are reported on the proprietary fund financial statements.
In general, governmental fund payables and accrued liabilities that, once incurred, are paid in a timely manner and in full from current financial resources, are reported as obligations of the funds. However, claims and judgments and compensated absences that will be paid from governmental funds are reported as a liability in the fund financial statements only to the extent that they are due for payment during the current year. Bonds, capital leases and long-term loans are recognized as a liability on the fund financial statements when due.
O. Unamortized Issuance Costs/Bond Premium and Discount/Accounting Gain or Loss
On government-wide financial statements, bond issuance costs are deferred and amortized over the term of the bonds using the straight-line method. Unamortized bond issuance costs are reported as a separate line item on the statement of net assets. Bond premiums and discounts are deferred and amortized over the term of the bonds using the straight line method, which approximates the effective interest method. Bond premiums are presented as an addition to the face amount of the bonds. Bond discounts are presented as a reduction to the face amount of the bonds.
For advance refundings resulting in the defeasance of debt reported in the government-wide financial statements and in the proprietary funds, the difference between the reacquisition price and the net carrying amount of the old debt is deferred and amortized as a component of interest expense. This accounting gain or loss is amortized over the remaining life of the old debt or the life of the new debt, whichever is shorter, and is presented as an addition to or reduction from the face amount of the new debt. On the governmental fund financial statements, issuance costs and bond premiums and discounts are recognized in the current period. The reconciliation between the bonds face value and the amount reported on the statement of net assets is presented in Note 13.
P. Interfund Activity
Transfers between governmental and business-type activities on the government-wide statements are reported in the same manner as general revenues.
Exchange transactions between funds are reported as revenues in the seller funds and as expenditures/expenses in the purchaser funds. Flows of cash or goods from one fund to another without a requirement for repayment are reported as interfund transfers. Interfund transfers are reported as other financing sources/uses in governmental funds and after nonoperating revenues/expenses in proprietary funds. Repayments from funds responsible for particular expenditures/expenses to the funds that initially paid for them are not presented on the basic financial statements.

CITY OF DAYTON, OHIO
NOTES TO THE BASIC FINANCIAL STATEMENTS FOR THE YEAR ENDED DECEMBER 31, 2009
F 64
NOTE 2 - SUMMARY OF SIGNIFICANT ACCOUNTING POLICIES - (Continued)
Q. Fund Balance Reserves
Reserved fund balances indicate that portion of fund equity which is not available for current appropriation or use. The unreserved portions of fund equity reflected in the governmental funds are available for use within the specific purposes of the funds.
The City reports amounts representing encumbrances outstanding, prepayments, amounts due to claimants, advances, advances to component unit, debt service, contributions to permanent fund, and loans receivable as reservations of fund balance in the governmental fund financial statements.
R. Fund Designations
Fund balance designations may be established to indicate tentative planned expenditures of financial resources. The designations reflect the City’s intentions and are subject to change. Designations are reported as part of unreserved fund balance. The City Commission has designated the following amounts within the general fund and the street maintenance fund (a nonmajor governmental fund) and the highway maintenance fund (a nonmajor governmental fund): General fund
Project Amount Designated
Special assessments 190,973$ Employee termination 1,253,324 27th payroll administration 1,639,750 Unclaimed money 133,588 Unemployment 648,907 PRC sponsorships 148,045 DEDE contractual services 120,088 Mediation center 239,994 Employee professional development 93,126 Newsrack district 13,279 Unallocated clearing account 1,237,378 Police professional development 46,200 Mayor's heritage celebration 612 Nationwide settlement 679,540 Miami Township - Dayton JEDD 106,269 Butler Township - Dayton JEDD 15,766 Treasury investment 18,700
Total general fund 6,585,539$
Nonmajor governmental funds:Street maintenance 58,613$ Highway maintenance 340,235
Total 6,984,387$

CITY OF DAYTON, OHIO
NOTES TO THE BASIC FINANCIAL STATEMENTS FOR THE YEAR ENDED DECEMBER 31, 2009
F 65
NOTE 2 - SUMMARY OF SIGNIFICANT ACCOUNTING POLICIES - (Continued) S. Estimates
The preparation of the BFS in conformity with GAAP requires management to make estimates and assumptions that affect the amounts reported in the BFS and accompanying notes. Actual results may differ from those estimates.
T. Contributions of Capital
Contributions of capital in proprietary fund financial statements arise from outside contributions of capital assets, tap-in fees to the extent they exceed the cost of the connection to the system, or from grants or outside contributions of resources restricted to capital acquisition and construction. Capital contributions are reported as revenue in the proprietary fund financial statements.
U. Net Assets
Net assets represent the difference between assets and liabilities. Net assets invested in capital assets, net of related debt consists of capital assets, net of accumulated depreciation, reduced by the outstanding balances of any borrowing used for the acquisition, construction or improvement of those assets. Net assets are reported as restricted when there are limitations imposed on their use either through the enabling legislation or through external restrictions imposed by creditors, grantors or laws or regulations of other governments. The City did not have any net assets restricted by enabling legislation.
The City applies restricted resources first when an expense is incurred for purposes for which both restricted and unrestricted net assets are available.
NOTE 3 - ACCOUNTABILITY AND COMPLIANCE A. Change in Accounting Principles
For 2009, the City has implemented GASB Statement No. 52, “Land and Other Real Estate Held as Investments by Endowments”, GASB Statement No. 55, “The Hierarchy of Generally Accepted Accounting Principles for State and Local Governments”, GASB Statement No. 56 “Codification of Accounting and Financial Reporting Guidance Contained in the AICPA Statements on Auditing Standards”, and GASB Statement No. 57 “Other Postemployment Benefit (OPEB) Measurements by Agent Employers and Agent Multiple-Employers”.
GASB Statement No. 52 improves the quality of financial reporting by requiring endowments to report their land and other real estate investments at fair value, creating consistency in reporting among similar entities that exist to invest resources for the purpose of generating income. The implementation of GASB Statement No. 52 did not have an effect on the financial statements of the City. GASB Statement No. 55 incorporates the hierarchy of generally accepted accounting principles (GAAP) for state and local governments into the GASB’s authoritative literature. The implementation of GASB Statement No. 55 did not have an effect on the financial statements of the City. GASB Statement No. 56 incorporates into the GASB’s authoritative literature certain accounting and financial reporting guidance presented in the American Institute of Certified Public Accountants’ (AICPA) Statements on Auditing Standards. The implementation of GASB Statement No. 56 did not have an effect on the financial statements of the City.
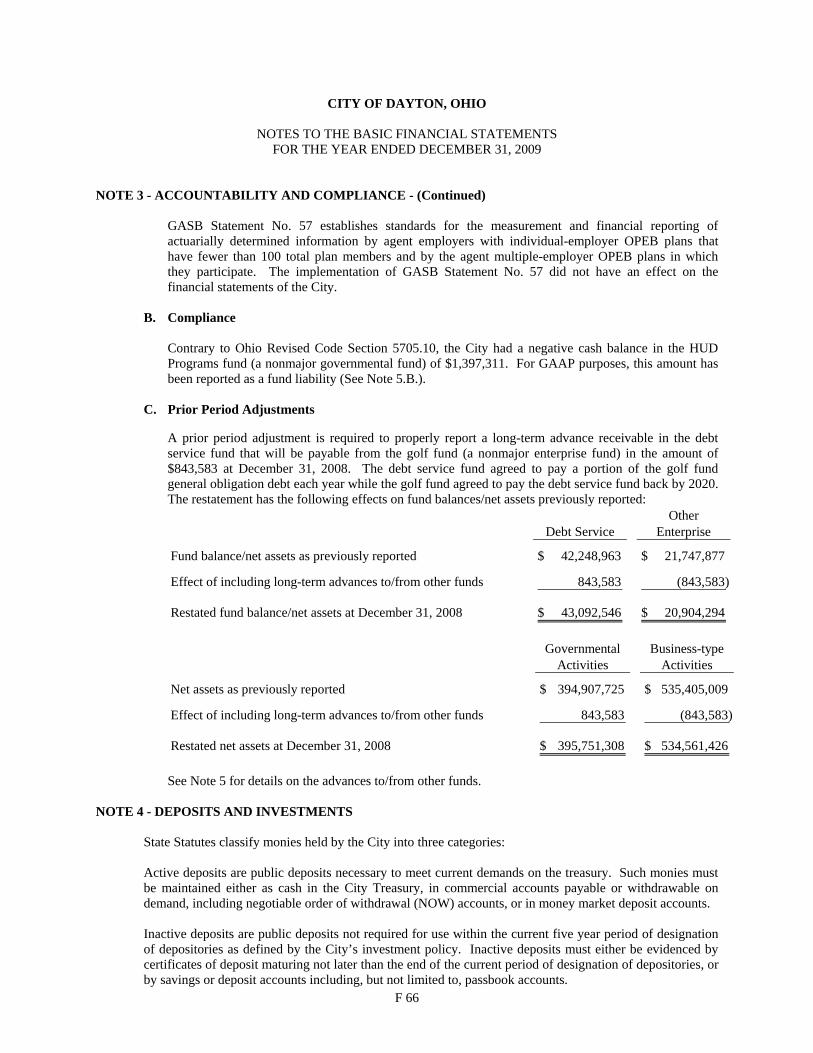
CITY OF DAYTON, OHIO
NOTES TO THE BASIC FINANCIAL STATEMENTS FOR THE YEAR ENDED DECEMBER 31, 2009
F 66
NOTE 3 - ACCOUNTABILITY AND COMPLIANCE - (Continued) GASB Statement No. 57 establishes standards for the measurement and financial reporting of actuarially determined information by agent employers with individual-employer OPEB plans that have fewer than 100 total plan members and by the agent multiple-employer OPEB plans in which they participate. The implementation of GASB Statement No. 57 did not have an effect on the financial statements of the City.
B. Compliance Contrary to Ohio Revised Code Section 5705.10, the City had a negative cash balance in the HUD
Programs fund (a nonmajor governmental fund) of $1,397,311. For GAAP purposes, this amount has been reported as a fund liability (See Note 5.B.).
C. Prior Period Adjustments
A prior period adjustment is required to properly report a long-term advance receivable in the debt service fund that will be payable from the golf fund (a nonmajor enterprise fund) in the amount of $843,583 at December 31, 2008. The debt service fund agreed to pay a portion of the golf fund general obligation debt each year while the golf fund agreed to pay the debt service fund back by 2020. The restatement has the following effects on fund balances/net assets previously reported:
OtherDebt Service Enterprise
Fund balance/net assets as previously reported 42,248,963$ 21,747,877$
Effect of including long-term advances to/from other funds 843,583 (843,583)
Restated fund balance/net assets at December 31, 2008 43,092,546$ 20,904,294$
Governmental Business-typeActivities Activities
Net assets as previously reported 394,907,725$ 535,405,009$
Effect of including long-term advances to/from other funds 843,583 (843,583)
Restated net assets at December 31, 2008 395,751,308$ 534,561,426$ See Note 5 for details on the advances to/from other funds.
NOTE 4 - DEPOSITS AND INVESTMENTS
State Statutes classify monies held by the City into three categories: Active deposits are public deposits necessary to meet current demands on the treasury. Such monies must be maintained either as cash in the City Treasury, in commercial accounts payable or withdrawable on demand, including negotiable order of withdrawal (NOW) accounts, or in money market deposit accounts. Inactive deposits are public deposits not required for use within the current five year period of designation of depositories as defined by the City’s investment policy. Inactive deposits must either be evidenced by certificates of deposit maturing not later than the end of the current period of designation of depositories, or by savings or deposit accounts including, but not limited to, passbook accounts.

CITY OF DAYTON, OHIO
NOTES TO THE BASIC FINANCIAL STATEMENTS FOR THE YEAR ENDED DECEMBER 31, 2009
F 67
NOTE 4 - DEPOSITS AND INVESTMENTS - (Continued) Interim deposits are deposits in interim monies. Interim monies are those monies which are not needed for immediate use, but which will be needed before the end of the current period of designation of depositories. Interim deposits must be evidenced by time certificates of deposit maturing not more than one year from the date of deposit or by savings or deposit accounts including passbook accounts. Interim monies may be deposited or invested in the following securities:
1. United States Treasury Notes, Bills, Bonds, or any other obligation or security issued by the United
States Treasury or any other obligation guaranteed as to principal or interest by the United States;
2. Bonds, notes, debentures, or any other obligations or securities issued by any federal government agency or instrumentality, including, but not limited to, the Federal National Mortgage Association, Federal Home Loan Bank, Federal Farm Credit Bank, Federal Home Loan Mortgage Corporation, Government National Mortgage Association, and Student Loan Marketing Association. All federal agency securities shall be direct issuances of federal government agencies or instrumentalities;
3. Written repurchase agreements in the securities listed above provided that the market value of the securities subject to the repurchase agreement must exceed the principal value of the agreement by at least two percent and be marked to market daily, and that the term of the agreement must not exceed thirty days;
4. Bonds and other obligations of the State of Ohio;
5. No-load money market mutual funds consisting exclusively of obligations described in items (1) or (2) above and repurchase agreements secured by such obligations, provided that investments in securities described in this division are made only through eligible institutions; and,
6. The State Treasurer’s investment pool (STAR Ohio). The City may also invest any monies not required to be used for a period of six months or more in the following:
1. Bonds and other obligations guaranteed by the United States; 2. Discount notes of the Federal National Mortgage Association;
3. Bonds of the State of Ohio; and,
4. Bonds of any municipal corporation, village, county, township, or other political subdivision of Ohio,
as to which there is no default of principal, interest or coupons.
Protection of the City’s deposits is provided by the Federal Deposit Insurance Corporation (FDIC), by eligible securities pledged by the financial institution as security for repayment, by surety company bonds deposited with the treasurer by the financial institution or by a single collateral pool established by the financial institution to secure the repayment of all public monies deposited with the institution.

CITY OF DAYTON, OHIO
NOTES TO THE BASIC FINANCIAL STATEMENTS FOR THE YEAR ENDED DECEMBER 31, 2009
F 68
NOTE 4 - DEPOSITS AND INVESTMENTS - (Continued) Investments in stripped principal or interest obligations, reverse repurchase agreements and derivatives are prohibited. The issuance of taxable notes for the purpose of arbitrage, the use of leverage and short selling are also prohibited. An investment must mature within five years from the date of purchase unless matched to a specific obligation or debt of the City, and must be purchased with the expectation that it will be held to maturity. Investments may only be made through specified dealers and institutions. Payment for investments may be made only upon delivery of the securities representing the investments to the Finance Director or qualified trustee or, if the securities are not represented by a certificate, upon receipt of confirmation of transfer from the custodian. A. Cash on Hand
At year end, the City had $56,907 in undeposited cash on hand which is included on the financial statements of the City as part of “equity in pooled cash and cash equivalents”.
B. Deposits with Financial Institutions
At December 31, 2009, the carrying amount of all City deposits was $3,600,807. As of December 31, 2009, $10,046,904 of the City’s bank balance of $10,796,904 was exposed to custodial risk as discussed below, while $750,000 was covered by the FDIC.
Custodial credit risk is the risk that, in the event of bank failure, the City will not be able to recover deposits or collateral securities that are in the possession of an outside party. As permitted by Ohio Revised Code, the City’s deposits are collateralized by a pool of eligible securities deposited with Federal Reserve Banks, or at member banks of the Federal Reserve System, in the name of the depository bank and pledged as a pool of collateral against all public deposits held by the depository. The City has no deposit policy for custodial credit risk beyond the requirements of State statute. Although the securities were held by the pledging institutions’ trust department and all statutory requirements for the deposit of money had been followed, noncompliance with federal requirements could potentially subject the City to a successful claim by the FDIC. The City has no deposit policy for custodial credit risk beyond the requirements of State statute. Although the securities were held by the pledging institutions’ trust department and all statutory requirements for the deposit of money had been followed, noncompliance with federal requirements could potentially subject the City to a successful claim by the FDIC.
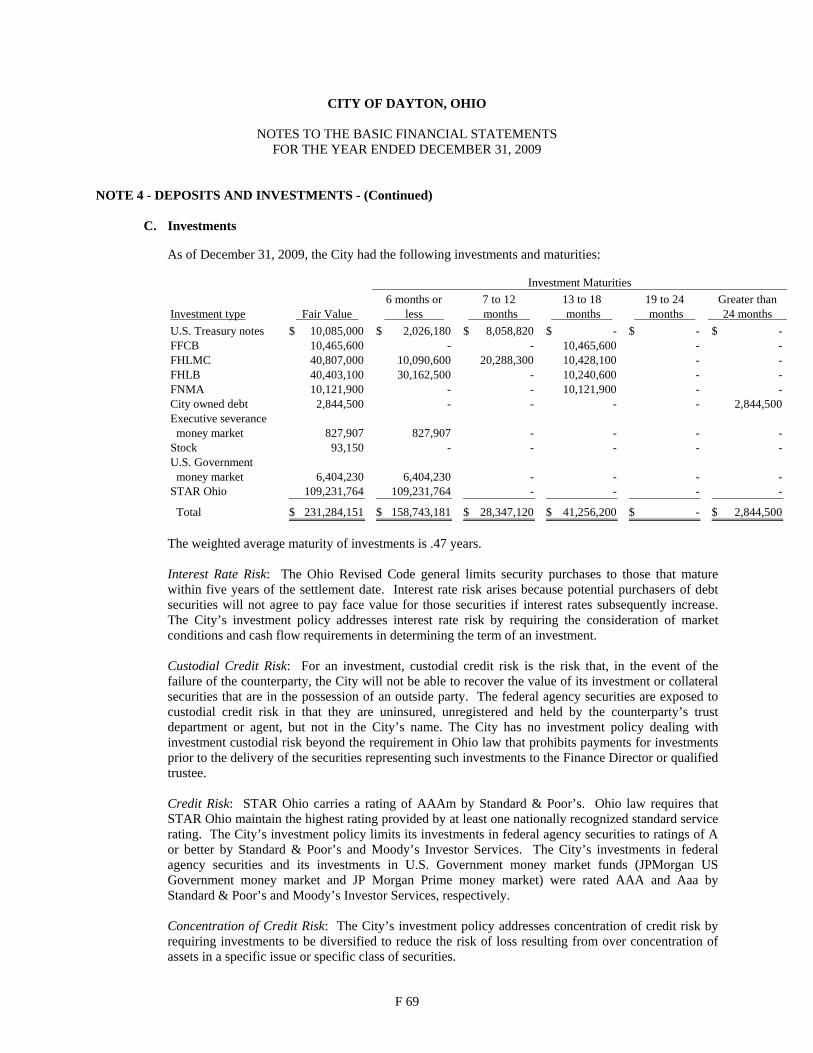
CITY OF DAYTON, OHIO
NOTES TO THE BASIC FINANCIAL STATEMENTS FOR THE YEAR ENDED DECEMBER 31, 2009
F 69
NOTE 4 - DEPOSITS AND INVESTMENTS - (Continued)
C. Investments As of December 31, 2009, the City had the following investments and maturities:
6 months or 7 to 12 13 to 18 19 to 24 Greater thanInvestment type Fair Value less months months months 24 months U.S. Treasury notes 10,085,000$ 2,026,180$ 8,058,820$ -$ -$ -$ FFCB 10,465,600 - - 10,465,600 - - FHLMC 40,807,000 10,090,600 20,288,300 10,428,100 - - FHLB 40,403,100 30,162,500 - 10,240,600 - - FNMA 10,121,900 - - 10,121,900 - - City owned debt 2,844,500 - - - - 2,844,500 Executive severance money market 827,907 827,907 - - - - Stock 93,150 - - - - - U.S. Government money market 6,404,230 6,404,230 - - - - STAR Ohio 109,231,764 109,231,764 - - - -
Total 231,284,151$ 158,743,181$ 28,347,120$ 41,256,200$ -$ 2,844,500$
Investment Maturities
The weighted average maturity of investments is .47 years.
Interest Rate Risk: The Ohio Revised Code general limits security purchases to those that mature within five years of the settlement date. Interest rate risk arises because potential purchasers of debt securities will not agree to pay face value for those securities if interest rates subsequently increase. The City’s investment policy addresses interest rate risk by requiring the consideration of market conditions and cash flow requirements in determining the term of an investment.
Custodial Credit Risk: For an investment, custodial credit risk is the risk that, in the event of the failure of the counterparty, the City will not be able to recover the value of its investment or collateral securities that are in the possession of an outside party. The federal agency securities are exposed to custodial credit risk in that they are uninsured, unregistered and held by the counterparty’s trust department or agent, but not in the City’s name. The City has no investment policy dealing with investment custodial risk beyond the requirement in Ohio law that prohibits payments for investments prior to the delivery of the securities representing such investments to the Finance Director or qualified trustee. Credit Risk: STAR Ohio carries a rating of AAAm by Standard & Poor’s. Ohio law requires that STAR Ohio maintain the highest rating provided by at least one nationally recognized standard service rating. The City’s investment policy limits its investments in federal agency securities to ratings of A or better by Standard & Poor’s and Moody’s Investor Services. The City’s investments in federal agency securities and its investments in U.S. Government money market funds (JPMorgan US Government money market and JP Morgan Prime money market) were rated AAA and Aaa by Standard & Poor’s and Moody’s Investor Services, respectively. Concentration of Credit Risk: The City’s investment policy addresses concentration of credit risk by requiring investments to be diversified to reduce the risk of loss resulting from over concentration of assets in a specific issue or specific class of securities.

CITY OF DAYTON, OHIO
NOTES TO THE BASIC FINANCIAL STATEMENTS FOR THE YEAR ENDED DECEMBER 31, 2009
F 70
NOTE 4 - DEPOSITS AND INVESTMENTS - (Continued) The following table includes the percentage of each investment type held by the City at December 31, 2009:
Investment type Fair Value % of Total
U.S. Treasury notes 10,085,000$ 4.36 FFCB 10,465,600 4.52 FHLMC 40,807,000 17.64 FHLB 40,403,100 17.47 FNMA 10,121,900 4.38 City owned debt 2,844,500 1.23 Executive severance money market 827,907 0.36 Stock 93,150 0.04 U.S. Government money market 6,404,230 2.77 STAR Ohio 109,231,764 47.23
Total 231,284,151$ 100.00
D. Reconciliation of Cash and Investments to the Statement of Net Assets
The following is a reconciliation of cash and investments as reported in the note above to cash and investments as reported on the statement of net assets as of December 31, 2009:
Cash and investments per note Carrying amount of deposits 3,600,807$ Investments 231,284,151 Cash on hand 56,907 Total 234,941,865$
Cash and investments per statement of net assets Governmental activities 78,014,066$ Business type activities 146,538,665 Agency funds 10,389,134
Total 234,941,865$
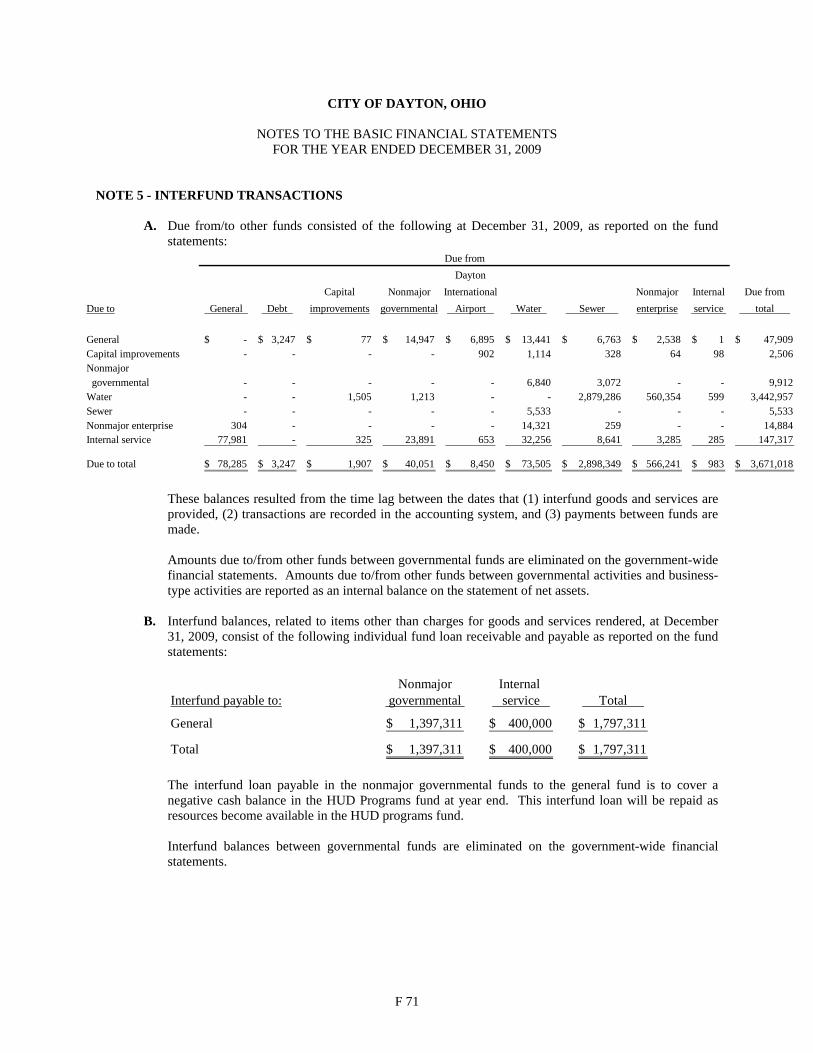
CITY OF DAYTON, OHIO
NOTES TO THE BASIC FINANCIAL STATEMENTS FOR THE YEAR ENDED DECEMBER 31, 2009
F 71
NOTE 5 - INTERFUND TRANSACTIONS
A. Due from/to other funds consisted of the following at December 31, 2009, as reported on the fund statements:
DaytonCapital Nonmajor International Nonmajor Internal Due from
Due to General Debt improvements governmental Airport Water Sewer enterprise service total
General -$ 3,247$ 77$ 14,947$ 6,895$ 13,441$ 6,763$ 2,538$ 1$ 47,909$ Capital improvements - - - - 902 1,114 328 64 98 2,506 Nonmajor governmental - - - - - 6,840 3,072 - - 9,912 Water - - 1,505 1,213 - - 2,879,286 560,354 599 3,442,957 Sewer - - - - - 5,533 - - - 5,533 Nonmajor enterprise 304 - - - - 14,321 259 - - 14,884 Internal service 77,981 - 325 23,891 653 32,256 8,641 3,285 285 147,317
Due to total 78,285$ 3,247$ 1,907$ 40,051$ 8,450$ 73,505$ 2,898,349$ 566,241$ 983$ 3,671,018$
Due from
These balances resulted from the time lag between the dates that (1) interfund goods and services are
provided, (2) transactions are recorded in the accounting system, and (3) payments between funds are made.
Amounts due to/from other funds between governmental funds are eliminated on the government-wide
financial statements. Amounts due to/from other funds between governmental activities and business-type activities are reported as an internal balance on the statement of net assets.
B. Interfund balances, related to items other than charges for goods and services rendered, at December
31, 2009, consist of the following individual fund loan receivable and payable as reported on the fund statements:
Nonmajor Internal
Interfund payable to: governmental service Total
General 1,397,311$ 400,000$ 1,797,311$
Total 1,397,311$ 400,000$ 1,797,311$ The interfund loan payable in the nonmajor governmental funds to the general fund is to cover a negative cash balance in the HUD Programs fund at year end. This interfund loan will be repaid as resources become available in the HUD programs fund. Interfund balances between governmental funds are eliminated on the government-wide financial statements.

CITY OF DAYTON, OHIO
NOTES TO THE BASIC FINANCIAL STATEMENTS FOR THE YEAR ENDED DECEMBER 31, 2009
F 72
NOTE 5 - INTERFUND TRANSACTIONS - (Continued)
C. Advances to component unit and advances from primary government consisted of the following at December 31, 2009, as reported on the fund statements:
Capital Nonmajor
Advance to improvements governmental Water Total
Component unit 5,393,043$ 7,801,264$ 1,777,778$ 14,972,085$ The City does not anticipate repayment of the advances to component unit within the next year.
D. Interfund transfers for the year ended December 31, 2009, consisted of the following, as reported on the fund statements:
Transfer to
Debt Capital NonmajorTransfer from General service improvements governmental
General -$ -$ 1,610,000$ 8,775,812$ Nonmajor governmental 804,913 - - 571,101 Other enterprise - 56,677 - -
Transfer to total 804,913$ 56,677$ 1,610,000$ 9,346,913$
DaytonInternational Nonmajor Internal Airport Water Sewer enterprise service Total
General 149,758$ 225,849$ 104,586$ 53,263$ 195,400$ 11,114,668$ Nonmajor governmental - 35,214 - 150,968 1,549 1,563,745 Other enterprise - - - - - 56,677
Transfer to total 149,758$ 261,063$ 104,586$ 204,231$ 196,949$ 12,735,090$ Transfers are used to (1) move revenues from the fund that statute or budget requires to collect them to the fund that statute or budget requires to expend them, (2) move receipts restricted to debt service from the funds collecting the receipts to the debt service fund as debt service payments become due, and (3) use unrestricted revenues collected in the general fund to finance various programs accounted for in other funds in accordance with budgetary authorizations and (4) transfers from the miscellaneous grants fund (a nonmajor governmental fund) in the amount of $1,563,745 were to move Federal Emergency Management Agency (FEMA) grant money to the proper funds. Transfers between governmental funds are eliminated on the government-wide financial statements. Transfers between governmental activities and business-type activities are reported as transfers on the statement of activities.

CITY OF DAYTON, OHIO
NOTES TO THE BASIC FINANCIAL STATEMENTS FOR THE YEAR ENDED DECEMBER 31, 2009
F 73
NOTE 5 - INTERFUND TRANSACTIONS - (Continued)
E. Advances to/from other funds for the year ended December 31, 2009, consisted of the following, as reported on the fund statements:
Receivable fund Payable fund Amount
Debt service Nonmajor enterprise fund 912,306$
Advances from the debt service fund to the golf fund (a nonmajor enterprise fund) are for debt service payments relating to the Series 2001 Golf Renovation General Obligation Bonds. The golf fund did not have the revenue to support complete repayment of the bonds. An agreement was made which allowed the debt service fund to pay a portion of the golf fund debt each year and the golf fund agreed to make payments of $281,505 each year for twenty years, eight years longer than the original issue date. Repayment on the loan will begin in 2013 with the complete loan being retired in 2020. Advances between governmental funds and business-type activities are reported as an internal balance on the statement of net assets.
NOTE 6 - PROPERTY TAXES
Property taxes include amounts levied against all real and public utility property located in the City. Taxes collected from real property taxes (other than public utility) in one calendar year are levied in the preceding calendar year on the assessed value as of January 1 of that preceding year, the lien date. Assessed values are established by the County Auditor at 35 percent of appraised market value. All property is required to be revaluated every six years. Real property taxes are payable annually or semi-annually. If paid annually, payment is due December 31; if paid semi-annually, the first payment is due December 31, with the remainder payable by June 20. Under certain circumstances, State statute permits later payment dates to be established.
Public utility real and tangible personal property taxes collected in one calendar year are levied in the
preceding calendar year on assessed values determined as of December 31 of the second year preceding the tax collection year, the lien date. Public utility tangible personal property is assessed at varying percentages of true value; public utility real property is assessed at 35 percent of true value. 2009 public utility property taxes became a lien December 31, 2008, are levied after October 1, 2009, and are collected in 2010 with real property taxes. Public utility property taxes are payable on the same dates as real property taxes described previously.
Beginning in calendar year 2009 tangible personal property tax on business inventory, manufacturing
machinery and equipment, and furniture and fixtures is no longer levied and collected. The October 2008 tangible personal property tax settlement was the last property tax settlement for general personal property taxes. Tangible personal property tax collections in calendar year 2009 represent delinquent collections.
House Bill No. 66 was signed into law on June 30, 2005. House Bill No. 66 phases out the tax on tangible
personal property of general businesses, telephone and telecommunications companies, and railroads. The tax on general business and railroad property was eliminated by calendar year 2009, and the tax on telephone and telecommunications property will be eliminated by calendar year 2011. The tax is phased out by reducing the assessment rate on the property each year. The bill replaces the revenue lost by the City due to the phasing out of the tax. In calendar years 2009-2010, the City will be fully reimbursed for the lost revenue. In calendar years 2011-2017, the reimbursements will be phased out.

CITY OF DAYTON, OHIO
NOTES TO THE BASIC FINANCIAL STATEMENTS FOR THE YEAR ENDED DECEMBER 31, 2009
F 74
NOTE 6 - PROPERTY TAXES - (Continued) The County Treasurer collects property taxes on behalf of all taxing districts in the County, including the
City of Dayton. The County Auditor periodically remits to the City its portion of the taxes collected. Property taxes receivable represents real property taxes, public utility taxes and outstanding delinquencies which are measurable as of December 31, 2009 and for which there is an enforceable legal claim. In the governmental funds, the current portion receivable has been offset by unearned revenue since the current taxes were not levied to finance 2009 operations and the collection of delinquent taxes has been offset by deferred revenue since the collection of the taxes during the available period is not subject to reasonable estimation. On a full accrual basis, collectible delinquent property taxes have been recorded as a receivable and revenue while on a modified accrual basis the revenue is deferred.
The full tax rate for all City operations for the year ended December 31, 2009 was $10 per $1,000 of
assessed value. The assessed values of real and tangible personal property upon which 2009 property tax receipts were based are as follows:
Real Property Residential/Agricultural 1,162,497,620$ Commercial/Industrial/Mineral 547,824,530
Telecom 2,088,420
Public Utility Real 1,335,600 Personal 72,969,690
Total Assessed Value 1,786,715,860$ NOTE 7 - INCOME TAX
On March 27, 1984, the City Commission levied a municipal income tax of 1.75% on substantially all income earned within the City. In addition, on March 14, 2006, the City renewed their additional .50% levy through December 31, 2014. The City income tax also applies to the net income of businesses located or doing business within the City. The residents of the City are required to pay income tax on income earned outside of the City; however, the City allows a credit for income taxes paid to another municipality up to 100% of the City's current tax rate.
Employers within the City are required to withhold income tax on employee compensation and remit the tax to the City of Dayton at least quarterly. Corporations and other individual taxpayers are required to pay their estimated tax quarterly and file a declaration annually. The City of Dayton administers the collection of income taxes and the assessment of interest and penalties. Income tax proceeds are to be used to pay the cost of administering the tax and are recorded in the general fund. Income tax revenue for 2009, as reported in the governmental fund financial statements on the modified accrual basis of accounting, was $99,831,456.

CITY OF DAYTON, OHIO
NOTES TO THE BASIC FINANCIAL STATEMENTS FOR THE YEAR ENDED DECEMBER 31, 2009
F 75
NOTE 8 - RECEIVABLES
Receivables at December 31, 2009, consisted of taxes, accounts (billings for user charged services), special assessments, accrued interest, loans and intergovernmental receivables arising from grants, entitlements, and shared revenue. All intergovernmental receivables have been classified as “due from other governments” on the basic financial statements. Receivables have been recorded to the extent that they are both measurable and available at December 31, 2009, as well as intended to finance 2009 operations. A summary of the principal items of receivables reported on the statement of net assets follows: Governmental activities: Property and other local taxes 22,398,893$ Muncipal income taxes 15,287,978 Accounts 3,967,710 Special assessments 1,202,383 Accrued interest 515,168 Loans 25,700,000 Due from other governments 32,805,411
Business-type activities: Accounts 15,163,666$ Special assessment 912,180 Accrued interest 400,198 Due from other governments 6,101,221
Receivables have been disaggregated on the face of the basic financial statements. Amounts reported as “due from other governments” in the governmental activities include local government and local government revenue assistance from the State of Ohio, motor vehicle license and gasoline taxes, homestead and rollback, grants and estate taxes. The amounts reported as “due from other governments” in the business-type activities include various State and federal grants whose eligibility requirements have been met by year end. The only receivables not expected to be collected within the subsequent year are the special assessments and the loans. The special assessments are collected over the term of the assessment and the loans receivable which will be collected annually through 2028 (See Note 9).
NOTE 9 - LOANS RECEIVABLE
A. Riverfront Area Redevelopment Enterprises, Inc. During 1999, the City issued taxable economic development revenue bonds payable from nontax
revenues of the City, in the amount of $12,190,000 (See Note 13.A.) and loaned $11,200,000 of the proceeds to Riverfront Area Redevelopment Enterprises, Inc. (the “Stadium Owner”) to assist in financing the costs of constructing a baseball stadium. In consideration of the repayment of the loan, the Stadium Owner shall make loan payments in the amount of $560,000 on April 1 of each year for twenty years, commencing April 1, 2000. All loan payments received will be credited against the outstanding principal amount of the loan, there being no interest payable on the loan.
The obligations of the stadium owner to make a loan payment on any loan payment date shall be
forgiven if neither the stadium owner nor the team owner has materially breached, violated, or failed to fully perform any provision contained in the ground lease, the stadium lease, or the plaza lease (See Note 12) and the team owner has committed to play all club home games at the stadium during the then current calendar year. At December 31, 2009, the amount owed to the City was $5,600,000.

CITY OF DAYTON, OHIO
NOTES TO THE BASIC FINANCIAL STATEMENTS FOR THE YEAR ENDED DECEMBER 31, 2009
F 76
NOTE 9 - LOANS RECEIVABLE - (Continued)
B. Dayton-Montgomery County Port Authority
During 2008, the City issued $32,000,000 in economic development revenue bonds payable from nontax revenues of the City. The City loaned $20,100,000 of the proceeds to the Dayton-Montgomery County Port Authority (the “Port Authority”) to assist in financing the costs of constructing a parking facility to be used by CareSource, a nonprofit corporation. The Port Authority will make loan payments semiannually on July 1 and December 1 at a 4.67% interest rate. The final loan payment is due December 1, 2028. At December 31, 2009, the amount owed to the City was $20,100,000.
NOTE 10 - CAPITAL ASSETS
A. Capital asset activity for the governmental activities for the year ended December 31, 2009, was as
follows:Balance Balance
12/31/08 Additions Deductions 12/31/09 Governmental activities:Capital assets, not being depreciated: Land 64,248,442$ 2,739,378$ -$ 66,987,820$ Construction in progress 9,915,488 35,713,336 (2,726,377) 42,902,447
Total capital assets, not being depreciated 74,163,930 38,452,714 (2,726,377) 109,890,267
Capital assets, being depreciated: Building improvements 107,202,842 1,252,400 - 108,455,242 Improvements other than buildings 53,851,623 91,742 - 53,943,365 Equipment 23,104,366 902,020 - 24,006,386 Motor vehicles 42,211,365 308,693 (1,129,704) 41,390,354 Infrastructure 232,827,679 1,580,276 - 234,407,955
Total capital assets, being depreciated 459,197,875 4,135,131 (1,129,704) 462,203,302
Less: accumulated depreciation Building improvements (63,969,349) (2,507,397) - (66,476,746) Improvements other than buildings (35,021,235) (1,294,978) - (36,316,213) Equipment (15,471,757) (1,399,996) - (16,871,753) Motor vehicles (28,588,292) (2,221,586) 1,064,713 (29,745,165) Infrastructure (55,954,352) (5,050,910) - (61,005,262)
Total accumulated depreciation (199,004,985) (12,474,867) 1,064,713 (210,415,139)
Total capital assets being depreciated, net 260,192,890 (8,339,736) (64,991) 251,788,163
Governmental activities capital assets, net 334,356,820$ 30,112,978$ (2,791,368)$ 361,678,430$

CITY OF DAYTON, OHIO
NOTES TO THE BASIC FINANCIAL STATEMENTS FOR THE YEAR ENDED DECEMBER 31, 2009
F 77
NOTE 10 - CAPITAL ASSETS - (Continued)
Depreciation expense was charged to functions of the governmental activities as follows: Governmental activities: Downtown 1,063,486$ Youth, education and human services 2,075 Community development and neighborhoods 453,972 Economic development 141,093 Leadership and quality of life 7,186,813 Corporate responsibility 1,351,775 Public safety and justice 2,275,653 Total depreciation expense - governmental activities 12,474,867$
B. Capital asset activity for the business-type activities for the year ended December 31, 2009, was as
follows: Balance Balance
12/31/08 Additions Deductions 12/31/09 Business-type activities:Capital assets, not being depreciated: Land 42,663,240$ 216,462$ -$ 42,879,702$ Construction in progress 24,809,724 27,265,546 (8,388,311) 43,686,959
Total capital assets, not being depreciated 67,472,964 27,482,008 (8,388,311) 86,566,661
Capital assets, being depreciated: Buildings and improvements 159,821,515 1,015,148 - 160,836,663 Improvements other than buildings 583,024,898 11,250,632 - 594,275,530 Equipment 15,678,944 218,049 - 15,896,993 Vehicles 34,195,660 1,584,928 (320,150) 35,460,438
Total capital assets, being depreciated 792,721,017 14,068,757 (320,150) 806,469,624
Less: accumulated depreciation Buildings and improvements (72,156,432) (3,357,373) - (75,513,805) Improvements other than buildings (315,341,698) (18,088,147) - (333,429,845) Equipment (8,024,365) (1,328,101) 320,150 (9,032,316) Vehicles (21,206,488) (1,548,279) - (22,754,767)
Total accumulated depreciation (416,728,983) (24,321,900) 320,150 (440,730,733)
Total capital assets being depreciated, net 375,992,034 (10,253,143) - 365,738,891
Business-type activities capital assets, net 443,464,998$ 17,228,865$ (8,388,311)$ 452,305,552$

CITY OF DAYTON, OHIO
NOTES TO THE BASIC FINANCIAL STATEMENTS FOR THE YEAR ENDED DECEMBER 31, 2009
F 78
NOTE 10 - CAPITAL ASSETS - (Continued) Depreciation expense was charged to the enterprise funds as follows:
Business-type activities: Dayton international airport 9,461,860$ Water 6,450,497 Sewer 7,722,188 Storm Water 424,933 Golf 262,422
Total depreciation expense - business type activities 24,321,900$
C. Outstanding contractual commitments related to construction in progress for the year ended December
31, 2009, was as follows:
Governmental activities 15,692,041$ DIA 16,260,281 Water 3,563,937 Sewer 539,829
Total outstanding contractual commitments 36,056,088$ NOTE 11 - CAPITAL LEASES - LESSEE DISCLOSURE
In a previous year, the City entered into a capitalized lease for land.
The lease meets the criteria of capital leases as defined by Statement of Financial Accounting Standard No. 13, “Accounting for Leases”, which defines a capital lease generally as one which transfers benefits and risks of ownership to the lessee. The capital lease payments were made from the special projects fund (a nonmajor governmental fund). Capital lease payments have been reclassified and are reflected as debt service expenditures in the basic financial statements and are reported as function expenditures on the budgetary statements. Capital assets consisting of land have been capitalized in the amount of $4,500,000. This amount represents the present value of the minimum lease payments at the time of acquisition. Principal payments in 2009 totaled $1,494,000. There are no future obligations on this lease.
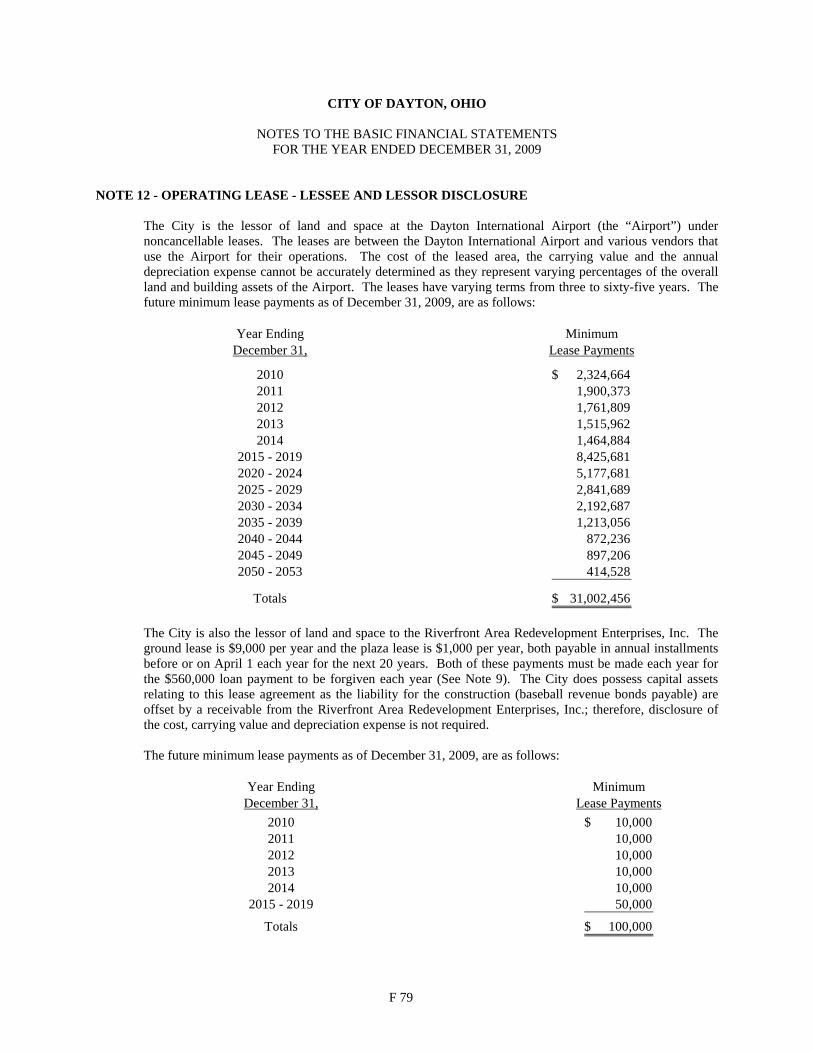
CITY OF DAYTON, OHIO
NOTES TO THE BASIC FINANCIAL STATEMENTS FOR THE YEAR ENDED DECEMBER 31, 2009
F 79
NOTE 12 - OPERATING LEASE - LESSEE AND LESSOR DISCLOSURE
The City is the lessor of land and space at the Dayton International Airport (the “Airport”) under noncancellable leases. The leases are between the Dayton International Airport and various vendors that use the Airport for their operations. The cost of the leased area, the carrying value and the annual depreciation expense cannot be accurately determined as they represent varying percentages of the overall land and building assets of the Airport. The leases have varying terms from three to sixty-five years. The future minimum lease payments as of December 31, 2009, are as follows:
Year Ending MinimumDecember 31, Lease Payments
2010 2,324,664$ 2011 1,900,373 2012 1,761,809 2013 1,515,962 2014 1,464,884
2015 - 2019 8,425,681 2020 - 2024 5,177,681 2025 - 2029 2,841,689 2030 - 2034 2,192,687 2035 - 2039 1,213,056 2040 - 2044 872,236 2045 - 2049 897,206 2050 - 2053 414,528
Totals 31,002,456$
The City is also the lessor of land and space to the Riverfront Area Redevelopment Enterprises, Inc. The ground lease is $9,000 per year and the plaza lease is $1,000 per year, both payable in annual installments before or on April 1 each year for the next 20 years. Both of these payments must be made each year for the $560,000 loan payment to be forgiven each year (See Note 9). The City does possess capital assets relating to this lease agreement as the liability for the construction (baseball revenue bonds payable) are offset by a receivable from the Riverfront Area Redevelopment Enterprises, Inc.; therefore, disclosure of the cost, carrying value and depreciation expense is not required. The future minimum lease payments as of December 31, 2009, are as follows:
Year Ending MinimumDecember 31, Lease Payments
2010 10,000$ 2011 10,000 2012 10,000 2013 10,000 2014 10,000
2015 - 2019 50,000
Totals 100,000$

CITY OF DAYTON, OHIO
NOTES TO THE BASIC FINANCIAL STATEMENTS FOR THE YEAR ENDED DECEMBER 31, 2009
F 80
NOTE 13 - LONG-TERM OBLIGATIONS
A. The City’s governmental activities long-term obligations at year-end and a schedule of current year activity are as follows:
Original Amounts
Issue Maturity Interest Issue Balance Balance Due in
Governmental activities: Date Date Rate (%) Amount 12/31/08 Increase Decrease 12/31/09 One Year
General obligation bonds:
Road improvements 06/01/89 12/01/09 7.000 5,200,000$ 260,000$ -$ (260,000)$ -$ -$
Human rehabilitation
center 06/01/89 12/01/09 7.000 2,425,000 125,000 - (125,000) - -
Police district facilities 06/01/89 12/01/09 7.000 1,815,000 95,000 - (95,000) - -
Taxable housing
improvements 10/01/93 11/01/13 5.35 - 6.5 3,035,000 775,000 - (155,000) 620,000 155,000
Capital facilities 05/01/98 12/01/09 4.6 - 5.0 15,630,000 755,000 - (755,000) - -
Capital facilities 12/01/98 12/01/20 3.1 - 5.125 22,200,000 9,325,000 - (9,325,000) - -
Capital facilities 02/01/01 12/01/14 3.75 - 4.65 24,911,861 10,761,334 - (6,830,391) 3,930,943 1,573,244
Capital facilities 06/09/04 12/01/19 3.0 - 5.25 11,360,000 8,925,000 - (655,000) 8,270,000 675,000
Capital facilities 10/25/07 12/01/27 4.0 - 5.0 19,745,000 18,420,000 - (1,440,000) 16,980,000 2,230,000
Various purpose and refunding 07/28/09 12/01/29 2.5 - 5.0 26,483,111 - 26,483,111 - 26,483,111 1,511,883
Total g.o. bonds 49,441,334 26,483,111 (19,640,391) 56,284,054 6,145,127
Revenue bonds:
Economic development -
parking facility 01/10/08 12/01/28 4.0 - 5.0 32,000,000 32,000,000 - - 32,000,000 1,035,000
Baseball revenue bonds 03/01/99 12/01/19 5.69 - 6.85 12,190,000 8,500,000 - (8,500,000) - -
Baseball revenue refunding bonds 12/30/09 12/01/19 2.25 - 3.5 7,925,000 - 7,925,000 - 7,925,000 740,000
Total revenue bonds 40,500,000 7,925,000 (8,500,000) 39,925,000 1,775,000
Special assessment bonds:
Sidewalk construction 11/01/00 11/01/10 6.000 127,575 25,600 - (12,800) 12,800 12,800
Sidewalk construction 12/01/01 12/01/11 6.000 11,089 3,300 - (1,100) 2,200 1,100
Sidewalk construction 11/01/02 11/01/12 6.000 251,050 100,400 - (25,100) 75,300 25,100
Ornamental lighting 11/01/02 11/01/12 6.000 88,276 35,200 - (8,800) 26,400 8,800
Sidewalk construction 12/01/03 12/01/13 6.000 167,947 83,500 - (16,700) 66,800 16,700
Sidewalk construction 12/01/04 12/01/09 6.000 112,047 22,400 - (22,400) - -
Sidewalk construction 12/01/04 12/01/14 6.000 232,415 139,200 - (23,200) 116,000 23,200
Total special assessment bonds 409,600 - (110,100) 299,500 87,700

CITY OF DAYTON, OHIO
NOTES TO THE BASIC FINANCIAL STATEMENTS FOR THE YEAR ENDED DECEMBER 31, 2009
F 81
NOTE 13 - LONG-TERM OBLIGATIONS - (Continued)
Original Amounts
Issue Maturity Interest Issue Balance Balance Due in
Governmental activities: Date Date Rate (%) Amount 12/31/08 Increase Decrease 12/31/09 One Year
Other long-term obligations:
Ohio Public Works
Commission loan 07/01/02 07/01/17 3.0 239,750$ 208,176$ -$ (10,842)$ 197,334$ 22,173$
Judgements 25,577 469,248 (491,178) 3,647 3,647
Claims 5,267,199 3,266,745 (2,243,896) 6,290,048 77,924
Pollution remediation
obligations 1,780,000 1,454,627 (2,055,454) 1,179,173 1,179,173
Compensated absences 12,061,010 4,414,594 (6,956,091) 9,519,513 4,685,526
Voluntary termination benefits 512,858 354,968 (867,826) - -
Capital lease obligations 1,494,000 - (1,494,000) - -
Total other long-term obligations 21,348,820 9,960,182 (14,119,287) 17,189,715 5,968,443
Total governmental activities 111,699,754$ 44,368,293$ (42,369,778)$ 113,698,269 13,976,270$
Less: unamortized deferred charges (1,077,053)
Add: unamortized bond premiums and discounts 584,038
Total on statement of net assets 113,205,254$
General obligation bonds were used to construct street improvements and government construction projects. All general obligation bonds will be paid through the debt service fund from property tax revenues and other revenue sources of the City. On October 25, 2007, the City issued $19,745,000 in general obligation bonds to advance refund $10,035,000 of outstanding general obligation bonds. The remaining issuance of $9,540,000 was used for capital improvements. The $10,035,000 issuance proceeds were used to purchase securities which were placed in an irrevocable trust to provide resources for all future debt service payments on refunded debt. This refunded debt is considered defeased (in-substance) and accordingly, has been removed from the statement of net assets. The refunding issue is comprised of current interest bonds, par value $19,745,000. The interest rates on the current interest bonds range from 4.0% to 5.0%. Interest payments of the current interest bonds are due on June 1 and December 1 of each year. The final maturity date stated on the issue is December 1, 2027.

CITY OF DAYTON, OHIO
NOTES TO THE BASIC FINANCIAL STATEMENTS FOR THE YEAR ENDED DECEMBER 31, 2009
F 82
NOTE 13 - LONG-TERM OBLIGATIONS - (Continued) On July 28, 2009, the City issued general obligation bonds (Series 2009 various purpose and refunding bonds) in the amount of $27,255,000 for the following purposes: $771,889 to advance refund the callable portion of the Series 2001 golf renovation general obligation bonds (see Note 13.B.), $5,023,111 to advance refund the callable portion of the Series 2001 capital facilities general obligation bonds, $8,730,000 to advance refund the callable portion of the Series 1998 capital facilities general obligation bonds and $12,730,000 for capital improvements. This refunded debt is considered defeased (in-substance) and accordingly, has been removed from the statement of net assets. The balance of the refunded Series 2001 golf renovation general obligation bonds at December 31, 2009, is $771,889. The balance of the refunded Series 2001 capital facilities general obligation bonds at December 31, 2009, is $8,954,054. The balance of the refunded Series 1998 capital facilities general obligation bonds at December 31, 2009, is $8,730,000.
The refunding issue for governmental activities is comprised of current interest bonds, par value $26,483,111. The interest rates on the current interest bonds range from 2.50% - 5.00%. Interest payments on the current interest bonds are due on June 1 and December 1 of each year. The final maturity stated in the issue is December 1, 2029. The reacquisition price exceeded the net carrying amount of the old debt by $639,021. This amount is being netted against the new debt and amortized over the remaining life of the refunded debt, which is equal to the life of the new debt issued. This advance refunding was undertaken to reduce the combined total debt service payments over the next 11 years by $800,328 and resulted in an economic gain of $703,369. The City has pledged future nontax revenues in the City’s general fund to repay $12,190,000 in Series 1999 economic development revenue bonds. The proceeds were used for the Dayton baseball stadium project. On December 30, 2009, the City issued revenue bonds (Series 2009 baseball revenue refunding bonds) to advance refund the callable portion of the Series 1999 baseball revenue bonds. This refunded debt is considered defeased (in-substance) and accordingly, has been removed from the statement of net assets. The balance of the refunded Series 1999 baseball revenue bonds at December 31, 2009 is $7,950,000. The Series 1999 revenue bonds are payable solely from nontax revenues in the City’s general fund and are payable through 2019. The most significant amounts of nontax revenues in the City’s general fund which are pledged for these purposes are derived from charges for services, investment earnings, fines and forfeitures and license and permit fees. Annual principal and interest payments on the revenue bonds are expected to require less than 3.78 percent of general fund nontax revenues. The total principal and interest remaining to be paid on the Series 2009 baseball revenue refunding bonds is $9,246,556. Principal and interest paid for the current year on the Series 1999 baseball revenue bonds prior to the refunding was $1,124,689. There was no principal or interest paid on the Series 2009 baseball revenue refunding bonds during 2009. General fund nontax revenues for the current year were $29,728,790. The reacquisition price exceeded the net carrying amount of the old debt by $180,965. This amount is being netted against the new debt and amortized over the remaining life of the refunded debt, which is equal to the life of the new debt issued. This advance refunding was undertaken to reduce the combined total debt service payments over the next 10 years by $2,002,267 and resulted in an economic gain of $1,251,530.

CITY OF DAYTON, OHIO
NOTES TO THE BASIC FINANCIAL STATEMENTS FOR THE YEAR ENDED DECEMBER 31, 2009
F 83
NOTE 13 - LONG-TERM OBLIGATIONS - (Continued) The City has pledged future nontax revenues in the City’s general fund to repay $32,000,000 in Series 2008 economic development revenue bonds. The proceeds were used for the construction of parking facilities and a loan to the Dayton-Montgomery County Port Authority related to the construction of the parking facility. The Series 2008 revenue bonds are payable solely from nontax revenues in the general fund and are payable through 2028. The most significant amounts of nontax revenues in the City’s general fund which are pledged for these purposes are derived from charges for services, investment earnings, fines and forfeitures and license permit fees. Annual principal and interest payments on the revenues bonds are expected to require less than 6.36 percent of general fund nontax revenues. The City has designated, through authorizing legislation, nontax revenues from the loan payments made by the Port Authority and income and profit related to the parking facility to be used for the debt repayment. The total principal and interest remaining to be paid on the Series 2008 revenue bonds is $48,842,338. Interest paid for the current year was $1,372,869. General fund nontax revenues for the current year were $29,728,790. Special assessment bond issues represent assessments for sidewalk, curb and gutter reconstruction, and lighting. They are payable from tax assessments against the property owner whose benefits from the improvements exceed that of the general public. The special assessment bond issues are backed by the full faith and credit of the City. In the event that an assessed property owner fails to make payments, the City will be required to pay the related debt. These bonds will be paid from the debt service fund.
The Ohio Public Works Commission loan was issued for the East Fifth Street rehabilitation project. The loan was issued at a 3.0% interest rate and a maturity date of July 1, 2017. The loan will be paid from the capital improvement fund. Compensated absences will be paid from the fund from which the employees' salaries are paid which for the City is primarily the general fund, Street fund (a nonmajor governmental fund) and the HUD Programs fund (a nonmajor governmental fund). The judgments payable liability with be paid from the general fund. The claims payable liability will be paid from the Worker’s Compensation Internal Service fund. Capital lease obligations were paid from the nonmajor governmental funds (See Note 11). The pollution remediation obligation includes liabilities for three projects: Dayton Tech Town, NIBCO and Monument Ave. As part of the Tech Town project, the City entered into a purchase contract for 24 acres of the former General Motors Harrison Radiator Plant. The City accepted Clean Ohio grant funds obligating the City to complete remediation of approximately 20 acres of land through the Ohio Voluntary Action Program (ORC 3746). As of December 31, 2009, the City has completed $3,474,381 of the $3,878,023 remediation work required at this site. The remaining $403,642 is booked as a long-term liability on the statement of net assets. The City’s pollution remediation obligation for this project was prepared by certified professionals hired as consultants for this project. The key assumption in the liability estimate is that General Motors will complete its RCRA obligation that is monitored by the USEPA. The liability has the potential to be reduced upon approval as an urban setting designation for the groundwater by the Ohio EPA.

CITY OF DAYTON, OHIO
NOTES TO THE BASIC FINANCIAL STATEMENTS FOR THE YEAR ENDED DECEMBER 31, 2009
F 84
NOTE 13 - LONG-TERM OBLIGATIONS - (Continued) The City’s NIBCO site requires pollution remediation related to the Ohio Voluntary Action Program (ORC 3746). The City performed an environmental investigation on the site and determined that remediation obligations of $601,871 were required. As of December 31, 2009, the City has not completed any of the $601,871 remediation work required at this site. This liability is based on a Phase II environmental assessment completed in 2005 and was updated in 2009. There are no significant changes expected in this estimate. The City’s Monument Ave. Gateway Project requires pollution remediation related to the Ohio Voluntary Action Program (ORC 3746). The City performed an environmental investigation on the site and determined that remediation obligations of $173,660 were required. As of December 31, 2009, the City has not completed any of the $173,660 remediation work required at this site. This liability is based on a Phase I environmental assessment completed in 2009. There are no significant changes expected to this estimate. The Ohio Revised Code provides that the net debt of a municipal corporation, whether or not approved by the electors, shall not exceed 10.5% of the total value of all property in the municipal corporation as listed and assessed for taxation. In addition, the unvoted net debt of municipal corporations cannot exceed 5.5% of the total taxation value of property. The assessed valuation used in determining the City’s legal debt margin has been modified by House Bill 530 which became effective March 30, 2006. In accordance with House Bill 530, the assessed valuation used in calculating the City’s legal debt margin calculation excludes tangible personal property used in business, telephone or telegraph property, interexchange telecommunications company property, and personal property owned or leased by a railroad company and used in railroad operations. The statutory limitations on debt are measured by a direct ratio of net debt to tax valuation and expressed in terms of a percentage. At December 31, 2009, the City’s total debt margin was $156,419,348 and the unvoted debt margin was $67,254,756.
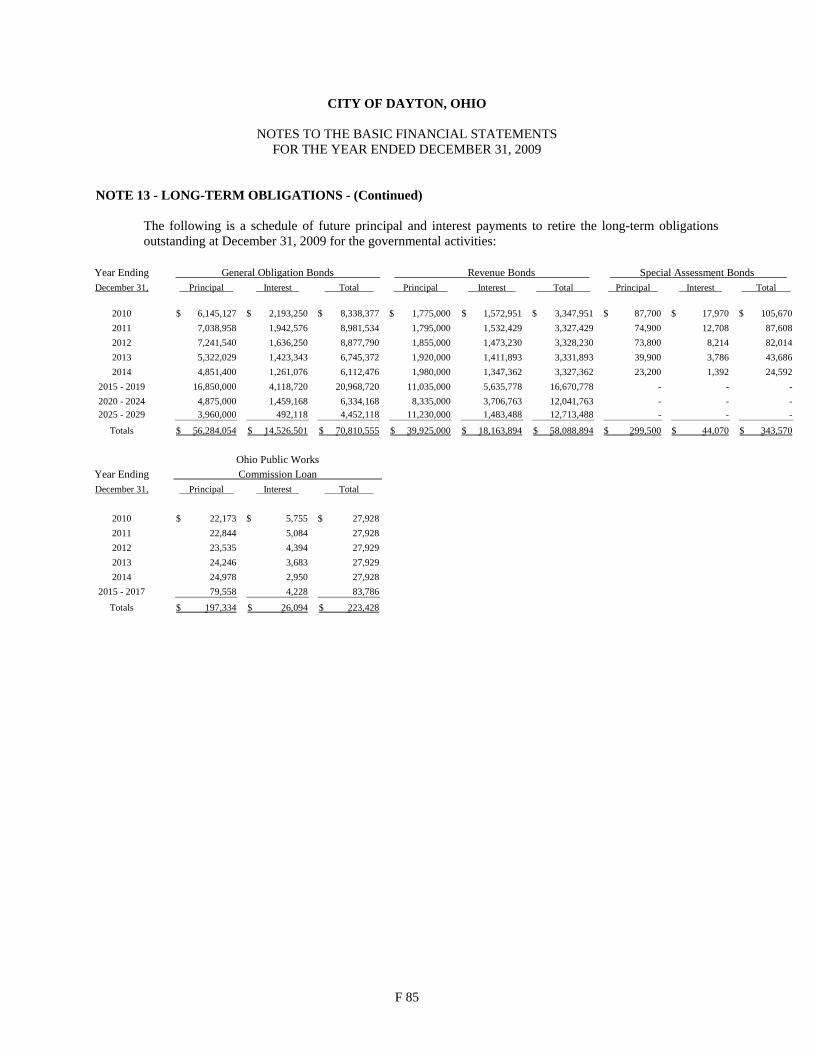
CITY OF DAYTON, OHIO
NOTES TO THE BASIC FINANCIAL STATEMENTS FOR THE YEAR ENDED DECEMBER 31, 2009
F 85
NOTE 13 - LONG-TERM OBLIGATIONS - (Continued) The following is a schedule of future principal and interest payments to retire the long-term obligations outstanding at December 31, 2009 for the governmental activities:
Year EndingDecember 31, Principal Interest Total Principal Interest Total Principal Interest Total
2010 6,145,127$ 2,193,250$ 8,338,377$ 1,775,000$ 1,572,951$ 3,347,951$ 87,700$ 17,970$ 105,670$ 2011 7,038,958 1,942,576 8,981,534 1,795,000 1,532,429 3,327,429 74,900 12,708 87,608 2012 7,241,540 1,636,250 8,877,790 1,855,000 1,473,230 3,328,230 73,800 8,214 82,014 2013 5,322,029 1,423,343 6,745,372 1,920,000 1,411,893 3,331,893 39,900 3,786 43,686 2014 4,851,400 1,261,076 6,112,476 1,980,000 1,347,362 3,327,362 23,200 1,392 24,592
2015 - 2019 16,850,000 4,118,720 20,968,720 11,035,000 5,635,778 16,670,778 - - - 2020 - 2024 4,875,000 1,459,168 6,334,168 8,335,000 3,706,763 12,041,763 - - - 2025 - 2029 3,960,000 492,118 4,452,118 11,230,000 1,483,488 12,713,488 - - -
Totals 56,284,054$ 14,526,501$ 70,810,555$ 39,925,000$ 18,163,894$ 58,088,894$ 299,500$ 44,070$ 343,570$
Year EndingDecember 31, Principal Interest Total
2010 22,173$ 5,755$ 27,928$ 2011 22,844 5,084 27,928 2012 23,535 4,394 27,929 2013 24,246 3,683 27,929 2014 24,978 2,950 27,928
2015 - 2017 79,558 4,228 83,786
Totals 197,334$ 26,094$ 223,428$
General Obligation Bonds Revenue Bonds Special Assessment Bonds
Commission Loan Ohio Public Works
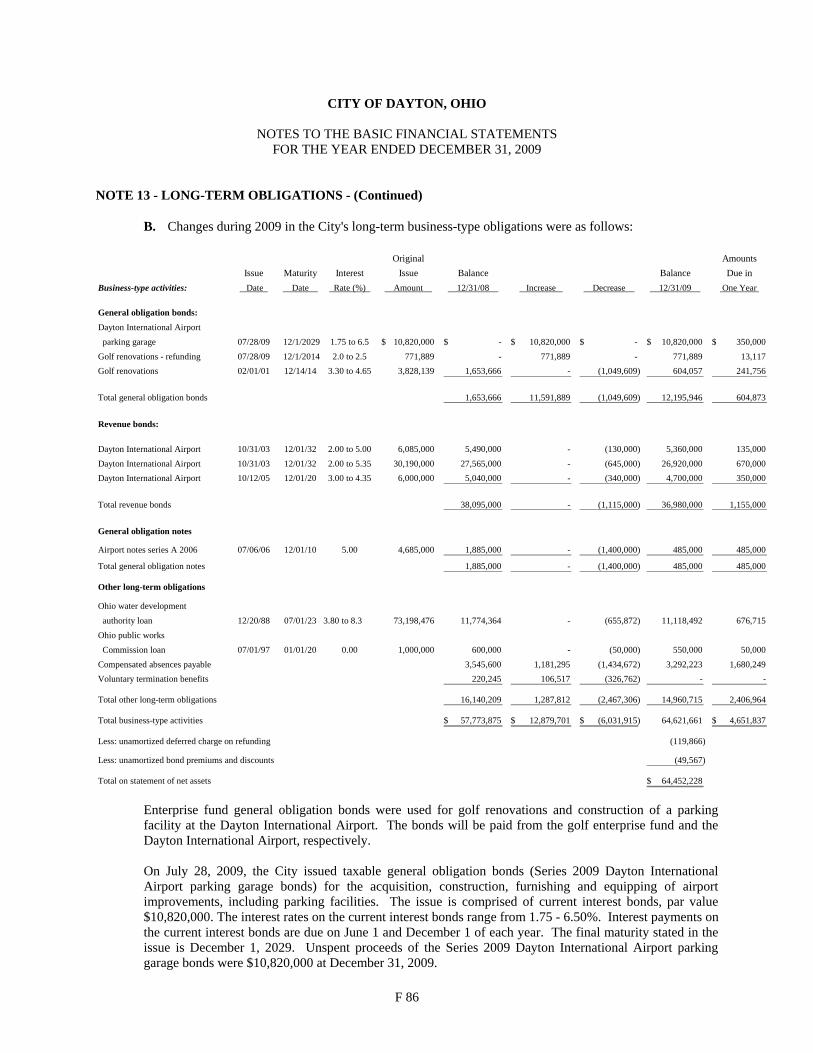
CITY OF DAYTON, OHIO
NOTES TO THE BASIC FINANCIAL STATEMENTS FOR THE YEAR ENDED DECEMBER 31, 2009
F 86
NOTE 13 - LONG-TERM OBLIGATIONS - (Continued)
B. Changes during 2009 in the City's long-term business-type obligations were as follows:
Original AmountsIssue Maturity Interest Issue Balance Balance Due in
Business-type activities: Date Date Rate (%) Amount 12/31/08 Increase Decrease 12/31/09 One Year
General obligation bonds:
Dayton International Airport parking garage 07/28/09 12/1/2029 1.75 to 6.5 10,820,000$ -$ 10,820,000$ -$ 10,820,000$ 350,000$ Golf renovations - refunding 07/28/09 12/1/2014 2.0 to 2.5 771,889 - 771,889 - 771,889 13,117 Golf renovations 02/01/01 12/14/14 3.30 to 4.65 3,828,139 1,653,666 - (1,049,609) 604,057 241,756
Total general obligation bonds 1,653,666 11,591,889 (1,049,609) 12,195,946 604,873
Revenue bonds:
Dayton International Airport 10/31/03 12/01/32 2.00 to 5.00 6,085,000 5,490,000 - (130,000) 5,360,000 135,000 Dayton International Airport 10/31/03 12/01/32 2.00 to 5.35 30,190,000 27,565,000 - (645,000) 26,920,000 670,000 Dayton International Airport 10/12/05 12/01/20 3.00 to 4.35 6,000,000 5,040,000 - (340,000) 4,700,000 350,000
Total revenue bonds 38,095,000 - (1,115,000) 36,980,000 1,155,000
General obligation notes
Airport notes series A 2006 07/06/06 12/01/10 5.00 4,685,000 1,885,000 - (1,400,000) 485,000 485,000
Total general obligation notes 1,885,000 - (1,400,000) 485,000 485,000
Other long-term obligations
Ohio water development
authority loan 12/20/88 07/01/23 3.80 to 8.3 73,198,476 11,774,364 - (655,872) 11,118,492 676,715 Ohio public works Commission loan 07/01/97 01/01/20 0.00 1,000,000 600,000 - (50,000) 550,000 50,000 Compensated absences payable 3,545,600 1,181,295 (1,434,672) 3,292,223 1,680,249 Voluntary termination benefits 220,245 106,517 (326,762) - -
Total other long-term obligations 16,140,209 1,287,812 (2,467,306) 14,960,715 2,406,964
Total business-type activities 57,773,875$ 12,879,701$ (6,031,915)$ 64,621,661 4,651,837$
Less: unamortized deferred charge on refunding (119,866)
Less: unamortized bond premiums and discounts (49,567)
Total on statement of net assets 64,452,228$
Enterprise fund general obligation bonds were used for golf renovations and construction of a parking facility at the Dayton International Airport. The bonds will be paid from the golf enterprise fund and the Dayton International Airport, respectively. On July 28, 2009, the City issued taxable general obligation bonds (Series 2009 Dayton International Airport parking garage bonds) for the acquisition, construction, furnishing and equipping of airport improvements, including parking facilities. The issue is comprised of current interest bonds, par value $10,820,000. The interest rates on the current interest bonds range from 1.75 - 6.50%. Interest payments on the current interest bonds are due on June 1 and December 1 of each year. The final maturity stated in the issue is December 1, 2029. Unspent proceeds of the Series 2009 Dayton International Airport parking garage bonds were $10,820,000 at December 31, 2009.

CITY OF DAYTON, OHIO
NOTES TO THE BASIC FINANCIAL STATEMENTS FOR THE YEAR ENDED DECEMBER 31, 2009
F 87
NOTE 13 - LONG-TERM OBLIGATIONS - (Continued) The refunding of the Series 2001 golf renovation general obligations as described in Note 13.A. for business-type activities is comprised of current interest bonds, par value $771,889. The interest rates on the current interest bonds range from 2.50% - 5.00%. Interest payments on the current interest bonds are due on June 1 and December 1 of each year. The final maturity stated in the issue is December 1, 2014.
Revenue bonds were issued for various projects at the Dayton International Airport. The revenue bonds are pledged against the revenue generated by the specific enterprise fund and will be paid from the respective enterprise fund. On October 12, 2005, the City issued $19,865,000 in revenue bonds (Series 2005 Bonds). A portion of the proceeds of the 2005 bonds will be used to pay costs of airport improvements including the acquisition, construction, furnishing and equipping of passenger boarding bridges, escalators, and stairwells in concourse and providing all necessary and related improvements. A portion of the proceeds were used to currently refund the Series 1995 bonds (principal $12,485,000) and variable interest rates. This refunded debt is considered defeased (in substance) and accordingly, has been removed from the statement of net assets.
On October 31, 2003, the City issued revenue bonds (Series 2003 Bonds). A portion of the proceeds of the 2003 bonds were issued to retire $8,000,000 in general obligation bond anticipation notes that the City issued to pay costs of airport improvements and to prepay the City’s obligations for the lease-purchase agreement entered into to finance the terminal environment restoration project. Portions of the bonds were used to improve the airport by the acquisition, construction, furnishing and equipping of parking, roadway, airfield and terminal improvements and providing all necessary and related improvements. A portion of the proceeds was used to advance refund the Series 1992 bonds (principal $8,235,000) and variable interest rates. The issuance proceeds were deposited into a special escrow trust fund, which consists of cash and direct or guaranteed non-callable government obligations. The principal of this escrow trust, when due, will be sufficient to pay on the redemption date the principal of, redemption premium and interest on the Series 1992 bonds. This refunded debt is considered defeased (in substance) and accordingly, has been removed from the statement of net assets. A portion of these bonds were defeased in 2007. The City has pledged future airport revenues, net of specified operating expenses, to repay $36,275,000 in Series 2003 and $6,000,000 in Series 2005 airport revenue bonds. The Series 2003 and 2005 airport revenue bonds are payable solely from airport net revenues and are payable through 2032. Annual principal and interest payments on the bonds are expected to require less than 98.67 percent of net revenues. The total principal and interest remaining to be paid on the Series 2003 and 2005 airport revenue bonds is $61,999,008. Principal and interest paid for the current year and total customer net revenues were $2,975,958 and $3,015,965, respectively.
The Dayton International Airport general obligation notes payable were issued on July 6, 2006 in the amounts of $4,685,000. These notes will be used for various capital improvements to the Airport.

CITY OF DAYTON, OHIO
NOTES TO THE BASIC FINANCIAL STATEMENTS FOR THE YEAR ENDED DECEMBER 31, 2009
F 88
NOTE 13 - LONG-TERM OBLIGATIONS - (Continued) The City of Dayton's Wastewater Treatment Plant capital improvement project is funded through the joint efforts of the United States Environmental Protection Agency (EPA) and the Ohio Water Development Authority (OWDA). Repayment amounts include capital expenses, administration fees, and accrued interest. The Ohio Water Development Authority Loan will be paid from the sewer enterprise fund. At December 31, 2009, the City had outstanding borrowings of $11,118,492 through OWDA. The future annual debt service principal and interest requirements for OWDA loans include only those loans that are finalized and all monies related to the projects are disbursed. As of December 31, 2009, the future annual debt service principal and interest payments for one OWDA loan was unavailable because monies related to the project are still being disbursed and the loan is not finalized.
In 1997, the City of Dayton was granted a $1,000,000 loan from the Ohio Public Works Commission. The purpose of the loan is to finance and reimburse the costs of replacing a wastewater treatment laboratory facility to meet Ohio Environmental Protection Agency and the Occupational Safety and Health Association requirements. The loan is being paid out of the sewer fund over 20 years, with semi-annual payments of $25,000. There is no interest on this loan. Compensated absences will be paid from the fund from which the employees' salaries are paid which, for the City, are primarily the Dayton International Airport fund, the Water fund and the Sewer fund.
The following is a schedule of future principal and interest payments to retire the long-term obligations outstanding at December 31, 2009 for the business-type activities. OWDA loan #3569 is currently “open” meaning that final distributions have not been made from the OWDA; therefore, future debt service requirements have not been finalized and are not presented in the amortization schedule below.
Year Ending General Obligation Bonds Revenue Bonds December 31, Principal Interest Total Principal Interest Total
2010 604,873$ 670,071$ 1,274,944$ 1,155,000$ 1,823,404$ 2,978,404$ 2011 731,042 653,344 1,384,386 1,200,000 1,780,969 2,980,969 2012 728,460 594,305 1,322,765 1,245,000 1,733,902 2,978,902 2013 567,971 576,999 1,144,970 1,290,000 1,683,228 2,973,228 2014 573,600 561,042 1,134,642 1,350,000 1,628,664 2,978,664
2015 - 2019 2,200,000 2,512,017 4,712,017 7,720,000 7,177,222 14,897,222 2020 - 2024 2,880,000 1,827,510 4,707,510 7,460,000 5,256,985 12,716,985 2025 - 2029 3,910,000 794,951 4,704,951 8,960,000 3,221,358 12,181,358 2030 - 2032 - - - 6,600,000 713,276 7,313,276
Totals 12,195,946$ 8,190,239$ 20,386,185$ 36,980,000$ 25,019,008$ 61,999,008$

CITY OF DAYTON, OHIO
NOTES TO THE BASIC FINANCIAL STATEMENTS FOR THE YEAR ENDED DECEMBER 31, 2009
F 89
NOTE 13 - LONG-TERM OBLIGATIONS - (Continued)
Year Ending OWDA Loan OPWC Loan December 31, Principal Interest Total Principal Interest Total
2010 192,509$ 137,106$ 329,615$ 50,000$ -$ 50,000$ 2011 200,188 129,427 329,615 50,000 - 50,000 2012 208,174 121,442 329,616 50,000 - 50,000 2013 216,477 113,137 329,614 50,000 - 50,000 2014 225,113 104,503 329,616 50,000 - 50,000
2015 - 2019 1,267,645 380,432 1,648,077 250,000 - 250,000 2020 - 2023 1,208,597 109,863 1,318,460 50,000 - 50,000
Totals 3,518,703$ 1,095,910$ 4,614,613$ 550,000$ -$ 550,000$
Year Ending Airport Note Series A 2006 December 31, Principal Interest Total
2010 485,000$ 24,250$ 509,250$
Totals 485,000$ 24,250$ 509,250$
NOTE 14 - RISK MANAGEMENT
A. Property and Liability
The City does not have municipal liability insurance. The City is self-insured for the purpose of handling, processing, and paying general municipality liability insurance claims in lieu of purchasing general municipality liability insurance. All claims activity is accounted for in the general fund. The City is fully insured through premium-based insurance policies for all other types of insurance. In 2009, the City contracted with various insurance companies to provide the following coverages:
Type of Coverage Coverage
Primary and Excess Airport Liability $100,000,000 Excess of Airport Policy 50,000,000 Property (including comprehensive/catastrophic fleet) 867,258,222 Vehicles 63,354,813
General Liability (North West Railway) 10,000,000 Commercial Liability (Convention Center) 2,000,000 Tenant Liability (Convention Center) 1,000,000 Errors and Omissions (Ambulance Attendants) 500,000
Errors and Omissions (Municipal Court) 500,000 Garagekeepers: Liability 2,000,000 Garagekeepers: Test Driving 1,000,000 Inland Marine 365,975 General Liability (Zion Cultural Center) 2,000,000 Excess Umbrella Coverage (Zion Cultural Center) 5,000,000 General Liability (Community Service Program for Dayton Municipal Court) 100,000 Travel (AD&D) 1,000,000 Executive Management Liability Policy 2,000,000 Public Officials Bond 3,000,000

CITY OF DAYTON, OHIO
NOTES TO THE BASIC FINANCIAL STATEMENTS FOR THE YEAR ENDED DECEMBER 31, 2009
F 90
NOTE 14 - RISK MANAGEMENT - (Continued) Settled claims have not exceeded this commercial coverage in any of the past three years. There have been no significant reductions in insurance coverage from last year. The City’s policy for reporting a claims liability is based on the requirements GASB Statement No. 10, “Accounting and Financial Reporting for Risk Financing and Related Insurance Issues”, as amended by GASB Statement No. 30, “Risk Financing Omnibus”, which requires that a liability for unpaid claims costs, including estimates of costs relating to incurred, but not reported claims, be accrued at the estimated ultimate cost of settling the claims. It is the opinion of the City’s legal counsel that, as of December 31, 2009, there were $3,046 in outstanding claims pending that are reported as a component of claimants payable in the general fund. Claims activity for 2009 and 2008 are as follows:
Balance at Current Year Claim Balance at Year Beginning of Year Claims Payments End of Year
2009 23,768$ 469,095$ (489,817)$ 3,046$ 2008 33,689 105,423 (115,344) 23,768
B. Workers' Compensation
The City has elected to take advantage of the workers' compensation plan being offered by the State of Ohio. This plan, called retrospective rating, allows the City to pay a fraction of the premium it would pay as an experience-rated risk.
Retrospective rating constitutes a step closer to self-insurance. In the retrospective rating plan, the City agrees to assume a portion of the risk in return for a possible reduction in premiums. The greater the percentage of the risk the City assumes, the greater the potential reduction in the premium. If the City's loss experience is better than predicted by the experience-rating system, its premium obligation will be less than what it would have paid under experience rating. If its experience is worse than predicted, its premium obligation will be more than it would have been assessed under experience rating, limited to a maximum premium. The City has assumed the risk for individual claims up to a maximum of $300,000.
The City has agreed to pay all claims up to a maximum of 200% of what the City would have paid had the City remained an experience-rated risk. Claims exceeding these limits will be paid by the State. Each year, the City pays the State a "minimum premium" for retaining the risk of having to pay claims which exceeds the City's maximum claim limits. Ten years after each year the City elected the retrospective plan for workers' compensation, the City settles up for the reserve on any claims that are still open. The City has established a workers' compensation internal service fund to account for and finance its uninsured risks of loss in this program. The claims liability of $6,290,048 reported at December 31, 2009, as estimated by the third party administrator, is based on the requirements of GASB Statement No. 10, “Accounting and Financial Reporting for Risk Financing and Related Insurance Issues”, as amended by GASB Statement No. 30, “Risk Financing Omnibus”, which requires that a liability for unpaid claims costs, including estimates of costs relating to incurred, but not reported claims, be accrued at the estimated ultimate cost of settling the claims. Of the $6,290,048 claims liability, $77,924 of the liability is due within one year and is reported as a current liability in the statement of net assets for the proprietary funds. The remaining portion is a noncurrent liability of $6,212,124. The estimate was not affected by non-incremental claim adjustment expenses and does not include other allocated or unallocated claim adjustment expenses.

CITY OF DAYTON, OHIO
NOTES TO THE BASIC FINANCIAL STATEMENTS FOR THE YEAR ENDED DECEMBER 31, 2009
F 91
NOTE 14 - RISK MANAGEMENT - (Continued) Changes in the funds' claims liability amount in 2009 and 2008 were:
Balance at Current Year Claim Balance at
Year Beginning of Year Claims Payments End of Year
2009 5,267,199$ 2,122,664$ (1,099,815)$ 6,290,048$ 2008 9,696,742 1,445,574 (5,875,117) 5,267,199
NOTE 15 - OTHER EMPLOYEE BENEFITS
A. Compensated Absences
The criteria for determining vacation, compensatory time and sick leave components are derived from negotiated agreements and State laws. Vacation time is accrued at the rate of one day per month, plus one to nine additional days per year for all employees except police, who receive up to 12 additional days per year, depending upon the length of service. The maximum accrual which can be carried forward into January is thirty days. Accumulated unused vacation time is paid to employees upon termination or retirement. Compensatory time off in lieu of overtime pay is an option given to uniformed Police under union contract. It is given on the basis of time and one-half for actual hours worked. Police officers, sergeants, and lieutenants may accumulate up to 136 hours. Currently, overtime pay is paid as overtime hours worked by those uniformed employees who have already accumulated the maximum hours allowed.
All uniformed employees of the Fire Department also have the option to choose compensatory time in lieu of overtime pay, and they may accumulate up to one hundred twenty hours of compensatory time. Employees who have accumulated the maximum hours are paid overtime as overtime hours are worked. Sick leave is accrued at the rate of one and one-fourth days per month. The maximum sick leave accrual which can be carried forward into January is 125 days. Accrued sick leave in excess of 125 days must be converted to vacation days in January at the rate of two sick leave days for one vacation day. Upon retirement, payment is made for one-half of the total sick leave accumulation, up to a maximum of 140 days.
B. Voluntary Termination Benefits
i. In 2009, the City offered a voluntary separation plan (VSP) to reduce its workforce. The VSP was available to all full-time and permanent part-time employees, excluding elected officials, retired/rehired employees, appointed Board Members and employees who had not completed their initial probation period by September 8, 2009 and where the employees are also contributing members to the Ohio Public Employees Retirement System. This is a one-time opportunity and employees were required to submit a VSP application and resignation form by September 29, 2009. Employees participating in the VSP will receive a lump sum payment equal to 25% of the first $50,000 of their base salary and an additional 5% of the portion of the base salary that exceeds $50,000. Forty-one employees took advantage of the VSP. The City made $461,485 in VSP payments in 2009. All VSP payments were made by December 31, 2009. No future obligation exists related to the VSP.

CITY OF DAYTON, OHIO
NOTES TO THE BASIC FINANCIAL STATEMENTS FOR THE YEAR ENDED DECEMBER 31, 2009
F 92
NOTE 15 - OTHER EMPLOYEE BENEFITS - (Continued) ii. In 2008, the City offered a voluntary separation plan (VSP) to reduce its workforce. The VSP was
available to all full-time and permanent part-time employees, excluding elected officials, retired/rehired employees, appointed Board Members and employees who had not completed their initial probation period by November 1, 2008 and where the employees are also contributing members to the Ohio Public Employees Retirement System. This is a one-time opportunity and employees were required to submit a VSP application and resignation form by October 31, 2008. Employees participating in the VSP will receive a lump sum payment equal to 25% of the first $50,000 of their base salary and an additional 5% of the portion of the base salary that exceeds $50,000. Eighty-eight employees took advantage of the VSP. The City made $246,695 in VSP payments in 2008 and $733,103 in VSP payments in 2009.
C. Insurance Benefits
Medical insurance is provided to employees through Anthem Blue Cross/Blue Shield Health Maintenance insurance plans. Dental insurance is provided to employees through MetLife and Ohio AFSCME Care. Group Life and Accidental Death and Dismemberment insurance is provided to employees through Aetna Life Insurance. Life insurance coverage amounts range from $12,000 to $300,000 according to employee position.
D. Deferred Compensation Plans
City employees and elected officials participate in either the International City Managers Association (ICMA) Deferred Compensation Plan, or the Ohio Public Employees Deferred Compensation Plan. These plans are created in accordance with Internal Revenue Code Section 457. Participation is on a voluntary payroll deduction basis. The plans permit deferral of compensation until future years. According to the plans, the deferred compensation is not available until termination, retirement, death or an unforeseeable emergency.
NOTE 16 - PENSION PLANS
A. Ohio Public Employees Retirement System
Plan Description - The City participates in the Ohio Public Employees Retirement System (OPERS). OPERS administers three separate pension plans. The Traditional Pension Plan is a cost-sharing, multiple-employer defined benefit pension plan. The Member-Directed Plan is a defined contribution plan in which the member invests both member and employer contributions (employer contributions vest over five years at 20% per year). Under the Member-Directed Plan, members accumulate retirement assets equal to the value of the member and vested employer contributions plus any investment earnings. The Combined Plan is a cost-sharing, multiple-employer defined benefit pension plan that has elements of both a defined benefit and a defined contribution plan. Under the Combined Plan, employer contributions are invested by the retirement system to provide a formula retirement benefit similar to the Traditional Pension Plan benefit. Member contributions, whose investment is self-directed by the member, accumulate retirement assets in a manner similar to the Member-Directed Plan. While members in the State and local divisions may participate in all three plans, law enforcement (generally sheriffs, deputy sheriffs and township police) and public safety divisions exist only within the traditional pension plan.

CITY OF DAYTON, OHIO
NOTES TO THE BASIC FINANCIAL STATEMENTS FOR THE YEAR ENDED DECEMBER 31, 2009
F 93
NOTE 16 - PENSION PLANS - (Continued) OPERS provides retirement, disability, survivor and death benefits and annual cost of living adjustments to members of the Traditional Pension and the Combined Plans. Members of the Member-Directed Plan do not qualify for ancillary benefits. Authority to establish and amend benefits is provided by Chapter 145 of the Ohio Revised Code. OPERS issues a stand-alone financial report that may be obtained by writing to OPERS, Attention: Finance Director, 277 E. Town St., Columbus, OH 43215-4642 or by calling (614) 222-5601 or (800) 222-7377. Funding Policy - The Ohio Revised Code provides statutory authority for member and employer contributions. For 2009, member and contribution rates were consistent across all three plans. While members in the State and local divisions may participate in all three plans, law enforcement and public safety divisions exist only within the Traditional Plan. The 2009 member contribution rates were 10.00% for members in State and local classifications. Public safety and law enforcement members contributed 10.10%. The City’s contribution rate for 2009 was 14.00%, except for those plan members in law enforcement or public safety, for whom the City’s contribution was 17.63% of covered payroll. The City’s contribution rate for pension benefits for 2009 was 7.00% from January 1 through March 31, 2009 and 8.50% from April 1 through December 31, 2009, except for those plan members in law enforcement and public safety. For those classifications, pension contributions were 10.63% from January 1 through March 31, 2009 and 12.13% from April 1 through December 31, 2009. The City’s required contributions for pension obligations to the Traditional Pension and Combined Plans for the years ended December 31, 2009, 2008 and 2007 were $6,356,423, $5,847,515 and $6,917,267 respectively; 92.52% has been contributed for 2009 and 100% has been contributed for 2008 and 2007.
B. Ohio Police and Fire Pension Fund
Plan Description - The City contributes to the Ohio Police and Fire Pension Fund (OP&F), a cost-sharing multiple-employer defined benefit pension plan. OP&F provides retirement and disability benefits, annual cost-of-living adjustments, and death benefits to plan members and beneficiaries. Benefit provisions are established by the Ohio State Legislature and are codified in Chapter 742 of the Ohio Revised Code. OP&F issues a publicly available financial report that includes financial statements and required supplementary information for the plan. That report may be obtained by writing to the OP&F, 140 East Town Street, Columbus, Ohio 43215-5164. Funding Policy - Plan members are required to contribute 10.0% of their annual covered salary, while the City is required to contribute 19.50% and 24.00% for police officers and firefighters, respectively. Contribution rates are established by State statute. For 2009, the portion of the City’s contributions to fund pension obligations was 12.75% for police officers and 17.25% for firefighters. The City’s required contributions for pension obligations to OP&F for police officers and firefighters were $3,524,787 and $3,930,474 for the year ended December 31, 2009, $3,547,664 and $3,953,996 for the year ended December 31, 2008 and $3,366,500 and $4,032,190 for the year ended December 31, 2007. The full amount has been contributed for 2008 and 2007. 77.10% has been contributed for police and 75.26% has been contributed for firefighters for 2009.

CITY OF DAYTON, OHIO
NOTES TO THE BASIC FINANCIAL STATEMENTS FOR THE YEAR ENDED DECEMBER 31, 2009
F 94
NOTE 17 - POSTRETIREMENT BENEFIT PLANS
A. Ohio Public Employees Retirement System Plan Description - OPERS maintains a cost-sharing multiple employer defined benefit post-employment healthcare plan, which includes a medical plan, prescription drug program and Medicare Part B premium reimbursement, to qualifying members of both the Traditional Pension and the Combined Plans. Members of the Member-Directed Plan do not qualify for ancillary benefits, including post-employment health care coverage. To qualify for post-employment health care coverage, age-and-service retirees under the Traditional Pension and Combined Plans must have ten years or more of qualifying Ohio service credit. The Ohio Revised Code permits, but not does mandate, OPERS to provide OPEB benefits to its eligible members and beneficiaries. Authority to establish and amend benefits is provided in Chapter 145 of the Ohio Revised Code. Disclosures for the healthcare plan are presented separately in the OPERS financial report which may be obtained by writing to OPERS, Attention: Finance Director, 277 E. Town St., Columbus, OH 43215-4642 or by calling (614) 222-5601 or (800) 222-7377. Funding Policy - The post-employment healthcare plan was established under, and is administrated in accordance with, Internal Revenue Code Section 401(h). State statute requires that public employers fund post-employment healthcare through contributions to OPERS. A portion of each employer’s contribution to the Traditional or Combined Plans is set aside for the funding of post-employment health care. Employer contribution rates are expressed as a percentage of the covered payroll of active employees. In 2009, local government employers contributed 14.00% of covered payroll (17.63% for public safety and law enforcement). Each year the OPERS Retirement Board determines the portion of the employer contribution rate that will be set aside for the funding of the postemployment health care benefits. The portion of employer contributions allocated to fund post-employment healthcare for 2009 was 7.00% from January 1 through March 31, 2009 and 5.50% from April 1 through December 31, 2009. The OPERS Retirement Board is also authorized to establish rules for the payment of a portion of the health care benefits provided, by the retiree or their surviving beneficiaries. Payment amounts vary depending on the number of covered dependents and the coverage selected. Active members do not make contributions to the post-employment healthcare plan. The City’s contributions allocated to fund post-employment health care benefits for the years ended December 31, 2009, 2008 and 2007 were $4,596,951, $5,847,515 and $4,595,960, respectively; 92.52% has been contributed for 2009 and 100% has been contributed for 2008 and 2007. The Health Care Preservation Plan (HCPP) adopted by the OPERS Board of Trustees on September 9, 2004, was effective January 1, 2007. Member and employer contribution rates increased as of January 1, 2006, January 1, 2007 and January 1, 2008, which allowed additional funds to be allocated to the health care plan.
CITY OF DAYTON, OHIO
NOTES TO THE BASIC FINANCIAL STATEMENTS FOR THE YEAR ENDED DECEMBER 31, 2009
F 95
NOTE 17 - POSTRETIREMENT BENEFIT PLANS - (Continued)
B. Ohio Police and Fire Pension Fund
Plan Description - The City contributes to the OP&F Pension Fund sponsored health care program, a cost-sharing multiple-employer defined postemployment health care plan administered by OP&F. OP&F provides healthcare benefits including coverage for medical, prescription drugs, dental, vision, Medicare Part B Premium and long term care to retirees, qualifying benefit recipients and their eligible dependents. OP&F provides access to post-employment health care coverage to any person who receives or is eligible to receive a monthly service, disability or survivor benefit check or is a spouse or eligible dependent child of such person. The Ohio Revised Code allows, but does not mandate OP&F to provide OPEB benefits. Authority for the OP&F Board of Trustees to provide health care coverage to eligible participants and to establish and amend benefits is codified in Chapter 742 of the Ohio Revised Code. OP&F issues a publicly available financial report that includes financial statements and required supplementary information for the plan. That report may be obtained by writing to the OP&F, 140 East Town Street, Columbus, Ohio 43215-5164. Funding Policy - The Ohio Revised Code provides for contribution requirements of the participating employers and of plan members to the OP&F (defined benefit pension plan). Participating employers are required to contribute to the pension plan at rates expressed as percentages of the payroll of active pension plan members, currently, 19.50% and 24.00% of covered payroll for police and fire employers, respectively. The Ohio Revised Code states that the employer contribution may not exceed 19.50% of covered payroll for police employer units and 24.00% of covered payroll for fire employer units. Active members do not make contributions to the OPEB Plan. OP&F maintains funds for health care in two separate accounts. One for health care benefits under an IRS Code Section 115 trust and one for Medicare Part B reimbursements administrated as an Internal Revenue Code Section 401(h) account, both of which are within the defined benefit pension plan, under the authority granted by the Ohio Revised Code to the OP&F Board of Trustees. The Board of Trustees is authorized to allocate a portion of the total employer contributions made into the pension plan into the Section 115 trust and the Section 401(h) account as the employer contribution for retiree health care benefits. For the year ended December 31, 2009, the employer contribution allocated to the health care plan was 6.75% of covered payroll. The amount of employer contributions allocated to the health care plan each year is subject to the Trustees’ primary responsibility to ensure that the pension benefits are adequately funded and is limited by the provisions of Sections 115 and 401(h). The OP&F Board of Trustees also is authorized to establish requirements for contributions to the health care plan by retirees and their eligible dependents, or their surviving beneficiaries. Payment amounts vary depending on the number of covered dependents and the coverage selected.

CITY OF DAYTON, OHIO
NOTES TO THE BASIC FINANCIAL STATEMENTS FOR THE YEAR ENDED DECEMBER 31, 2009
F 96
NOTE 17 - POSTRETIREMENT BENEFIT PLANS - (Continued) The City’s contributions to OP&F which were allocated to fund post-employment healthcare benefits for police officers and firefighters were $1,866,064 and $1,538,011 for the year ended December 31, 2009, $1,878,175 and $1,547,216 for the year ended December 31, 2008 and $1,782,265 and $1,577,813 for the year ended December 31, 2007. The full amount has been contributed for 2008 and 2007. 77.10% has been contributed for police and 75.26% has been contributed for firefighters for 2009.
NOTE 18 - BUDGETARY BASIS OF ACCOUNTING
While the City is reporting financial position, results of operations and changes in fund balance on the basis of generally accepted accounting principles (GAAP), the budgetary basis as provided by law is based upon accounting for certain transactions on a modified accrual basis with exceptions. The statement of revenues, expenditures and changes in fund balances - budget and actual (non-GAAP budgetary basis) presented for the general fund is presented on the budgetary basis to provide a meaningful comparison of actual results with the budget. The adjustments necessary to convert the results of operations of the general fund for the year ended December 31, 2009, on the GAAP basis to the budget basis are as follows:
Net Change in Fund Balance
General
Budget basis (5,752,120)$ Net adjustment for revenues (4,044,860) Net adjustment for expenditures (2,397,250) Adjustment for encumbrances 4,438,340
GAAP basis (7,755,890)$
NOTE 19 - CONDUIT DEBT OBLIGATIONS
The City has the following conduit debt obligations at December 31, 2009:
Original Amount Issue Amount Outstanding
Ohio Special Facilities Revenue - 1999 7,015,000$ 5,760,000$ These bonds do not constitute a general obligation, debt or bonded indebtedness of the City; neither is the
full faith and credit or taxing power of the City pledged to make repayment, and therefore they have been excluded entirely from the City's debt presentation. There has not been and is not any condition of default under the bond or the related financing documents.

CITY OF DAYTON, OHIO
NOTES TO THE BASIC FINANCIAL STATEMENTS FOR THE YEAR ENDED DECEMBER 31, 2009
F 97
NOTE 20 - DISCRETELY PRESENTED COMPONENT UNIT
A. Basis of Accounting
CityWide prepares its financial statements in accordance with Governmental Accounting Standards Board (GASB) Statement No. 34, “Basic Financial Statement and Management’s Discussion and Analysis”. CityWide reports as a business-type activity, as defined by GASB Statement No. 34. Business-type activities are those that are financed in whole or by part by fees charged to external parties for goods or services. The financial statements have been prepared on an accrual basis. All Financial Accounting Standards Board (FASB) Statements and Interpretations issued after November 30, 1989 have been applied, except for those that conflict with GASB pronouncements, based upon the provisions of GASB Statement No. 20, as amended by GASB Statement No. 34.
B. Deposits and Investments
The following information classifies deposits and investments by categories of risk.
Deposits:
The carrying amount of CityWide Development Corporation deposits was $852,599 and the bank balance was $1,267,451. Of the bank balance, $1,170,157 was covered by federal depository insurance and $97,294 was uncollateralized and uninsured. Investments are recorded at fair value, which approximates cost due to the short-term nature of the investments held.
2009 2008
CDs held to maturity 275,000$ 825,000$ Money markets 78,483 78,106
Total 353,483$ 903,106$
A reconciliation between the classifications of “cash and cash equivalents” on the statement of net assets and the classifications of “deposits” and “investments” presented above per GASB Statement No. 3, as amended by GASB Statement No. 40, is as follows:
2009 2008
Cash and cash equivalents 188,983$ 370,578$ Restricted cash and cash equivalents 742,099 586,256 Investments 275,000 825,000 Total per combined statement of net assets 1,206,082$ 1,781,834$
Deposits 852,599$ 878,728$ Investments 353,483 903,106 Total per GASB Statement No. 3 1,206,082$ 1,781,834$

CITY OF DAYTON, OHIO
NOTES TO THE BASIC FINANCIAL STATEMENTS FOR THE YEAR ENDED DECEMBER 31, 2009
F 98
NOTE 20 - DISCRETELY PRESENTED COMPONENT UNIT - (Continued)
C. Notes Payable Advance from Primary Government
Notes payable/advance from primary government at December 31, 2009, consisted of the following:
Note Payable to Amount
Noninterest-bearing Note for Landing Project City of Dayton 5,433,600$ Noninterest-bearing Note for Wellfield Project City of Dayton 1,777,778 Note for Renovation of Western Manor City of Dayton and the Dayton
Montgomery County Housing Authority 86,459
Note for redevelopment of Hawthorn School Building City of Dayton 681,584 Note for Webster Street Project City of Dayton 200,000 Note for development of West 3rd Street City of Dayton 4,425,000 Note for Excelsior Project City of Dayton 250,000 Note for Phoenix Redevelopment Areas City of Dayton 2,117,664
Total advance from primary government 14,972,085
Note for Housing Loans Third-Party Insurance Company 424,917 Other Notes Payable 118,753
Total Notes Payable 543,670
Total Advance from primary government/notes payable 15,515,755$ The amounts payable to the City are shown on the Statement of Net Assets as "Advance from Primary Government".
D. Bonds Payable
During 1996, Citywide issued $2,560,000 County of Montgomery Ohio, Adjustable Rate Industrial Development Revenue Bonds, Series 1996. Also during 1996, Citywide issued $2,420,000 in Montgomery County Series, 1996A Industrial Development Revenue Bonds. The Series 1996A Indenture refunded a Trust Indenture dated as of December 1, 1988. Proceeds of the bonds were used to construct a building and an addition to an existing building to be rented to Advanced Assembly Automation, Inc. Principal maturities due under these agreements are as follows:
Year Ending
December 31, Amount
2010 375,000$ 2011 405,000 2012 430,000 2013 460,000
Total 1,670,000$

CITY OF DAYTON, OHIO
NOTES TO THE BASIC FINANCIAL STATEMENTS FOR THE YEAR ENDED DECEMBER 31, 2009
F 99
NOTE 20 - DISCRETELY PRESENTED COMPONENT UNIT - (Continued)
E. Loans Payable
CityWide has a real estate loan with a financial institution with variable interest rates equal to the prime rate. This loan is collateralized by property and the personal guarantees of two Citywide executives and originally matured on April 1, 2009. The loan was modified during 2009, extending the maturity date one year. The balance of the loan at December 31, 2009 is $937,888. During 2005, CityWide borrowed $100,000 for a construction loan with another company. This loan has a stated interest of 2.0%, payable upon maturity of the loan on May 25, 2010. During 2009, Citywide settled a lead lawsuit in the amount of $50,000. This loan has a stated interest rate of 6.00%, payable upon maturity of the loan on December 23, 2014. The debt service requirements to maturity are as follows:
Year EndingDecember 31, Amount
2010 1,037,888$ 2014 50,000
Total 1,087,888$
F. Operating Lease During 2006, CityWide began leasing a building from an unrelated party. The lease is for a five year, six month term expiring March, 2012. CityWide has the option to renew the lease for three successive five year terms. Monthly lease payments are $6,792 for the first 32 months, $10,187 for the next 12 months and $11,885 for the final 22 months of the lease. Rent expense associated with this lease was $84,894 for 2009. CityWide is responsible for property taxes and utilities as described in the lease agreement. Future minimum lease payments due over the subsequent five years are as follows:
Year Ending
December 31, Amount
2010 134,132$ 2011 142,622 2012 35,655
Total 312,409$
In 2006, CityWide entered into agreements to sublease a portion of the space to two unaffiliated organizations. Rental payments for the first space commenced on April 1, 2007 and rental payments for the second space commenced on June 1, 2008, The above lease expense will be offset by payments due under the subleases. Rents received from the subleases in excess of the above lease expense will be applied to outstanding loan interest and principal balances due by the lessor to CityWide.

CITY OF DAYTON, OHIO
NOTES TO THE BASIC FINANCIAL STATEMENTS FOR THE YEAR ENDED DECEMBER 31, 2009
F 100
NOTE 20 - DISCRETELY PRESENTED COMPONENT UNIT - (Continued) Future minimum lease payments to be received from non-cancellable subleases are as follows:
Year EndingDecember 31, Amount
2010 235,771$ 2011 218,608 2012 93,268
Total 547,647$
NOTE 21 - CONTINGENCIES
A. Litigation
The City is party to legal proceedings. The City is of the opinion that ultimate disposition of claims will not have a material effect, if any, on the financial condition of the City.
B. Grants
For the period January 1, 2009, to December 31, 2009, the City received federal and State grants for specific purposes that are subject to review and audit by grantor agencies or their designee. Such audits could lead to a request for reimbursement to the grantor agency for expenditures disallowed under the terms of the grant. Based on prior experience, the City believes such disallowance, if any, would be immaterial.
NOTE 22 – SUBSEQUENT EVENTS
On January 6, 2010, the City loaned CityWide $6,335,904 to assist in the construction of a new recreation complex (“RecPlex”). Upon completion, the City will lease RecPlex from CityWide for a 30 year term through 2039. Under the lease terms, the City will provide maintenance and operations for the RecPlex.
On June 28, 2010, the City (the lender) entered into a $7,375,620 leveraged loan agreement with Dayton Techtown Investment Fund, LLC (the borrower). A Forbearance Agreement was entered into concurrently between the City, Dayton Techtown Investment Fund, LLC and PNC New Markets Investment Partners, LLC. The proceeds of the loan will be used by the borrower to make one or more loans or equity investments in Qualified Active Low-Income Community Businesses. The loan is at an interest rate of 2% with annual payments through 2040.

The Lamp is the symbol of Dayton’s Cultural Activities.
Dayton is host to the Dayton Blues Festival, Dayton Reggae Festival, Women In Jazz Festival and many other Culture Activities. Dayton is a great city to do business, work, live and play.
CO
MB
ININ
G S
TAT
EM
EN
TS
AN
D S
CH
ED
ULE
S

THIS PAGE IS INTENTIONALLY LEFT BLANK

COMBINING STATEMENTSAND INDIVIDUAL FUND SCHEDULES
F 101

THIS PAGE IS INTENTIONALLY LEFT BLANK
F 102

The City reports only one permanent fund to account for the above activity. No combining schedules are required.
Nonmajor Permanent Fund
Permanent funds are used to account for resources that are legally restricted to the extent that earnings, and not principal, maybe used for purposes that support City programs. Included in the permanent fund is the Schantz Waldruhe Park Trust whichaccounts for interest earned on Dayton Power & Light stock that is used for the improvement, care and maintenance ofWaldruhe Park and the Forrest B. Lucas Foundation which accounts for interest earned on a contribution made by Forrest B.Lucas that is to be used for fire department training purposes.
To account for miscellaneous grant projects. These projects include food service for children at child care and recreationcenters, additional police patrol in high density traffic areas, juvenile court mediation services, and drug rehabilitationprograms. Funding sources include the United States Departments of Justice, Housing and Urban Development, Agriculture,Education, Interior and Transportation and the Ohio Departments of Education, Development, Highway Safety, and NaturalResources.
To account for various program funds administered by the Department of Housing and Urban Development. Such monies areappropriated on a project level with specific identification of each project being budgeted. Budget basis financial statementsfor these funds are not, therefore, presented in this report because such statements would not be meaningful. The first threeprograms listed below are entitlement grants. Funds are granted annually using a statutory formula.
Miscellaneous Grants
To account for lighting the freeways through Dayton. Funds are provided by shared tax revenues and registration fees fromthe State of Ohio and Montgomery County, respectively.
Emergency Shelter Grant Program (EMRG) was established in 1987 to provide for the creation and operations ofemergency shelters for the homeless.
HOME Program was established in 1990 to expand the supply of decent and affordable housing for low incomefamilies.
Urban Development Action Grants (UDAG) are granted on a project basis. The City has used these funds forprojects such as the renovation of the Arcade and The Landing rental housing downtown.
The Community Development Block Grant Program (CDBG) was established in 1974 to assist in the developmentof viable urban communities, to conserve and renew older urban areas, to improve the living environment of lowand moderate income families, and to develop opportunities for economic growth.
To account for monies restricted by City Ordinance to finance various special projects undertaken by the City. Other Special Revenue (formerly called Other Special Projects)
COMBINING STATEMENTS - NONMAJOR GOVERNMENTAL FUNDS
CITY OF DAYTON, OHIO
To account for monies for all street and road repairs and general upkeep to ensure safe, smooth transportation for all users ofDayton roadways. Funds are provided by shared tax revenues and registration fees from the State of Ohio and MontgomeryCounty, respectively.
Street
The special revenue funds are used to account for the proceeds of specific revenue sources (other than major capital projects)that are legally restricted to expenditures for specific purposes. The following are the nonmajor special revenue funds whichthe City of Dayton operates:
Nonmajor Special Revenue Funds
HUD Programs
Highway Maintenance
F 103

Variance withFinal Budget
Positive Original Final Actual (Negative)
Revenues:Municipal income taxes . . . . . . . . . . . . . . 105,417,700$ 101,368,300$ 100,430,248$ (938,052)$ Property and other local taxes . . . . . . . . . . . . 10,145,900 9,896,200 9,883,262 (12,938) State shared taxes . . . . . . . . . . . . . . . . . 15,678,500 13,409,300 13,545,039 135,739 Charges for services . . . . . . . . . . . . . . . . 22,824,800 23,249,500 23,475,636 226,136 Licenses and permits. . . . . . . . . . . . . . . . 1,410,700 1,683,000 1,585,081 (97,919) Fines and forfeitures. . . . . . . . . . . . . . . . 1,768,000 1,551,700 1,663,326 111,626 Intergovernmental. . . . . . . . . . . . . . . . . . 1,345,300 1,132,800 1,132,821 21 Special assessments . . . . . . . . . . . . . . . . 200,000 158,800 189,434 30,634 Investment income . . . . . . . . . . . . . . . . 4,058,300 2,202,500 2,190,940 (11,560) Other . . . . . . . . . . . . . . . . . . . . . . . 2,769,100 2,204,200 2,611,433 407,233
Total revenues. . . . . . . . . . . . . . . . . . . . . . 165,618,300 156,856,300 156,707,220 (149,080) Expenditures:General operating:
Clerk of commission . . . . . . . . . . . . . . . . 1,247,100 1,090,200 968,306 121,894 Civil service board . . . . . . . . . . . . . . . . . 1,189,200 1,143,400 1,062,060 81,340 Human relations council . . . . . . . . . . . . . . 800,200 800,200 742,971 57,229 City manager's office . . . . . . . . . . . . . . . . 1,424,300 1,374,300 1,322,092 52,208 Department of public affairs. . . . . . . . . . . . . 820,900 806,900 761,040 45,860 Department of planning & community development. . . 2,879,600 2,660,600 2,594,382 66,218 Department of building services . . . . . . . . . . 2,905,600 2,616,900 2,378,903 237,997 Clerk of courts . . . . . . . . . . . . . . . . . . . 3,650,300 3,695,300 3,552,862 142,438 Municipal court. . . . . . . . . . . . . . . . . . . 4,060,100 4,060,100 3,612,104 447,996 Office of economic development. . . . . . . . . . 1,465,600 1,750,600 1,547,645 202,955 Department of management and budget . . . . . . . 790,500 698,000 544,353 153,647 Department of water . . . . . . . . . . . . . . . . 95,300 95,300 81,879 13,421 Department of law . . . . . . . . . . . . . . . . . 2,365,900 2,365,900 2,063,705 302,195 Department of finance . . . . . . . . . . . . . . . 3,937,400 3,570,500 3,330,293 240,207 Department of human resources . . . . . . . . . . . 1,003,500 1,133,500 1,103,922 29,578 Department of central services . . . . . . . . . . . . 14,978,000 15,155,000 14,674,818 480,182 Department of police. . . . . . . . . . . . . . . . 50,583,500 50,089,700 46,358,904 3,730,796 Department of fire . . . . . . . . . . . . . . . . . 37,119,100 37,826,600 37,416,978 409,622 Department of public works . . . . . . . . . . . . 19,319,500 19,545,800 18,982,206 563,594 Department of parks, recreation and culture. . . . . 3,902,000 4,116,000 4,030,315 85,685 Non-departmental . . . . . . . . . . . . . . . . . 1,790,500 1,860,700 963,811 896,889 Convention center operating . . . . . . . . . . . . 2,987,900 2,939,400 2,919,542 19,858 Special assessments . . . . . . . . . . . . . . . . 222,200 222,200 201,989 20,211 Special projects . . . . . . . . . . . . . . . . . . 2,101,200 2,227,100 934,505 1,292,595
Total expenditures. . . . . . . . . . . . . . . . . . . 161,639,400 161,844,200 152,149,585 9,694,615
Excess (deficiency) of revenues over (under) expenditures. . . . . . . . . . . . . . . 3,978,900 (4,987,900) 4,557,635 9,545,535 Other financing sources (uses):
Transfers in . . . . . . . . . . . . . . . . 4,058,400 979,913 804,913 (175,000) Transfers out . . . . . . . . . . . . . . . (11,454,700) (15,930,400) (11,114,668) 4,815,732
Total other financing sources (uses). . . . . . . . (7,396,300) (14,950,487) (10,309,755) 4,640,732
Net change is fund balances . . . . . . . . . . . . . . (3,417,400) (19,938,387) (5,752,120) 14,186,267
Fund balance at beginning of year. . . . . . . . . . 21,909,052 21,909,052 21,909,052 - Prior year encumbrances appropriated. . . . . . . 2,506,696 2,506,696 2,506,696 -
Fund balance at end of year. . . . . . . . . . . . . $ 20,998,348 $ 4,477,361 $ 18,663,628 $ 14,186,267
FOR THE YEAR ENDED DECEMBER 31, 2009
Budgeted Amounts
CITY OF DAYTON, OHIO
SCHEDULE OF REVENUES, EXPENDITURES AND CHANGES INFUND BALANCE - BUDGET AND ACTUAL (NON-GAAP BUDGETARY BASIS)
GENERAL FUND
F 104

Nonmajor Nonmajor Total NonmajorSpecial Revenue Permanent Governmental
Funds Fund FundsAssets: Equity in pooled cash and cash equivalents. . . . . . . . . . 16,110,026$ 85,157$ 16,195,183$ Investments . . . . . . . . . . . . . . . . . . . . . . . . . . - 93,150 93,150 Receivables (net of allowances for uncollectibles): Accounts. . . . . . . . . . . . . . . . . . . . . . . . . . . 153,862 - 153,862 Special assessments . . . . . . . . . . . . . . . . . . . . . 254,918 - 254,918 Accrued interest . . . . . . . . . . . . . . . . . . . . . . . 8,238 275 8,513 Due from other funds. . . . . . . . . . . . . . . . . . . . . 9,912 - 9,912 Due from other governments . . . . . . . . . . . . . . . . . 7,245,969 - 7,245,969 Prepayments . . . . . . . . . . . . . . . . . . . . . . . . . 786 - 786 Advances to component unit . . . . . . . . . . . . . . . . . 7,801,264 - 7,801,264
Total assets . . . . . . . . . . . . . . . . . . . . . . . . . . 31,584,975$ 178,582$ 31,763,557$
Liabilities: Accounts payable . . . . . . . . . . . . . . . . . . . . . . 238,982$ -$ 238,982$ Contracts payable . . . . . . . . . . . . . . . . . . . . . . 2,893,890 - 2,893,890 Accrued wages and benefits . . . . . . . . . . . . . . . . . 160,648 - 160,648 Retainage payable . . . . . . . . . . . . . . . . . . . . . . 21,459 - 21,459 Interfund loans payable . . . . . . . . . . . . . . . . . . . . 1,397,311 - 1,397,311 Due to other funds. . . . . . . . . . . . . . . . . . . . . . 40,051 - 40,051 Deferred revenue . . . . . . . . . . . . . . . . . . . . . . 3,493,983 52 3,494,035
Total liabilities . . . . . . . . . . . . . . . . . . . . . . . . 8,246,324 52 8,246,376
Fund Balances: Reserved for encumbrances. . . . . . . . . . . . . . . . . 23,812,974 - 23,812,974 Reserved for prepayments . . . . . . . . . . . . . . . . . 786 - 786 Reserved for advances to component unit. . . . . . . . . . 7,801,264 - 7,801,264 Reserved for contributions to permanent fund . . . . . . . - 102,228 102,228 Unreserved, designated for various projects, reported in: Special revenue funds. . . . . . . . . . . . . . 398,848 - 398,848
Undesignated (deficit), reported in: Special revenue funds . . . . . . . . . . . . . . . . . (8,675,221) - (8,675,221) Permanent funds . . . . . . . . . . . . . . . . . . . - 76,302 76,302
Total fund balances . . . . . . . . . . . . . . . . . . . . . 23,338,651 178,530 23,517,181
Total liabilities and fund balances . . . . . . . . . . . . . . 31,584,975$ 178,582$ 31,763,557$
CITY OF DAYTON, OHIO
COMBINING BALANCE SHEETNONMAJOR GOVERNMENTAL FUNDS
DECEMBER 31, 2009
F 105

Nonmajor Nonmajor Total Nonmajor
Special Revenue Permanent GovernmentalFunds Fund Funds
Revenues:State shared taxes. . . . . . . . . . . . . . . . 5,674,831$ -$ 5,674,831$ Charges for services . . . . . . . . . . . . . . 1,344,208 - 1,344,208 Licenses and permits . . . . . . . . . . . . . . 9,082 - 9,082 Fines and forfeitures . . . . . . . . . . . . . . 501,669 - 501,669 Intergovernmental . . . . . . . . . . . . . . . 19,436,678 - 19,436,678 Special assessments . . . . . . . . . . . . . . 102,722 - 102,722 Investment income . . . . . . . . . . . . . . . 37,433 1,107 38,540 Increase (decrease) in FMV of investments. . . (16,521) 15,524 (997) Other . . . . . . . . . . . . . . . . . . . . . . 1,847,492 - 1,847,492
Total revenues. . . . . . . . . . . . . . . . . . . 28,937,594 16,631 28,954,225
Expenditures: Current:
Youth, education and human services. . . . . 2,221,124 - 2,221,124 Community development and neighborhoods. 8,683,280 - 8,683,280 Economic development . . . . . . . . . . . . 4,806,270 - 4,806,270 Leadership and quality of life . . . . . . . . . 11,572,567 742 11,573,309 Corporate responsibility. . . . . . . . . . . . 1,980,002 - 1,980,002 Public safety and justice. . . . . . . . . . . . 4,347,213 - 4,347,213
Capital outlay . . . . . . . . . . . . . . . . . . 21,459 - 21,459 Debt service:
Principal retirement . . . . . . . . . . . . . . 1,494,000 - 1,494,000
Total expenditures. . . . . . . . . . . . . . . . 35,125,915 742 35,126,657
Excess (deficiency) of revenues over (under) expenditures. . . . . . . . . (6,188,321) 15,889 (6,172,432)
Other financing sources (uses):Transfers in . . . . . . . . . . . . . . . . . . 9,346,913 - 9,346,913 Transfers out . . . . . . . . . . . . . . . . . (1,563,745) - (1,563,745)
Total other financing sources (uses). . . . . . . . 7,783,168 - 7,783,168
Net change in fund balances . . . . . . . . . . 1,594,847 15,889 1,610,736
Fund balances at beginning of year. . . . . . . 21,743,804 162,641 21,906,445
Fund balances at end of year. . . . . . . . . . 23,338,651$ 178,530$ 23,517,181$
CITY OF DAYTON, OHIO
COMBINING STATEMENT OF REVENUES, EXPENDITURES AND CHANGES IN FUND BALANCESNONMAJOR GOVERNMENTAL FUNDS
FOR THE YEAR ENDED DECEMBER 31, 2009
F 106

THIS PAGE IS INTENTIONALLY LEFT BLANK
F 107

Other Highway Special
Street Maintenance Revenue
Assets: Equity in pooled cash and cash equivalents. . . . . . 150,233$ 438,685$ 13,180,939$ Receivables (net of allowances for uncollectibles): Accounts. . . . . . . . . . . . . . . . . . . . . . . 30,948 - 66,255 Special assessments. . . . . . . . . . . . . . . . . . - - - Accrued interest . . . . . . . . . . . . . . . . . . . - - 3,295 Due from other funds. . . . . . . . . . . . . . . . . . - - 9,912 Due from other governments . . . . . . . . . . . . . 2,348,750 191,339 120,259 Prepayments . . . . . . . . . . . . . . . . . . . . . . - - 786 Advances to component unit . . . . . . . . . . . . . - - 250,000
Total assets. . . . . . . . . . . . . . . . . . . . . . . 2,529,931$ 630,024$ 13,631,446$
Liabilities: Accounts payable. . . . . . . . . . . . . . . . . . . 27,103$ 33,333$ 33,335$ Contracts payable. . . . . . . . . . . . . . . . . . . - - 1,015,435 Accrued wages and benefits . . . . . . . . . . . . . 63,963 - 3,167 Retainage payable . . . . . . . . . . . . . . . . . . - - - Interfund loans payable . . . . . . . . . . . . . . . . - - - Due to other funds . . . . . . . . . . . . . . . . . . 22,176 - - Deferred revenue. . . . . . . . . . . . . . . . . . . 1,570,988 119,154 19,112
Total liabilities. . . . . . . . . . . . . . . . . . . . . 1,684,230 152,487 1,071,049
Fund Balances: Reserved for encumbrances . . . . . . . . . . . . 72,032 31,783 3,146,216 Reserved for prepayments . . . . . . . . . . . . . - - 786 Reserved for advances to component unit . . . . . - - 250,000
Special revenue funds. . . . . . . . . . . . . . 58,613 340,235 - Unreserved, undesignated (deficit), reported in:
Special revenue funds . . . . . . . . . . . . . . . . . 715,056 105,519 9,163,395
Total fund balances . . . . . . . . . . . . . . . . . . 845,701 477,537 12,560,397
Total liabilities and fund balances. . . . . . . . . . . 2,529,931$ 630,024$ 13,631,446$
DECEMBER 31, 2009
CITY OF DAYTON, OHIO
COMBINING BALANCE SHEETNONMAJOR SPECIAL REVENUE FUNDS
Unreserved, designated for various projects, reported in:
F 108

HUD MiscellaneousPrograms Grants Total
-$ 2,340,169$ 16,110,026$
41,623 15,036 153,862 254,918 - 254,918
- 4,943 8,238 - - 9,912
1,977,298 2,608,323 7,245,969 - - 786
7,551,264 - 7,801,264
9,825,103$ 4,968,471$ 31,584,975$
96,201$ 49,010$ 238,982$ 1,657,282 221,173 2,893,890
51,363 42,155 160,648 21,459 - 21,459
1,397,311 - 1,397,311 4,014 13,861 40,051
1,219,177 565,552 3,493,983
4,446,807 891,751 8,246,324
11,058,259 9,504,684 23,812,974 - - 786
7,551,264 - 7,801,264
- - 398,848
(13,231,227) (5,427,964) (8,675,221)
5,378,296 4,076,720 23,338,651
9,825,103$ 4,968,471$ 31,584,975$
F 109

Other Highway Special
Street Maintenance RevenueRevenues:
State shared taxes. . . . . . . . . . . . . . . . 5,229,927$ 444,904$ -$ Charges for services . . . . . . . . . . . . . . 340,882 - 352,665 Licenses and permits . . . . . . . . . . . . . . - - 9,082 Fines and forfeitures . . . . . . . . . . . . . . - - 70,000 Intergovernmental . . . . . . . . . . . . . . . 99,542 - 25,000 Special assessments . . . . . . . . . . . . . . - - - Investment income . . . . . . . . . . . . . . . - - 15,502 Decrease in FMV of investments . . . . . . . . - - (6,794) Other . . . . . . . . . . . . . . . . . . . . . . 91,134 - 1,341,119
Total revenues . . . . . . . . . . . . . . . . . . 5,761,485 444,904 1,806,574
Expenditures:Current: Youth, education and human services. . . . . - - - Community development and neighborhoods. - - 15,674 Economic development . . . . . . . . . . . . - - 3,340,033 Leadership and quality of life . . . . . . . . . 8,544,550 368,217 594,724 Corporate responsibility. . . . . . . . . . . . - - 1,374,021 Public safety and justice. . . . . . . . . . . . - - 859,529 Capital outlay. . . . . . . . . . . . . . . . . . - - - Debt service:
Principal retirement . . . . . . . . . . . . . - - 1,494,000
Total expenditures . . . . . . . . . . . . . . . . 8,544,550 368,217 7,677,981
Excess (deficiency) of revenues over (under) expenditures. . . . . . . . . (2,783,065) 76,687 (5,871,407)
Other financing sources (uses):
Transfers in . . . . . . . . . . . . . . . . . . 2,284,380 - 6,755,000 Transfers out . . . . . . . . . . . . . . . . . - - -
Total other financing sources (uses) . . . . . . . 2,284,380 - 6,755,000
Net change in fund balances. . . . . . . . . . . (498,685) 76,687 883,593
Fund balances at beginning of year . . . . . . 1,344,386 400,850 11,676,804
Fund balances at end of year. . . . . . . . . . 845,701$ 477,537$ 12,560,397$
FOR THE YEAR ENDED DECEMBER 31, 2009
COMBINING STATEMENT OF REVENUES, EXPENDITURES AND CHANGES IN FUND BALANCESNONMAJOR SPECIAL REVENUE FUNDS
CITY OF DAYTON, OHIO
F 110

HUD Miscellaneous Programs Grants Total
-$ -$ 5,674,831$ 71,099 579,562 1,344,208
- - 9,082 - 431,669 501,669
13,472,791 5,839,345 19,436,678 102,722 - 102,722
- 21,931 37,433 - (9,727) (16,521)
2,377 412,862 1,847,492
13,648,989 7,275,642 28,937,594
2,214,917 6,207 2,221,124 8,615,630 51,976 8,683,280
180,065 1,286,172 4,806,270 1,659,708 405,368 11,572,567
605,981 - 1,980,002 - 3,487,684 4,347,213
21,459 - 21,459
- - 1,494,000
13,297,760 5,237,407 35,125,915
351,229 2,038,235 (6,188,321)
39,074 268,459 9,346,913 - (1,563,745) (1,563,745)
39,074 (1,295,286) 7,783,168
390,303 742,949 1,594,847
4,987,993 3,333,771 21,743,804
5,378,296$ 4,076,720$ 23,338,651$
F 111

Variance withFinal Budget
PositiveOriginal Final Actual (Negative)
Revenues:State shared taxes . . . . . . . . . . . . . . . . . 5,310,400$ 5,965,400$ 5,342,042$ (623,358)$ Charges for services . . . . . . . . . . . . . . . . 419,900 471,700 422,381 (49,319) Other . . . . . . . . . . . . . . . . . . . . . . . 109,700 123,200 110,355 (12,845)
Total revenues. . . . . . . . . . . . . . . . . . . . . 5,840,000 6,560,300 5,874,778 (685,522) Expenditures: Department of public works . . . . . . . . . . . . 8,519,500 8,947,400 8,738,723 208,677
Total expenditures. . . . . . . . . . . . . . . . . . . 8,519,500 8,947,400 8,738,723 208,677
Excess of expenditures over revenues . . . . . . . . . . . . . . . . . . (2,679,500) (2,387,100) (2,863,945) (476,845)
Other financing sources: Transfers in . . . . . . . . . . . . . . . . . . . . . 1,644,000 1,644,000 2,284,380 640,380
Total other financing sources. . . . . . . . . . . . . 1,644,000 1,644,000 2,284,380 640,380
Net change in fund balance . . . . . . . . . . . . . (1,035,500) (743,100) (579,565) 163,535
Fund balance at beginning of year . . . . . . . . . 1,716,717 1,716,717 1,716,717 - Prior year encumbrances appropriated . . . . . . 43,556 43,556 43,556 -
Fund balance at end of year . . . . . . . . . . . . 724,773$ 1,017,173$ 1,180,708$ 163,535$
CITY OF DAYTON, OHIO
SCHEDULE OF REVENUES, EXPENDITURES, AND CHANGES INFUND BALANCE - BUDGET AND ACTUAL (NON-GAAP BUDGETARY BASIS)
STREET FUNDFOR THE YEAR ENDED DECEMBER 31, 2009
Budgeted Amounts
F 112

Variance withFinal Budget
PositiveOriginal Final Actual (Negative)
Revenues:State shared taxes . . . . . . . . . . . . . . . . . 400,000$ 400,000$ 445,146$ 45,146$
Total revenues. . . . . . . . . . . . . . . . . . . . . 400,000 400,000 445,146 45,146 Expenditures: Department of public works . . . . . . . . . . . 400,000 400,000 433,333 (33,333)
Total expenditures. . . . . . . . . . . . . . . . . . . 400,000 400,000 433,333 (33,333)
Net change in fund balance . . . . . . . . . . . . . - - 11,813 11,813
Fund balance at beginning of year. . . . . . . . . 338,245 338,245 338,245 -
Fund balance at end of year . . . . . . . . . . . . 338,245$ 338,245$ 350,058$ 11,813$
CITY OF DAYTON, OHIO
SCHEDULE OF REVENUES, EXPENDITURES, AND CHANGES INFUND BALANCE - BUDGET AND ACTUAL (NON-GAAP BUDGETARY BASIS)
HIGHWAY MAINTENANCE FUNDFOR THE YEAR ENDED DECEMBER 31, 2009
Budgeted Amounts
F 113

Variance withFinal Budget
PositiveOriginal Final Actual (Negative)
Revenues:Charges for services . . . . . . . . . . . . . . . . 79,000$ 108,300$ 128,110$ 19,810$ Licenses and permits. . . . . . . . . . . . . . . . 5,600 7,700 9,082 1,382 Investment income . . . . . . . . . . . . . . . . 84,700 116,100 15,271 (100,829) Other . . . . . . . . . . . . . . . . . . . . . . . 1,812,000 2,483,900 1,542,677 (941,223)
Total revenues. . . . . . . . . . . . . . . . . . . . . 1,981,300 2,716,000 1,695,140 (1,020,860) Expenditures: Various departments. . . . . . . . . . . . . . . . 9,930,800 11,903,000 9,795,711 2,107,289
Total expenditures. . . . . . . . . . . . . . . . . . . 9,930,800 11,903,000 9,795,711 2,107,289
Excess of expenditures over revenues . . . . . . . . . . . . . . . . . . (7,949,500) (9,187,000) (8,100,571) 1,086,429
Other financing sources: Transfers in . . . . . . . . . . . . . . . . . . . . . 4,180,700 5,731,100 6,755,000 1,023,900
Total other financing sources . . . . . . . . . . . . . 4,180,700 5,731,100 6,755,000 1,023,900
Net change in fund balance . . . . . . . . . . . . . (3,768,800) (3,455,900) (1,345,571) 2,110,329
Fund balance at beginning of year. . . . . . . . . 7,799,894 7,799,894 7,799,894 - Prior year encumbrances appropriated . . . . . . 3,493,282 3,493,282 3,493,282 -
Fund balance at end of year . . . . . . . . . . . . 7,524,376$ 7,837,276$ 9,947,605$ 2,110,329$
FOR THE YEAR ENDED DECEMBER 31, 2009
Budgeted Amounts
CITY OF DAYTON, OHIO
SCHEDULE OF REVENUES, EXPENDITURES, AND CHANGES INFUND BALANCE - BUDGET AND ACTUAL (NON-GAAP BUDGETARY BASIS)
OTHER SPECIAL REVENUE FUND
F 114

Variance withFinal Budget
PositiveOriginal Final Actual (Negative)
Revenues:Charges for services . . . . . . . . . . . . . . . . 890,000$ 2,802,600$ 542,461$ (2,260,139)$ Intergovernmental . . . . . . . . . . . . . . . . . 6,289,600 19,805,700 3,833,545 (15,972,155) Other . . . . . . . . . . . . . . . . . . . . . . . 1,124,800 3,542,000 685,577 (2,856,423)
Total revenues. . . . . . . . . . . . . . . . . . . . . 8,304,400 26,150,300 5,061,583 (21,088,717) Expenditures: Other grants . . . . . . . . . . . . . . . . . . . . 4,527,000 21,036,000 14,419,796 6,616,204
Total expenditures. . . . . . . . . . . . . . . . . . . 4,527,000 21,036,000 14,419,796 6,616,204
Excess (deficiency) of revenues over (under) expenditures . . . . . . . . . . . 3,777,400 5,114,300 (9,358,213) (14,472,513)
Other financing sources (uses): Transfers in . . . . . . . . . . . . . . . . . . . . . 440,500 1,387,000 268,459 (1,118,541) Transfers out . . . . . . . . . . . . . . . . . . . . (500,400) (2,325,400) (1,563,745) 761,655
Total other financing sources (uses) . . . . . . . . (59,900) (938,400) (1,295,286) (356,886)
Net change in fund balance . . . . . . . . . . . . . 3,717,500 4,175,900 (10,653,499) (14,829,399)
Fund balance (deficit) at beginning of year. . . . . . (3,466,444) (3,466,444) (3,466,444) - Prior year encumbrances appropriated . . . . . . 6,647,762 6,647,762 6,647,762 -
Fund balance (deficit) at end of year . . . . . . . . . 6,898,818$ 7,357,218$ (7,472,181)$ (14,829,399)$
CITY OF DAYTON, OHIO
SCHEDULE OF REVENUES, EXPENDITURES, AND CHANGES INFUND BALANCE - BUDGET AND ACTUAL (NON-GAAP BUDGETARY BASIS)
MISCELLANEOUS GRANTS FUNDFOR THE YEAR ENDED DECEMBER 31, 2009
Budgeted Amounts
F 115

Variance withFinal Budget
PositiveOriginal Final Actual (Negative)
Revenues:Other . . . . . . . . . . . . . . . . . . . . . . . 5,000 - 1,188 1,188
Total revenues. . . . . . . . . . . . . . . . . . . . . 5,000 - 1,188 1,188 Expenditures: Other. . . . . . . . . . . . . . . . . . . . . . . 50,000 50,000 - 50,000
Total expenditures. . . . . . . . . . . . . . . . . . . 50,000 50,000 - 50,000
Net change in fund balance . . . . . . . . . . . . . (45,000) (50,000) 1,188 51,188
Fund balance at beginning of year. . . . . . . . . . 144,887 144,887 144,887 -
Fund balance at end of year. . . . . . . . . . . . . . 99,887$ 94,887$ 146,075$ 51,188$
FOR THE YEAR ENDED DECEMBER 31, 2009
Budgeted Amounts
CITY OF DAYTON, OHIO
SCHEDULE OF REVENUES, EXPENDITURES, AND CHANGES INFUND BALANCE - BUDGET AND ACTUAL (NON-GAAP BUDGETARY BASIS)
PERMANENT FUND
F 116

Variance withFinal Budget
PositiveOriginal Final Actual (Negative)
Revenues:Property and other local taxes . . . . . . . . . . . 2,769,300$ 9,296,600$ 9,296,628$ 28$ Special assessments . . . . . . . . . . . . . . . . 35,000 117,700 117,652 (48) Intergovernmental. . . . . . . . . . . . . . . . . . 312,900 1,050,400 1,050,358 (42) Other . . . . . . . . . . . . . . . . . . . . . . . 133,800 449,000 137,818 (311,182)
Total revenues. . . . . . . . . . . . . . . . . . . . . 3,251,000 10,913,700 10,602,456 (311,244) Expenditures: Department of finance . . . . . . . . . . . . . . . 16,312,000 35,000,000 14,344,549 20,655,451
Total expenditures. . . . . . . . . . . . . . . . . . . 16,312,000 35,000,000 14,344,549 20,655,451
Excess of expenditures over revenues . . . . . . . (13,061,000) (24,086,300) (3,742,093) 20,344,207
Other financing sources (uses): Sale of bonds. . . . . . . . . . . . . . . . . . . . 7,305,200 24,524,200 22,337,868 (2,186,332) Advances out . . . . . . . . . . . . . . . . . . . . - - (68,723) (68,723) Premium on bond issuance . . . . . . . . . . . . . - - 311,474 311,474 Payment to refund bond escrow agent . . . . . . . . - - (22,045,122) (22,045,122)
Total other financing sources. . . . . . . . . . . . . . 7,305,200 24,524,200 535,497 (23,988,703)
Net change in fund balance . . . . . . . . . . . . . (5,755,800) 437,900 (3,206,596) (3,644,496)
Fund balance at beginning of year . . . 28,026,896 28,026,896 28,026,896 - Prior year encumbrances appropriated . . . . . . 49,392 49,392 49,392 -
Fund balance at end of year. . . . . . . . . 22,320,488$ 28,514,188$ 24,869,692$ (3,644,496)$
FOR THE YEAR ENDED DECEMBER 31, 2009
Budgeted Amounts
CITY OF DAYTON, OHIO
SCHEDULE OF REVENUES, EXPENDITURES, AND CHANGES INFUND BALANCE - BUDGET AND ACTUAL (NON-GAAP BUDGETARY BASIS)
DEBT SERVICE FUND
F 117

The enterprise funds account for operations that are financed and operated in a manner similar to private business enterprises wherethe intent is that costs (expenses, including depreciation) of providing services to the general public on a continuing basis berecovered primarily through user charges, or where it has been decided that a periodic determination of revenues earned, expensesincurred, and/or net income in appropriate for capital maintenance, public policy, management control, accountability or otherpurposes. The following are the nonmajor enterprise funds which the City of Dayton operates:
Storm Water
To account for the provision of storm sewers to the residents of the City of Dayton. Charges for services are used to maintain thestorm sewers throughout the City.
Golf
To account for the operations of the City's six golf courses. Revenue is generated by golf fees charged for the use of the facilities.The six golf courses provide needed green space inside the City with three providing scenic cover to the City's north well field.
COMBINING STATEMENTS - NONMAJOR ENTERPRISE FUNDS
Nonmajor Enterprise Funds
CITY OF DAYTON, OHIO
F 118

Storm Water Golf Total
Assets:Current assets:
Equity in pooled cash and cash equivalents . . . . . 6,944,343$ 197,664$ 7,142,007$ Receivables (net of allowance for uncollectibles):
Special assessments . . . . . . . . . . . . . . . 423,501 - 423,501 Accounts . . . . . . . . . . . . . . . . . . . . . 1,471,194 479 1,471,673
Due from other funds . . . . . . . . . . . . . . . . 14,580 304 14,884 Total current assets 8,853,618 198,447 9,052,065
Noncurrent assets:Unamortized bond issuance costs. . . . . . . . . . . - 7,819 7,819 Capital assets:
Land and construction in progress . . . . . . . . . 57,500 594,927 652,427 Depreciable capital assets, net . . . . . . . . . . 11,480,047 4,903,205 16,383,252 Total capital assets . . . . . . . . . . . . . . . . 11,537,547 5,498,132 17,035,679 Total noncurrent assets . . . . . . . . . . . . . 11,537,547 5,505,951 17,043,498
Total assets. . . . . . . . . . . . . . . . . . . . . . . 20,391,165 5,704,398 26,095,563
Liabilities:Current liabilities:
Accounts payable . . . . . . . . . . . . . . . . . 48,141 10,108 58,249 Contracts payable . . . . . . . . . . . . . . . . . - 1,335 1,335 Accrued wages and benefits . . . . . . . . . . . . 76,517 23,069 99,586 Compensated absences - current. . . . . . . . . . 118,524 54,142 172,666 Accrued interest payable. . . . . . . . . . . . . . - 6,466 6,466 Due to other funds . . . . . . . . . . . . . . . . . 565,157 1,084 566,241 Due to other governments . . . . . . . . . . . . . - 442 442 General obligation bonds payable - current. . . . . - 254,873 254,873
Total current liabilities. . . . . . . . . . . . . . 808,339 351,519 1,159,858
Noncurrent liabilities:Compensated absences. . . . . . . . . . . . . . 113,708 51,942 165,650 Advances from other funds . . . . . . . . . . . . - 912,306 912,306 General obligation bonds payable . . . . . . . . . - 1,121,073 1,121,073
Total noncurrent liabilities. . . . . . . . . . . 113,708 2,085,321 2,199,029
Total liabilities. . . . . . . . . . . . . . . . . . . . . 922,047 2,436,840 3,358,887
Net assets: Invested in capital assets, net of related debt . . . . . 11,537,547 4,122,186 15,659,733 Unrestricted (deficit) . . . . . . . . . . . . . . . . . 7,931,571 (854,628) 7,076,943
Total net assets . . . . . . . . . . . . . . . . . . . . 19,469,118$ 3,267,558$ 22,736,676$
CITY OF DAYTON, OHIO
COMBINING STATEMENT OF NET ASSETSNONMAJOR ENTERPRISE FUNDS
DECEMBER 31, 2009
F 119

Storm Water Golf Total
Operating revenues:Charges for services . . . . . . . . . . . . . . 7,043,146$ 3,232,460$ 10,275,606$ Other . . . . . . . . . . . . . . . . . . . . . . 40,309 17,781 58,090
Total operating revenues . . . . . . . . . . . . . 7,083,455 3,250,241 10,333,696
Operating expenses: Personal services . . . . . . . . . . . . . . . 2,375,780 1,142,956 3,518,736 Benefit payments . . . . . . . . . . . . . . . 927,056 360,387 1,287,443 Contractual services . . . . . . . . . . . . . . 1,233,841 854,431 2,088,272 Materials and supplies. . . . . . . . . . . . . 199,909 337,007 536,916 Utilities . . . . . . . . . . . . . . . . . . . . 86,853 127,879 214,732 Depreciation. . . . . . . . . . . . . . . . . . 424,933 262,422 687,355 Other. . . . . . . . . . . . . . . . . . . . . . 139,028 87,816 226,844
Total operating expenses . . . . . . . . . . . . . 5,387,400 3,172,898 8,560,298
Operating income. . . . . . . . . . . . . . . . . 1,696,055 77,343 1,773,398
Nonoperating expenses: Interest expense and fiscal charges. . . . . . . . . - (88,570) (88,570)
Total nonoperating expenses. . . . . . . . . . . . - (88,570) (88,570)
Income (loss) before transfers . . . . . . . . . . 1,696,055 (11,227) 1,684,828
Transfers in . . . . . . . . . . . . . . . . . . . 157,727 46,504 204,231 Transfers out . . . . . . . . . . . . . . . . . . (56,677) - (56,677)
Change in net assets. . . . . . . . . . . . . . . . 1,797,105 35,277 1,832,382
Net assets, January 1 (restated) . . . . . . . . . 17,672,013 3,232,281 20,904,294
Net assets, December 31 . . . . . . . . . . . . . 19,469,118$ 3,267,558$ 22,736,676$
FOR THE YEAR ENDED DECEMBER 31, 2009
CITY OF DAYTON, OHIO
COMBINING STATEMENT OF REVENUES, EXPENSES AND CHANGES IN NET ASSETSNONMAJOR ENTERPRISE FUNDS
F 120

Storm Water Golf Total
Cash flows from operating activities:Cash received from customers . . . . . . . . . . . . . 6,877,741$ 3,232,969$ 10,110,710$ Cash received from other operating revenues . . . . . 25,729 17,477 43,206 Cash payments for personal services . . . . . . . . . (2,414,331) (1,184,882) (3,599,213) Cash payments for fringe benefits . . . . . . . . . . . (932,233) (364,878) (1,297,111) Cash payments for contract services. . . . . . . . . . (1,223,593) (856,131) (2,079,724) Cash payments for materials and supplies. . . . . . . (205,756) (336,431) (542,187) Cash payments for utilities. . . . . . . . . . . . . . . (85,674) (131,181) (216,855) Cash payments for other operating expenses . . . . . (138,924) (88,408) (227,332)
Net cash provided by operating activities. . . . . . . 1,902,959 288,535 2,191,494
Cash flows from noncapital financing activities:Cash received from interfund loans . . . . . . . . . . - 68,723 68,723 Transfers in . . . . . . . . . . . . . . . . . . . . . . 157,727 46,504 204,231 Transfers out . . . . . . . . . . . . . . . . . . . . . (56,677) - (56,677)
Net cash provided by noncapital financing activities . . . . . . . . . . . . . . . . 101,050 115,227 216,277
Cash flows from capital and related financing activities:Acquisition of capital assets . . . . . . . . . . . . . (385,474) - (385,474) Payment to refund bond escrow agent . . . . . . . . - (771,889) (771,889) Sale of refunding bonds. . . . . . . . . . . . . . . . . - 771,889 771,889 Principal paid on bonds . . . . . . . . . . . . . . . - (277,720) (277,720) Interest paid on bonds . . . . . . . . . . . . . . . . - (72,508) (72,508)
Net cash used in capital andrelated financing activities. . . . . . . . . . . . (385,474) (350,228) (735,702)
Net increase in cash and cash equivalents . . . . . . 1,618,535 53,534 1,672,069
Cash and cash equivalents at beginning of year . . . . . . . . . . . . . . . . . . . 5,325,808 144,130 5,469,938 Cash and cash equivalents at end of year. . . . . . . $ 6,944,343 $ 197,664 $ 7,142,007
Reconciliation of operating income to net cash provided by operating activities:Operating income. . . . . . . . . . . . . . . . . . . . 1,696,055$ 77,343$ 1,773,398$ Adjustments to reconcile operating income to net cash provided by operating activities:
Depreciation . . . . . . . . . . . . . . . . . . . . . 424,933 262,422 687,355 Changes in assets and liabilities:
(Increase) decrease in accounts receivable. . . . . . . (91,518) 509 (91,009) Increase in due from other funds . . . . . . . . . . . (14,580) (304) (14,884) Decrease in due from other governments. . . . . . . . 13,635 - 13,635 Increase in special assessments receviable . . . . . . . (87,522) - (87,522) Increase (decrease) in accounts payable . . . . . . . . 44,604 (2,726) 41,878 Decrease in contracts payable . . . . . . . . . . . . . - (1,449) (1,449) Decrease in retainage payable . . . . . . . . . . . . . (34,888) - (34,888) Decrease in accrued wages and benefits. . . . . . . . (27,911) (25,820) (53,731) Decrease in due to other funds . . . . . . . . . . . . (4,032) (843) (4,875) Decrease in voluntary termination benefits payable . . (12,527) (10,348) (22,875) Decrease in compensated absences payable . . . . . . . . . . . . . . . . . . (3,290) (10,249) (13,539)
Net cash provided by operating activities. . . . . . . . . $ 1,902,959 $ 288,535 $ 2,191,494
Non-cash transactions:At December 31, 2008, the Storm Water fund purchased $92,470 in capital assets on account.
CITY OF DAYTON, OHIO
COMBINING STATEMENT OF CASH FLOWSNONMAJOR ENTERPRISE FUNDS
FOR THE YEAR ENDED DECEMBER 31, 2009
F 121

Stores and Reproduction
Workers' Compensation
Plumbing ShopTo account for plumbing services to departments within the City.
Fleet ManagementTo account for the maintenance of City vehicles. Revenues are derived from direct charges to other departments for fuelusage and repairs. General maintenance is charged to the other funds on a pro-rated basis.
Stores is used in purchasing and storage of office materials and supplies for the entire organization. The other departmentsare charged the cost of the materials and supplies plus an average of fifteen percent markup to cover the overhead cost ofoperating this fund. Reproduction is used to account for the reproducing of written material, and the print, binding anddistribution of the City's various publications. All costs are recouped from charges to other departments within theorganization on a per-job basis.
Fire Fleet ManagementTo account for the maintenance of City fire vehicles and to charge for maintenance of fire vehicles from othermunicipalities. A majority of the maintenance will be provided to City fire vehicles. Revenues are derived from directcharges to the fire department within the general fund and from fees changed to other municipalities.
CITY OF DAYTON, OHIO
COMBINING STATEMENTS - INTERNAL SERVICE FUNDS
The internal service funds account for the financing of goods or services provided by one department or agency to otherdepartments of the City of Dayton on a cost-reimbursement basis. Accounting for these funds is designed to accumulate allof the costs incurred by the internal service funds in providing goods and services to other departments. However, chargesto the other departments are not intended to produce a significant profit in the long run, but to recover the total costs ofproviding goods or services.
To account for claims and administrative payments to cover risks due to job-related injuries to City employees. Revenuesare derived from pro-rated charges against personnel costs of each department to cover claim payments and costs ofadministering the fund.
F 122

Fleet Fire Fleet Stores and Workers' PlumbingManagement Management Reproduction Compensation Shop Total
Assets:Current assets: Equity in pooled cash and cash equivalents. . . . . . 46,682$ 13,930$ 117,924$ 14,084,055$ 421,476$ 14,684,067$ Receivables (net of allowances of uncollectibles): Accounts. . . . . . . . . . . . . . . . . . . . . . . 122 14,553 - - - 14,675 Due from other funds. . . . . . . . . . . . . . . . . 74,647 - 35,893 - 36,777 147,317 Due from other governments . . . . . . . . . . . . . - 26,747 - - - 26,747 Prepayments. . . . . . . . . . . . . . . . . . . . . . - 21,245 - - - 21,245 Inventory held for resale . . . . . . . . . . . . . . . 365,913 293,847 11,969 - - 671,729
Total current assets 487,364 370,322 165,786 14,084,055 458,253 15,565,780
Noncurrent assets: Capital assets:
Land and construction in progress . . . . . . . . . - 75,000 - - - 75,000 Depreciable capital assets, net . . . . . . . . . . 220,997 838,080 3,035 73,263 36,058 1,171,433 Total noncurrent assets . . . . . . . . . . . . . 220,997 913,080 3,035 73,263 36,058 1,246,433
Total assets. . . . . . . . . . . . . . . . . . . . . . . 708,361 1,283,402 168,821 14,157,318 494,311 16,812,213
Liabilities:Current liabilities: Accounts payable. . . . . . . . . . . . . . . . . . . 98,245 2,852 61,897 8,050 9,904 180,948 Accrued wages and benefits . . . . . . . . . . . . . 83,600 16,957 2,436 8,334 10,684 122,011 Compensated absences - current. . . . . . . . . . 103,339 16,872 7,727 30,206 14,789 172,933 Interfund loans payable. . . . . . . . . . . . . . . . 400,000 - - - - 400,000 Due to other funds . . . . . . . . . . . . . . . . . . 134 - - 1 848 983 Due to other governments . . . . . . . . . . . . . . - - - 1,822,016 - 1,822,016 Claims payable - current . . . . . . . . . . . . . . . - - - 77,924 - 77,924
Total current liabilities. . . . . . . . . . . . . . 685,318 36,681 72,060 1,946,531 36,225 2,776,815
Noncurrent liabilities:Compensated absences. . . . . . . . . . . . . . 99,140 16,185 7,413 28,979 14,189 165,906 Claims payable . . . . . . . . . . . . . . . . . . - - - 6,212,124 - 6,212,124
Total noncurrent liabilities. . . . . . . . . . . 99,140 16,185 7,413 6,241,103 14,189 6,378,030
Total liabilities. . . . . . . . . . . . . . . . . . . . . 784,458 52,866 79,473 8,187,634 50,414 9,154,845
Net assets: Invested in capital assets, net of related debt . . . . . 220,997 913,080 3,035 73,263 36,058 1,246,433 Unrestricted (deficit). . . . . . . . . . . . . . . . . (297,094) 317,456 86,313 5,896,421 407,839 6,410,935
Total net assets (deficit). . . . . . . . . . . . . . . . (76,097)$ 1,230,536$ 89,348$ 5,969,684$ 443,897$ 7,657,368$
CITY OF DAYTON, OHIO
COMBINING STATEMENT OF NET ASSETSINTERNAL SERVICE FUNDS
DECEMBER 31, 2009
F 123

Fleet Fire Fleet Stores and Workers' Plumbing Management Management Reproduction Compensation Shop Total
Operating revenues:Charges for services . . . . . . . . . . . . . . 6,895,863$ 1,102,911$ 224,554$ 3,929,852$ 603,046$ 12,756,226$ Other . . . . . . . . . . . . . . . . . . . . . . 4,025 - 282,442 - 3,500 289,967
Total operating revenues . . . . . . . . . . . . . 6,899,888 1,102,911 506,996 3,929,852 606,546 13,046,193
Operating expenses: Personal services . . . . . . . . . . . . . . . 2,252,967 456,630 161,291 639,305 253,229 3,763,422 Benefit payments . . . . . . . . . . . . . . . . 874,092 171,855 59,965 211,503 100,329 1,417,744 Contractual services . . . . . . . . . . . . . . 389,809 364,377 340,837 193,104 3,585 1,291,712 Materials and supplies. . . . . . . . . . . . . 1,918,923 919 953 69,657 121,840 2,112,292 Utilities . . . . . . . . . . . . . . . . . . . . - 22,430 - - - 22,430 Cost of sales . . . . . . . . . . . . . . . . . . 1,524,071 215,266 69,594 - - 1,808,931 Depreciation. . . . . . . . . . . . . . . . . . 50,325 29,021 4,548 9,159 8,274 101,327 Claims . . . . . . . . . . . . . . . . . . . . - - - 2,961,161 - 2,961,161 Other. . . . . . . . . . . . . . . . . . . . . . 21,613 1,091 - 6,176 37 28,917
Total operating expenses . . . . . . . . . . . . . 7,031,800 1,261,589 637,188 4,090,065 487,294 13,507,936
Operating income (loss) . . . . . . . . . . . . . (131,912) (158,678) (130,192) (160,213) 119,252 (461,743)
Transfers in . . . . . . . . . . . . . . . . . . . 1,549 60,000 135,400 - - 196,949
Change in net assets . . . . . . . . . . . . . . . . (130,363) (98,678) 5,208 (160,213) 119,252 (264,794)
Net assets, January 1 . . . . . . . . . . . . . . . 54,266 1,329,214 84,140 6,129,897 324,645 7,922,162
Net assets (deficit), December 31 . . . . . . . . . (76,097)$ 1,230,536$ 89,348$ 5,969,684$ 443,897$ 7,657,368$
INTERNAL SERVICE FUNDSFOR THE YEAR ENDED DECEMBER 31, 2009
COMBINING STATEMENT OF REVENUES, EXPENSES AND CHANGES IN NET ASSETS
CITY OF DAYTON, OHIO
F 124

Fleet Fire Fleet Stores and Workers' PlumbingManagement Management Reproduction Compensation Shop Total
Cash flows from operating activities:Cash received from interfund services provided. . . . . 6,927,414$ 1,135,951$ 218,950$ 3,929,852$ 657,003$ 12,869,170$ Cash received from other operating revenues . . . . . 4,025 - 282,442 - 3,500 289,967 Cash payments for personal services . . . . . . . . . (2,314,003) (480,640) (163,250) (654,364) (265,639) (3,877,896) Cash payments for fringe benefits . . . . . . . . . . . (880,337) (174,458) (61,414) (218,335) (101,236) (1,435,780) Cash payments for contract services. . . . . . . . . . (427,943) (362,160) (281,146) (240,594) (3,585) (1,315,428) Cash payments for materials and supplies. . . . . . . (1,903,975) - (3,790) (67,926) (125,951) (2,101,642) Cash payments for cost of goods sold . . . . . . . . . (1,493,595) (246,319) (73,550) - - (1,813,464) Cash payments for utilities. . . . . . . . . . . . . . . - (24,286) - - - (24,286) Cash payments for claims . . . . . . . . . . . . . . . - - - (2,243,896) - (2,243,896) Cash payments for other operating expenses . . . . . (21,479) (1,091) - (6,469) (37) (29,076)
Net cash provided by (used in) operating activities. . (109,893) (153,003) (81,758) 498,268 164,055 317,669
Cash flows from noncapital financing activities:Transfers in . . . . . . . . . . . . . . . . . . . . . 1,549 60,000 135,400 - - 196,949
Net cash provided by noncapital financing activities. 1,549 60,000 135,400 - - 196,949
Net increase (decrease) in cash and cash equivalents. . . (108,344) (93,003) 53,642 498,268 164,055 514,618
Cash and cash equivalents at beginning of year . . . . . . . . . . . . . . . . . . . 155,026 106,933 64,282 13,585,787 257,421 14,169,449 Cash and cash equivalents at end of year. . . . . . . $ 46,682 $ 13,930 $ 117,924 $ 14,084,055 $ 421,476 $ 14,684,067
Reconciliation of operating income (loss) to net cash provided by (used in) operating activities:Operating income (loss) . . . . . . . . . . . . . . . . . (131,912)$ (158,678)$ (130,192)$ (160,213)$ 119,252$ (461,743)$ Adjustments to reconcile operating income (loss) to net cash provided by (used in) operating activities:
Depreciation . . . . . . . . . . . . . . . . . . . . . 50,325 29,021 4,548 9,159 8,274 101,327 Changes in assets and liabilities:
Increase in accounts receivable. . . . . . . . . . . . . (122) (8,396) - - - (8,518) (Increase) decrease in due from other funds . . . . . . 31,673 38,289 (5,604) - 53,957 118,315 Decrease in prepaid assets . . . . . . . . . . . . . . . - 1,641 - - - 1,641 Decrease in due from other governments. . . . . . . . - 3,147 - - - 3,147 (Increase) decrease in inventory held for resale. . . . 30,476 (31,053) (3,956) - - (4,533) Increase (decrease) in accounts payable . . . . . . . 1,954 (361) 56,854 3,743 (3,971) 58,219 Decrease in contracts payable . . . . . . . . . . . . . - - - (49,500) - (49,500) Decrease in accrued wages and benefits . . . . . . . . . (19,687) (4,027) (5,763) (27,451) (1,753) (58,681) Decrease in due to other funds . . . . . . . . . . . . . (25,006) - - (295) (140) (25,441) Decrease in due to other governments . . . . . . . . . - - - (305,584) - (305,584) Decrease in voluntary termination benefits payable . . (13,135) - - - - (13,135) Increase (decrease) in compensated absences payable. (34,459) (22,586) 2,355 5,560 (11,564) (60,694) Increase in claims payable. . . . . . . . . . . . . . - - - 1,022,849 - 1,022,849
Net cash provided by (used in) operating activities. . . $ (109,893) $ (153,003) $ (81,758) $ 498,268 $ 164,055 $ 317,669
CITY OF DAYTON, OHIO
COMBINING STATEMENT OF CASH FLOWSINTERNAL SERVICE FUNDS
FOR THE YEAR ENDED DECEMBER 31, 2009
F 125

Guaranty Payroll WithholdingPerformance Bond Special Improvement DistrictDeveloper Construction Payments GMR Trading ProjectDeposit of Taxes/Courthouse Square Miami Township-Dayton JEDDDependent Care Butler Township-Dayton JEDDFire Proceeds EmeryUrban Renewal Comp Dep Municipal CourtsBuilding Permit Surcharge Executive Severance
Agency funds are custodial in nature, and thus, do not recognize revenues or expenditures, only changes in assets andliabilities. These funds are used to record the collection and payment of employee payroll, withholdings, medical and lifeinsurance premiums, refundable deposits, PERS, Police and Fire Pension funds, taxes collected for other governments,conduit debt and municipal court.
Agency Funds
CITY OF DAYTON, OHIO
COMBINING STATEMENTS - FIDUCIARY FUNDS
Fiduciary funds are used to account for assets held by the City in a trustee capacity, or as an agent for individuals, privateorganizations, other governmental units, and/or funds. The following are the City's fiduciary fund types:
F 126

Balance Balance12/31/08 Additions Deductions 12/31/09
GuarantyAssets: Equity in pooled cash and cash equivalents. . . . . . 49,649$ -$ -$ 49,649$ Total assets. . . . . . . . . . . . . . . . . . . . . . . 49,649$ -$ -$ 49,649$
Liabilities: Due to other governments . . . . . . . . . . . . . . 49,649$ -$ -$ 49,649$ Total liabilities. . . . . . . . . . . . . . . . . . . . . 49,649$ -$ -$ 49,649$
Performance BondAssets: Equity in pooled cash and cash equivalents. . . . . . 14,119$ -$ -$ 14,119$ Total assets. . . . . . . . . . . . . . . . . . . . . . . 14,119$ -$ -$ 14,119$
Liabilities: Withholdings and deposits. . . . . . . . . . . . . . 14,119$ -$ -$ 14,119$ Total liabilities. . . . . . . . . . . . . . . . . . . . . 14,119$ -$ -$ 14,119$
Developer Construction PaymentsAssets: Equity in pooled cash and cash equivalents. . . . . . 2,800$ -$ -$ 2,800$ Total assets. . . . . . . . . . . . . . . . . . . . . . . 2,800$ -$ -$ 2,800$
Liabilities: Due to others. . . . . . . . . . . . . . . . . . . . . 2,800$ -$ -$ 2,800$ Total liabilities. . . . . . . . . . . . . . . . . . . . . 2,800$ -$ -$ 2,800$
Deposit of Taxes/Courthouse SquareAssets: Equity in pooled cash and cash equivalents. . . . . . 138,175$ 731,232$ 749,241$ 120,166$ Accounts receivable. . . . . . . . . . . . . . . . . . 306,675 18,009 - 324,684 Total assets. . . . . . . . . . . . . . . . . . . . . . . 444,850$ 749,241$ 749,241$ 444,850$
Liabilities: Due to other governments . . . . . . . . . . . . . . 444,850$ 749,241$ 749,241$ 444,850$ Total liabilities. . . . . . . . . . . . . . . . . . . . . 444,850$ 749,241$ 749,241$ 444,850$
Dependent CareAssets: Equity in pooled cash and cash equivalents. . . . . . 6,679$ -$ 3,187$ 3,492$ Total assets. . . . . . . . . . . . . . . . . . . . . . . 6,679$ -$ 3,187$ 3,492$
Liabilities: Due to other governments . . . . . . . . . . . . . . 6,679$ -$ 3,187$ 3,492$ Total liabilities. . . . . . . . . . . . . . . . . . . . . 6,679$ -$ 3,187$ 3,492$
- - Continued
CITY OF DAYTON, OHIO
COMBINING STATEMENT OF CHANGES IN ASSETS AND LIABILITIESAGENCY FUNDS
FOR THE YEAR ENDED DECEMBER 31, 2009
F 127

Balance Balance12/31/08 Additions Deductions 12/31/09
Fire ProceedsAssets: Equity in pooled cash and cash equivalents. . . . . . 776,629$ -$ 82,400$ 694,229$ Total assets. . . . . . . . . . . . . . . . . . . . . . . 776,629$ -$ 82,400$ 694,229$
Liabilities: Accounts payable . . . . . . . . . . . . . . . . . . 12,779$ -$ 12,779$ -$ Due to other governments . . . . . . . . . . . . . . 763,850 - 69,621 694,229 Total liabilities. . . . . . . . . . . . . . . . . . . . . 776,629$ -$ 82,400$ 694,229$
Urban Renewal Comp DepAssets: Equity in pooled cash and cash equivalents. . . . . . 53,520$ -$ -$ 53,520$ Total assets. . . . . . . . . . . . . . . . . . . . . . . 53,520$ -$ -$ 53,520$
Liabilities: Withholdings and deposits. . . . . . . . . . . . . . 53,520$ -$ -$ 53,520$ Total liabilities. . . . . . . . . . . . . . . . . . . . . 53,520$ -$ -$ 53,520$
Building Permit SurchargeAssets: Equity in pooled cash and cash equivalents. . . . . . 6,437$ -$ 2,118$ 4,319$ Total assets. . . . . . . . . . . . . . . . . . . . . . . 6,437$ -$ 2,118$ 4,319$
Liabilities: Accounts payable 2,573$ -$ 1,642$ 931$ Due to other governments . . . . . . . . . . . . . . 3,864 - 476 3,388 Total liabilities. . . . . . . . . . . . . . . . . . . . . 6,437$ -$ 2,118$ 4,319$
Payroll WithholdingAssets: Equity in pooled cash and cash equivalents. . . . . . 3,604,461$ 687,309$ 63,815$ 4,227,955$ Total assets. . . . . . . . . . . . . . . . . . . . . . . 3,604,461$ 687,309$ 63,815$ 4,227,955$
Liabilities: Accounts payable -$ 2,950$ -$ 2,950$ Withholdings and deposits. . . . . . . . . . . . . . 3,604,461 684,359 63,815 4,225,005 Total liabilities. . . . . . . . . . . . . . . . . . . . . 3,604,461$ 687,309$ 63,815$ 4,227,955$
Special Improvement DistrictAssets: Equity in pooled cash and cash equivalents. . . . . . 18,186$ -$ -$ 18,186$ Total assets. . . . . . . . . . . . . . . . . . . . . . . 18,186$ -$ -$ 18,186$
Liabilities: Due to other governments . . . . . . . . . . . . . . 18,186$ -$ -$ 18,186$ Total liabilities. . . . . . . . . . . . . . . . . . . . . 18,186$ -$ -$ 18,186$
- - Continued
COMBINING STATEMENT OF CHANGES IN ASSETS AND LIABILITIESAGENCY FUNDS (CONTINUED)
FOR THE YEAR ENDED DECEMBER 31, 2009
CITY OF DAYTON, OHIO
F 128

Balance Balance12/31/08 Additions Deductions 12/31/09
GMR Trading ProjectAssets: Equity in pooled cash and cash equivalents. . . . . . 321,434$ -$ 220,005$ 101,429$ Total assets. . . . . . . . . . . . . . . . . . . . . . . 321,434$ -$ 220,005$ 101,429$
Liabilities: Due to other governments . . . . . . . . . . . . . . 321,434$ -$ 220,005$ 101,429$ Total liabilities. . . . . . . . . . . . . . . . . . . . . 321,434$ -$ 220,005$ 101,429$
Miami Township-Dayton JEDDAssets: Equity in pooled cash and cash equivalents. . . . . . 46,207$ 72,866$ 12,803$ 106,270$ Accounts receivable. . . . . . . . . . . . . . . . . . 18,243 - 18,243 - Total assets. . . . . . . . . . . . . . . . . . . . . . . 64,450$ 72,866$ 31,046$ 106,270$
Liabilities: Accounts payable . . . . . . . . . . . . . . . . . . 64,450$ -$ 18,442$ 46,008$ Due to other governments . . . . . . . . . . . . . . - 72,866 12,604 60,262 Total liabilities. . . . . . . . . . . . . . . . . . . . . 64,450$ 72,866$ 31,046$ 106,270$
Butler Township-Dayton JEDDAssets: Equity in pooled cash and cash equivalents. . . . . . 4,490$ 11,633$ 357$ 15,766$ Accounts receivable. . . . . . . . . . . . . . . . . . 1,636 - 1,636 - Total assets. . . . . . . . . . . . . . . . . . . . . . . 6,126$ 11,633$ 1,993$ 15,766$
Liabilities: Accounts payable . . . . . . . . . . . . . . . . . . 6,126$ -$ 610$ 5,516$ Due to other governments . . . . . . . . . . . . . . - 11,633 1,383 10,250 Total liabilities. . . . . . . . . . . . . . . . . . . . . 6,126$ 11,633$ 1,993$ 15,766$
Emery Assets: Investments with fiscal agent. . . . . . . . . . . 3,386,939$ 1,623$ 275$ 3,388,287$ Total assets. . . . . . . . . . . . . . . . . . . . . . . 3,386,939$ 1,623$ 275$ 3,388,287$
Liabilities: Due to others. . . . . . . . . . . . . . . . . . . . 3,386,939$ 1,623$ 275$ 3,388,287$ Total liabilities. . . . . . . . . . . . . . . . . . . . . 3,386,939$ 1,623$ 275$ 3,388,287$
Municipal CourtsAssets: Cash and cash equivalents with fiscal agents . . . . . 1,067,339$ 761,040$ 1,067,339$ 761,040$ Total assets. . . . . . . . . . . . . . . . . . . . . . . 1,067,339$ 761,040$ 1,067,339$ 761,040$
Liabilities: Due to other governments . . . . . . . . . . . . . . 654,539$ 346,984$ 654,539$ 346,984$ Due to others. . . . . . . . . . . . . . . . . . . . . 412,800 414,056 412,800 414,056 Total liabilities. . . . . . . . . . . . . . . . . . . . . 1,067,339$ 761,040$ 1,067,339$ 761,040$
- - Continued
COMBINING STATEMENT OF CHANGES IN ASSETS AND LIABILITIESAGENCY FUNDS (CONTINUED)
FOR THE YEAR ENDED DECEMBER 31, 2009
CITY OF DAYTON, OHIO
F 129

Balance Balance12/31/08 Additions Deductions 12/31/09
Executive SeveranceAssets: Investments with fiscal agents . . . . . . . . . . . . 959,405$ 162,338$ 293,836$ 827,907$ Total assets. . . . . . . . . . . . . . . . . . . . . . . 959,405$ 162,338$ 293,836$ 827,907$
Liabilities: Withholdings and deposits. . . . . . . . . . . . . . 959,405$ 162,338$ 293,836$ 827,907$ Total liabilities. . . . . . . . . . . . . . . . . . . . . 959,405$ 162,338$ 293,836$ 827,907$
Total Agency FundsAssets: Equity in pooled cash and cash equivalents. . . . . . 5,042,786$ 1,503,040$ 1,133,926$ 5,411,900$ Cash and cash equivalents with fiscal agents . . . . . 1,067,339 761,040 1,067,339 761,040 Investments with fiscal agents . . . . . . . . . . . . 4,346,344 163,961 294,111 4,216,194 Accounts receivable. . . . . . . . . . . . . . . . . . 326,554 18,009 19,879 324,684 Total assets. . . . . . . . . . . . . . . . . . . . . . . 10,783,023$ 2,446,050$ 2,515,255$ 10,713,818$
Liabilities: Accounts payable . . . . . . . . . . . . . . . . . . 85,928$ 2,950$ 33,473$ 55,405$ Due to other governments . . . . . . . . . . . . . . 2,263,051 1,180,724 1,711,056 1,732,719 Due to others. . . . . . . . . . . . . . . . . . . . . 3,802,539 415,679 413,075 3,805,143 Withholdings and deposits. . . . . . . . . . . . . . 4,631,505 846,697 357,651 5,120,551 Total liabilities. . . . . . . . . . . . . . . . . . . . . 10,783,023$ 2,446,050$ 2,515,255$ 10,713,818$
FOR THE YEAR ENDED DECEMBER 31, 2009
CITY OF DAYTON, OHIO
COMBINING STATEMENT OF CHANGES IN ASSETS AND LIABILITIESAGENCY FUNDS (CONTINUED)
F 130

The Building is Newcom’s Tavern which is the fi rst offi cial building in Dayton. It served as the courthouse, jail, general store as well as a tavern.
Dayton is home to 60 parks and has over 1374 acres of green space for citizens to enjoy. This is the original Newcom’s Tavern now located and perserved in Caroillon Park. The structure was moved in 1965 and can be toured.
STA
TIS
TIC
AL

THIS PAGE IS INTENTIONALLY LEFT BLANK

FISCAL CAPACITY OF THE CITY
STATISTICAL SECTION
THE FOLLOWING UNAUDITED STATISTICAL TABLESREFLECT SOCIAL AND ECONOMIC DATA, FINANCIAL TRENDS AND
S 1

THIS PAGE IS INTENTIONALLY LEFT BLANK
S 2

Contents Page
Financial Trends
S 4 - S 13
Revenue Capacity
S 14 - S 21
Debt Capacity
S 22 - S 30
Demographic and Economic Information
S 31 - S 42
Operating Information
S 43
Sources: Sources are noted on the individual schedules. The City implemented GASB Statement 34 in 2002; schedules presenting government-wide information include information beginning in that year.
These schedules contain information to help the reader assess the City's most significant local revenue source, the income tax,property tax and special assessments.
These schedules present information to help the reader assess the affordability of the City's current levels of outstanding debt andthe City's ability to issue additional debt in the future.
This part of the City of Dayton's Comprehensive Annual Financial Report presents detailed information as a context for understanding what theinformation in the financial statements, note disclosures, and required supplementary information says about the City's overall financial health.
This schedule contain service and infrastructure data to help the reader understand how the information in the City's financialreport relates to the services the City provides and the activities it performs.
CITY OF DAYTON, OHIO
STATISTICAL SECTION
These schedules contain trend information to help the reader understand how the City's financial performance and well-being havechanged over time.
These schedules offer demographic and economic indicators to help the reader understand the environment within which the City'sfinancial activities take place.
S 3

2002 2003 2004 2005Governmental activities Invested in capital assets, net of related debt 184,561,144$ 188,610,596$ 207,581,135$ 228,383,145$ Restricted 60,703,404 53,916,504 63,442,672 65,403,080 Unrestricted 44,138,216 61,754,770 49,507,627 44,629,417
Total governemental activities net assets 289,402,764$ 304,281,870$ 320,531,434$ 338,415,642$
Business-type activities Invested in capital assets, net of related debt 294,822,094$ 293,481,592$ 309,060,125$ 328,655,724$ Restricted 9,685 - - - Unrestricted 137,726,433 153,425,794 127,133,397 129,939,569
Total business-type activities net assets 432,558,212$ 446,907,386$ 436,193,522$ 458,595,293$
Primary government Invested in capital assets, net of related debt 479,383,238$ 482,092,188$ 516,641,260$ 557,038,869$ Restricted 60,713,089 53,916,504 63,442,672 65,403,080 Unrestricted 181,864,649 215,180,564 176,641,024 174,568,986
Total primary government net assets 721,960,976$ 751,189,256$ 756,724,956$ 797,010,935$
Source: City of Dayton financial records
(1) Amounts have been restated from prior year's CAFR.
Note: 2002 was the first year the City implemented GASB Statement No. 34, so comparative information before that date is not available.
CITY OF DAYTON, OHIO
NET ASSETS BY COMPONENTLAST EIGHT FISCAL YEARS
(ACCRUAL BASIS OF ACCOUNTING)
S 4

2006 2007 (1) 2008 (1) 2009
242,926,214$ 271,643,144$ 282,480,043$ 304,910,802$ 71,779,813 60,595,698 96,325,940 91,563,337 43,854,526 43,818,871 16,945,325 10,040,732
358,560,553$ 376,057,713$ 395,751,308$ 406,514,871$
346,386,163$ 380,238,011$ 389,630,233$ 401,965,547$ - - - -
136,579,525 127,953,698 144,931,193 144,144,446
482,965,688$ 508,191,709$ 534,561,426$ 546,109,993$
589,312,377$ 651,881,155$ 672,110,276$ 706,876,349$ 71,779,813 60,595,698 96,325,940 91,563,337
180,434,051 171,772,569 161,876,518 154,185,178
841,526,241$ 884,249,422$ 930,312,734$ 952,624,864$
S 5

2002 2003 2004 2005ExpensesGovernmental activities: Downtown 5,673,050$ 5,418,423$ 5,031,993$ 5,064,225$ Youth, education and human services 1,493,693 2,535,385 2,208,479 2,070,638 Community development and neighbors 2,634,232 21,769,149 20,163,040 20,037,194 Economic development 24,275,989 10,494,459 6,411,508 7,162,137 Leadership and quality of life 44,353,088 45,111,428 45,891,870 46,407,089 Corporate responsibility 17,075,875 17,020,585 15,950,738 16,907,149 Public safety and justice 102,284,144 89,976,989 92,954,582 94,599,294 Other 1,765,310 986,660 507,896 2,547,338 Interest and fiscal charges 4,449,764 3,430,708 3,944,038 3,072,035
Total governmental activities expenses 204,005,145 196,743,786 193,064,144 197,867,099
Business type activities: Dayton International Airport 35,815,035 35,502,289 39,961,191 40,802,335 Water 44,439,722 45,628,781 47,152,642 44,674,367 Sewer 28,256,027 27,210,776 28,903,051 28,319,647 Golf 3,527,006 3,118,857 2,472,685 2,536,878 Storm Water 3,440,565 2,636,386 3,983,545 4,933,239
Total business-type activities expenses 115,478,355 114,097,089 122,473,114 121,266,466
Total primary government expenses 319,483,500$ 310,840,875$ 315,537,258$ 319,133,565$
Program RevenuesGovernmental activities: Charges for services: Downtown 644,660$ 459,014$ 504,472$ 517,512$ Youth, education and human services 186,360 26,724 29,987 20,593 Community development and neighbors 85,178 2,284,484 1,762,861 1,942,351 Economic development 2,341,364 3,074,605 1,689,779 2,092,562 Leadership and quality of life 7,251,167 5,791,514 6,769,017 5,693,276 Corporate responsibility 2,271,381 2,213,081 2,203,013 2,310,305 Public safety and justice 17,749,728 15,655,803 15,049,321 16,737,568 Other 279,748 93,175 51,096 573,462 Interest and fiscal charges 814,194 504,180 463,975 - Operating grants and contributions 17,265,398 19,791,048 18,789,989 17,571,173 Capital grants and contributions 7,726,360 10,307,490 9,604,411 12,149,725
Total governmental activities program revenue 56,615,538 60,201,118 56,917,921 59,608,527
Business type activities: Charges for services: Dayton International Airport 30,274,531 42,239,421 42,943,773 40,174,905 Water 42,368,104 42,441,461 37,709,426 43,578,504 Sewer 40,681,646 26,666,859 28,143,643 27,796,918 Golf 3,144,663 2,951,887 4,273,982 2,931,243 Storm Water 2,641,653 2,583,042 2,785,709 6,698,328 Operating grants and contributions 250,717 - - - Capital grants and contributions 19,157,629 14,845,098 14,794,084 18,926,901
Total business-type activities program revenue 138,518,943 131,727,768 130,650,617 140,106,799
Total primary government program revenue 195,134,481$ 191,928,886$ 187,568,538$ 199,715,326$
CITY OF DAYTON, OHIO
CHANGES IN NET ASSETSLAST EIGHT FISCAL YEARS
(ACCRUAL BASIS OF ACCOUNTING)
S 6

2006 2007 2008 2009
4,978,385$ 5,666,737$ 5,570,112$ 5,182,850$ 1,886,238 2,408,097 2,583,667 2,264,862
20,050,274 21,459,480 21,460,067 21,342,171 9,348,825 15,999,955 9,810,580 14,263,940
43,411,252 43,224,368 48,563,961 47,091,889 20,544,073 17,892,823 17,442,665 17,707,683 98,533,695 101,277,697 101,533,014 95,706,450
1,105,280 1,378,197 683,122 - 3,043,887 2,904,913 4,849,682 3,620,502
202,901,909 212,212,267 212,496,870 207,180,347
39,032,293 41,813,989 31,958,820 40,310,513 45,200,207 45,401,676 45,811,605 45,672,640 32,375,482 30,889,719 30,855,192 31,994,865
3,121,707 3,322,911 3,196,937 3,281,384 4,491,851 5,030,425 5,090,241 5,401,928
124,221,540 126,458,720 116,912,795 126,661,330
327,123,449$ 338,670,987$ 329,409,665$ 333,841,677$
505,552$ 704,984$ 570,059$ 588,229$ 17,994 19,333 40,322 7,618
2,204,445 3,000,683 2,313,335 2,289,894 1,179,367 1,328,746 1,161,369 1,438,105 4,380,757 4,251,275 5,128,446 4,411,912 2,169,808 2,533,128 2,341,620 2,853,032
16,911,515 17,363,610 17,328,246 17,398,578 979,787 1,129,885 27,277 -
- - - - 16,701,482 19,245,962 20,423,979 24,147,823 11,253,574 15,536,992 13,489,575 25,771,047
56,304,281 65,114,598 62,824,228 78,906,238
41,820,112 39,311,221 31,067,418 30,655,950 47,088,482 50,944,369 48,944,620 47,743,750 32,379,198 31,322,099 30,398,157 30,998,739
3,295,321 3,353,732 3,291,376 3,250,241 4,898,132 6,663,178 6,688,476 7,083,455
- - - - 15,408,247 15,058,562 21,316,626 17,098,233
144,889,492 146,653,161 141,706,673 136,830,368
201,193,773$ 211,767,759$ 204,530,901$ 215,736,606$ -- Continued
S 7

2002 2003 2004 2005Net (Expense)/RevenueGovernmental activities (147,389,607)$ (136,542,668)$ (136,146,223)$ (138,258,572)$ Business-type activities 23,040,588 17,630,679 8,177,503 18,840,333
Total primary government net expense (124,349,019)$ (118,911,989)$ (127,968,720)$ (119,418,239)$
General Revenues and Other Changes in Net AssetsGovernmental activities: Property taxes 17,888,114$ 18,641,542$ 19,496,591$ 20,719,101$ Income taxes 106,710,540 108,520,891 108,438,846 112,169,475 Grants and entitlements 27,039,019 19,081,383 20,377,849 18,276,100 Investment earnings - 3,579,657 1,706,199 3,383,886 Miscellaneous 3,376,292 2,952,997 1,984,048 3,644,141 Transfers (801,514) (913,666) - -
Total governmental activities general revenues 154,212,451 151,862,804 152,003,533 158,192,703
Special ItemGain on sale of capital assets 25,646 - 781,586 -
Total general revenues and special items 154,238,097 151,862,804 152,785,119 158,192,703
Business type activities: Investment earnings 3,679,757 3,604,829 1,032,922 1,537,561 Miscellaneous 10,300 - - - Gain on sale of capital assets 21,489 - - - Transfers 801,514 913,666 - -
Total business-type activities 4,513,060 4,518,495 1,032,922 1,537,561 Total primary government 158,751,157$ 156,381,299$ 153,818,041$ 159,730,264$
Changes in Net AssetsGovernmental activities 6,848,490$ 15,320,136$ 16,638,896$ 19,934,131$ Business-type activities 27,553,648 22,149,174 9,210,425 20,377,894
Total primary government 34,402,138$ 37,469,310$ 25,849,321$ 40,312,025$
Source: City of Dayton financial records
Note: 2002 was the first year the City implemented GASB Statement No. 34, so comparative information before that date is not available.
(ACCRUAL BASIS OF ACCOUNTING)
CITY OF DAYTON, OHIO
CHANGES IN NET ASSETSLAST EIGHT FISCAL YEARS
(CONTINUED)
S 8
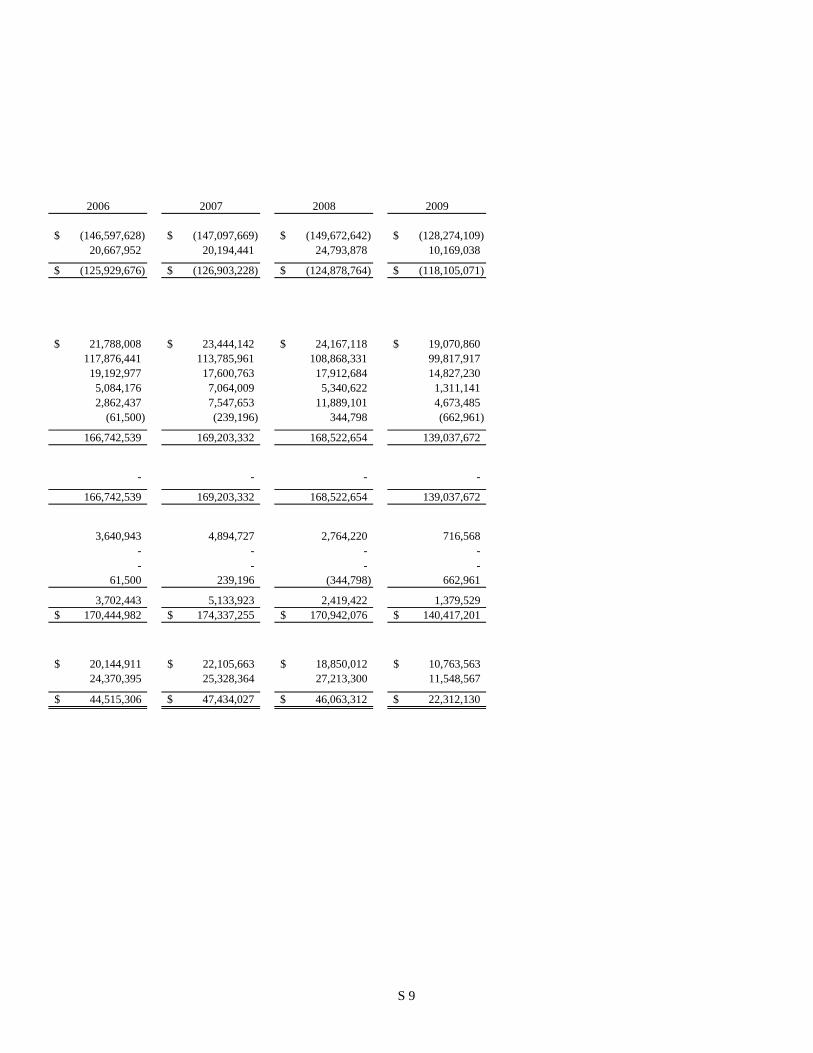
2006 2007 2008 2009
(146,597,628)$ (147,097,669)$ (149,672,642)$ (128,274,109)$ 20,667,952 20,194,441 24,793,878 10,169,038
(125,929,676)$ (126,903,228)$ (124,878,764)$ (118,105,071)$
21,788,008$ 23,444,142$ 24,167,118$ 19,070,860$ 117,876,441 113,785,961 108,868,331 99,817,917
19,192,977 17,600,763 17,912,684 14,827,230 5,084,176 7,064,009 5,340,622 1,311,141 2,862,437 7,547,653 11,889,101 4,673,485
(61,500) (239,196) 344,798 (662,961)
166,742,539 169,203,332 168,522,654 139,037,672
- - - -
166,742,539 169,203,332 168,522,654 139,037,672
3,640,943 4,894,727 2,764,220 716,568 - - - - - - - -
61,500 239,196 (344,798) 662,961
3,702,443 5,133,923 2,419,422 1,379,529 170,444,982$ 174,337,255$ 170,942,076$ 140,417,201$
20,144,911$ 22,105,663$ 18,850,012$ 10,763,563$ 24,370,395 25,328,364 27,213,300 11,548,567
44,515,306$ 47,434,027$ 46,063,312$ 22,312,130$
S 9
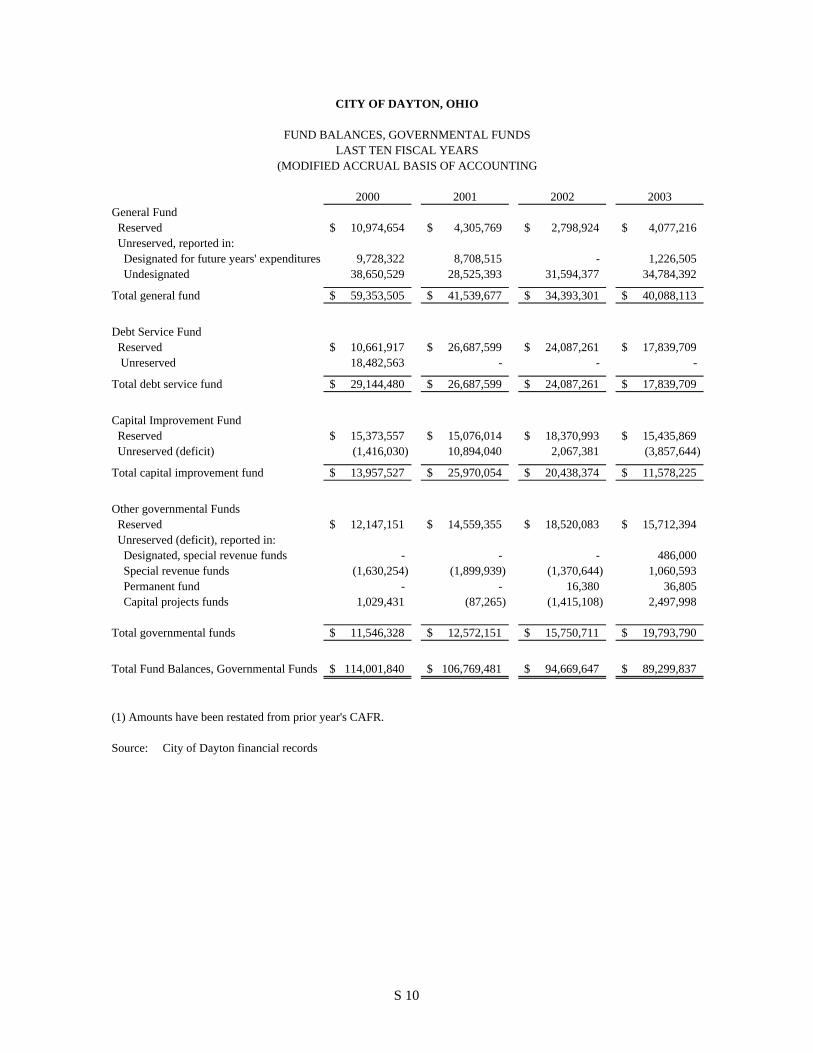
2000 2001 2002 2003General Fund Reserved 10,974,654$ 4,305,769$ 2,798,924$ 4,077,216$ Unreserved, reported in: Designated for future years' expenditures 9,728,322 8,708,515 - 1,226,505 Undesignated 38,650,529 28,525,393 31,594,377 34,784,392
Total general fund 59,353,505$ 41,539,677$ 34,393,301$ 40,088,113$
Debt Service Fund Reserved 10,661,917$ 26,687,599$ 24,087,261$ 17,839,709$ Unreserved 18,482,563 - - -
Total debt service fund 29,144,480$ 26,687,599$ 24,087,261$ 17,839,709$
Capital Improvement Fund Reserved 15,373,557$ 15,076,014$ 18,370,993$ 15,435,869$ Unreserved (deficit) (1,416,030) 10,894,040 2,067,381 (3,857,644)
Total capital improvement fund 13,957,527$ 25,970,054$ 20,438,374$ 11,578,225$
Other governmental Funds Reserved 12,147,151$ 14,559,355$ 18,520,083$ 15,712,394$ Unreserved (deficit), reported in: Designated, special revenue funds - - - 486,000 Special revenue funds (1,630,254) (1,899,939) (1,370,644) 1,060,593 Permanent fund - - 16,380 36,805 Capital projects funds 1,029,431 (87,265) (1,415,108) 2,497,998
Total governmental funds 11,546,328$ 12,572,151$ 15,750,711$ 19,793,790$
Total Fund Balances, Governmental Funds 114,001,840$ 106,769,481$ 94,669,647$ 89,299,837$
(1) Amounts have been restated from prior year's CAFR.
Source: City of Dayton financial records
CITY OF DAYTON, OHIO
FUND BALANCES, GOVERNMENTAL FUNDS
(MODIFIED ACCRUAL BASIS OF ACCOUNTINGLAST TEN FISCAL YEARS
S 10

2004 2005 2006 2007 (1) 2008 (1) 2009
4,451,193$ 4,846,464$ 2,985,745$ 3,646,545$ 2,418,755$ 3,571,816$
2,161,198 3,573,236 6,949,009 8,284,213 10,172,634 6,585,539 29,795,216 36,132,638 27,407,200 30,035,615 31,002,915 25,681,059
36,407,607$ 44,552,338$ 37,341,954$ 41,966,373$ 43,594,304$ 35,838,414$
15,333,393$ 13,298,438$ 15,080,926$ 18,676,879$ 43,092,546$ 42,188,046$ - - - - - -
15,333,393$ 13,298,438$ 15,080,926$ 18,676,879$ 43,092,546$ 42,188,046$
23,208,822$ 14,836,284$ 22,459,015$ 30,413,308$ 27,221,279$ 26,133,688$ 916,028 2,013,719 1,797,815 (12,394,589) (10,819,429) (21,142,062)
24,124,850$ 16,850,003$ 24,256,830$ 18,018,719$ 16,401,850$ 4,991,626$
12,711,217$ 20,867,328$ 19,535,089$ 19,934,678$ 21,146,364$ 31,717,252$
400,000 - 1,253,000 1,146,380 1,116,000 398,848 4,402,528 184,630 1,124,470 2,910,665 (416,332) (8,675,221)
53,439 58,896 67,805 79,836 60,413 76,302 739,531 (4,384,639) (1,480,796) - - -
18,306,715$ 16,726,215$ 20,499,568$ 24,071,559$ 21,906,445$ 23,517,181$
94,172,565$ 91,426,994$ 97,179,278$ 102,733,530$ 124,995,145$ 106,535,267$
S 11

2000 2001 2002 2003Revenues (1)Taxes 153,386,497$ 148,602,604$ 145,251,212$ 147,286,520$ Charges for services 22,313,071 21,660,189 23,813,556 22,262,759 Licenses and permits 2,083,365 2,039,503 1,980,844 2,120,143 Fines and forfeits 1,754,313 2,454,517 2,249,333 2,083,662 Intergovernmental 29,212,950 26,512,452 24,096,216 28,609,999 Special assessments 272,107 569,983 693,360 1,033,045 Investment income 9,810,194 7,086,378 3,332,301 3,623,500 Increase (decrease) in FMV of investments - - - - Other 4,598,578 8,607,756 8,319,580 5,756,600 Total revenues 223,431,075 217,533,382 209,736,402 212,776,228
Expenditures (1)Current: Downtown 4,869,311 5,021,369 4,807,733 3,747,343 Youth, education and human services 1,301,481 1,436,191 1,506,653 2,531,763 Community development and neighborhoods 3,281,232 2,331,172 2,468,203 20,353,743 Economic development 21,838,458 23,658,978 24,328,537 6,996,268 Leadership and quality life 43,581,245 37,964,500 39,442,705 37,705,241 Corporate responsibility 20,761,269 22,350,461 15,813,881 16,035,551 Public safety and justice 96,185,438 101,900,533 100,912,458 90,354,455 Other - 373,382 1,747,482 918,216 Capital outlay 24,523,977 45,292,081 22,165,044 29,742,434 Debt service: Principal retirement 4,926,770 6,524,068 6,198,173 7,350,552 Interest and fiscal charges 3,746,724 4,333,281 4,317,835 3,430,374 Bond issuance costs - 356,193 - - Total expenditures 225,015,905 251,542,209 223,708,704 219,165,940 Excess(deficiency) of revenues over expenditures (1,584,830) (34,008,827) (13,972,302) (6,389,712)
Other Financing Sources (Uses)Sale of capital assets 18,449 29,388 - 150,000 Transfers in 26,563,590 32,893,734 9,119,979 17,092,990 Transfers out (26,564,490) (33,549,534) (7,755,533) (16,730,663) Bonds issued 305,495 24,911,873 1,568,387 395,485 Discount on bonds issued - - - - Proceeds of loans - - - - Payment of refunded bond escrow agent - - - - Premium on bond issuance - 17,377 - - Capital lease transactions - - - 112,090 Total other financing sources (uses) 323,044 24,302,838 2,932,833 1,019,902
Net change in fund balance (1,261,786)$ (9,705,989)$ (11,039,469)$ (5,369,810)$
Capital expenditures 21,747,242$ 21,670,947$ 22,024,697$ 21,536,097$
Debt service as a percentage of noncapital expenditures 4.46% 5.13% 5.50% 5.77%
(1) For 2002, the City of Dayton changed accounting procedures to GASB 34 and included all governmental activities.Source: City of Dayton financial records
CITY OF DAYTON, OHIO
CHANGES IN FUND BALANCES, GOVERNMENTAL FUNDSLAST TEN FISCAL YEARS
(MODIFIED ACCRUAL BASIS OF ACCOUNTING)
S 12

2004 2005 2006 2007 2008 2009
149,926,379$ 154,210,979$ 159,082,912$ 157,223,154$ 152,514,608$ 139,011,038$ 20,295,875 22,898,740 22,083,074 24,051,832 23,926,449 25,037,733 1,817,222 1,903,063 1,750,262 1,861,236 1,817,153 1,630,319 1,832,710 1,944,186 3,450,859 2,044,271 2,908,861 2,106,189
25,333,452 17,329,078 28,044,012 31,643,646 25,707,748 39,699,451 1,034,415 652,363 1,076,163 505,670 546,047 422,608 2,288,903 3,483,518 5,131,388 7,393,303 4,286,751 2,927,657
- - - - 599,485 (1,085,864) 4,767,369 6,554,510 2,862,437 7,547,653 11,889,101 4,648,485
207,296,325 208,976,437 223,481,107 232,270,765 224,196,203 214,397,616
4,167,407 4,093,181 4,183,009 4,651,014 4,604,197 4,143,788 2,237,230 2,060,357 1,928,205 2,420,958 2,581,447 2,280,237
20,311,675 19,230,564 18,959,062 21,016,004 20,981,602 22,259,601 6,410,373 7,049,497 9,464,377 15,082,881 11,191,284 15,047,900
41,319,775 40,423,448 37,073,237 36,925,472 41,676,303 40,991,411 14,870,289 15,423,671 19,489,965 16,597,674 16,401,770 17,125,159 92,673,272 92,422,480 97,403,724 98,432,234 100,009,551 95,240,850
506,890 2,544,612 1,107,606 1,377,348 685,888 - 23,346,465 22,818,819 17,501,729 28,529,727 24,852,628 34,908,638
9,228,813 5,774,552 7,480,101 5,789,851 6,652,464 8,047,222 3,962,946 3,097,330 3,076,308 2,884,154 4,707,848 3,557,790
199,535 - - 312,327 598,836 586,476 219,234,670 214,938,511 217,667,323 234,019,644 234,943,818 244,189,072
(11,938,345) (5,962,074) 5,813,784 (1,748,879) (10,747,615) (29,791,456)
824,849 101,600 100,000 - - - 15,249,526 16,692,371 21,682,063 13,418,525 9,831,205 11,818,503
(15,349,526) (16,732,871) (21,843,563) (13,757,721) (9,556,407) (12,678,413) 11,731,021 - - 19,745,000 32,000,000 34,408,111
- - - - (348,901) - - - - - 239,750 - - - - (10,383,734) - (22,528,097)
244,535 - - 491,061 - 311,474 4,500,000 205,326 - - - -
17,200,405 266,426 (61,500) 9,513,131 32,165,647 11,331,578
5,262,060$ (5,695,648)$ 5,752,284$ 7,764,252$ 21,418,032$ (18,459,878)$
24,327,555$ 21,930,329$ 17,332,478$ 27,702,620$ 24,555,847$ 39,799,258$
7.38% 4.82% 5.56% 4.55% 6.03% 6.34%
S 13
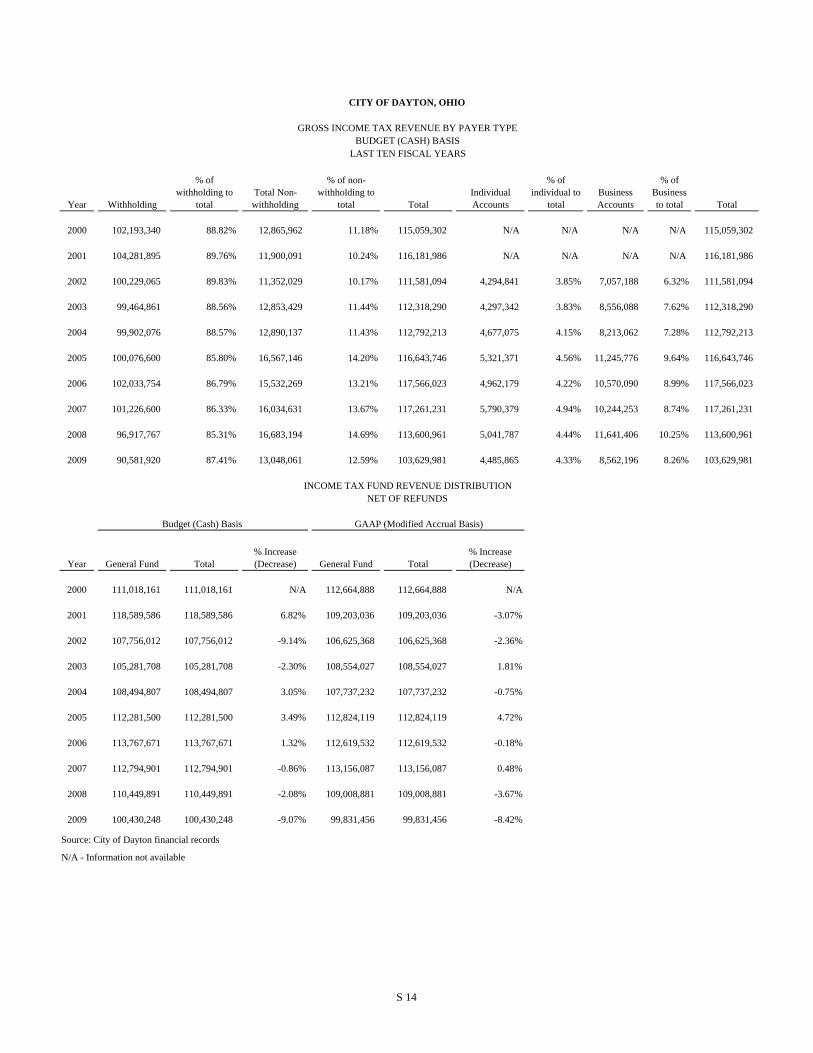
Year Withholding
% of withholding to
total Total Non-withholding
% of non-withholding to
total TotalIndividual Accounts
% of individual to
totalBusiness Accounts
% of Business to total Total
2000 102,193,340 88.82% 12,865,962 11.18% 115,059,302 N/A N/A N/A N/A 115,059,302
2001 104,281,895 89.76% 11,900,091 10.24% 116,181,986 N/A N/A N/A N/A 116,181,986
2002 100,229,065 89.83% 11,352,029 10.17% 111,581,094 4,294,841 3.85% 7,057,188 6.32% 111,581,094
2003 99,464,861 88.56% 12,853,429 11.44% 112,318,290 4,297,342 3.83% 8,556,088 7.62% 112,318,290
2004 99,902,076 88.57% 12,890,137 11.43% 112,792,213 4,677,075 4.15% 8,213,062 7.28% 112,792,213
2005 100,076,600 85.80% 16,567,146 14.20% 116,643,746 5,321,371 4.56% 11,245,776 9.64% 116,643,746
2006 102,033,754 86.79% 15,532,269 13.21% 117,566,023 4,962,179 4.22% 10,570,090 8.99% 117,566,023
2007 101,226,600 86.33% 16,034,631 13.67% 117,261,231 5,790,379 4.94% 10,244,253 8.74% 117,261,231
2008 96,917,767 85.31% 16,683,194 14.69% 113,600,961 5,041,787 4.44% 11,641,406 10.25% 113,600,961
2009 90,581,920 87.41% 13,048,061 12.59% 103,629,981 4,485,865 4.33% 8,562,196 8.26% 103,629,981
Year General Fund Total % Increase (Decrease) General Fund Total
% Increase (Decrease)
2000 111,018,161 111,018,161 N/A 112,664,888 112,664,888 N/A
2001 118,589,586 118,589,586 6.82% 109,203,036 109,203,036 -3.07%
2002 107,756,012 107,756,012 -9.14% 106,625,368 106,625,368 -2.36%
2003 105,281,708 105,281,708 -2.30% 108,554,027 108,554,027 1.81%
2004 108,494,807 108,494,807 3.05% 107,737,232 107,737,232 -0.75%
2005 112,281,500 112,281,500 3.49% 112,824,119 112,824,119 4.72%
2006 113,767,671 113,767,671 1.32% 112,619,532 112,619,532 -0.18%
2007 112,794,901 112,794,901 -0.86% 113,156,087 113,156,087 0.48%
2008 110,449,891 110,449,891 -2.08% 109,008,881 109,008,881 -3.67%
2009 100,430,248 100,430,248 -9.07% 99,831,456 99,831,456 -8.42%
Source: City of Dayton financial records
N/A - Information not available
CITY OF DAYTON, OHIO
BUDGET (CASH) BASISLAST TEN FISCAL YEARS
GAAP (Modified Accrual Basis)
NET OF REFUNDS
Budget (Cash) Basis
GROSS INCOME TAX REVENUE BY PAYER TYPE
INCOME TAX FUND REVENUE DISTRIBUTION
S 14

Fiscal year Total tax levy
Current tax collections
Percent of levy collected
Delinquent tax
collectionsTotal tax
collections
Percent of total tax
collections to tax levy
Outstanding delinquent
taxes
Percent of outstanding delinquent taxes to tax
levy
2000 18,747,632 17,953,577 95.76% 1,028,171 18,981,748 101.25% 4,089,228 21.81%
2001 18,861,580 18,027,699 95.58% 1,121,799 19,149,498 101.53% 3,458,115 18.33%
2002 19,075,592 17,815,051 93.39% 1,327,331 19,142,382 100.35% 4,765,605 24.98%
2003 21,142,675 19,212,789 90.87% 1,265,481 20,478,270 96.86% 4,956,875 23.44%
2004 21,129,504 19,921,141 94.28% 1,441,368 21,362,509 101.10% 4,921,388 23.29%
2005 20,559,068 19,464,064 94.67% 2,004,760 21,468,824 104.43% 3,621,335 17.61%
2006 22,098,556 20,809,488 94.17% 2,343,469 23,152,957 104.77% 2,526,394 11.43%
2007 20,334,804 19,544,381 96.11% 1,998,653 21,543,034 105.94% 3,390,837 16.68%
2008 19,483,451 17,932,392 92.04% 1,661,231 19,593,623 100.57% 5,911,972 30.34%
2009 18,205,975 17,052,225 93.66% 1,195,497 18,247,722 100.23% 4,700,112 25.82%
Source: County Auditor; Montgomery County, Ohio
Montgomery County
CITY OF DAYTON, OHIO
PROPERTY TAX LEVIES AND COLLECTIONSLAST TEN FISCAL YEARS
S 15
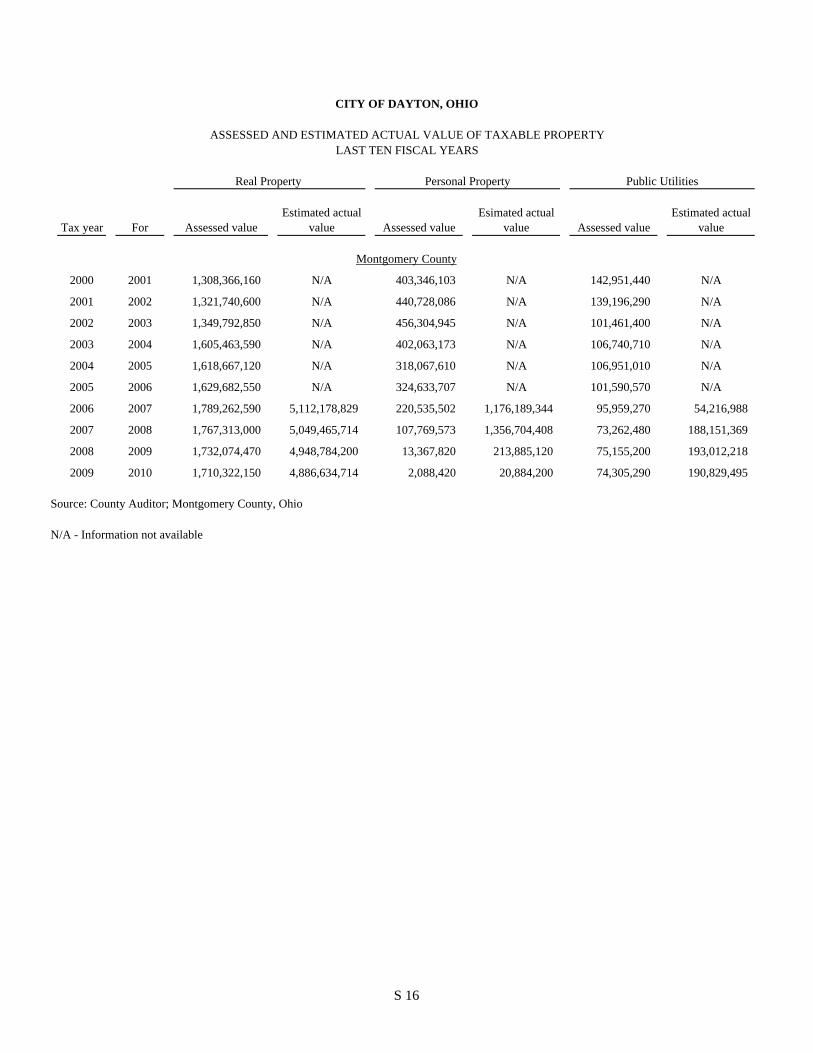
Tax year For Assessed valueEstimated actual
value Assessed valueEsimated actual
value Assessed valueEstimated actual
value
2000 2001 1,308,366,160 N/A 403,346,103 N/A 142,951,440 N/A
2001 2002 1,321,740,600 N/A 440,728,086 N/A 139,196,290 N/A
2002 2003 1,349,792,850 N/A 456,304,945 N/A 101,461,400 N/A
2003 2004 1,605,463,590 N/A 402,063,173 N/A 106,740,710 N/A
2004 2005 1,618,667,120 N/A 318,067,610 N/A 106,951,010 N/A
2005 2006 1,629,682,550 N/A 324,633,707 N/A 101,590,570 N/A
2006 2007 1,789,262,590 5,112,178,829 220,535,502 1,176,189,344 95,959,270 54,216,988
2007 2008 1,767,313,000 5,049,465,714 107,769,573 1,356,704,408 73,262,480 188,151,369
2008 2009 1,732,074,470 4,948,784,200 13,367,820 213,885,120 75,155,200 193,012,218
2009 2010 1,710,322,150 4,886,634,714 2,088,420 20,884,200 74,305,290 190,829,495
Source: County Auditor; Montgomery County, Ohio
N/A - Information not available
Montgomery County
Real Property Personal Property Public Utilities
CITY OF DAYTON, OHIO
ASSESSED AND ESTIMATED ACTUAL VALUE OF TAXABLE PROPERTYLAST TEN FISCAL YEARS
S 16

Percent of total assessed
Assessed valueTotal direct tax
rateEsimated actual
valueto total estimated
actual value
1,854,663,703$ 10.00 5,161,385,240$ 35.93%
1,901,664,976 10.00 5,799,921,138 32.79%
1,907,559,195 10.00 5,897,206,567 32.35%
2,114,267,473 10.00 5,797,067,825 36.47%
2,043,685,740 10.00 6,269,282,241 32.60%
2,055,906,827 10.00 6,171,703,279 33.31%
2,105,757,362 10.00 6,125,085,429 34.38%
1,948,345,053 10.00 6,594,321,491 29.55%
1,820,597,490 10.00 5,355,681,538 33.99%
1,786,715,860 10.00 5,098,348,409 35.04%
Total
S 17

Fiscal YearDebt Service
FundJudgement Trust Fund
Street Maintenance
Fund Total
Capital Improvement
FundDebt Service
Fund General Total
2000 for 2001 0.15 0.50 0.85 1.50 - 3.50 5.00 8.50
2001 for 2002 0.15 - 1.35 1.50 - 3.50 5.00 8.50
2002 for 2003 0.15 - 1.35 1.50 - 3.50 5.00 8.50
2003 for 2004 0.15 - 1.35 1.50 1.70 1.80 5.00 8.50
2004 for 2005 1.17 - 0.33 1.50 - 3.50 5.00 8.50
2005 for 2006 1.17 - 0.33 1.50 - 3.50 5.00 8.50
2006 for 2007 0.40 - - 0.40 - 4.60 5.00 9.60
2007 for 2008 0.40 - - 0.40 - 4.60 5.00 9.60
2008 for 2009 0.40 - - 0.40 - 4.60 5.00 9.60
2009 for 2010 0.40 - - 0.40 - 4.60 5.00 9.60
Source: County Auditor; Montgomery County, Ohio
Montgomery County
(1) The Ohio Constitution places a ten-mill limitation upon the combined property tax levied by the County, the SchoolDistrict, and the City. The City has been permitted to levy only 1.5 mills of that ten-mill limitation. The Constitutionpermits the City to levy additional millage beyond 1.5 mills upon approval of the electorate. The City Charter also has aten-mill limitation which prohibits the City from levying a total tax rate for all purposes in excess of ten mills. As a resultof the passage of a Charter amendment, the City has been levying an additional 8.5 mills above the 1.5 mills. Thisadditional millage has resulted in a total property tax rate of ten mill for the City, the maximum permitted by the CityCharter.
By November 6, 1945 Charter AmendmentDirect 10 Mill Limitation (By Ohio Constitution)
CITY OF DAYTON, OHIO
PROPERTY TAX RATES - DIRECT AND OVERLAPPING GOVERNMENTS
LAST TEN FISCAL YEARS(PER $1,000 OF ASSESSED VALUATION)
S 18

City of Dayton
Grand Total
Dayton City School District
Montgomery County
Montgomery County Public Library
10.00 62.65 16.64 0.26
10.00 62.65 16.64 0.26
10.00 70.85 16.64 0.26
10.00 70.85 17.24 0.26
10.00 70.85 18.24 0.26
10.00 70.85 18.24 0.26
10.00 70.85 18.24 1.25
10.00 70.85 20.25 1.25
10.00 75.75 20.94 1.25
10.00 75.75 20.94 1.75
S 19
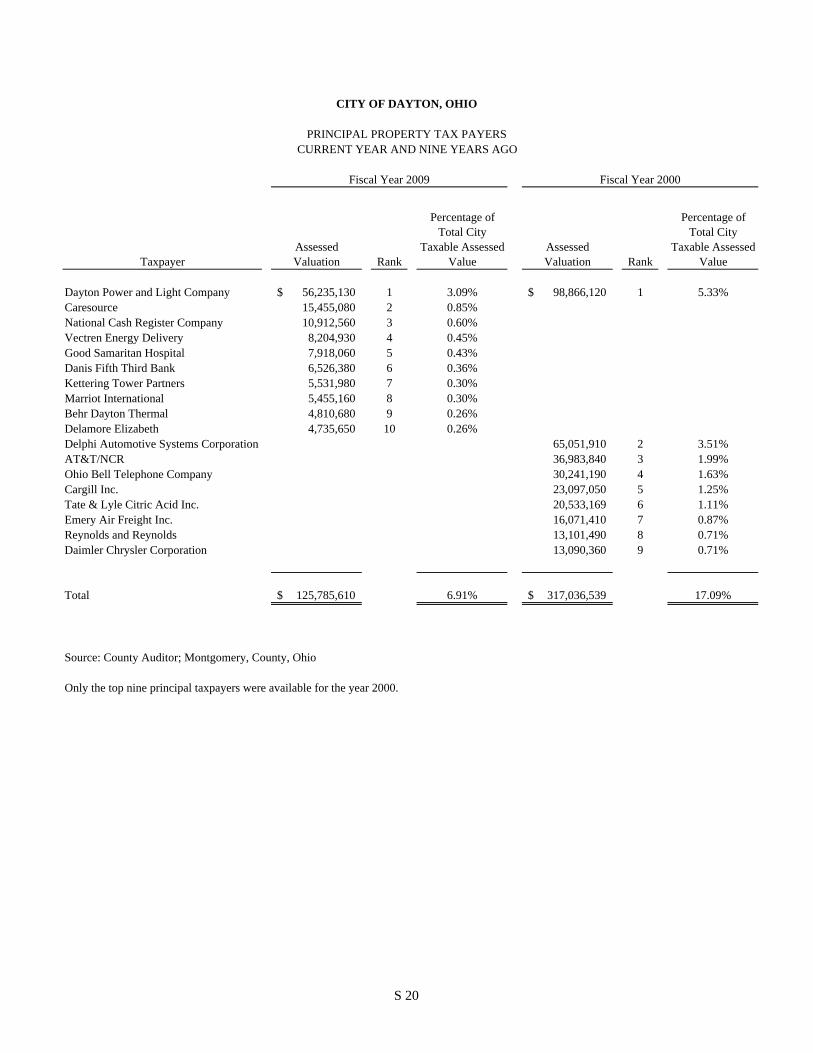
TaxpayerAssessed Valuation Rank
Percentage of Total City
Taxable Assessed Value
Assessed Valuation Rank
Percentage of Total City
Taxable Assessed Value
Dayton Power and Light Company 56,235,130$ 1 3.09% 98,866,120$ 1 5.33%Caresource 15,455,080 2 0.85%National Cash Register Company 10,912,560 3 0.60%Vectren Energy Delivery 8,204,930 4 0.45%Good Samaritan Hospital 7,918,060 5 0.43%Danis Fifth Third Bank 6,526,380 6 0.36%Kettering Tower Partners 5,531,980 7 0.30%Marriot International 5,455,160 8 0.30%Behr Dayton Thermal 4,810,680 9 0.26%Delamore Elizabeth 4,735,650 10 0.26%Delphi Automotive Systems Corporation 65,051,910 2 3.51%AT&T/NCR 36,983,840 3 1.99%Ohio Bell Telephone Company 30,241,190 4 1.63%Cargill Inc. 23,097,050 5 1.25%Tate & Lyle Citric Acid Inc. 20,533,169 6 1.11%Emery Air Freight Inc. 16,071,410 7 0.87%Reynolds and Reynolds 13,101,490 8 0.71%Daimler Chrysler Corporation 13,090,360 9 0.71%
Total 125,785,610$ 6.91% 317,036,539$ 17.09%
Source: County Auditor; Montgomery, County, Ohio
Only the top nine principal taxpayers were available for the year 2000.
Fiscal Year 2009 Fiscal Year 2000
CITY OF DAYTON, OHIO
PRINCIPAL PROPERTY TAX PAYERSCURRENT YEAR AND NINE YEARS AGO
S 20

Fiscal Year
Current Assements Due (1)
Current Assessment
Collected (1)
Percent of Current Collections to
Current Assessments
Delinquent Assessments
CollectedTotal Assessments
Collected
Percent of Total Assessments Collected to
Current Due (2)
2000 1,392,991 769,441 55.24% 158,810 928,251 66.64%
2001 1,481,584 1,159,041 78.23% 192,008 1,351,049 91.19%
2002 1,734,308 1,179,253 68.00% 185,355 1,364,608 78.68%
2003 1,720,310 1,198,753 69.68% 238,209 1,436,962 83.53%
2004 1,814,540 1,250,199 68.90% 158,459 1,408,658 77.63%
2005 1,838,846 763,031 41.50% 138,406 901,437 49.02%
2006 2,439,603 1,529,084 62.68% 741,577 2,270,661 93.08%
2007 2,339,548 2,023,233 86.48% 815,408 2,838,641 121.33%
2008 3,065,046 2,195,831 71.64% 419,295 2,615,126 85.32%
2009 3,404,912 1,829,865 53.74% 330,272 2,160,137 63.44%
(1) Reported on a cash basis and includes collections of delinquent utility bills.
(2) Total collections exceed Current Assessment Due because of high collection of curb, gutter and sidewalk delinquent assessments.
Note: This table reflects only those special assessments collected through the County Auditor's Office.
Source: County Auditor; Montgomery County, Ohio
CITY OF DAYTON, OHIO
SPECIAL ASSESSMENT BILLINGS AND COLLECTIONSLAST TEN FISCAL YEARS
S 21

Fiscal Year
General Obligation
BondsRevenue Bonds
Special Assessment
BondsCapital Lease Obligations
General Obligation
NotesOPWC Loans
Special Assessment
Notes
General Obligation
Bonds Revenue Bonds
2000 51,805,000 11,870,000 584,569 - - - 1,400 825,000 72,915,000
2001 70,705,963 11,530,000 471,029 - - - - 3,829,037 66,220,000
2002 65,167,452 12,170,000 885,487 312,990 8,250,000 - 44,234 3,422,536 59,245,000
2003 58,635,798 11,790,000 1,095,285 332,660 8,250,000 - 48,130 3,104,190 89,345,000
2004 62,429,997 11,385,000 1,244,721 3,730,742 - - 52,688 2,640,003 81,455,000
2005 54,962,646 10,955,000 977,100 3,255,561 - - - 2,292,354 80,210,000
2006 49,727,772 9,500,000 753,500 2,612,121 - - - 2,087,228 70,730,000
2007 54,900,224 9,015,000 555,600 1,995,000 - - - 1,874,776 39,185,000
2008 49,441,334 40,500,000 409,600 1,494,000 - 208,176 - 1,653,666 38,095,000
2009 56,284,054 39,925,000 299,500 - - 197,334 - 12,195,946 36,980,000
Note: Details regarding the City's outstanding debt can be found in the notes to the financial statements.
Source: City of Dayton financial records
(1) Source: Bureau of Economic Analysis, US Department of Commerce. Personal Income for FY2009 is not available.
Governmental Activities
CITY OF DAYTON, OHIO
RATIOS OF OUTSTANDING DEBT BY TYPELAST TEN FISCAL YEARS
Business-Type Activities
S 22

OWDA Loans OPWC LoansCapital Lease Obligations
General Obligation
NotesTotal Primary Government Personal Income (1)
Percentage of Personal Income Per Capita
22,920,149 1,000,000 441,371 8,600,000 170,962,489 24,210,487,000 0.71% 1,029
19,957,154 950,000 16,175,567 7,600,000 197,438,750 24,657,688,000 0.80% 1,202
16,994,159 900,000 14,284,427 12,850,000 194,526,285 25,130,233,000 0.77% 1,195
27,401,011 850,000 110,127 4,850,000 205,812,201 25,525,598,000 0.81% 1,272
24,539,685 800,000 - 9,350,000 197,627,836 25,935,393,000 0.76% 1,233
21,005,877 750,000 132,516 6,675,000 181,216,054 26,452,240,000 0.69% 1,131
17,624,367 700,000 67,630 6,715,000 160,517,618 27,693,775,000 0.58% 1,010
15,055,215 650,000 - 3,285,000 126,515,815 28,596,630,000 0.44% 796
11,774,364 600,000 - 1,885,000 146,061,140 29,736,127,000 0.49% 932
11,118,492 550,000 - 485,000 158,035,326 N/A N/A 1,025
Business-Type Activities (Continued)
S 23

2000 2001 2002 2003
Assesed Value (2) 1,854,663,703$ 1,901,664,976$ 1,907,559,195$ 2,114,267,473$
Legal debt margin: Debt limitation - 10.5% of Assesed Value 194,739,689 199,674,822 200,293,715 221,998,085
Total Voted and Unvoted Debt Outstanding 170,521,118 181,263,183 179,928,869 202,589,607
Less: Exempt DebtWaterworks General Obligation Bonds and Notes (80,000) - - - Airport General Obligation Bonds and Notes (9,345,000) (7,830,000) (12,850,000) (4,850,000) Waterworks Revenue Bonds (1) (37,065,000) (32,260,000) (27,260,000) (21,839,200) Ohio Water Development Authority Loan (22,920,149) (19,957,154) (16,994,159) (27,401,011) Ohio Public Works Commission Loan (1,000,000) (950,000) (900,000) (850,000) Airport Revenue Bonds (1) (35,850,000) (33,960,000) (31,985,000) (64,951,733) Special Assessment Bonds and Notes (585,969) (471,029) (929,721) (1,143,415) Other Exempt Debt - - - - Capital Facilities and Various Purpose Income Tax Bonds (33,705,000) (54,740,963) (56,912,452) (51,810,798) Economic Development Bonds (11,870,000) (11,530,000) (12,170,000) (11,790,000) Golf Renovation General Obligation Bonds - (3,599,037) (3,422,536) (3,104,190)
Total Exempt Debt (152,421,118) (165,298,183) (163,423,868) (187,740,347)
Total Debt Applicable to Limitation - Within 10.5% Limitations 18,100,000 15,965,000 16,505,001 14,849,260
Less: Amount Available in Debt Service Fundto pay debt applicable to limitation (18,356,028) (16,604,497) (14,559,051) (8,872,909)
Net Debt Within 10.5% Limitation - - 1,945,950 5,976,351
Overall Debt Margin Within 10.5% Limitation 194,739,689$ 199,674,822$ 198,347,765$ 216,021,734$
Unvoted Debt Limitation - 5.5% of Assessed Valuation 102,006,504$ 104,591,574$ 104,915,756$ 116,284,711$
Debt Within 5.5% Limitations 18,100,000 15,965,000 16,505,001 14,849,260
Less Amount Available in Debt Service Fund (18,356,028) (16,604,497) (14,559,051) (8,872,909)
Net Debt Within 5.5% Limitation - - 1,945,950 5,976,351
Unvoted Debt Margin Within 5.5% Limitation 102,006,504$ 104,591,574$ 102,969,806$ 110,308,360$
Source: City of Dayton financial records
(1) Airport and Waterworks revenue bonds are shown on the balance sheet net of a discount and unamortized deferred charges. For 2009, this amount was $169,433.
(2) Beginning in 2007, due to the rapid phase-out of the tangible personal property tax, including certain public utility personal property, and the length of bond issues, the taxable value of such property should be excluded from the assessed valuation used to calculate the legal debt margin. The adjusted personal property valuation is included, which excludes railroads and telephone personal property valuation.
CITY OF DAYTON, OHIO
COMPUTATION OF LEGAL DEBT MARGINLAST TEN FISCAL YEARS
S 24

2004 2005 2006 2007 2008 2009
2,043,685,740$ 2,055,906,827$ 2,105,757,362$ 1,838,251,690$ 2,351,440,480$ 1,783,291,840$
214,587,003 215,870,217 221,104,523 193,016,427 246,901,250 187,245,643
193,897,094 176,184,321 157,837,860 124,821,234 144,393,875 158,035,326
- - - - - - (9,350,000) (6,675,000) (6,715,000) (3,430,000) (1,885,000) (485,000) (5,235,650) (10,927,100) (5,133,550) - - -
(24,539,685) (21,005,877) (17,624,365) (15,055,215) (11,774,364) (11,118,492) (800,000) (750,000) (700,000) (650,000) (808,176) (747,334)
(62,645,625) (67,639,245) (64,350,209) (39,007,904) (37,921,735) (36,810,567) (1,297,409) (977,100) (753,500) (555,600) (409,600) (299,500)
- - - - - - (57,034,997) (35,962,645) (31,974,008) (23,705,224) (20,841,334) (20,910,943) (11,385,000) (10,955,000) (9,500,000) (9,015,000) (40,500,000) (39,925,000) (2,640,003) (2,292,354) (2,087,228) (1,874,776) (1,653,666) (1,375,946)
(174,928,369) (157,184,321) (138,837,860) (93,293,719) (115,793,875) (111,672,782)
18,968,725 19,000,000 19,000,000 31,527,515 28,600,000 46,362,544
(6,895,689) (5,435,549) (7,777,979) (16,499,004) (15,943,399) (15,536,249)
12,073,036 13,564,451 11,222,021 15,028,511 12,656,601 30,826,295
202,513,967$ 202,305,766$ 209,882,502$ 177,987,916$ 234,244,649$ 156,419,348$
112,402,716$ 113,074,875$ 115,816,655$ 101,103,843$ 129,329,226$ 98,081,051$
18,968,725 19,000,000 19,000,000 31,527,515 28,600,000 46,362,544
(6,895,689) (5,435,549) (7,777,979) (16,499,004) (15,943,399) (15,536,249)
12,073,036 13,564,451 11,222,021 15,028,511 12,656,601 30,826,295
100,329,680$ 99,510,424$ 104,594,634$ 86,075,332$ 116,672,625$ 67,254,756$
S 25

Fiscal Year Population (3) Assessed value (2)
Net general bonded debt (1)
Ratio of net general bonded debt to assessed
value
Net general bonded debt per
capita
2000 166,179 1,854,663,703 33,448,972 1.80% 201$
2001 164,199 1,901,664,976 54,101,466 2.84% 329$
2002 162,788 1,907,559,195 50,608,401 2.65% 311$
2003 161,832 2,114,267,473 49,762,889 2.35% 307$
2004 160,293 2,043,685,740 55,534,308 2.72% 346$
2005 160,293 2,055,906,827 49,527,097 2.41% 309$
2006 158,873 2,105,757,362 41,949,793 1.99% 264$
2007 158,873 1,948,345,053 42,949,931 2.20% 270$
2008 156,771 1,820,597,490 33,497,935 1.84% 214$
2009 154,200 1,786,715,860 40,747,805 2.28% 264$
(1) Net general bonded debt is defined as bonded debt supported by taxes less Debt Service Fund fund balance (which does not include reserve for encumbrances, advances or loans receivable).
(2) Source: County Auditor, Montgomery County, Ohio
(3) Source: U.S. Census Bureau and Miami Valley Regional Planning Commission
CITY OF DAYTON, OHIO
RATIO OF NET GENERAL OBLIGATION BONDED DEBT TO ASSESSED VALUEAND NET GENERAL OBLIGATION BONDED DEBT PER CAPITA
LAST TEN FISCAL YEARS
S 26
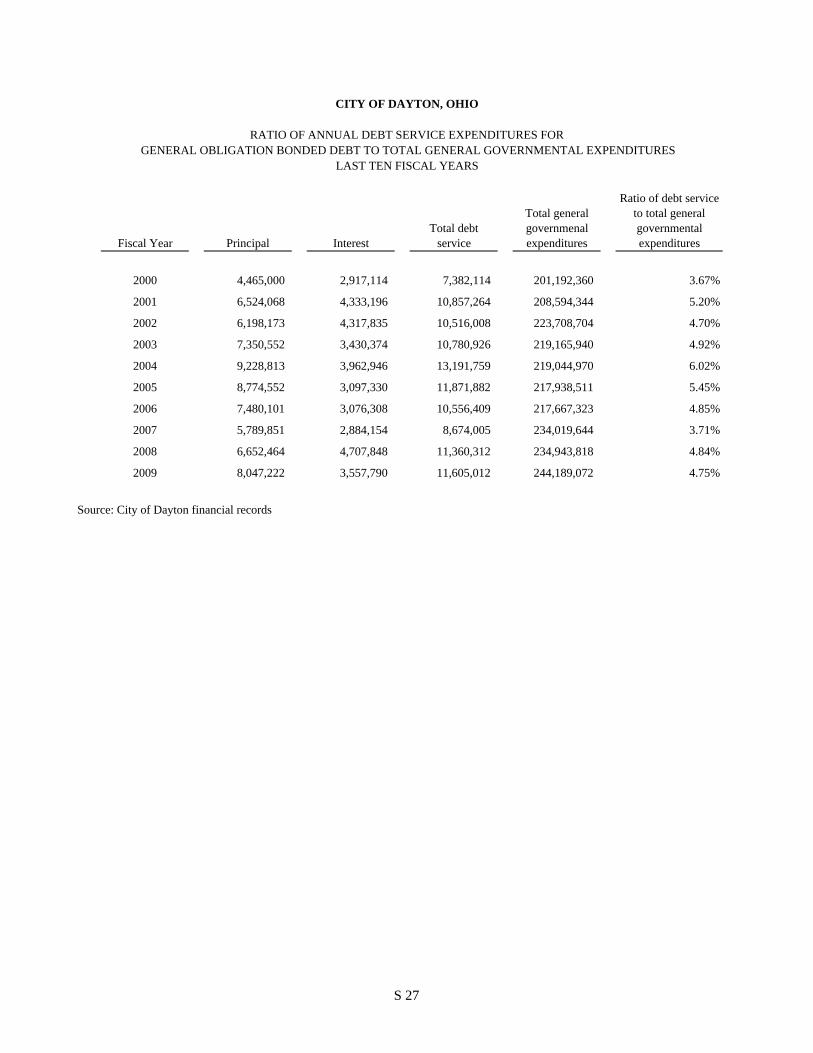
Fiscal Year Principal InterestTotal debt
service
Total general governmenal expenditures
Ratio of debt service to total general governmental expenditures
2000 4,465,000 2,917,114 7,382,114 201,192,360 3.67%
2001 6,524,068 4,333,196 10,857,264 208,594,344 5.20%
2002 6,198,173 4,317,835 10,516,008 223,708,704 4.70%
2003 7,350,552 3,430,374 10,780,926 219,165,940 4.92%
2004 9,228,813 3,962,946 13,191,759 219,044,970 6.02%
2005 8,774,552 3,097,330 11,871,882 217,938,511 5.45%
2006 7,480,101 3,076,308 10,556,409 217,667,323 4.85%
2007 5,789,851 2,884,154 8,674,005 234,019,644 3.71%
2008 6,652,464 4,707,848 11,360,312 234,943,818 4.84%
2009 8,047,222 3,557,790 11,605,012 244,189,072 4.75%
Source: City of Dayton financial records
CITY OF DAYTON, OHIO
RATIO OF ANNUAL DEBT SERVICE EXPENDITURES FORGENERAL OBLIGATION BONDED DEBT TO TOTAL GENERAL GOVERNMENTAL EXPENDITURES
LAST TEN FISCAL YEARS
S 27

Political subdivision of State of OhioNet General Bonded
Debt
Percentage applicable to
DaytonAmount applicable
to Dayton
Direct City of Dayton 56,284,054$ 100.00% 56,284,054$
Per Montgomery County Auditor:Overlapping Montgomery County 13,100,773 18.12% 2,373,860 Green County Joint Vocational School District 212,668 0.59% 1,255 Miami Valley Career Joint Vocational School District 6,675,000 2.58% 172,215 Dayton City School District 212,675,000 83.76% 178,136,580 Miami Valley Regional Transit Authority 2,625,000 18.12% 475,650 Vandalia Butler City School District 49,949,991 3.69% 1,843,155 Mad River Local School District 12,815,000 21.72% 2,783,418 Huber Heights City School District 80,015,000 11.00% 8,801,650 Trotwood-Madison City School District 31,159,987 2.46% 766,536 Fairborn City School District 16,074,987 3.62% 581,915 Northridge Local School District 6,285,000 29.42% 1,849,047
Total 487,872,460$ 254,069,334$
Source: County Auditor; Montgomery County, Ohio
CITY OF DAYTON, OHIO
COMPUTATION OF DIRECT AND OVERLAPPING DEBT
Debt of the City, authorized by the Council but not by a vote of the electors, is subject to overlapping restrictions with eachrespective county and school district. Limitations apply to each county total and should not be considered cumulatively. Total debtservice charges for and one year of all overlapping debt must not exceed ten mills (1%) of the assessed property value. Thisdetermination is made by the respective county auditors each time a subdivision proposes to issue unvoted debt. The most recentdata prepared by the county auditors for this purpose is as of December 31, 2009.
AS OF DECEMBER 31, 2009
S 28

Net RevenueAvailable for
Year Debt Service (1) Principal Interest Total Coverage
2000 18,333,123 4,625,000 1,678,310 6,303,310 2.91
2001 19,668,398 4,805,000 1,493,310 6,298,310 3.12
2002 (a) 6,368,233 5,000,000 1,301,110 6,301,110 1.01
2003 (a) 5,415,955 5,195,000 1,101,110 6,296,110 0.86
2004 (a) 5,036,318 5,405,000 893,310 6,298,310 0.80
2005 14,601,556 5,620,000 677,110 6,297,110 2.32
2006 17,477,353 5,850,000 452,310 6,302,310 2.77
2007 (b) - - - - -
2008 (b) - - - - -
2009 (b) - - - - -
(1)
(a)
(b) The City repaid these bonds in 2007, revenue bond coverage disclosure is no longer required.
Source: City of Dayton financial records
In accordance with the Trust Agreement, amounts on deposit in the Utility Reserve Fund may be transferred into the RevenueFund or the Bond Service Fund (as defined in the Trust Agreement) to be included as Net Revenue Available for Debt Service.Had sufficient transfers been made by the fiscal year-end, the revenue bond coverage ratio would have met the requiredminimum of 1.25.
Net Revenue Available for Debt Service is computed by adding operating income (loss) for the reporting period to depreciation expense and interest revenue. The Net Revenue Available for Debt Service also includes restricted cash held by a fiscal agent to meet the Rate Covenant as described in Section 4.02 of the Trust Agreement.
CITY OF DAYTON, OHIO
WATER ENTERPRISE REVENUE BOND COVERAGEWATER SYSTEMS REVENUE REFUNDING BONDS SERIES 1999
LAST TEN FISCAL YEARS
Debt Service Requirements
S 29

Net RevenueAvailable for
Year Debt Service (1) Principal Interest Total Coverage
2000 6,922,358 1,800,000 1,994,329 3,794,329 1.82
2001 5,879,030 1,890,000 1,910,247 3,800,247 1.55
2002 4,936,408 1,975,000 1,820,023 3,795,023 1.30
2003 17,489,400 1,275,000 1,206,507 2,481,507 7.05
2004 14,839,413 2,485,000 3,357,370 5,842,370 2.54
2005 12,196,929 3,005,000 3,085,715 6,090,715 2.00
2006 16,742,217 3,630,000 2,813,589 6,443,589 2.60
2007 16,112,888 3,750,000 3,062,695 6,812,695 2.37
2008 11,735,966 1,090,000 1,894,488 2,984,488 3.93
2009 6,230,427 1,115,000 1,860,958 2,975,958 2.09
used for payment of debt service charges and all Customer Facility Charges (CFC). For 2007 and 2008, no PFC were used for payment of debt service charges.
Source: City of Dayton financial records
expense and interest revenue. Also included in this calculation is the portion of Passenger Facility Charges (PFC) which were
(2) Debt service requirements are exclusive of refunding transactions and additional principal payments made to retire bonds.
CITY OF DAYTON, OHIO
DAYTON INTERNATIONAL AIRPORT ENTERPRISE REVENUE BOND COVERAGEDAYTON INTERNATIONAL AIRPORT REVENUE REFUNDING BOND SERIES
LAST TEN FISCAL YEARS
Debt Service Requirements (2)
(1) Net Revenue Available for Debt Service is computed by adding operating income (loss) for the reporting period to depreciation
S 30

Year
Square Mile Area City of Dayton Year
End (1) Air Passengers (2)
Scheduled Airline Freight
(2)
2000 56 (+/-) 2,363,322 917,527 2001 56 (+/-) 2,145,826 588,901 2002 56 (+/-) 2,280,960 430,282 2003 56 (+/-) 2,603,129 360,796 2004 56 (+/-) 2,874,386 369,429 2005 56 (+/-) 2,438,210 370,329 2006 56 (+/-) 2,607,167 166,613 2007 56 (+/-) 2,833,081 10,455 2008 56 (+/-) 2,928,018 9,471 2009 56 (+/-) 2,506,271 10,388
YearActive Gas Meters (3)
Vehicle Registrations (4)
2000 N/A N/A2001 85,396 N/A2002 84,245 N/A2003 83,065 N/A2004 83,115 131,096 2005 84,458 120,623 2006 88,573 130,190 2007 81,606 123,640 2008 80,900 106,186 2009 80,233 102,921
Source: 1 Square Miles for City of Dayton - Division of Planning, City of Dayton2 Dayton International Airport3 Vectren4 Bureau of Motor Vehicles
CITY OF DAYTON, OHIO
BUSINESS INDICATORSLAST TEN FISCAL YEARS
S 31

Square miles at
Year December 31
1950 231955 27
1960 341965 36
1970 401975 43
1980 541985 55
1990 551991 561992 56
1993 561994 561995 56
1996 561997 561998 56
1999 562000 562001 56
2002 562003 562004 56
2005 562006 562007 56
2008 56.52009 56.5
Source: Division of Planning City of Dayton
CITY OF DAYTON, OHIO
GROWTH IN LAND AREASELECTED YEARS
S 32

Employer Employees Rank
Percentage of Total City
Employment Employees Rank
Percentage of Total City
Employment
Miami Valley Hospital 6,960 1 10.06% 4,200 3 5.43%Montgomery County 5,774 2 8.35% 4,750 2 6.14%Dayton Public Schools 3,700 3 5.35% 3,750 4 4.84%Good Samaritan Hospital and Health 3,343 4 4.83% 2,700 7 3.49%University of Dayton 2,900 5 4.19% 2,600 8 3.36%City of Dayton 2,648 6 3.83% 2,944 6 3.80%Childrens Medical Hospital 1,912 7 2.76%Sinclair Community College 1,597 8 2.31%Veterns Administration 1,579 9 2.28%BEHR Dayton Thermal 1,416 10 2.05%Delphi Automotive Systems Corporation 5,000 1 6.46%AT&T/NCR Corporation 3,200 5 4.13%Franciscan Medical Center 2,200 9 2.84%Acustar (formerly Chrysler) 2,100 10 2.71%
Total 31,829 46.00% 33,444 43.21%
Source: Dayton Business Journal
Fiscal Year 2000
CITY OF DAYTON, OHIO
PRINCIPAL EMPLOYERSCURRENT YEAR AND NINE YEARS AGO
Fiscal Year 2009
S 33

U.S.
Year Labor ForceUnemployment
rate Labor forceUnemployment
rate Labor forceUmployment
rateUnemployment
rate
2000 279,600 4.00% 73,300 6.90% 5,807,000 6.00% 4.00%
2001 278,700 4.60% 73,400 7.90% 5,825,600 7.40% 4.40%
2002 276,700 6.00% 73,600 10.20% 5,836,500 5.60% 5.70%
2003 276,000 6.50% 72,500 7.60% 5,866,800 5.50% 6.20%
2004 273,300 6.60% 71,600 8.00% 5,875,300 7.10% 6.20%
2005 272,200 6.40% 71,200 7.60% 5,900,400 7.60% 5.90%
2006 271,900 6.05% 71,000 8.30% 5,839,200 5.37% 4.60%
2007 275,200 6.20% 71,500 7.20% 5,976,500 5.60% 4.60%
2008 270,500 8.40% 70,000 9.40% 5,954,200 7.60% 5.80%
2009 267,234 11.40% 69,188 12.60% 5,970,188 10.20% 9.30%
Source: Ohio Workforce Informer (2000 - 2008)Source: Bureau of Labor Statistics (2009)
Montgomery County Dayton Ohio
CITY OF DAYTON, OHIO
ESTIMATED CIVILIAN LABOR FORCEAND ANNUAL AVERAGE UNEMPLOYMENT RATES
LAST TEN FISCAL YEARS
S 34

United States
YearPer capita
income% of national
averageTotal personal
incomePer capita
income% of national
averagePer capita
income% of national
averagePer capita
income
2000 28,549 95.66% 4,744,244,271$ 28,949 97.00% 28,207 94.51% 29,845
2001 29,160 95.38% 4,788,042,840$ 29,827 97.56% 28,601 93.55% 30,574
2002 29,747 96.55% 4,842,454,636$ 30,404 98.68% 29,212 94.81% 30,810
2003 30,385 96.51% 4,917,265,320$ 30,784 97.78% 29,954 95.14% 31,484
2004 31,387 94.97% 5,031,116,391$ 31,773 96.14% 31,161 94.28% 33,050
2005 31,792 92.16% 5,096,035,056$ 32,133 93.15% 31,867 92.38% 34,495
2006 33,195 90.42% 5,273,789,235$ 33,658 91.68% 33,320 90.76% 36,714
2007 34,314 88.87% 5,451,568,122$ 34,732 89.95% 34,874 90.32% 38,611
2008 34,724 87.35% 5,443,716,204$ 34,715 87.33% 35,511 89.33% 39,751
2009 N/A N/A N/A N/A N/A 35,381 90.40% 39,138
Source: Bureau of Economic Analysis
N/A - Information not available
Montgomery County Ohio
CITY OF DAYTON, OHIO
ESTIMATED PER CAPITA INCOME AND PERSONAL INCOMELAST TEN FISCAL YEARS
Dayton (MSA)
S 35

Industry 2000 2001 2002 2003 2004 2005 2006 2007
Total 435.3 428.8 420.6 415.5 411.8 409.4 408.2 408.2
Goods-Producing Industries 96.2 87.1 82.5 78.3 75.4 73.8 71.7 67.8
Natural Resources, Mining and Construction 16.2 15.1 15.3 15.2 15.6 15.4 15.2 14.7
Manufacturing 80.0 72.0 67.2 63.1 59.9 58.4 56.5 53.1
Service-Providing Industries 339.1 341.6 338.1 337.2 336.4 335.7 336.5 335.6
Trade, Transportation, and Utilities 81.5 79.0 75.0 72.6 71.6 71.1 70.0 68.7
Information 10.3 11.5 11.6 11.4 11.1 11.1 10.6 10.9
Financial Activies 17.3 18.0 18.3 18.8 19.0 19.0 20.1 20.1
Professional and Business Services 52.4 54.8 52.7 53.9 53.2 52.3 52.3 52.2
Educational and Health Services 58.3 59.3 60.9 61.7 62.5 63.7 64.7 65.8
Leisure and Hospitality 36.1 35.5 35.7 36.5 37.1 37.3 37.8 37.3
Other Services 16.3 16.3 16.7 16.8 16.7 16.7 16.4 16.0
Government 66.8 67.2 67.3 65.4 65.1 64.5 64.8 64.5
(1) Dayton Metropolitan Statistical Area includes Greene, Miami, Montgomery, and Preble Counties.
(2) Nonagricultural employment excludes farm workers, proprietors, the self-employed, unpaid family workers, and domestic workers.
Source: Bureau of Labor Market Information and Ohio Department of Job and Family Services
CITY OF DAYTON, OHIO
(IN THOUSANDS, EXCEPT PERCENT)LAST TEN FISCAL YEARS
DAYTON METROPOLITAN STATISTICAL AREA EMPLOYMENT (1)NONAGRICULTURAL WAGE AND SALARY EMPLOYMENT IN SELECTED INDUSTRIES (2)
S 36

2008 2009
396.2 372.6 100.00%
60.6 50.6 13.58%
13.7 11.6 3.11%
46.9 39.0 10.47%
335.6 322.0 86.42%
67.0 63.1 16.94%
12.1 11.0 2.95%
18.6 16.8 4.51%
51.7 45.5 12.21%
68.9 68.7 18.42%
37.2 36.3 9.74%
15.5 14.9 4.00%
64.6 65.6 17.59%
Percentage of Total 2009
employment
S 37
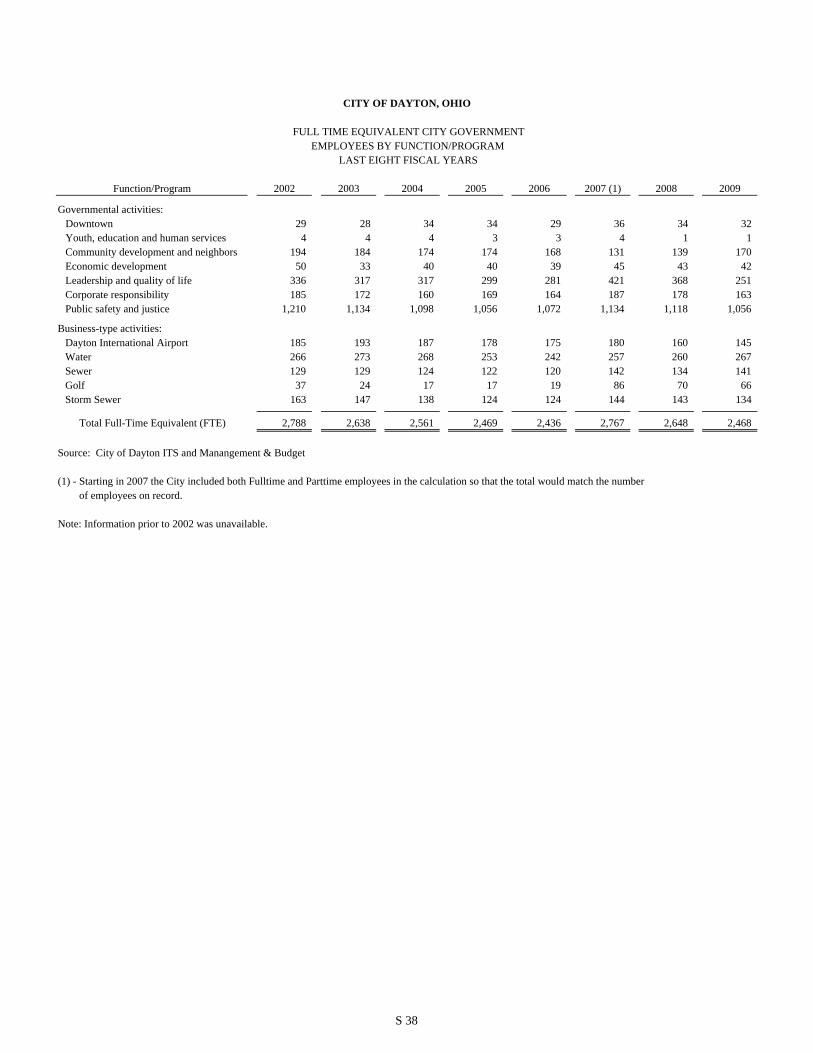
Function/Program 2002 2003 2004 2005 2006 2007 (1) 2008 2009
Governmental activities:Downtown 29 28 34 34 29 36 34 32 Youth, education and human services 4 4 4 3 3 4 1 1 Community development and neighbors 194 184 174 174 168 131 139 170 Economic development 50 33 40 40 39 45 43 42 Leadership and quality of life 336 317 317 299 281 421 368 251 Corporate responsibility 185 172 160 169 164 187 178 163 Public safety and justice 1,210 1,134 1,098 1,056 1,072 1,134 1,118 1,056
Business-type activities:Dayton International Airport 185 193 187 178 175 180 160 145 Water 266 273 268 253 242 257 260 267 Sewer 129 129 124 122 120 142 134 141 Golf 37 24 17 17 19 86 70 66 Storm Sewer 163 147 138 124 124 144 143 134
Total Full-Time Equivalent (FTE) 2,788 2,638 2,561 2,469 2,436 2,767 2,648 2,468
Source: City of Dayton ITS and Manangement & Budget
(1) - Starting in 2007 the City included both Fulltime and Parttime employees in the calculation so that the total would match the number of employees on record.
Note: Information prior to 2002 was unavailable.
CITY OF DAYTON, OHIO
FULL TIME EQUIVALENT CITY GOVERNMENTEMPLOYEES BY FUNCTION/PROGRAM
LAST EIGHT FISCAL YEARS
S 38

Year
2000 10,318 15,398 21,348 47,064 21,079
2001 10,250 15,810 22,246 48,306 20,842
2002 10,125 16,517 22,917 49,559 20,788
2003 10,284 16,729 23,588 50,601 17,170
2004 10,495 16,944 23,241 50,680 19,829
2005 10,569 17,074 22,555 50,198 15,972
2006 10,503 16,870 22,786 50,159 17,054
2007 10,395 16,913 22,443 49,751 14,963
2008 10,920 17,662 23,259 51,841 14,486
2009 10,908 17,558 25,249 53,715 14,939
Source: (1) University of Dayton, Registrar's Office(2) Wright State University, Budget Planning & Resource Analysis(3) Sinclair Community College, Institute of Planning & Research(4) Dayton City School District
CITY OF DAYTON, OHIO
SCHOOL ENROLLMENT TRENDS IN MONTGOMERY COUNTY
The University of Dayton (1)
Wright State University (2)
Sinclair Community College (3)
Total Colleges/ Universities
Dayton Public Schools (4)
LAST TEN FISCAL YEARS
S 39

Jurisdiction Square Miles
Dayton . . . . . . . . . . . . . . . . . . . . . . . . . . . . . 56 Less portion outside of Montgomery County. . . . . . .
Other incorporated areas in Montgomery County 174 excluding Dayton . . . . . . . . . . . . . . . . . . . . .
Unincorporated Townships within 233 Montgomery County . . . . . . . . . . . . . . . . . . .
Total approximate area of Montgomery County 463
Source: Division of Planning City of Dayton ( County Land Records)
DECEMBER 31, 2009
CITY OF DAYTON, OHIO
CITY OF DAYTON ANDMONTGOMERY COUNTY, OHIO
LAND AREA
S 40

Year Permits issued (1) Valuation (1)
2000 1,652 124,091,672
2001 1,206 129,052,146
2002 1,314 148,084,800
2003 1,407 133,241,900
2004 1,020 174,560,405
2005 957 135,844,107
2006 948 106,199,962
2007 843 135,523,498
2008 757 76,613,598
2009 793 111,538,280
Source: (1) City of Dayton Divison of Business Services, Permit Section
CITY OF DAYTON, OHIO
BUILDING PERMITS ISSUEDLAST TEN FISCAL YEARS
New Construction
S 41

Year UnitsTotal Permit
Value
Single-family average
structure cost
% Change from previous
year% Change from 2000
2000 39 5,893,400 151,113 -0.03% N/A
2001 192 20,722,589 107,930 -28.58% -28.58%
2002 222 22,801,633 102,710 -4.84% -32.03%
2003 277 29,435,199 106,264 3.46% -29.68%
2004 185 21,928,258 118,531 11.54% -21.56%
2005 215 25,306,493 117,705 -0.70% -22.11%
2006 186 19,292,702 103,724 -11.88% -31.36%
2007 134 12,431,781 92,774 -10.56% -38.61%
2008 83 8,125,807 97,901 5.53% -35.21%
2009 123 11,114,593 90,363 -7.70% -40.20%
Source: Census Bureau
CITY OF DAYTON, OHIO
AVERAGE COST OF HOUSING CONSTRUCTIONLAST TEN FISCAL YEARS
S 42

2000 2001 2002 2003 2004 2005 2006 2007 2008 2009
Public ServiceHighways and Streets Streets (miles) 855 855 855 855 855 855 967 969 1,718 1,718 Streetlights 19,900 20,030 19,188 19,356 21,292 23,421 18,650 18,650 20,163 20,163 Traffic Signals N/A N/A N/A N/A N/A N/A 325 325 325 325 Computerized Signals N/A N/A N/A N/A N/A N/A 178 225 275 275
Public Safety Police Headquarters 1 1 1 1 1 1 1 1 1 1 Training Academy 1 1 1 1 1 1 1 1 1 1 Number of Districts 5 5 5 5 5 5 5 5 5 5 Number of Employees 621 625 611 464 439 414 506 512 505 474
Fire Headquarters 1 1 1 1 1 1 1 1 1 1 Training Academy 1 1 1 1 1 1 1 1 1 1 Fire Stations 14 14 13 13 13 12 12 12 12 12 Number of Employees 437 423 413 379 376 366 385 383 379 346
City Fleet (public safety) Fire N/A N/A N/A N/A N/A N/A 101 99 96 97 Police N/A N/A N/A 405 402 393 288 354 354 307
Recreation and parks Parks Acreage 2,200 2,000 1,400 1,400 1,400 1,400 1,389 1,389 1,389 1,374 Playgrounds 49 49 49 49 49 49 49 49 49 42 Total Facilities 248 238 185 185 188 182 186 221 205 184 Parks 72 72 72 72 72 72 72 72 62 60 Swimming Pools 28 28 16 16 19 14 19 8 3 4 Tennis Courts 78 68 22 22 22 22 22 65 65 63 Community Centers 11 11 11 11 11 10 9 2 2 - Senior Centers N/A N/A 2 2 2 2 2 1 1 1 Athletic Complexes N/A N/A 2 2 2 2 2 2 2 2 Specialized Facilities N/A N/A 4 4 4 4 4 1 1 - Shelter Houses 53 53 53 53 53 53 53 53 53 37 Golf Courses 6 6 3 3 3 3 3 3 3 3 Spray Park Facilities N/A N/A N/A N/A N/A N/A N/A 7 7 6 Recreation Centers N/A N/A N/A N/A N/A N/A N/A 4 4 5 Cultural Centers N/A N/A N/A N/A N/A N/A N/A 2 1 2 Teen Centers N/A N/A N/A N/A N/A N/A N/A 1 1 1
Water Water Mains (miles) 771.00 772.90 800.00 800.00 791.00 799.00 800.28 803.07 803.33 804.29 Maximum Daily Capacity 75.90 48.00 72.35 72.35 51.85 51.30 50.30 51.60 46.53 43.79 (millions of gallons)
Sewer Sanitary Sewers (miles) 603.00 600.00 650.00 650.00 600.00 600.00 601.28 601.39 602.85 603.11 Storm Sewers (miles) 403.00 400.00 600.00 600.00 400.00 401.00 402.28 402.85 403.35 403.61 Maximum Daily Capacity N/A N/A 44.98 37.43 36.64 36.03 37.56 35.97 35.06 32.61 (millions of gallons)
Source: Various Departments, City of DaytonN/A - Information not available
CITY OF DAYTON, OHIO
OPERATING INDICATORS AND CAPITAL ASSET STATISTICSLAST TEN FISCAL YEARS
S 43

THIS PAGE IS INTENTIONALLY LEFT BLANK
S 44

The following Department of Finance Personnel
contributed directly to the 2009 Comprehensive Annual
Financial Report.
Cheryl J. Garrett, Finance Director
Bejoy C. John, Deputy Finance Director
Candy H. Carr, Financial Services Supervisor
Jason L. Cook, Financial Analyst I
Rhonda L. Salone, Financial Analyst I
Trasenna T. Williams, Financial Analyst I
Josephine A. Kennedy, Finance Technician I
Appreciation is extended to all the staff for a fi ne and useful
product and also to individuals in: Accounting, Revenue and
Taxation, Offi ce of Management and Budget, and the other
offi ces that contributed to the preparation of the Report. We
also wish to thank our consultant, Julian and Grube, Inc. for
their assistance on this project.
Design and Printing: Document Management Services

2009 CAFR, City of Dayton, Department of Finance
Enclosed in a Golden Circular Band, a shield was crested top of gold leaves and rosettes.
The Shield divided: Blazoned on a Chief of red, fi ve stars of gold, representing the fi ve City Commissioners; the center star is larger, honoring the Mayor.
At Fesse Point, a gold circle embossed with a gold star, honoring the City Manager.
The Dexter Honor: Blazoned on a fi eld of black, a gear in gold, representing the manufacturing industry.
Sinister Honor: Blazoned on a fi eld of blue, a pair of wings in Gold, representing Aviation.
Dexter Base: Blazoned on a fi eld of Purple, a lamp of gold, representing the Culture Activities.
Sinister Base: Blazoned on a fi eld of green, a replica of the Newcom Tavern in gold with the inscription ‘1796’ representing the pioneer settlement of Dayton .
DAYTON: WHERE THE FUTURE BEGANDAYTON: WHERE THE FUTURE BEGAN
The Coat of Arms is the offi cial Seal of the City of Dayton. It was designed in 1935 by Harold Coffman Harlan, Registered Architect, to be used as the offi cial insignia or seal of the City.
The following is a description of the Coat of Arms presented by Mr. Harlan:


