COMPREHENSIVE ANNUAL FINANCIAL REPORT & INDEPENDENT ...
103
COMPREHENSIVE ANNUAL FINANCIAL REPORT & INDEPENDENT AUDITORS’ REPORT FOR THE YEAR ENDED AUGUST 31, 2019
Transcript of COMPREHENSIVE ANNUAL FINANCIAL REPORT & INDEPENDENT ...

COMPREHENSIVE ANNUAL FINANCIAL REPORT& INDEPENDENT AUDITORS’ REPORT
FOR THE YEAR ENDED AUGUST 31, 2019

UNIVERSITY OF NORTH TEXAS SYSTEM
COMPREHENSIVE ANNUAL FINANCIAL REPORT AND INDEPENDENT AUDITORS’ REPORT
For the fiscal year ended August 31, 2019
DALLAS, TEXAS
Lesa Roe, Chancellor

2
TABLE OF CONTENTS Organizational Data ...................................................................................................................................... 5 Letter of Transmittal .................................................................................................................................. 7‐8 Independent Auditors’ Report ................................................................................................................. 9‐11 Management’s Discussion and Analysis ................................................................................................ 13‐22 Statements Statement of Net Position ............................................................................................................. 24‐25 Statements of Financial Position ‐ UNT Foundation, Inc. ................................................................... 26 Statements of Financial Position ‐ UNTHSC Foundation .................................................................... 27 Statement of Revenues, Expenses and Changes in Net Position ....................................................... 28 Matrix of Operating Expenses Reported by Function ........................................................................ 29 Statements of Activities ‐ UNT Foundation, Inc. ........................................................................... 30‐31 Statements of Activities ‐ UNTHSC Foundation ............................................................................ 32‐33 Statement of Cash Flows ............................................................................................................... 34‐35 Notes to the Comprehensive Financial Statements .............................................................................. 37‐77 Required Supplementary Information ................................................................................................... 78‐79 Notes to the Financial Statements ‐ UNT Foundation, Inc. ................................................................... 81‐90 Notes to the Financial Statements ‐ UNTHSC Foundation ................................................................... 91‐101
3
4

UNIVERSITY OF NORTH TEXAS SYSTEM
ORGANIZATIONAL DATA
August 31, 2019
BOARD OF REGENTS
Rusty Reid ............................................... (Term expired 5‐22‐19)* .............................................. Fort Worth
Brint Ryan ................................................ (Term expires 5‐22‐21) ........................................................ Dallas A.K. Mago ................................................. (Term expires 5‐22‐21) ........................................................ Dallas Laura Wright ............................................ (Term expires 5‐22‐21) ........................................................ Dallas
Mary Denny ............................................. (Term expires 5‐22‐23) ...................................................... Aubrey Milton B. Lee ............................................ (Term expires 5‐22‐23) .............................................. San Antonio Carlos Munguia ........................................ (Term expires 5‐22‐23) ......................................... University Park
Daniel Feehan .......................................... (Term expires 5‐22‐25) ............................................... Fort Worth John Scott, Jr., D.O. .................................. (Term expires 5‐22‐25) ........................................................ Keller
STUDENT REGENT
Alexandra Harrel ...................................... (Term expires 5‐31‐20) ........................................... Corpus Christi
OFFICERS OF THE BOARD
Laura Wright .................................................................................................................................... Chairman Milton B. Lee …... ..................................................................................................................... Vice Chairman Rosemary R. Haggett ....................................................................................................................... Secretary
ADMINISTRATIVE OFFICERS
Lesa Roe ......................................................................................................................................... Chancellor Daniel Tenney ......................................................................................................Vice Chancellor for Finance
* As of the time of print, the Governor of Texas had not yet made a new Regent appointment.
5

6
UNI I SYSTEM™ UNT UNT HEALTH SCIENCE CENTER
December 19, 2019
Laura Wright, Chairman, UNT System Board of Regents Milton B. Lee, Vice Chairman, UNT System Board of Regents Mary Denny, Chairman, Audit Committee Board of Regent Members University of North Texas System 1901 Main Street Dallas, Texas 75201
Dear Chairman Ryan, Vice Chairman Wright, Chairman Denny and Board of Regents,
UNT DALLAS
We are pleased to submit the audited Comprehensive Annual Financial Report (CAFR} of the University of North Texas System (UNTS) for the fiscal year ended August 31, 2019. This report is in compliance with TEX. GOV'T CODE ANN 2101.011 and in accordance with the requirements established by the Comptroller of Public Accounts and Governmental Accounting Standards Board (GASB} Statement No. 34, Basic Financial Statements - and Management's Discussion and Analysis - for State and Local Governments.
Responsibility for both the accuracy of the data presented, as well as the completeness and fairness of the presentation, rests with the management and those charged with governance of each UNT System member institution. To the best of our knowledge, the information presented is accurate in all material respects, and all disclosures necessary for a reasonable understanding of the system's financial activities are included. The management's discussion and analysis (MD&A} in the financial section provides an overview of the System's financial activities reported in the comprehensive financial statements.
The UNT System is reaching new heights as we collectively strive to transform the future of North Texas and beyond. We are setting records in almost every critical measurement of success including enrollment, fundraising, research, legislative funding, academic excellence and athletic excellence. Strategic efforts have yielded impressive results and many firsts for UNT World:
• More than 45,000 students attended UNT System institutions last Fall, a record for UNTWorld enrollment.
• In the last academic year, UNT System institutions awarded more than 11,000 degrees.
• UNT World combined research expenditures in fiscal year 2019 eclipsed $120 million for the first time. • Philanthropic dollars raised via foundation and institutional gifts eclipsed a combined record total of $71.5
million in fiscal year 2019. Combined endowments have also reached a record high of $300 million.
At UNT, we now have 77 programs ranked among the nation's Top 100 by various publications and services, including 19 programs ranked in the Top 100 by US New and World Report. The Carnegie Classification of Institutions of Higher Education™ reaffirmed UNT's standing as a Tier One research university in February 2019, an achievement recognizing the university's efforts to grow its research enterprise and commitment to rise, in national prominence. UNT's Center for Agile & Adaptive Additive Manufacturing is transforming manufacturing technologies to better develop complex 3-D objects to create viable market-based solutions that impact almost every industry from operating rooms to oil fields. The 86th Texas Legislature recognized the impact this program can make on our region and state by awarding $10 million in funding to the center. Our flagship is also bringing the power of a UNT degree to new populations through its expansion in Frisco. A master plan· has been approved
1901 MAIN STREET• DALLAS, TEXAS• TEL 214.752.8585 • FAX 214.752.8827 • UNTSYSTEM.EDU 7
for what will eventually become a 100-acre campus in fast-growing Collin County, and provide practical experience into each of our degree programs at UNT Frisco.
In Fort Worth, the UNT Health Science Center is committed to improving the human condition through a shared passion for innovation and teamwork. The TCU and UNTHSC School of Medicine is now open and has been lauded for its creative private/public partnerships between universities. Fort Worth's new MD school achieved preliminary accreditation and welcomed its first class of students this summer for classes and research initiatives held in our new state-of-the-art Integrated Research Education Building, with added commitments for almost 700 new residency slots with health systems. The HSC Physician's Assistant Program ranks among the nation's Top 20 in US News and World Report and its Texas College of Osteopathic Medicine produces more primary care physicians than any medical school in Texas.
Our youngest institution, UNT Dallas, has become the state's fastest-growing public university, achieving record enrollment three years running. UNT Dallas is designated as a Minority Serving Institution by the U.S. Department of Education and offers the lowest tuition costs in DFW. UNT Dallas has grown programs based on industry needs across urban Dallas. This includes bilingual K-12 teaching, logistics, criminal justice, law, business analytics, mental health, and public health. We are working with foundational partners, businesses and the Dallas County Promise to reach more urban students than ever before and provide a pathway to social mobility.
The 86th Texas Legislature committed more special item support to the collective UNT System than ever before. In addition, the 86th Texas Legislature maintained or increased formula funding rates for the UNT System - this especially benefitted UNT Dallas, which had the biggest percent increase in formula funding among all universities in Texas. New initiatives funded by the Texas Legislature include UNT's Center for Agile & Adaptive Additive Manufacturing, UNT Dallas' student success initiative, and UNT Health Science Center's forensic genetics research program, which included additional funding to reduce the backlog of rape kit evidence for local Texas communities. UNT Dallas will also benefit from a small institution supplement of $2.6 million over the next two fiscal years.
The preparation of the System's externally audited CAFR is overseen by the System Controller team but requires the collective efforts of financial personnel throughout each institution. Without all financial personnel and the hundreds of hours that were spent, this report would not be possible. We are committed to being good stewards of the resources entrusted to us by the State of Texas and by students and their families, and we hold ourselves accountable for the wise and appropriate use of those resources. This financial report serves as a testament to the work we have done to ensure that our stewardship, accountability, and financial viability are just as strong and as important to us as our academic services themselves.
cc: Lesa B. Roe, Chancellor Dr. Neal Smatresk, President, UNT Dr. Michael Williams, President, UNT Health Science Center Robert Mong, President, UNT Dallas Bob Brown, Senior Vice President for Finance and Administration, UNT Greg Anderson, Executive Vice President for Finance and Operations, UNT Health Science Center Jim Main, Executive Vice President of Administration and CFO, UNT Dallas Tracy Grunig, Chief Audit Executive, UNT System Alan Stucky, Interim Vice Chancellor and General Counsel, UNT System
8
GT.COM Grant Thornton LLP is the U.S. member firm of Grant Thornton International Ltd (GTIL). GTIL and each of its member firms are separate legal entities and are not a worldwide partnership.
Board of Regents University of North Texas System
Report on the financial statements We have audited the accompanying financial statements of the business-type activities and discretely presented component units of the University of North Texas System (the “System”) as of and for the year ended August 31, 2019, and the related notes to the financial statements, which collectively comprise the System’s basic financial statements as listed in the table of contents.
Management’s responsibility for the financial statements Management is responsible for the preparation and fair presentation of these financial statements in accordance with accounting principles generally accepted in the United States of America; this includes the design, implementation, and maintenance of internal control relevant to the preparation and fair presentation of financial statements that are free from material misstatement, whether due to fraud or error.
Auditor’s responsibility Our responsibility is to express opinions on these financial statements based on our audit. We did not audit the financial statements of the University of North Texas Foundation, Inc. or the University of North Texas Health Science Center Foundation, Inc. (collectively the “Foundations”), which collectively represents 100% of the assets, net assets, and revenues of the discretely presented component units of the System. Those statements were audited by other auditors whose reports have been furnished to us, and our opinion, insofar as it relates to the amounts included for the Foundations, is based solely on the report of other auditors. We conducted our audit in accordance with auditing standards generally accepted in the United States of America and the standards applicable to financial audits contained in Government Auditing Standards issued by the Comptroller General of the United States. Those standards require that we plan and perform the audit to obtain reasonable assurance about whether the financial statements are free from material misstatement. The financial statements of the Foundations were not audited in accordance with Government Auditing Standards.
An audit involves performing procedures to obtain audit evidence about the amounts and disclosures in the financial statements. The procedures selected depend on the auditor’s judgment, including the assessment of the risks of material misstatement of the financial statements, whether due to fraud or error. In making those risk assessments, the auditor considers internal control relevant to the System’s preparation and fair presentation of the financial statements in order to design audit procedures that are appropriate in the circumstances, but not for the purpose of expressing an opinion on the effectiveness of the System’s internal control.
REPORT OF INDEPENDENT CERTIFIED PUBLIC ACCOUNTANTS
GRANT THORNTON LLP 1717 Main Street, Suite 1800 Dallas, Texas 75201 D +1 214-561-2300
F +1 214-561-2370
9

Accordingly, we express no such opinion. An audit also includes evaluating the appropriateness of accounting policies used and the reasonableness of significant accounting estimates made by management, as well as evaluating the overall presentation of the financial statements.
We believe that the audit evidence we have obtained is sufficient and appropriate to provide a basis for our audit opinions.
Opinions In our opinion, based on our audit and the report of other auditors, the financial statements referred to above present fairly, in all material respects, the financial position of the business-type activities and the discretely presented component units of the System as of August 31, 2019, and the changes in financial position and cash flows thereof for the year then ended in accordance with accounting principles generally accepted in the United States of America.
Other matters
Required supplementary information Accounting principles generally accepted in the United States of America require that the Management’s Discussion and Analysis, on pages 13 through 22, and the Required Supplementary Information on pages 78 through 79 be presented to supplement the basic financial statements. Such information, although not a required part of the basic financial statements, is required by the Governmental Accounting Standards Board who considers it to be an essential part of financial reporting for placing the basic financial statements in an appropriate operational, economic, or historical context. This required supplementary information is the responsibility of management. We have applied certain limited procedures to the required supplementary information in accordance with auditing standards generally accepted in the United States of America. These limited procedures consisted of inquiries of management about the methods of preparing the information and comparing the information for consistency with management’s responses to our inquiries, the basic financial statements, and other knowledge we obtained during our audit of the basic financial statements. We do not express an opinion or provide any assurance on the information because the limited procedures do not provide us with sufficient evidence to express an opinion or provide any assurance.
Other information The Introductory Section is presented for purposes of additional analysis and is not a required part of the basic financial statements. Such information has not been subjected to the auditing procedures applied in the audit of the basic financial statements, and accordingly, we do not express an opinion or provide any assurance on it.
Other reporting required by Government Auditing Standards In accordance with Government Auditing Standards, we have also issued our report, dated December 19, 2019, on our consideration of the System’s internal control over financial reporting and on our tests of its compliance with certain provisions of laws, regulations, contracts, and grant agreements and other matters. The purpose of that report is solely to describe the scope of our testing of internal control over financial reporting and compliance and the results of that testing, and not to provide an opinion
10
on the effectiveness of the System’s internal control over financial reporting or on compliance. That report is an integral part of an audit performed in accordance with Government Auditing Standards in considering the System’s internal control over financial reporting and compliance.
Dallas, Texas December 19, 2019
11

THIS PAGE INTENTIONALLY LEFT BLANK
12

UNIVERSITY OF NORTH TEXAS SYSTEM Management’s Discussion and Analysis (Unaudited)
For the Year Ended August 31, 2019
Introduction The University of North Texas System (the “System”) was established by the 76th Legislature with legislative funding provided for the fiscal year beginning September 1, 1999. The System is an agency of the State of Texas and is currently comprised of the University of North Texas System Administration (“System Administration”), established 1999, and three academic institutions funded by the Legislature: the University of North Texas (“UNT”), established 1890; the University of North Texas Health Science Center at Fort Worth (“HSC”), established 1970; and the University of North Texas at Dallas (“UNTD”), established 2010. The System serves the North Texas area, boosting economic activity in the region by over $5.2 billion annually. The UNT System has a $1.1 billion annual consolidated budget and employs roughly 10,000 people at its various locations within the robust North Texas Region. In Fall 2018, over 46,000 students enrolled in undergraduate, graduate, and professional programs at UNT System institutions. The System is governed by a nine‐member Board of Regents appointed by the Governor of Texas and confirmed by the Texas State Senate. Three members are appointed every odd‐numbered year for six‐year terms. In addition, the Governor annually appoints a non‐voting Student Regent for a one‐year term.
Financial Highlights and Overview of the Financial Statements The objective of Management’s Discussion and Analysis (the “MD&A”) is to provide an overview of the financial position and activities of the System as of and for the year ended August 31, 2019, with selected comparative information as of and for the year ended August 31, 2018. The MD&A is prepared by management and should be read in conjunction with the accompanying financial statements and notes. The emphasis of discussion about these financial statements will focus on current year data. Unless otherwise indicated, years in the MD&A refer to the fiscal years ended August 31. The System Comprehensive Annual Financial Report includes three primary financial statements: the Statement of Net Position; the Statement of Revenues, Expenses and Changes in Net Position; and the Statement of Cash Flows. The financial statements of the System have been prepared in accordance with Generally Accepted Accounting Principles (“GAAP”) as prescribed by the Governmental Accounting Standards Board (“GASB”). In addition, the System Comprehensive Annual Financial Report contains the Statement of Financial Position and the Statement of Activities for the following discretely presented component units: the University of North Texas Foundation, Inc. (“UNT Foundation”); and the University of North Texas Health Science Center Foundation (“UNTHSC Foundation”). Each foundation is a separate nonprofit organization. The foundations are essential components of the UNT and HSC programs for university advancement and development of private sources of funding for capital acquisition, operations, endowments, and other purposes relating to the mission of each university. The financial statements of the foundations have been prepared in accordance with GAAP as prescribed by the Financial Accounting Standards Board (“FASB”).
Financial Highlights
Total assets and deferred outflows of resources of the System exceeded its total liabilities and deferred inflows of resources in 2019, resulting in a net position of $719.6 million. Unrestricted net position, which may be used to meet the System’s future obligations, was $106.1 million, or 14.8% of total net position as of August 31, 2019.
The System concluded the 2019 fiscal year with a reduction in net position of $85.1 million, compared to a $21.1 million reduction in 2018. The primary cause for the decrease is a change in accounting methodology used to calculate Other Postemployment Benefits (“OPEB”). Employees Retirement System of Texas (“ERS”), which provides the System’s health insurance benefits, changed their method to calculate OPEB proportionate share by including both active and retired employee contributions for fiscal year 2019
13
UNIVERSITY OF NORTH TEXAS SYSTEM Management’s Discussion and Analysis (Unaudited)
For the Year Ended August 31, 2019
reporting. In fiscal year 2018, OPEB proportionate share was calculated using retiree contributions only. The total impact of OPEB reporting was a $76.5 million increase in payroll related costs over prior year.
The 2019 change in net position before restatements was a reduction of net position of $83.1 million, a decrease of $162.8 million over the prior year. The decrease is primarily attributable to a $139.9 million increase in operating expenses, comprised of salary and wages and payroll related costs due to increased faculty and staff to support enrollment growth, OPEB, and pensions. In addition, increased materials, utilities, and depreciation costs are due to multiple major construction projects placed in service in 2019. The System also had a $25.2 million decrease in nonoperating revenue and expenses which contributed to the net position reduction, due primarily to increased interest expense and fiscal charges related to the issuance of Series 2018A & 2018B bonds in September 2018. The System also had a net decrease in the fair value of investments in fiscal year 2019.
The System continues to make significant investments, $236.4 million in 2019 alone, in numerous capital projects across all institutions to strategically benefit students, faculty, and staff. The System has also committed $414.2 million to fund, with assistance from State supported debt financing and Higher Education Fund (“HEF”) capital appropriations, future capital asset additions and improvements over the next several years. These projects are currently in various stages of completion. The “Capital Asset and Debt Administration” section of the MD&A provides more details pertaining to these strategic investments.
Overview of the Financial Statements These statements are prepared applying the following principles and standards:
Reporting is on the full accrual basis of accounting. All current year revenues and expenses are recognized when earned or incurred, regardless of when the cash is received or disbursed.
Depreciation and amortization expense on capital assets is reported as an operating expense on the Statement of Revenues, Expenses, and Changes in Net Position. The historical cost of capital assets, net of accumulated depreciation and amortization, is reported on the Statement of Net Position.
Revenues and expenses are categorized as operating or nonoperating. Revenues from state appropriations, gifts, and investment income are reported as nonoperating revenue in accordance with GASB Statement No. 35, Basic Financial Statements—and Management’s Discussion and Analysis—for Public Colleges and Universities, as amended.
Statement of Net Position The Statement of Net Position presents the financial position of the System at fiscal year‐end. From the data presented, readers of this statement are able to determine the assets available to continue the operations of the System. They are also able to determine what the System owes to vendors, investors and lending institutions. Finally, the Statement of Net Position provides a picture of the net position and the availability of resources to cover the expenses of the System. The change in net position is one indicator of whether the financial condition has improved or worsened during the fiscal year when considered with nonfinancial facts, such as enrollment levels and the condition of facilities. The Statement of Net Position presents the assets, deferred outflows of resources, liabilities, deferred inflows of resources and net position of the System as of the end of the year. The net position section of the statement is reported by three major categories: 1) Net Investment in Capital Assets, 2) Restricted, and 3) Unrestricted. The Net Investment in Capital Assets section represents the System’s equity in property, plant, and equipment, net of accumulated depreciation and amortization, capital asset related bonds and other debt items. Restricted Net Position is reported for amounts subject to constraints that are either externally imposed or imposed by law. Amounts that are permanently held for investment are divided into two categories: 1) Non‐Expendable and 2) Expendable. Unrestricted Net Position is available for any lawful purpose of the System.
14

UNIVERSITY OF NORTH TEXAS SYSTEM Management’s Discussion and Analysis (Unaudited)
For the Year Ended August 31, 2019
The following table reflects the condensed Comparative Statement of Net Position for the System as of August 31, 2019 and 2018:
The section below includes explanations and management’s analysis of significant changes within the Statement of Net Position:
Total Assets and Deferred Outflows Current Assets The System’s current assets decreased $40.2 million, or 6.3%, in 2019 primarily as a result of a $45.4 million decrease in cash, cash equivalents and short‐term investments from spending bond proceeds received in 2018, and offset by a $3.3 million increase in legislative appropriation receivables. Non‐Current Assets: Net Capital Assets Net capital assets increased $148.1 million, or 11.9%, in 2019 as a result of an increase in capital and intangible assets. This increase is primarily attributable to $236.4 million of capital improvements offset by depreciation and amortization expense of $84.7 million. Major capital improvements included $27.6 million for the new UNT Residence Hall, $13.7 million for the UNT College of Visual Arts & Design Building, $12.3 million for the Athletics Indoor Practice Facility, $10.8 Discovery Park Bio Medical Addition, $6.7 million for the HSC Interdisciplinary Research and Education Building, $30.5 million for the UNT Dallas Student Learning and Success Center, $20.5 million for renovating the Dallas Municipal Building, $28.7 million in equipment, vehicle and library purchases, and $25.0 million for capitalized Building and Software cost additions to depreciable capital assets.
15

UNIVERSITY OF NORTH TEXAS SYSTEM Management’s Discussion and Analysis (Unaudited)
For the Year Ended August 31, 2019
Other Non‐Current Assets The System’s other non‐current assets increased by $28.5 million, or 8.3%, primarily due to a $27.7 million increase in investments related to increases in the long‐term investment pool over the prior year. Additionally, restricted investments increased by $1.6 million due to new investments from growth in permanent endowment contributions. Deferred Outflows of Resources Deferred outflows of resources increased $444.6 million, or 956.3%, in 2019, primarily due to the recognition of deferred outflows of resources related to OPEB and pensions of $375.1 million and $68.6 million, respectively. Total Liabilities and Deferred Inflows Current Liabilities The System’s current liabilities increased $81.5 million, or 19.0%, in 2019 primarily due to a $47.1 million increase in short‐term commercial paper, a $10.9 million increase in OPEB liability, and a $12.8 million increase in unearned revenues related to increased tuition coupled with higher enrollment. Non‐Current Liabilities Non‐current liabilities consist primarily of the non‐current portion of revenue bonds payable, net pension and other postemployment benefits liability, and employees’ compensable leave liability. In total, non‐current liabilities increased $455.2 million, or 46.5%, primarily due to a $306.6 million increase in the net OPEB obligation and an $84.6 million increase in net pension liability. The primary cause for the increase in OPEB liability is due to the ERS change in accounting methodology to include both active and retired employee contributions in the calculation of proportionate share for fiscal year 2019 reporting. The primary reason for the increase in the net pension liability was due to a decrease in the long term assumed rate of return from 8.00% to 7.25%. In addition, the discount rate for pensions decreased from 8.000% to 6.907% for fiscal year 2019 reporting. Revenue bonds payable increased $136.6 million as a result of issuing $172.1 million for Series 2018A & 2018B revenue bonds offset by 2019 debt service payments of $44.5 million. In addition, there was a decrease of $80.5 million in notes and loans payable related to commercial paper refunded for the 2018A & 2018B bond series. Deferred Inflows of Resources Deferred inflows of resources increased $129.4 million, or 205.7%, in 2019 primarily due to a $137.2 million increase related to OPEB, offset by a $7.8 million decrease related to pensions. Total Net Position Total net position represents the residual interest in the System’s total assets and deferred outflows of resources after liabilities and deferred inflows of resources are deducted. Net position decreased by $85.1 million, or 10.6%, in 2019. Net Investment in Capital Assets Net investment in capital assets represents the System’s capital and intangible assets, net of accumulated depreciation and amortization and outstanding debt obligations attributable to the acquisition, construction or improvement of those assets. The net $34.3 million, or 7.8%, increase in net investment in capital assets in 2019 primarily resulted from a $148.1 million increase in net capital assets. This increase was offset by activity related to notes and bonds payable, capital lease obligations, and deferred outflows and inflows of resources related to unamortized gains and losses on refunded bonds. Restricted Net Position Restricted net position primarily includes the System’s permanent investments subject to externally imposed restrictions governing their use. In total, restricted net position increased by $7.6 million, or 5.7%, in 2019 primarily due to continued positive growth in restricted investments, investment income, and fundraising efforts resulting in an increase in restricted contributions across the System.
16

UNIVERSITY OF NORTH TEXAS SYSTEM Management’s Discussion and Analysis (Unaudited)
For the Year Ended August 31, 2019
Unrestricted Net Position Unrestricted net position decreased by $127.0 million, or 54.5%, primarily due to an $87.9 increase in OPEB and pension payroll related costs over prior year. In addition, increased materials, repairs and maintenance, utilities, and depreciation costs of $27.5 million were incurred related to multiple major construction projects in 2019. Statement of Revenues, Expenses and Changes in Net Position The Statement of Revenues, Expenses and Changes in Net Position presents the System’s revenues earned and the expenses incurred during 2019, regardless of when cash is received or paid. Activities are reported as either operating or nonoperating. Generally, operating revenues are earned in exchange for providing goods and services. Operating expenses are incurred in the normal operation of the System, including a provision for depreciation and amortization on capital assets. Certain revenue sources the System relies on for operations include state appropriations, gifts, grants and investment income which are required by GASB Statement No. 35, Basic Financial Statements—and Management’s Discussion and Analysis—for Public Colleges and Universities, as amended, to be classified as nonoperating revenues. Revenues are reported by major source, and expenses are reported on the face of the statement by functional (programmatic) categories as defined by the National Association of College and University Business Officers (“NACUBO”). The following table reflects the System’s Condensed Comparative Statement of Revenues, Expenses and Changes in Net Position for the years ended August 31, 2019 and 2018:
17

UNIVERSITY OF NORTH TEXAS SYSTEM Management’s Discussion and Analysis (Unaudited)
For the Year Ended August 31, 2019
Operating Revenues Operating revenues totaled $657.6 million in 2019, an increase of $3.3 million, or 0.5%, over 2018. The System’s primary sources of operating revenues are tuition and fees, and federal, state, local, and private grants. Net tuition and fees, representing 58.1% of operating revenues, are reflected in the financial statements with associated discounts and allowances shown separately. Net tuition and fees increased $16.6 million as a result of increased enrollment and increased tuition rates throughout the System. Federal, state, local, and private grant revenues, representing 16.1% of operating revenues, are primarily from governmental and private sources and are related to research programs that normally provide for the recovery of direct and indirect costs. Grant related revenues decreased by $3.6 million due to agreements that expired and were not renewed or replaced with similar agreements in 2019. Net professional fees revenue and other sales of goods and services revenue decreased $13.9 million due to decreased medical and correctional services provided by HSC. Auxiliary enterprise revenue increased $3.1 million as a result of increased parking, housing, and food service activity. The chart below shows total operating revenues by major source for the year ended August 31, 2019:
Operating Expenses Operating expenses totaled $1,143.7 million in 2019, an increase of $139.9 million, or 13.9%, over 2018, primarily due to an $87.9 million increase in OPEB and pension payroll related costs. There was also an increase of $20.8 million in salaries, wages, and payroll related costs to provide qualified faculty and staff to meet enrollment growth and support System strategic goals. In addition, there were increased materials and supplies, repairs and maintenance, utilities, and depreciation costs of $27.5 million incurred related to multiple major construction projects and new buildings placed in service during 2019.
18
UNIVERSITY OF NORTH TEXAS SYSTEM Management’s Discussion and Analysis (Unaudited)
For the Year Ended August 31, 2019
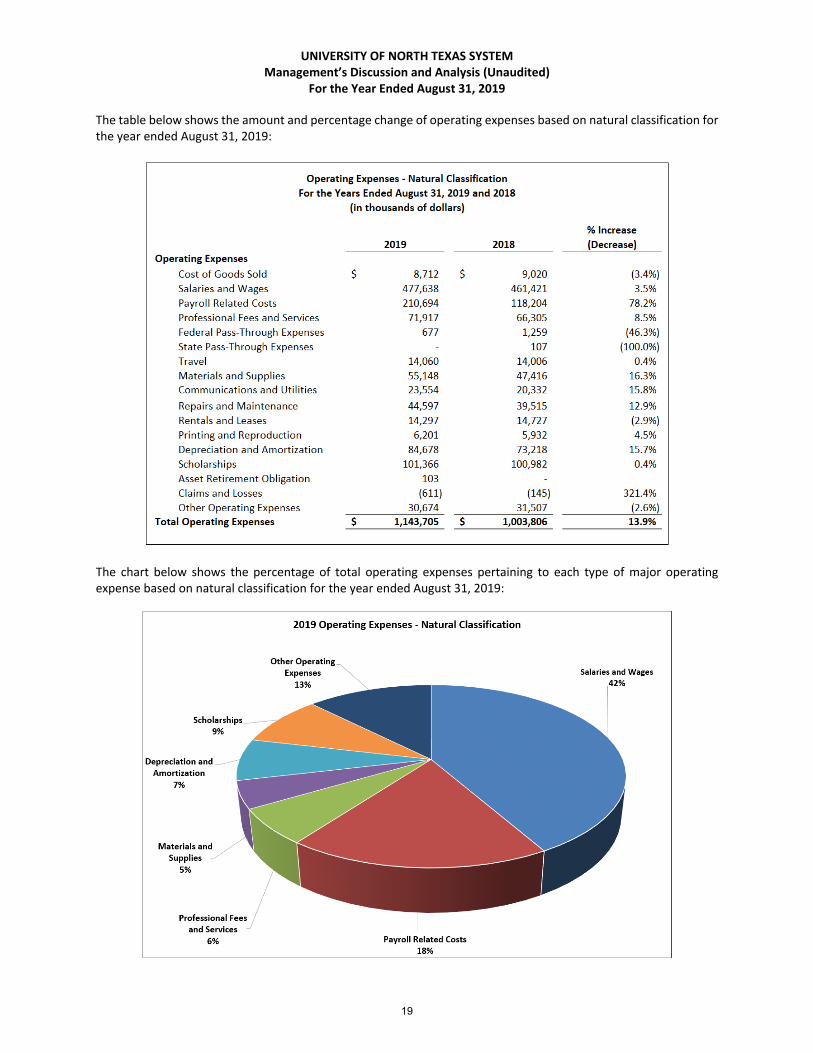
The table below shows the amount and percentage change of operating expenses based on natural classification for the year ended August 31, 2019:
The chart below shows the percentage of total operating expenses pertaining to each type of major operating expense based on natural classification for the year ended August 31, 2019:
19

UNIVERSITY OF NORTH TEXAS SYSTEM Management’s Discussion and Analysis (Unaudited)
For the Year Ended August 31, 2019
The table below shows the amount and percentage change of operating expenses based on NACUBO functional (programmatic) classification for the year ended August 31, 2019:
The chart below shows the percentage of total operating expenses pertaining to each type of operating expense based on NACUBO functional (programmatic) classification for the year ended August 31, 2019:
20

UNIVERSITY OF NORTH TEXAS SYSTEM Management’s Discussion and Analysis (Unaudited)
For the Year Ended August 31, 2019
Nonoperating Revenues and Expenses Certain significant recurring revenues and expenses are considered nonoperating. The System’s primary nonoperating revenues come from state appropriations, federal Pell Grant revenue, gifts, investment income, and net increase in fair market value of investments. The System’s primary nonoperating expenses are interest expense and fiscal charges and other nonoperating expenses. The total nonoperating revenues and expenses decreased $25.2 million, or 6.9%, over the prior year. The variance is primarily due to an $11.6 million increase in interest expense and fiscal charges related to Series 2018A & 2018B bonds issued early in the fiscal year and an $8.8 million increase in the net decrease in fair market value of investments. The System recognized a $2.1 million increase in loss on sale of capital assets related to the retirement and transfer of shuttle buses to the Denton County Transit Authority. Additionally, other nonoperating expenses increased by $2.9 million over the prior year due to an increase in debt issuance costs and recognition of expense related to the wind down of the Perkins loan program. Other Revenues, Expenses, and Transfers Other revenues, expenses, and transfers comprised of capital and endowment related additions and transfers decreased $900 thousand, or 1.4%, in 2019. HEF comprises the majority of the activity in this category. Annual HEF‐related revenue totaled $56.8 million, no change from 2018, and is reported as capital appropriations rather than operating or nonoperating revenue. Capital contributions increased $1.6 million due to increased gifts for capital construction projects. Contributions to permanent endowments decreased $2.7 million, primarily the result of a planned reduction in the second year of an endowment contract. Capital Asset and Debt Administration Investments in capital asset additions were $236.4 million in 2019. Major capital project activity included:
Building Improvements (UNT) – College of Visual Arts and Design Building and UNT Residence Hall
Building Improvements (HSC) – Interdisciplinary Research and Education Building
Building Improvements (UNTD) – Dallas Student Learning and Success Center
Building Improvements (System Administration) – Dallas Municipal Building The System has committed $414.2 million to capital asset additions and improvements that are currently in various stages of completion. These additions and improvements primarily consist of new buildings or renovations to existing buildings, including the Interdisciplinary Research Building at HSC, the College of Visual Arts and Design at UNT, residence and dining halls at UNT, the Dallas Municipal Building for the future use by UNT Dallas College of Law, and the Student Learning and Success Center at UNT Dallas. More detailed information regarding the System’s capital additions and commitments is provided in Note 2, Capital Assets, and Note 12, Contingencies and Commitments, in the Notes to the Comprehensive Financial Statements. Revenue bonds payable represents the largest portion of the System’s liabilities. Current and non‐current revenue bonds payable increased $139.0 million to $870.5 million in 2019. All bonds related to financing of current and prior years’ construction needs reflect “Aa2” and “AA” credit ratings from two major bond rating agencies, Moody’s and Fitch, respectively. More detailed information regarding the System’s bonded indebtedness is provided in Note 5, Long‐Term Liabilities, and Note 6, Bonded Indebtedness, in the accompanying Notes to the Comprehensive Financial Statements.
Economic Outlook
The System’s primary sources of revenue are tuition and fees and legislative appropriations. Enrollment growth, program expansion, and new campus buildings contributed to a positive outlook for the System. For 2020, net tuition and fees revenues are budgeted at an increase of $11.5 million, or 2.8%, over 2019. This revenue increase is the result of full‐time student equivalent enrollment growth, nominal tuition rate increases, and the implementation of differential tuition plans. Between fall 2015 and fall 2019, enrollment increased 8.5% system‐wide.
21
UNIVERSITY OF NORTH TEXAS SYSTEM Management’s Discussion and Analysis (Unaudited)
For the Year Ended August 31, 2019
In the recently concluded session, the 86th Texas Legislature passed a budget that included $15.85 billion in funding for higher education for the 2020‐2021 biennium, a $942 million (6.3%) increase over the 2018‐2019 biennium. Much of the increase is attributable to growth in formula funding, non‐formula items (formerly special items), and research funding. Formula funding for General Academic Institutions was increased by $201.4 million from prior biennium levels. Non‐formula support items were again a topic of discussion and the state allocated more than $200 million in new non‐formula support items for 2020‐2021. The session culminated in a two‐year appropriations increase to the System institutions of $34.1 million from 2018‐2019 levels. Fiscal year 2020 budgeted legislative appropriation revenues for the System are $22.6 million higher than 2019. Budgeted amounts include continued funding for specialized initiatives and unique programs recognized as deserving state support. These areas of excellence include the University of North Texas Health Science Center’s Institute for Patient Safety and Preventable Harm, HSC’s Texas Missing Persons and Human Identification Program, University of North Texas’ Texas Academy of Mathematics and Science, and the University of North Texas Dallas College of Law (“College of Law”). Construction projects at System institutions supported by the 84th Legislature have been completed and are open for their intended use. These include the Interdisciplinary Research Building at the HSC, Student Success and Learning Center at UNTD, College of Visual Arts and Design facility at UNT, and the renovation of the historic Dallas Municipal Building in downtown Dallas for the College of Law. These projects have all been supported with State funds to continue growth, educational excellence, and research capacity at System institutions. The System continues to maintain a ‘stable’ outlook from Fitch and Moody’s for debt financing which has enabled these construction projects to progress on schedule. UNT is one of the state’s largest public universities and one of the nation’s 115 top‐tier research universities by the Carnegie Classification. UNT awarded a record 9,628 degrees in fiscal year 2019 and anticipates exceeding that number in 2020. Strategic initiatives for growth and revenue include expanding off‐site educational opportunities for working professionals—delivering UNT degrees in new locations and modalities. UNT’s New College at Frisco is progressing in its efforts to build a $100 million facility near the heart of Frisco, one of the fastest growing cities in the country. This new campus will house 5,000 students able to receive full or partial degrees in a number of different disciplines without the need to commute to the main campus Frisco and the surrounding area is home to many corporations including Toyota, the Dallas Cowboys, Texas Instruments, and many more, offering opportunities for collaboration and employment for UNT students. UNTD had record enrollment in Fall 2019 of 4,059 students and its record growth is expected to continue its current pace. Construction on the new Student Learning and Success Center (“SLSC”) completed and it now serves as a one‐stop‐shop for student support services. The SLSC houses such services as advising, registration, financial aid, and tutoring, as well as providing additional space for large events and a modern library. The UNTD College of Law continues efforts in its bid for full accreditation and recently welcomed the first class into the historic Dallas Municipal Building after completing a $72 million renovation. The HSC continues to expand some of its most recent initiatives, including achieving preliminary accreditation for and welcoming the first class into the Fort Worth M.D. School, an innovative partnership with Texas Christian University (“TCU”); launching a first‐of‐its‐kind national clinical trial aimed at determining if a simple blood test could be used to diagnose Alzheimer’s disease; and expanded DNA work for the state, which is focused on reducing the sexual assault case backlog and increasing efforts to identify victims of human trafficking. The Interdisciplinary Research and Education Building has completed construction and is now home to the UNT System College of Pharmacy, the North Texas Eye Research Institute, and the TCU and UNTHSC School of Medicine. Additionally, UNTHSC plans to create even more residency positions through partnerships with regional health care systems.
22

COMPREHENSIVE
FINANCIAL STATEMENTS
of the
UNIVERSITY OF NORTH TEXAS SYSTEM
DALLAS, TEXAS
For the Year Ended August 31, 2019
23

UNIVERSITY OF NORTH TEXAS SYSTEMStatement of Net Position
August 31,2019
ASSETS Current Assets
Cash and Cash Equivalents:Cash on Hand 105,603.94$ Cash in Bank 20,585,662.70 Cash in State Treasury 15,465,629.67 Cash Equivalents 183,272,500.93
Restricted Cash and Cash Equivalents:Cash on Hand 13,238.52 Cash in Bank 4,804,521.87 Cash Equivalents 49,640,087.48
Legislative Appropriations 133,751,333.17 Receivables From:
Accounts Receivable, net 100,048,055.32 Federal, net 10,318,786.12 Other Intergovernmental 858,127.37 Clinical Practice, net 2,937,821.08 Gifts, Pledges and Donations, net 435,663.81 Interest and Dividends 2,036,912.54 Other Receivables, net 6,300,403.31
Due From Other Agencies 7,934,508.76 Consumable Inventories 580,029.30 Merchandise Inventories 2,554,071.53 Prepaid Items 54,187,402.55 Loans and Contracts 6,918,965.05 Other Current Assets 254,790.00
Total Current Assets 603,004,115.02$
Non‐Current Assets Restricted Investments 80,799,617.16$ Loans and Contracts 3,394,495.41 Investments 282,295,861.37 Gifts, Pledges and Donations 3,771,118.00 Capital Assets:
Non‐Depreciable or Non‐Amortizable 160,007,733.41 Depreciable or Amortizable, Net 1,233,130,757.26
Total Non‐Current Assets 1,763,399,582.61$ Total Assets 2,366,403,697.63$
DEFERRED OUTFLOWS OF RESOURCESDeferred Outflows of Resources 491,094,948.02$
Total Deferred Outflows of Resources 491,094,948.02$
TOTAL ASSETS AND DEFERRED OUTFLOWS OF RESOURCES 2,857,498,645.65$
Continued on Next Page
As of August 31, 2019
See Accompanying Notes to the Comprehensive Financial Statements
24

UNIVERSITY OF NORTH TEXAS SYSTEMStatement of Net Position
August 31,2019
As of August 31, 2019
LIABILITIES Current Liabilities
Payables From:Accounts Payable 66,750,959.86$ Payroll Payable 44,296,837.67 Other Payables 4,957,686.67 Interest 12,995,522.14
Due To Other Agencies 50,171.27 Unearned Revenue 261,062,994.38 Notes and Loans Payable 49,180,000.00 Revenue Bonds Payable 51,000,223.18 Claims and Judgments 511,259.00 Employees' Compensable Leave 4,853,883.62 Capital Lease Obligations 1,879,301.53 Net OPEB Liability 11,293,670.00 Funds Held for Others 2,198,068.54
Total Current Liabilities 511,030,577.86$
Non‐Current LiabilitiesRevenue Bonds Payable 819,475,043.75$ Claims and Judgments 323,284.00 Employees' Compensable Leave 21,420,449.54 Capital Lease Obligations 4,830,517.07 Asset Retirement Obligation 2,427,750.00 Net Pension Liability 191,696,519.00 Net OPEB Liability 392,589,832.00 Other Non‐Current Liabilities 1,865,423.54
Total Non‐Current Liabilities 1,434,628,818.90$ Total Liabilities 1,945,659,396.76$
DEFERRED INFLOWS OF RESOURCESDeferred Inflows of Resources 192,254,537.12$
Total Deferred Inflows of Resources 192,254,537.12$
TOTAL LIABILITIES AND DEFERRED INFLOWS OF RESOURCES 2,137,913,933.88$
NET POSITIONNet Investment in Capital Assets 472,337,888.32$ Restricted For:
Funds Held as Permanent InvestmentsNon‐Expendable 55,359,275.49 Expendable 32,475,438.18
Other Restricted 53,264,612.71 Unrestricted 106,147,497.07
Total Net Position 719,584,711.77$
See Accompanying Notes to the Comprehensive Financial Statements
25

August 31, 2019 August 31, 2018ASSETSCash and Cash Equivalents 16,105,036$ 13,206,667$ Investments 223,221,634 355,984,317 Contributions Receivable, Net 11,315,540 6,718,043 Real Property 31,623 33,164 Other Assets 8,198 7,500 Cash Value ‐ Life Insurance Policies 559,217 551,315 Assets Held Under Split‐Interest Agreements 5,786,927 5,589,186
Total ASSETS 257,028,175$ 382,090,192$
LIABILITIESAccounts Payable and Accrued Expenses 154,602$ 2,001,924$ Agency Funds 397,555 460,317 Liabilities Under Split‐Interest Agreements 2,287,548 2,477,704 Assets Held for Others 58,798,098 217,024,679
Total LIABILITIES 61,637,803$ 221,964,624$
NET ASSETSWithout Donor Restrictions: Undesignated 1,334,283$ 942,704$ Board Designated Endowments 608,078 390,000 Board Designated for Reserves 2,008,584 1,869,728 Total Without Donor Restrictions 3,950,945$ 3,202,432$
With Donor Restrictions: Purpose Restrictions 12,600,877$ 9,782,376$ Perpetual in Nature 179,137,259 147,321,025 Fair value of Endowments Below Historical Cost (298,709) (180,265) Total With Donor Restrictions 191,439,427$ 156,923,136$
Total NET ASSETS 195,390,372$ 160,125,568$
Total LIABILITIES & NET ASSETS 257,028,175$ 382,090,192$
UNIVERSITY OF NORTH TEXAS FOUNDATION, INC.Statements of Financial PositionAs of August 31, 2019 and 2018
See Accompanying Notes to the Financial Statements
26

August 31, 2019 August 31, 2018
ASSETS
Cash 1,305,137$ 1,037,018$
Investments, including $54,258,416 and $36,962,213 held
on behalf of others as of August 31, 2019 and 2018 74,752,266 55,697,352
Pledges Receivable 6,001,198 4,826,228
Prepaids 144,299 100,000 Total ASSETS 82,202,900$ 61,660,598$
LIABILITIES
Due to Related Party 54,258,743$ 36,962,213$
Pledge Payable ‐ 75,000
Unearned Revenue 200,000 ‐
Total LIABILITIES 54,458,743$ 37,037,213$
NET ASSETS
Net Assets without Donor Restrictions 2,953,668$ 2,513,275$
Net Assets with Donor Restrictions 24,790,489 22,110,110
Total NET ASSETS 27,744,157$ 24,623,385$
Total LIABILITIES & NET ASSETS 82,202,900$ 61,660,598$
UNIVERSITY OF NORTH TEXAS HEALTH SCIENCE CENTER FOUNDATION
Statements of Financial Position
As of August 31, 2019 and 2018
See Accompanying Notes to the Financial Statements
27

UNIVERSITY OF NORTH TEXAS SYSTEMStatement of Revenues, Expenses and Changes in Net PositionFor the Year Ended August 31, 2019
August 31,2019
OPERATING REVENUESTuition and Fees 500,762,381.66$ Discounts and Allowances (118,490,709.11)
Professional Fees 25,430,549.34 Discounts and Allowances (14,012,392.80)
Auxiliary Enterprises 80,314,772.07 Sales of Goods and Services 74,251,110.52 Federal Grant Revenue 61,065,611.93 Federal Pass‐Through Revenue 1,593,216.10 State Grant Revenue 2,175,603.91 State Grant Pass‐Through Revenue 31,002,310.92 Other Contracts and Grants 10,110,224.47 Other Operating Revenues 3,414,748.64
Total Operating Revenues 657,617,427.65$
OPERATING EXPENSES (1)
Instruction 315,778,027.47$ Research 104,917,404.44 Public Service 54,771,124.98 Academic Support 92,996,011.60 Student Services 100,968,889.88 Institutional Support 135,027,705.61 Operation and Maintenance of Plant 81,927,237.65 Scholarships and Fellowships 99,279,170.99 Auxiliary Enterprises 73,361,219.05 Depreciation and Amortization 84,678,390.86
Total Operating Expenses 1,143,705,182.53$
Operating Loss (486,087,754.88)$
NONOPERATING REVENUES (EXPENSES)Legislative Appropriations (GR) 222,116,175.00$ Additional Appropriations (GR) 48,920,108.59 Federal Revenue 65,868,749.08 Gifts 18,947,681.79 Investment Income 22,136,002.53 Interest Expense and Fiscal Charges (29,983,896.01) Loss on Sale of Capital Assets (2,188,613.59) Net Decrease in Fair Value of Investments (4,235,573.76) Other Nonoperating Revenues 812,476.86 Other Nonoperating Expenses (3,141,282.00)
Total Nonoperating Revenues (Expenses) 339,251,828.49$
Loss Before Other Revenues, Expenses and Transfers (146,835,926.39)$
OTHER REVENUES, EXPENSES AND TRANSFERSCapital Contributions 3,068,530.66$ Capital Appropriations (HEF) 56,766,916.00 Contributions To Permanent and Term Endowments 2,225,871.45 Interagency Transfers of Capital Assets‐Decrease (7,517.16) Transfers From Other State Agencies 631,224.00 Transfers To Other State Agencies (12,706.07) Legislative Transfers In 1,083,604.00 Legislative Appropriation Lapses (3,895.82)
Total Other Revenues, Expenses and Transfers 63,752,027.06$
CHANGE IN NET POSITION (83,083,899.33)$
Beginning Net Position 804,663,888.39$ Restatement (1,995,277.29) Beginning Net Position, as Restated 802,668,611.10$
ENDING NET POSITION 719,584,711.77$
(1) See Matrix of Operating Expenses Reported by Function.
See Accompanying Notes to the Comprehensive Financial Statements
28

UNIVERSITY OF NORTH TEXAS SYSTEMMatrix of Operating Expenses Reported by FunctionFor the Year Ended August 31, 2019
Operation and DepreciationPublic Academic Student Institutional Maintenance of Scholarships Auxiliary and Total
Operating Expenses Instruction Research Service Support Services Support Plant and Fellowships Enterprises Amortization Expenditures
Cost of Goods Sold 188,795.19$ ‐$ 149,060.27$ 9,721.52$ 22,804.72$ 628,596.39$ ‐$ ‐$ 7,713,293.98$ ‐$ 8,712,272.07$
Salaries and Wages 184,888,614.97 63,117,669.15 18,909,556.46 48,384,998.32 53,338,062.17 66,886,984.59 17,472,886.90 388,938.44 24,249,900.70 ‐ 477,637,611.70
Payroll Related Costs 102,704,762.15 17,463,970.77 5,275,871.90 17,526,408.65 17,047,840.24 31,118,173.78 6,856,008.69 2,782.28 12,698,512.87 ‐ 210,694,331.33
Professional Fees and Services 5,297,894.69 8,716,851.99 26,987,725.30 5,690,282.15 6,914,392.21 11,275,894.69 3,377,459.34 ‐ 3,656,562.81 ‐ 71,917,063.18
Federal Pass‐Through Expenses 22,235.20 654,361.35 ‐ ‐ ‐ ‐ ‐ ‐ ‐ ‐ 676,596.55
Travel 2,977,891.44 2,040,379.58 478,093.53 2,343,531.78 5,166,776.93 890,037.52 67,574.94 ‐ 96,275.69 ‐ 14,060,561.41
Materials and Supplies 9,179,874.16 7,588,075.97 1,058,169.92 9,668,755.21 4,689,561.40 5,480,380.35 13,278,950.27 ‐ 4,204,306.76 ‐ 55,148,074.04
Communications and Utilities 579,967.44 61,083.14 49,959.64 464,248.68 1,611,102.82 1,691,842.44 13,074,067.51 ‐ 6,021,541.92 ‐ 23,553,813.59
Repairs and Maintenance 1,400,257.78 949,113.78 292,544.68 1,989,917.37 1,774,783.70 5,694,845.68 23,609,161.70 ‐ 8,886,192.02 ‐ 44,596,816.71
Rentals and Leases 1,662,176.64 438,391.60 264,549.78 1,340,909.41 2,607,065.59 3,475,102.95 3,609,259.29 ‐ 899,505.44 ‐ 14,296,960.70
Printing and Reproduction 650,321.67 235,598.20 86,764.56 1,144,435.83 1,994,296.70 1,589,328.69 32,574.51 ‐ 467,291.65 ‐ 6,200,611.81
Depreciation and Amortization ‐ ‐ ‐ ‐ ‐ ‐ ‐ ‐ ‐ 84,678,390.86 84,678,390.86
Scholarships 1,017,297.35 1,207,098.32 259,515.99 ‐ ‐ ‐ ‐ 98,882,255.34 ‐ ‐ 101,366,167.00
Asset Retirement Obligation ‐ ‐ ‐ ‐ ‐ ‐ 103,139.90 ‐ ‐ ‐ 103,139.90
Claims and Losses (630,434.00) ‐ ‐ ‐ ‐ 18,718.17 600.00 ‐ ‐ ‐ (611,115.83)
Other Operating Expenses 5,838,372.79 2,444,810.59 959,312.95 4,432,802.68 5,802,203.40 6,277,800.36 445,554.60 5,194.93 4,467,835.21 ‐ 30,673,887.51
Total Operating Expenses 315,778,027.47$ 104,917,404.44$ 54,771,124.98$ 92,996,011.60$ 100,968,889.88$ 135,027,705.61$ 81,927,237.65$ 99,279,170.99$ 73,361,219.05$ 84,678,390.86$ 1,143,705,182.53$
29

Without Donor
Restrictions
With Donor
Restrictions Total
REVENUES, GAINS AND OTHER SUPPORT:
Gifts 45,198$ 40,626,375$ 40,671,573$
Grant Revenue ‐ 597,917 597,917
Net Investment Return (68,389) 1,253,781 1,185,392
Other Income ‐ 191,408 191,408
Change in Value of Split‐Interest Agreements ‐ 152,072 152,072
Change in Cash Value of Life Insurance Policies ‐ 7,902 7,902
Asset Management Fee Income 2,132,223 ‐ 2,132,223
Release of Donor Restrictions 8,314,214 (8,314,214) ‐
Transfers/Changes in Donor Restrictions (1,050) 1,050 ‐
Total REVENUES, GAINS AND OTHER SUPPORT 10,422,196$ 34,516,291$ 44,938,487$
EXPENSES:
PROGRAM SERVICES:
Support of UNT:
Distributions to UNT 3,232,601$ 3,232,601$
Scholarships & Awards 2,307,249 2,307,249
Grant Support to UNT 597,917 597,917
Board Designated Grants to University 173,250 173,250
Services/Expenses for Programs 599,331 599,331
Internal Mangement Fees 1,559,067 1,559,067
Other Support Provided 15,550 15,550
Distributions to Other Institutions 17,000 17,000
Total PROGRAM SERVICES 8,501,965$ 8,501,965$
MANAGEMENT and GENERAL EXPENSES:
Salaries and Benefits 953,690$ 953,690$
Administrative Expenses 20,197 20,197
Professional Development & Travel 36,112 36,112
Consulting Services 51,794 51,794
Professional Fees 58,037 58,037
Office, Computer Equipment and Software 17,341 17,341
Bank Charges and Credit Card Discount 5,953 5,953
Insurance 20,719 20,719
Strategic Planning 7,875 7,875
Total MANAGEMENT and GENERAL EXPENSES 1,171,718$ 1,171,718$
Total EXPENSES 9,673,683$ 9,673,683$
CHANGE IN NET ASSETS 748,513$ 34,516,291$ 35,264,804$
Net Assets, Beginning of Year 3,202,432 156,923,136 160,125,568
NET ASSETS, END OF YEAR 3,950,945$ 191,439,427$ 195,390,372$
UNIVERSITY OF NORTH TEXAS FOUNDATION, INC.
Statements Of Activities
For the Years Ended August 31, 2019 and 2018
2019
See Accompanying Notes to the Financial Statements
30
Without Donor
Restrictions
With Donor
Restrictions Total
REVENUES, GAINS AND OTHER SUPPORT:
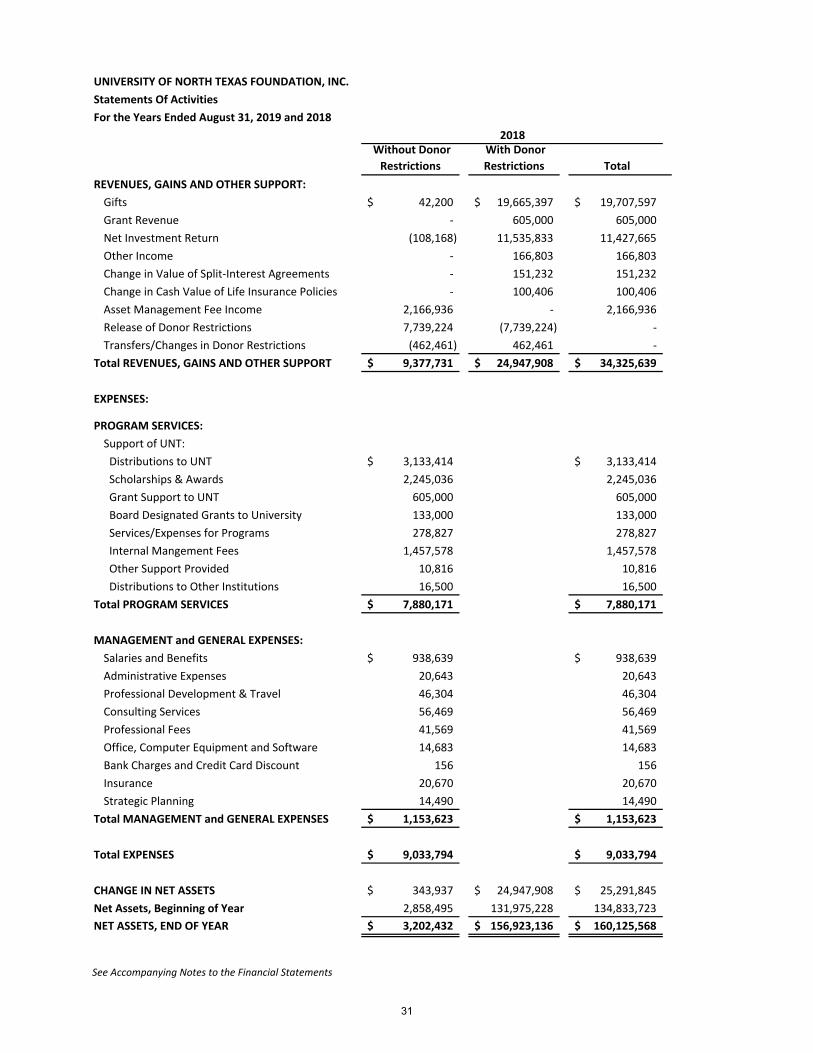
Gifts 42,200$ 19,665,397$ 19,707,597$
Grant Revenue ‐ 605,000 605,000
Net Investment Return (108,168) 11,535,833 11,427,665
Other Income ‐ 166,803 166,803
Change in Value of Split‐Interest Agreements ‐ 151,232 151,232
Change in Cash Value of Life Insurance Policies ‐ 100,406 100,406
Asset Management Fee Income 2,166,936 ‐ 2,166,936
Release of Donor Restrictions 7,739,224 (7,739,224) ‐
Transfers/Changes in Donor Restrictions (462,461) 462,461 ‐
Total REVENUES, GAINS AND OTHER SUPPORT 9,377,731$ 24,947,908$ 34,325,639$
EXPENSES:
PROGRAM SERVICES:
Support of UNT:
Distributions to UNT 3,133,414$ 3,133,414$
Scholarships & Awards 2,245,036 2,245,036
Grant Support to UNT 605,000 605,000
Board Designated Grants to University 133,000 133,000
Services/Expenses for Programs 278,827 278,827
Internal Mangement Fees 1,457,578 1,457,578
Other Support Provided 10,816 10,816
Distributions to Other Institutions 16,500 16,500
Total PROGRAM SERVICES 7,880,171$ 7,880,171$
MANAGEMENT and GENERAL EXPENSES:
Salaries and Benefits 938,639$ 938,639$
Administrative Expenses 20,643 20,643
Professional Development & Travel 46,304 46,304
Consulting Services 56,469 56,469
Professional Fees 41,569 41,569
Office, Computer Equipment and Software 14,683 14,683
Bank Charges and Credit Card Discount 156 156
Insurance 20,670 20,670
Strategic Planning 14,490 14,490
Total MANAGEMENT and GENERAL EXPENSES 1,153,623$ 1,153,623$
Total EXPENSES 9,033,794$ 9,033,794$
CHANGE IN NET ASSETS 343,937$ 24,947,908$ 25,291,845$
Net Assets, Beginning of Year 2,858,495 131,975,228 134,833,723
NET ASSETS, END OF YEAR 3,202,432$ 156,923,136$ 160,125,568$
UNIVERSITY OF NORTH TEXAS FOUNDATION, INC.
Statements Of Activities
For the Years Ended August 31, 2019 and 2018
2018
See Accompanying Notes to the Financial Statements
31

Net Assets
Without Donor
Restrictions
Net Assets With
Donor
Restrictions Total
SUPPORT AND REVENUE
Contributions ‐$ 7,291,694$ 7,291,694$
Fundraising ‐ 493,060 493,060
Realized Gain on Investments ‐ 141,944 141,944
Unrealized Gain (Loss) on Investments ‐ (226,337) (226,337)
Investment Income, Net of Direct Expenses (22,407) 504,920 482,513
Releases from Restriction 5,524,902 (5,524,902) ‐
Total SUPPORT AND REVENUE 5,502,495$ 2,680,379$ 8,182,874$
EXPENSES
Program Expenses
Gifts and Scholarships 4,591,883$ ‐$ 4,591,883$
Supporting Services
Management and General
Professional Fees 93,912 ‐ 93,912
Alumni & Student Expenses 52,333 ‐ 52,333
Fundraising Expenses 323,974 ‐ 323,974
Total EXPENSES 5,062,102$ ‐$ 5,062,102$
CHANGE IN NET ASSETS 440,393$ 2,680,379$ 3,120,772$
Net Assets, Beginning of Year, as Previously Reported 2,513,275$ 22,110,110$ 24,623,385$
Prior Period Adjustment ‐ ‐ ‐
Net Assets, Beginning of Year, as Restated 2,513,275$ 22,110,110$ 24,623,385$
NET ASSETS, END OF YEAR 2,953,668$ 24,790,489$ 27,744,157$
UNIVERSITY OF NORTH TEXAS HEALTH SCIENCE CENTER FOUNDATION
Statements of Activities
Years Ended August 31, 2019 and 2018
2019
See Accompanying Notes to the Financial Statements
32

Net Assets
Without Donor
Restrictions
Net Assets With
Donor
Restrictions Total
SUPPORT AND REVENUE
Contributions ‐$ 10,146,158$ 10,146,158$
Fundraising ‐ 670,064 670,064
Realized Gain on Investments ‐ 1,759,867 1,759,867
Unrealized Gain (Loss) on Investments ‐ (658,662) (658,662)
Investment Income, Net of Direct Expenses (91,702) 116,499 24,797
Releases from Restriction 5,829,655 (5,829,655) ‐
Total SUPPORT AND REVENUE 5,737,953$ 6,204,271$ 11,942,224$
EXPENSES
Program Expenses
Gifts and Scholarships 5,152,555$ ‐$ 5,152,555$
Supporting Services
Management and General
Professional Fees 120,545 ‐ 120,545
Alumni & Student Expenses 54,433 ‐ 54,433
Fundraising Expenses 189,852 ‐ 189,852
Total EXPENSES 5,517,385$ ‐$ 5,517,385$
CHANGE IN NET ASSETS 220,568$ 6,204,271$ 6,424,839$
Net Assets, Beginning of Year, as Previously Reported 2,292,707$ 15,475,572$ 17,768,279$
Prior Period Adjustment ‐ 430,267 430,267
Net Assets, Beginning of Year, as Restated 2,292,707$ 15,905,839$ 18,198,546$
NET ASSETS, END OF YEAR 2,513,275$ 22,110,110$ 24,623,385$
UNIVERSITY OF NORTH TEXAS HEALTH SCIENCE CENTER FOUNDATION
Statements of Activities
Years Ended August 31, 2019 and 2018
2018 (As Restated)
See Accompanying Notes to the Financial Statements
33

UNIVERSITY OF NORTH TEXAS SYSTEMStatement of Cash FlowsFor the Year Ended August 31, 2019
August 31,2019
CASH FLOWS FROM OPERATING ACTIVITIESProceeds from Customers 88,625,335.88$ Proceeds from Tuition and Fees 385,900,429.77 Proceeds from Research Grants and Contracts 114,808,128.43 Proceeds from Loan Programs 5,773.01 Proceeds from Auxiliaries 80,314,772.07 Proceeds from Other Revenues 3,192,316.91 Payments to Suppliers for Goods and Services (257,477,878.94) Payments to Employees (568,128,987.07) Payments for Loans Provided (474,747.65) Payments for Other Expenses (136,151,473.79) Net Cash Used by Operating Activities (289,386,331.38)$
CASH FLOWS FROM NONCAPITAL FINANCING ACTIVITIESProceeds from State Appropriations 235,063,937.69$ Proceeds from Gifts 20,551,512.50 Proceeds from Endowments 2,514,883.36 Proceeds from Transfers from Other Agencies 631,224.00 Proceeds from Legislative Transfers 1,083,604.00 Proceeds from Grant Receipts 65,868,749.08 Proceeds from Other Revenues 812,476.86 Payments for Transfers to Other Agencies (12,706.07) Payments for Legislative Appropriation Lapses (3,895.82) Payments for Other Uses (135,432.60) Net Cash Provided by Noncapital Financing Activities 326,374,353.00$
CASH FLOWS FROM CAPITAL AND RELATED FINANCING ACTIVITIESProceeds from Sale of Capital Assets 110,032.16$ Proceeds from State Appropriations 56,766,916.00 Proceeds from Debt Issuance 236,728,943.70 Proceeds from Capital Contributions 1,985,981.40 Payments for Additions to Capital Assets (212,813,584.53) Payments for Capital Leases (2,115,934.28) Payments of Principal on Debt Issuance (123,910,000.00) Payments of Other Costs of Debt Issuance (1,156,437.77) Payments of Interest on Debt Issuance (27,607,872.30) Net Cash Used by Capital and Related Financing Activities $ (72,011,955.62)
CASH FLOWS FROM INVESTING ACTIVITIESProceeds from Sale of Investments 874,667,905.69$ Proceeds from Interest and Investment Income 22,850,601.90 Payments to Acquire Investments (890,505,351.18)
7,013,156.41$
(28,010,777.59)$
301,898,022.70$ 273,887,245.11$
219,429,397.24$ 54,457,847.87 273,887,245.11$
Net Cash Provided by Investing Activities
Net Decrease in Cash and Cash Equivalents
Cash and Cash Equivalents, September 1, 2018Cash and Cash Equivalents, August 31, 2019
Cash and Cash EquivalentsRestricted Cash and Cash EquivalentsCash and Cash Equivalents, August 31, 2019
See Accompanying Notes to the Comprehensive Financial Statements
34

UNIVERSITY OF NORTH TEXAS SYSTEMStatement of Cash FlowsFor the Year Ended August 31, 2019
August 31,2019
RECONCILIATION OF OPERATING LOSS TO NET CASH USEDBY OPERATING ACTIVITIES
Operating Loss (486,087,754.88)$ Adjustments to Reconcile Operating Loss to Net Cash Usedby Operating Activities:Depreciation and Amortization Expense 84,678,390.86$ Pension Expense 20,381,349.00 OPEB Expense 79,462,900.00 Asset Retirement Obligation Expense 103,139.90 Employee Benefits Paid by State 32,682,637.41 Changes in Assets and Liabilities:
Decrease in Receivables 2,453,068.76 Increase in Inventories (17,592.44) Increase in Prepaid Expenses (5,313,728.69) Increase in Loans and Contracts (468,974.64) Increase in Other Assets (178,765.00) Increase in Deferred Outflows of Resources ‐ Pensions (68,555,919.00) Increase in Deferred Outflows of Resources ‐ OPEB (375,071,797.00) Decrease in Payables (14,608,365.79) Increase in Unearned Revenue 12,754,313.45 Decrease in Benefits Payable (102,862,978.00) Increase in Liabilities to Employees for Defined Benefit Pensions 84,552,669.00 Increase in Liabilities to Employees for Defined Benefit OPEB 317,491,473.00 Decrease in Other Liabilities (246,590.32) Decrease in Deferred Inflows of Resources ‐ Pensions (7,760,926.00) Increase in Deferred Inflows of Resources ‐ OPEB 137,227,119.00 Total Adjustments 196,701,423.50$
Net Cash Used by Operating Activities (289,386,331.38)$
NON‐CASH TRANSACTIONSNet Change in Fair Value of Investments (4,235,573.76)$ Donation of Capital Assets 1,082,549.26 Borrowing Under Capital Lease Purchase 5,365,029.84 Loss on Sale of Capital Assets (2,188,613.59) Amortization of Bond Premiums 6,208,161.35 Amortization of Deferred Inflows/Outflows from Refunding Bonds (768,924.68) Capital Assets Acquired with Payables 22,481,520.13
Interagency Transfer of Capital Assets (7,517.16)
See Accompanying Notes to the Comprehensive Financial Statements
35
THIS PAGE INTENTIONALLY LEFT BLANK
36

NOTES TO THE
COMPREHENSIVE FINANCIAL STATEMENTS
of the
UNIVERSITY OF NORTH TEXAS SYSTEM
DALLAS, TEXAS
For the Year Ended August 31, 2019
37

UNIVERSITY OF NORTH TEXAS SYSTEM Notes to the Comprehensive Financial Statements
For the Year Ended August 31, 2019
Note 1: Summary of Significant Accounting Policies
Introduction The University of North Texas System (the “System”) is an agency of the State of Texas (the “State”) and its financial records comply with state statutes and regulations. This includes compliance with the Texas Comptroller of Public Accounts’ Reporting Requirements for Annual Financial Reports of State Agencies and Universities and with Generally Accepted Accounting Principles (“GAAP”) as prescribed by the Governmental Accounting Standards Board (“GASB”). The comprehensive financial statements include the University of North Texas System Administration (“System Administration”) and all institutions of the System. Amounts due between and among institutions, amounts held for institutions by the System Administration and other duplications in reporting are eliminated in consolidating the financial statements. The System is composed of the System Administration and three academic institutions as follows: the University of North Texas (“UNT”), the University of North Texas Health Science Center at Fort Worth (“HSC”), and the University of North Texas at Dallas (“UNTD”). The System is governed by a nine member Board of Regents appointed by the Governor of Texas and confirmed by the Texas State Senate. Three members are appointed every odd‐numbered year for six‐year terms. In addition, the Governor appoints a nonvoting student Regent for a one‐year term. The System has two discrete component units. Information on the component units can be found in Note 14, Financial Reporting Entity.
Basis of Accounting The comprehensive financial statements of the System have been prepared using the economic resources measurement focus and the full accrual basis of accounting. The System reports as a business‐type activity, as defined by the GASB. Business‐type activities are those that are financed in whole or in part by fees charged to external parties for goods or services.
Under the full accrual basis of accounting, revenues, expenses, gains, losses, assets and liabilities resulting from exchange and exchange‐like transactions are recognized when the exchange takes place. Revenues, expenses, gains, losses, assets and liabilities resulting from nonexchange transactions are recognized in accordance with GASB Statement No. 33, Accounting and Financial Reporting for Nonexchange Transactions, as amended. The Statement of Revenues, Expenses and Changes in Net Position is segregated into operating and nonoperating sections. Operating activities consist of transactions that are the direct result of providing goods and services to customers or directly related to the System’s principal ongoing operations. The System follows the requirements and guidelines provided in GASB pronouncements. Standards newly effective for fiscal year 2019 are listed below: GASB Statement No. 83, Certain Asset Retirement Obligations, determines the timing and pattern of recognition of a liability and a corresponding deferred outflow of resources for asset retirement obligations (“ARO”) and requires disclosure of information about the nature of a government’s AROs, the methods and assumptions used for the estimates of the liabilities, and the estimated remaining useful life of the associated tangible capital assets. This statement has minimal impact to the comprehensive financial statements. GASB Statement No. 88, Certain Disclosures Related to Debt, including Direct Borrowings and Direct Placements, requires additional note disclosures relating to direct borrowings and direct placements and clarifies which liabilities governments should include when disclosing information related to such. Additional disclosures include unused lines of credit, assets pledged as collateral, and terms specified in debt agreements for significant events of default, termination, or subjective acceleration clauses with finance‐related consequences. This statement has no impact to the comprehensive financial statement balances, as it is a disclosure only standard.
38

UNIVERSITY OF NORTH TEXAS SYSTEM Notes to the Comprehensive Financial Statements
For the Year Ended August 31, 2019
GASB Statement No. 89, Accounting for Interest Cost Incurred before the End of a Construction Period, established accounting requirements for interest costs incurred before the end of a construction period. An interest cost incurred before the end of a construction period is recognized as an expense in the period in which the cost is incurred and is no longer capitalized as part of the historical cost of a capital asset. The statement will result in increased nonoperating expenses on the Statement of Revenues, Expenses, and Changes in Net Position.
Assets, Liabilities, Deferred Outflows and Inflows of Resources, and Net Position Assets Cash and Cash Equivalents Short‐term highly liquid investments that are both readily convertible to known amounts of cash and having an original maturity of three months or less are considered cash equivalents. It is the System’s policy to exclude items that meet this definition if they are part of an investment pool, which has an investment horizon of one year or greater. Therefore, highly liquid investments that are part of the long‐term investment pool are not considered cash and cash equivalents. Additionally, endowments invested in money market accounts are also excluded from cash and cash equivalents, as the intent is to invest these funds for more than one year. Cash held in the State Treasury is considered cash and cash equivalents. Restricted cash and cash equivalents include restricted sources of funds used for construction of capital assets as well as funds held for debt service. The System holds bond proceeds in restricted investment accounts to be disbursed to its institutions to support capital projects. Legislative Appropriations The appropriation of revenues by the Texas Legislature (the “Legislature”) is in the form of general revenue. When the Legislature meets during the odd‐numbered years, they approve a two‐year budget (biennial) for all State agencies. The general revenue appropriation to the System supports the instruction, research and operation of the System. Appropriations also include payments made by the State on behalf of the System for benefits related to salaries funded by state appropriations. There is no assurance that the Legislature will continue its state appropriations to the System in future years; however, the System expects that the Legislature will continue to do so. Higher Education Funds (“HEF”) are general revenue appropriations received from the State designated for the acquisition of certain capital assets and capital projects. As of August 31, 2019, the unexpended amount was approximately $116.4 million. Accounts and Other Receivables Accounts receivable mainly consists of tuition and fee charges to students. Accounts receivable is shown net of an allowance for doubtful accounts, which is approximately $41.8 million of the outstanding accounts receivable balance at August 31, 2019. The allowance for doubtful accounts on other receivables was approximately $300 thousand at August 31, 2019. The System has adopted a policy of reserving for account receivables based on collections history over the previous five years. Any amount outstanding after five years is reserved at 100% per state requirements. Federal receivables include federal grants and education scholarships. The allowance for doubtful accounts on federal receivables was approximately $300 thousand at August 31, 2019. Intergovernmental receivables include amounts due from state government or private sources in connection with reimbursement of allowable expenditures made pursuant to the System’s grants and contracts.
39

UNIVERSITY OF NORTH TEXAS SYSTEM Notes to the Comprehensive Financial Statements
For the Year Ended August 31, 2019
Clinical Practice receivables are presented net of allowances for contractual discounts and bad debts. The contractual and bad debt allowances on clinical receivables were approximately $2.0 million and $900 thousand as of August 31, 2019. Clinical accounts receivable are subject to concentrations of patient accounts receivable credit risk. The mix of receivables (gross) from patients and third parties as of August 31, 2019 was as follows:
Net Gross
Medicaid 23% 27% Medicare 39% 32% Commercial 27% 28% Self‐pay 4% 8% Other 7% 5%
Total 100% 100%
Gift receivables include amounts pledged to the System by donors, net of allowances. The allowance for gift pledges is approximately $1.9 million at August 31, 2019. Multiyear gift pledges are reported at the discounted present value. At the beginning of each fiscal year, the System re‐establishes the scale of discount rates applicable for present valuing multi‐year gift pledges that are received during the new fiscal year. Prepaid Items Prepaid items include prepaid scholarship expenses that pertain to the fall term of the following fiscal year and other various prepaid expenses. Loans and Contracts Current and noncurrent loans and contracts receivables, related to student loans, are shown net of allowances. The net allowance on loans and contracts at August 31, 2019 is approximately $4.9 million. Investments The System accounts for its investments at fair value in accordance with GASB Statement No. 31, Accounting and Financial Reporting for Certain Investments and for External Investment Pools, as amended. Changes in realized gain (loss) on the carrying value of investments are reported as a component of investment income. Restricted investments include investments restricted by legal or contractual requirements, including those related to donors and constitutional restrictions. Capital and Intangible Assets The System follows the State’s capitalization policy, which requires capitalization of assets with an initial individual cost of more than $5,000 for equipment items, $100,000 for buildings, building improvements and improvements other than buildings, and $500,000 for infrastructure items, and an estimated useful life of greater than one year. These assets are capitalized at cost or, if not purchased, at fair value as of the date of acquisition. Purchases of library books are capitalized. Routine repairs and maintenance are charged to operating expense in the year in which the expense is incurred. Outlays for construction in progress are capitalized as incurred. GASB Statement No. 89, Accounting for Interest Cost Incurred before the End of a Construction Period, was implemented during fiscal year 2019. The statement established accounting requirements for interest costs incurred before the end of a construction period to be recognized as an expense in the period in which the cost is incurred. Interest costs are no longer capitalized as part of the historical cost of a capital asset. Depreciation is reported on all exhaustible assets. Inexhaustible assets such as land, works of art and historical treasures are not depreciated. Depreciation is computed using the straight‐line method over the estimated useful lives of the assets, generally, 10 to 30 years for buildings and improvements, 10 to 45 years for infrastructure, 4 to 15 years for equipment, and 15 years for library books. GASB Statement No. 51, Accounting and Financial Reporting for Intangible Assets, as amended, requires all intangible assets not specifically excluded by scope provisions to be classified as capital assets. The System has computer
40

UNIVERSITY OF NORTH TEXAS SYSTEM Notes to the Comprehensive Financial Statements
For the Year Ended August 31, 2019
software that meets the criteria. Accordingly, existing authoritative guidance related to the accounting and financial reporting for capital assets is applied to computer software, as applicable.
Deferred Outflows of Resources Deferred outflows of resources relate to unamortized losses on the refunding of debt, and certain amounts related to asset retirement obligation, pensions, and OPEB.
Deferred Outflows of Resources Related to Debt Refunding For debt refunding, the difference between the reacquisition price and the net carrying amount of the old debt is deferred and reported as deferred outflows or deferred inflows. The gain or loss is amortized using the straight‐line method over the remaining life of the old debt or the life of the new debt, whichever is shorter, in the Statement of Revenues, Expenses and Changes in Net Position as a component of interest expense. Deferred Outflows of Resources Related to Asset Retirement Obligation When an asset retirement obligation is recognized, the System must also recognize a corresponding deferred outflow of resources. At initial measurement of an ARO, the deferred outflows associated with an ARO is recorded at the amount of the corresponding liability. For subsequent measurement and recognition, the reduction of deferred outflows must be recognized and expensed in a systematic and rational manner over a period of time, such as over the useful life of the asset. Deferred Outflows of Resources Related to Pensions Certain changes in the collective net pension liability of the Teacher Retirement System of Texas (“TRS”) Plan (the “TRS Plan”) are reported as deferred outflows or as deferred inflows of resources related to pensions, depending on the type of change. The types of deferred outflows of resources related to pensions and their respective accounting treatments are discussed below.
• System contributions subsequent to the measurement date of the collective net pension liability are recognized as a reduction in the net pension liability in the following year.
• The effect on the System’s proportionate share of the total pension liability of changes of economic and demographic assumptions or of other inputs that increase the total pension liability is amortized as a component of pension expense using the straight‐line method over the expected average remaining service lives of active and inactive employees.
• The effect on the System’s proportionate share of the total pension liability of differences between expected and actual experience that increase the total pension liability is amortized as a component of pension expense using the straight‐line method over the expected average remaining service lives of active and inactive employees.
• Increases in the System’s proportion of the collective net pension liability are amortized as a component of pension expense using the straight‐line method over the expected average remaining service lives of active and inactive employees.
• System contributions during the measurement period that are greater than its proportionate share of total contributions is amortized as a component of pension expense using the straight‐line method over the expected average remaining service lives of active and inactive employees.
• The effect on the System’s proportionate share of the collective net pension liability of the difference between expected and actual earnings on investments is amortized as a component of pension expense using the straight‐line method over a period of five years.
Deferred Outflows of Resources Related to OPEB Certain changes in the net OPEB liability of the Employees Retirement System of Texas (“ERS”) Plan (the “ERS Plan”) are reported as deferred outflows or as deferred inflows of resources related to OPEB, depending on the type of change. The types of deferred outflows of resources related to OPEB and their respective accounting treatments are discussed below.
• System contributions for retirees subsequent to the measurement date of the net OPEB liability are recognized as a reduction in the OPEB liability in the following year.
41
UNIVERSITY OF NORTH TEXAS SYSTEM Notes to the Comprehensive Financial Statements
For the Year Ended August 31, 2019
• Increases in the System’s proportion of the collective net OPEB liability are amortized as a component of OPEB expense using the straight‐line method over the expected average remaining service lives of active and inactive employees.
• System contributions during the measurement period that are greater than its proportionate share of total contributions is amortized as a component of OPEB expense using the straight‐line method over the expected average remaining service lives of active and inactive employees.
• The effect on the System’s proportionate share of the net OPEB liability of the difference between expected and actual earnings on investments is amortized as a component of OPEB expense using the straight‐line method over a period of five years.
Liabilities Accounts and Other Payables Accounts and other payables represent the liability for the value of assets or services received at the Statement of Net Position date for which payment is pending. Unearned Revenue Unearned revenue represents assets received in advance of an exchange taking place in an exchange transaction or assets received prior to eligibility requirements (other than time requirements) being met in a nonexchange transaction. Unearned revenue includes $250.6 million of tuition revenue related to the semesters that have not been completed as of August 31, 2019. Tuition revenue is recognized based on the number of class days as a percentage of total class days that fall within the fiscal year. Revenue Bonds Payable Revenue bonds payable are reported at par value. Bond discounts and premiums are amortized over the life of the bonds using the effective interest method. Revenue bonds payable is reported separately as either current or non‐current in the Statement of Net Position. Claims and Judgments Claims and judgments are reported when it is probable a loss has occurred and the amount of the loss can be reasonably estimated. These liabilities include an amount for claims that were incurred but not reported. See Note 12, Contingencies and Commitments, and Note 13, Risk Management, for information on risk management, claims and judgments. Employees’ Compensable Leave Employees’ compensable leave represents the liability that becomes due upon the occurrence of relevant events such as resignations, retirements and uses of leave balances by covered employees, in conformance with State policy and practice. Liabilities are reported separately as either current or non‐current in the Statement of Net Position. These obligations generally are paid from the same funding source from which each employee’s salary or wage compensation is paid. Capital Lease Obligations Capital lease obligations represent the liability for future lease payments under capital lease contracts. Liabilities are reported separately as either current or non‐current in the Statement of Net Position. Funds Held for Others Funds held for others represent funds held by the System as custodial or fiscal agent for students, faculty members, foundations and others. Asset Retirement Obligation An ARO is a legally enforceable liability associated with the retirement of a tangible capital asset. An ARO must be recognized when the liability is incurred and reasonably estimable. Incurrence of a liability is manifested by the occurrence of both an external obligating event and an internal obligating event resulting from normal operations.
42

UNIVERSITY OF NORTH TEXAS SYSTEM Notes to the Comprehensive Financial Statements
For the Year Ended August 31, 2019
Net Pension Liability The fiduciary net position of the TRS Plan has been determined using the flow of economic resources measurement focus and full accrual basis of accounting. For purposes of measuring the net pension liability, deferred outflows of resources, and deferred inflows of resources related to pensions and pension expense, information about the fiduciary net position of the TRS Plan, and additions to/deductions from the TRS Plan’s fiduciary net position have been determined on the same basis as they are reported by TRS. Benefit payments (including refunds of employee contributions) are recognized when due and payable in accordance with the benefit terms. Investments are reported at fair value. Fair value is a market‐based measurement, not an entity‐specific measurement. TRS utilizes one or more of the following valuation techniques in order to measure fair value: the market approach, the cost approach, and the income approach. Net OPEB Liability The fiduciary net position of the ERS Plan has been determined using the flow of economic resources measurement focus and full accrual basis of accounting. Benefit payments (including refunds of employee contributions) are recognized when due and payable in accordance with the benefit terms. Investments of the Other Employee Benefit Trust Fund are reported at fair value. The fair value of investments is based on published market prices and quotations from major investment brokers at available current exchange rates. However, corporate bonds in general are valued based on currently available yields of comparable securities by issuers with similar credit ratings. Deferred Inflows of Resources Deferred inflows of resources relate to unamortized gains on refunding of debt and certain amounts related to pensions and OPEB. Deferred Inflows of Resources Related to Debt Refunding For debt refunding, the difference between the reacquisition price and the net carrying amount of the old debt is deferred and reported as deferred outflows or deferred inflows. The gain or loss is amortized using the straight‐line method over the remaining life of the old debt or the life of the new debt, whichever is shorter, in the Statement of Revenues, Expenses and Changes in Net Position as a component of interest expense. Deferred Inflows of Resources Related to Pensions Certain changes in the collective net pension liability of the TRS Plan are reported as deferred outflows of resources related to pensions or as deferred inflows of resources related to pensions, depending on the type of change. The types of deferred inflows of resources related to pensions and their respective accounting treatments are discussed below.
• The effect on the System’s proportionate share of the total pension liability of changes of economic and demographic assumptions or of other inputs that decrease the total pension liability is amortized as a component of pension expense using the straight‐line method over the expected average remaining service lives of active and inactive employees.
• The effect on the System’s proportionate share of the total pension liability of differences between expected and actual experience that decrease the total pension liability is amortized as a component of pension expense using the straight‐line method over the expected average remaining service lives of active and inactive employees.
• Decreases in the System’s proportion of the collective net pension liability are amortized as a component of pension expense using the straight‐line method over the expected average remaining service lives of active and inactive employees.
• System contributions during the measurement period that are less than its proportionate share of total of contributions are amortized as a component of pension expense using the straight‐line method over the expected average remaining service lives of active and inactive employees.
• The effect on the System’s proportionate share of the collective net pension liability of more actual earnings on pension plan investments than projected is amortized as a component of pension expense using the straight‐line method over a period of five years.
43
UNIVERSITY OF NORTH TEXAS SYSTEM Notes to the Comprehensive Financial Statements
For the Year Ended August 31, 2019
Deferred Inflows of Resources Related to OPEB Certain changes in the net OPEB liability of the ERS Plan are reported as deferred outflows of resources related to OPEB or as deferred inflows of resources related to OPEB, depending on the type of change. The types of deferred inflows of resources related to OPEB and their respective accounting treatments are discussed below.
• The effect on the System’s proportionate share of the total OPEB liability of changes of economic and demographic assumptions or of other inputs that decrease the total OPEB liability is amortized as a component of OPEB expense using the straight‐line method over the expected average remaining service lives of active and inactive employees.
• The effect on the System’s proportionate share of the total OPEB liability of differences between expected and actual experience that decrease the total OPEB liability is amortized as a component of OPEB expense using the straight‐line method over the expected average remaining service lives of active and inactive employees.
Net Position Net Investment in Capital Assets Net investment in capital assets consists of capital assets, net of accumulated depreciation, and unspent bond proceeds reduced by outstanding balances for bonds, notes and other debt that are attributed to the acquisition, construction or improvement of those assets. Restricted Net Position Restricted net position primarily consists of permanent investments subject to restrictions externally imposed by creditors, grantors, contributors, and the like, or imposed by law through constitutional provisions or enabling legislation.
Restricted nonexpendable net position is subject to externally imposed stipulations that require the amounts be maintained in perpetuity by the System. Such assets include the System’s permanent endowment funds. Restricted expendable net position is subject to externally imposed stipulations that can be fulfilled by actions of the System pursuant to those stipulations or that expire with the passage of time. Unrestricted Net Position Unrestricted net position consists of net position that does not meet the definition of the two preceding categories. Unrestricted net position often has constraints on resources that are imposed by management, but can be removed or modified. Because the System is an agency of the State, constraints on the use of resources imposed by the State are not considered external restrictions.
When an expense is incurred that can be paid using either restricted or unrestricted resources, the System addresses each situation on a case‐by‐case basis prior to determining the resources to be used to satisfy the obligation. Generally, the System’s policy is to first apply the expense toward restricted resources and then toward unrestricted resources.
Revenues and Expenses Operating Revenues and Expenses Operating revenues include activities such as net student tuition and fees, net professional fees for hospital clinical services, net sales and services by auxiliary enterprises, and most federal, state and local grants and contracts. Operating expenses include cost of goods sold, salaries and wages, payroll related costs, professional fees and services, federal and state pass‐through expense, travel, materials and supplies, communications and utilities, repairs and maintenance, rentals and leases, printing and reproduction, depreciation and amortization, scholarships and fellowships, and asset retirement obligation. In addition, all changes to incurred but not reported liabilities related to insurance programs are reflected as operating expenses.
44

UNIVERSITY OF NORTH TEXAS SYSTEM Notes to the Comprehensive Financial Statements
For the Year Ended August 31, 2019
Professional Fees Revenue HSC has agreements with third parties that provide for reimbursement to HSC at amounts different from its established rates. Contractual adjustments under third party reimbursement programs represent the difference between HSC’s established rates for services and the amounts reimbursed by third parties. HSC’s more significant third parties are the Medicare and Medicaid programs. Medicare outpatient services are reimbursed on a prospective basis through ambulatory payment classifications, which are based on clinical resources used in performing the procedure. Medicaid outpatient services are paid based on a fee schedule or blended rates. Scholarship Allowances and Student Aid Financial aid to students is reported in the financial statements as prescribed by the National Association of College and University Business Officers (“NACUBO”). Certain aid (student loans, funds provided to students as awarded by third parties, and Federal Direct Lending) is accounted for as third party payments (credited to the student’s account and reported as revenue as if the student made the payment). All other aid is reflected in the financial statements either as operating expense or as scholarship allowances, which reduce revenues. The amount reported as operating expense represents the portion of aid that was provided to the student in the form of cash. Scholarship allowances represent the portion of aid provided to the student in the form of reduced tuition. The allowance is computed on an institution‐wide basis by allocating cash payments to students, excluding payments for services, using the ratio of total aid to the aid not considered to be third party aid. Nonoperating Revenues and Expenses Nonoperating revenues include activities such as gifts and contributions, insurance recoveries received in years subsequent to the associated loss, state appropriations, investment income, and other revenue sources that are defined as nonoperating revenues by GASB. The System’s institutions are the named beneficiaries in certain lawsuits, wills, trusts, and insurance policies; however, the System does not recognize these potential refunds, gifts, and contributions until realized. Nonoperating expenses include activities such as interest expense on capital asset financings and other expenses that are defined as nonoperating expenses by GASB.
Use of Estimates The preparation of financial statements in conformity with accounting principles generally accepted in the United States of America requires management to make estimates and assumptions that affect the reported amounts of assets and liabilities and disclosure of contingent assets and liabilities at the date of the comprehensive financial statements. Estimates also affect the reported amounts of revenues and expenses during the reporting period. Actual results could differ from those estimates.
Upcoming Accounting Pronouncements GASB Statement No. 84, Fiduciary Activities, establishes criteria for identifying fiduciary activities of all state and local governments. This statement will be implemented in fiscal year 2020. The System is in the process of evaluating the impact this will have to the comprehensive financial statements. GASB Statement No. 87, Leases, creates a single model for lease accounting. It requires recognition of certain lease assets and liabilities for leases that previously were classified as operating leases and recognized as inflows of resources or outflows of resources based on the payment provisions of the contract. This statement will be implemented in fiscal year 2021. The System is in the process of analyzing current operating leases to assess the impact of this statement. The System anticipates moderate impact to the comprehensive financial statements.
45

UNIVERSITY OF NORTH TEXAS SYSTEM Notes to the Comprehensive Financial Statements
For the Year Ended August 31, 2019
Note 2: Capital Assets A summary of changes in capital assets for the year ended August 31, 2019 is presented below:
GASB Statement No. 89, Accounting for Interest Cost Incurred before the End of a Construction Period, was implemented during fiscal year 2019. The statement established accounting requirements for interest costs incurred before the end of a construction period to be recognized as an expense in the period in which the cost is incurred. Interest costs are no longer capitalized as part of the historical cost of a capital asset.
Note 3: Cash, Cash Equivalents and Investments
Deposits of Cash in Bank As of August 31, 2019, the carrying amount of deposits was $25,390,184.57 as presented below:
Cash in Bank Carrying Value $ 25,390,184.57
Cash in Bank per Statement of Net Position $ 25,390,184.57
Proprietary Funds Current Assets Cash in Bank $ 20,585,662.70
Proprietary Funds Current Assets Restricted Cash in Bank 4,804,521.87
Cash in Bank per Statement of Net Position $ 25,390,184.57
The carrying amount consists of all cash in local banks and is included on the Statement of Net Position as a portion of cash and cash equivalents. Assets classified as cash and cash equivalents include $232,912,588.41 that is invested in cash equivalents. The remainder of the cash and cash equivalents balance of $15,584,472.13 is comprised of cash on hand, cash in transit or reimbursement from the Treasury, and cash in the State Treasury.
Reclassification
of Completed Increase Decrease
Balance Construction Interagency Interagency Balance
September 1, 2018 In Progress Transfers Transfers Additions Deletions August 31, 2019
Non‐Depreciable or Non‐Amortizable Assets:
Land and Land Improvements 81,129,302.51$ 5,300.00$ ‐$ ‐$ 13,902,678.17$ ‐$ 95,037,280.68$
Construction in Progress 293,151,433.07 (422,204,644.38) ‐ ‐ 168,673,818.23 ‐ 39,620,606.92
Other Tangible Capital Assets 25,224,945.81 ‐ ‐ ‐ 124,900.00 ‐ 25,349,845.81
Total Non‐Depreciable or Non‐Amortizable Assets: 399,505,681.39$ (422,199,344.38)$ ‐$ ‐$ 182,701,396.40$ ‐$ 160,007,733.41$
Depreciable Assets:
Buildings and Building Improvements 1,157,556,509.38$ 408,761,080.54$ ‐$ ‐$ 24,530,960.76$ (1,487,159.86)$ 1,589,361,390.82$
Infrastructure 67,744,818.74 1,969,704.86 ‐ ‐ ‐ ‐ 69,714,523.60
Facil ities and Other Improvements 128,036,992.05 10,220,691.25 ‐ ‐ ‐ (984,163.26) 137,273,520.04
Furniture and Equipment 169,384,329.39 847,295.06 59,738.00 (90,205.92) 21,843,889.87 (13,711,333.63) 178,333,712.77
Vehicles, Boats and Aircraft 13,718,438.23 ‐ ‐ ‐ 868,191.26 (3,732,352.49) 10,854,277.00
Other Capital Assets 109,745,719.10 ‐ ‐ ‐ 5,999,506.06 (784,888.90) 114,960,336.26
Total Depreciable Assets: 1,646,186,806.89$ 421,798,771.71$ 59,738.00$ (90,205.92)$ 53,242,547.95$ (20,699,898.14)$ 2,100,497,760.49$
Less Accumulated Depreciation for:
Buildings and Building Improvements (552,369,787.21)$ ‐$ ‐$ ‐$ (55,205,708.70)$ 1,429,643.97$ (606,145,851.94)$
Infrastructure (23,090,815.22) ‐ ‐ ‐ (2,413,549.50) ‐ (25,504,364.72)
Facil ities and Other Improvements (34,670,676.66) ‐ ‐ ‐ (3,942,842.19) 761,299.19 (37,852,219.66)
Furniture and Equipment (123,856,232.38) ‐ (59,738.00) 82,688.76 (13,838,053.73) 11,640,777.56 (126,030,557.79)
Vehicles, Boats and Aircraft (9,670,908.40) ‐ ‐ ‐ (1,055,311.33) 2,473,943.54 (8,252,276.19)
Other Capital Assets (67,784,279.36) ‐ ‐ ‐ (4,927,712.58) 749,624.74 (71,962,367.20)
Total Accumulated Depreciation (811,442,699.23)$ ‐$ (59,738.00)$ 82,688.76$ (81,383,178.03)$ 17,055,289.00$ (875,747,637.50)$
Total Depreciable Assets, Net 834,744,107.66$ 421,798,771.71$ ‐$ (7,517.16)$ (28,140,630.08)$ (3,644,609.14)$ 1,224,750,122.99$
Amortizable Assets ‐ Intangibles:
Computer Software 33,505,813.82$ 400,572.67$ ‐$ ‐$ 495,249.43$ (88,830.00)$ 34,312,805.92$
Total Amortizable Assets ‐ Intangibles 33,505,813.82$ 400,572.67$ ‐$ ‐$ 495,249.43$ (88,830.00)$ 34,312,805.92$
Less Accumulated Amortization for:
Computer Software (22,725,788.82)$ ‐$ ‐$ ‐$ (3,295,212.83)$ 88,830.00$ (25,932,171.65)$
Total Accumulated Amortization (22,725,788.82)$ ‐$ ‐$ ‐$ (3,295,212.83)$ 88,830.00$ (25,932,171.65)$
Amortizable Assets ‐ Intangibles, Net 10,780,025.00$ 400,572.67$ ‐$ ‐$ (2,799,963.40)$ ‐$ 8,380,634.27$
Total Capital Assets, Net 1,245,029,814.05$ ‐$ ‐$ (7,517.16)$ 151,760,802.92$ (3,644,609.14)$ 1,393,138,490.67$
46

UNIVERSITY OF NORTH TEXAS SYSTEM Notes to the Comprehensive Financial Statements
For the Year Ended August 31, 2019
As of August 31, 2019, the total bank balance was $79,724,070.05. The carrying amount of deposits for the System’s discretely presented component unit, UNT Foundation, reported on the UNT Foundation Statement of Net Position as of August 31, 2019 was $16,105,036. As of August 31, 2019, the total bank balance was $987,633.72. The carrying amount of deposits for the System’s discretely presented component unit, UNTHSC Foundation, reported on the UNTHSC Foundation Statement of Net Position as of August 31, 2019 was $1,305,137. As of August 31, 2019, the total bank balance was $1,260,137.00.
Custodial Credit Risk ‐ Deposits Custodial credit risk for deposits is the risk that, in the event of the failure of a depository financial institution, the agency will not be able to recover deposits or will not be able to recover collateral securities that are in the possession of an outside party. The System’s policy is that all deposits are governed by a bank depository agreement between the System and the respective banking institution. This agreement provides that the System’s deposits, to the extent such deposits exceed the maximum insured limit under deposit insurance provided by the Federal Deposit Insurance Corporation (the “FDIC”), shall at all times be collateralized with government securities. As of August 31, 2019, the System had no bank balances that were exposed to custodial credit risk.
Investments Each institution of the System adopts an endowment investment policy that must be reviewed and approved by the System Board of Regents annually. The policy authorizes the following types of investments: U.S. Government obligations, U.S. Government Agency obligations, other government obligations, corporate obligations, corporate asset‐backed and mortgage‐backed securities, equity, international obligations, international equity, certificates of deposit, banker’s acceptances, money market mutual funds, mutual funds, repurchase agreements, private equity, hedge funds, Real Estate Investment Trusts (“REITs”), derivatives, energy and real estate. The System’s cash management objective is to retain appropriate liquidity to meet daily operating demands while seeking higher yield on cash reserves through an appropriately diversified long‐term investment portfolio. The System obtained permission from the Attorney General’s office for the Board of Regents of the System to invest funds under its control that are held and managed by the System’s institutions under section 51.0031(c) of the Texas Education Code. Section 51.0031 of the Texas Education Code authorizes the System Board of Regents, subject to procedures and restrictions it establishes, to invest System funds in any kind of investment and in amounts it considers appropriate, provided that it adheres to the prudent person standard described in Article VII, Section 11b, of the Texas Constitution. This standard provides that the System Board of Regents, in making investments, may acquire, exchange, sell, supervise, manage or retain, through procedures and subject to restrictions it establishes and in amounts it considers appropriate, any kind of investment that prudent investors, exercising reasonable care, skill and caution, would acquire or retain in light of the purposes, terms, distribution requirements and other circumstances of the fund then prevailing, taking into consideration the investment of all of the assets of the fund rather than a single investment. All System funds subject to Board of Regents control, System endowment funds, and HSC medical professional liability self‐insurance plan funds shall be invested pursuant to a prudent person standard. All other System funds shall be deposited in an approved depository bank, invested pursuant to the Public Funds Investment Act in authorized investments such as FDIC insured money market funds and approved local government investment pools, or deposited in the State Treasury.
47
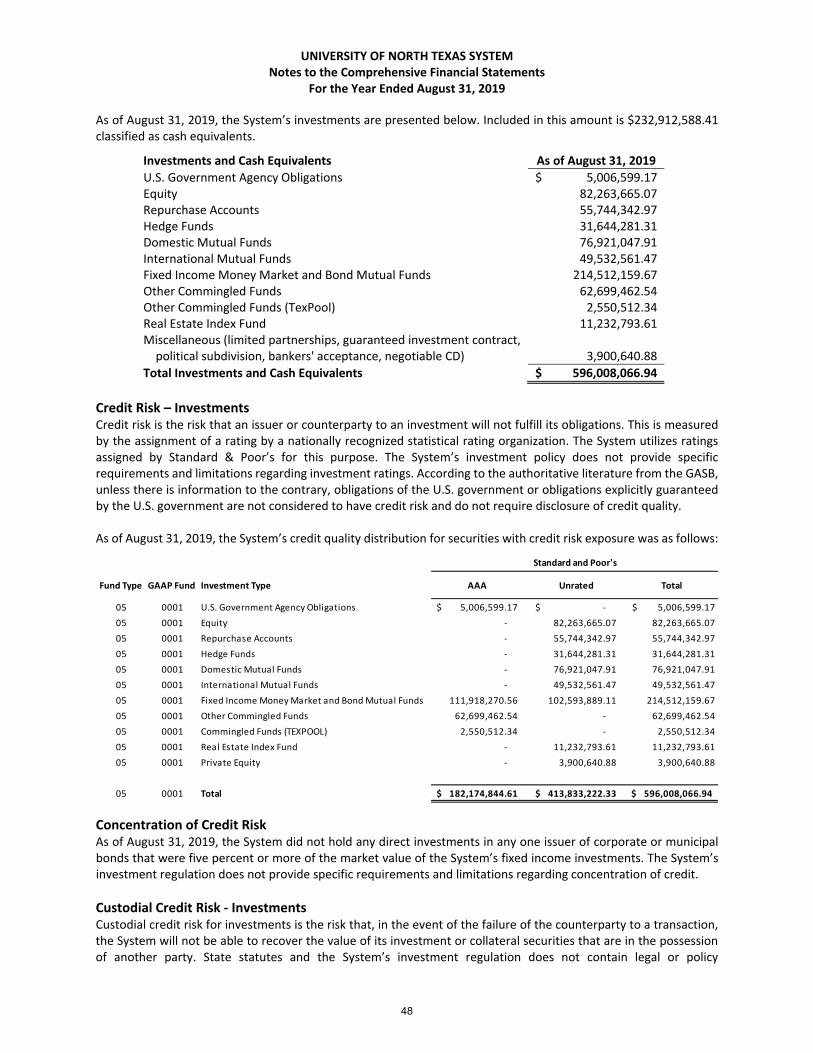
UNIVERSITY OF NORTH TEXAS SYSTEM Notes to the Comprehensive Financial Statements
For the Year Ended August 31, 2019
As of August 31, 2019, the System’s investments are presented below. Included in this amount is $232,912,588.41 classified as cash equivalents.
Investments and Cash Equivalents As of August 31, 2019
U.S. Government Agency Obligations $ 5,006,599.17 Equity 82,263,665.07 Repurchase Accounts 55,744,342.97 Hedge Funds 31,644,281.31 Domestic Mutual Funds 76,921,047.91 International Mutual Funds 49,532,561.47 Fixed Income Money Market and Bond Mutual Funds 214,512,159.67 Other Commingled Funds 62,699,462.54 Other Commingled Funds (TexPool) 2,550,512.34 Real Estate Index Fund 11,232,793.61 Miscellaneous (limited partnerships, guaranteed investment contract, political subdivision, bankers' acceptance, negotiable CD) 3,900,640.88
Total Investments and Cash Equivalents $ 596,008,066.94
Credit Risk – Investments Credit risk is the risk that an issuer or counterparty to an investment will not fulfill its obligations. This is measured by the assignment of a rating by a nationally recognized statistical rating organization. The System utilizes ratings assigned by Standard & Poor’s for this purpose. The System’s investment policy does not provide specific requirements and limitations regarding investment ratings. According to the authoritative literature from the GASB, unless there is information to the contrary, obligations of the U.S. government or obligations explicitly guaranteed by the U.S. government are not considered to have credit risk and do not require disclosure of credit quality. As of August 31, 2019, the System’s credit quality distribution for securities with credit risk exposure was as follows:
Concentration of Credit Risk As of August 31, 2019, the System did not hold any direct investments in any one issuer of corporate or municipal bonds that were five percent or more of the market value of the System’s fixed income investments. The System’s investment regulation does not provide specific requirements and limitations regarding concentration of credit.
Custodial Credit Risk ‐ Investments Custodial credit risk for investments is the risk that, in the event of the failure of the counterparty to a transaction, the System will not be able to recover the value of its investment or collateral securities that are in the possession of another party. State statutes and the System’s investment regulation does not contain legal or policy
Fund Type GAAP Fund Investment Type AAA Unrated Total
05 0001 U.S. Government Agency Obligations 5,006,599.17$ ‐$ $ 5,006,599.17
05 0001 Equity ‐ 82,263,665.07 82,263,665.07
05 0001 Repurchase Accounts ‐ 55,744,342.97 55,744,342.97
05 0001 Hedge Funds ‐ 31,644,281.31 31,644,281.31
05 0001 Domestic Mutual Funds ‐ 76,921,047.91 76,921,047.91
05 0001 International Mutual Funds ‐ 49,532,561.47 49,532,561.47
05 0001 Fixed Income Money Market and Bond Mutual Funds 111,918,270.56 102,593,889.11 214,512,159.67
05 0001 Other Commingled Funds 62,699,462.54 ‐ 62,699,462.54
05 0001 Commingled Funds (TEXPOOL) 2,550,512.34 ‐ 2,550,512.34
05 0001 Real Estate Index Fund ‐ 11,232,793.61 11,232,793.61
05 0001 Private Equity ‐ 3,900,640.88 3,900,640.88
05 0001 Total 182,174,844.61$ 413,833,222.33$ 596,008,066.94$
Standard and Poor's
48

UNIVERSITY OF NORTH TEXAS SYSTEM Notes to the Comprehensive Financial Statements
For the Year Ended August 31, 2019
requirements that would limit the exposure to custodial credit risk for investments. As of August 31, 2019, the System did not have investments that are exposed to custodial credit risk.
Interest Rate Risk Interest rate risk is the risk that changes in market interest rates will adversely affect the fair value of an investment. Generally, the longer the maturity of an investment the greater the sensitivity of its fair value to changes in market interest rates. As of August 31, 2019, the System investments subject to interest rate risk – commingled funds, certificates of deposit, repurchase agreements and fixed income money market – have an average maturity of less than one year. The System’s investments in U.S. Government Agency Obligations have an average maturity of approximately three years and the investments in bond mutual funds have an average maturity of less than three years.
Foreign Currency Risk Foreign currency risk for investments is the risk that changes in exchange rates will adversely affect the investment. As of August 31, 2019, the System’s investments were all denominated in U.S. dollars. The System’s investment policy does not provide specific requirements and limitations regarding investments in foreign currency.
Internal Investment Pools UNT Foundation Internal Investment Pool Prior to fiscal year 2019, certain System long‐term assets were placed with the UNT Foundation and invested in the UNT Foundation's Consolidated Investment Pool (“UNT Foundation Pool”). The initial term of the agreement effective November 1, 2014 ended August 31, 2016, and contained a provision to automatically renew annually thereafter, as well as a provision for early termination as agreed by the parties. The System elected not to renew this agreement as of August 31, 2018, and the majority of funds have been transferred back to the System. Redemption instructions have been submitted for illiquid investments and remaining balances will be transferred to the System as they are liquidated. The UNT Foundation Pool is invested with external investment managers who invest in equity, fixed income and alternative investment funds, both domestic and international. The UNT Foundation’s investment policy allows for the asset allocation to be maintained within the following tactical ranges: 50‐70% growth assets (U.S. and international equities), 20‐40% risk reduction assets (U.S. and global fixed income funds and cash), and 5‐15% inflation protection assets (real assets). The UNT Foundation’s investment committee is responsible for monitoring and rebalancing to the strategic target allocation ranges, and within the tactical ranges, has discretionary authority for setting, monitoring, and making reallocations to the portfolio’s specific underlying assets. Complete audited financial statements of the UNT Foundation can be obtained from https://endow.unt.edu/. As of August 31, 2019, total investments held by the UNT Foundation, including the System portion, consisted of the following investment types:
Investment Fair Value
Equity $ 9,465,938.61
Domestic Mutual Funds 67,374,174.00
International Other Commingled Funds 21,016,500.56
International Mutual Funds 41,773,490.68
Fixed Income Money Market and Bond Mutual Funds 38,988,984.45
Hedge Funds 25,642,345.88
Private Debt/Equity 18,824,623.28
Miscellaneous 135,576.54
Total Investments $ 223,221,634.00
The System’s portion of the UNT Foundation Pool of investments as of August 31, 2019 is $57,422,468.37.
49
UNIVERSITY OF NORTH TEXAS SYSTEM Notes to the Comprehensive Financial Statements
For the Year Ended August 31, 2019
The UNT Foundation Pool’s investments are not rated by Standard & Poor’s. As of August 31, 2019, the UNT Foundation Pool did not hold any direct investments in any one issuer of corporate or municipal bonds that were five percent or more of the market value of the UNT Foundation Pool’s investments. The UNT Foundation Pool did not have investments exposed to custodial credit risk. The UNT Foundation Pool’s investments subject to interest rate risk – fixed income money market and bond mutual funds – have a weighted average maturity of less than one year and approximately eight years, respectively. As of August 31, 2019, the System’s investments in the UNT Foundation Pool consisted of the following investment types: Equity Equity consists of direct ownership of equity securities in publicly‐held corporations. Equity securities are typically managed by an external investment advisor. Domestic Mutual Funds Domestic mutual funds are mutual funds that, by policy, invest primarily in U.S. equity securities of publicly‐held corporations. International Other Commingled Funds International other commingled funds include ownership of unit interests in commingled pools which invest primarily in international equity securities of publicly held corporations. International Mutual Funds International mutual funds are mutual funds that, by policy, invest primarily in international equity securities of publicly‐held corporations. Fixed Income Money Market & Bond Mutual Funds Money market mutual funds are open‐end mutual funds registered with the SEC that must comply with the SEC's "Rule 2a‐7," which imposes certain restrictions, such as a requirement that the fund's board must attempt to maintain a stable net asset value per share or stable price per share, limits on the maximum maturity of any individual security in the fund's portfolio, and limits on the maximum weighted‐average portfolio maturity and life. Money market funds typically attempt to maintain a net asset value or price of $1.00 per share. Bond mutual funds are publicly‐traded open‐end mutual funds that primarily invest in fixed income securities of the U.S. government and agencies, U.S. corporations, and international fixed income securities. Alternative Investments Alternative investments consist of hedge funds, real estate, private debt and other pooled funds that employ various investment strategies that are typically less correlated to the publicly traded investment markets. Investments may be held through a combination of unit interests in limited partnerships, publicly‐traded open‐end mutual fund vehicles, or unit ownership in other commingled pooled funds. UNTHSC Foundation Internal Investment Pool Certain investments of the System are managed by the UNTHSC Foundation in its internal long‐term investment pool (the “UNTHSC Foundation Pool”). The UNTHSC Foundation Pool is invested with external investment managers who invest in equity, mutual funds and alternative investment funds, both domestic and international. The primary investment objective of the UNTHSC Foundation is long‐term growth of capital. It is recognized that short‐term fluctuations in the capital markets may result in the loss of capital on occasion (i.e., negative rates of return). However, the total asset value of the UNTHSC Foundation Pool, exclusive of contributions or withdrawals, should grow in the long‐run. It should earn, through a combination of investment income and capital appreciation, a rate of return in excess of a balanced market index while incurring less risk than such index. The Board and/or the Investment Committee of the UNTHSC Foundation intends to maximize the portfolio's total return comprising income and net realized and unrealized gains and losses. This objective is to be accomplished by assuming a prudent level of risk in the investment of the UNTHSC Foundation assets. Complete audited financial statements of the
50

UNIVERSITY OF NORTH TEXAS SYSTEM Notes to the Comprehensive Financial Statements
For the Year Ended August 31, 2019
UNTHSC Foundation can be obtained by writing to UNTHSC Foundation at 3500 Camp Bowie Boulevard Suite 802, Fort Worth, Texas, 76107. As of August 31, 2019, total investments held by the UNTHSC Foundation, including the System portion, consisted of the following investment types:
Investment Fair Value
Equity $ 43,765,350.80
Domestic Mutual Funds 28,647,718.75
Miscellaneous 2,339,197.00
Total Investments $ 74,752,266.55
The System’s portion of the UNTHSC Foundation Pool of investments as of August 31, 2019 is $54,258,416.30. The UNTHSC Foundation Pool’s investments are not rated by Standard & Poor’s. As of August 31, 2019, the UNTHSC Foundation Pool did not hold any direct investments in any one issuer of corporate or municipal bonds that were five percent or more of the market value of the UNTHSC Foundation Pool’s investments. The UNTHSC Foundation Pool did not have investments exposed to custodial credit risk. The UNTHSC Foundation Pool’s investments subject to interest rate risk – fixed income money market and bond mutual funds – have a weighted average maturity of less than one year and approximately eight years, respectively. As of August 31, 2019, the System’s investments in the UNTHSC Foundation Pool consisted of the following investment types: Equity Equity consists of direct ownership of equity securities in publicly‐held corporations. Equity securities are typically managed by an external investment advisor. Domestic Mutual Funds Domestic mutual funds are mutual funds that, by policy, invest primarily in U.S. equity securities of publicly‐held corporations. Alternative Investments Alternative investments consist of hedge funds, real estate, and other pooled funds that employ various investment strategies that are typically less correlated to the publicly traded investment markets. Investments may be held through a combination of unit interests in limited partnerships, publicly‐traded open‐end mutual fund vehicles, or unit ownership in other commingled pooled funds. Fair Value Measurements The System’s investments are recorded at fair value as of August 31, 2019, and have been categorized based upon a fair value hierarchy in accordance with GASB Statement No. 72, Fair Value Measurement and Application. GASB Statement No. 72 defines fair value as the price that would be received to sell an asset or paid to transfer a liability in an orderly transaction between market participants at the measurement date. The System categorizes its fair value measurements within the fair value hierarchy established by GASB Statement No. 72. The hierarchy is based on the valuation inputs used to measure fair value of the assets. An investment’s level within the fair value hierarchy is based on the lowest level of any input that is significant to the fair value measurement. The following describes the hierarchy of inputs used to measure fair value on a recurring basis:
Level 1 Quoted prices (unadjusted) for identical assets or liabilities in active markets that a government can access at the measurement date
Level 2 Inputs other than quoted prices included within Level 1 that are observable for an asset or liability, either directly (quoted market prices for similar assets or liabilities) or indirectly (corroborated from observable market information)
Level 3 Unobservable inputs for an asset or liability
51
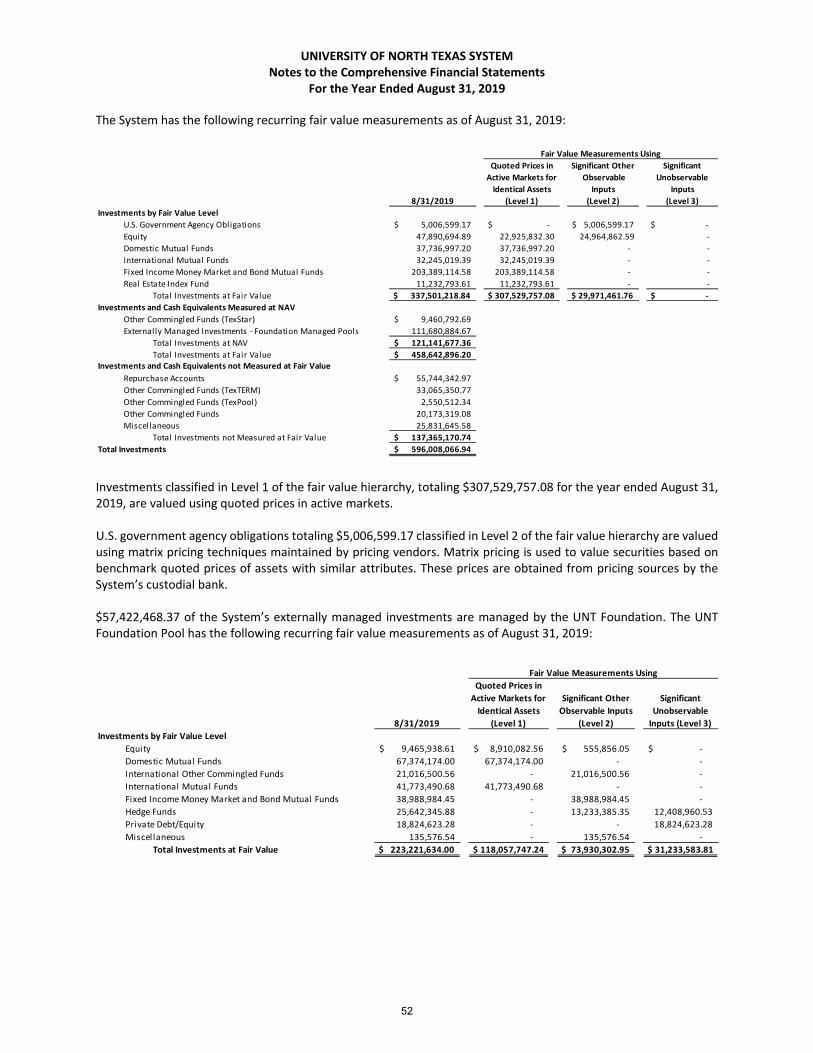
UNIVERSITY OF NORTH TEXAS SYSTEM Notes to the Comprehensive Financial Statements
For the Year Ended August 31, 2019
The System has the following recurring fair value measurements as of August 31, 2019:
Investments classified in Level 1 of the fair value hierarchy, totaling $307,529,757.08 for the year ended August 31, 2019, are valued using quoted prices in active markets. U.S. government agency obligations totaling $5,006,599.17 classified in Level 2 of the fair value hierarchy are valued using matrix pricing techniques maintained by pricing vendors. Matrix pricing is used to value securities based on benchmark quoted prices of assets with similar attributes. These prices are obtained from pricing sources by the System’s custodial bank. $57,422,468.37 of the System’s externally managed investments are managed by the UNT Foundation. The UNT Foundation Pool has the following recurring fair value measurements as of August 31, 2019:
8/31/2019
Quoted Prices in
Active Markets for
Identical Assets
(Level 1)
Significant Other
Observable
Inputs
(Level 2)
Significant
Unobservable
Inputs
(Level 3)
U.S. Government Agency Obligations 5,006,599.17$ $ ‐ 5,006,599.17$ $ ‐
Equity 47,890,694.89 22,925,832.30 24,964,862.59 ‐
Domestic Mutual Funds 37,736,997.20 37,736,997.20 ‐ ‐
International Mutual Funds 32,245,019.39 32,245,019.39 ‐ ‐
Fixed Income Money Market and Bond Mutual Funds 203,389,114.58 203,389,114.58 ‐ ‐
Real Estate Index Fund 11,232,793.61 11,232,793.61 ‐ ‐
Total Investments at Fair Value $ 337,501,218.84 $ 307,529,757.08 $ 29,971,461.76 $ ‐
Investments and Cash Equivalents Measured at NAV
Other Commingled Funds (TexStar) 9,460,792.69$
Externally Managed Investments ‐ Foundation Managed Pools 111,680,884.67
Total Investments at NAV 121,141,677.36$
Total Investments at Fair Value 458,642,896.20$
Repurchase Accounts 55,744,342.97$
Other Commingled Funds (TexTERM) 33,065,350.77
Other Commingled Funds (TexPool) 2,550,512.34
Other Commingled Funds 20,173,319.08
Miscellaneous 25,831,645.58
Total Investments not Measured at Fair Value 137,365,170.74$
596,008,066.94$
Fair Value Measurements Using
Investments by Fair Value Level
Investments and Cash Equivalents not Measured at Fair Value
Total Investments
8/31/2019
Quoted Prices in
Active Markets for
Identical Assets
(Level 1)
Significant Other
Observable Inputs
(Level 2)
Significant
Unobservable
Inputs (Level 3)
Equity 9,465,938.61$ 8,910,082.56$ 555,856.05$ ‐$
Domestic Mutual Funds 67,374,174.00 67,374,174.00 ‐ ‐
International Other Commingled Funds 21,016,500.56 ‐ 21,016,500.56 ‐
International Mutual Funds 41,773,490.68 41,773,490.68 ‐ ‐
Fixed Income Money Market and Bond Mutual Funds 38,988,984.45 ‐ 38,988,984.45 ‐
Hedge Funds 25,642,345.88 ‐ 13,233,385.35 12,408,960.53
Private Debt/Equity 18,824,623.28 ‐ ‐ 18,824,623.28
Miscellaneous 135,576.54 ‐ 135,576.54 ‐
Total Investments at Fair Value $ 223,221,634.00 $ 118,057,747.24 $ 73,930,302.95 $ 31,233,583.81
Fair Value Measurements Using
Investments by Fair Value Level
52

UNIVERSITY OF NORTH TEXAS SYSTEM Notes to the Comprehensive Financial Statements
For the Year Ended August 31, 2019
$54,258,416.30 of the System’s externally managed investments are managed by the UNTHSC Foundation. The UNTHSC Foundation Pool has assets with the following recurring fair value measurements as of August 31, 2019:
Within the pool, financial assets valued using Level 1 inputs are based on unadjusted quoted market prices within active markets. Fair values for mutual funds valued using Level 2 inputs are based on published daily valuations. Fair values for the Hedge Funds and Real Estate Funds (REITs) are determined by third‐party valuations of the investments. Other Commingled Funds consists of funds invested with TexPool, TexStar, and TexTERM. These commingled funds were established in conformity with the Interlocal Cooperation Act, Chapter 791 of the Texas Government Code and the Public Funds Investment Act, Chapter 2256 of the Code. They are structured somewhat like money market mutual funds and allow shareholders the ability to deposit or withdraw funds on a daily basis. In addition, interest rates are also adjusted on a daily basis and the funds seek to maintain a constant net asset value of $1.00, although this cannot be fully guaranteed. The System reports its investment with TexStar of $9,460,792.69 at fair value and reports its investment with TexPool and TexTERM of $35,615,863.11 at amortized cost in accordance with GASB Statement No. 79, Certain External Investment Pools and Pool Participants. Please refer to the Investments Reported at NAV section below for further information regarding commingled funds reported at fair value. For commingled funds reported at amortized cost, there are no limitations or restrictions on withdrawals and maximum transaction amounts.
Investments Reported at NAV Other Commingled funds The System invests excess working capital in TexStar to maintain sufficient liquidity and increase yields. There are no unfunded commitments. No limitations or restrictions on redemptions exist. Redemptions can occur at any time. Externally Managed Investments – UNT Foundation and UNTHSC Foundation managed endowments The System records its unitized portion of the UNT Foundation and UNTHSC Foundation‐held investments using NAV. As of August 31, 2019, $111,680,884.67 of the System’s externally managed investments are managed by the UNT Foundation and the UNTHSC Foundation.
Fair Value Fair Value
Frequency Range ‐ Low
Frequency Range ‐ High
Notice Range ‐ Low
Notice Range ‐ High
Unfunded Commitment
Hedge Funds $ 7,169,738.73 Quarterly Quarterly 45 Days 180 Days $0 Equity Funds 34,372,970.18 Daily Monthly 1 Day 60 Days 0 Mutual Funds 67,594,637.88 Daily Monthly 1 Day 60 Days 0 Private Debt 845,647.89 N/A N/A N/A N/A 0 Miscellaneous 1,697,889.99 N/A N/A N/A N/A 0
Total $ 111,680,884.67
8/31/2019
Quoted Prices in
Active Markets for
Identical Assets
(Level 1)
Significant Other
Observable Inputs
(Level 2)
Significant
Unobservable
Inputs (Level 3)
Equity ‐ US Large Cap 20,479,543.44$ 20,479,543.44$ ‐$ ‐$
Equity ‐ US Mid Cap 6,585,944.51 6,585,944.51 ‐ ‐
Emerging Markets 3,162,997.65 3,162,997.65 ‐ ‐
Equity ‐ Foreign 2,633,561.30 2,633,561.30 ‐ ‐
Equity ‐ Global 10,903,303.90 10,903,303.90 ‐ ‐
Mutual Funds ‐ Bonds 28,647,718.75 28,647,718.75 ‐ ‐
Total Investments at Fair Value $ 72,413,069.55 $ 72,413,069.55 $ ‐ $ ‐
Cash Equivalents 1,402,134.00$
Alternative Investments 937,063.00
Total Investments not Measured at Fair Value $ 2,339,197.00
$ 74,752,266.55
Fair Value Measurements Using
Investments by Fair Value Level
Investments and Cash Equivalents not Measured at Fair Value
Total Investments
53

UNIVERSITY OF NORTH TEXAS SYSTEM Notes to the Comprehensive Financial Statements
For the Year Ended August 31, 2019
Note 4: Short‐Term Debt
Commercial Paper At the May 19, 2018 meeting, the University of North Texas System Board of Regents approved a resolution limiting the principal amount of Series A Commercial Paper Notes that may be outstanding at any one time to $50,000,000.00. The Twenty‐Fourth Resolution established the UNT System Revenue Financing System Commercial Paper Program Series B (Extendible Commercial Paper). The issuance of Series B Commercial Paper Notes may not exceed, in aggregate, the principal amount of $75,000,000.00 at any one time. Outstanding commercial paper proceeds may be used for the purpose of financing project costs of eligible projects and to refinance, renew or refund commercial paper notes, prior encumbered obligations, and parity obligations, including interest. Commercial paper notes may not be issued to refinance or refund prior encumbered obligations or parity bonds without the approval of the Board of Regents. Commercial paper activity for the System for the year ended August 31, 2019 is as follows:
September 1, 2018
Additions
Reductions
August 31, 2019
Series A Commercial Paper $ 2,080,000.00 $ 9,200,000.00 $ ‐ $ 11,280,000.00 Series B Commercial Paper ‐ 37,900,000.00 ‐ 37,900,000.00
Total Commercial Paper $ 2,080,000.00 $ 47,100,000.00 $ ‐ $ 49,180,000.00
The outstanding balance of commercial paper at August 31, 2019 was $49,180,000.00 at an average interest rate of 1.74%. Average commercial paper maturity during the year ended August 31, 2019 was approximately 35 days. The System will provide liquidity support for $50,000,000.00 in Series A Commercial Paper Notes by utilizing available funds of the System in lieu of or in addition to bank liquidity support. The maximum maturity for commercial paper is 270 days. In practice, the System rolls, pays off, and/or issues new commercial paper at each maturity. Commercial paper will continue to be used as interim funding until long‐term bonds are approved and issued or gifts or institutional funds are received to retire the commercial paper debt. The System adheres to the requirements of the Federal Securities Act of 1933, which precludes proceeds from commercial paper issues to be used for financing fixed assets, such as plant and equipment, on a permanent basis. The System, working with bond counsel and its financial advisor, routinely determines alternative long‐term funding to ensure that commercial paper is used as interim financing only and will be paid off after completion of construction or equipment acquisition.
54

UNIVERSITY OF NORTH TEXAS SYSTEM Notes to the Comprehensive Financial Statements
For the Year Ended August 31, 2019
Note 5: Long‐Term Liabilities
Changes in Long‐Term Liabilities The following changes occurred in long‐term liabilities during the year ended August 31, 2019:
Revenue Bonds Payable Scheduled principal and interest payments for revenue bonds issued and outstanding as of August 31, 2019 are as follows:
Year Principal Interest Total
2020 $ 37,940,000.00 $ 32,605,562.46 $ 70,545,562.46
2021 40,550,000.00 31,278,406.34 71,828,406.34
2022 42,075,000.00 29,732,552.38 71,807,552.38
2023 37,055,000.00 28,065,497.84 65,120,497.84
2024 37,600,000.00 26,616,429.18 64,216,429.18
2025‐2029 193,350,000.00 109,073,930.32 302,423,930.32
2030‐2034 160,800,000.00 64,599,042.40 225,399,042.40
2035‐2039 95,235,000.00 35,496,751.50 130,731,751.50
2040‐2044 56,740,000.00 15,342,778.30 72,082,778.30
2045‐2049 33,130,000.00 4,269,581.70 37,399,581.70
2050 3,210,000.00 128,400.00 3,338,400.00
Total $ 737,685,000.00 $ 377,208,932.42 $ 1,114,893,932.42
September 1, 2018 Additions ReductionsOther
Adjustments (1) August 31, 2019
Amounts Due
Within One Year
Amounts Due
Thereafter
Bonds Payable:
Revenue Bonds Payable 684,030,000.00$ 172,110,000.00$ 34,910,000.00$ (83,545,000.00)$ 737,685,000.00$ 37,940,000.00$ 699,745,000.00$
Unamortized Net Premiums 47,494,484.58 17,518,943.70 6,208,161.35 ‐ 58,805,266.93 5,920,223.18 52,885,043.75
Direct Placement Revenue Bonds Payable ‐ ‐ 9,560,000.00 83,545,000.00 73,985,000.00 7,140,000.00 66,845,000.00
Total Revenue Bonds Payable 731,524,484.58$ 189,628,943.70$ 50,678,161.35$ ‐$ 870,475,266.93$ 51,000,223.18$ 819,475,043.75$
Capital Lease Obligations:
Capital Lease Obligations 3,460,723.04$ ‐$ 793,977.25$ (1,272,796.00)$ 1,393,949.79$ 554,546.36$ 839,403.43$
Direct Borrowing Capital Leases ‐ 5,365,029.84 1,321,957.03 1,272,796.00 5,315,868.81 1,324,755.17 3,991,113.64
Total Capital Lease Obligations 3,460,723.04$ 5,365,029.84$ 2,115,934.28$ ‐$ 6,709,818.60$ 1,879,301.53$ 4,830,517.07$
Notes and Loans Payable 81,520,000.00$ ‐$ 81,520,000.00$ ‐$ ‐$ ‐$ ‐$
Claims and Judgments 1,464,977.00 ‐ 630,434.00 ‐ 834,543.00 511,259.00 323,284.00
Employees' Compensable Leave 25,767,064.24 3,355,055.57 2,847,786.65 ‐ 26,274,333.16 4,853,883.62 21,420,449.54
Asset Retirement Obligation ‐ 2,427,750.00 ‐ ‐ 2,427,750.00 ‐ 2,427,750.00
Net Pension Liability 107,143,850.00 96,285,020.00 11,732,351.00 ‐ 191,696,519.00 ‐ 191,696,519.00
Net OPEB Liability 86,392,029.00 415,400,684.00 97,909,211.00 ‐ 403,883,502.00 11,293,670.00 392,589,832.00
Other Non‐Current Liabil ities ‐ 1,865,423.54 ‐ ‐ 1,865,423.54 ‐ 1,865,423.54
Total Long‐Term Liabilities 1,037,273,127.86$ 714,327,906.65$ 247,433,878.28$ ‐$ 1,504,167,156.23$ 69,538,337.33$ 1,434,628,818.90$
(1) Amount reclassified per GASB 88 implementation.
55
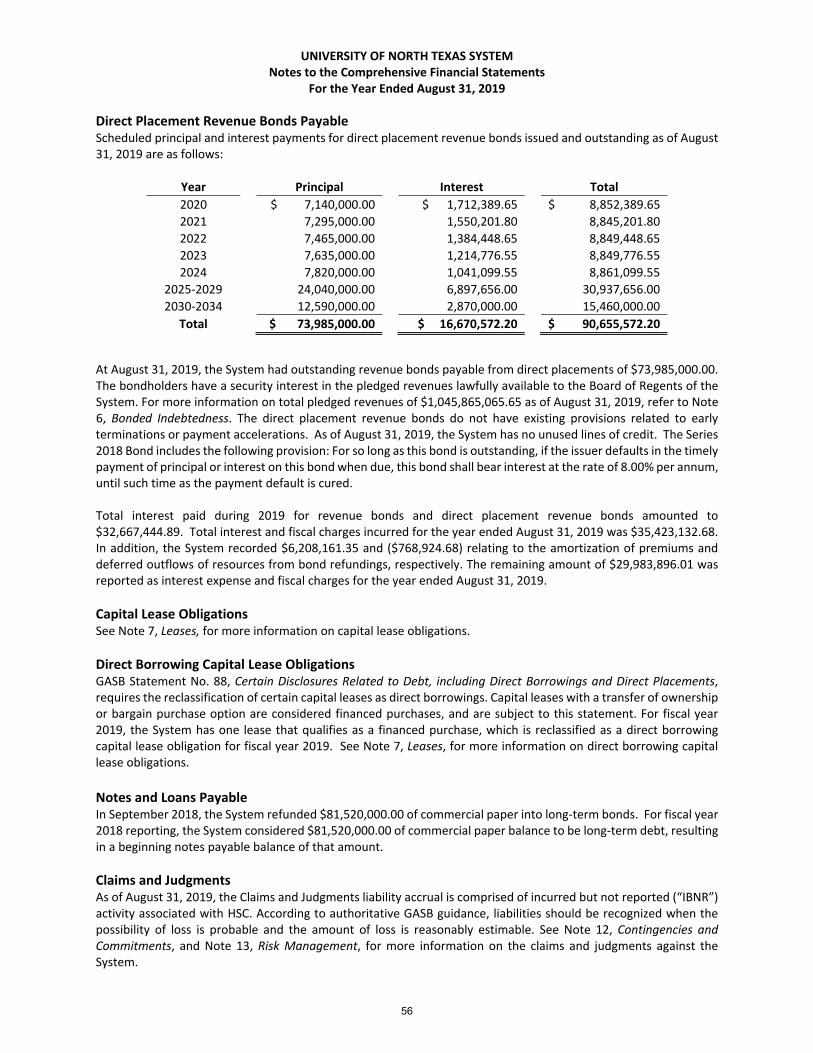
UNIVERSITY OF NORTH TEXAS SYSTEM Notes to the Comprehensive Financial Statements
For the Year Ended August 31, 2019
Direct Placement Revenue Bonds Payable Scheduled principal and interest payments for direct placement revenue bonds issued and outstanding as of August 31, 2019 are as follows:
Year Principal Interest Total
2020 $ 7,140,000.00 $ 1,712,389.65 $ 8,852,389.65
2021 7,295,000.00 1,550,201.80 8,845,201.80
2022 7,465,000.00 1,384,448.65 8,849,448.65
2023 7,635,000.00 1,214,776.55 8,849,776.55
2024 7,820,000.00 1,041,099.55 8,861,099.55
2025‐2029 24,040,000.00 6,897,656.00 30,937,656.00
2030‐2034 12,590,000.00 2,870,000.00 15,460,000.00
Total $ 73,985,000.00 $ 16,670,572.20 $ 90,655,572.20
At August 31, 2019, the System had outstanding revenue bonds payable from direct placements of $73,985,000.00. The bondholders have a security interest in the pledged revenues lawfully available to the Board of Regents of the System. For more information on total pledged revenues of $1,045,865,065.65 as of August 31, 2019, refer to Note 6, Bonded Indebtedness. The direct placement revenue bonds do not have existing provisions related to early terminations or payment accelerations. As of August 31, 2019, the System has no unused lines of credit. The Series 2018 Bond includes the following provision: For so long as this bond is outstanding, if the issuer defaults in the timely payment of principal or interest on this bond when due, this bond shall bear interest at the rate of 8.00% per annum, until such time as the payment default is cured. Total interest paid during 2019 for revenue bonds and direct placement revenue bonds amounted to $32,667,444.89. Total interest and fiscal charges incurred for the year ended August 31, 2019 was $35,423,132.68. In addition, the System recorded $6,208,161.35 and ($768,924.68) relating to the amortization of premiums and deferred outflows of resources from bond refundings, respectively. The remaining amount of $29,983,896.01 was reported as interest expense and fiscal charges for the year ended August 31, 2019.
Capital Lease Obligations See Note 7, Leases, for more information on capital lease obligations.
Direct Borrowing Capital Lease Obligations GASB Statement No. 88, Certain Disclosures Related to Debt, including Direct Borrowings and Direct Placements, requires the reclassification of certain capital leases as direct borrowings. Capital leases with a transfer of ownership or bargain purchase option are considered financed purchases, and are subject to this statement. For fiscal year 2019, the System has one lease that qualifies as a financed purchase, which is reclassified as a direct borrowing capital lease obligation for fiscal year 2019. See Note 7, Leases, for more information on direct borrowing capital lease obligations.
Notes and Loans Payable In September 2018, the System refunded $81,520,000.00 of commercial paper into long‐term bonds. For fiscal year 2018 reporting, the System considered $81,520,000.00 of commercial paper balance to be long‐term debt, resulting in a beginning notes payable balance of that amount.
Claims and Judgments As of August 31, 2019, the Claims and Judgments liability accrual is comprised of incurred but not reported (“IBNR”) activity associated with HSC. According to authoritative GASB guidance, liabilities should be recognized when the possibility of loss is probable and the amount of loss is reasonably estimable. See Note 12, Contingencies and Commitments, and Note 13, Risk Management, for more information on the claims and judgments against the System.
56

UNIVERSITY OF NORTH TEXAS SYSTEM Notes to the Comprehensive Financial Statements
For the Year Ended August 31, 2019
Employees’ Compensable Leave According to the Texas Human Resources Management Statutes Inventory provided by the State Auditor’s Office, state agency employees who have accrued six months of continuous state employment are entitled to be paid for the accrued balance of the employee’s vacation leave as of the date of separation if the employee is not reemployed by a state agency or institution of higher education with no break in state service to a position which accrues vacation leave. Substantially all full‐time System employees earn between eight and twenty‐one hours of annual leave per month depending upon the respective employee’s years of state employment. State law permits employees to carry accrued leave forward from one fiscal year to another, up to a maximum of 532 hours for those employees with 35 or more years of state service. Eligible part‐time employees’ annual leave accrual rate and maximum carryover are proportional to the number of hours appointed to work. Employees with at least six months of continuous State service who terminate their employment are entitled to payment for all accumulated vacation leave. Sick leave, the accumulation of which is unlimited, is earned at the rate of eight hours per month and is paid only when an employee is off due to personal or family illness or to the estate of an employee in the event of his/her death. The maximum sick leave that may be paid to an employee’s estate is one‐half of the employee’s accumulated sick leave or 336 hours, whichever is less. Eligible part‐time employees’ sick leave accrual rate is proportional to the number of hours they are appointed to work. This obligation is generally paid from the same funding source as the employee’s salary or wage compensation is paid. An expense and a liability are recorded as the benefits accrue to employees, and the liability is reduced as the accrued leave is taken. No liability is recorded for non‐vesting accumulating rights to receive sick pay benefits.
Asset Retirement Obligation As of August 31, 2019, the System held two radioactive material licenses associated with facilities at UNT and HSC. The estimated remaining useful life of the associated tangible capital assets is 263 months and 178 months, respectively. Licensing of Radioactive Materials is regulated by the State of Texas (Texas Administrative Code Title 25 Health Services, Part 289 Radiation Control, Subpart 252 Licensing of Radioactive Materials). The System estimated the obligation amount using best‐estimate current value based on settlement amount and recorded the initial measurement as a deferred outflow and a non‐current liability. The System will assess the ARO account balances annually for any significant changes in current value and make all necessary adjustments. ARO balances are reduced annually by the amount of actual expenditures to retire the asset. In accordance with TAX Title 25, Part 289, subpart 201(c), the System is exempted from posting the financial instruments specifically based upon being a state funded academic facility actively working to reduce the amount of radioactive material authorized on its licenses.
Net Pension Liability See Note 1, Summary of Significant Accounting Policies, and Note 8, Defined Benefit Pension Plan and Defined Contribution Plan, for more information on the Net Pension Liability.
Net OPEB Liability See Note 1, Summary of Significant Accounting Policies, and Note 9, Postemployment Benefits Other Than Pensions, for more information on the Net Pension Liability. Other Non‐Current Liabilities The System reported balances in Other Non‐Current Liabilities in fiscal year 2019 related to the wind down of the Perkins Loan Program. Specifically, the federal share to be returned in proportion to the total excess liquid capital of the Perkins Loan Program was recorded as an other non‐current liability in 2019.
57

UNIVERSITY OF NORTH TEXAS SYSTEM Notes to the Comprehensive Financial Statements
For the Year Ended August 31, 2019
Note 6: Bonded Indebtedness At August 31, 2019, the System had revenue bonds principal outstanding of $811,670,000.00. Revenue Financing System (“RFS”) debt is secured by and payable from pledged revenues as defined in the Master Resolution establishing the RFS. Pledged revenues consist of all lawfully available revenues, funds and balances, with certain exceptions, pledged to secure revenue‐supported indebtedness issued under the Master Resolution as set forth by the State. General information related to revenue bonds outstanding as of August 31, 2019 is summarized in the table below:
Bond Purpose Issue Date Interest Rates Amount Issued
Total Principal
Outstanding as of
8/31/19
Public Offerings
RFS Refunding
Bonds, Series
2010
To provide funds for the purposes of refunding Revenue Financing
System Bonds Series 2001, Revenue Financing System Bonds Series
2002, Revenue Financing System Bonds Series 2002A, and paying
certain costs of issuing the bonds
7/23/2010 3.0000% ‐ 5.0000% 57,625,000.00$ 26,670,000.00$
RFS Refunding and
Improvement
Bonds, Series
2012A
To provide funds for the purposes of refunding Revenue Financing
System Bonds Series 2003; a portion of the Board’s outstanding
commercial paper notes; for purchasing, constructing, improving,
renovating, enlarging, and equipping property and infrastructure;
and paying certain costs of issuing the bonds
6/1/2012 2.0000% ‐ 5.0000% 75,890,000.00 46,005,000.00
RFS Refunding
Bonds, Taxable
Series 2012B
To provide funds for the purposes of refunding Revenue Financing
System Bonds Series 2003B and paying certain costs of issuing the
bonds
6/1/2012 0.5500% ‐ 4.0500% 4,820,000.00 3,680,000.00
RFS Refunding
Bonds, Series
2015A
To provide funds for the purposes of refunding Revenue Financing
System Bonds Series 2014 Private Placement Arrangement, for
refunding a portion of the Board's commericial paper notes and
provide funding for constructing and equipping buildings, and
paying certain costs of issuing the bonds
10/21/2015 2.0000%‐5.0000% 105,130,000.00 102,510,000.00
RFS Refunding
Bonds, Series
2015B
To provide funds for the purposes of refunding Revenue Financing
System Bonds Series 2014 Private Placement Arrangement, for
refunding a portion of the Board's commericial paper notes, provide
funding for constructing and equipping buildings, and paying
certain costs of issuing the bonds
10/21/2015 0.3000%‐4.8380% 73,035,000.00 56,620,000.00
RFS Refunding
Bonds, Series
2017A
To provide funds for the purposes of refunding a portion of the
Revenue Financing System Bonds Series 2009A; a portion of the
Board’s outstanding commercial paper notes; for constructing,
improving, renovating, and equipping property; and paying certain
costs of issuing the bonds
1/31/2017 1.0000%‐5.0000% 196,165,000.00 180,825,000.00
RFS Refunding
Bonds, Series
2017B
To provide funds for the purposes of refunding a portion of the
Revenue Financing System Bonds Series 2009A; a portion of the
Board’s outstanding commercial paper notes; for constructing,
improving, renovating, and equipping property; and paying certain
costs of issuing the bonds
1/31/2017 0.9000%‐4.1220% 164,305,000.00 150,240,000.00
RFS Refunding
Bonds, Series
2018A
To provide funds for the purposes of constructing, improving,
renovating, and equipping property; refunding a portion of the
Board’s outstanding commercial paper notes; and paying certain
costs of issuing the bonds
9/11/2018 3.0000%‐5.0000% 149,425,000.00 149,425,000.00
RFS Forward
Refunding Bonds,
Series 2018B
To provide funds for the purposes of constructing, improving,
renovating, and equipping property; refunding a portion of the
Board’s outstanding commercial paper notes; and paying certain
costs of issuing the bonds
9/11/2018 2.3000%‐3.5500% 22,685,000.00 21,710,000.00
Total Public Offerings 849,080,000.00$ 737,685,000.00$
Direct Borrowings
RFS Refunding
Bonds, Series
2015
To provide funds for the purposes of refunding Revenue Financing
System Bonds Series 2003A and 2005 Bonds and paying certain
costs of issuing the bonds
4/30/2015 1.9500% ‐ 1.9500% 38,265,000.00$ 14,815,000.00$
RFS Refunding
Bonds, Series
2015C
To provide funds for the purposes of refunding Revenue Financing
System Bonds Series 2007 Bonds and and paying certain costs of
issuing the bonds
3/1/2016 2.4460%‐10.0000% 45,865,000.00 39,200,000.00
RFS Forward
Refunding Bonds,
Series 2018
To provide funds for the purposes of refunding a portion of the
Revenue Financing System Bonds Series 2009; and paying certain
costs of issuing the bonds
3/14/2018 2.4000% ‐ 2.4000% 22,845,000.00 19,970,000.00
Total Direct Placements 106,975,000.00$ 73,985,000.00$
Total Bonded Indebtedness 956,055,000.00$ 811,670,000.00$
58

UNIVERSITY OF NORTH TEXAS SYSTEM Notes to the Comprehensive Financial Statements
For the Year Ended August 31, 2019
Defeased Bonds Outstanding A portion of RFS Refunding Bonds, Series 2012A, were defeased during 2016. Funds were deposited into an irrevocable trust with an escrow agent to provide for all future debt service payments on the defeased bonds. As of August 31, 2019, the par value outstanding on cash defeased bonds was $3,535,000.00.
Funds Available for Debt Service GASB Statement No. 48, Sales and Pledges of Receivables and Future Revenues and Intra‐Entity Transfers of Assets and Future Revenues, as amended, makes a basic distinction between sales of receivables and future revenues, on the one hand, and the pledging of receivables or future revenues to repay a borrowing (a collateralized borrowing) on the other. Total pledged revenues consist of available pledged revenues, which include the gross revenues of the RFS, the Student Union Fee, pledged general tuition (which includes general use fees), investment income, and funds held for payment of debt service. In addition to current year pledged revenues, any unappropriated or reserve fund balances remaining at year‐end are available for payment of the subsequent year debt service. System HEF reserves cannot be included in total pledged revenues. The following table provides the pledged revenue information for the System’s revenue bonds: Pledged Revenue Required for Future Principal and Interest on Existing Revenue Bonds $ 1,205,549,504.62 Term of Commitment Year Ending 8/31 2050 Percentage of Pledged Revenue 100% Current Year Pledged Revenue $ 1,045,865,065.65 Current Year Principal and Interest Paid $ 77,137,444.89
Note 7: Leases
Operating Leases The System has entered into various operating leases for buildings, equipment, vehicles and land. Rental expenses for operating leases were $8,142,345.66 in 2019. The lease terms typically range from 12 to 60 months, where some lease terms contain optional renewals. Future minimum lease payments under non‐cancelable operating leases having an initial term in excess of one year as of August 31, 2019, were as follows:
Fiscal Year Lease Payments
2020 $ 5,454,463.59 2021 3,605,972.90 2022 687,453.95 2023 431,998.56 2024 139,839.09
2025 – 2029 587,499.20 2030 – 2034 587,499.20 2035 – 2039 587,499.20 2040 – 2044 587,499.20 2045 – 2049 469,999.36
Total Future Minimum Operating Lease Payments
$ 13,139,724.25
59

UNIVERSITY OF NORTH TEXAS SYSTEM Notes to the Comprehensive Financial Statements
For the Year Ended August 31, 2019
The System has also leased buildings and other capital assets to outside parties under various operating leases. The cost, carrying value, and accumulated depreciation of these leased assets as of August 31, 2019, were as follows:
Assets Leased 2019
Buildings:
Cost $ 35,218,081.72
Less: Accumulated Depreciation (6,694,757.30)
Carrying Value $ 28,523,324.42
Parking Garage:
Cost $ 10,655,156.80
Less: Accumulated Depreciation (6,694,279.89)
Carrying Value $ 3,960,876.91
Total Carrying Value $ 32,484,201.33
There were no contingent rentals for the period ended August 31, 2019. Rental income for operating leases was $4,225,729.89 in 2019. Future minimum lease income under non‐cancelable operating leases as of August 31, 2019, was as follows:
Year Lease Income
2020 $ 3,966,997.71
2021 1,300,333.51
2022 1,013,875.16
2023 864,950.74
2024 648,842.77
2025 and beyond 1,649,147.37
Total Minimum Lease Income $ 9,444,147.26
Capital Leases Leases that are purchases in substance are reported as capital lease obligations. The System has entered into long‐term leases for financing the purchase of certain capital assets where lease terms contain bargain purchase options. Such leases are classified as capital leases for accounting purposes, and the asset and liability are recorded at the present value of the future minimum lease payments at the inception of the lease. Amortization of the leased assets is included in depreciation expense. GASB Statement No. 88, Certain Disclosures Related to Debt, including Direct Borrowings and Direct Placements, requires the reclassification of certain capital leases as direct borrowings. For fiscal year 2019, the System has one lease that qualifies as a financed purchase, which is presented as a direct borrowing capital lease obligation herein. A summary of original capitalized costs and accumulated depreciation of all assets under capital lease as of August 31, 2019, is presented below:
Assets Under Capital Lease or Direct Borrowing Capital Lease Direct Borrowing
Equipment: Cost $ 3,064,488.82 $ 6,637,825.84 Less: Accumulated Depreciation (1,191,713.46) (995,673.88)
Carrying Value $ 1,872,775.36 $ 5,642,151.96
Vehicles: Cost $ 450,594.26 $ ‐ Less: Accumulated Depreciation (197,465.38) ‐ Carrying Value $ 253,128.88 $ ‐
Total Carrying Value as of August 31, 2019 $ 2,125,904.24 $ 5,642,151.96
60

UNIVERSITY OF NORTH TEXAS SYSTEM Notes to the Comprehensive Financial Statements
For the Year Ended August 31, 2019
Capital lease obligations are due in monthly, quarterly or annual installments. Future minimum lease payments for
assets under capital lease at August 31, 2019, were as follows:
Year Principal Interest
2020 $ 554,546.36 $ 19,932.47 2021 278,394.15 14,236.90 2022 252,348.37 8,741.13 2023 216,969.45 4,191.51 2024 91,691.46 458.97
Total Future Minimum Lease Payments
$ 1,393,949.79 $ 47,560.98
The direct borrowing capital lease obligation is due in annual installments. Future minimum lease payments for the
asset under direct borrowing capital lease obligations at August 31, 2019, were as follows:
Year Principal Interest
2020 $ 1,324,755.17 $ 11,251.92 2021 1,327,559.23 8,447.86 2022 1,330,369.23 5,637.86 2023 1,333,185.18 2,821.91
Total Future Minimum Lease Payments
$ 5,315,868.81 $ 28,159.55
Note 8: Defined Benefit Pension Plan and Defined Contribution Plan Teacher Retirement System Plan Description The State has joint contributory retirement plans for the majority of its employees. One of the primary plans in which the System participates is the TRS Plan. The TRS Plan is a cost‐sharing, multiple‐employer defined benefit pension plan with a special funding situation administered by TRS. The TRS Plan is established and administered in accordance with the Texas Constitution, Article XVI, Section 67 and Texas Government Code, Title 8, Subtitle C. The TRS Plan is a qualified pension trust under Section 401(a) of the Internal Revenue Code. The Legislature has the authority to establish and amend benefits and contribution rates within the guidelines of the Texas Constitution. The TRS Plan’s Board of Trustees does not have the authority to establish or amend benefit terms.
The employers in the TRS Plan include the state of Texas, TRS, the state’s public schools, education service centers, charter schools, and community and junior colleges. Employees of TRS and state of Texas colleges, universities and medical schools are members of the TRS Plan.
Detailed information about the TRS Plan’s fiduciary net position is available in a separately issued Comprehensive Annual Financial Report that includes financial statements and required supplementary information. That report may be obtained by writing to TRS at 1000 Red River Street, Austin, TX, 78701‐2698. Benefits Provided The TRS Plan provides retirement, disability annuities and death and survivor benefits. The pension benefit formulas are based on members’ average annual compensation and years of service credit. The standard annuity is 2.3% of the average of the five highest annual salaries multiplied by years of service credit. For grandfathered members who were hired on or before August 31, 2005 and meet certain criteria, the standard annuity is based on the average of the three highest annual salaries. The plan does not provide automatic post‐employment benefit changes, including automatic cost of living adjustments (“COLAs”). Ad hoc post‐employment benefit changes, including ad hoc COLAs, can be granted by the Legislature.
61

UNIVERSITY OF NORTH TEXAS SYSTEM Notes to the Comprehensive Financial Statements
For the Year Ended August 31, 2019
All System personnel working on a half time or greater basis that is projected to last for 4½ months or more are eligible for membership in the TRS Plan. However, students employed in positions that require student status as a condition of employment do not participate. Members with at least five years of service have a vested right to unreduced retirement benefits at age 65 or provided they have a combination of age plus years of service totaling 80 or more. However, members who began participation in the TRS Plan on or after September 1, 2007 must be age 60 to retire and members who were not vested in the TRS Plan on August 31, 2014, must be age 62 to retire under the second option. Members are fully vested after five years of service and are entitled to any reduced benefits for which the eligibility requirements have been met prior to meeting the eligibility requirements for unreduced benefits. Early retirement is at age 55 with 5 years of service credit or earlier than 55 with 30 years of service credit. There are additional provisions for early retirement if the sum of the member’s age and years of service credit total at least 80, but the member is less than age 60 or 62 depending on date of employment, or if the member was grandfathered in under a previous rule.
Contributions Contribution requirements are established or amended pursuant to Article XVI, Section 67 of the Texas Constitution, which requires the Legislature to establish a member contribution rate of not less than 6.0% of the member’s annual compensation and a state contribution rate of not less than 6.0% and not more than 10.0% of the aggregate annual compensation paid to members of the System during the year. Texas Government Code Section 821.006 prohibits benefit improvements, if as a result of the particular action, the time required to amortize TRS’ unfunded actuarial liabilities would be increased to a period that exceeds 31 years, or, if the amortization period already exceeds 31 years, the period would be increased by such action.
During the measurement period of 2018 for fiscal 2019 reporting, the amount of the System’s contributions recognized by the plan was $11,732,351.00. The contribution rates are based on a percentage of the monthly gross compensation for each member. Contributions by employees were 7.7% of gross earnings during the measurement period of 2018. Depending upon the source of funding for the employee’s compensation, the State or the System contributes a percentage of participant salaries totaling 6.8% of annual compensation for during the measurement period of 2018.
Pension Liabilities, Pension Expense and Deferred Outflows and Inflows of Resources Related to Pensions The pension plan’s fiduciary net position is determined using economic resources measurement focus and the accrual basis of accounting, which is the same basis used by Teacher Retirement System. Benefits and refunds of contributions are recognized when due and payable in accordance with the terms of the plan. Investments are reported at fair value. Fair value is a market‐based measurement, not an entity‐specific measurement. TRS utilizes one or more of the following valuation techniques in order to measure fair value: the market approach, the cost approach, and the income approach. More detailed information on the plan’s investment policy, assets, and fiduciary net position, may be obtained from TRS’ fiscal 2018 Comprehensive Annual Financial Report. At August 31, 2019, the System reported a liability of $191,696,519.00 for its proportionate share of the collective net pension liability of the TRS Plan. The collective net pension liability was measured as of August 31, 2018 (the “measurement date”), and the total pension liability used to calculate the net pension liability was determined by an actuarial valuation as of that date. The System’s proportion of the collective net pension liability at the measurement date was 0.3482704688%, which was an increase of 0.0131800934% from the 0.3350903754% measured at the prior measurement date. The System’s proportionate share was based on its contributions to the pension plan, excluding State on‐behalf contributions, relative to the contributions of all employers and non‐employer contributing entities to the TRS Plan for the period September 1, 2017 through August 31, 2018 (the “measurement period”). During the measurement period, the amount of the System’s contributions recognized by the TRS Plan, including State on‐behalf contributions, was $14,965,183.93. The State recognized $52,821,707.83 for its proportionate share of the net pension liability related to its contributions to TRS on behalf of the System. The State’s proportionate share for those contributions was 0.0959654411%.
62

UNIVERSITY OF NORTH TEXAS SYSTEM Notes to the Comprehensive Financial Statements
For the Year Ended August 31, 2019
For the year ended August 31, 2019, the System recognized pension expense of $20,381,349.00. At August 31, 2019, the System reported deferred outflows of resources and deferred inflows of resources related to pensions from the following sources:
Deferred Outflows
of Resources
Deferred Inflows of Resources
Contributions subsequent to the measurement date $ 12,006,673.00 $ ‐ Changes of assumptions 69,115,829.00 2,159,872.00 Difference between expected and actual experience 1,194,879.00 4,703,476.00 Change in proportion and contribution difference 22,175,309.00 24,316,340.00 Net difference between projected and actual investment return ‐ 3,637,303.00
Total $ 104,492,690.00 $ 34,816,991.00
The $12,006,673.00 reported as deferred outflows of resources resulting from contributions subsequent to the measurement date will be recognized as a reduction in the net pension liability for 2020. Amounts reported as deferred outflows of resources and deferred inflows of resources related to pensions will be recognized in pension expense as follows:
Year Expense
2020 $ 13,686,030.00
2021 6,031,704.00
2022 4,541,603.00
2023 12,528,000.00
2024 12,852,682.00
Thereafter 8,029,007.00
Total $ 57,669,026.00
Actuarial Assumptions The total pension liability is determined by an annual actuarial valuation. The table below presents the actuarial methods and assumptions used to measure the total pension liability as of the August 31, 2018 measurement date:
Actuarial Methods and Assumptions TRS Plan
Actuarial Valuation Date August 31, 2017 rolled forward to August 31, 2018
Actuarial Cost Method Individual Entry Age Normal
Amortization Method Level Percentage of Payroll, Floating
Asset Valuation Method Market Value
Actuarial Assumptions: Discount Rate 6.907%
Investment Rate of Return 8.00%
Long‐term Expected Rate of Return 7.25%
Municipal Bond Rate as of August 2018 3.69%
Inflation 2.30%
Salary Increase 3.05% to 9.05% including inflation
Mortality
Active 90% of the RP 2014 Employee Mortality Tables for males and females with full generational mortality using Scale BB
Post‐Retirement 2018 TRS Healthy Pensioner Mortality Tables with full generation projection using Scale BB
Ad Hoc Post‐Employment Benefit Changes None
63

UNIVERSITY OF NORTH TEXAS SYSTEM Notes to the Comprehensive Financial Statements
For the Year Ended August 31, 2019
The assumptions used to determine the actuarially determined contributions are those in effect for the Aug. 31, 2017 actuarial valuation. Due to the lag between valuation data and the measurement date, they may not be the same assumptions used to measure the Net Pension Liability. The source for the municipal bond rate is the Fixed Income Market Data/Yield Curve/Data Municipal Bonds with 20 years to maturity that include only federally tax‐exempt municipal bonds as reported in Fidelity Index’s “20‐Year Municipal GO AA Index.” The actuarial assumptions used in the valuation were primarily based on the result of an actuarial experience study for the three‐year period ended August 31, 2017 and adopted in July 2018. The mortality rates were based on 90% of the RP 2014 employee Mortality Tables for males and females. The Post‐retirement mortality rates were based on 2018 TRS Healthy Pensioner Mortality Tables. Furthermore, assumptions, methods, and plan changes were updated from the prior year’s report. The net pension liability increased significantly since the prior measurement date due to a change in the following assumptions:
• The total pension liability as of Aug. 31, 2018 was developed using a roll forward method from the Aug. 31, 2017 valuation.
• Demographic assumptions including post‐retirement mortality, termination rates, and rates of retirement were updated based on the experience study performed for TRS for the period ending Aug. 31, 2017.
• Economic assumptions including rates of salary increase for individual participants were updated based on the same experience study.
• The discount rate changed from 8.000% as of Aug. 31, 2017 to 6.907% as of Aug. 31, 2018. • The long term assumed rate of return changed from 8.00% to 7.25%. • The change in the long term assumed rate of return combined with the change in the discount rate was the
primary reason for the increase in the net pension liability. There have been no changes to the benefit provisions of the TRS Plan since the prior measurement date. The discount rate used to measure the total net pension liability was 6.907%, a decrease of 1.093% from the 8.0% rate used in the prior year. The discount rate was based on the long‐term expected rate of return on pension plan investments of 7.25% and a municipal bond rate of 3.69%. The projected cash flows into and out of the TRS Plan assumed that active members, employers, and non‐employer contributing entities make their contributions at the statutorily required rates. It is assumed that future employer and state contributions will be 7.76% of payroll. This includes a factor for the rehired retirees and the Non‐OASDI surcharge. Based on these assumptions, the TRS Plan’s fiduciary net position and future contributions were sufficient to finance the benefit payments until the year 2069. As a result, the long‐term expected rate of return on pension plan investments was applied to projected benefit payments through the year 2069, and the municipal bond rate was applied to all benefit payments after that date. The long‐term expected rate of return on plan investments was developed using a building‐block method in which best estimate ranges of expected future real rates of return (net of pension plan investment expense and inflation) are developed for each major asset class. These ranges are combined to produce the long‐term expected rate of return by weighing the expected future real rates of return by the target asset allocation percentage and by adding expected inflation.
64
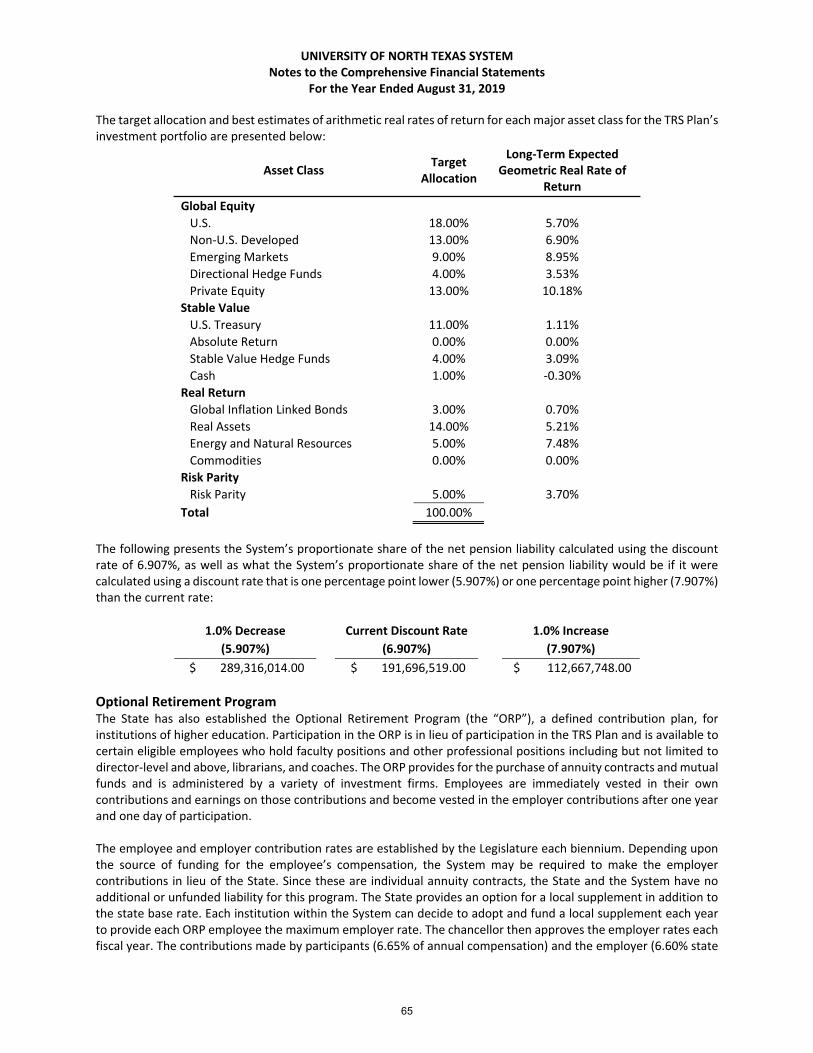
UNIVERSITY OF NORTH TEXAS SYSTEM Notes to the Comprehensive Financial Statements
For the Year Ended August 31, 2019
The target allocation and best estimates of arithmetic real rates of return for each major asset class for the TRS Plan’s investment portfolio are presented below:
Asset Class Target
Allocation
Long‐Term Expected Geometric Real Rate of
Return
Global Equity U.S. 18.00% 5.70%
Non‐U.S. Developed 13.00% 6.90%
Emerging Markets 9.00% 8.95%
Directional Hedge Funds 4.00% 3.53%
Private Equity 13.00% 10.18%
Stable Value U.S. Treasury 11.00% 1.11%
Absolute Return 0.00% 0.00%
Stable Value Hedge Funds 4.00% 3.09%
Cash 1.00% ‐0.30%
Real Return Global Inflation Linked Bonds 3.00% 0.70%
Real Assets 14.00% 5.21%
Energy and Natural Resources 5.00% 7.48%
Commodities 0.00% 0.00%
Risk Parity Risk Parity 5.00% 3.70%
Total 100.00%
The following presents the System’s proportionate share of the net pension liability calculated using the discount rate of 6.907%, as well as what the System’s proportionate share of the net pension liability would be if it were calculated using a discount rate that is one percentage point lower (5.907%) or one percentage point higher (7.907%) than the current rate:
1.0% Decrease Current Discount Rate 1.0% Increase
(5.907%) (6.907%) (7.907%)
$ 289,316,014.00 $ 191,696,519.00 $ 112,667,748.00
Optional Retirement Program The State has also established the Optional Retirement Program (the “ORP”), a defined contribution plan, for institutions of higher education. Participation in the ORP is in lieu of participation in the TRS Plan and is available to certain eligible employees who hold faculty positions and other professional positions including but not limited to director‐level and above, librarians, and coaches. The ORP provides for the purchase of annuity contracts and mutual funds and is administered by a variety of investment firms. Employees are immediately vested in their own contributions and earnings on those contributions and become vested in the employer contributions after one year and one day of participation.
The employee and employer contribution rates are established by the Legislature each biennium. Depending upon the source of funding for the employee’s compensation, the System may be required to make the employer contributions in lieu of the State. Since these are individual annuity contracts, the State and the System have no additional or unfunded liability for this program. The State provides an option for a local supplement in addition to the state base rate. Each institution within the System can decide to adopt and fund a local supplement each year to provide each ORP employee the maximum employer rate. The chancellor then approves the employer rates each fiscal year. The contributions made by participants (6.65% of annual compensation) and the employer (6.60% state
65

UNIVERSITY OF NORTH TEXAS SYSTEM Notes to the Comprehensive Financial Statements
For the Year Ended August 31, 2019
base rate for 2019 plus any local supplement for a maximum 8.50% of annual compensation) for the year ended August 31, 2019, is provided in the following table:
ORP Participation
Member Contributions $ 8,638,208.14
Employer Contributions 9,166,495.47
Total $ 17,804,703.61
Note 9: Postemployment Benefits Other Than Pensions Employees Retirement System Plan Description The state of Texas currently participates in two types of defined benefit OPEB plans. The System participates in the ERS Plan. The ERS Plan is a cost‐sharing, multiple‐employer defined benefit OPEB plan with a special funding situation administered by ERS. The Legislature has the authority to establish and amend benefits and contribution rates within the guidelines of the Texas Constitution. The ERS Plan’s Board of Trustees does not have the authority to establish or amend benefit terms. Benefits are provided to retirees through the Texas Employees Group Benefits Program as authorized by Texas Insurance Code, Chapter 1551.
The employers in the ERS Plan include the state of Texas agencies and universities, community and junior colleges, and other entities specified by the Legislature. Employees of state of Texas agencies, colleges, universities and medical schools are members of the ERS Plan. Detailed information about the ERS Plan’s fiduciary net position is available in a separately issued Comprehensive Annual Financial Report that includes financial statements and required supplementary information. That report may be obtained by writing to ERS at 200 E. 18th Street, Austin, TX, 78701‐1400. Benefits Provided The ERS Plan provides postemployment health care, life and dental insurance benefits to eligible retirees. The benefit and contribution provisions of the ERS Plan are authorized by state law and may be amended by the Legislature. All System employees that work at least 20 hours but less than 30 hours per week for an expected period of 4.5 months or more are eligible for partial health benefits under ERS. UNTS employees that work 30 or more hours for an expected period of 4.5 months or more are eligible for full health benefits under ERS. Employees may retire at age 65 with 10 years of service with an employer who participated in the ERS Plan or any combination of age plus 10 years of service with an employer who participated in the ERS Plan that is equal to or greater than 80. The premium provisions are determined by the Texas Legislature and require monthly contributions by the State, UNTS, and UNTS employees. Surviving spouses and dependents of retirees are also covered by the plan. The plan does not provide automatic cost of living adjustments. Contributions During the measurement period of 2018 for fiscal 2019 reporting, the amount of the System’s contributions recognized by the plan for retirees was $4,409,993.00. Contributions to ERS for the year ended August 31, 2019 for active and retired employees were as follows:
ERS Participation
Member Contributions $ 18,034,052.90
State On‐Behalf Contributions 25,406,258.36
Employer Contributions 38,727,084.95
Total $ 82,167,396.21
66

UNIVERSITY OF NORTH TEXAS SYSTEM Notes to the Comprehensive Financial Statements
For the Year Ended August 31, 2019
The employer does not contribute toward dental or optional life insurance. Surviving spouses and their dependents do not receive any employer contribution. The contribution requirements for the state and the members in the measurement period are presented in the table below:
Employer Contribution Rates
Retiree Health and Basic Life Premium
Retiree Only $ 621.90
Retiree & Spouse $ 1,334.54
Retiree & Children $ 1,099.06
Retiree & Family $ 1,811.70
OPEB Liabilities, OPEB Expense and Deferred Outflows and Inflows of Resources Related to OPEB The OPEB plan’s fiduciary net position is determined using economic resources measurement focus and the accrual basis of accounting, which is the same basis used by ERS. Benefits and refunds of contributions are recognized when due and payable in accordance with the terms of the plan. Investments of the Other Employee Benefit Trust Fund are reported at fair value in accordance with GASB Statement No. 72, Fair Value Measurement and Application. The fair value of investments is based on published market prices and quotations from major investment brokers at available current exchange rates. However, corporate bonds in general are valued based on currently available yields of comparable securities by issuers with similar credit ratings. More detailed information on the plan’s investment valuation, investment policy, assets, and fiduciary net position may be obtained from ERS’ fiscal 2018 Comprehensive Annual Financial Report. At August 31, 2019, the System reported a restatement to decrease fiscal year 2019 beginning net position of $1,519,025.00 related to OPEB due to timing differences in receipt of the fiscal year 2018 contributions subsequent to the measurement date information. At August 31, 2019, the System reported a liability of $403,883,502.00 for its proportionate share of the collective net OPEB liability of the ERS Plan. The non‐current portion of the liability was $392,589,832.00 and the current portion was $11,293,670.00. The collective net OPEB liability was measured as of August 31, 2018 (the “measurement date”), and the total OPEB liability used to calculate the net OPEB liability was determined by an actuarial valuation as of that date. The System’s proportion of the collective net OPEB liability at the measurement date was 1.36273369%, which was an increase of 1.10918396% from the 0.25354973% measured at the prior measurement date. The System’s proportionate share was based on its contributions to the OPEB plan, excluding State on‐behalf contributions, relative to the contributions of all employers and non‐employer contributing entities to the ERS Plan for the period September 1, 2017 through August 31, 2018 (the “measurement period”).
For the year ended August 31, 2019, the System recognized OPEB expense of $79,462,900.00. At August 31, 2019, the System reported deferred outflows of resources and deferred inflows of resources related to OPEB from the following sources:
Deferred Outflows
of Resources
Deferred Inflows of Resources
Contributions subsequent to the measurement date $ 1,315,809.00 $ ‐ Changes of assumptions ‐ 141,531,819.00 Difference between expected and actual experience ‐ 14,796,992.00 Change in proportion and contribution difference 376,573,612.00 ‐ Net difference between projected and actual investment return 191,261.00 ‐
Total $ 378,080,682.00 $ 156,328,811.00
The $1,315,809.00 reported as deferred outflows of resources resulting from contributions subsequent to the measurement date will be recognized as a reduction in the net OPEB liability for 2020. Amounts reported as deferred
67

UNIVERSITY OF NORTH TEXAS SYSTEM Notes to the Comprehensive Financial Statements
For the Year Ended August 31, 2019
outflows of resources and deferred inflows of resources related to OPEB will be recognized in OPEB expense as follows:
Year Expense
2020 $ 42,104,794.00
2021 42,104,794.00
2022 42,104,794.00
2023 55,019,084.00
2024 39,102,596.00
Total $ 220,436,062.00
Actuarial Assumptions The total OPEB liability is determined by an annual actuarial valuation. The table below presents the actuarial methods and assumptions used to measure the total OPEB liability as of the August 31, 2018 measurement date: Actuarial Methods and Assumptions ERS Plan
Actuarial Valuation Date August 31, 2018
Actuarial Cost Method Entry Age
Amortization Method Level Percent of Payroll, Open
Remaining Amortization Period 30 Years
Actuarial Assumptions:
Discount Rate 3.96%
Inflation 2.50%
Salary Increase 2.50% to 9.50% including inflation
Healthcare Cost and Trend Rate 7.30% for FY 2020, 7.40% for FY 2021, 7.00% for FY 2022, decreasing 0.50% per year to an ultimate rate of 4.50% for FY 2027 and later years
Aggregate Payroll Growth 3.00%
Retirement Age Experience‐based tables of rates that are specific to the class of employee Mortality
State Agency Members
Service Retirees, Survivors and Other Inactive Members
2017 State Retirees of Texas Mortality table with a 1 year set forward for male CPO/CO members and Ultimate MP Projection Scale projected from the year 2017
Disabled Retirees RP‐2014 Disabled Retiree Mortality with Ultimate MP Projection Scale projected from the year 2014
Active Members RP‐2014 Active Member Mortality tables with Ultimate MP Projection Scale from the year 2014
Higher Education Members
Service Retirees, Survivors and Other Inactive Members
Tables based on TRS experience with Ultimate MP Projection Scale from the year 2018
Disabled Retirees Tables based on TRS experience with Ultimate MP Projection Scale from year 2018 using a 3‐year set forward and minimum mortality rates of four per 100 male members and two per 100 female members
Active Members Sex Distinct RP‐2014 Employee Mortality multiplied by 90% with Ultimate MP Projection Scale from the year 2014
Ad Hoc Post‐Employment Benefit Changes
None
The source of the municipal bond rate is the Bond Buyer Index of general obligations bonds with 20 years to maturity and mixed credit quality. The bonds’ average credit quality is roughly equivalent to Moody’s Investors Service’s Aa2 rating and Standard & Poor’s Corp.’s AA. The actuarial assumptions used in the valuation were primarily based on the result of actuarial experience studies performed by the ERS and TRS retirement plan actuaries for the period September 1, 2011 to August 31, 2016 for state agency members and for the period September 1, 2010 to August
68
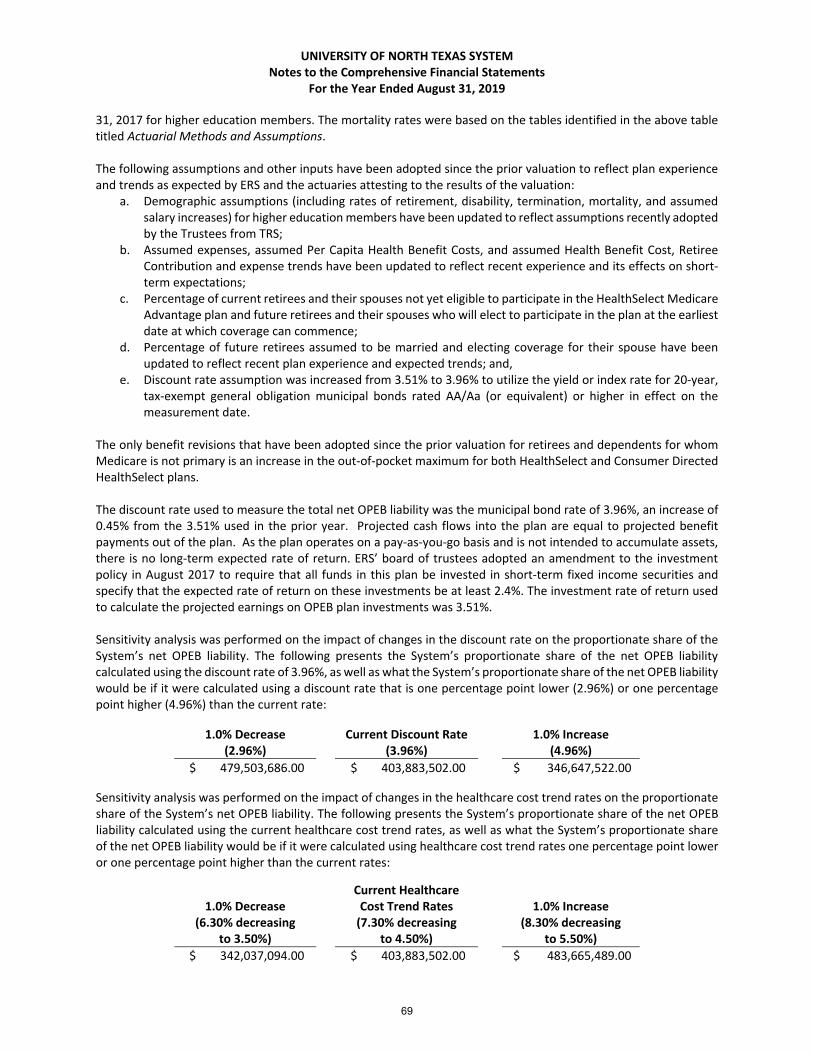
UNIVERSITY OF NORTH TEXAS SYSTEM Notes to the Comprehensive Financial Statements
For the Year Ended August 31, 2019
31, 2017 for higher education members. The mortality rates were based on the tables identified in the above table titled Actuarial Methods and Assumptions. The following assumptions and other inputs have been adopted since the prior valuation to reflect plan experience and trends as expected by ERS and the actuaries attesting to the results of the valuation:
a. Demographic assumptions (including rates of retirement, disability, termination, mortality, and assumed salary increases) for higher education members have been updated to reflect assumptions recently adopted by the Trustees from TRS;
b. Assumed expenses, assumed Per Capita Health Benefit Costs, and assumed Health Benefit Cost, Retiree Contribution and expense trends have been updated to reflect recent experience and its effects on short‐term expectations;
c. Percentage of current retirees and their spouses not yet eligible to participate in the HealthSelect Medicare Advantage plan and future retirees and their spouses who will elect to participate in the plan at the earliest date at which coverage can commence;
d. Percentage of future retirees assumed to be married and electing coverage for their spouse have been updated to reflect recent plan experience and expected trends; and,
e. Discount rate assumption was increased from 3.51% to 3.96% to utilize the yield or index rate for 20‐year, tax‐exempt general obligation municipal bonds rated AA/Aa (or equivalent) or higher in effect on the measurement date.
The only benefit revisions that have been adopted since the prior valuation for retirees and dependents for whom Medicare is not primary is an increase in the out‐of‐pocket maximum for both HealthSelect and Consumer Directed HealthSelect plans. The discount rate used to measure the total net OPEB liability was the municipal bond rate of 3.96%, an increase of 0.45% from the 3.51% used in the prior year. Projected cash flows into the plan are equal to projected benefit payments out of the plan. As the plan operates on a pay‐as‐you‐go basis and is not intended to accumulate assets, there is no long‐term expected rate of return. ERS’ board of trustees adopted an amendment to the investment policy in August 2017 to require that all funds in this plan be invested in short‐term fixed income securities and specify that the expected rate of return on these investments be at least 2.4%. The investment rate of return used to calculate the projected earnings on OPEB plan investments was 3.51%. Sensitivity analysis was performed on the impact of changes in the discount rate on the proportionate share of the System’s net OPEB liability. The following presents the System’s proportionate share of the net OPEB liability calculated using the discount rate of 3.96%, as well as what the System’s proportionate share of the net OPEB liability would be if it were calculated using a discount rate that is one percentage point lower (2.96%) or one percentage point higher (4.96%) than the current rate:
1.0% Decrease Current Discount Rate 1.0% Increase (2.96%) (3.96%) (4.96%)
$ 479,503,686.00 $ 403,883,502.00 $ 346,647,522.00
Sensitivity analysis was performed on the impact of changes in the healthcare cost trend rates on the proportionate share of the System’s net OPEB liability. The following presents the System’s proportionate share of the net OPEB liability calculated using the current healthcare cost trend rates, as well as what the System’s proportionate share of the net OPEB liability would be if it were calculated using healthcare cost trend rates one percentage point lower or one percentage point higher than the current rates:
1.0% Decrease
Current Healthcare Cost Trend Rates 1.0% Increase
(6.30% decreasing to 3.50%)
(7.30% decreasing to 4.50%)
(8.30% decreasing to 5.50%)
$ 342,037,094.00 $ 403,883,502.00 $ 483,665,489.00
69
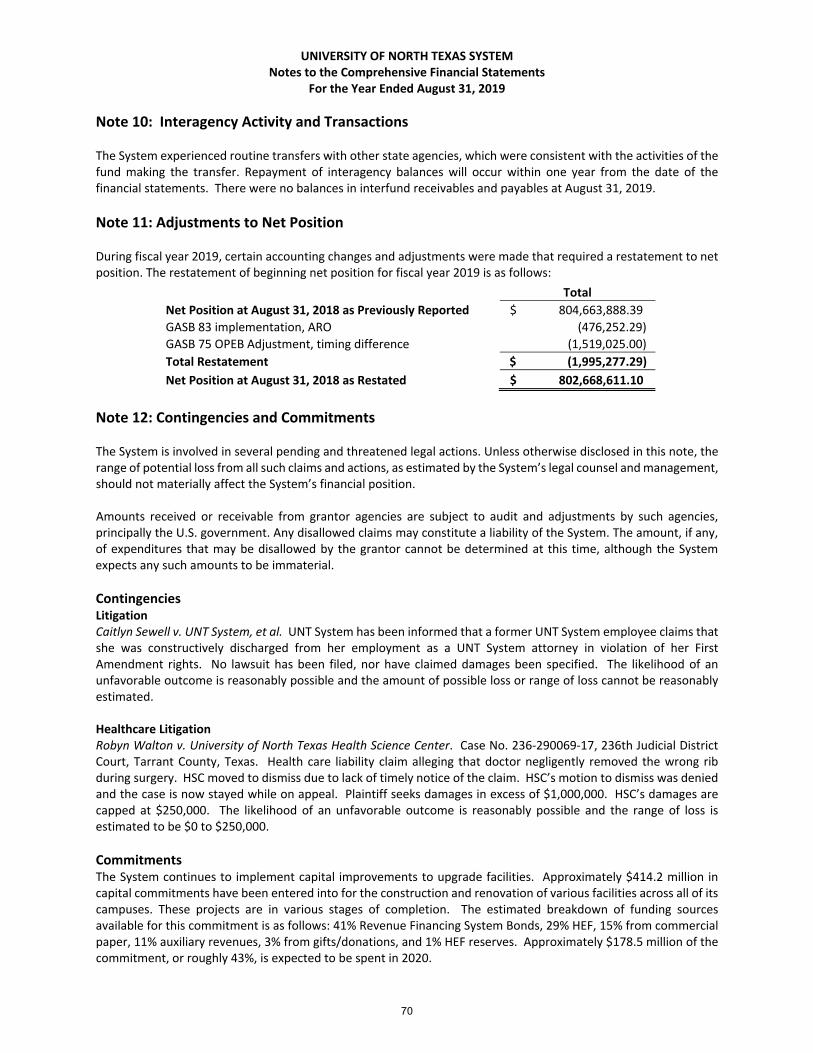
UNIVERSITY OF NORTH TEXAS SYSTEM Notes to the Comprehensive Financial Statements
For the Year Ended August 31, 2019
Note 10: Interagency Activity and Transactions
The System experienced routine transfers with other state agencies, which were consistent with the activities of the fund making the transfer. Repayment of interagency balances will occur within one year from the date of the financial statements. There were no balances in interfund receivables and payables at August 31, 2019.
Note 11: Adjustments to Net Position During fiscal year 2019, certain accounting changes and adjustments were made that required a restatement to net position. The restatement of beginning net position for fiscal year 2019 is as follows:
Total
Net Position at August 31, 2018 as Previously Reported $ 804,663,888.39
GASB 83 implementation, ARO (476,252.29)
GASB 75 OPEB Adjustment, timing difference (1,519,025.00)
Total Restatement $ (1,995,277.29)
Net Position at August 31, 2018 as Restated $ 802,668,611.10
Note 12: Contingencies and Commitments The System is involved in several pending and threatened legal actions. Unless otherwise disclosed in this note, the range of potential loss from all such claims and actions, as estimated by the System’s legal counsel and management, should not materially affect the System’s financial position. Amounts received or receivable from grantor agencies are subject to audit and adjustments by such agencies, principally the U.S. government. Any disallowed claims may constitute a liability of the System. The amount, if any, of expenditures that may be disallowed by the grantor cannot be determined at this time, although the System expects any such amounts to be immaterial.
Contingencies Litigation Caitlyn Sewell v. UNT System, et al. UNT System has been informed that a former UNT System employee claims that she was constructively discharged from her employment as a UNT System attorney in violation of her First Amendment rights. No lawsuit has been filed, nor have claimed damages been specified. The likelihood of an unfavorable outcome is reasonably possible and the amount of possible loss or range of loss cannot be reasonably estimated. Healthcare Litigation Robyn Walton v. University of North Texas Health Science Center. Case No. 236‐290069‐17, 236th Judicial District Court, Tarrant County, Texas. Health care liability claim alleging that doctor negligently removed the wrong rib during surgery. HSC moved to dismiss due to lack of timely notice of the claim. HSC’s motion to dismiss was denied and the case is now stayed while on appeal. Plaintiff seeks damages in excess of $1,000,000. HSC’s damages are capped at $250,000. The likelihood of an unfavorable outcome is reasonably possible and the range of loss is estimated to be $0 to $250,000.
Commitments The System continues to implement capital improvements to upgrade facilities. Approximately $414.2 million in capital commitments have been entered into for the construction and renovation of various facilities across all of its campuses. These projects are in various stages of completion. The estimated breakdown of funding sources available for this commitment is as follows: 41% Revenue Financing System Bonds, 29% HEF, 15% from commercial paper, 11% auxiliary revenues, 3% from gifts/donations, and 1% HEF reserves. Approximately $178.5 million of the commitment, or roughly 43%, is expected to be spent in 2020.
70
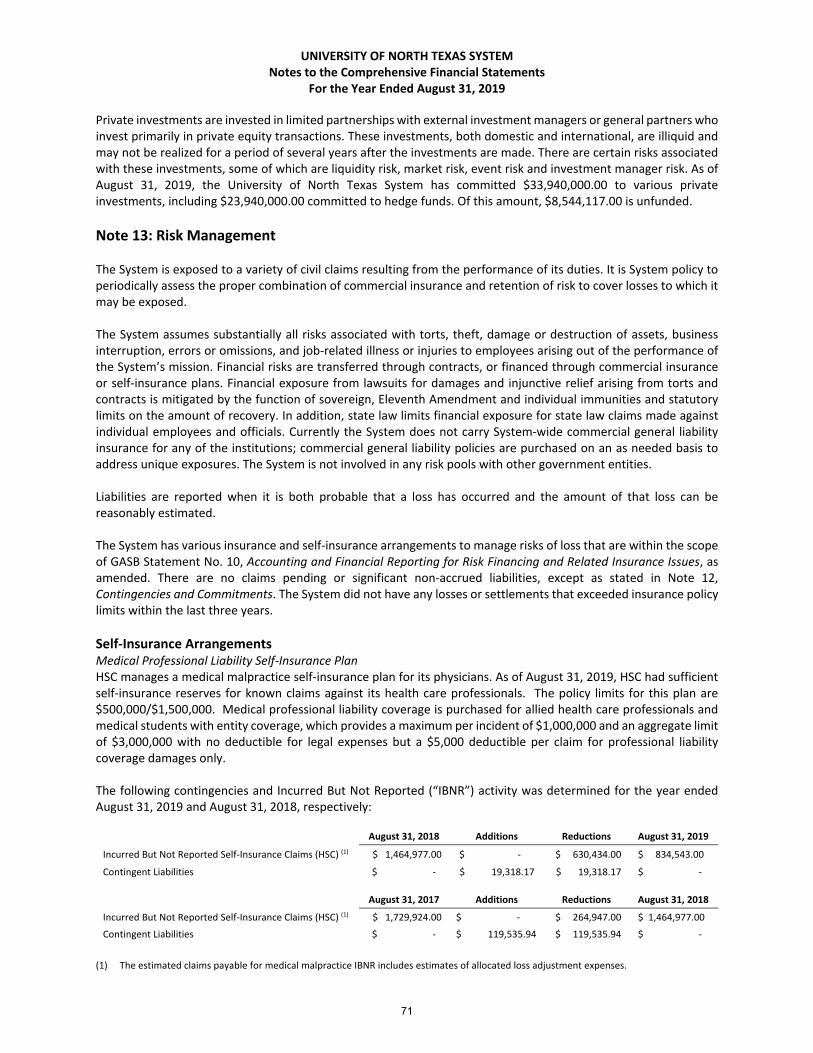
UNIVERSITY OF NORTH TEXAS SYSTEM Notes to the Comprehensive Financial Statements
For the Year Ended August 31, 2019
Private investments are invested in limited partnerships with external investment managers or general partners who invest primarily in private equity transactions. These investments, both domestic and international, are illiquid and may not be realized for a period of several years after the investments are made. There are certain risks associated with these investments, some of which are liquidity risk, market risk, event risk and investment manager risk. As of August 31, 2019, the University of North Texas System has committed $33,940,000.00 to various private investments, including $23,940,000.00 committed to hedge funds. Of this amount, $8,544,117.00 is unfunded.
Note 13: Risk Management The System is exposed to a variety of civil claims resulting from the performance of its duties. It is System policy to periodically assess the proper combination of commercial insurance and retention of risk to cover losses to which it may be exposed. The System assumes substantially all risks associated with torts, theft, damage or destruction of assets, business interruption, errors or omissions, and job‐related illness or injuries to employees arising out of the performance of the System’s mission. Financial risks are transferred through contracts, or financed through commercial insurance or self‐insurance plans. Financial exposure from lawsuits for damages and injunctive relief arising from torts and contracts is mitigated by the function of sovereign, Eleventh Amendment and individual immunities and statutory limits on the amount of recovery. In addition, state law limits financial exposure for state law claims made against individual employees and officials. Currently the System does not carry System‐wide commercial general liability insurance for any of the institutions; commercial general liability policies are purchased on an as needed basis to address unique exposures. The System is not involved in any risk pools with other government entities. Liabilities are reported when it is both probable that a loss has occurred and the amount of that loss can be reasonably estimated. The System has various insurance and self‐insurance arrangements to manage risks of loss that are within the scope of GASB Statement No. 10, Accounting and Financial Reporting for Risk Financing and Related Insurance Issues, as amended. There are no claims pending or significant non‐accrued liabilities, except as stated in Note 12, Contingencies and Commitments. The System did not have any losses or settlements that exceeded insurance policy limits within the last three years.
Self‐Insurance Arrangements Medical Professional Liability Self‐Insurance Plan HSC manages a medical malpractice self‐insurance plan for its physicians. As of August 31, 2019, HSC had sufficient self‐insurance reserves for known claims against its health care professionals. The policy limits for this plan are $500,000/$1,500,000. Medical professional liability coverage is purchased for allied health care professionals and medical students with entity coverage, which provides a maximum per incident of $1,000,000 and an aggregate limit of $3,000,000 with no deductible for legal expenses but a $5,000 deductible per claim for professional liability coverage damages only. The following contingencies and Incurred But Not Reported (“IBNR”) activity was determined for the year ended August 31, 2019 and August 31, 2018, respectively:
August 31, 2018 Additions Reductions August 31, 2019
Incurred But Not Reported Self‐Insurance Claims (HSC) (1) $ 1,464,977.00 $ ‐ $ 630,434.00 $ 834,543.00
Contingent Liabilities $ ‐ $ 19,318.17 $ 19,318.17 $ ‐
August 31, 2017 Additions Reductions August 31, 2018
Incurred But Not Reported Self‐Insurance Claims (HSC) (1) $ 1,729,924.00 $ ‐ $ 264,947.00 $ 1,464,977.00
Contingent Liabilities $ ‐ $ 119,535.94 $ 119,535.94 $ ‐
(1) The estimated claims payable for medical malpractice IBNR includes estimates of allocated loss adjustment expenses.
71
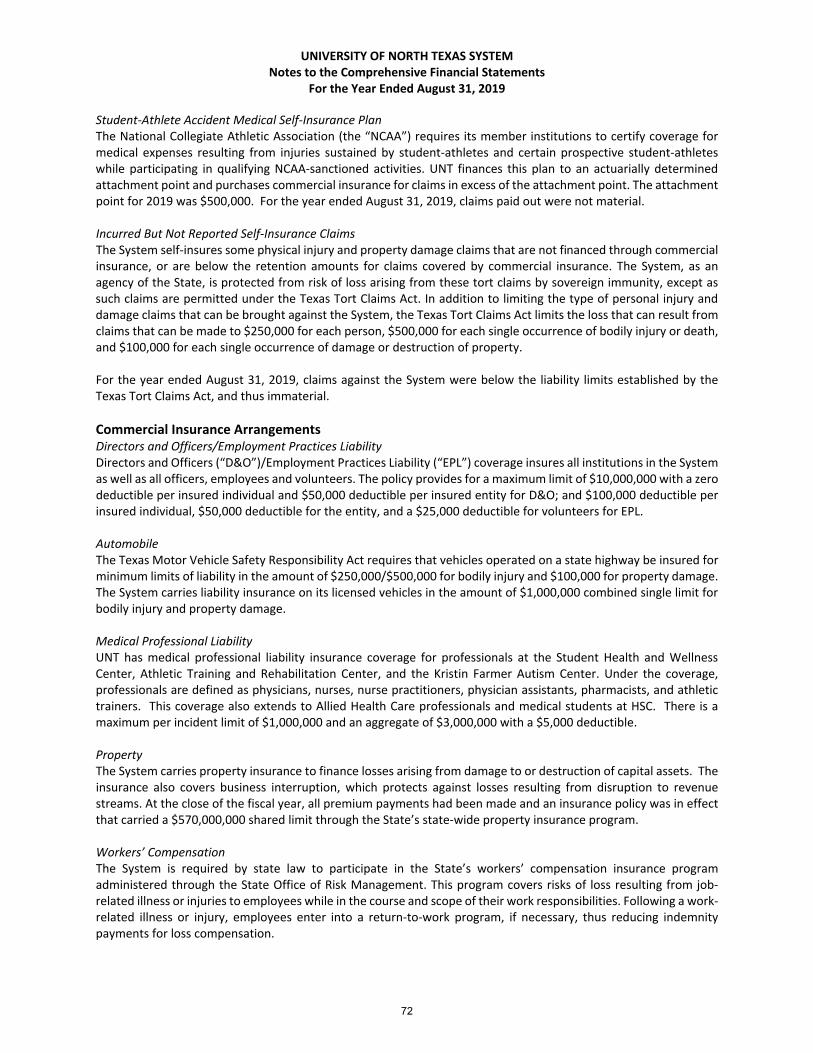
UNIVERSITY OF NORTH TEXAS SYSTEM Notes to the Comprehensive Financial Statements
For the Year Ended August 31, 2019
Student‐Athlete Accident Medical Self‐Insurance Plan The National Collegiate Athletic Association (the “NCAA”) requires its member institutions to certify coverage for medical expenses resulting from injuries sustained by student‐athletes and certain prospective student‐athletes while participating in qualifying NCAA‐sanctioned activities. UNT finances this plan to an actuarially determined attachment point and purchases commercial insurance for claims in excess of the attachment point. The attachment point for 2019 was $500,000. For the year ended August 31, 2019, claims paid out were not material. Incurred But Not Reported Self‐Insurance Claims The System self‐insures some physical injury and property damage claims that are not financed through commercial insurance, or are below the retention amounts for claims covered by commercial insurance. The System, as an agency of the State, is protected from risk of loss arising from these tort claims by sovereign immunity, except as such claims are permitted under the Texas Tort Claims Act. In addition to limiting the type of personal injury and damage claims that can be brought against the System, the Texas Tort Claims Act limits the loss that can result from claims that can be made to $250,000 for each person, $500,000 for each single occurrence of bodily injury or death, and $100,000 for each single occurrence of damage or destruction of property. For the year ended August 31, 2019, claims against the System were below the liability limits established by the Texas Tort Claims Act, and thus immaterial.
Commercial Insurance Arrangements Directors and Officers/Employment Practices Liability Directors and Officers (“D&O”)/Employment Practices Liability (“EPL”) coverage insures all institutions in the System as well as all officers, employees and volunteers. The policy provides for a maximum limit of $10,000,000 with a zero deductible per insured individual and $50,000 deductible per insured entity for D&O; and $100,000 deductible per insured individual, $50,000 deductible for the entity, and a $25,000 deductible for volunteers for EPL. Automobile The Texas Motor Vehicle Safety Responsibility Act requires that vehicles operated on a state highway be insured for minimum limits of liability in the amount of $250,000/$500,000 for bodily injury and $100,000 for property damage. The System carries liability insurance on its licensed vehicles in the amount of $1,000,000 combined single limit for bodily injury and property damage. Medical Professional Liability UNT has medical professional liability insurance coverage for professionals at the Student Health and Wellness Center, Athletic Training and Rehabilitation Center, and the Kristin Farmer Autism Center. Under the coverage, professionals are defined as physicians, nurses, nurse practitioners, physician assistants, pharmacists, and athletic trainers. This coverage also extends to Allied Health Care professionals and medical students at HSC. There is a maximum per incident limit of $1,000,000 and an aggregate of $3,000,000 with a $5,000 deductible. Property The System carries property insurance to finance losses arising from damage to or destruction of capital assets. The insurance also covers business interruption, which protects against losses resulting from disruption to revenue streams. At the close of the fiscal year, all premium payments had been made and an insurance policy was in effect that carried a $570,000,000 shared limit through the State’s state‐wide property insurance program. Workers’ Compensation The System is required by state law to participate in the State’s workers’ compensation insurance program administered through the State Office of Risk Management. This program covers risks of loss resulting from job‐ related illness or injuries to employees while in the course and scope of their work responsibilities. Following a work‐related illness or injury, employees enter into a return‐to‐work program, if necessary, thus reducing indemnity payments for loss compensation.
72
UNIVERSITY OF NORTH TEXAS SYSTEM Notes to the Comprehensive Financial Statements
For the Year Ended August 31, 2019
Separate workers’ compensation policies are purchased to cover out‐of‐state employees as required by the laws of the state in which an employee works. As of August 31, 2019, the System maintains one policy for out‐of‐state employees who reside in Alabama, Arizona, California, Kentucky, New Mexico, New York, Pennsylvania, South Carolina, Virginia and Wyoming. Unemployment Compensation The State provides coverage for unemployment benefits from appropriations made to other state agencies for System employees. The current General Appropriations Act provides that the System must reimburse the General Revenue Fund – Consolidated one‐half of the unemployment benefits for former and current employees from System appropriations. The Texas Comptroller of Public Accounts determines the proportionate amount to be reimbursed from each appropriated fund type. The System has only one appropriated fund type. The System must reimburse the General Revenue Fund 100% of the cost for unemployment compensation for any employees paid from funds held in local bank accounts and local funds held in the State Treasury. Unemployment compensation is on a pay‐as‐you‐go basis through the State, with the exception of locally funded enterprises that have fund expenses and set‐aside amounts based on a percentage of payroll amounts. No material outstanding claims were pending at August 31, 2019. The System maintains reserves for unemployment compensation payments made for all claims and settlements not eligible for state funding. There were no material outstanding claims pending as of August 31, 2019. Health benefits are provided through the various state contracts administered by the Employee Retirement System. Miscellaneous Other lines of insurance purchased include: camp accident/medical, commercial crime, fine arts, inland marine, foreign liability, global medical, kidnap and extortion, specialized general liability and property insurance for the Elm Fork Education Center, errors and omissions, and professional liability for students and North Texas Regional Institutional Review Board.
Note 14: Financial Reporting Entity The System is composed of the University of North Texas System Administration and three academic institutions as follows: the University of North Texas, the University of North Texas Health Science Center at Fort Worth, and the University of North Texas at Dallas. The System is governed by a nine‐member Board of Regents appointed by the Governor of Texas and confirmed by the Texas State Senate. Three members are appointed every odd‐numbered year for six‐year terms. In addition, the Governor appoints a nonvoting student Regent for a one‐year term.
Assets Held By Affiliated Organizations GASB authoritative guidance provides criteria for determining whether certain organizations should be reported as component units based on the nature and significance of their relationship to the primary government, the System. This guidance states that a legally separate tax‐exempt organization should be reported as a component unit of a reporting entity if all of the following criteria are met:
1. The economic resources received or held by the separate organization are entirely or almost entirely for the direct benefit of the primary government, its component units, or its constituents.
2. The primary government is entitled to, or has the ability to otherwise access a majority of the economic resources received or held by the separate organization.
3. The economic resources received or held by an individual organization that the specific primary government, or its component units, is entitled to, or has the ability to otherwise access, are significant to that primary government.
73

UNIVERSITY OF NORTH TEXAS SYSTEM Notes to the Comprehensive Financial Statements
For the Year Ended August 31, 2019
The System has defined significance as 3% of its net position. As of August 31, 2019, the University of North Texas Foundation and the University of North Texas Health Sciences Center Foundation met the criteria for inclusion in the System’s financial statements.
Discretely Presented Component Units University of North Texas Foundation The University of North Texas Foundation, Inc. is reported as a discrete component unit. The UNT Foundation’s fiscal year end is August 31, consistent with the System. The UNT Foundation is a separate nonprofit organization that is organized for various purposes, including transferring or using all or any part of the corpus or income from endowments for the benefit of UNT. Such uses are made in accordance with the general or specific purposes stipulated by the donors, grantors or testators, or in the absence of such stipulations, for such uses as may be determined by the Board of Directors of the UNT Foundation; furthermore, the UNT Foundation promptly distributes all net income in excess of operating requirements to promote the educational advancement of UNT. The governing board is self‐perpetuating, comprised of elected members separate from the System’s Board of Regents. The direction and management of the affairs of the UNT Foundation and the control and disposition of its assets are vested in the Board of Directors of the UNT Foundation. The System has no liability with regard to the UNT Foundation, its operations or liabilities. The majority of endowments supporting university scholarships and other System programs are owned by the UNT Foundation; therefore, including the UNT Foundation’s financial reports is important to obtain a full understanding of the System’s financial position and resources. The UNT Foundation is an essential component of UNT’s program for university advancement and for the development of private sources of funding for capital acquisitions, operations, endowments, and other purposes relating to the mission of UNT. In August 2003, UNT entered into an agreement with the UNT Foundation to better define the relationship between the two entities and to comply with the statutory requirements of Chapters 2255 and 2260 of the Texas Government Code. The 2003 agreement provided that the development leadership for UNT would be provided by the UNT Foundation’s Chief Executive Officer. An amended agreement was approved by the UNT Foundation’s Board of Directors in their June 2009 meeting, and subsequently approved by the System Board of Regents in August 2009. Under the amended agreement, UNT’s Vice President for Advancement will serve as the UNT Foundation’s Director of Development and will oversee, coordinate and exercise decision‐making authority over the fundraising activities of both UNT and the UNT Foundation. In this dual position, the Vice President for Advancement/Foundation’s Director of Development (the “VPA/FDD”) shall have no decision‐making authority in regard to governance of the UNT Foundation or expenditure of funds by the UNT Foundation. The VPA/FDD is an employee of UNT, and compensation for the position is the sole obligation of UNT. In consideration of this amended agreement, UNT has consistently reported the UNT Foundation as a discrete component unit in the System’s financial statements.
University of North Texas Health Science Center Foundation The UNTHSC Foundation is reported as a discrete component unit. The UNTHSC Foundation's fiscal year end is August 31, consistent with the System. The UNTHSC Foundation is a separate nonprofit organization that is organized for various purposes, including transferring or using all or any part of the corpus or income from endowments for the benefit of UNT Health Science Center. Such uses are made in accordance with the general or specific purposes stipulated by the donors, grantors or testators, or in the absence of such stipulations, for such uses as may be determined by the Board of Directors of the UNTHSC Foundation. The governing board is self‐perpetuating, comprised of elected members separate from the System's Board of Regents. The direction and management of the affairs of the UNTHSC Foundation and the control and disposition of its assets are vested in the Board of Directors of the UNTHSC Foundation. The System has no liability with regard to the UNTHSC Foundation, its operations or liabilities. A portion of the endowments supporting scholarships or programs/operations of the Health Science Center is owned by the UNTHSC Foundation, while another portion of the endowments is owned by the Health Science Center and placed with the UNTHSC Foundation for investment under terms of Management
74
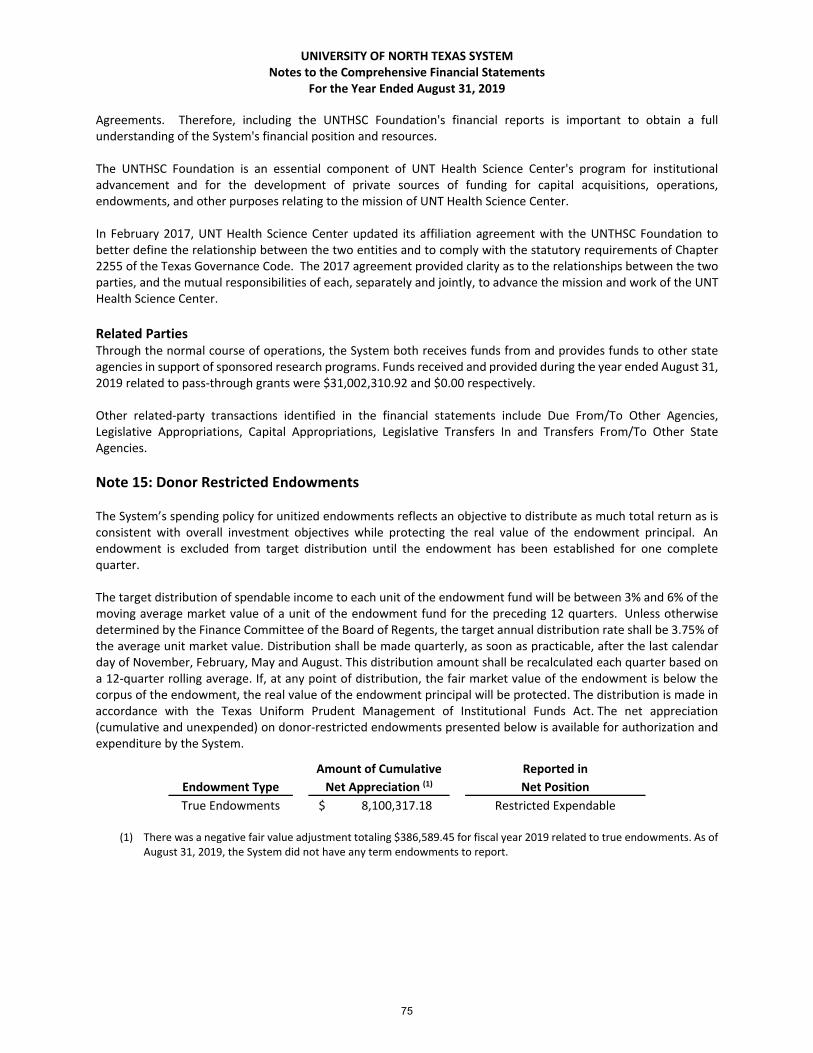
UNIVERSITY OF NORTH TEXAS SYSTEM Notes to the Comprehensive Financial Statements
For the Year Ended August 31, 2019
Agreements. Therefore, including the UNTHSC Foundation's financial reports is important to obtain a full understanding of the System's financial position and resources. The UNTHSC Foundation is an essential component of UNT Health Science Center's program for institutional advancement and for the development of private sources of funding for capital acquisitions, operations, endowments, and other purposes relating to the mission of UNT Health Science Center. In February 2017, UNT Health Science Center updated its affiliation agreement with the UNTHSC Foundation to better define the relationship between the two entities and to comply with the statutory requirements of Chapter 2255 of the Texas Governance Code. The 2017 agreement provided clarity as to the relationships between the two parties, and the mutual responsibilities of each, separately and jointly, to advance the mission and work of the UNT Health Science Center.
Related Parties Through the normal course of operations, the System both receives funds from and provides funds to other state agencies in support of sponsored research programs. Funds received and provided during the year ended August 31, 2019 related to pass‐through grants were $31,002,310.92 and $0.00 respectively. Other related‐party transactions identified in the financial statements include Due From/To Other Agencies, Legislative Appropriations, Capital Appropriations, Legislative Transfers In and Transfers From/To Other State Agencies.
Note 15: Donor Restricted Endowments The System’s spending policy for unitized endowments reflects an objective to distribute as much total return as is consistent with overall investment objectives while protecting the real value of the endowment principal. An endowment is excluded from target distribution until the endowment has been established for one complete quarter. The target distribution of spendable income to each unit of the endowment fund will be between 3% and 6% of the moving average market value of a unit of the endowment fund for the preceding 12 quarters. Unless otherwise determined by the Finance Committee of the Board of Regents, the target annual distribution rate shall be 3.75% of the average unit market value. Distribution shall be made quarterly, as soon as practicable, after the last calendar day of November, February, May and August. This distribution amount shall be recalculated each quarter based on a 12‐quarter rolling average. If, at any point of distribution, the fair market value of the endowment is below the corpus of the endowment, the real value of the endowment principal will be protected. The distribution is made in accordance with the Texas Uniform Prudent Management of Institutional Funds Act. The net appreciation (cumulative and unexpended) on donor‐restricted endowments presented below is available for authorization and expenditure by the System.
Amount of Cumulative Reported in
Endowment Type Net Appreciation (1) Net Position
True Endowments $ 8,100,317.18 Restricted Expendable
(1) There was a negative fair value adjustment totaling $386,589.45 for fiscal year 2019 related to true endowments. As of August 31, 2019, the System did not have any term endowments to report.
75

UNIVERSITY OF NORTH TEXAS SYSTEM Notes to the Comprehensive Financial Statements
For the Year Ended August 31, 2019
Discretely Presented Component Units University of North Texas Foundation The University of North Texas Foundation’s spending policy for unitized endowments reflects an objective to distribute as much total return as is consistent with overall investment objectives and intergenerational equity, while protecting the real value of the endowment principal. An endowment is excluded from target distribution until the endowment has been established for one quarter. The target distribution of spendable income to each unit of the endowment fund will be between 3% and 5% of the moving average market value of a unit of the endowment fund for the preceding 12 quarters. Unless otherwise determined by the UNT Foundation's Board of Directors, the target annual distribution rate shall be 4% of the average unit market value: for fiscal year 2019 the distribution rate was 3.75%. Distribution shall be made quarterly, as soon as practicable, after the last calendar day of November, February, May and August. This distribution amount shall be recalculated each quarter based on a 12‐quarter rolling average. If, at any point of distribution, the fair market value of the endowment is below the corpus of the endowment, the distributions shall be determined on a sliding scale basis. The distribution is made in accordance with the Texas Uniform Prudent Management of Institutional Funds Act. The net appreciation (cumulative and unexpended) on donor‐restricted endowments presented below is available for authorization and expenditure by the UNT Foundation, a discrete component unit of the University of North Texas System.
Amount of Cumulative Reported in
Endowment Type Net Appreciation (1) Net Assets
True Endowments $ 12,352,584.81
Net Assets with Donor Restrictions Held in Perpetuity
(1) There was a positive fair value adjustment totaling $792,215.74 for fiscal year 2019 related to true endowments. As of
August 31, 2019, the UNT Foundation did not have any term endowments to report.
University of North Texas Health Science Center Foundation The University of North Texas Health Science Center Foundation’s spending policy for endowments reflects an objective to distribute as much total return as is consistent with overall investment objectives and intergenerational equity, while protecting the real value of the endowment principal. An endowment is excluded from target distribution until the endowment has been established for one year. The target distribution of spendable income to each unit of the endowment fund will be 4% of the moving average market value of the endowment fund for the preceding 12 quarters. Unless otherwise determined by the UNTHSC Foundation's Board of Directors, the target annual distribution rate shall be 4% of the average unit market value. For fiscal year 2019, the distribution rate was 4%. Distribution shall be made annually. This distribution amount shall be recalculated each year based on a 12‐quarter rolling average. If, at any point of distribution, the fair market value of the endowment is below the corpus of the endowment, the distributions shall be determined on a sliding scale basis. The distribution is made in accordance with the Texas Uniform Prudent Management of Institutional Funds Act. The net appreciation (cumulative and unexpended) on donor‐restricted endowments presented below is available for authorization and expenditure by the UNTHSC Foundation, a discrete component unit of the University of North Texas System.
Amount of Cumulative Reported in
Endowment Type Net Appreciation (1) Net Assets
True Endowments $ 14,788,989.00
Net Assets with Donor Restrictions Held in Perpetuity
(1) There was a positive fair value adjustment totaling $366,391.00 for fiscal year 2019 related to true endowments. As of
August 31, 2019, the UNTHSC Foundation did not have any term endowments to report.
76

UNIVERSITY OF NORTH TEXAS SYSTEM Notes to the Comprehensive Financial Statements
For the Year Ended August 31, 2019
Note 16: Disaggregation of Receivable Balances Net other receivables at August 31, 2019 are detailed by type as follows:
Net Other Receivables Total
Receivables related to various other activities $ 5,345,035.75 Receivables related to auxiliary enterprises, parking 955,367.56
Total Net Other Receivables $ 6,300,403.31
Note 17: Deferred Outflows of Resources and Deferred Inflows of Resources A summary of the System’s deferred outflows of resources and deferred inflows of resources as of August 31, 2019 is presented below:
Total
Deferred Outflows of Resources Unamortized Losses on Refunding of Debt $ 6,189,190.01
Unamortized Losses on Refunding of Direct Placement Debt 484,028.20
Deferred Outflows of Resources Related to Asset Retirement Obligation 1,848,357.81
Deferred Outflows of Resources Related to Pensions 104,492,690.00
Deferred Outflows of Resources Related to OPEB 378,080,682.00
Total Deferred Outflows of Resources $ 491,094,948.02
Deferred Inflows of Resources
Unamortized Gains on Refunding of Direct Placement Debt $ 1,108,735.12
Deferred Inflows of Resources Related to Pensions 34,816,991.00
Deferred Inflows of Resources Related to OPEB 156,328,811.00
Total Deferred Inflows of Resources $ 192,254,537.12
See Note 1, Summary of Significant Accounting Policies, Note 5, Long Term Liabilities, Note 8, Defined Benefit Pension Plan and Defined Contribution Plan, and Note 9, Postemployment Benefits Other Than Pensions, for more information regarding deferred outflows of resources and deferred inflows of resources related to debt refunding, asset retirement obligation, pensions, and OPEB.
77
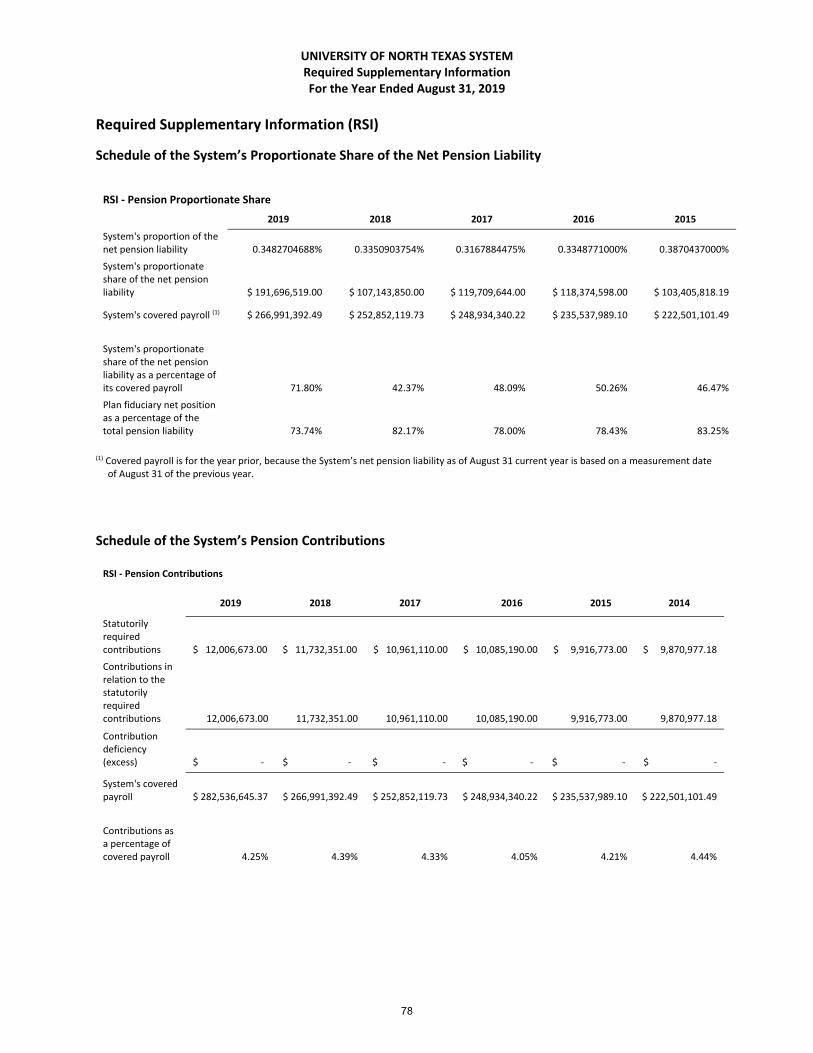
UNIVERSITY OF NORTH TEXAS SYSTEM Required Supplementary Information For the Year Ended August 31, 2019
Required Supplementary Information (RSI)
Schedule of the System’s Proportionate Share of the Net Pension Liability
RSI ‐ Pension Proportionate Share
2019 2018 2017 2016 2015
System's proportion of the net pension liability 0.3482704688% 0.3350903754% 0.3167884475% 0.3348771000% 0.3870437000%
System's proportionate share of the net pension liability $ 191,696,519.00 $ 107,143,850.00 $ 119,709,644.00 $ 118,374,598.00 $ 103,405,818.19
System's covered payroll (1) $ 266,991,392.49 $ 252,852,119.73 $ 248,934,340.22 $ 235,537,989.10 $ 222,501,101.49
System's proportionate share of the net pension liability as a percentage of its covered payroll 71.80% 42.37% 48.09% 50.26% 46.47%
Plan fiduciary net position as a percentage of the total pension liability 73.74% 82.17% 78.00% 78.43% 83.25%
(1) Covered payroll is for the year prior, because the System’s net pension liability as of August 31 current year is based on a measurement date
of August 31 of the previous year.
Schedule of the System’s Pension Contributions RSI ‐ Pension Contributions
2019 2018 2017 2016 2015 2014
Statutorily required contributions $ 12,006,673.00 $ 11,732,351.00 $ 10,961,110.00 $ 10,085,190.00 $ 9,916,773.00 $ 9,870,977.18
Contributions in relation to the statutorily required contributions 12,006,673.00 11,732,351.00 10,961,110.00 10,085,190.00 9,916,773.00 9,870,977.18
Contribution deficiency (excess) $ ‐ $ ‐ $ ‐ $ ‐ $ ‐ $ ‐
System's covered payroll $ 282,536,645.37 $ 266,991,392.49 $ 252,852,119.73 $ 248,934,340.22 $ 235,537,989.10 $ 222,501,101.49
Contributions as a percentage of covered payroll 4.25% 4.39% 4.33% 4.05% 4.21% 4.44%
78

UNIVERSITY OF NORTH TEXAS SYSTEM Required Supplementary Information For the Year Ended August 31, 2019
Schedule of the System’s Proportionate Share of the Net OPEB Liability
RSI ‐ OPEB Proportionate Share
2019 (2) 2018
System's proportion of the net OPEB liability 1.36273369% 0.25354973%
System's proportionate share of the net OPEB liability $ 403,883,502.00 $ 86,392,029.00
System's covered‐employee payroll (1) $ 164,170,798.74 $ 29,780,201.94
System's proportionate share of the net OPEB liability as a percentage of its covered‐employee payroll 246.01% 290.10%
Plan fiduciary net position as a percentage of the total OPEB liability 1.27% 2.04%
(1) Covered‐employee payroll is for the year prior, because the System’s net pension liability as of August 31 current year is
based on a measurement date of August 31 of the previous year. (2) For fiscal year 2019 reporting, ERS had a change in accounting methodology to include both active and retired employee
contributions in the calculation of proportionate share.
Schedule of the System’s OPEB Contributions RSI ‐ OPEB Contributions
2019 2018
Statutorily required contributions $ 1,315,809.00 $ 1,464,282.00
Contributions in relation to the statutorily required contributions 1,315,809.00 1,464,282.00
Contribution deficiency (excess) $ ‐ $ ‐
System's covered‐employee payroll $ 167,889,174.41 $ 164,170,798.94
Contributions as a percentage of covered‐employee payroll 0.78% 0.89%
79
THIS PAGE INTENTIONALLY LEFT BLANK
80
NOTES TO THE
FINANCIAL STATEMENTS
of the
UNIVERSITY OF NORTH TEXAS FOUNDATION, INC.
DENTON, TEXAS
For the Years Ended August 31, 2018 and 2019
81

UNIVERSITY OF NORTH TEXAS FOUNDATION, INC. Notes to the Financial Statements For the Year Ended August 31, 2019
Note 1: Principal Activity and Significant Accounting Policies Organization The University of North Texas Foundation, Inc. (“UNT Foundation”) is a nonprofit organization established to provide financial support to the University of North Texas. This purpose is accomplished by the UNT Foundation receiving and managing donations (cash and non‐cash) from individuals and organizations.
Basis of Presentation The financial statements have been prepared on the accrual basis of accounting.
Contributions Contributions are generally restricted by the donor to support specific programs within the University of North Texas. Unconditional promises to give are recorded as received. Contributions receivable due in the next year are recorded at their estimated net realizable value. Contributions receivable due in subsequent years are recorded at the present value of their estimated net realizable value, using interest rates applicable to the years in which the promises are received to discount the amounts. An allowance for uncollectible promises to give has been provided based on management’s evaluation of contributions receivable at year end. Contributions of cash and other assets are reported as restricted support if they are received with donor stipulations that limit the use of the donated assets. Endowment contributions and investments are permanently restricted by the donor. Investment income available for distribution is recorded as donor restricted net assets because of program restrictions. The portion of the fair value of endowment funds which is below the endowment fund’s historical cost is recorded as a reduction in net assets with donor restrictions. Contributions of donated noncash assets are recorded at their fair values in the period received. Contributions of donated services that create or enhance non‐financial assets or that require specialized skills, are provided by individuals possessing those skills, and would typically need to be purchased if not provided by donation, are recorded at their fair values in the period received.
Net Assets Net assets, revenues, gains, and losses are classified based on the existence or absence of donor‐imposed or grantor‐imposed restrictions. Accordingly, net assets and changes therein area classified and reported as follows: Net Assets Without Donor Restrictions – Net assets available for use in general operations and not subject to donor (or certain grantor) restrictions. The governing board has designated, from net assets without donor restrictions, net assets for operating reserves and board‐designated endowments. Net Assets With Donor Restrictions – Net assets subject to donor‐ (or certain grantor‐) imposed restrictions. Some donor‐imposed restrictions are temporary in nature, such as those that will be met by the passage of time or other events specified by the donor. Other donor‐imposed restrictions are perpetual in nature, where the donor stipulates that resources be maintained in perpetuity. Donor‐imposed restrictions are released when a restriction expires, that is, when the stipulated time has elapsed, when the stipulated purpose for which the resource was restricted has been fulfilled, or both.
Functional Allocation of Expenses The costs of program and supporting services activities have been reported on a functional basis in the statements of activities in order to present the natural classificiation detail of expenses by function. Accordingly, certain costs have been allocated among the programs and supporting services benefited.
82

UNIVERSITY OF NORTH TEXAS FOUNDATION, INC. Notes to the Financial Statements For the Year Ended August 31, 2019
Cash and Cash Equivalents Cash equivalents consist of highly liquid investments with an initial maturity at the time of purchase of three months or less. At August 31, 2019 and 2018, there was $4,869,289 and $1,918,559, respectively, of cash and cash equivalents in the UNT Foundation’s investment accounts awaiting investment.
Investments Investment purchases are recorded at cost, or if donated, at fair value on the date of donation. Thereafter, investments are reported at their fair values in the statements of financial position. Net investment return/(loss) is reported in the statements of activities and consists of interest and dividend income, realized and unrealized capital gains and losses, less external and direct internal investment expenses.
Real Property Real property consists of property that has been donated to the UNT Foundation. The property is stated at the estimated fair value.
Other Assets Other assets consists of paintings and photographs donated to the UNT Foundation and held for sale. The paintings and photographs are recorded at their fair value as of the date of the donation.
Agency Funds Agency funds consist of resources held by the UNT Foundation as an agent for resource providers and will be transferred to third‐party recipients specified by the resource provider.
Estimates The preparation of financial statements in conformity with generally accepted accounting principles requires us to make estimates and assumptions that affect certain reported amounts of assets and liabilities at the date of the financial statements and the reported amounts of revenues and expenses during the reporting period. Actual results could differ from those estimates, and those differences could be material.
Subsequent Events Subsequent events were evaluated through November 20, 2019, the date the financial statements were available to be issued.
Assets Held and Liabilites Under Split‐Interest Agreements Charitable Trusts We act as trustee for various irrevocable trusts. These trusts are governed by the respective trust agreements, which generally provide for either an income stream or a future distribution of cash or other assets to us, in whole or in part, for a specified period or upon the occurrence of a specific event, respectively. If a trust is revocable, or if the maker of the trust reserves the right to replace us as the beneficiary of the trust, we record the assets placed in trust at fair value, with an equal and offsetting liability until such time that we receive distributions from the trust in accordance with its terms. If the trust is irrevocable, the trust assets are recorded at fair value, and a related liability for future payments to be made to the specified beneficiaries is recorded at fair value using present value techniques. The excess of contributed assets over the trust liability is recorded as a contribution with donor restrictions until such amount is received via trust distribution or is expended in satisfaction of the donor‐restricted purpose stipulated by the trust agreement, or both, if any. At that time, net assets with donor‐imposed time or purpose restrictions are released to net assets without restrictions, and net assets with donor restrictions that are perpetual in nature are transferred to the endowment. In subsequent years, the liability for future trust payments to the donor is reduced by payments made to the donor and is adjusted to reflect amortization of the discount and changes in actuarial assumptions at the end of the year. Upon termination of the trust, the remaining liability is removed and recognized as income.
83

UNIVERSITY OF NORTH TEXAS FOUNDATION, INC. Notes to the Financial Statements For the Year Ended August 31, 2019
Charitable Gift Annuities Under charitable gift annuity contracts, we receive immediate title to contributed assets and agree to make fixed recurring payments over the stipulated period. Contributed assets are recorded at fair value on the date of receipt. The related liability for future payments to be made to the specified beneficiaries is recorded at fair value using present value techniques. The excess of contributed assets over the annuity liability is recorded as a contribution with donor restrictions. In subsequent years, the liability for future annuity payments is reduced by payments made to the specified beneficiaries and is adjusted to reflect amortization of the discount and changes in actuarial assumptions at the end of the year. Upon termination of the annuity contract, the remaining liability is removed and recognized as income. Change in Accounting Principle On August 18, 2016, FASB issued Accounting Standards Update (ASU) 2016‐14, Not‐for‐Profit Entities (Topic 958) ‐ Presentation of Financial Statements of Not‐for‐Profit Entities. The update addresses the complexity and understandability of net asset classification, deficiencies in information about liquidity and availability of resources, and the lack of consistency in the type of information provided about expenses and investment return. We have implemented ASU 2016‐14 and have adjusted the presentation in these financial statements accordingly. The ASU has been applied retrospectively to all periods presented which increased net assets without donor restriction by $466,529 and decreased net assets with donor restrictions by $466,529 as of September 1, 2017 (the date the new accounting principle was adopted), resulting from the reclassifications of underwater endowment funds as required under ASU 2016‐14.
Note 2: Liquidity and Availability Financial assets available for general expenditure without donor or other restrictions limiting their use, within one year of the balance sheet date, comprise the following:
Cash and cash equivalents $ 16,105,036 Less cash and cash equivalents included in the investment pool (4,869,289)
Operating investments 1,630,030 Cash and cash equivalents included in donor restricted funds (7,542,283)
Board designated reserves (2,008,584)
Total Contributions and Other Receivables $ 3,314,910
Our endowment funds consist of donor‐restricted endowments and funds designated by the board as endowments. Income from donor‐restricted endowments is restricted for specific purposes. Donor‐restricted endowment funds are not available for general expenditure. Our board‐designated endowments of $608,078 provide for annual distributions to the University of North Texas. Although we do not intend to spend from these board‐designated endowments for general expenditures, these amounts could be made available if necessary. As part of our liquidity management plan, we invest cash in excess of daily requirements in short‐term investments, CDs, and money market funds.
84
UNIVERSITY OF NORTH TEXAS FOUNDATION, INC. Notes to the Financial Statements For the Year Ended August 31, 2019
Note 3: Fair Value Measurements and Disclosures We report certain assets at fair value in the financial statements. Fair value is the price that would be received to sell an asset in an orderly transaction in the principal, or most advantageous, market at the measurement date under current market conditions regardless of whether that price is directly observable or estimated using another valuation technique. Inputs used to determine fair value refer broadly to the assumptions that market participants would use in pricing the asset or liability, including assumptions about risk. Inputs may be observable or unobservable. Observable inputs are inputs that reflect the assumptions market participants would use in pricing the asset or liability based on market data obtained from sources independent of the reporting entity. Unobservable inputs are inputs that reflect the reporting entity's own assumptions about the assumptions market participants would use in pricing the asset or liability based on the best information available. A three‐tier hierarchy categorizes the inputs as follows: Level 1 ‐ Quoted prices (unadjusted) in active markets for identical assets or liabilities that we can access at the measurement date. Level 2 ‐ Inputs other than quoted prices included within Level 1 that are observable for the asset or liability, either directly or indirectly. These include quoted prices for similar assets or liabilities in active markets, quoted prices for identical or similar assets or liabilities in markets that are not active, inputs other than quoted prices that are observable for the asset or liability, and market‐corroborated inputs. Level 3 ‐ Unobservable inputs for the asset or liability. In these situations, we develop inputs using the best information available in the circumstances. In some cases, the inputs used to measure the fair value of an asset might be categorized within different levels of the fair value hierarchy. In those cases, the fair value measurement is categorized in its entirety in the same level of the fair value hierarchy as the lowest level input that is significant to the entire measurement. Assessing the significance of a particular input to entire measurement requires judgment, taking into account factors specific to the asset. The categorization of an asset within the hierarchy is based upon the pricing transparency of the asset and does not necessarily correspond to our assessment of the quality, risk, or liquidity profile of the asset. A significant portion of our investment assets are classified within Level 1 because they are comprised of open‐end mutual funds with readily determinable fair values based on daily redemption values. We invest in CDs traded in the financial markets. Those CDs are valued by the custodians of the securities using pricing models based on credit quality, time to maturity, stated interest rates, and market‐rate assumptions, and are classified within Level 2. The fair value of the private company stock is based on the fair value determined by the company based on a specific valuation methodology and formula. This is considered to be a Level 3 measurement. We use net asset value (NAV) per share, or its equivalent, such as member units or an ownership interest in partners' capital, as a practical expedient to estimate the fair values of certain hedge funds, private equity/debt funds and limited partnerships, which do not have readily determinable fair values. Investments that are measured at fair value using NAV per share as a practical expedient are not classified in the fair value hierarchy.
85

UNIVERSITY OF NORTH TEXAS FOUNDATION, INC. Notes to the Financial Statements For the Year Ended August 31, 2019
The following table presents investments measured at fair value on a recurring basis, except those measured at cost or by using NAV per share as a practical expedient as identified in the following, at August 31, 2019.
Total
Quoted Prices
in Active
Markets for
Identical Assets
(Level 1)
Significant
Other
Observable
Inputs
(Level 2)
Significant
Unobservable
Inputs
(Level 3)
Investments
Measured at
NAV
U.S. and International Equities
Securities and mutual funds 105,985,163$ $ 105,985,163 $ ‐ $ ‐ $ ‐
Equity funds 20,875,136 ‐ ‐ ‐ 20,875,136
$ 126,860,299 $ 105,985,163 $ ‐ $ ‐ $ 20,875,136
U.S. and International Fixed Income
Mutual Funds 37,788,165$ $ 37,788,165 $ ‐ $ ‐ $ ‐
Certificates of deposit 1,630,030 ‐ 1,630,030 ‐ ‐
$ 39,418,195 $ 37,788,165 $ 1,630,030 $ ‐ $ ‐
U.S. Balanced Fund 11,519,778$ $ ‐ $ ‐ $ ‐ $ 11,519,778
Global Real Assets and Infrastructure Mutual Funds 14,038,288$ $ 14,038,288 $ ‐ $ ‐ $ ‐
Hedge Funds 12,560,451$ $ ‐ $ ‐ $ ‐ $ 12,560,451
Private Equity/Debt Funds 3,071,473$ $ ‐ $ ‐ $ ‐ $ 3,071,473
U.S. Private Company Common Stock 15,753,150$ $ ‐ $ ‐ $ 15,753,150
Total Investments 223,221,634$ 157,811,616$ 1,630,030$ 15,753,150$ 48,026,838$
Fair Value Measurements at August 31, 2019 Using
Investments
The following table presents investments measured at fair value on a recurring basis, except those measured at cost or by using NAV per share as a practical expedient as identified in the following, at August 31, 2018.
Total
Quoted Prices
in Active
Markets for
Identical Assets
(Level 1)
Significant
Other
Observable
Inputs
(Level 2)
Significant
Unobservable
Inputs
(Level 3)
Investments
Measured at
NAV
U.S. and International Equities
Securities and mutual funds 177,071,958$ $ 177,071,958 $ ‐ $ ‐ $ ‐
Equity funds 37,930,516 ‐ ‐ ‐ 37,930,516
$ 215,002,474 $ 177,071,958 $ ‐ $ ‐ $ 37,930,516
U.S. and International Fixed Income
Mutual Funds 63,509,225$ $ 63,509,225 $ ‐ $ ‐ $ ‐
Certificates of deposit 1,610,123 ‐ 1,610,123 ‐ ‐
$ 65,119,348 $ 63,509,225 $ 1,610,123 $ ‐ $ ‐
U.S. Balanced Fund 21,065,941$ $ ‐ $ ‐ $ ‐ $ 21,065,941
Global Real Assets and Infrastructure Mutual Funds 23,455,262$ $ 23,455,262 $ ‐ $ ‐ $ ‐
Hedge Funds 31,341,292$ $ ‐ $ ‐ $ ‐ $ 31,341,292
Private Equity/Debt Funds ‐$ $ ‐ $ ‐ $ ‐ $ ‐
U.S. Private Company Common Stock ‐$ $ ‐ $ ‐ $ ‐
Total Investments 355,984,317$ 264,036,445$ 1,610,123$ ‐$ 90,337,749$
Investments
Fair Value Measurements at August 31, 2018 Using
86
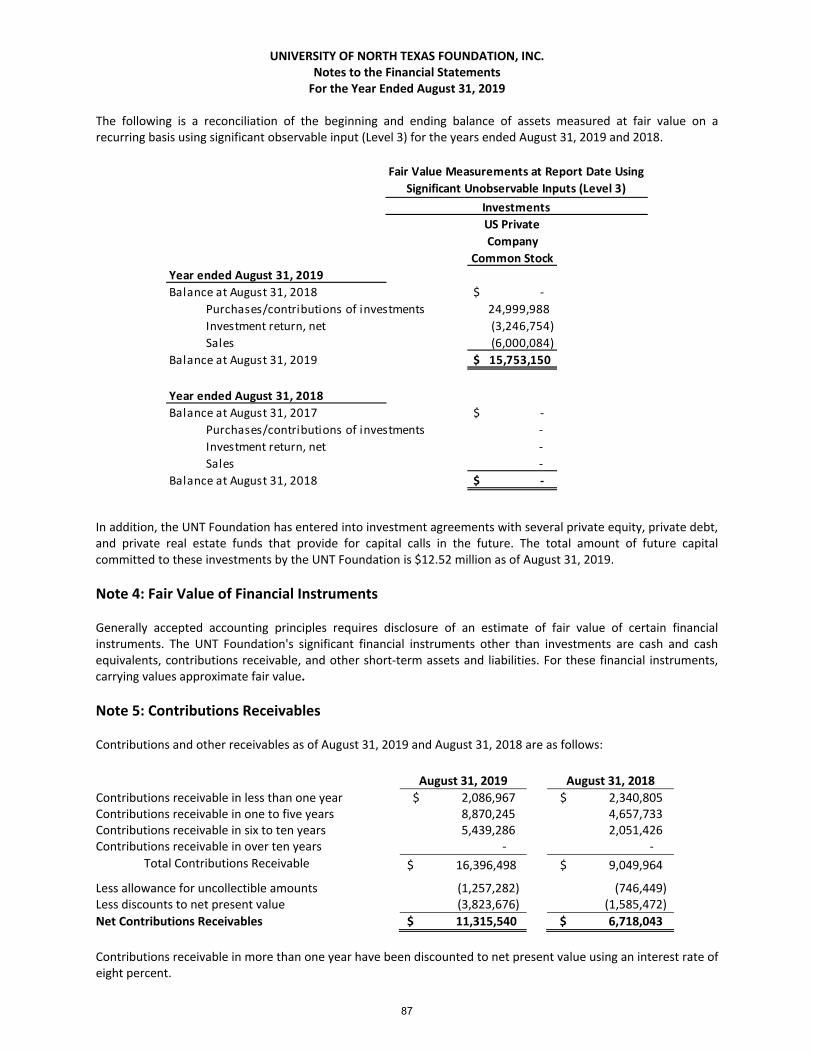
UNIVERSITY OF NORTH TEXAS FOUNDATION, INC. Notes to the Financial Statements For the Year Ended August 31, 2019
The following is a reconciliation of the beginning and ending balance of assets measured at fair value on a recurring basis using significant observable input (Level 3) for the years ended August 31, 2019 and 2018.
US Private
Company
Common Stock
Balance at August 31, 2018 $ ‐
Purchases/contributions of investments 24,999,988
Investment return, net (3,246,754)
Sales (6,000,084)
Balance at August 31, 2019 $ 15,753,150
Balance at August 31, 2017 $ ‐
Purchases/contributions of investments ‐
Investment return, net ‐
Sales ‐
Balance at August 31, 2018 $ ‐
Year ended August 31, 2019
Fair Value Measurements at Report Date Using
Significant Unobservable Inputs (Level 3)
Investments
Year ended August 31, 2018
In addition, the UNT Foundation has entered into investment agreements with several private equity, private debt, and private real estate funds that provide for capital calls in the future. The total amount of future capital committed to these investments by the UNT Foundation is $12.52 million as of August 31, 2019.
Note 4: Fair Value of Financial Instruments Generally accepted accounting principles requires disclosure of an estimate of fair value of certain financial instruments. The UNT Foundation's significant financial instruments other than investments are cash and cash equivalents, contributions receivable, and other short‐term assets and liabilities. For these financial instruments, carrying values approximate fair value.
Note 5: Contributions Receivables Contributions and other receivables as of August 31, 2019 and August 31, 2018 are as follows:
August 31, 2019 August 31, 2018
Contributions receivable in less than one year $ 2,086,967 $ 2,340,805 Contributions receivable in one to five years 8,870,245 4,657,733 Contributions receivable in six to ten years 5,439,286 2,051,426 Contributions receivable in over ten years ‐ ‐
Total Contributions Receivable $ 16,396,498 $ 9,049,964
Less allowance for uncollectible amounts (1,257,282) (746,449) Less discounts to net present value (3,823,676) (1,585,472)
Net Contributions Receivables $ 11,315,540 $ 6,718,043
Contributions receivable in more than one year have been discounted to net present value using an interest rate of eight percent.
87
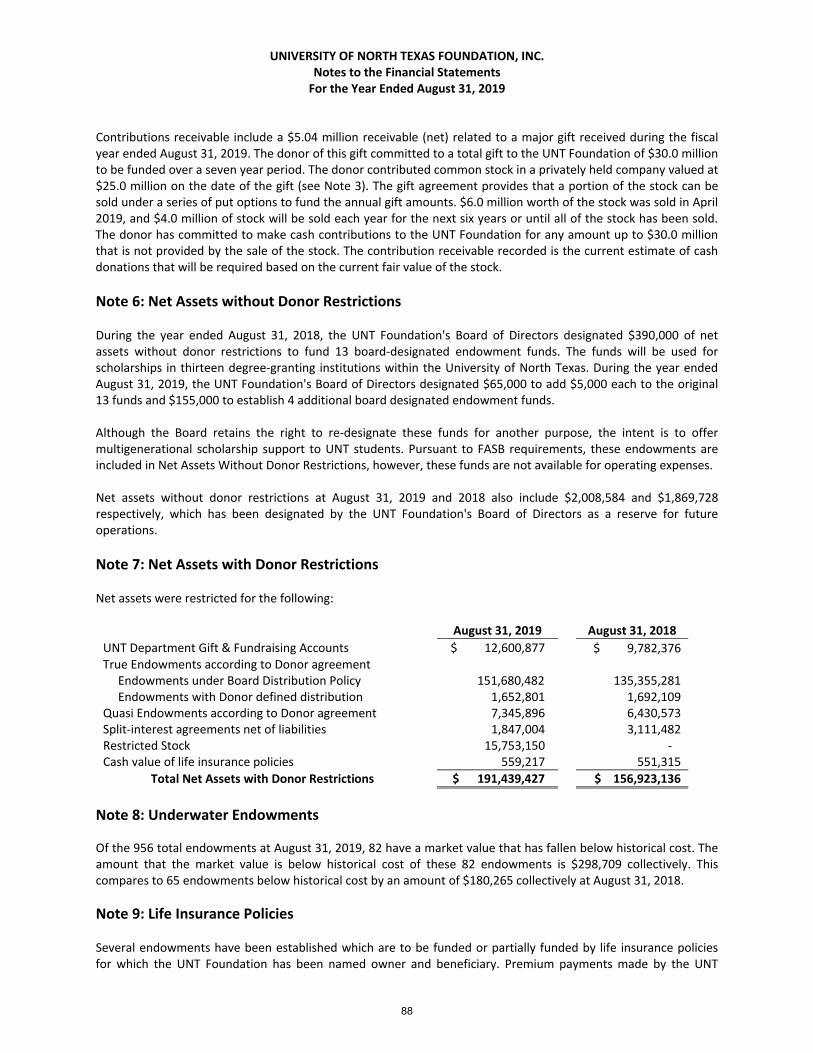
UNIVERSITY OF NORTH TEXAS FOUNDATION, INC. Notes to the Financial Statements For the Year Ended August 31, 2019
Contributions receivable include a $5.04 million receivable (net) related to a major gift received during the fiscal year ended August 31, 2019. The donor of this gift committed to a total gift to the UNT Foundation of $30.0 million to be funded over a seven year period. The donor contributed common stock in a privately held company valued at $25.0 million on the date of the gift (see Note 3). The gift agreement provides that a portion of the stock can be sold under a series of put options to fund the annual gift amounts. $6.0 million worth of the stock was sold in April 2019, and $4.0 million of stock will be sold each year for the next six years or until all of the stock has been sold. The donor has committed to make cash contributions to the UNT Foundation for any amount up to $30.0 million that is not provided by the sale of the stock. The contribution receivable recorded is the current estimate of cash donations that will be required based on the current fair value of the stock.
Note 6: Net Assets without Donor Restrictions During the year ended August 31, 2018, the UNT Foundation's Board of Directors designated $390,000 of net assets without donor restrictions to fund 13 board‐designated endowment funds. The funds will be used for scholarships in thirteen degree‐granting institutions within the University of North Texas. During the year ended August 31, 2019, the UNT Foundation's Board of Directors designated $65,000 to add $5,000 each to the original 13 funds and $155,000 to establish 4 additional board designated endowment funds. Although the Board retains the right to re‐designate these funds for another purpose, the intent is to offer multigenerational scholarship support to UNT students. Pursuant to FASB requirements, these endowments are included in Net Assets Without Donor Restrictions, however, these funds are not available for operating expenses. Net assets without donor restrictions at August 31, 2019 and 2018 also include $2,008,584 and $1,869,728 respectively, which has been designated by the UNT Foundation's Board of Directors as a reserve for future operations.
Note 7: Net Assets with Donor Restrictions Net assets were restricted for the following: August 31, 2019 August 31, 2018
UNT Department Gift & Fundraising Accounts $ 12,600,877 $ 9,782,376 True Endowments according to Donor agreement Endowments under Board Distribution Policy 151,680,482 135,355,281 Endowments with Donor defined distribution 1,652,801 1,692,109 Quasi Endowments according to Donor agreement 7,345,896 6,430,573 Split‐interest agreements net of liabilities 1,847,004 3,111,482 Restricted Stock 15,753,150 ‐ Cash value of life insurance policies 559,217 551,315
Total Net Assets with Donor Restrictions $ 191,439,427 $ 156,923,136
Note 8: Underwater Endowments Of the 956 total endowments at August 31, 2019, 82 have a market value that has fallen below historical cost. The amount that the market value is below historical cost of these 82 endowments is $298,709 collectively. This compares to 65 endowments below historical cost by an amount of $180,265 collectively at August 31, 2018. Note 9: Life Insurance Policies Several endowments have been established which are to be funded or partially funded by life insurance policies for which the UNT Foundation has been named owner and beneficiary. Premium payments made by the UNT
88

UNIVERSITY OF NORTH TEXAS FOUNDATION, INC. Notes to the Financial Statements For the Year Ended August 31, 2019
Foundation are reimbursed by the donors of the policies. As of August 31, 2019 and 2018, there were a total of 23 and 24 such policies, respectively, with death benefits totaling $1,831,879 and $1,889,703 respectively, and cash values totaling $559,217 and $551,315 respectively.
Note 10: Income Taxes The UNT Foundation is organized as a Texas nonprofit corporation and has been recognized by the IRS as exempt from federal income taxes under IRC Section 501 (a) as an organization described in IRC Section 501 (c)(3), qualifies for the charitable contribution deduction under IRC Sections 170(b)(1)(A)(vi) and (viii), and has been determined not to be a private foundation under IRC Sections 509(a)(1) and (3), respectively. The UNT Foundation is annually required to file a Return of Organization Exempt from Income Tax (Form 990) with the IRS. In addition, the entity is subject to income tax on net income that is derived from business activities that are unrelated to their exempt purposes. We have determined that the UNT Foundation is not subject to unrelated business income tax and has not filed an Exempt Organization Business Tax Return (Form 990‐T) with the IRS.
Note 11: Retirement Plan The UNT Foundation sponsors a defined contribution 403(b) retirement plan covering all full time employees of the UNT Foundation. Under the terms of the plan, the UNT Foundation contributes a full matching contribution of up to 6.0% of compensation for employees who make an elective contribution. An additional discretionary non‐elective contribution may be allocated on the basis of compensation, as budgeted and approved by the Board in advance of the fiscal year. Employees may make voluntary contributions up to the limits prescribed by the Internal Revenue Code. The UNT Foundation contributions to the plan were $75,901 and $68,553 for the years ended August 31, 2019 and 2018, respectively.
Note 12: Assets Held For Others The UNT Foundation holds and invests certain funds in trust on behalf of the University of North Texas (“UNT”). Pursuant to an investment management agreement dated August 24, 2012, certain UNT endowment assets have been placed with the UNT Foundation and invested in the UNT Foundation's Consolidated Investment Pool or the UNT Foundation's DFA Short‐Term Government fund. The UNT endowment funds residing in the UNT Foundation's Consolidated Investment Pool are subject to the same investment management and distribution policies as the UNT Foundation's investments. The initial term of the agreement ended August 31, 2013, with a provision to automatically renew annually thereafter. On September 11, 2019 the agreement was re‐written with an effective date of September 1, 2019, with the initial term ending on August 31, 2027 and a provision to automatically renew and extend for additional five‐year terms. The UNT Foundation also formerly held and invested certain funds in trust on behalf of the University of North Texas System (“UNTS”). Pursuant to an investment agreement dated March 15, 2012 and amended and restated on November 1, 2014, certain UNTS long‐term assets had been placed with the UNT Foundation and invested in the UNT Foundation's Consolidated Investment Pool. The UNTS investment funds were subject to the same investment management policy as the UNT Foundation's investments, but received monthly distributions. The initial term of the agreement effective on November 1, 2014 ended August 31, 2016 and contained a provision to automatically renew annually thereafter, as well as a provision for early termination as agreed by the parties. UNTS elected to not renew the agreement at August 31, 2018, and the majority of funds have been transferred back to UNTS. Redemption instructions have been submitted for illiquid investments, and remaining balances will be transferred to UNTS as they are liquidated. UNTS and UNT are independent of the UNT Foundation in all respects. UNTS and UNT are not subsidiaries or affiliates of the UNT Foundation and are not directly or indirectly controlled by the UNT Foundation. The Board of Regents of UNTS makes all decisions regarding the business and affairs of UNTS and UNT, and their long‐term assets and endowment assets managed by the UNT Foundation are the exclusive property of UNTS and UNT
89
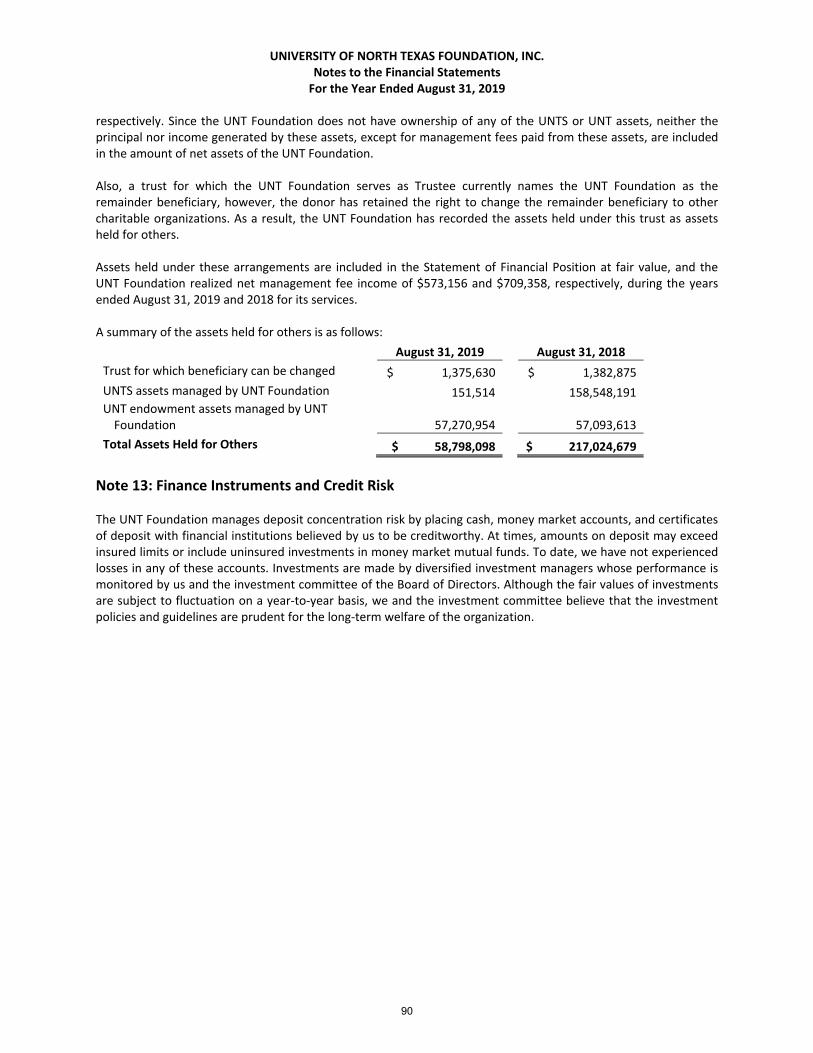
UNIVERSITY OF NORTH TEXAS FOUNDATION, INC. Notes to the Financial Statements For the Year Ended August 31, 2019
respectively. Since the UNT Foundation does not have ownership of any of the UNTS or UNT assets, neither the principal nor income generated by these assets, except for management fees paid from these assets, are included in the amount of net assets of the UNT Foundation. Also, a trust for which the UNT Foundation serves as Trustee currently names the UNT Foundation as the remainder beneficiary, however, the donor has retained the right to change the remainder beneficiary to other charitable organizations. As a result, the UNT Foundation has recorded the assets held under this trust as assets held for others. Assets held under these arrangements are included in the Statement of Financial Position at fair value, and the UNT Foundation realized net management fee income of $573,156 and $709,358, respectively, during the years ended August 31, 2019 and 2018 for its services. A summary of the assets held for others is as follows:
August 31, 2019 August 31, 2018
Trust for which beneficiary can be changed $ 1,375,630 $ 1,382,875
UNTS assets managed by UNT Foundation 151,514 158,548,191 UNT endowment assets managed by UNT Foundation 57,270,954 57,093,613
Total Assets Held for Others $ 58,798,098 $ 217,024,679
Note 13: Finance Instruments and Credit Risk The UNT Foundation manages deposit concentration risk by placing cash, money market accounts, and certificates of deposit with financial institutions believed by us to be creditworthy. At times, amounts on deposit may exceed insured limits or include uninsured investments in money market mutual funds. To date, we have not experienced losses in any of these accounts. Investments are made by diversified investment managers whose performance is monitored by us and the investment committee of the Board of Directors. Although the fair values of investments are subject to fluctuation on a year‐to‐year basis, we and the investment committee believe that the investment policies and guidelines are prudent for the long‐term welfare of the organization.
90

NOTES TO THE
FINANCIAL STATEMENTS
of the
UNIVERSITY OF NORTH TEXAS HEALTH SCIENCE CENTER FOUNDATION
FORT WORTH, TEXAS
For the Years Ended August 31, 2018 and 2019
91

UNIVERSITY OF NORTH TEXAS HEALTH SCIENCE CENTER FOUNDATION
Notes to the Financial Statements For the Year Ended August 31, 2019
Note 1: Summary of Significant Accounting Policies The University of North Texas Health Science Center Foundation (“UNTHSC Foundation”) was organized for charitable, educational, and scientific purposes, and to advance the mission and vision of the University of North Texas Health Science Center (“UNTHSC”) through financial support of its education, discovery and health care priorities. All income received by the UNTHSC Foundation is to be used for the future benefit of the UNT Health Science Center at the discretion of the Board of Directors.
Nature of Activities The management of the UNTHSC Foundation is vested in the Board of Directors (“the Board”) who have discretionary authority to determine the amount, manner and times for payment of any distributions from the UNTHSC Foundation. The UNTHSC Foundation is subject to a pay‐out policy which dictates scholarships and other payments made in current year. During 2019 and 2018, the UNTHSC Foundation paid $4,591,883 and $5,152,555 in scholarships, grants and other expenses to UNTHSC and other not‐for‐profit organizations.
Basis of Accounting The accompanying financial statements are prepared on the accrual basis of accounting, which recognizes support and revenue when earned, and expenses when incurred.
Financial Statement Presentation The financial statements of the UNTHSC Foundation are presented in accordance with accounting principles generally accepted in the United States of America applicable to not‐for‐profit organizations. Financial position and activities are reported according to two classes of net assets: (i) net assets without donor restrictions, and (ii) net assets with donor restrictions.
Use of Estimates The preparation of financial statements in conformity with accounting principles generally accepted in the United States of America (“GAAP”) requires management to make estimates and assumptions that affect the reported amounts of assets and liabilities, disclosure of contingent assets and liabilities at the date of the financial statements, and the reported amounts of revenues and expenses during the reporting period. Significant estimates include, but are not limited to, the fair value of investments and the discounts applied to unconditional promises to give. It is at least reasonably possible that these estimates will change in the near term.
Cash and Cash Equivalents For the purpose of the statement of cash flows, the UNTHSC Foundation considers cash available in the demand deposit accounts and all highly liquid short‐term investments with original maturities of three months or less to be cash equivalents. The UNTHSC Foundation maintains its cash and cash equivalents in bank deposit accounts, which at times may exceed federally insured limits. The UNTHSC Foundation has not experienced any losses in such accounts and believes it is not exposed to any significant credit risk related to cash and cash equivalents.
Investments Investments are carried at fair value or net asset value. Appreciation or depreciation in fair value is reported in support and revenue.
Contributions Conditional promises to give received by the UNTHSC Foundation, which stipulate the occurrence of some specified event before payment will be made, are recognized when the specified future event takes place and the promise to give becomes unconditional.
92

UNIVERSITY OF NORTH TEXAS HEALTH SCIENCE CENTER FOUNDATION
Notes to the Financial Statements For the Year Ended August 31, 2019
Unconditional promises to give are recorded as contributions when received and classified as net assets without donor restrictions, or net assets with donor restrictions, depending on the existence and/or nature of any donor‐imposed restrictions.
Donor Restrictions The UNTHSC Foundation reports gifts of cash and other assets as restricted support if they are received with donor stipulations that limit the use of the donated assets. When a donor restriction expires, that is, when a stipulated time restriction ends or purpose restriction is accomplished, net assets with donor restrictions are reclassified to net assets without donor restrictions and reported in the statement of activities as net assets released from restrictions.
Income Taxes The UNTHSC Foundation is exempt from federal income taxes under Section 501(c)(3) of the Internal Revenue Code. In addition, the UNTHSC Foundation has been determined by the Internal Revenue Service not to be a private foundation within the meaning of Section 509(a) of the Code.
Uncertain Tax Positions The UNTHSC Foundation recognizes in its financial statements the financial effect of a tax position, if that position is more likely than not to be sustained upon examination, including resolution of any appeals or litigation processes, based upon the technical merits of the position. Tax positions taken related to the UNTHSC Foundation’s tax exempt status for federal tax purposes and state filing requirements have been reviewed, and management is of the opinion that material positions taken by the UNTHSC Foundation would more likely than not be sustained by examination. Accordingly, the UNTHSC Foundation has not recorded an income tax liability for uncertain tax benefits.
New Accounting Standard Adopted In fiscal year 2018, the UNTHSC Foundation adopted the Financial Accounting Standards Board Accounting Standards Update (ASU) 2016‐14, Not‐for‐Profit Entities (Topic 958) Presentation of Financial Statements of Not‐for‐Profit Entities. The requirements of ASU 2016‐14 apply to the financial statements of all not‐for‐profit entities. This update reduced the net asset classifications from three classes (unrestricted, temporarily restricted and permanently restricted) to two classes (net assets with donor restrictions and net assets without donor restrictions). In addition, this statement added a liquidity disclosure (Note 8) to show the amount of financial assets available within one year from the balance sheet date and added disclosures related to cost allocation methodologies. Accounts recognized in net assets related to the prior period have been reclassified to conform to the presentation requirements under ASU 2016‐14. The reclassifications, including reclassifying investment expenses to investment income, have no effect on total net assets or change in net assets.
Functional Allocation of Expenses The costs of providing the programs and supporting services of the UNTHSC Foundation have been summarized on a functional basis in the statements of activities. Functional expenses have been categorized as program expenses and supporting services based on the nature of the activity performed, and, as such, no costs have been allocated across the functional expense categories.
Subsequent Events The UNTHSC Foundation evaluated all events or transactions that occurred after August 31, 2019 through November 20, 2019, the date these financial statements were available to be issued.
93
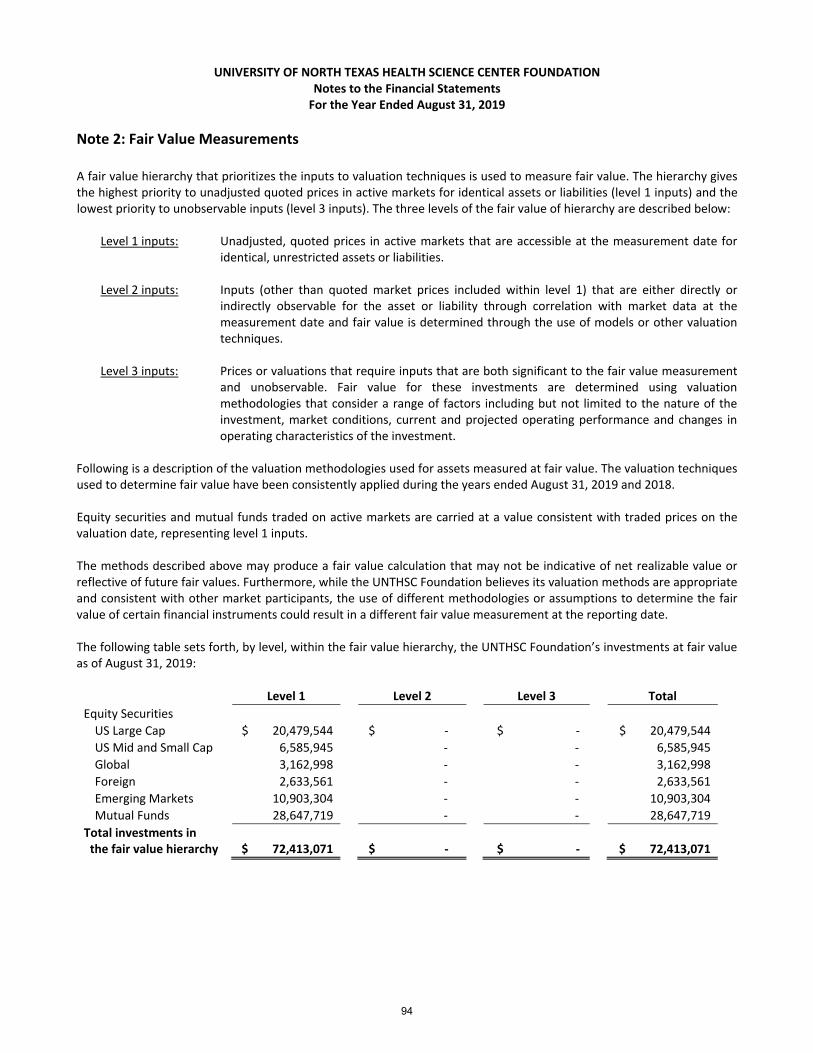
UNIVERSITY OF NORTH TEXAS HEALTH SCIENCE CENTER FOUNDATION
Notes to the Financial Statements For the Year Ended August 31, 2019
Note 2: Fair Value Measurements A fair value hierarchy that prioritizes the inputs to valuation techniques is used to measure fair value. The hierarchy gives the highest priority to unadjusted quoted prices in active markets for identical assets or liabilities (level 1 inputs) and the lowest priority to unobservable inputs (level 3 inputs). The three levels of the fair value of hierarchy are described below:
Level 1 inputs: Unadjusted, quoted prices in active markets that are accessible at the measurement date for identical, unrestricted assets or liabilities.
Level 2 inputs: Inputs (other than quoted market prices included within level 1) that are either directly or
indirectly observable for the asset or liability through correlation with market data at the measurement date and fair value is determined through the use of models or other valuation techniques.
Level 3 inputs: Prices or valuations that require inputs that are both significant to the fair value measurement
and unobservable. Fair value for these investments are determined using valuation methodologies that consider a range of factors including but not limited to the nature of the investment, market conditions, current and projected operating performance and changes in operating characteristics of the investment.
Following is a description of the valuation methodologies used for assets measured at fair value. The valuation techniques used to determine fair value have been consistently applied during the years ended August 31, 2019 and 2018. Equity securities and mutual funds traded on active markets are carried at a value consistent with traded prices on the valuation date, representing level 1 inputs. The methods described above may produce a fair value calculation that may not be indicative of net realizable value or reflective of future fair values. Furthermore, while the UNTHSC Foundation believes its valuation methods are appropriate and consistent with other market participants, the use of different methodologies or assumptions to determine the fair value of certain financial instruments could result in a different fair value measurement at the reporting date. The following table sets forth, by level, within the fair value hierarchy, the UNTHSC Foundation’s investments at fair value as of August 31, 2019: Level 1 Level 2 Level 3 Total
Equity Securities
US Large Cap $ 20,479,544 $ ‐ $ ‐ $ 20,479,544
US Mid and Small Cap 6,585,945 ‐ ‐ 6,585,945
Global 3,162,998 ‐ ‐ 3,162,998
Foreign 2,633,561 ‐ ‐ 2,633,561
Emerging Markets 10,903,304 ‐ ‐ 10,903,304
Mutual Funds 28,647,719 ‐ ‐ 28,647,719
Total investments in the fair value hierarchy $ 72,413,071 $ ‐ $ ‐ $ 72,413,071
94
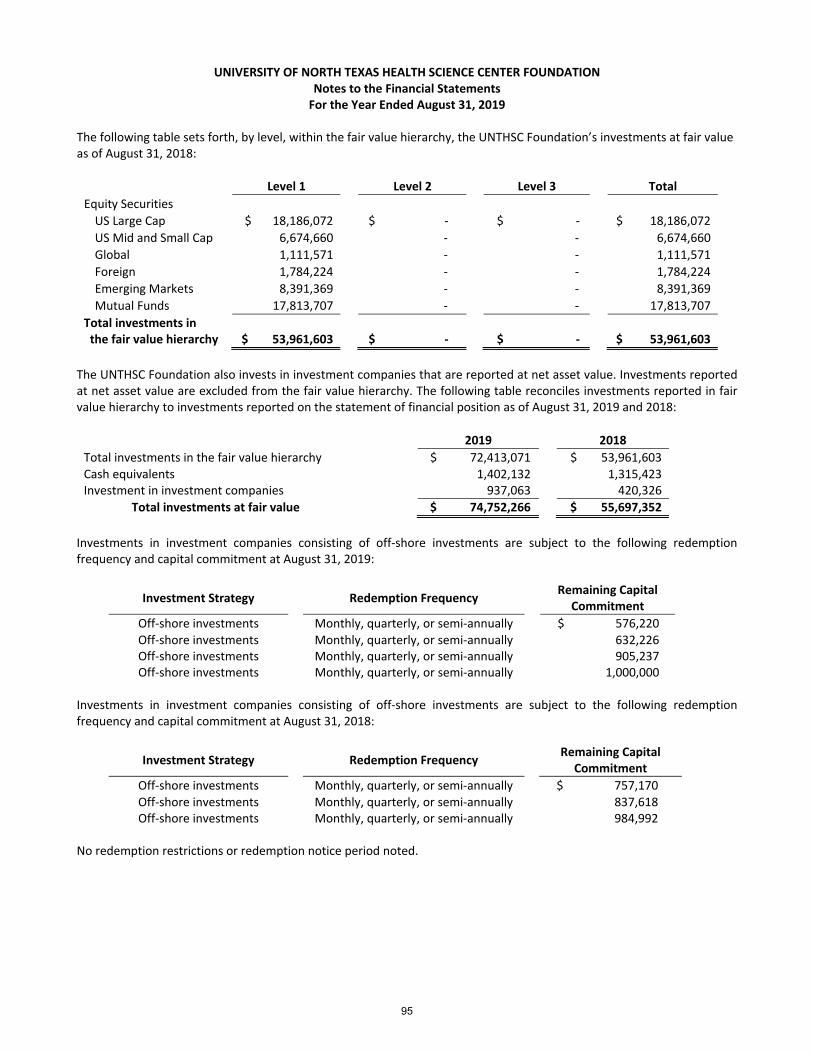
UNIVERSITY OF NORTH TEXAS HEALTH SCIENCE CENTER FOUNDATION
Notes to the Financial Statements For the Year Ended August 31, 2019
The following table sets forth, by level, within the fair value hierarchy, the UNTHSC Foundation’s investments at fair value as of August 31, 2018: Level 1 Level 2 Level 3 Total
Equity Securities
US Large Cap $ 18,186,072 $ ‐ $ ‐ $ 18,186,072
US Mid and Small Cap 6,674,660 ‐ ‐ 6,674,660
Global 1,111,571 ‐ ‐ 1,111,571
Foreign 1,784,224 ‐ ‐ 1,784,224
Emerging Markets 8,391,369 ‐ ‐ 8,391,369
Mutual Funds 17,813,707 ‐ ‐ 17,813,707
Total investments in the fair value hierarchy $ 53,961,603 $ ‐ $ ‐ $ 53,961,603
The UNTHSC Foundation also invests in investment companies that are reported at net asset value. Investments reported at net asset value are excluded from the fair value hierarchy. The following table reconciles investments reported in fair value hierarchy to investments reported on the statement of financial position as of August 31, 2019 and 2018: 2019 2018
Total investments in the fair value hierarchy $ 72,413,071 $ 53,961,603 Cash equivalents 1,402,132 1,315,423 Investment in investment companies 937,063 420,326
Total investments at fair value $ 74,752,266 $ 55,697,352
Investments in investment companies consisting of off‐shore investments are subject to the following redemption frequency and capital commitment at August 31, 2019:
Investment Strategy
Redemption Frequency Remaining Capital
Commitment
Off‐shore investments Monthly, quarterly, or semi‐annually $ 576,220 Off‐shore investments Monthly, quarterly, or semi‐annually 632,226 Off‐shore investments Monthly, quarterly, or semi‐annually 905,237 Off‐shore investments Monthly, quarterly, or semi‐annually 1,000,000
Investments in investment companies consisting of off‐shore investments are subject to the following redemption frequency and capital commitment at August 31, 2018:
Investment Strategy
Redemption Frequency Remaining Capital
Commitment
Off‐shore investments Monthly, quarterly, or semi‐annually $ 757,170 Off‐shore investments Monthly, quarterly, or semi‐annually 837,618 Off‐shore investments Monthly, quarterly, or semi‐annually 984,992
No redemption restrictions or redemption notice period noted.
95
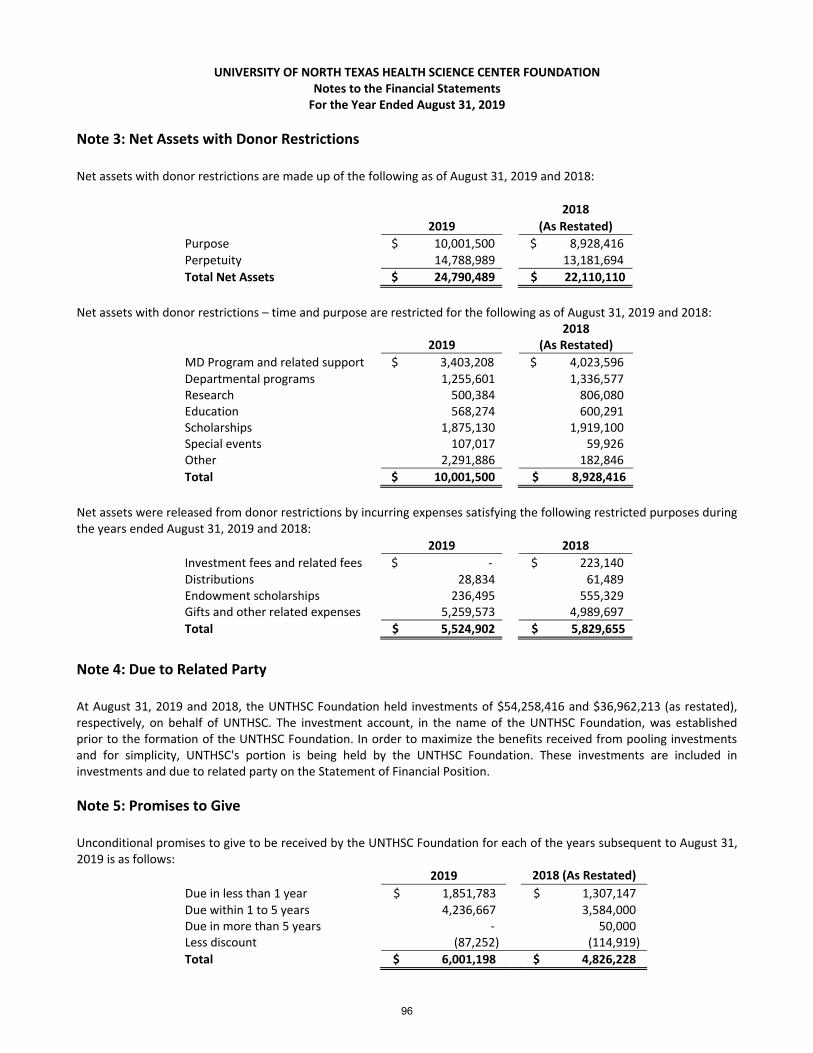
UNIVERSITY OF NORTH TEXAS HEALTH SCIENCE CENTER FOUNDATION
Notes to the Financial Statements For the Year Ended August 31, 2019
Note 3: Net Assets with Donor Restrictions Net assets with donor restrictions are made up of the following as of August 31, 2019 and 2018:
2018 2019 (As Restated)
Purpose $ 10,001,500 $ 8,928,416 Perpetuity 14,788,989 13,181,694
Total Net Assets $ 24,790,489 $ 22,110,110
Net assets with donor restrictions – time and purpose are restricted for the following as of August 31, 2019 and 2018:
2019
2018 (As Restated)
MD Program and related support $ 3,403,208 $ 4,023,596 Departmental programs 1,255,601 1,336,577 Research 500,384 806,080 Education 568,274 600,291 Scholarships 1,875,130 1,919,100 Special events 107,017 59,926 Other 2,291,886 182,846
Total $ 10,001,500 $ 8,928,416
Net assets were released from donor restrictions by incurring expenses satisfying the following restricted purposes during the years ended August 31, 2019 and 2018:
2019 2018
Investment fees and related fees $ ‐ $ 223,140 Distributions 28,834 61,489 Endowment scholarships 236,495 555,329 Gifts and other related expenses 5,259,573 4,989,697
Total $ 5,524,902 $ 5,829,655
Note 4: Due to Related Party At August 31, 2019 and 2018, the UNTHSC Foundation held investments of $54,258,416 and $36,962,213 (as restated), respectively, on behalf of UNTHSC. The investment account, in the name of the UNTHSC Foundation, was established prior to the formation of the UNTHSC Foundation. In order to maximize the benefits received from pooling investments and for simplicity, UNTHSC's portion is being held by the UNTHSC Foundation. These investments are included in investments and due to related party on the Statement of Financial Position.
Note 5: Promises to Give Unconditional promises to give to be received by the UNTHSC Foundation for each of the years subsequent to August 31, 2019 is as follows:
2019 2018 (As Restated)
Due in less than 1 year $ 1,851,783 $ 1,307,147 Due within 1 to 5 years 4,236,667 3,584,000 Due in more than 5 years ‐ 50,000 Less discount (87,252) (114,919)
Total $ 6,001,198 $ 4,826,228
96

UNIVERSITY OF NORTH TEXAS HEALTH SCIENCE CENTER FOUNDATION
Notes to the Financial Statements For the Year Ended August 31, 2019
Unconditional promises to give that are expected to be collected after one year are discounted and are reported net of the discount in pledges receivable on the statement of financial position. Amortization of the discount on long‐term pledges receivable is included with contributions revenue in the statement of activities. Pledges receivable are also reported net of any anticipated losses due to uncollectible accounts. The UNTHSC Foundation’s policy for determining when pledges receivable are past due or delinquent is when all efforts to collect a pledged amount have been exhausted. An allowance for doubtful accounts is estimated by management based on information received by pledged donors and pledge receivable aging schedules. No allowance was considered necessary as of August 31, 2019 and 2018. As of August 31, 2019, conditional promises to give to be received by the UNTHSC Foundation are $2,500,000, which are due within 1 to 5 years. The conditional promises to give have not met the criteria for recognition in the financial statements as established by GAAP.
Note 6: Pledges Payable During the year ended August 31, 2017, the UNTHSC Foundation pledged $200,000 to a not‐for‐profit organization. Payments are due at annual payment intervals. As of August 31, 2018, $75,000 was still outstanding and is shown as pledge payable on the statement of financial position. Payment of the remaining amount due of $75,000 was paid in November 2018.
Note 7: Uniform Prudent Management of Institutional Funds Act Net assets with donor restrictions held in perpetuity were $14,788,989 and $13,181,694 as of August 31, 2019 and 2018, respectively. The UNTHSC Foundation's endowment funds consist of equity securities, cash and cash equivalents and investments in investment companies. These funds consist of contributions made to establish an endowment, the earnings from which are to be used to support different restricted purposes. As required by accounting principles generally accepted in the United States of America, net assets associated with endowment funds are classified and reported based upon the existence or absence of donor‐imposed restrictions. The investment policy is issued by the Board of the UNTHSC Foundation. It articulates the principles by which the UNTHSC Foundation governs the management of its investment assets. The Board is responsible for adopting investment objectives and policies, hiring and evaluating investment managers, establishing a controlled environment, and monitoring policy implementation and investment performance. The Board exercises its responsibility according to applicable fiduciary standards and in the exclusive interest of the UNTHSC Foundation. A reconciliation of the endowment funds’ beginning and ending balances for the years ended August 31, 2019 and 2018 is as follows. There was no cumulative effect of any amounts by which permanently restricted funds have been reduced, or increased that were not specified by the donor, or in the absence of a donor stipulation, approved by the Board.
Endowment Net Assets with
Donor Restrictions ‐Purpose
Endowment Net Assets with
Donor Restrictions Held in Perpetuity
Total Endowment Net Assets
Endowment net assets, September 1, 2018 (as restated) $ 2,409,702 $ 13,181,694 $ 15,591,396
Interest and dividends ‐ ‐ ‐
Net appreciation (realized and unrealized) 366,391 ‐ 366,391
$ 2,776,093 $ 13,181,694 $ 15,957,787
Contributions 26,341 1,607,295 1,633,636
Appropriation of endowment assets for expenditure (152,745) ‐ (152,745)
Endowment net assets, August 31, 2019 $ 2,649,689 $ 14,788,989 $ 17,438,678
97

UNIVERSITY OF NORTH TEXAS HEALTH SCIENCE CENTER FOUNDATION
Notes to the Financial Statements For the Year Ended August 31, 2019
Endowment Net Assets with
Donor Restrictions ‐Purpose
Endowment Net Assets with
Donor Restrictions Held in Perpetuity
Total Endowment Net Assets
Endowment net assets, September 1, 2017 (as restated) $ 2,568,172 $ 8,793,844 $ 11,362,016
Interest and dividends ‐ ‐ ‐
Net appreciation (realized and unrealized) 1,026,458 ‐ 1,026,458
$ 3,594,630 $ 8,793,844 $ 12,388,474
Contributions 62,455 4,387,850 4,450,305
Appropriation of endowment assets for expenditure (1,247,383) ‐ (1,247,383)
Endowment net assets, August 31, 2018 (as restated) $ 2,409,702 $ 13,181,694 $ 15,591,396
Endowment net asset composition by type of fund as of August 31, 2019 was as follows:
Endowment Net Assets with Donor
Restrictions Purpose
Endowment Net Assets with Donor Restrictions Held in Perpetuity
Total Endowment Net Assets
Donor‐restricted $ 2,649,689 $ 14,788,989 $ 17,438,678
Total funds $ 2,649,689 $ 14,788,989 $ 17,438,678
Endowment net asset composition by type of fund as of August 31, 2018 was as follows:
Net Assets with Donor Restrictions
Purpose
Net Assets with Donor Restrictions Held in Perpetuity
Total Endowment Net Assets
Donor‐restricted $ 2,409,702 $ 13,181,694 $ 15,591,396
Total funds $ 2,409,702 $ 13,181,694 $ 15,591,396
Investment Objectives The UNTHSC Foundation assets are to be invested in a balanced portfolio composed of equity, fixed‐income and cash equivalent securities. As such, it is intended to be more aggressive than fixed‐income‐oriented portfolios and less aggressive than equity‐only‐oriented portfolios. In this context, "aggressive" relates to such issues as expected long‐term rates of return and return volatility, investment vehicles, diversification among economic and industry sectors and individual securities. Within this framework, the principal investment objectives are stated below. These objectives recognize the nature of the UNTHSC Foundation, its purpose and its beneficiaries. The basic investment objective is long‐term growth of capital and preservation of capital. In pursuing the investment objective, the UNTHSC Foundation endeavors, over time, to outperform the investment return objectives. Returns must be sufficient to meet or exceed the minimum required investment rate of return for the UNTHSC Foundation as established in the spending policy plus fee of 1% of the invested accounts for services in direct connection to the UNTHSC Foundation. Returns must meet or exceed the inflation rate plus 2%, meet or exceed the rate of return of a balanced market index, and meet or exceed the Sharpe Ratio of the market index while limiting portfolio risk.
Investment Philosophy The primary investment objective of the UNTHSC Foundation is long‐term growth of capital. It is recognized that short‐term fluctuations in the capital markets may result in the loss of capital on occasion (i.e., negative rates of return). However, the total asset value of the UNTHSC Foundation, exclusive of contributions or withdrawals, should grow in the long‐run. It should earn, through a combination of investment income and capital appreciation, a rate of return in excess
98

UNIVERSITY OF NORTH TEXAS HEALTH SCIENCE CENTER FOUNDATION
Notes to the Financial Statements For the Year Ended August 31, 2019
of a balanced market index while incurring less risk than such index. The long‐term growth of capital should also be greater than the spending policy plus the fee for services in direct connection to the UNTHSC Foundation. The Board and/or the Investment Committee intends to maximize the portfolio's total return comprising income and net realized and unrealized gains and losses. This objective is to be accomplished by assuming a prudent level of risk in the investment of the UNTHSC Foundation assets. The UNTHSC Foundation will engage well‐qualified investment managers registered under the Investment Advisors Act of 1940. The investment manager will perform duties with the care, skill, prudence and diligence under the prevailing circumstance that a prudent expert acting in a like capacity and familiar with such matter would use in the conduct of an enterprise of a like character and of like aims.
Underwater Endowments From time to time, the fair value of assets associated with individual donor‐restricted endowment funds may fall below the level that the donor or the Uniform Prudent Management of Institutional Funds Act (UPMIFA) requires the UNTHSC Foundation to retain as a fund of perpetual duration. Deficiencies of this nature exist in 6 endowment funds with donor restrictions, which together have an original gift value of $1,173,673, a current fair value of $1,144,778, and a deficiency of $28,895 as of August 31, 2019. Deficiencies of this nature exist in 5 endowment funds with donor restrictions, which together have an original gift value of $169,673, a current fair value of $146,833, and a deficiency of $22,840 as of August 31, 2018. These deficiencies resulted from unfavorable market fluctuations that occurred shortly after the investment of new contributions for donor‐restricted endowment funds and continued appropriation for certain programs that was deemed prudent by the Board of Trustees. The UNTHSC Foundation has a policy that permits spending from underwater endowment funds depending on the degree to which the fund is underwater, unless otherwise precluded by donor intent or relevant laws and regulations. Note 8: Liquidity As a not‐for‐profit entity, UNTHSC Foundation receives significant funding in the form of contributions each year from donors, which are restricted to be used in a particular manner. UNTHSC Foundation must maintain sufficient resources to meet those responsibilities to its donors. Thus, financial assets may not be available for general expenditure within one year. As part of managing the financial assets, UNTHSC Foundation ensures these become available when obligations come due. The following reflects UNTHSC Foundation’s financial assets as of the balance sheet date, including amounts not available within one year of the balance sheet date. Amounts not available include donor‐imposed restricted contributions.
Cash $ 1,305,137 Investments 20,493,850 Pledges receivable 6,001,198
Total financial assets $ 27,800,185 Less donor restrictions Net assets with donor restrictions time and purpose $ (10,001,500) Net assets with donor restrictions – held in perpetuity (14,788,989)
Total financial assets not available to be used within one year $ (24,790,489)
Total financial assets available to meet general expenditures within one year $ 3,009,696
99

UNIVERSITY OF NORTH TEXAS HEALTH SCIENCE CENTER FOUNDATION
Notes to the Financial Statements For the Year Ended August 31, 2019
Note 9: Prior Period Restatement During the year ended August 31, 2019, the UNTHSC Foundation reassessed accounting principles generally accepted in the United States related to unconditional promises to give. As a result of this review, the UNTHSC Foundation determined that $500,000 of a $2,500,000 promise to give was not recorded as revenue when received in year ended August 31, 2016. Additionally, as a result of this review, the UNTHSC Foundation determined that $543,504 of investments held on behalf of a related party were not recorded as a liability as of August 31, 2018. In addition, $473,771 was recorded as contributions and investment income in the statement of activities when the amounts should have been recorded as changes in due to related party as of August 31, 2018. The accompanying financial statements as of and for the year ended August 31, 2018 have been restated to reflect the above corrections. The effect on the UNTHSC Foundation 2018 financial statements are summarized as follows:
As Previously Reported
Due to Related Party Adjustment
Contributions Receivable Adjustment
Restated
Statement of financial position
Pledges receivable $ 4,326,228 $ ‐ $ 500,000 $ 4,826,228
Total assets 61,160,598 ‐ 500,000 61,660,598
Due to related party (36,418,709) (543,504) ‐ (36,962,213)
Total liabilities (36,493,709) (543,504) ‐ (37,037,213)
Temporarily restricted net assets 8,537,895 (109,479) 500,000 8,928,416
Permanently restricted net assets 13,615,719 (434,025) ‐ 13,181,694
Total net assets 24,666,889 (543,504) 500,000 24,623,385
Statement of activities
Contributions $ 10,599,195 $ (453,037) $ ‐ $ 10,146,158
Investment income 45,531 (20,734) ‐ 24,797
Total support and revenue 12,686,635 (473,771) ‐ 12,212,864
Change in net assets 6,898,610 (473,771) ‐ 6,424,839
Temporarily restricted net assets, beginning of year 6,614,739 (2,744) 500,000 7,111,995
Temporarily restricted net assets, end of year 8,537,895 (109,479) 500,000 8,928,416
Permanently restricted net assets, beginning of year 8,860,833 (66,989) ‐ 8,793,844
Permanently restricted net assets, end of year 13,615,719 (434,025) ‐ 13,181,694
Net assets, beginning of year 17,768,279 (69,733) 500,000 18,198,546
Net assets, end of year 24,666,889 (543,504) 500,000 24,623,385
Statement of cash flows
Change in net assets $ 10,599,195 $ (453,037) $ ‐ $ 10,146,158
Changes in operating assets and liabilities Due to related party
3,418,404 453,037 ‐ 3,871,441
100

UNIVERSITY OF NORTH TEXAS HEALTH SCIENCE CENTER FOUNDATION
Notes to the Financial Statements For the Year Ended August 31, 2019
Upon implementation of ASU 2016‐14, net assets classifications went from three classes (unrestricted, temporarily restricted, and permanently restricted) to two classes (net assets without donor restrictions and net assets with donor restrictions), and direct investment expenses are now required to be shown with investment return. The effect on the UNTHSC Foundation 2018 financial statements, upon implementation of ASU 2016‐14, are summarized as follows:
As Previously Reported
Due to Related Party Adjustment
Contributions Receivable Adjustment
Restated
Statement of financial position
Pledges receivable $ 4,326,228 $ ‐ $ 500,000 $ 4,826,228
Total assets 61,160,598 ‐ 500,000 61,660,598
Due to related party (36,418,709) (543,504) ‐ (36,962,213)
Total liabilities (36,493,709) (543,504) ‐ (37,037,213)
Net assets with donor restrictions 22,153,614 (543,504) 500,000 22,110,110
Total net assets 24,666,889 (543,504) 500,000 24,623,385
Statement of activities
Contributions $ 10,599,195 $ (453,037) $ ‐ $ 10,146,158
Investment income 45,531 (20,734) ‐ 24,797
Total support and revenue 12,686,635 (473,771) ‐ 12,212,864
Change in net assets 6,898,610 (473,771) ‐ 6,424,839
Net assets with donor restrictions, beginning of year 15,475,572 (69,733) 500,000 15,905,839
Net assets with donor restrictions, end of year 22,153,614 (543,504) 500,000 22,110,110
Net assets, beginning of year 17,768,279 (69,733) 500,000 18,198,546
Net assets, end of year 24,666,889 (543,504) 500,000 24,623,385
Statement of cash flows
Change in net assets $ 10,599,195 $ (453,037) $ ‐ $ 10,146,158
Changes in operating assets and liabilities Due to related party
3,418,404 453,037 ‐ 3,871,441
101