
AP Biology Eukaryotic Genome Control Mechanisms for Gene expression.

Comprehensive and quantitative mapping ofRNA–protein interactions across a transcribedeukaryotic genomeRichard Shea,1, Anupam K. Chakravartya,1, Curtis J. Laytonb,1, Lauren M. Chircusa,b, Johan O. L. Andreassonb,c,Nandita Damarajub, Peter L. McMahonb,d, Jason D. Buenrostrob, Daniel F. Jarosza,e,2, and William J. Greenleafb,d,2
aDepartment of Chemical and Systems Biology, Stanford University School of Medicine, Stanford, CA 94305; bDepartment of Genetics, Stanford UniversitySchool of Medicine, Stanford, CA 94305; cDepartment of Biochemistry, Stanford University School of Medicine, Stanford, CA 94305; dDepartment ofApplied Physics, Stanford University, Stanford, CA 94305; and eDepartment of Developmental Biology, Stanford University, Stanford, CA 94305
Edited by Roy Parker, University of Colorado Boulder, Boulder, CO, and approved February 24, 2017 (received for review November 10, 2016)
RNA-binding proteins (RBPs) control the fate of nearly everytranscript in a cell. However, no existing approach for studyingthese posttranscriptional gene regulators combines transcriptome-wide throughput and biophysical precision. Here, we describe anassay that accomplishes this. Using commonly available hardware,we built a customizable, open-source platform that leverages theinherent throughput of Illumina technology for direct biophysicalmeasurements. We used the platform to quantitatively measurethe binding affinity of the prototypical RBP Vts1 for everytranscript in the Saccharomyces cerevisiae genome. The scale andprecision of these measurements revealed many previously un-known features of this well-studied RBP. Our transcribed genomearray (TGA) assayed both rare and abundant transcripts with equiv-alent proficiency, revealing hundreds of low-abundance targetsmissed by previous approaches. These targets regulated diversebiological processes including nutrient sensing and the DNA dam-age response, and implicated Vts1 in de novo gene “birth.” TGAprovided single-nucleotide resolution for each binding site and de-lineated a highly specific sequence and structure motif for Vts1binding. Changes in transcript levels in vts1Δ cells established theregulatory function of these binding sites. The impact of Vts1 ontranscript abundance was largely independent of where it boundwithin an mRNA, challenging prevailing assumptions about howthis RBP drives RNA degradation. TGA thus enables a quantitativedescription of the relationship between variant RNA structures, af-finity, and in vivo phenotype on a transcriptome-wide scale. Weanticipate that TGA will provide similarly comprehensive and quan-titative insights into the function of virtually any RBP.
RNA | next-generation sequencing | systems biochemistry |RNA binding proteins | Vts1
RNA-binding proteins (RBPs) constitute 5–10% of theeukaryotic proteome (1–3) and collectively govern the lo-
calization, translation, and decay of virtually every transcript (4–6).Despite the ubiquity of RBPs and their central importance ingene regulation, decoding the links between RNA primary se-quence and its cadre of regulators remains a major unresolvedchallenge (7). Current approaches for characterizing RBPfunction generally involve trade-offs between throughput, com-prehensiveness, and quantitative precision. Biophysical measure-ments can be made with targeted biochemical approaches such aselectrophoretic mobility shift assays (EMSAs) or fluorescencepolarization (FP) (8, 9), but these methods can only interrogateknown RNA–protein interactions and are inherently low-throughput. Selection-based approaches [e.g., in vitro selection,high-throughput sequencing of RNA, and sequence-specificitylandscapes (SEQRS)/RNA bind-n-seq (RBNS)] achieve higherthroughput, but these techniques remove binding sites from theirnatural sequence context and identify “winners” based on morethan simple affinity (10). Transcriptome-wide methods, which oftenuse cross-linking and immunoprecipitation [e.g., photoactivatable
ribonucleoside-enhanced cross-linking and immunoprecipitation(PAR-CLIP), high-throughput sequencing of RNA isolated bycross-linking and immunoprecipitation (HiTS-CLIP), RNA im-munoprecipitation (RIP-chip/seq), individual-nucleotide resolu-tion cross-linking and immunoprecipitation (iCLIP), RNAtagging, targets of RNA-binding proteins identified by editing(TRIBE)] (11–16), have yielded many insights. However, they donot generally provide quantitative information about relativeaffinity and often suffer from additional drawbacks. First, theygenerally require high-quality, specific antibodies and are thusnot scalable to many proteins of interest. Second, binding targetsmust be appreciably expressed in an individual cell type andcondition to be observed. Third, with notable exceptions (e.g.,iCLIP), the sequence resolution of these techniques typicallyprecludes nucleotide-level resolution of binding motifs. Finally,differences in cross-linking efficiency and transcript abundance,both of which can vary over many orders of magnitude, are sig-nificant sources of bias in transcriptome-wide approaches (17–19).We overcame these biases with an approach that, for rare and
abundant substrates alike, combines the genome-wide scale of
Significance
High-throughput sequencing has transformed modern biology,but its repertoire is currently confined to reading DNA mole-cules. Here, we report hardware and software adaptations thatallow the very methods that enabled the genomic sequencingrevolution to be applied to fluorescence-based biochemical as-says, on a massive scale. We demonstrate the unique value ofthis approach by finding previously unknown features of anancient developmental regulator, Vts1 (Smaug in metazoans),despite its extensive study with previously available techniques.Our work couples transcriptome-wide measurements of bindingaffinity, sequence, and structural determinants of binding, andphenotypic outcomes to provide a comprehensive portrait ofVts1 function. Our technology is easily extensible to other RNA-binding proteins involved in disease and development, and fa-cilitates diverse applications in systems biochemistry.
Author contributions: R.S., A.K.C., C.J.L., L.M.C., D.F.J., and W.J.G. designed research; R.S.and A.K.C. performed research; R.S., C.J.L., J.O.L.A., N.D., P.L.M., J.D.B., and W.J.G. con-tributed new reagents/analytic tools; R.S. analyzed data; R.S., A.K.C., D.F.J., and W.J.G.wrote the paper; and D.F.J. and W.J.G. supervised all aspects of the work.
The authors declare no conflict of interest.
This article is a PNAS Direct Submission.
Data deposition: The sequence reported in this paper has been deposited in the GeneExpression Omnibus (GEO) database, www.ncbi.nlm.nih.gov/geo (accession no. GSE95851).1R.S., A.K.C., and C.J.L. contributed equally to this work.2To whom correspondence may be addressed. Email: [email protected] or [email protected].
This article contains supporting information online at www.pnas.org/lookup/suppl/doi:10.1073/pnas.1618370114/-/DCSupplemental.
www.pnas.org/cgi/doi/10.1073/pnas.1618370114 PNAS | April 4, 2017 | vol. 114 | no. 14 | 3619–3624
BIOCH
EMISTR
Y
Dow
nloa
ded
by g
uest
on
Feb
ruar
y 10
, 202
2

cross-linking methods with the quantitative precision of targetedbiochemical experiments. We applied our method to character-ize the interactions of the conserved RNA binding domain of asequence- and structure-specific RBP (Vts1 in Saccharomycescerevisiae; Smaug in metazoans). We chose to study Vts1 becauseof its biological significance as a key regulator of RNA stability indevelopment (20) and because decades of prior study provided agold standard against which to benchmark our results (21–27).
ResultsAn Open-Source Platform for Systems Biochemistry. Our approachdirectly harnessed the throughput of Illumina sequencing, using theMiSeq sequencing flow cell itself as a platform for high-throughputbiochemistry. Although the flow cell provides an ideal substrate formassively parallel experiments, current Illumina instruments are notamenable to customization (28, 29). Previous methods such as RNAon a massively parallel array (RNA-MaP) and high-throughputsequencing–RNA affinity profiling (HiTS-RAP) overcame this is-sue by operating on the now antiquated Genome Analyzer II. Here,we built our own hardware platform that enables custom bio-chemical experiments to be performed on modern sequencingchips. We developed a high-throughput imaging station, combininghardware components from an Illumina Genome Analyzer II withoptimized optics, fluidics, and temperature control systems (Fig.1A). We integrated these hardware components into a fully pro-grammable interface (Fig. S1A), creating a modular design thatprovides a blueprint for future applications to interrogate otherclasses of biophysical interactions. To enable transfer of the tech-nology to other laboratories, we integrated our imaging platformwith sequencing flow cells produced by a benchtop sequencer
(MiSeq), using cross-correlation methods to identify the physicallocation of each sequenced cluster with submicron accuracy (Fig. S1B–F). This exquisite spatial resolution allowed us to link imagesgenerated on our imaging station to specific nucleotide sequencesobtained on a commercial sequencer, decoupling the instrumentused for sequencing from that used to carry out custom bio-chemistry applications. Our imaging station thus provides an openplatform for systems biochemistry that we expect will encouragefurther methodological development.We next densely populated a MiSeq flow cell with an S. cerevisiae
genomic DNA library. During library construction, we incorporatedan Escherichia coliRNA polymerase (RNAP) promoter and RNAPstall sequence. We then transcribed each DNA molecule into atethered RNA transcript (Fig. 1A, Figs. S2 and S3A (29, 30), andMaterials and Methods). This transcribed genome array (TGA)displays the entire potential RNA sequence space of S. cerevisiae ina highly redundant and unbiased manner; each nucleotide is rep-resented at a mean coverage of >30× in overlapping transcripts of∼100–300 nt (Fig. 1B and Fig. S3B). Moreover, the enzymaticallytranscribed fragments can adopt physiologically relevant folds thatare dependent on local sequence context (see below).
A Multitude of Additional Binding Targets. We used this platformand a workflow that spanned just 36 h to make >107 measure-ments of binding for Vts1 across a ∼100-fold concentrationgradient (Fig. 1 C–E). Using these measurements, we identified325 RNAs that reproducibly bound Vts1 at physiological proteinconcentrations (∼130 nM) (31) across the many redundantclusters on the TGA. These apparent affinities were comparableto known Vts1 target elements that we doped into our library
Fig. 1. A quantitative method for rapid, unbiasedmeasurements of RBP affinity and kinetics across 107
substrates. (A) Workflow for TGA. On the MiSeq, adense array of clonal clusters is produced as part ofthe standard sequencing by synthesis workflow(Top). Then, after moving the flow cell to a customimaging station, clusters serve as a template for insitu generation of RNA (Bottom), enabling quanti-tative measurement and analysis of 107 binding ex-periments in less than 36 h. (B) Genome browsertrack showing unique overlapping and strand-specific Vts1 binding sequences covering eachVts1 binding site (Top) and all candidate RNA se-quences generated by the TGA (Bottom) for a low-and high-abundance transcript. (C) Raw images offluorescently labeled Vts1 bound to a weak affinity(TOR2, in blue) vs. a strong affinity (SRE3, in red)substrate. The first image in each series shows theRNA clusters, and subsequent images show Vts1binding at increasing concentrations. (D) Quantifica-tion of single-cluster image series from C. All reportedvalues are median apparent Kd estimates averagedacross multiple independent binding curves (nSRE3 =156; nTOR2 = 14; see SI Materials and Methods forfurther discussion). (E) Distribution of affinity mea-surements across independent clusters for a strong(SRE3)- and weak-affinity (TOR2) target (kernel den-sity estimate). (F) Comparison of bulk solution affinitymeasurements and TGA-derived measurements [lin-ear fit, slope = 1, 95% confidence interval (CI)].
3620 | www.pnas.org/cgi/doi/10.1073/pnas.1618370114 She et al.
Dow
nloa
ded
by g
uest
on
Feb
ruar
y 10
, 202
2
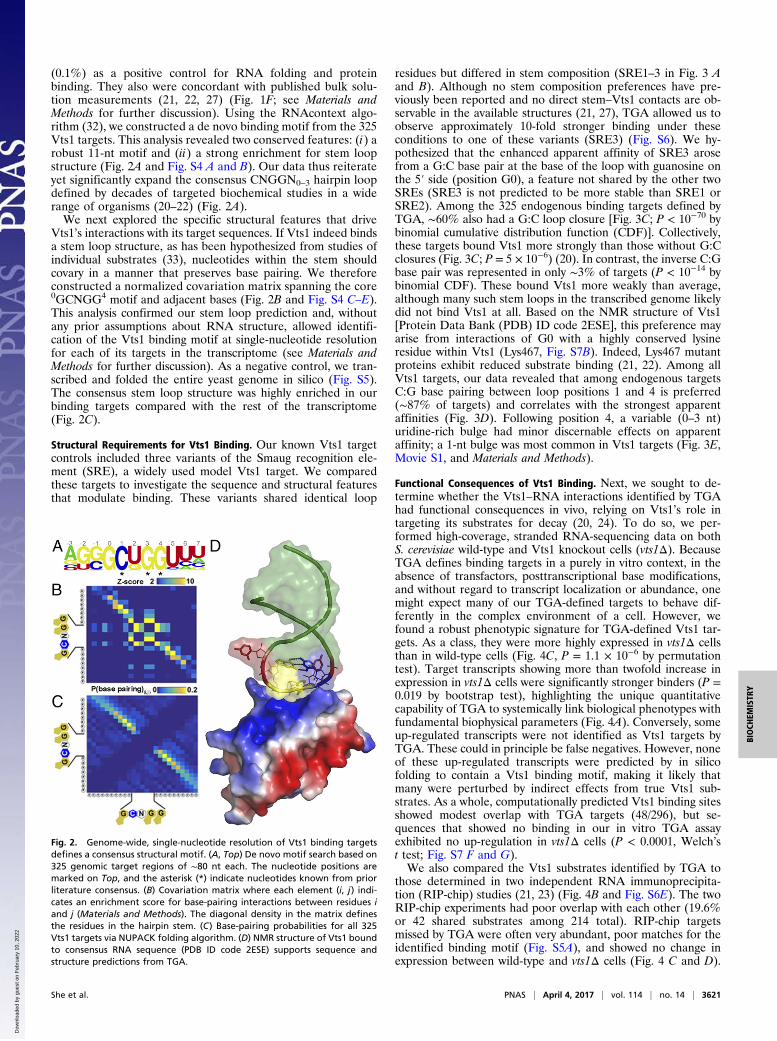
(0.1%) as a positive control for RNA folding and proteinbinding. They also were concordant with published bulk solu-tion measurements (21, 22, 27) (Fig. 1F; see Materials andMethods for further discussion). Using the RNAcontext algo-rithm (32), we constructed a de novo binding motif from the 325Vts1 targets. This analysis revealed two conserved features: (i) arobust 11-nt motif and (ii) a strong enrichment for stem loopstructure (Fig. 2A and Fig. S4 A and B). Our data thus reiterateyet significantly expand the consensus CNGGN0–3 hairpin loopdefined by decades of targeted biochemical studies in a widerange of organisms (20–22) (Fig. 2A).We next explored the specific structural features that drive
Vts1’s interactions with its target sequences. If Vts1 indeed bindsa stem loop structure, as has been hypothesized from studies ofindividual substrates (33), nucleotides within the stem shouldcovary in a manner that preserves base pairing. We thereforeconstructed a normalized covariation matrix spanning the core0GCNGG4 motif and adjacent bases (Fig. 2B and Fig. S4 C–E).This analysis confirmed our stem loop prediction and, withoutany prior assumptions about RNA structure, allowed identifi-cation of the Vts1 binding motif at single-nucleotide resolutionfor each of its targets in the transcriptome (see Materials andMethods for further discussion). As a negative control, we tran-scribed and folded the entire yeast genome in silico (Fig. S5).The consensus stem loop structure was highly enriched in ourbinding targets compared with the rest of the transcriptome(Fig. 2C).
Structural Requirements for Vts1 Binding. Our known Vts1 targetcontrols included three variants of the Smaug recognition ele-ment (SRE), a widely used model Vts1 target. We comparedthese targets to investigate the sequence and structural featuresthat modulate binding. These variants shared identical loop
residues but differed in stem composition (SRE1–3 in Fig. 3 Aand B). Although no stem composition preferences have pre-viously been reported and no direct stem–Vts1 contacts are ob-servable in the available structures (21, 27), TGA allowed us toobserve approximately 10-fold stronger binding under theseconditions to one of these variants (SRE3) (Fig. S6). We hy-pothesized that the enhanced apparent affinity of SRE3 arosefrom a G:C base pair at the base of the loop with guanosine onthe 5′ side (position G0), a feature not shared by the other twoSREs (SRE3 is not predicted to be more stable than SRE1 orSRE2). Among the 325 endogenous binding targets defined byTGA, ∼60% also had a G:C loop closure [Fig. 3C; P < 10−70 bybinomial cumulative distribution function (CDF)]. Collectively,these targets bound Vts1 more strongly than those without G:Cclosures (Fig. 3C; P = 5 × 10⁻⁶) (20). In contrast, the inverse C:Gbase pair was represented in only ∼3% of targets (P < 10−14 bybinomial CDF). These bound Vts1 more weakly than average,although many such stem loops in the transcribed genome likelydid not bind Vts1 at all. Based on the NMR structure of Vts1[Protein Data Bank (PDB) ID code 2ESE], this preference mayarise from interactions of G0 with a highly conserved lysineresidue within Vts1 (Lys467, Fig. S7B). Indeed, Lys467 mutantproteins exhibit reduced substrate binding (21, 22). Among allVts1 targets, our data revealed that among endogenous targetsC:G base pairing between loop positions 1 and 4 is preferred(∼87% of targets) and correlates with the strongest apparentaffinities (Fig. 3D). Following position 4, a variable (0–3 nt)uridine-rich bulge had minor discernable effects on apparentaffinity; a 1-nt bulge was most common in Vts1 targets (Fig. 3E,Movie S1, and Materials and Methods).
Functional Consequences of Vts1 Binding. Next, we sought to de-termine whether the Vts1–RNA interactions identified by TGAhad functional consequences in vivo, relying on Vts1’s role intargeting its substrates for decay (20, 24). To do so, we per-formed high-coverage, stranded RNA-sequencing data on bothS. cerevisiae wild-type and Vts1 knockout cells (vts1Δ). BecauseTGA defines binding targets in a purely in vitro context, in theabsence of transfactors, posttranscriptional base modifications,and without regard to transcript localization or abundance, onemight expect many of our TGA-defined targets to behave dif-ferently in the complex environment of a cell. However, wefound a robust phenotypic signature for TGA-defined Vts1 tar-gets. As a class, they were more highly expressed in vts1Δ cellsthan in wild-type cells (Fig. 4C, P = 1.1 × 10⁻⁶ by permutationtest). Target transcripts showing more than twofold increase inexpression in vts1Δ cells were significantly stronger binders (P =0.019 by bootstrap test), highlighting the unique quantitativecapability of TGA to systemically link biological phenotypes withfundamental biophysical parameters (Fig. 4A). Conversely, someup-regulated transcripts were not identified as Vts1 targets byTGA. These could in principle be false negatives. However, noneof these up-regulated transcripts were predicted by in silicofolding to contain a Vts1 binding motif, making it likely thatmany were perturbed by indirect effects from true Vts1 sub-strates. As a whole, computationally predicted Vts1 binding sitesshowed modest overlap with TGA targets (48/296), but se-quences that showed no binding in our in vitro TGA assayexhibited no up-regulation in vts1Δ cells (P < 0.0001, Welch’st test; Fig. S7 F and G).We also compared the Vts1 substrates identified by TGA to
those determined in two independent RNA immunoprecipita-tion (RIP-chip) studies (21, 23) (Fig. 4B and Fig. S6E). The twoRIP-chip experiments had poor overlap with each other (19.6%or 42 shared substrates among 214 total). RIP-chip targetsmissed by TGA were often very abundant, poor matches for theidentified binding motif (Fig. S5A), and showed no change inexpression between wild-type and vts1Δ cells (Fig. 4 C and D).
Fig. 2. Genome-wide, single-nucleotide resolution of Vts1 binding targetsdefines a consensus structural motif. (A, Top) De novo motif search based on325 genomic target regions of ∼80 nt each. The nucleotide positions aremarked on Top, and the asterisk (*) indicate nucleotides known from priorliterature consensus. (B) Covariation matrix where each element (i, j) indi-cates an enrichment score for base-pairing interactions between residues iand j (Materials and Methods). The diagonal density in the matrix definesthe residues in the hairpin stem. (C) Base-pairing probabilities for all 325Vts1 targets via NUPACK folding algorithm. (D) NMR structure of Vts1 boundto consensus RNA sequence (PDB ID code 2ESE) supports sequence andstructure predictions from TGA.
She et al. PNAS | April 4, 2017 | vol. 114 | no. 14 | 3621
BIOCH
EMISTR
Y
Dow
nloa
ded
by g
uest
on
Feb
ruar
y 10
, 202
2

Because these targets exhibited no functional repression byVts1 in vivo, they could represent false positives inherent toimmunoprecipitation methods. Targets common to both TGAand RIP-chip exhibited a stronger degree of up-regulation thaneither method alone, highlighting a potential synergy betweencomplementary methods for studying RBP function (Fig. S7C).TGA analysis also identified 145 binding targets that prior
studies did not (325 vs. 180) (21, 23, 27). These targets includedmany key regulators of metabolism, cell cycle, and DNA repair(e.g., Tor2, Apc1, Polς) and they clustered into distinct func-tional subnetworks, for example, controlling nutrient sensing andthe DNA damage response (Fig. S8A). Because we identifiedthese binding events in the absence of additional RBPs and otherfactors inherent to the cellular environment, we examined theirfunctional relevance. Most of these transcripts bound Vts1strongly and harbored robust consensus motifs. Virtually all wereexpressed at low levels in standard growth conditions, high-lighting a distinct advantage of TGA’s equimolar presentation ofthe entire potential RNA landscape (Fig. 4D and Fig. S7D).Critically, these targets were expressed at higher levels in vts1Δcells (Fig. S7E), providing strong evidence that they were bonafide targets in vivo.We picked two TGA-specific targets to investigate in greater
depth in vivo. TGA identified the RNA encoding the nutrientsensing protein Tor2, but not its paralog Tor1, as a Vts1 target.The Vts1 binding site in TOR2 fell within a region that encodesan identical amino acid sequence in both paralogs. However,several synonymous mutations abolished the Vts1 binding site inTOR1 (Fig. 4E). Consequently, in vts1Δ cells, there was an in-crease in TOR2 expression, whereas TOR1 expression was un-changed (Fig. 4F). Because the TOR2 gene is essential, we used ator2 decreased abundance by mRNA perturbation (DAmP)partial loss-of-function allele to reduce its expression whilemaintaining cell viability (34). Cells harboring the tor2-DaMPallele were sensitive to the antifungal drug fluconazole, whereasthose harboring a vts1 deletion (vts1Δ) were resistant. If tor2-DaMP and vts1Δ acted via independent mechanisms, the com-bined double-mutant vts1Δ tor2-DaMP cells should display anintermediate phenotype. However, we observed a strong epi-static relationship between the two genes: vts1Δ tor2-DaMP cellsgrew very similarly to tor2-DaMP single mutant cells (Fig. 4G). Incontrast, mutants in vts1 and tor1 exhibited no epistasis (Fig. 4H).We next extended our analysis to Rev3, the catalytic subunit ofDNA Polς, a translesion polymerase responsible for most mu-tagenesis in eukaryotic cells and an emerging therapeutic target
for chemoresistant malignancies (35). As others have reported,the rev3Δ cells were sensitive to DNA-damaging agents (Fig. 4I).vts1Δ cells, in contrast, were more resistant than wild-type cells.The double-mutant vts1Δ rev3Δ cells phenocopied the rev3Δsingle mutant, demonstrating negative epistasis between the twogenes. These robust genetic interactions demonstrate the powerof TGA to reveal previously unknown regulatory relationshipsfor even an exceptionally well-studied RBP.
Vts1 and the Birth of New Genes. Nearly one-third of theVts1 targets we discovered fell in intergenic sequences. Wewondered whether any of these sites might represent functionalRBP targets. The S. cerevisiae genome encodes over 100,000transcribed nongenic sequences (protoORFs). Only a smallfraction of these sequences are detectably translated, but manyare transcribed at low or moderate levels; these “protoORFs”have been hypothesized to provide a fertile evolutionary testingground for the birth of new genes (36). Although previous RIP-chip experiments were incapable of detecting protoORF targetsfor various technical reasons, we asked whether TGA could.Indeed, the vast majority of intergenic TGA targets were con-tained in previously defined protoORFs (73%, P < 10−19, Pois-son CDF). We observed no binding to other classes of noncodingRNAs, such as tRNAs, small nucleolar RNAs, or rRNA. The fewremaining targets fell in sequences that rarely or potentiallynever exist as RNA within a cell. These sequences may illustratethe possibility for the Vts1 regulatory motif to arise purely throughdrift, in the absence of any selection on a functional transcript.Vts1 binding sites were even more strongly enriched among longer(>300 nt) protoORFs (P = 0.023, Poisson CDF), which some haveargued are more “evolutionarily developed” and are more likely tobe translated (36) (Fig. 4L).To determine whether Vts1 regulates protoORF targets in
living cells, we again examined our high-coverage, strandedRNA-sequencing data from vts1Δ and wild-type cells. Strikingly,Vts1-targeted protoORFs were as strongly regulated by Vts1 ascanonical ORFs, which is remarkable given their recent evolu-tionary origins (Fig. 4J; P = 0.036, bootstrap distribution). Weobtained similar results for a set of randomly selected proto-ORFs not detected in our RNA-seq experiment via quantitativeRT-PCR (qRT-PCR) (Fig. S8B). We propose that acquisition ofa Vts1 binding site allows a nascent gene to easily acquire a regu-lated expression profile downstream of the complex developmentalpathways that regulate Vts1/Smaug itself.
Fig. 3. Structural determinants of affinity and kinetics. (A) Cartoon representations of the canonical Smaug recognition elements (SREs) and SSA1 targetregion. (B) Median apparent Kd (Materials and Methods) of the canonical SREs reveal that the two elements derived from the nanos 3′-UTR are weakerbinders than the synthetic stem loop SRE3 and comparable to genomic target SSA1 (nSRE1 = 748; nSRE2 = 99; nSRE3 = 156; nSSA1 = 10, 95% CI). (C–E) Relationshipbetween binding affinity and various hairpin structures classified by loop closure bases (C), base identity in positions 1 and 4 of the loop (D), and U-rich bulgepresence and length (E) across all genomic targets identified by TGA.
3622 | www.pnas.org/cgi/doi/10.1073/pnas.1618370114 She et al.
Dow
nloa
ded
by g
uest
on
Feb
ruar
y 10
, 202
2

Acquisition and loss of Vts1 binding sites was not confined tonascent genes alone—among paralogs in the yeast genome, wefound 40 pairs of paralogs where only one of the two paralogscontains a Vts1 binding site. In all cases, the nonbinding paralogmutated critical elements of the core Vts1 binding motif. Wealso discovered three pairs of paralogs that contained Vts1binding sites in entirely different regions of the transcript. Thus,gain and loss of Vts1 binding sites over evolutionary time canprovide a route for diversifying gene duplications and rewiringregulatory networks.Finally, because TGA provides nucleotide-level resolution, we
investigated how the location of a Vts1 binding site within amessage influences transcript levels. In light of a large body ofliterature implicating Vts1 binding in transcript deadenylationvia recruitment of the CCR4-NOT1 complex to 3′-UTRs (24,37), it is striking that only seven 3′-UTR binding sites occur
across the entire transcribed genome array. Indeed, Vts1 bindingsites were strongly enriched in 5′-UTRs but not in 3′-UTRs (P =0.0067, P = 0.31, Poisson CDF; Fig. 4L). The enrichment in5′-UTRs could point to the importance of Vts1 in the regula-tion of translation initiation (25). However, our genome-wide,nucleotide-resolved dataset established that the impact ofVts1 on transcript abundance is largely independent of where itbinds within an mRNA (Fig. 4K). We conclude that Vts1 bindingoutside of the 3′-UTR may be the predominant mode by whichthis RBP regulates gene expression.
DiscussionTGA combines the best features of many separate methods forstudying RNA–RBP interactions and complements many of theirindividual weaknesses (Table 1) (10). Like RIP- and CLIP-seq, itidentifies a transcriptome-wide compendium of functional binding
Fig. 4. TGA reveals evidence of positive selectionand enrichment in protogenes. (A) Targets withmore than twofold increase in expression upon vts1deletion (purple; smoothed density estimation, n =20) have generally lower apparent Kd comparedwith all Vts1 targets identified by TGA (gray). (B andC) TGA targets (blue, nonintergenic, n = 205) areenriched vts1Δ cells compared with wild-type cells.RIP-chip targets not detected in TGA [red, n = 108,Hogan et al. (23); green, n = 43, Aviv et al. (21)] donot show enhanced expression in vts1Δ cells. They axis in C is in log2 scale. (D) RNA abundance forTGA targets vs. RIP-chip targets. (E) Vts1 binding siteis present in tor2 but not in its homolog tor1. (F) tor2is more highly expressed in vts1Δ vs. wild type. tor1is not (two biological replicates each; SEM). (G and H)tor2 exhibits strong negative epistasis with vts1. tor1does not (4–16 technical replicates; SEM; dotted linerepresents no epistasis expectation; Materials andMethods). (I) rev3 shows negative epistasis with vts1under DNA damage conditions. (J) RNA-seq expres-sion for protoORF targets. (K) Metagene showing thedistribution of Vts1 binding targets by position inORF. Position in ORF is not correlated to up-regulationin vts1Δ cells. (L) Enrichment analysis based onequimolar representation of all genomic sequences.Vts1 targets are enriched in 5′-UTRs and but not in3′-UTRs. Vts1 targets are also highly enriched on thetemplate strand compared with the nontemplatestrand (P < 10−16, binomial CDF).
Table 1. Summary characteristics for various methods of studying RNA–protein interactions [adapted from Campbelland Wickens (10)]
MethodDe novo motifID (length)
Measurement ofequilibrium Kd
Transcriptome-wideanalysis
Unbiased equimolartranscriptome In vivo context
TGA Yes (11) Direct Yes Yes NoHiTS-RAP Direct Direct No No NoCLIP-seq No No Yes No YesRIP-chip/seq Yes Indirect Yes No YesSEQRS Yes (3) Correlated No No NoRNA tagging Yes Indirect Yes No YesEMSA No Direct No No No
She et al. PNAS | April 4, 2017 | vol. 114 | no. 14 | 3623
BIOCH
EMISTR
Y
Dow
nloa
ded
by g
uest
on
Feb
ruar
y 10
, 202
2

targets. Like EMSA and FP, TGA can provide estimates ofbinding parameters for each target. Like selection-based methods(SEQRS/RBNS), de novo primary sequence and structural motifsare recovered in a single experiment (38, 39). Last, unlike othermethods, TGA enables a quantitative description of the relation-ship between variant RNA structures, affinity, and in vivo pheno-type irrespective of transcript abundance. Although TGA is at itscore an in vitro measurement between a recombinant protein and ahighly redundant array of RNA fragments, our data demonstratethat experimental evaluation of sequence- and structure-specificbinding synergistically complements in vivo measurements of RBPoccupancy.Our technology establishes a flexible platform for high-throughput
biochemistry that can be easily extended to any nucleic acidtemplate (e.g., the human exome), used to study diverse types ofbiochemical interaction (e.g., RNA-guided nucleases), and adap-ted to even higher- throughput systems (e.g., HiSeq). Our appli-cation of TGA to Vts1 (i) doubled the number of known Vts1targets, identifying key regulators of cell cycle and the DNAdamage response; (ii) provided a marked improvement in thespecificity of the protein’s binding motif; (iii) generated struc-tural insight into its ability to discriminate among targets; and(iv) suggested that Vts1 may have a role in regulating the transcripts
of evolutionarily nascent genes. The breadth of findings stemmingfrom analysis of an already exceptionally well-studied RBP sug-gests that TGA technology will be similarly enabling for otherRBPs and establishes a paradigm for quantitative, ultrahigh-throughput biochemistry.
Materials and MethodsDetailed information is provided in SI Materials and Methods. After sequencing,additional chemistry was performed on theMiSeq flow cell to generate RNA in amanner similar to RNA-MaPmethodology (29). A custommicrofluidic station wasbuilt from repurposed components harvested from an Illumina Genome Ana-lyzer II (GAII) (see Table S1 for parts list). Vts1 recombinant protein was purifiedfrom E. coli. Biological validation of TGA hits was performed in S. cerevisiae.Additional tables, example images, and code can be found at https://www.dropbox.com/s/juo3bnow2wdd8zq/Supplemental%20Data.zip?dl=0.
ACKNOWLEDGMENTS. This work was supported by National Institutesof Health (NIH) Grants R01-GM111990, P50-HG007735, and P01GM066275(to W.J.G.), and DP2-GM119140 (to D.F.J.). D.F.J. is also supported as a SearleScholar, as a Kimmel Scholar, and by a Science and Engineering Fellowshipfrom the David and Lucile Packard Foundation. This work was catalyzed bya seed grant from the Stanford Systems Biology Center (P50-GM107615),and the Beckman Center (to W.J.G.). A.K.C. is a Howard Hughes Medical In-stitute Fellow of the Damon Runyon Cancer Research Foundation (DRG2221-15).R.S. is a Stanford Graduate Fellow.
1. Gerstberger S, Hafner M, Tuschl T (2014) A census of human RNA-binding proteins.Nat Rev Genet 15(12):829–845.
2. Tsvetanova NG, Klass DM, Salzman J, Brown PO (2010) Proteome-wide search revealsunexpected RNA-binding proteins in Saccharomyces cerevisiae. PLoS One 5(9):1–12.
3. Castello A, et al. (2012) Insights into RNA biology from an atlas of mammalian mRNA-binding proteins. Cell 149(6):1393–1406.
4. Bartel DP (2009) MicroRNAs: Target recognition and regulatory functions. Cell 136(2):215–233.
5. Curtis D, Lehmann R, Zamore PD (1995) Translational regulation in development. Cell81(2):171–178.
6. Moore MJ, Proudfoot NJ (2009) Pre-mRNA processing reaches back to transcriptionand ahead to translation. Cell 136(4):688–700.
7. Ray D, et al. (2013) A compendium of RNA-binding motifs for decoding gene regu-lation. Nature 499(7457):172–177.
8. Hellman LM, Fried MG (2007) Electrophoretic mobility shift assay (EMSA) for detect-ing protein-nucleic acid interactions. Nat Protoc 2(8):1849–1861.
9. Shi X, Herschlag D (2009) Fluorescence polarization anisotropy to measure RNA dy-namics. Methods Enzymol 469:287–302.
10. Campbell ZT, Wickens M (2015) Probing RNA-protein networks: Biochemistry meetsgenomics. Trends Biochem Sci 40(3):157–164.
11. McMahon AC, et al. (2016) TRIBE: Hijacking an RNA-editing enzyme to identify cell-specific targets of RNA-binding proteins. Cell 165(3):742–753.
12. Licatalosi DD, et al. (2008) HITS-CLIP yields genome-wide insights into brain alterna-tive RNA processing. Nature 456(7221):464–469.
13. König J, et al. (2010) iCLIP reveals the function of hnRNP particles in splicing at in-dividual nucleotide resolution. Nat Struct Mol Biol 17(7):909–915.
14. Zhao J, et al. (2010) Genome-wide identification of polycomb-associated RNAs by RIP-seq. Mol Cell 40(6):939–953.
15. Friedersdorf MB, Keene JD (2014) Advancing the functional utility of PAR-CLIP byquantifying background binding to mRNAs and lncRNAs. Genome Biol 15(1):R2.
16. Lapointe CP, Wilinski D, Saunders HAJ, Wickens M (2015) Protein-RNA networks re-vealed through covalent RNA marks. Nat Methods 12(12):1163–1170.
17. Miura F, et al. (2008) Absolute quantification of the budding yeast transcriptome bymeans of competitive PCR between genomic and complementary DNAs. BMC Genomics9:574.
18. Kishore S, et al. (2011) A quantitative analysis of CLIP methods for identifying bindingsites of RNA-binding proteins. Nat Methods 8(7):559–564.
19. Flynn RA, et al. (2015) Dissecting noncoding and pathogen RNA-protein interactomes.RNA 21(1):135–143.
20. Chen L, et al. (2014) Global regulation of mRNA translation and stability in the earlyDrosophila embryo by the Smaug RNA-binding protein. Genome Biol 15(1):R4.
21. Aviv T, et al. (2006) The NMR and X-ray structures of the Saccharomyces cerevisiaeVts1 SAM domain define a surface for the recognition of RNA hairpins. J Mol Biol356(2):274–279.
22. Aviv T, et al. (2003) The RNA-binding SAM domain of Smaug defines a new family ofpost-transcriptional regulators. Nat Struct Biol 10(8):614–621.
23. Hogan DJ, Riordan DP, Gerber AP, Herschlag D, Brown PO (2008) Diverse RNA-bindingproteins interact with functionally related sets of RNAs, suggesting an extensiveregulatory system. PLoS Biol 6(10):e255.
24. Rendl LM, Bieman MA, Smibert CA (2008) S. cerevisiae Vts1p induces deadenylation-dependent transcript degradation and interacts with the Ccr4p-Pop2p-Not dead-enylase complex. RNA 14(7):1328–1336.
25. Rendl LM, Bieman MA, Vari HK, Smibert CA (2012) The eIF4E-binding protein Eap1pfunctions in Vts1p-mediated transcript decay. PLoS One 7(10):e47121.
26. Riordan DP, Herschlag D, Brown PO (2011) Identification of RNA recognition elementsin the Saccharomyces cerevisiae transcriptome. Nucleic Acids Res 39(4):1501–1509.
27. Oberstrass FC, et al. (2006) Shape-specific recognition in the structure of the Vts1pSAM domain with RNA. Nat Struct Mol Biol 13(2):160–167.
28. Tome JM, et al. (2014) Comprehensive analysis of RNA-protein interactions by high-throughput sequencing-RNA affinity profiling. Nat Methods 11(6):683–688.
29. Buenrostro JD, et al. (2014) Quantitative analysis of RNA-protein interactions on amassively parallel array reveals biophysical and evolutionary landscapes. NatBiotechnol 32(6):562–568.
30. Greenleaf WJ, Frieda KL, Foster DAN, Woodside MT, Block SM (2008) Direct observationof hierarchical folding in single riboswitch aptamers. Science 319(5863):630–633.
31. Ghaemmaghami S, et al. (2003) Global analysis of protein expression in yeast. Nature425(6959):737–741.
32. Kazan H, Ray D, Chan ET, Hughes TR, Morris Q (2010) RNAcontext: A new method forlearning the sequence and structure binding preferences of RNA-binding proteins.PLoS Comput Biol 6(7):e1000832.
33. Aviv T, Lin Z, Ben-Ari G, Smibert CA, Sicheri F (2006) Sequence-specific recognition ofRNA hairpins by the SAM domain of Vts1p. Nat Struct Mol Biol 13(2):168–176.
34. Breslow DK, et al. (2008) A comprehensive strategy enabling high-resolution func-tional analysis of the yeast genome. Nat Methods 5(8):711–718.
35. Doles J, et al. (2010) Suppression of Rev3, the catalytic subunit of Polzeta, sensitizesdrug-resistant lung tumors to chemotherapy. Proc Natl Acad Sci USA 107(48):20786–20791.
36. Carvunis AR, et al. (2012) Proto-genes and de novo gene birth. Nature 487(7407):370–374.
37. Temme C, Simonelig M, Wahle E (2014) Deadenylation of mRNA by the CCR4-NOTcomplex in Drosophila: Molecular and developmental aspects. Front Genet 5(May):143.
38. Campbell ZT, et al. (2012) Cooperativity in RNA-protein interactions: Global analysisof RNA binding specificity. Cell Reports 1(5):570–581.
39. Lambert N, et al. (2014) RNA Bind-n-Seq: Quantitative assessment of the sequenceand structural binding specificity of RNA binding proteins. Mol Cell 54(5):887–900.
40. Tong AH, et al. (2001) Systematic genetic analysis with ordered arrays of yeast de-letion mutants. Science 294(5550):2364–2368.
41. Metzker ML (2010) Sequencing technologies—the next generation. Nat Rev Genet11(1):31–46.
42. Nutiu R, et al. (2011) Direct measurement of DNA affinity landscapes on a high-throughput sequencing instrument. Nat Biotechnol 29(7):659–664.
43. McKenna A, et al. (2010) The Genome Analysis Toolkit: A MapReduce framework foranalyzing next-generation DNA sequencing data. Genome Res 20(9):1297–1303.
44. Quinlan AR, Hall IM (2010) BEDTools: A flexible suite of utilities for comparing ge-nomic features. Bioinformatics 26(6):841–842.
45. Langmead B, Salzberg SL (2012) Fast gapped-read alignment with Bowtie 2. NatMethods 9(4):357–359.
46. Bolger AM, Lohse M, Usadel B (2014) Trimmomatic: A flexible trimmer for Illuminasequence data. Bioinformatics 30(15):2114–2120.
47. Trapnell C, et al. (2012) Differential gene and transcript expression analysis of RNA-seq experiments with TopHat and Cufflinks. Nat Protoc 7(3):562–578.
48. Nagalakshmi U, et al. (2008) The transcriptional landscape of the yeast genome de-fined by RNA sequencing. Science 320(5881):1344–1349.
3624 | www.pnas.org/cgi/doi/10.1073/pnas.1618370114 She et al.
Dow
nloa
ded
by g
uest
on
Feb
ruar
y 10
, 202
2


![Long-Read Annotation: Automated Eukaryotic Genome · Breakthrough Technologies Long-Read Annotation: Automated Eukaryotic Genome Annotation Based on Long-Read cDNA Sequencing1[OPEN]](https://static.fdocuments.us/doc/165x107/5fc17da202de2311b330ac06/long-read-annotation-automated-eukaryotic-breakthrough-technologies-long-read-annotation.jpg)
