Composting Commercial Fish Processing Waste from Fish ...Composting Commercial Fish Processing Waste...
40
Composting Commercial Fish Processing Waste from Fish Caught in the Michigan Waters of the Great Lakes Ronald E. Kinnunen District Sea Grant Agent Michigan State University Extension M. Charles Gould Agriculture & Natural Resources Nutrient Management Agent Michigan State University Extension Peter Cambier Vice President Northern Initiatives
Transcript of Composting Commercial Fish Processing Waste from Fish ...Composting Commercial Fish Processing Waste...

Composting CommercialFish Processing Waste
from Fish Caught in theMichigan Waters of the
Great LakesRonald E. Kinnunen
District Sea Grant AgentMichigan State University Extension
M. Charles GouldAgriculture & Natural Resources Nutrient Management Agent
Michigan State University Extension
Peter CambierVice President
Northern Initiatives

Composting Commercial Fish Processing Waste from Fish Caught in the Michigan Waters of the Great Lakes
2
Table of ContentsAcknowledgements . . . . . . . . . . . . . . . . . . . . . . . . . . . . . . . . . . . . . . . . . . . . . . . . . . . . . . . . . . . . . . . . . . . . . . . . . . . . . . . 3
Abstract . . . . . . . . . . . . . . . . . . . . . . . . . . . . . . . . . . . . . . . . . . . . . . . . . . . . . . . . . . . . . . . . . . . . . . . . . . . . . . . . . . . . . . . . 3
Introduction . . . . . . . . . . . . . . . . . . . . . . . . . . . . . . . . . . . . . . . . . . . . . . . . . . . . . . . . . . . . . . . . . . . . . . . . . . . . . . . . . . . . 4
Objectives . . . . . . . . . . . . . . . . . . . . . . . . . . . . . . . . . . . . . . . . . . . . . . . . . . . . . . . . . . . . . . . . . . . . . . . . . . . . . . . . . . . . . . 5
Feedstock Descriptions. . . . . . . . . . . . . . . . . . . . . . . . . . . . . . . . . . . . . . . . . . . . . . . . . . . . . . . . . . . . . . . . . . . . . . . . . . . . 5
Compost Production. . . . . . . . . . . . . . . . . . . . . . . . . . . . . . . . . . . . . . . . . . . . . . . . . . . . . . . . . . . . . . . . . . . . . . . . . . . . . . 5
Methods . . . . . . . . . . . . . . . . . . . . . . . . . . . . . . . . . . . . . . . . . . . . . . . . . . . . . . . . . . . . . . . . . . . . . . . . . . . . . . . . . . . . . . . . 8
Results . . . . . . . . . . . . . . . . . . . . . . . . . . . . . . . . . . . . . . . . . . . . . . . . . . . . . . . . . . . . . . . . . . . . . . . . . . . . . . . . . . . . . . . . 13
Markets for Composted Fish Waste . . . . . . . . . . . . . . . . . . . . . . . . . . . . . . . . . . . . . . . . . . . . . . . . . . . . . . . . . . . . . . . . . 24
Conclusions. . . . . . . . . . . . . . . . . . . . . . . . . . . . . . . . . . . . . . . . . . . . . . . . . . . . . . . . . . . . . . . . . . . . . . . . . . . . . . . . . . . . 28
References . . . . . . . . . . . . . . . . . . . . . . . . . . . . . . . . . . . . . . . . . . . . . . . . . . . . . . . . . . . . . . . . . . . . . . . . . . . . . . . . . . . . . 30
Appendix 1 . . . . . . . . . . . . . . . . . . . . . . . . . . . . . . . . . . . . . . . . . . . . . . . . . . . . . . . . . . . . . . . . . . . . . . . . . . . . . . . . . . 31-38
Appendix 2. . . . . . . . . . . . . . . . . . . . . . . . . . . . . . . . . . . . . . . . . . . . . . . . . . . . . . . . . . . . . . . . . . . . . . . . . . . . . . . . . . . . . 39
Composting Commercial Fish Processing Waste from Fish Caught in the Michigan Waters of the Great Lakes
Ronald E. KinnunenDistrict Sea Grant Agent
Michigan State University ExtensionMarquette
M. Charles GouldAgriculture & Natural Resources Nutrient Management Agent
Michigan State University ExtensionGrand Haven
Peter CambierVice President
Northern InitiativesCadillac
May 5, 2005
MICHIGAN STATEU N I V E R S I T Y
EXTENSION
Although the responsibility for the accuracy of thiswork is solely that of the authors, we are indebted to anumber of individuals involved in various aspects of thisindustry for assistance. We wish to thank the fishprocessors who allowed for the collection of fish wastefrom their facilities: Cameron McMurray, Jill Bentgen,Randy King, Ted Thill, and Ralph Scalzo. Fish processorswho delivered fish waste to the Upper Peninsula com-posting site included: Jill Bentgen, Don Bell, and JamieMassey. At Kinross Township we would like to thankLarry Palma, township supervisor, and Norman Perkinsat the Department of Public Works and his staff whoconstructed and monitored the static compost pile. Wewould like to thank Michelle Miller of MillerHorticultural and Christopher Lufkin of Soils Solutions,LLC for their many hours devoted to this project. Wethank Wayne Davis at Woods End Laboratory, Dr. JohnBouwkamp of the University of Maryland College Park,Dr. John Biernbaum of Michigan State University, Dr.Chuck Cubbage, Michigan Department of Agriculture(retired), Patrick Donovan, Michigan Department ofEnvironmental Quality, Christine Rector, director ofmarketing services at Northern Initiatives, and ChristineVandervoort PhD, at the Center for Integrated Plant
Systems at Michigan State University for the use of theirexpertise during the project. We thank Mark Ebener ofthe Chippawa Ottawa Resource Authority and theMichigan Department of Natural Resources for supply-ing the commercial catch and weir harvest data fromwhich we conducted the length frequency analysis forlake whitefish/lake trout and salmon respectively. Last,but certainly not least, we thank Mike Bronkema, ownerof Shady Side Farm, Holland, MI for the use of therotating drum in-vessel composter.
We are especially appreciative of the work of the adviso-ry council for this project. They include Mike Ripley,environmental coordinator of the Chippewa OttawaResource Authority; Mary Kostecki, county Extensiondirector, Mackinac County (retired); Christine Lietzau,organic and sustainable agriculture specialist, MichiganDepartment of Agriculture; Lucille Scotti, MichiganDepartment of Environmental Quality (retired); JillBentgen, president, Mackinac Straits Fish Company; andJim Lucas, county Extension director, Chippewa County.
This project was supported in part by a grant throughthe Clean Michigan Initiative administered by theMichigan Department of Environmental Quality.
Composting Commercial Fish Processing Waste from Fish Caught in the Michigan Waters of the Great Lakes
3
The disposal or reuse of fish processing waste has longbeen a challenge for Michigan’s fish processing industry.Approximately 5 million pounds of waste from commer-cially processed lake whitefish, lake trout, and salmonare generated annually. In an effort to help the Michiganfish processing industry find better solutions to handlefish processing waste materials, a project was initiatedto determine the viability of composting fish waste. Theobjectives of this project were to develop a compostmarketing strategy, produce compost that met identifiedmarket specifications, and document the levels of mer-cury and halogenated hydrocarbons along the compost-ing process to allay concerns in using composted fishwaste.
Lake whitefish waste from fish caught in Lake Superiorexceeded the USDA Food and Drug Administration’s(FDA) chlordane and dieldrin action level of 0.3 ppm forfood fish. Lake whitefish waste from fish caught in lakesHuron and Michigan were below the action level forchlordane and dieldrin. All lake whitefish waste, regard-less of coming from Lakes Huron, Michigan or Superior,were below the FDA’s action levels for food fish for
toxaphene, dichlorodiphenyldichloroethylene (DDE),dichlorodiphenyldichloroethane (DDD),dichlorodiphenyltrichloroethane (DDT), polychlorinatedbiphenyl (PCB) and mercury.
Lake trout waste from fish caught in lakes Superior andHuron exceeded the FDA action level of 0.3 ppm forchlordane and dieldrin. Chlordane and dieldrin were notdetected in lake trout caught in Lake Michigan. Laketrout waste from fish caught in lakes Huron, Michiganand Superior were below the FDA’s action levels for foodfish for toxaphene, DDE, DDD, DDT, PCB and mercury.
Salmon waste from fish caught in Lake Michiganexceeded the FDA’s PCB level of 2.0 ppm for food fish.Salmon waste from fish caught in Lake Huron wasbelow the action level for PCB. All salmon waste, regard-less of coming from Lake Michigan or Lake Huron, werebelow the FDA’s action levels for food fish for chlordane,dieldrin, toxaphene, DDE, DDD, DDT and mercury.
No halogenated hydrocarbons were detected in compostmade from white fish/lake trout waste while DDT levelsin compost made from salmon waste were detected, but
Acknowledgements
Abstract
Composting Commercial Fish Processing Waste from Fish Caught in the Michigan Waters of the Great Lakes
4
were well below the FDA DDT action level of 5.0 ppm forfood fish. Mercury levels were below both the FDAaction level (1.0 ppm) and State of Michigan action level(0.5 ppm) in both white fish/lake trout waste compostand salmon waste compost. No chlordane, dieldrin,toxaphene, DDE, DDD, DDT, PCB or mercury was foundin the leaf compost from the City of Kincheloe.
Mercury contaminant levels in basil plants grown inmixes with various amounts of white fish/lake trout andsalmon compost in them were well below the FDA
action level (1.0 ppm) and State of Michigan action level(0.5 ppm).
It is recommended that fish waste compost be a compo-nent of a growing mix that meets a more demandingspecification and for which the consumer is accustomedto paying a higher price. Based on the trials in thisstudy, growing mixes containing 20-25% compost in aprofessional peat based growing media are optimum.There is nothing in compost made from fish waste thatwould prohibit it from being used in an organic crop-ping system.
The Great Lakes still support a sustainable commercialfishery. The activities of this commercial fishery varyamong the states and the province of Ontario. In 2000,lake whitefish was the most harvested fish in both U.S.and Canadian waters of the Great Lakes, accounting formore than 21 million pounds and worth over $18 million in dockside value (Kinnunen, 2003). In2000, 60 percent of the commercial harvest of GreatLakes whitefish was from Lake Huron, 25 percent fromLake Michigan and 10 percent from Lake Superior.
Lake whitefish, lake trout and salmon account for thelargest share of commercial fish harvested from theMichigan waters of the Great Lakes (Kinnunen, 2003).In 2000, about 8 million pounds of lake whitefish, justover 1 million pounds of lake trout and over a half-million pounds of Pacific salmon were harvested fromthe Michigan waters of the Great Lakes. The lake white-fish commercial harvest in Michigan waters of the GreatLakes in 2000 was made up of fish from Lake Michigan(41 percent), Lake Huron (37 percent) and LakeSuperior (22 percent).
In addition, about 1 million pounds of Pacific salmonare harvested each fall from weirs on rivers that flowinto lakes Huron and Michigan. Kinnunen (2001)reported that, through the late 1990s, these weir-harvested Pacific salmon consisted of, by poundage,Lake Michigan coho salmon (38 percent), Lake Michiganchinook salmon (35 percent) and Lake Huron chinooksalmon (27 percent). When these Michigan Great Lakesfish are processed, about half their weight is generatedas waste byproducts. Thus about 5 million pounds ofwaste was generated from the harvest of lake whitefish,lake trout and salmon in Michigan in 2000.
The disposal or reuse of fish processing waste productshas long been a challenge for Michigan’s fish processingindustry. This problem is especially acute in northernMichigan, where municipal sewage treatment systemsare ill equipped to treat fish processing waste materialand landfills are an expensive disposal solution. Someprocessors have developed markets in the liquid fertiliz-er industry that have helped alleviate disposal problems;however, the liquid fertilizer market is available onlyduring the summer months, and it requires expensiverefrigeration while material is accumulated. In an effortto help the Michigan fish processing industry find betterways to treat fish processing waste materials, a pilotproject was initiated to determine the viability of com-posting fish processing waste material and identify mar-kets for the composted material.
It was understood at the outset of this project that com-posting fish processing waste had been done before withvarying amounts of success. Past fish waste compostingpilot projects in Door County, Wis. (L. Frederick et al.,1989), Rogers City, Mich., and Michigan’s UpperPeninsula (Logsden, 1991; Gould, 2004) provided arange of results. It is postulated that composting tech-niques, as well as the origin of fish and perhaps contam-inants in feedstocks used as the carbon source, con-tributed to the wide range of test results.
Because contaminants in the fish waste were of concern,it was felt that analysis needed to be done all along thecomposting process. Accordingly, fish waste from vari-ous fish species from lakes Superior, Michigan andHuron; feedstocks used to provide carbon; the finishedcompost from two composting methods; and sensitivecrops grown in a greenhouse in the finished compostwere all analyzed for contaminants.
Introduction
Composting Commercial Fish Processing Waste from Fish Caught in the Michigan Waters of the Great Lakes
5
Feedstock DescriptionsLake whitefish and lake trout waste samples were col-lected from commercial fish processing facilities. Lakewhitefish waste consisted of everything except the skin-on fillet portion of the fish. Lake trout waste consistedof everything except the skin-on fillet portion of the fishand the viscera. Pacific salmon waste consisted of thehead and viscera minus the eggs (the fish were beingprocessed for sale whole, and the eggs were sold ascaviar). The carbon feedstocks used to make compostwere sawmill bark wood chips, hardwood sawdust, cedarsawdust and industrial waste sawdust.
A composite sample of the fish waste (one-third lakewhitefish, one-third lake trout and one-third Pacificsalmon) plus the sawmill bark wood chips and hardwood
Compost ProductionComposting methods and locationsTwo composting methods were used in this project —the rotating drum in-vessel composting method and thestatic pile method. The rotating drum in-vessel com-poster used was Model 408 manufactured by BWOrganics (Sulfur Springs, Texas) (Figure 4). It has acapacity of 2.45 cubic yards and was located at ShadySide Farm (Holland, Mich.). The static pile was formedand located at the Kinross Charter TownshipDepartment of Public Works (Kincheloe, Mich.).
The sawdust, wood bark chips and fish waste analyseswere used by Woods End Research Laboratories, Inc., todevelop several compost recipes for this site (seeAppendix 1). The compost recipe used was adjusted tocompensate for higher than anticipated fish waste mois-ture content. The compost recipe was 13 cubic yards ofsawdust (10 cubic yards of hardwood sawdust and 3cubic yards of cedar sawdust), 10 cubic yards of hard-wood bark and 9 cubic yards (1,800 gallons or 15,000pounds) of fish waste. Cedar sawdust was used becauseof the difficulty in getting hardwood sawdust, but this isnot recommended. Approximately 3 cubic yards of com-posted leaf material from the Kincheloe leaf collectionfacility were also incorporated in the pile. The fish
waste, predominantly made up of lake whitefish andlake trout, came from three fish processors in the St.Ignace/Mackinaw City, Mich., area — Bell’s Fishery,Clearwater Fish Cooperative and the Mackinac StraitsFish Company. About a third of the fish waste volume(4,100 pounds) came from Lake Superior fish; the restcame from fish from lakes Huron and Michigan.
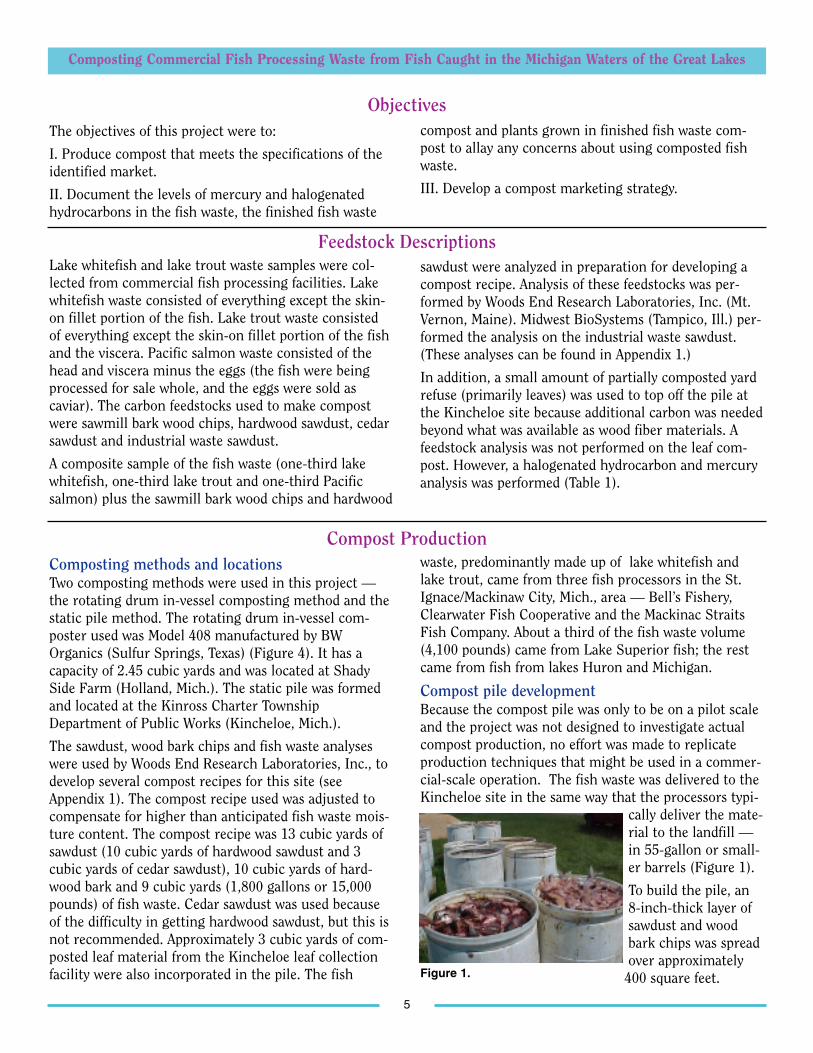
Compost pile developmentBecause the compost pile was only to be on a pilot scaleand the project was not designed to investigate actualcompost production, no effort was made to replicateproduction techniques that might be used in a commer-cial-scale operation. The fish waste was delivered to theKincheloe site in the same way that the processors typi-
cally deliver the mate-rial to the landfill —in 55-gallon or small-er barrels (Figure 1).
To build the pile, an8-inch-thick layer ofsawdust and woodbark chips was spreadover approximately
400 square feet.
sawdust were analyzed in preparation for developing acompost recipe. Analysis of these feedstocks was per-formed by Woods End Research Laboratories, Inc. (Mt.Vernon, Maine). Midwest BioSystems (Tampico, Ill.) per-formed the analysis on the industrial waste sawdust.(These analyses can be found in Appendix 1.)
In addition, a small amount of partially composted yardrefuse (primarily leaves) was used to top off the pile atthe Kincheloe site because additional carbon was neededbeyond what was available as wood fiber materials. Afeedstock analysis was not performed on the leaf com-post. However, a halogenated hydrocarbon and mercuryanalysis was performed (Table 1).
ObjectivesThe objectives of this project were to:
I. Produce compost that meets the specifications of theidentified market.
II. Document the levels of mercury and halogenatedhydrocarbons in the fish waste, the finished fish waste
compost and plants grown in finished fish waste com-post to allay any concerns about using composted fishwaste.
III. Develop a compost marketing strategy.
Figure 1.

Composting Commercial Fish Processing Waste from Fish Caught in the Michigan Waters of the Great Lakes
6
Table 1. A summary of chemical contaminants found in fish waste, compost, leaf compost and tissue samples.
Sample Chlordane Dieldrin Toxaphene Sum DDTs Sum PCBs MercuryName ug/g Total ug/g Total ug/g ug/g ug/g ug/gLS-WF 2.00 1.00 0.03 0.18 0.72 0.020LH-WF 0.00 0.28 0.16 1.46 1.10 0.030LM-WF 0.00 0.00 0.11 0.00 1.58 0.030LS-LT 0.60 2.10 0.00 0.00 0.00 0.130LH-LT 0.41 1.27 0.00 0.20 1.02 0.090LM-LT 0.00 0.00 0.53 0.00 1.07 0.060LH-CHS 0.06 0.00 0.48 0.26 1.35 0.080LM-CHS 0.00 0.00 4.20 0.05 2.97 0.250Compost 1 ND ND ND 0.00 ND 0.170Compost 2 ND ND ND 0.13 ND 0.040Compost 3 ND ND ND ND ND 0.015Plant 1 ND ND ND ND ND 0.001Plant 2 ND ND ND ND ND 0.002Plant 3 ND ND ND ND ND 0.002Plant 4 ND ND ND ND ND 0.003Plant 5 ND ND ND ND ND 0.003Plant 6 ND ND ND ND ND 0.002Plant 7 ND ND ND ND ND 0.004Plant 8 ND ND ND ND ND 0.003Plant 9 ND ND ND ND ND 0.003Plant 10 ND ND ND ND ND 0.003LOD 0.003 0.001 0.050 - 0.025 -LOQ 0.010 0.003 0.165 - 0.825 -
KEYLH-WF (Lake Huron lake whitefish)LH-LT (Lake Huron lake trout)LH-CHS (Lake Huron chinook salmon)
LM-WF (Lake Michigan lake whitefish)LM-LT (Lake Michigan lake trout)LM-CHS (Lake Michigan chinook salmon)
LS-WF (Lake Superior lake whitefish) LS-LT (Lake Superior lake trout)
Compost 1 (Lake whitefish/lake trout compost)Compost 2 (Chinook salmon compost) Compost 3 (Leaf compost from Kincheloe)
Plant 1 (Trial 2-control), Plant 2 (Trial 1-treatment 3-20% compost)Plant 3 (Trial 2-30% salmon compost)Plant 4 (Trial 3-control)Plant 5 (Trial 3-treatment 4-25% compost)Plant 6 (Trial 1-treatment 2-15% compost)Plant 7 (Trial 1-control)Plant 8 (Trial 1-treatment 4-25% compost)Plant 9 (Trial 1-treatment 5-30% compost)Plant 10 (Trial 1- treatment 1-10% compost)
LOD (Level of detection)LOQ (Level of quantification)

Composting Commercial Fish Processing Waste from Fish Caught in the Michigan Waters of the Great Lakes
7
Barrels of fish wastewere then tipped overby hand from a palleton a forklift and even-ly distributed over thewood bark chip/saw-dust bed (Figure 2).Another layer of woodbark chips/sawdustapproximately 6 inch-
es thick was placedover the fish waste, and the process of alternating layersof fish waste and wood bark chips/sawdust was repeated.Fish waste was spread to the edges of the pile.
Once the pile reached 7 feet high, a front-end loader wasused to thoroughly mix the pile. After this was complet-ed, the pile was covered with a 12-inch layer of leaf com-post to minimize odors and vermin attraction.
Managing the pileThe pile was in place for approximately 12 months. Itwas formed in the third week of June 2002 and wasmanaged until we judged it to be mature enough for usein growing mixes in June of 2003. During most of thesummer and fall, a fleece compost blanket was used tomanage moisture and retain heat in the pile (Figure 3).
A temperature probe wasused to monitor the heatgenerated by the com-posting activity of thepile. The staff at theKincheloe site monitoredthe pile, taking dailytemperature readingsmost days. Temperature
readings can be found in Table 2. They were asked totake three readings in random areas of the pile.Depending on the status of the pile, they were also askedto use their front-end loader to turn the pile.
The pile was within the working compound of theKincheloe facility and within a few feet of a road usedregularly by staff members. Odors were noticeable onlywhen the pile was turned and then only in the immedi-
ate area. No animal problems were noticed around thepile because of a hurricane fence around the entire facil-ity and the control of odors with an appropriate com-posting recipe.
In December 2002, a sample of the Kincheloe pile wastested by Woods End Laboratory for maturity. Theanalysis found the pile to be immature with high ammo-nium content. A subsequent test of the material in May2003 using a Solvita test found the pile to be matureenough for use as a component of a growing mix.
Shady Side Farm site (Holland, Mich.)At the Shady Side Farm site, industrial waste sawdustreplaced the sawdust used at the Kincheloe site. The in-vessel composter was charged in late October 2002 with467 pounds (approximately 60 gallons) of fish waste, 147pounds of hardwood bark, 393 pounds of industrialwaste sawdust and 21 gallons of water. This mix had aC:N ratio of 29:1. The fish waste, generated at a BearLake, Mich., processing facility, came from salmon har-vested from weirs for the collection of salmon roe andwhole processed fish. After four days of continuous rota-tion, the composter was unloaded and the material wasplaced in a pile and allowed to mature until it was col-lected for testing in June of 2003.
Figure 4. BW Organics Model 408 rotating drum in-vesselcomposter.
Figure 3.
Figure 2.
Composting Commercial Fish Processing Waste from Fish Caught in the Michigan Waters of the Great Lakes
8
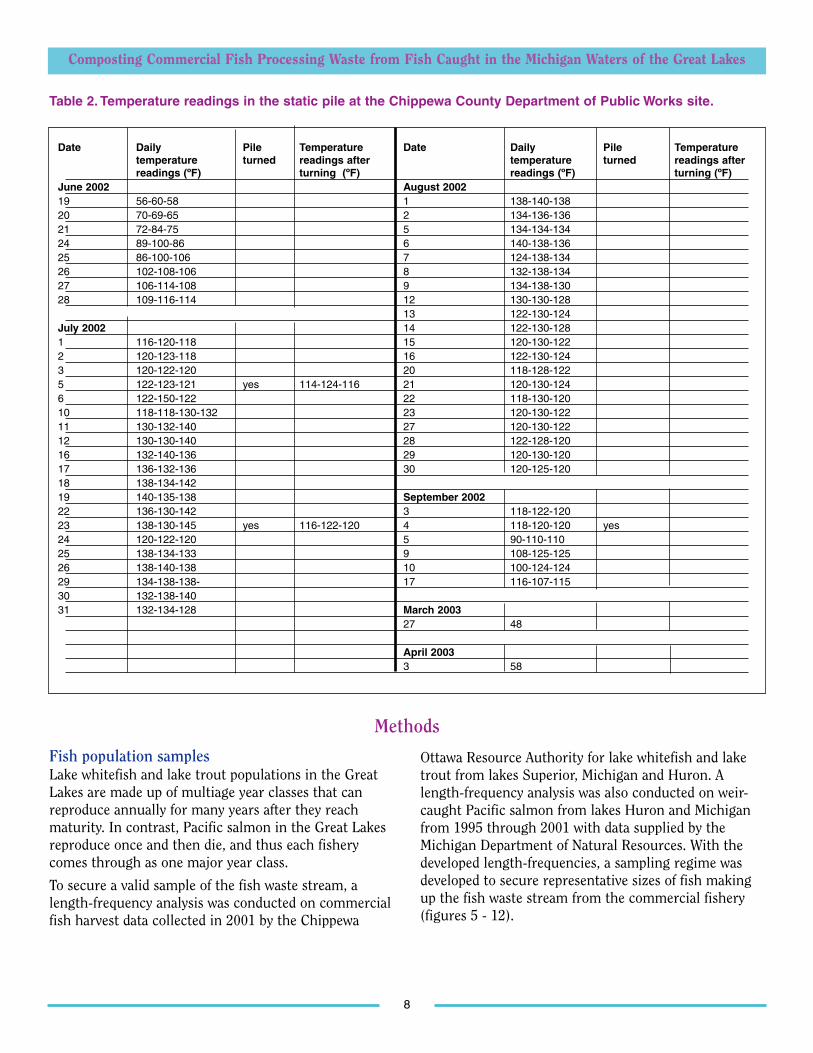
Table 2. Temperature readings in the static pile at the Chippewa County Department of Public Works site.
Date Daily Pile Temperature Date Daily Pile Temperaturetemperature turned readings after temperature turned readings afterreadings (ºF) turning (ºF) readings (ºF) turning (ºF)
June 2002 August 200219 56-60-58 1 138-140-13820 70-69-65 2 134-136-13621 72-84-75 5 134-134-13424 89-100-86 6 140-138-13625 86-100-106 7 124-138-13426 102-108-106 8 132-138-13427 106-114-108 9 134-138-13028 109-116-114 12 130-130-128
13 122-130-124July 2002 14 122-130-1281 116-120-118 15 120-130-1222 120-123-118 16 122-130-1243 120-122-120 20 118-128-1225 122-123-121 yes 114-124-116 21 120-130-1246 122-150-122 22 118-130-12010 118-118-130-132 23 120-130-12211 130-132-140 27 120-130-12212 130-130-140 28 122-128-12016 132-140-136 29 120-130-12017 136-132-136 30 120-125-12018 138-134-14219 140-135-138 September 200222 136-130-142 3 118-122-12023 138-130-145 yes 116-122-120 4 118-120-120 yes24 120-122-120 5 90-110-11025 138-134-133 9 108-125-12526 138-140-138 10 100-124-12429 134-138-138- 17 116-107-11530 132-138-14031 132-134-128 March 2003
27 48
April 20033 58
Methods
Fish population samplesLake whitefish and lake trout populations in the GreatLakes are made up of multiage year classes that canreproduce annually for many years after they reachmaturity. In contrast, Pacific salmon in the Great Lakesreproduce once and then die, and thus each fisherycomes through as one major year class.
To secure a valid sample of the fish waste stream, alength-frequency analysis was conducted on commercialfish harvest data collected in 2001 by the Chippewa
Ottawa Resource Authority for lake whitefish and laketrout from lakes Superior, Michigan and Huron. Alength-frequency analysis was also conducted on weir-caught Pacific salmon from lakes Huron and Michiganfrom 1995 through 2001 with data supplied by theMichigan Department of Natural Resources. With thedeveloped length-frequencies, a sampling regime wasdeveloped to secure representative sizes of fish makingup the fish waste stream from the commercial fishery(figures 5 - 12).
Composting Commercial Fish Processing Waste from Fish Caught in the Michigan Waters of the Great Lakes
9
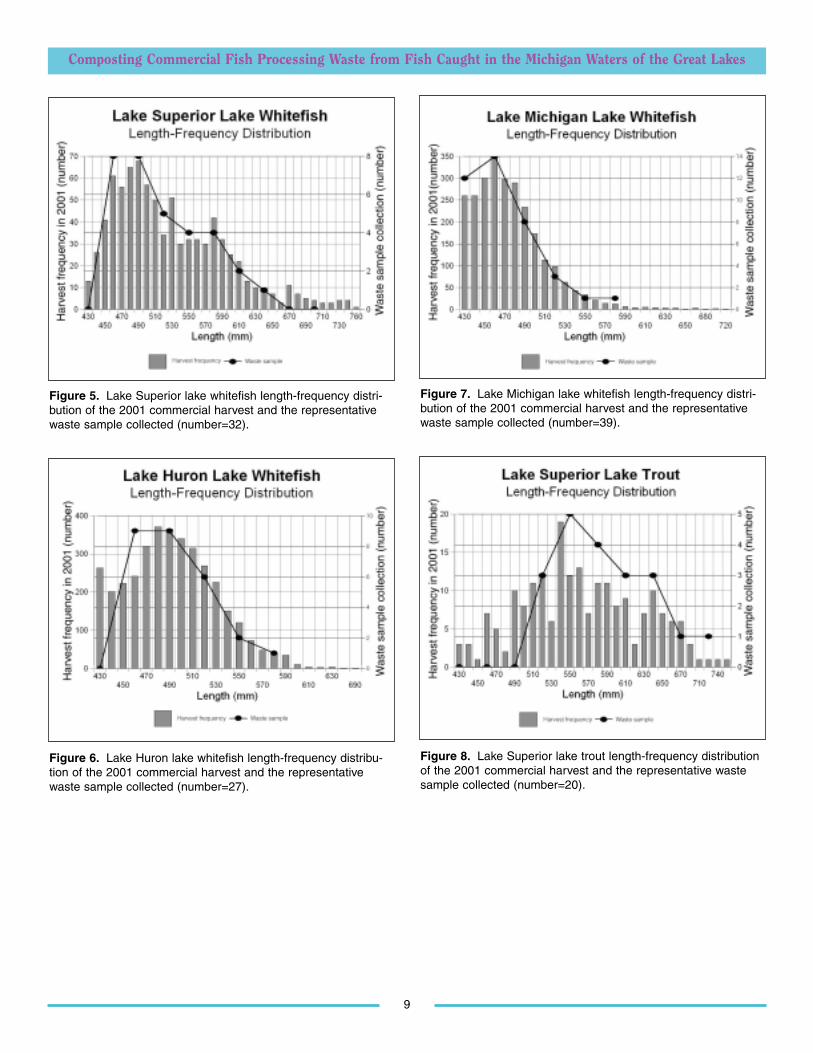
Figure 5. Lake Superior lake whitefish length-frequency distri-bution of the 2001 commercial harvest and the representativewaste sample collected (number=32).
Figure 6. Lake Huron lake whitefish length-frequency distribu-tion of the 2001 commercial harvest and the representativewaste sample collected (number=27).
Figure 7. Lake Michigan lake whitefish length-frequency distri-bution of the 2001 commercial harvest and the representativewaste sample collected (number=39).
Figure 8. Lake Superior lake trout length-frequency distributionof the 2001 commercial harvest and the representative wastesample collected (number=20).

Composting Commercial Fish Processing Waste from Fish Caught in the Michigan Waters of the Great Lakes
10
Figure 9. Lake Huron lake trout length-frequency distribution ofthe 2001 commercial harvest and the representative waste sam-ple collected (number=24).
Figure 10. Lake Michigan lake trout length-frequency distribu-tion of the 2001 commercial harvest and the representativewaste sample collected (number=17).
Figure 11. Lake Huron chinook salmon length-frequency distri-bution of the 1995-2001 weir harvests and the representativewaste sample collected (number=35).
Figure 12. Lake Michigan chinook salmon length-frequency dis-tribution of the 1995-2001 weir harvests and the representativewaste sample collected (number=29).
Composting Commercial Fish Processing Waste from Fish Caught in the Michigan Waters of the Great Lakes
11
Lake whitefish and lake trout waste samples were col-lected from commercial fish processing facilities inMarquette, Naubinway, St. Ignace and Mackinaw City,Mich. The lake whitefish waste samples consisted ofeverything except the skin-on fillet portion of the fish.The lake trout waste samples consisted of everythingexcept the skin-on fillet portion of the fish and the vis-cera. (Lake trout are harvested by Native American fish-eries, and this fish is delivered to processors with theviscera removed.) Pacific salmon waste samples werecollected from a fish processing facility in Bear Lakethat processed weir-caught salmon from lakes Huronand Michigan. The salmon waste consisted of the headand viscera minus the eggs — the fish were beingprocessed for sale whole, and the eggs were sold ascaviar.
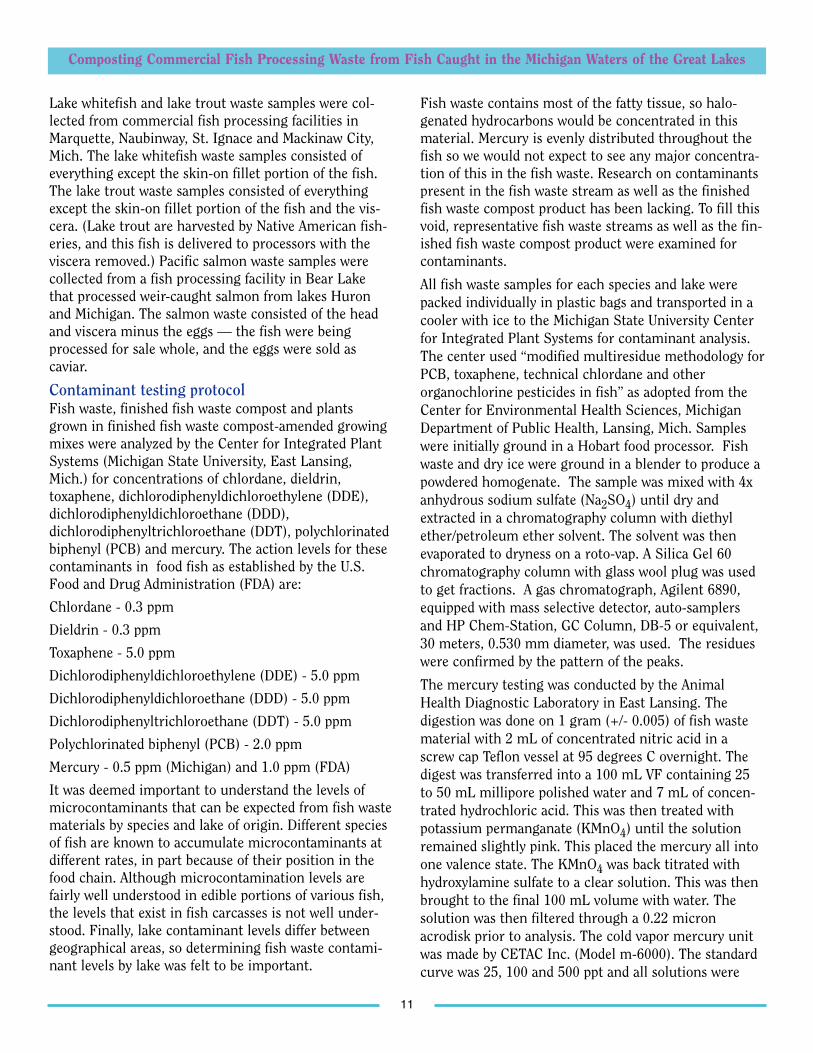
Contaminant testing protocolFish waste, finished fish waste compost and plantsgrown in finished fish waste compost-amended growingmixes were analyzed by the Center for Integrated PlantSystems (Michigan State University, East Lansing,Mich.) for concentrations of chlordane, dieldrin,toxaphene, dichlorodiphenyldichloroethylene (DDE),dichlorodiphenyldichloroethane (DDD),dichlorodiphenyltrichloroethane (DDT), polychlorinatedbiphenyl (PCB) and mercury. The action levels for thesecontaminants in food fish as established by the U.S.Food and Drug Administration (FDA) are:
Chlordane - 0.3 ppm
Dieldrin - 0.3 ppm
Toxaphene - 5.0 ppm
Dichlorodiphenyldichloroethylene (DDE) - 5.0 ppm
Dichlorodiphenyldichloroethane (DDD) - 5.0 ppm
Dichlorodiphenyltrichloroethane (DDT) - 5.0 ppm
Polychlorinated biphenyl (PCB) - 2.0 ppm
Mercury - 0.5 ppm (Michigan) and 1.0 ppm (FDA)
It was deemed important to understand the levels ofmicrocontaminants that can be expected from fish wastematerials by species and lake of origin. Different speciesof fish are known to accumulate microcontaminants atdifferent rates, in part because of their position in thefood chain. Although microcontamination levels arefairly well understood in edible portions of various fish,the levels that exist in fish carcasses is not well under-stood. Finally, lake contaminant levels differ betweengeographical areas, so determining fish waste contami-nant levels by lake was felt to be important.
Fish waste contains most of the fatty tissue, so halo-genated hydrocarbons would be concentrated in thismaterial. Mercury is evenly distributed throughout thefish so we would not expect to see any major concentra-tion of this in the fish waste. Research on contaminantspresent in the fish waste stream as well as the finishedfish waste compost product has been lacking. To fill thisvoid, representative fish waste streams as well as the fin-ished fish waste compost product were examined forcontaminants.
All fish waste samples for each species and lake werepacked individually in plastic bags and transported in acooler with ice to the Michigan State University Centerfor Integrated Plant Systems for contaminant analysis.The center used “modified multiresidue methodology forPCB, toxaphene, technical chlordane and otherorganochlorine pesticides in fish” as adopted from theCenter for Environmental Health Sciences, MichiganDepartment of Public Health, Lansing, Mich. Sampleswere initially ground in a Hobart food processor. Fishwaste and dry ice were ground in a blender to produce apowdered homogenate. The sample was mixed with 4xanhydrous sodium sulfate (Na2SO4) until dry andextracted in a chromatography column with diethylether/petroleum ether solvent. The solvent was thenevaporated to dryness on a roto-vap. A Silica Gel 60chromatography column with glass wool plug was usedto get fractions. A gas chromatograph, Agilent 6890,equipped with mass selective detector, auto-samplersand HP Chem-Station, GC Column, DB-5 or equivalent,30 meters, 0.530 mm diameter, was used. The residueswere confirmed by the pattern of the peaks.
The mercury testing was conducted by the AnimalHealth Diagnostic Laboratory in East Lansing. Thedigestion was done on 1 gram (+/- 0.005) of fish wastematerial with 2 mL of concentrated nitric acid in ascrew cap Teflon vessel at 95 degrees C overnight. Thedigest was transferred into a 100 mL VF containing 25to 50 mL millipore polished water and 7 mL of concen-trated hydrochloric acid. This was then treated withpotassium permanganate (KMnO4) until the solutionremained slightly pink. This placed the mercury all intoone valence state. The KMnO4 was back titrated withhydroxylamine sulfate to a clear solution. This was thenbrought to the final 100 mL volume with water. Thesolution was then filtered through a 0.22 micronacrodisk prior to analysis. The cold vapor mercury unitwas made by CETAC Inc. (Model m-6000). The standardcurve was 25, 100 and 500 ppt and all solutions were

Composting Commercial Fish Processing Waste from Fish Caught in the Michigan Waters of the Great Lakes
12
diluted to fit inside the curve. The quality control usedwas a NIST Mussel SRM 2976 and the high calibration(500 ppt) solution was used prior to, at the middle andat the end of the run.Plant growth trial methodsThe use of finished compost made from lake whitefishand lake trout caught in lakes Huron, Michigan andSuperior and salmon waste was evaluated as a compo-nent of a potting soil by Miller Horticultural Associates,Inc. (Portland, Ore.). The objectives of the plant growthtrials were to:
1. Determine the appropriate amount of compost thatcan be added to a professional and retail growing mixthat will result in acceptable plant growth.
2. Evaluate the nutritional status of plants grown in acompost-amended medium.
3. Determine the levels of mercury and halogenatedhydrocarbons that are absorbed by plants grown in acompost-amended medium.
Trial 1Trial 1 compared a standard professional growing medi-um (Premier ProMix BX amended with coir) with thesame medium amended with fish waste (lakewhitefish/lake trout) compost rates of 10 percent to 30percent. The control medium consisted of 67 percentProMix BX (Premier Horticulture, Quebec) and 33 per-cent short-fibered coir (Coco Palm Resources, SriLanka). The treatments were as follows:
Control Premier ProMix BX amended with coir
Treatment 1 10% compost, 90% control
Treatment 2 15% compost, 85% control
Treatment 3 20% compost, 80% control
Treatment 4 25% compost, 75% control
Treatment 5 30% compost, 70% control
Sixty 1-gallon containers were filled with each treatmentplus the control (a total of 360 containers). A mediumsample from each treatment plus the control was takenand sent to Quality Analytical Labs (Panama City, Fla.)for analysis. Two basil (Ocimum basilicum) plants wereplanted in each 1-gallon container. The basil plants wereobtained from Yoshitomi Brothers (West Linn, Ore.).Planting was done over a three-day period — June 23-25, 2003. Plants were randomized within thefertilization group and watered as needed (approximatelyevery other day).
The control and each treatment were split in half, withthe A group receiving no additional liquid fertilizer dur-ing the trial and the B group receiving fertilizer twice aweek according to the following schedule:
Week 1-2 Gromore® 9-45-15 (nitrogen = 25 parts per million)
Week 3-12 Gromore® 20-20-20 (nitrogen = 100 parts per million)
Fertilizer was applied though a Dosatron® injector setat a 1:100 ratio.
Temperatures in the greenhouse ranged from 24 to 32degrees C. The plants were grown until August 30, 2003.Ten plants per treatment and fertilization group wererandomly selected to be measured for height, freshweight and dry weight. Approximately 200 grams offresh tissue from the most recently matured leaves weresent to Quality Analytical Labs for nutrient analysis.Two pounds (approximately 908 grams) of fresh plantmaterial were shipped to the Center for Integrated PlantSystems (CIPS) at Michigan State University (EastLansing, Mich.) for halogenated hydrocarbon and mer-cury analysis following the same protocol used for thefish waste material analysis.
Trial 2This trial evaluated the use of salmon compost as a com-ponent of a professional growing mix. The professionalgrowing mix was the same mix used in Trial 1 (67 per-cent ProMix BX and 33 percent coir). Because of limitedgreenhouse space and a decision to grow only enough toconduct a halogenated hydrocarbon and mercury analy-sis, only one treatment of 30 percent salmon compostand 70 percent control medium was employed in thistrial.
Two basil plugs were planted in each gallon containerfor a total of 60 pots (30 pots for the treatment and 30pots for the control). Trial 2 was put on the same fertil-ization schedule, planted at the same time and kept atthe same temperatures as Trial 1.
Plants were harvested at 12 weeks and shipped to CIPSfor halogenated hydrocarbon and mercury analysis. Noplant growth data were collected nor nutrient analysisconducted on these plants.

Composting Commercial Fish Processing Waste from Fish Caught in the Michigan Waters of the Great Lakes
13
Trial 3Trial 3 evaluated plant growth in the following mixes:
1. Lake whitefish/lake trout compost in a standard bark-based potting soil (Marigold ‘Bonanza’).
The standard bark-based potting soil consisted of 55percent composted pine bark, 35 percent peat moss,and 10 percent perlite. Dolomitic lime was added at arate of 6 pounds per cubic yard to adjust the final pHto a range of 5.5 to 5.7. Fish waste compost wasadded in the same amounts as in Trial 1, beginningwith 10 percent and ending with 30 percent compost.
Forty pots were filled with each treatment plus thecontrol. The control and each treatment were split inhalf, with the A group receiving no additional liquidfertilizer during the trial and the B group receivingfertilizer twice a week. Marigold ‘Bonanza’ was plant-ed in each pot. Media samples were taken at the timeof mixing and analyzed for nutritional levels byQuality Analytical Labs.
2. Lake whitefish/lake trout compost in a bark-basedpotting soil compared with a standard bark-basedpotting soil (basil).
Forty pots were filled with treatment 1 (10 percentcompost, 90 percent control). Half were fertilized, theother half were not. Basil was planted in these pots,two plugs per pot. Media samples were taken at thetime of mixing and analyzed for nutritional levels byQuality Analytical Labs.
Planting occurred during June 25-26, 2003. All potswith bark-based potting soil, regardless of treatment,were topdressed with 6 grams of a 9-5-3 fish fertilizer tocompensate for the microbial decomposition of the pinebark. Plants in group B received fertilizer twice a weekusing the same schedule as in Trial 1. Greenhouse tem-peratures ranged from 24 to 32 degrees C.
Plants were grown until August 30, 2003. Fresh and dryweights were recorded for 10 randomly selectedmarigold plants per treatment. Height and dry weightswere recorded for 10 randomly selected basil plants.
ResultsFish waste sample test resultsLake Superior lake whitefish waste material exceededthe FDA action level of 0.3 ppm for both chlordane anddieldrin (Figure 13). Lake Huron lake whitefish wastematerial nearly reached the action level for dieldrin, butno chlordane was detected. These pesticides were notdetected in Lake Michigan lake whitefish waste. LakeSuperior lake whitefish waste contained almost seventimes the FDA action level for chlordane and over threetimes the FDA action level for dieldrin. None of the lakewhitefish waste material from lakes Superior, Huron andMichigan exceeded the FDA action level of 2.0 ppm forPCBs (Figure 14).
The lake whitefish waste material from lakes Superior,Huron and Michigan did not exceed the FDA action levelof 5.0 ppm for toxaphene and DDT (Figure 15).Extremely low levels of toxaphene were found in lakewhitefish waste from lakes Superior, Huron andMichigan. DDT was detected in lake whitefish wastefrom lakes Superior and Huron; none was detected inthe Lake Michigan samples. None of the lake whitefishwaste material from lakes Superior, Huron and Michiganexceeded the FDA action level of 1.0 ppm or theMichigan action level of 0.5 ppm for mercury (Figure16).
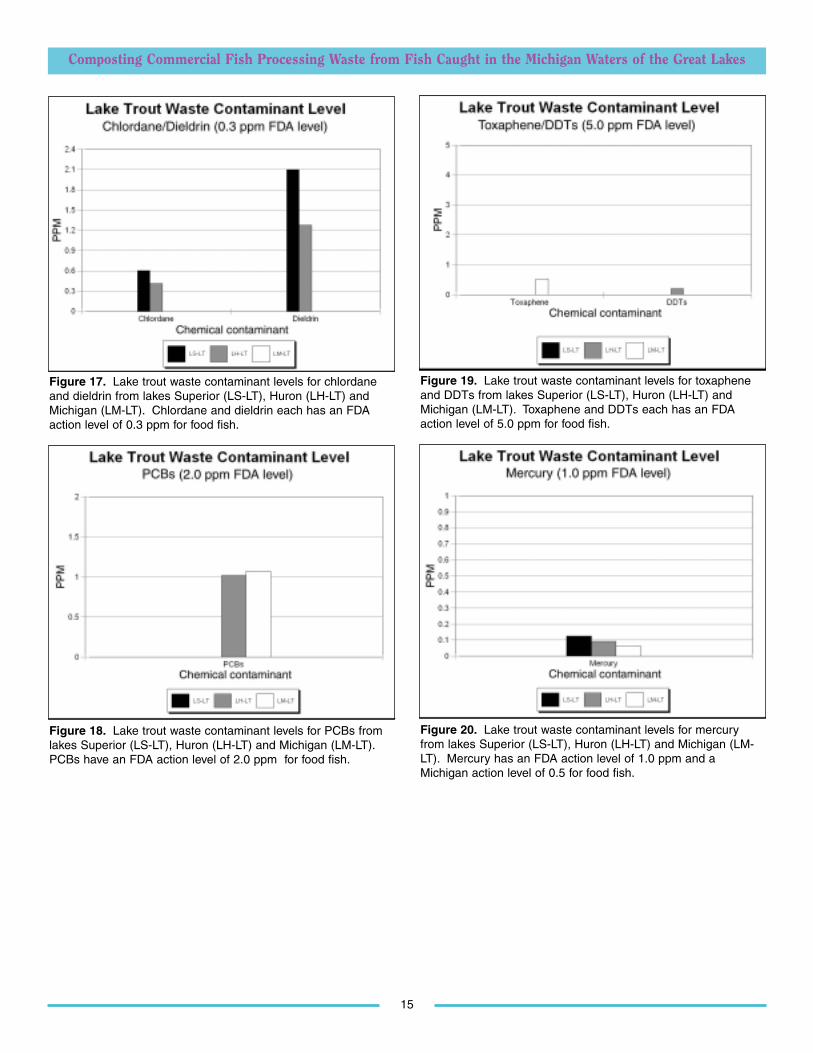
Lakes Superior and Huron lake trout waste materialexceeded the FDA action level of 0.3 ppm for chlordaneand dieldrin (Figure 17). These pesticides were notdetected in Lake Michigan lake trout waste. LakeSuperior lake trout waste was double the FDA actionlevel for chlordane and seven times the FDA action levelfor dieldrin. Although the Lake Huron lake trout wastejust exceeded the FDA action level for chlordane, it con-tained over four times the action level for dieldrin. Noneof the lake trout waste material from lakes Superior,Huron and Michigan exceeded the FDA action level of2.0 ppm for PCBs (Figure 18). Only Lake Superior laketrout waste had no detection of PCBs.
The lake trout waste material from lakes Superior,Huron and Michigan did not exceed the FDA action levelof 5.0 ppm for toxaphene and DDTs (Figure 19). Lowlevels of toxaphene and DDT were found in lake troutwaste from Lake Michigan and Lake Huron, respectively.Toxaphene was not detected in lake trout waste fromlakes Superior and Huron. DDT was not detected in laketrout waste from lakes Superior and Michigan. None ofthe lake trout waste material from lakes Superior,Huron and Michigan exceeded the FDA action level of1.0 ppm or the Michigan action level of 0.5 ppm formercury (Figure 20).

Composting Commercial Fish Processing Waste from Fish Caught in the Michigan Waters of the Great Lakes
14
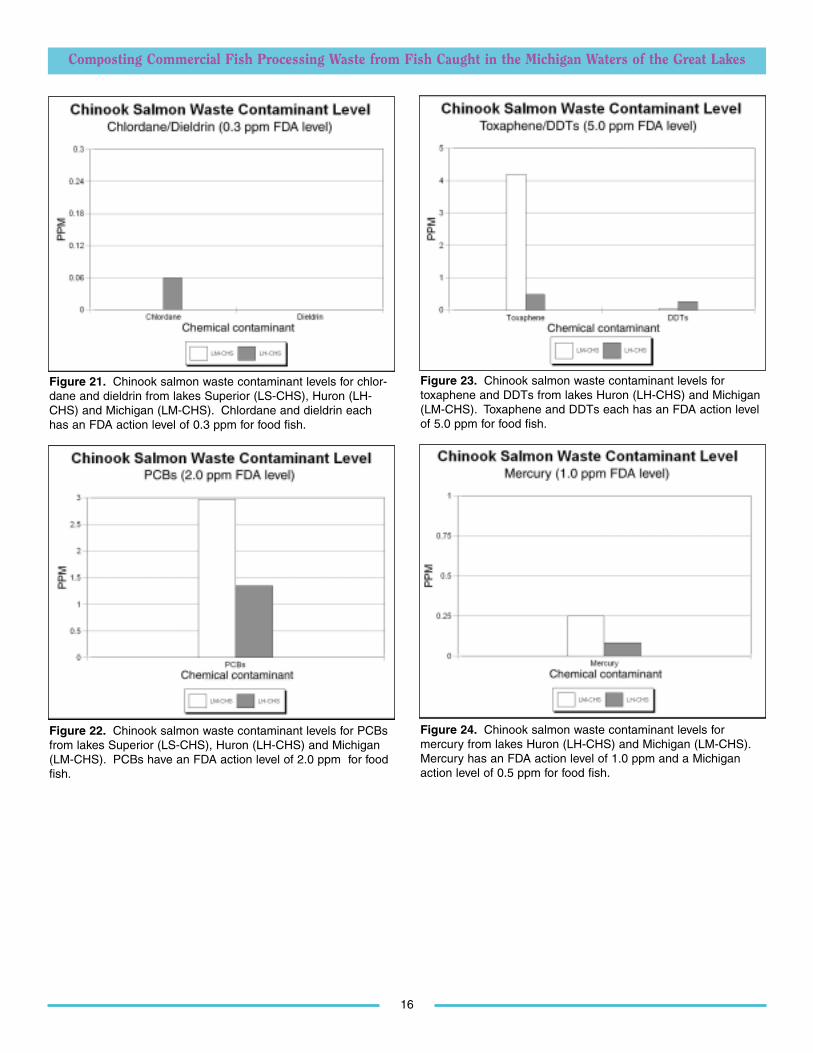
Lakes Michigan and Huron chinook salmon waste didnot exceed the FDA action level of 0.3 ppm for chlor-dane and dieldrin (Figure 21). These pesticides were notdetected in Lake Michigan chinook salmon waste.Dieldrin was not detected in Lake Huron chinooksalmon waste; a trace amount of chlordane was. LakeMichigan chinook salmon waste exceeded the FDAaction level of 2.0 ppm for PCBs; chinook salmon wastefrom Lake Huron was below the action level (Figure 22).
Lakes Michigan and Huron chinook salmon waste didnot exceed the FDA action level of 5.0 ppm fortoxaphene and DDT (Figure 23). Chinook salmon wastefrom Lake Michigan nearly approached the FDA actionlevel for toxaphene. None of the chinook salmon wastefrom Lakes Michigan and Huron exceeded the FDAaction level of 1.0 ppm or the Michigan action level of0.5 ppm for mercury (Figure 24).
Figure 13. Lake whitefish waste contaminant levels for chlordane and dieldrin from lakes Superior (LS-WF), Huron (LH-WF) and Michigan (LM-WF). Chlordane and dieldrin each hasan FDA action level of 0.3 ppm for food fish.
Figure 14. Lake whitefish waste contaminant levels for PCBsfrom lakes Superior (LS-WF), Huron (LH-WF) and Michigan(LM-WF). PCBs have an FDA action level of 2.0 ppm for foodfish.
Figure 15. Lake whitefish waste contaminant levels for toxaphene and DDTs from lakes Superior (LS-WF), Huron(LH-WF) and Michigan (LM-WF). Toxaphene and DDTs eachhas an FDA action level of 5.0 ppm for food fish.
Figure 16. Lake whitefish waste contaminant levels for mercuryfrom lakes Superior (LS-WF), Huron (LH-WF) and Michigan(LM-WF). Mercury has an FDA action level of 1.0 ppm and aMichigan action level of 0.5 for food fish.
Composting Commercial Fish Processing Waste from Fish Caught in the Michigan Waters of the Great Lakes
15
Figure 17. Lake trout waste contaminant levels for chlordaneand dieldrin from lakes Superior (LS-LT), Huron (LH-LT) andMichigan (LM-LT). Chlordane and dieldrin each has an FDAaction level of 0.3 ppm for food fish.
Figure 18. Lake trout waste contaminant levels for PCBs fromlakes Superior (LS-LT), Huron (LH-LT) and Michigan (LM-LT).PCBs have an FDA action level of 2.0 ppm for food fish.
Figure 19. Lake trout waste contaminant levels for toxapheneand DDTs from lakes Superior (LS-LT), Huron (LH-LT) andMichigan (LM-LT). Toxaphene and DDTs each has an FDAaction level of 5.0 ppm for food fish.
Figure 20. Lake trout waste contaminant levels for mercuryfrom lakes Superior (LS-LT), Huron (LH-LT) and Michigan (LM-LT). Mercury has an FDA action level of 1.0 ppm and aMichigan action level of 0.5 for food fish.
Composting Commercial Fish Processing Waste from Fish Caught in the Michigan Waters of the Great Lakes
16
Figure 21. Chinook salmon waste contaminant levels for chlor-dane and dieldrin from lakes Superior (LS-CHS), Huron (LH-CHS) and Michigan (LM-CHS). Chlordane and dieldrin eachhas an FDA action level of 0.3 ppm for food fish.
Figure 22. Chinook salmon waste contaminant levels for PCBsfrom lakes Superior (LS-CHS), Huron (LH-CHS) and Michigan(LM-CHS). PCBs have an FDA action level of 2.0 ppm for foodfish.
Figure 23. Chinook salmon waste contaminant levels fortoxaphene and DDTs from lakes Huron (LH-CHS) and Michigan(LM-CHS). Toxaphene and DDTs each has an FDA action levelof 5.0 ppm for food fish.
Figure 24. Chinook salmon waste contaminant levels for mercury from lakes Huron (LH-CHS) and Michigan (LM-CHS).Mercury has an FDA action level of 1.0 ppm and a Michiganaction level of 0.5 ppm for food fish.

Composting Commercial Fish Processing Waste from Fish Caught in the Michigan Waters of the Great Lakes
17
Plant growth results
Trial 1
Statistical analysis was applied using multiple regressionand analysis of variance with Statgraphics 3.0(Manugistics). Plants in the fertilized treatments weresignificantly taller than those in corresponding non-fertilized treatments (Table 3). Non-fertilized treatment5, was significantly taller than the other plants in thegroup.
No significant differences were noted in dry weights andfresh weights of the plants within and between treat-ments.
Tissue analysis of the basil plants showed similar fertilitylevels between non-fertilized and fertilized treatments(tables 4-5).
It was observed at the end of week 6, in the 30 percentcompost level only, that some senescing of the foliageand stems occurred on the uppermost 4 to 5 inches ofthe basil plants. The cause of the distortion was notobvious from the symptoms.
Plant heights Plant fresh weights Plant dry weights
Non-fertilized, Fertilized, Non-fertilized, Fertilized, Non-fertilized, Fertilized,average average average average average average
(cm) (cm) (grams) (grams) (grams) (grams)
Control 66.40a 81.80c 119.24a 170.56a 28.82a 35.65a
Trt 1 67.45a 84.10c 103.10a 162.00a 26.90a 33.92a(10% compost)
Trt 2 63.10a 85.20c 108.20a 159.82a 26.99a 36.75a(15% compost)
Trt 3 65.55a 82.20c 136.83a 153.56a 34.71a 36.92a(20% compost)
Trt 4 68.40a 81.40c 127.54a 164.94a 33.18a 35.22a(25% compost)
Trt 5 71.70b 80.60c 117.72a 188.67a 34.00a 38.81a(30% compost)
P<0.05 for least significant difference.
Table 3. Trial 1 basil plant heights, fresh weights and dry weights.
Composting Commercial Fish Processing Waste from Fish Caught in the Michigan Waters of the Great Lakes
18
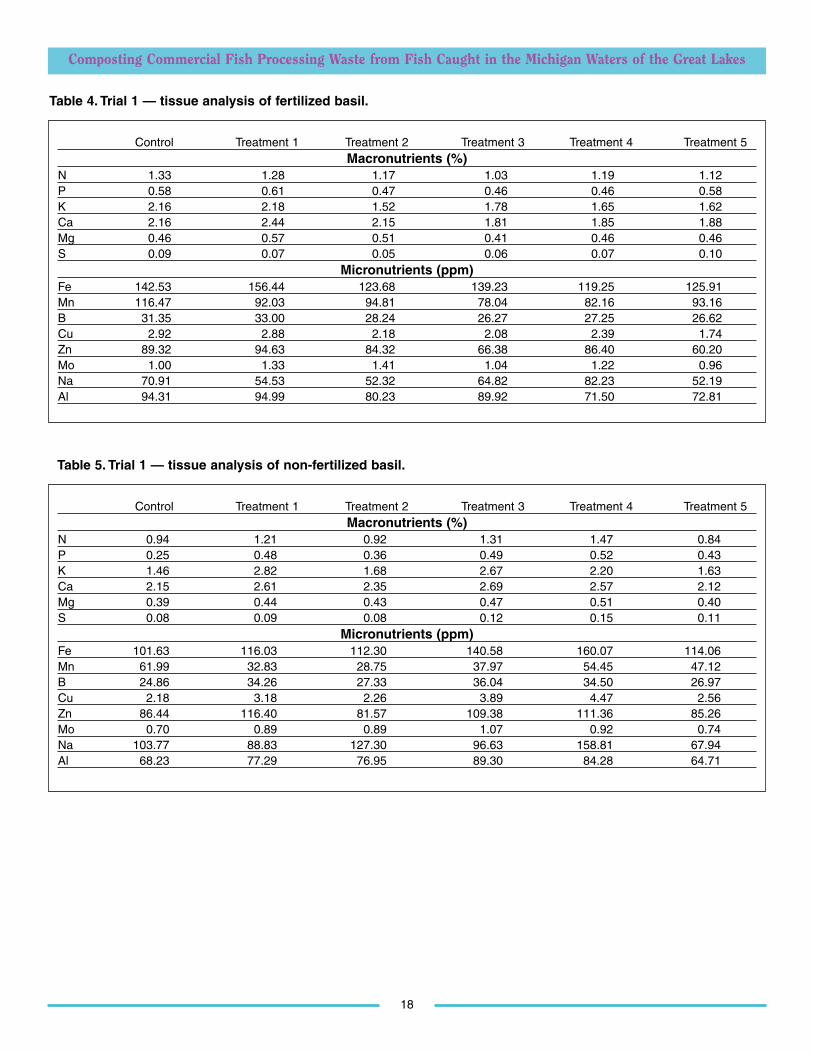
Table 4. Trial 1 — tissue analysis of fertilized basil.
Control Treatment 1 Treatment 2 Treatment 3 Treatment 4 Treatment 5Macronutrients (%)
N 1.33 1.28 1.17 1.03 1.19 1.12P 0.58 0.61 0.47 0.46 0.46 0.58K 2.16 2.18 1.52 1.78 1.65 1.62Ca 2.16 2.44 2.15 1.81 1.85 1.88Mg 0.46 0.57 0.51 0.41 0.46 0.46S 0.09 0.07 0.05 0.06 0.07 0.10
Micronutrients (ppm)Fe 142.53 156.44 123.68 139.23 119.25 125.91Mn 116.47 92.03 94.81 78.04 82.16 93.16B 31.35 33.00 28.24 26.27 27.25 26.62Cu 2.92 2.88 2.18 2.08 2.39 1.74Zn 89.32 94.63 84.32 66.38 86.40 60.20Mo 1.00 1.33 1.41 1.04 1.22 0.96Na 70.91 54.53 52.32 64.82 82.23 52.19Al 94.31 94.99 80.23 89.92 71.50 72.81
Table 5. Trial 1 — tissue analysis of non-fertilized basil.
Control Treatment 1 Treatment 2 Treatment 3 Treatment 4 Treatment 5Macronutrients (%)
N 0.94 1.21 0.92 1.31 1.47 0.84P 0.25 0.48 0.36 0.49 0.52 0.43K 1.46 2.82 1.68 2.67 2.20 1.63Ca 2.15 2.61 2.35 2.69 2.57 2.12Mg 0.39 0.44 0.43 0.47 0.51 0.40S 0.08 0.09 0.08 0.12 0.15 0.11
Micronutrients (ppm)Fe 101.63 116.03 112.30 140.58 160.07 114.06Mn 61.99 32.83 28.75 37.97 54.45 47.12B 24.86 34.26 27.33 36.04 34.50 26.97Cu 2.18 3.18 2.26 3.89 4.47 2.56Zn 86.44 116.40 81.57 109.38 111.36 85.26Mo 0.70 0.89 0.89 1.07 0.92 0.74Na 103.77 88.83 127.30 96.63 158.81 67.94Al 68.23 77.29 76.95 89.30 84.28 64.71
Composting Commercial Fish Processing Waste from Fish Caught in the Michigan Waters of the Great Lakes
19
Results — Trial 2No plant growth data were gathered for this trial.However, it was observed at the end of week 3 that thesalmon compost-amended plants were a darker greenthan the other plants grown in Trials 1 and 3.
Results — Trial 3There were two experiments in Trial 3.
Basil (Experiment 1)Height and dry weight of basil grown in a 90 percentbark-based potting medium/10 percent lakewhitefish/lake trout compost mix were compared withthe height and dry weight of basil grown in a 90 percentprofessional growing medium/10 percent lakewhitefish/lake trout compost mix (this mix is treatment1 of Trial 1).
The height and dry weight in the basil plants were lesswhen the bark/compost potting soil was used (Table 6).This was observed within two weeks of planting and wasconsistent throughout the trial. This may have beendue to the activity of microorganisms in the bark/com-post potting soil mix that use nitrogen to break downthe bark and therefore competed with the plants for theavailable nitrogen. After the plants in Trial 3 were top-dressed with pelletized fish fertilizer, two weeks passedbefore there was noticeable plant response. This delay inplant response might have been responsible for the finaldifferences in height and dry weight noted between thebasil in Trial 1 and Trial 3.
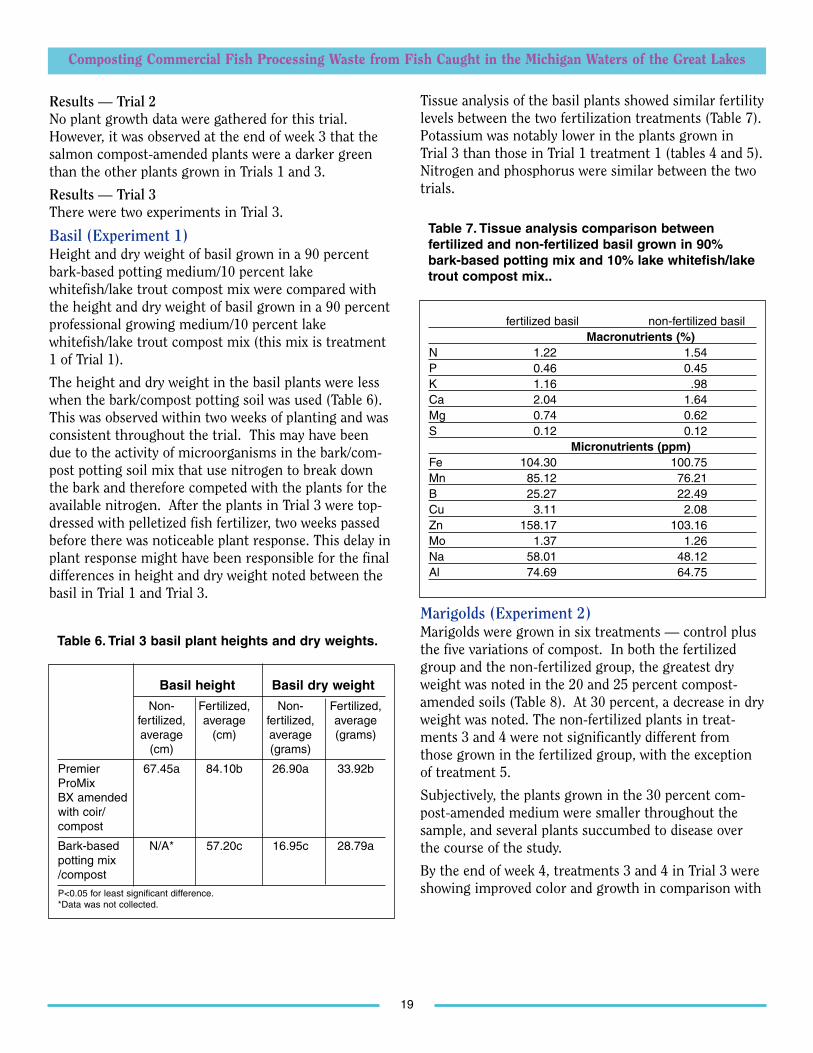
Tissue analysis of the basil plants showed similar fertilitylevels between the two fertilization treatments (Table 7).Potassium was notably lower in the plants grown inTrial 3 than those in Trial 1 treatment 1 (tables 4 and 5).Nitrogen and phosphorus were similar between the twotrials.
fertilized basil non-fertilized basilMacronutrients (%)
N 1.22 1.54P 0.46 0.45K 1.16 .98Ca 2.04 1.64Mg 0.74 0.62S 0.12 0.12
Micronutrients (ppm)Fe 104.30 100.75Mn 85.12 76.21B 25.27 22.49Cu 3.11 2.08Zn 158.17 103.16Mo 1.37 1.26Na 58.01 48.12Al 74.69 64.75
Table 7. Tissue analysis comparison between fertilized and non-fertilized basil grown in 90%bark-based potting mix and 10% lake whitefish/laketrout compost mix..
Basil height Basil dry weight
Non- Fertilized, Non- Fertilized,fertilized, average fertilized, average average (cm) average (grams)
(cm) (grams)
Premier 67.45a 84.10b 26.90a 33.92bProMix BX amended with coir/compost
Bark-based N/A* 57.20c 16.95c 28.79apotting mix /compost
P<0.05 for least significant difference.*Data was not collected.
Table 6. Trial 3 basil plant heights and dry weights.
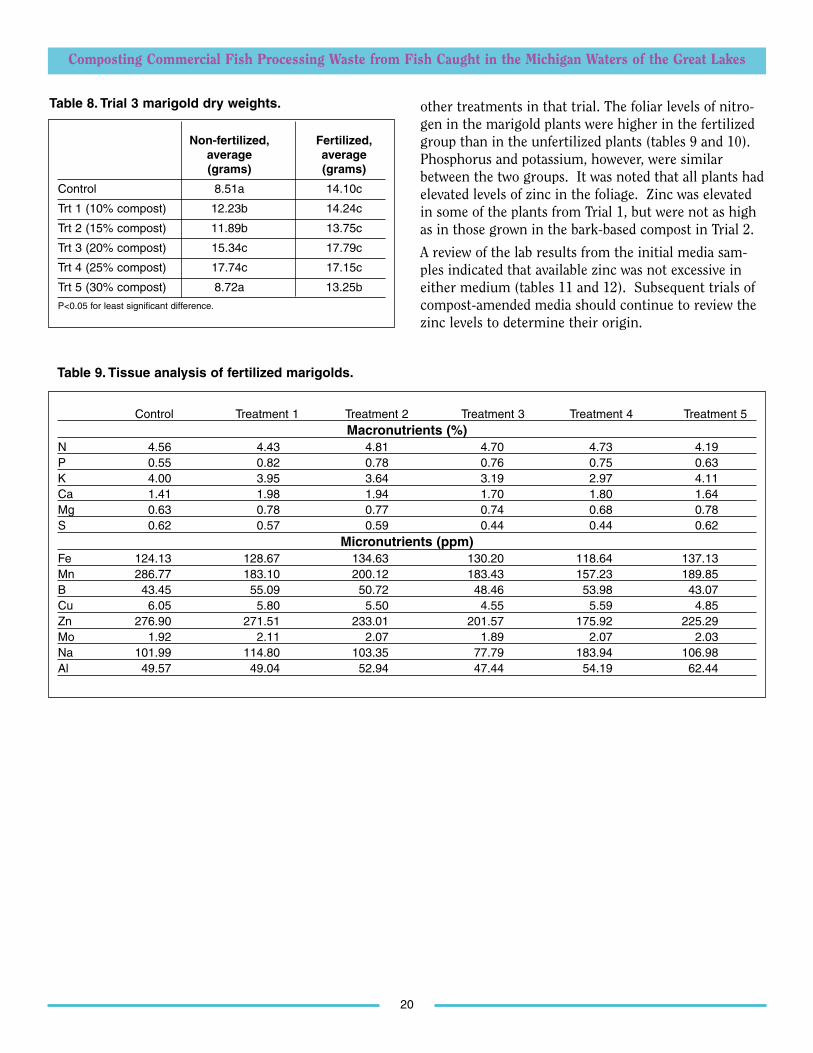
Marigolds (Experiment 2)Marigolds were grown in six treatments — control plusthe five variations of compost. In both the fertilizedgroup and the non-fertilized group, the greatest dryweight was noted in the 20 and 25 percent compost-amended soils (Table 8). At 30 percent, a decrease in dryweight was noted. The non-fertilized plants in treat-ments 3 and 4 were not significantly different fromthose grown in the fertilized group, with the exceptionof treatment 5.
Subjectively, the plants grown in the 30 percent com-post-amended medium were smaller throughout thesample, and several plants succumbed to disease overthe course of the study.
By the end of week 4, treatments 3 and 4 in Trial 3 wereshowing improved color and growth in comparison with
Non-fertilized, Fertilized,average average (grams) (grams)
Control 8.51a 14.10c
Trt 1 (10% compost) 12.23b 14.24c
Trt 2 (15% compost) 11.89b 13.75c
Trt 3 (20% compost) 15.34c 17.79c
Trt 4 (25% compost) 17.74c 17.15c
Trt 5 (30% compost) 8.72a 13.25b
P<0.05 for least significant difference.
Composting Commercial Fish Processing Waste from Fish Caught in the Michigan Waters of the Great Lakes
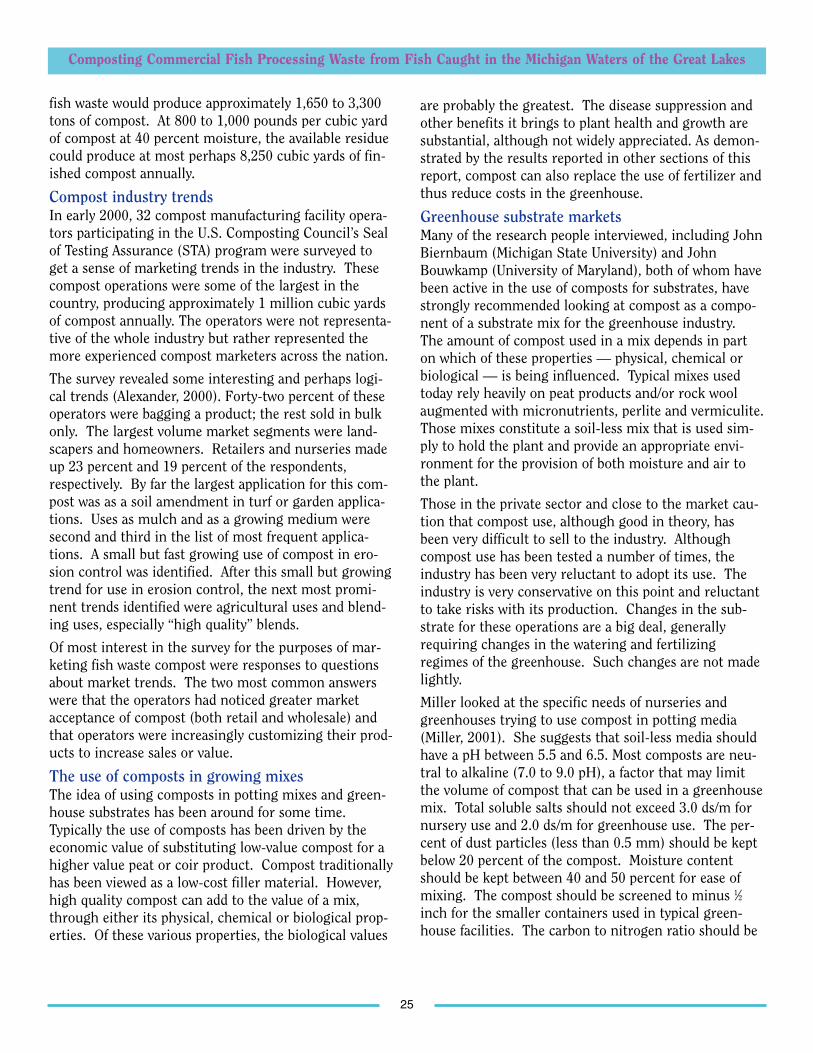
20
other treatments in that trial. The foliar levels of nitro-gen in the marigold plants were higher in the fertilizedgroup than in the unfertilized plants (tables 9 and 10).Phosphorus and potassium, however, were similarbetween the two groups. It was noted that all plants hadelevated levels of zinc in the foliage. Zinc was elevatedin some of the plants from Trial 1, but were not as highas in those grown in the bark-based compost in Trial 2.
A review of the lab results from the initial media sam-ples indicated that available zinc was not excessive ineither medium (tables 11 and 12). Subsequent trials ofcompost-amended media should continue to review thezinc levels to determine their origin.
Table 8. Trial 3 marigold dry weights.
Table 9. Tissue analysis of fertilized marigolds.
Control Treatment 1 Treatment 2 Treatment 3 Treatment 4 Treatment 5Macronutrients (%)
N 4.56 4.43 4.81 4.70 4.73 4.19P 0.55 0.82 0.78 0.76 0.75 0.63K 4.00 3.95 3.64 3.19 2.97 4.11Ca 1.41 1.98 1.94 1.70 1.80 1.64Mg 0.63 0.78 0.77 0.74 0.68 0.78S 0.62 0.57 0.59 0.44 0.44 0.62
Micronutrients (ppm)Fe 124.13 128.67 134.63 130.20 118.64 137.13Mn 286.77 183.10 200.12 183.43 157.23 189.85B 43.45 55.09 50.72 48.46 53.98 43.07Cu 6.05 5.80 5.50 4.55 5.59 4.85Zn 276.90 271.51 233.01 201.57 175.92 225.29Mo 1.92 2.11 2.07 1.89 2.07 2.03Na 101.99 114.80 103.35 77.79 183.94 106.98Al 49.57 49.04 52.94 47.44 54.19 62.44

Composting Commercial Fish Processing Waste from Fish Caught in the Michigan Waters of the Great Lakes
21
Table 10. Tissue analysis of non-fertilized marigolds.
Control Treatment 1 Treatment 2 Treatment 3 Treatment 4 Treatment 5Macronutrients (%)
N * 3.97 4.22 3.81 3.27 *P 0.51 0.67 0.64 0.56 0.57 0.39K 4.26 3.63 3.32 3.32 2.61 4.35Ca 1.88 1.84 2.02 2.09 2.24 1.75Mg 0.80 0.98 1.02 0.97 0.93 0.82S 0.79 0.78 0.75 0.72 0.65 0.59
Micronutrients (ppm)Fe 130.68 134.36 122.63 128.23 111.52 140.12Mn 367.75 152.03 135.55 104.60 99.83 313.64B 52.95 48.85 34.57 38.83 35.74 37.62Cu 8.44 8.07 5.59 5.84 4.47 5.45Zn 355.79 311.32 198.28 182.43 134.83 258.53Mo 2.13 2.66 2.00 2.15 2.03 1.97Na 110.64 122.12 65.90 94.66 73.68 108.07Al 83.80 69.53 53.23 66.59 53.04 65.52
* The lab did not receive enough tissue to determine nitrogen content.
Contaminant concentrations in compost and basil plantsThe fish waste compost generated from the lake white-fish and lake trout waste stream did not have anyreportable levels of halogenated hydrocarbons. Only verylow levels of DDT showed up in the fish waste compostthat was generated from the chinook salmon wastestream (Figure 25). Mercury levels in fish waste compost from lake white-fish/lake trout waste showed a slight increase whencompared with the original waste stream. Fish wastecompost generated from chinook salmon waste showed
a decrease in mercury levels compared with the originalwaste stream. None of the finished fish waste compostexceeded the FDA action level of 1.0 ppm or theMichigan action level of 0.5 ppm for mercury (Figure26).
Chlordane, dieldrin, toxaphene, DDE, DDD, DDT andPCB were not detected in the basil plant tissue. Mercurylevels were well below the FDA action level of 1.0 ppmand the Michigan action level of 0.5 ppm for food fish(Figure 27).

Composting Commercial Fish Processing Waste from Fish Caught in the Michigan Waters of the Great Lakes
22
Table 11. Trial 1 — Media analysis.
Control Treatment 1 Treatment 2 Treatment 3 Treatment 4 Treatment 5pH 5.16 5.34 5.09 5.05 4.99 5.05EC 1.23 1.40 1.72 1.53 1.63 1.40
Macronutrients (ppm)NO3-N 61.70 51.50 115.30 100.80 113.80 94.70NH4-N ND ND ND ND ND NDP 20.22 19.16 25.42 20.36 20.73 20.82K 123.72 200.93 179.87 147.48 170.30 149.03Ca 90.81 66.52 131.74 116.64 119.88 101.07Mg 34.16 27.25 49.11 42.82 42.59 36.88SO4-S 75.77 82.05 83.52 69.54 59.52 53.62
Micronutrients (ppm)Fe 0.89 0.86 0.92 0.81 0.76 0.66Mn 0.21 0.43 0.07 0.14 0.29 0.09B 0.19 0.18 0.24 0.23 0.24 0.22Cu 0.07 0.08 0.07 0.07 0.08 0.07Zn 0.30 0.40 0.18 0.14 0.11 0.09Mo 0.03 0.03 0.02 0.02 0.02 0.03Na 35.59 62.13 51.47 44.34 52.15 45.06Al 0.46 0.41 0.48 0.48 0.54 0.48Cl 32.00 86.00 45.00 39.00 46.00 42.00Si 6.51 4.67 9.51 7.33 7.95 7.68
Table 12. Trial 3 — Media analysis.
Control Treatment 1 Treatment 2 Treatment 3 Treatment 4 Treatment 5pH 4.76 5.13 5.09 4.55 4.63 4.50EC 0.19 0.30 0.23 0.75 0.81 1.33
Macronutrients (ppm)NO3-N ND ND ND 45.20 46.50 99.90NH4-N ND ND ND ND ND 0.40P 2.21 9.88 5.87 18.74 19.18 25.25K 23.08 42.03 30.18 94.73 104.05 147.32Ca 7.08 13.53 8.70 46.20 47.62 85.94Mg 4.78 9.55 6.27 27.81 27.14 44.61SO4-S 7.79 14.11 8.75 11.59 12.45 18.39
Micronutrients (ppm)Fe 0.64 0.41 0.34 0.27 0.33 0.26Mn 0.19 0.16 0.14 1.17 1.01 1.61B 0.12 0.13 0.12 0.25 0.25 0.29Cu 0.08 0.07 0.07 0.07 0.07 0.05Zn ND 0.02 0.01 0.06 0.05 0.06Mo 0.02 0.03 0.02 0.02 0.03 0.02Na 16.47 21.46 20.25 29.89 35.36 44.98Al 1.84 1.24 1.20 1.65 1.62 1.43Cl 12.00 30.00 30.00 29.00 35.00 43.00Si 12.06 10.53 9.94 5.56 6.50 5.84

Composting Commercial Fish Processing Waste from Fish Caught in the Michigan Waters of the Great Lakes
23
Figure 25. Fish waste compost contaminant level for DDTsfrom lake whitefish/lake trout waste (WF/LT) and chinook salmonwaste (CHS). DDTS have an FDA action level of 5.0 PPM forfood fish.
Figure 26. Fish waste compost contaminant level for mercuryfrom lake whitefish/lake trout waste (WF/LT) and chinook salmonwaste (CHS). Mercury has an FDA action level of 1.0 ppm anda Michigan action level of 0.5 ppm for food fish.
Figure 27. Contaminant levels for mercury from plants grown invarious amounts of fish waste compost. Mercury has an FDAaction level of 1.0 ppm and a Michigan action level of 0.5 ppmfor food fish.

Composting Commercial Fish Processing Waste from Fish Caught in the Michigan Waters of the Great Lakes
24
Markets for Composted Fish WasteMarket information sourcesThe market information reflected in this section wasgathered through a variety of methods. Both telephoneand in-person interviews were conducted with a numberof consultants and university people active in the field.Two trade shows (the Great Lakes Fruit, Vegetable andFarm Market Expo and the Great Lakes Trade Expo ofthe Michigan Nursery and Landscape Association) wereattended to complete interviews with suppliers to theindustry and users of some of its products, especiallyorchard growers and organic farmers. Limited storesurvey work was done. Much of the information con-cerning products available in the market was obtainedfrom Web searches. This work also builds on a reporton compost markets completed by Northern Initiativesin November 2000 (Cambier and Rector, 2000).
Project historyThe disposal or reuse of fish processing waste has longbeen a challenge for the fish processing industry inMichigan. These problems have been especially acute innorthern Michigan in recent years because landfills andmunicipal sewage treatment systems have been illequipped or otherwise inappropriate solutions for thisdisposal. Some processors have recently developed mar-kets in the liquid fertilizer industry that have helpedalleviate these problems. These markets, however,require fish processors to incur the costs of storage,especially refrigeration costs, as waste is accumulatedfor transport. In the off-season, fish waste is generallytaken to a landfill for lack of any better solution. In2004, fish processors in Michigan’s eastern UpperPeninsula (U.P.) paid landfills $60 per ton to take fishwaste.
Potential marketsThe opportunity to market fish waste/wood residue com-post presents some unique challenges as well as oppor-tunities. The limited amount of fish waste available tocompost could restrain the size of a composting opera-tion and thus its economic viability. One way aroundthis problem is to make the fish compost product acomponent of a larger waste refining and/or compostingoperation. That is a possibility, given the interest inmaking better use of wood residues in the U.P. as well asinterest in farm and food residue composting.
On the other hand, limiting one’s thinking about a com-post product derived from specific, well-defined feed-stocks (i.e., fish and wood) rather than a compost prod-
uct that might be produced from a waste stream thatwould be less well characterized (such as a municipalsolid waste stream) provides an advantage — the charac-teristics and quality of such a compost product can bevery predictable and thus suitable for some market nich-es. The challenge of this current market research is tofind the most valuable potential market niche for such aproduct.
In a report on compost opportunities produced byNorthern Initiatives (Rector and Cambier, 2000), it wasclear that marketing a simple compost product would bea challenging task. Although the National Bark and SoilProducers Association state the annual growth of thesoil market (including compost, topsoil and growingmedia) is between 8 and 10 percent, most productslabeled as compost are not highly regarded in the mar-ket. Such products sold by mass merchandisers areusually of low quality and sold on price, and discussionswith people in the market confirm this evaluation.Without exception the advice has been to use compostin combination with other materials to produce a grow-ing mix or potting soil that meets the more demandingspecifications of those uses and for which the consumeris accustomed to paying a higher price.
Volume estimatesTo get a handle on the volume limits of a fish compostproduct, rough estimates were prepared of the quanti-ties of fish waste compost that could be generated andthe volume demands of at least one specific market.These estimates start out with the volumes of fishresidues currently available in the Straits of Mackinacarea. No effort has been made to suggest how much ofthis volume might be available to a composter. There isvery little known about compost markets that generateany cash flow for the processors. This residue is all dis-posed of at some cost. A business model built on theability to pay even a minimal amount for this materialor at least provide a no-cost disposal option should beable to compete effectively for the available supply.
Estimates of the volume of fish residue that might bediverted to a composting operation in the Straits ofMackinac area (between the Upper Peninsula and theLower Peninsula, connecting Lake Michigan and LakeHuron) run from 3 million to 5 million pounds annual-ly. Charles Gould with MSU Extension (personal com-munication, 2002) estimates that 3 million pounds of
Composting Commercial Fish Processing Waste from Fish Caught in the Michigan Waters of the Great Lakes
25
fish waste would produce approximately 1,650 to 3,300tons of compost. At 800 to 1,000 pounds per cubic yardof compost at 40 percent moisture, the available residuecould produce at most perhaps 8,250 cubic yards of fin-ished compost annually.
Compost industry trendsIn early 2000, 32 compost manufacturing facility opera-tors participating in the U.S. Composting Council’s Sealof Testing Assurance (STA) program were surveyed toget a sense of marketing trends in the industry. Thesecompost operations were some of the largest in thecountry, producing approximately 1 million cubic yardsof compost annually. The operators were not representa-tive of the whole industry but rather represented themore experienced compost marketers across the nation.
The survey revealed some interesting and perhaps logi-cal trends (Alexander, 2000). Forty-two percent of theseoperators were bagging a product; the rest sold in bulkonly. The largest volume market segments were land-scapers and homeowners. Retailers and nurseries madeup 23 percent and 19 percent of the respondents,respectively. By far the largest application for this com-post was as a soil amendment in turf or garden applica-tions. Uses as mulch and as a growing medium weresecond and third in the list of most frequent applica-tions. A small but fast growing use of compost in ero-sion control was identified. After this small but growingtrend for use in erosion control, the next most promi-nent trends identified were agricultural uses and blend-ing uses, especially “high quality” blends.
Of most interest in the survey for the purposes of mar-keting fish waste compost were responses to questionsabout market trends. The two most common answerswere that the operators had noticed greater marketacceptance of compost (both retail and wholesale) andthat operators were increasingly customizing their prod-ucts to increase sales or value.
The use of composts in growing mixesThe idea of using composts in potting mixes and green-house substrates has been around for some time.Typically the use of composts has been driven by theeconomic value of substituting low-value compost for ahigher value peat or coir product. Compost traditionallyhas been viewed as a low-cost filler material. However,high quality compost can add to the value of a mix,through either its physical, chemical or biological prop-erties. Of these various properties, the biological values
are probably the greatest. The disease suppression andother benefits it brings to plant health and growth aresubstantial, although not widely appreciated. As demon-strated by the results reported in other sections of thisreport, compost can also replace the use of fertilizer andthus reduce costs in the greenhouse.
Greenhouse substrate marketsMany of the research people interviewed, including JohnBiernbaum (Michigan State University) and JohnBouwkamp (University of Maryland), both of whom havebeen active in the use of composts for substrates, havestrongly recommended looking at compost as a compo-nent of a substrate mix for the greenhouse industry.The amount of compost used in a mix depends in parton which of these properties — physical, chemical orbiological — is being influenced. Typical mixes usedtoday rely heavily on peat products and/or rock woolaugmented with micronutrients, perlite and vermiculite.Those mixes constitute a soil-less mix that is used sim-ply to hold the plant and provide an appropriate envi-ronment for the provision of both moisture and air tothe plant.
Those in the private sector and close to the market cau-tion that compost use, although good in theory, hasbeen very difficult to sell to the industry. Althoughcompost use has been tested a number of times, theindustry has been very reluctant to adopt its use. Theindustry is very conservative on this point and reluctantto take risks with its production. Changes in the sub-strate for these operations are a big deal, generallyrequiring changes in the watering and fertilizingregimes of the greenhouse. Such changes are not madelightly.
Miller looked at the specific needs of nurseries andgreenhouses trying to use compost in potting media(Miller, 2001). She suggests that soil-less media shouldhave a pH between 5.5 and 6.5. Most composts are neu-tral to alkaline (7.0 to 9.0 pH), a factor that may limitthe volume of compost that can be used in a greenhousemix. Total soluble salts should not exceed 3.0 ds/m fornursery use and 2.0 ds/m for greenhouse use. The per-cent of dust particles (less than 0.5 mm) should be keptbelow 20 percent of the compost. Moisture contentshould be kept between 40 and 50 percent for ease ofmixing. The compost should be screened to minus 1⁄2inch for the smaller containers used in typical green-house facilities. The carbon to nitrogen ratio should be
Composting Commercial Fish Processing Waste from Fish Caught in the Michigan Waters of the Great Lakes
26
below 25:1 to avoid nitrogen tie-up. Bioassays orSolvita® tests (6 or above) are commonly accepted.General guidelines for microflora used by labs that spe-cialize in such testing should be used. Labs that analyzecompost can be found in Appendix 2.
There has been concern in some quarters about theindustry reliance on peat products and the effect on theenvironment of peat mining operations. Unlike peat,compost is a renewable resource and its use does notinvolve the environmental impacts associated with mining peat bogs.
Regional substrate marketsBecause transportation is an important element in thecost of bringing a substrate product to market in theU.P., regional market opportunities were investigated.They included the use of abandoned mines as high-security growing chambers for the pharmaceuticalindustry and the market for flower bed amendments inresidential and resort industry markets, especially onMackinac Island.
A pilot project underway at SubTerra’s White Pine facili-ty is investigating the use of compost as a component ofa greenhouse mix to grow specialty crops in an under-ground growth chamber (i.e., high-tech greenhouse) forthe pharmaceutical industry. Recent changes in stateregulations that make it easier to access mines and mar-ket interest in SubTerra’s growing services make itmuch more likely that the White Pine facility will beexpanded to a commercial scale in 2005. Very roughearly estimates of the demand for compost at the WhitePine facility suggest that, at full development, 3-galloncontainers cycled four times a year would use 45,170cubic yards of material. If that material were 20 percentcompost, the potential use of compost at that facilitywould be in the vicinity of 9,000 cubic yards annually.
An interview with the SubTerra parent company inSaskatoon, Sask., reveals that it currently uses a mixthat is 50 percent BX peat and 50 percent coconut coir.The BX peat product is a mix of peat, vermiculite, limeand micronutrients supplied by Premiere. This mix,once expanded, costs $57 a cubic yard (Canadian dollars)or $43.60 (U.S. dollars). A web survey found that theretail price for expanded Premier Pro BX for garden usewas as high as $134.81/cy.
In addition to the costs of peat and coir, a large operatormust add the cost of labor, space, energy and equipmentto prepare the mix. As the Canadian facility has expand-ed in the past year, it has found it increasingly difficultto keep up with the substrate demand. This is likely to
be a problem at SubTerra within the next year, creatinga market opportunity for either compost as a componentof a mix or for a custom mix prepared off site. The com-pany will likely be very interested in better material-handling methods than those being used at this time asit grows in size. The use of appropriate reusable con-tainers and perhaps automated growing container prepa-ration will be important considerations for a supplier ofsubstrate.
Currently, the Canadian operation pasteurizes some ofthe mix it uses to assist in pest management. The mate-rial is taken to 70 degrees C for a period of 15 minutes.Their intent is not to sterilize the mix. Interviews sug-gest that the price range for greenhouse substrate in theUnited States ranges from around $35 per cubic yard atthe low end to more than $100 per cubic yard for themore demanding users.
Organic substrate marketsIn interviews with researchers in the field, includingBouwkamp and Biernbaum, the idea of using compostin a substrate mix for the organic industry has beenenthusiastically promoted. The new USDA compoststandards require vegetable growers to use vegetablestarts produced with organic materials if they are avail-able. There is a widely held expectation that the organicgreenhouse industry is on the cusp of substantialgrowth to meet market demand.
Most commercial starter mixes contain both syntheticfertilizers and wetting agents to help regulate moisture,improve aeration and increase nutrient availability.Synthetic fertilizers and, in most cases, wetting agentsare not allowed in the production of organic vegetablestarts. Composts are being touted for this use becausethey can provide superior wetting qualities to peat-basedmixes and they supply nutrients. Because of the benefi-cial microorganisms they contain, composts can alsoprovide protection from diseases and encourage plantgrowth.
However, lists of organic suppliers do not indicate muchcommercial production of organic starts in the Midwestat this time. Further interviews with the major organicvegetable growers in Michigan indicate that growers areproducing their own starts, usually with substrate pre-pared on the farm. Michigan Grower’s Products doesproduce a special mix for these growers, but the marketfor U.S. product seems to be limited. The desire to growtheir own starts is driven partly by a desire to produceunusual varieties that are generally not available exceptas seed. Thus selling to this market segment would

Composting Commercial Fish Processing Waste from Fish Caught in the Michigan Waters of the Great Lakes
27
probably require selling directly to farmers and alsoovercoming the farmers’ reluctance to purchase a pre-pared substrate mix.
The production of a compost product that can meet theUSDA Organic Standards §205 (http://www.ams.usda.gov/nop/NOP/standards/FullRegTextOnly.html) maypresent a challenge, but only because the standards arenot finalized. Thus far no standards have been set formercury in compost. Halogenated hydrocarbon contentmust be below the FDA’s action level, which this projecthas clearly demonstrated to be the case.
Consumer Potting MixesSeveral of the people interviewed in this effort suggestedthat a high-end, well-merchandised “boutique” pottingsoil for the consumer market could be very profitable. Alook at the market shows that a wide range of productsare available both in quality and price.
The Cooperative Extension horticulturists at ColoradoState University recently completed a trial of a numberof potting media that they found available from massmerchandisers, garden centers and nurseries. Theyfound some of the most popular brands resulted in pooror mixed plant growth. They also tried products thatwere labeled “compost” and found them to be poor per-formers.
In the market these products are available in manyprices and sizes. “Sam’s Choice Continuous FeedingPotting Mix” is sold for $2.50 for a 0.39-cubic-foot (10-quart) bag. This product was advertised with a fertilizervalue of 0.16-0.1-0.1. Another example, “Garden-VillePotting Soil,” was found advertised as the best-sellingpremium potting soil in Texas. It was priced at $5.99 for0.50 cubic foot.
A typical price point for a bagged product out of a massmerchandiser of this nature would be about $3 to $3.50for a 0.62-cubic-foot (16-quart) bag delivered to theretailer. Of this price, about $1 would go to the produc-er, or about $27 per cubic yard; about $1 would go intothe bagging and about another $1 into transportation.This margin should be improved upon through the mer-chandising of a high quality “boutique” brand throughnurseries and garden centers rather than mass mer-chandisers.
A composting operation run by the Department ofPublic Works (DPW) on Mackinac Island provides anexample of a regional market in the eastern UpperPeninsula. The DPW composts a mix of wastes, especial-ly horse manure, and sells the product in bulk to thepublic on the island. It produces 2,000 to 3,000 cubicyards a year, and all of it is sold for $8 to $10 a cubicyard. The production is managed as a system to disposeof waste rather than an operation to maximize profits.All transportation costs are borne by the user within asmall geographic area.
The production of a bagged high value product couldutilize a distributor on a regional basis. The CiscoCompanies of Indianapolis are one example of a distribu-tor that handles both bulk quantities as well as smallvolumes of high-value products to garden centers. Thelatter are often distributed in a small geographic regionto manage transportation costs. One distributor hasspeculated that a small-volume high quality productcould probably be marketed in an area bordered byTraverse City, Sault Ste. Marie and Marquette, Mich.,and Green Bay, Wis.
Composting Commercial Fish Processing Waste from Fish Caught in the Michigan Waters of the Great Lakes
28
Contaminants in fish waste, compost and basilplantsThe level of halogenated hydrocarbons in lake whitefishand lake trout waste depended on the lake of origin.Some lake whitefish waste and lake trout waste exceededthe FDA action level for food fish for a particular con-taminant. Contaminant levels for mercury from lakewhitefish waste, lake trout waste and chinook salmonwaste did not exceed the FDA action level of 1.0 ppm orthe Michigan action level of 0.5 ppm for mercury.
The compost generated from the lake whitefish and laketrout waste did not have any reportable levels of halo-genated hydrocarbons. Only very low levels of DDTshowed up in the compost made from the chinooksalmon waste. Contaminant levels for mercury from lakewhitefish/lake trout waste compost and chinook salmonwaste compost did not exceed the FDA action level of 1.0ppm or the Michigan action level of 0.5 ppm for mercu-ry. Leaf compost from the city of Kincheloe did not haveany reportable levels of halogenated hydrocarbons ormercury.
Because halogenated hydrocarbons were known to bepresent in the fish waste, the absence or reduced levelsof these contaminants in both the lake whitefish/laketrout and chinook salmon composts suggest thatmicroorganisms active in the composting process breakdown the halogenated hydrocarbons. The same cannotbe said for mercury. Because it is a heavy metal and inits elemental form, the low levels in the compost aremost likely due to the fact that levels of mercury in thefish waste were low and then were diluted when the fishwaste was mixed with other feedstocks used to make thecompost. Mercury can not be reduced through biologi-cal activity.
Basil plants did not contain any halogenated hydrocar-bons and only very low levels of mercury. This stands toreason, considering halogenated hydrocarbons and mer-cury levels were either non-detected or at very low levelsin the compost mixes. A summary of the halogenatedhydrocarbon and mercury contaminant levels found inthe fish waste, fish waste compost, leaf compost andbasil plant tissue analysis, is found in Table 1.
Plant growthTrial 1Basil plants grown in the professional growing substrateof peat, coir and perlite had increased height at the 30percent compost level without any additional liquid fer-tilizer. However, height did not improve in the fertilizedplants with increasing levels of compost. Faster growthand better color were observed in the 20 percent and 25percent compost-amended mixes compared with plantsin the control and 10 percent and 15 percent compost-amended mixes during the first six weeks of the trial.Additionally, the results show that non-fertilized plantsin the 20 percent and 25 percent compost-amendedmixes were similar in dry mass to those grown with theaddition of fertilizer. The use of fertilizer negates theimpact of increasing compost levels in the media. Tissueanalysis of the basil plants showed similar fertility levelsbetween non-fertilized and fertilized treatments.
It was observed at the end of week 6 at the 30 percentcompost level only that some senescing of the foliageand stems occurred on the uppermost 4 to 5 inches ofthe basil plants. The cause of the distortion was notobvious from the symptoms.
Trial 2No plant growth data were collected for Trial 2.
Trial 3Basil plants in the bark-based mix did not perform aswell as those in the professional mix when both wereamended with 10 percent compost. Incorporation of astarter fertilizer into the bark-based mix is suggested forsubsequent trials to determine if this addition over-comes the slow initial growth. It should be noted thatthis comparison between a peat-based mix and a bark-based mix was included in the project to encourage theuse of bark as a locally available and more sustainablematerial.
The bark-based mix showed a drop in dry weight andhealth of marigolds grown in the highest treatmentlevel, of 30 percent compost. It was observed that inboth the fertilized and the non-fertilized groups, theplants grown in the 20 and 25 percent compost treat-ments were fuller, had more branching and flower devel-opment, and were a deeper green color. For a bark-based medium, either of these two levels would enhancethe performance of the retail potting soil.
Conclusions

Composting Commercial Fish Processing Waste from Fish Caught in the Michigan Waters of the Great Lakes
29
Barrel use in static pile compostingThe barrels typically used to collect fish waste in the fishprocessing operations would present a problem for aproduction compost operation — they were difficult totip by hand. An on-going composting operation wouldneed to investigate safer and less labor-intensive tippingmethods, perhaps involving different collection contain-ers in the fish processor facility that could be more easi-ly moved on and off trucks and tipped over.
Fish Waste Compost MarketsThe opportunity to market fish waste/wood residue com-post presents some unique challenges as well as oppor-tunities.
■ The challenges include having a finite volume of fishwaste, overcoming fears about contaminants in thecompost and finding the most valuable potential mar-ket niche for fish waste compost.
■ The opportunities include receiving a fair price forcompost that meets market specifications and elimi-nating dependence on landfills for disposal of fishwaste.
The profitability of a composting operation will dependon:
■ The tipping fee that can be charged processors.
■ The ability of an operator to manage production costs(possibly by integrating the composting with otheroperations).
■ Developing a market for a high quality product, eitheras a niche consumer product or as a high quality bulkproduct that meets the needs of the greenhouseindustry. In other words, manufacturing a growingmix to meet a more demanding specification forwhich the consumer willingly pays a higher price.
30
ReferencesAlexander, Ron. 2000. Compost Marketing Trends in the U.S. Bio Cycle, July 2000, pp. 64-66.
Frederick, L., R. Harris, L. Peterson and S. Kehrmeyer. 1989. The Composting Solution to Dockside Fish Wastes.WIS-SG-89-434.
Gould, M. Charles. 2004. Unpublished Rogers City, Mich., data in the possession of author.
Kinnunen, R.E. 2001. Commercial Fisheries Newsline. Michigan Sea Grant Extension.Vol. 20, No. 1 (August 2001).
Kinnunen, R.E. 2003. Great Lakes Commercial Fisheries. Great Lakes Fisheries Leadership Institute. Great Lakes SeaGrant Network.
Logsden, Gene. 1991. Composting Fish Wastes Along the Great Lakes. BioCycle. Vol. 32, No. 5.
Miller, Michelle. 2001. Fulfilling Special Needs of the Nurseries. Bio Cycle, April 2001, pp. 55-58.
Rector, C., P. Cambier. 2000. Wood Waste Compost Market Feasibility Study. Marquette, Mich.: Northern Initiatives.
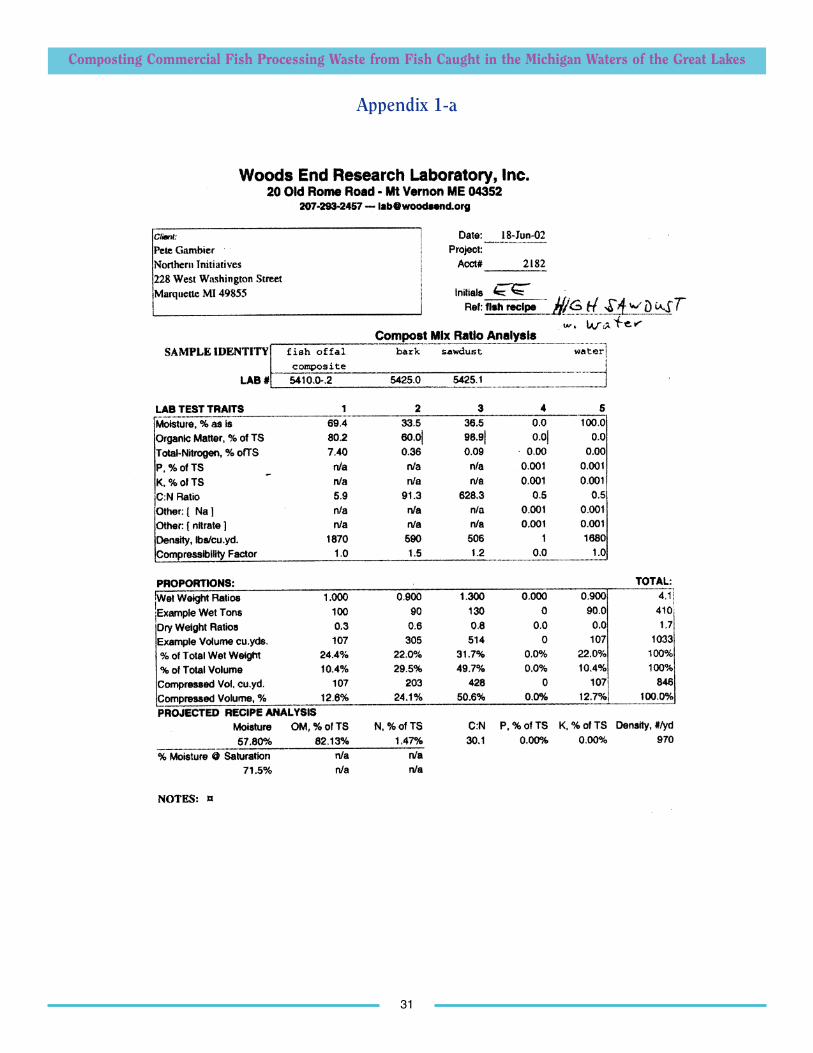
Composting Commercial Fish Processing Waste from Fish Caught in the Michigan Waters of the Great Lakes
31
Appendix 1-a

Composting Commercial Fish Processing Waste from Fish Caught in the Michigan Waters of the Great Lakes
32
Appendix 1-b
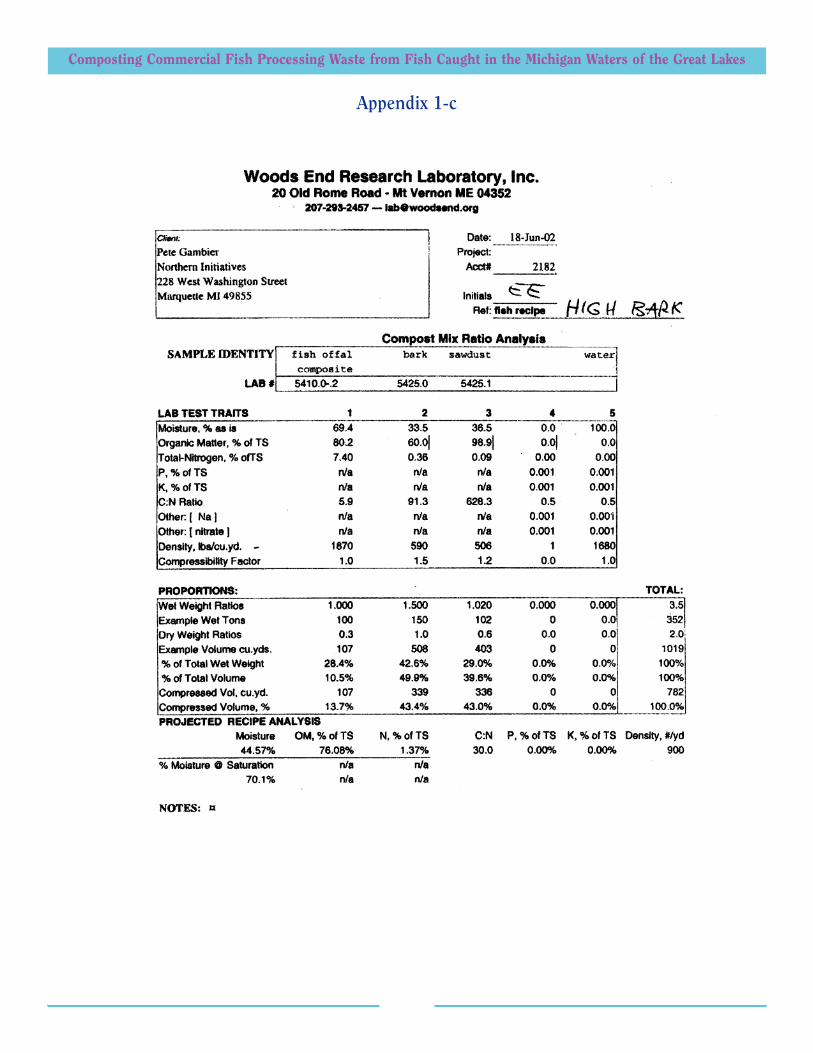
Composting Commercial Fish Processing Waste from Fish Caught in the Michigan Waters of the Great Lakes
Appendix 1-c

Composting Commercial Fish Processing Waste from Fish Caught in the Michigan Waters of the Great Lakes
34
Appendix 1-d
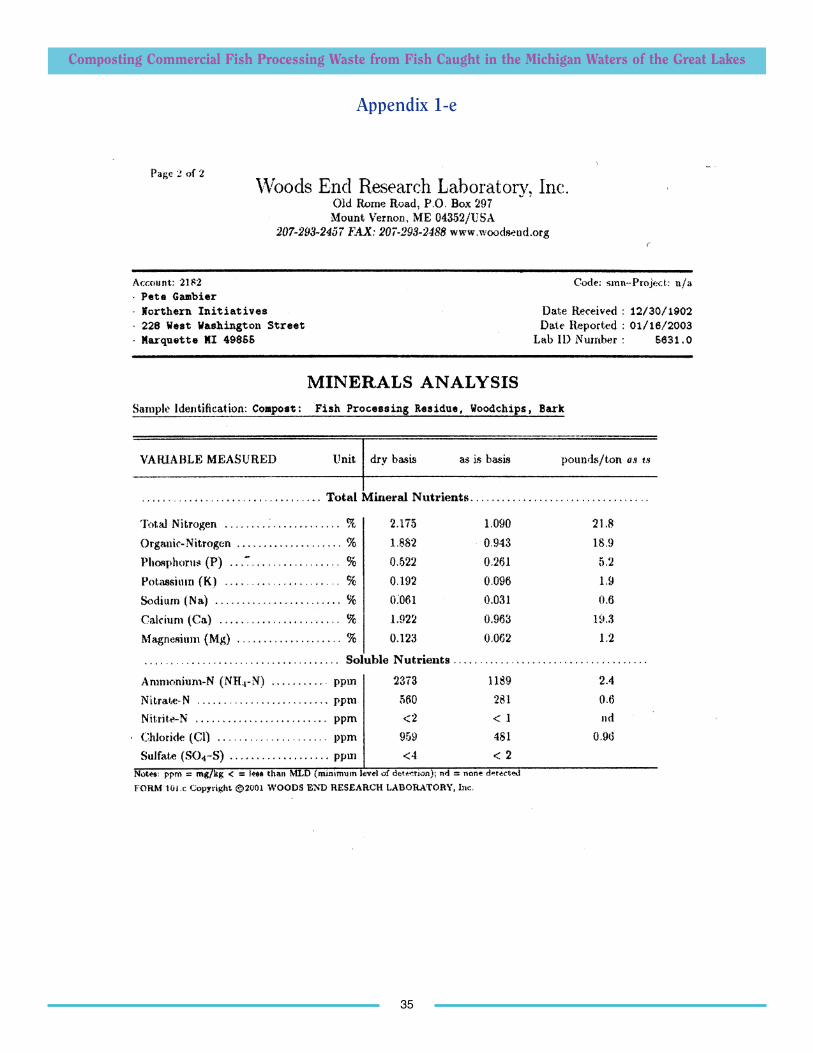
Composting Commercial Fish Processing Waste from Fish Caught in the Michigan Waters of the Great Lakes
35
Appendix 1-e
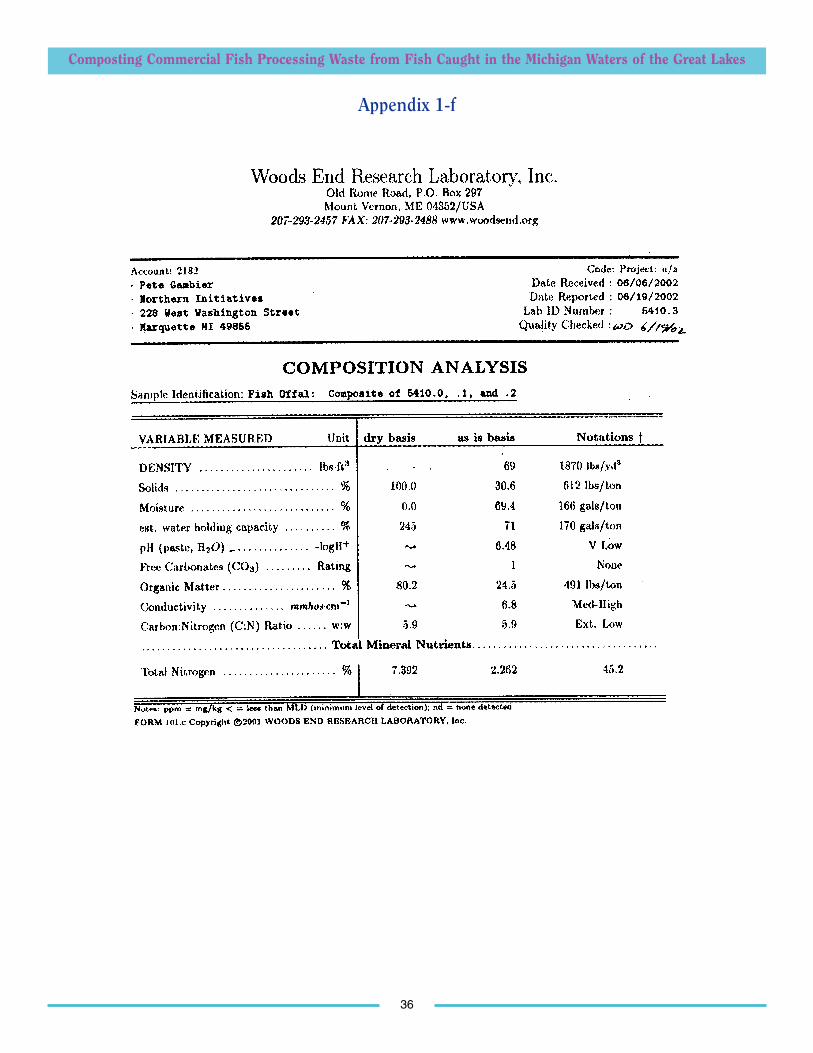
Composting Commercial Fish Processing Waste from Fish Caught in the Michigan Waters of the Great Lakes
36
Appendix 1-f

Composting Commercial Fish Processing Waste from Fish Caught in the Michigan Waters of the Great Lakes
37
Appendix 1-g
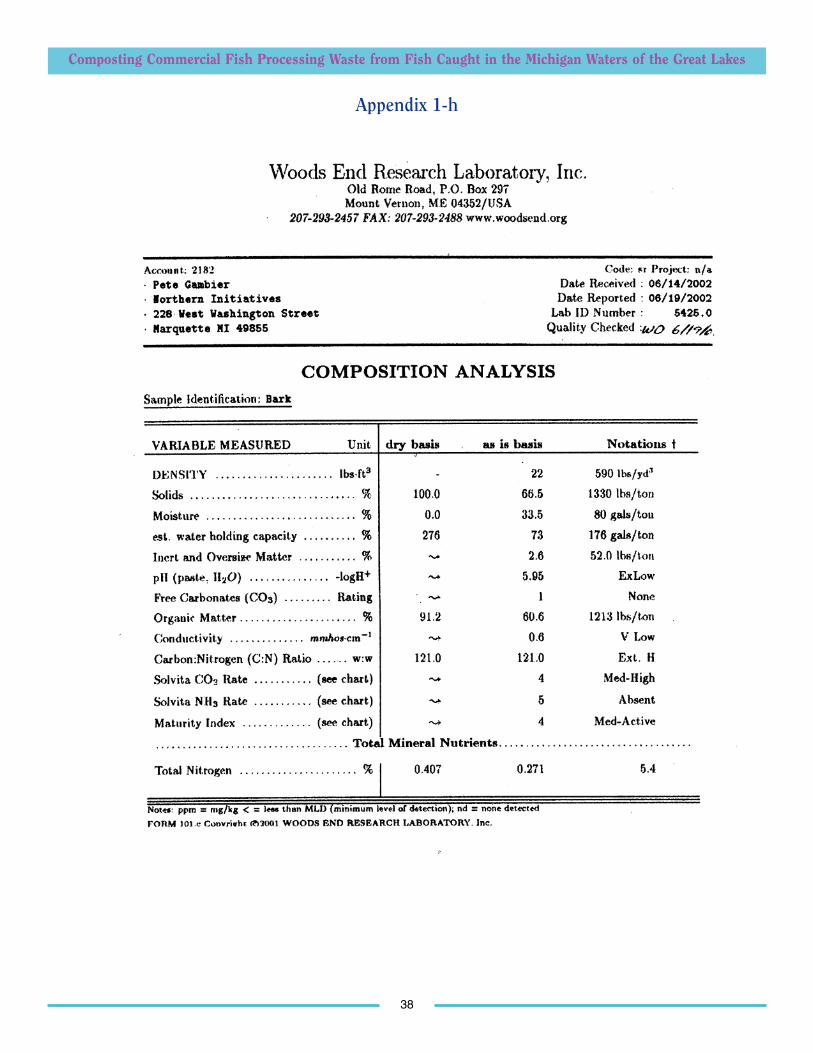
Composting Commercial Fish Processing Waste from Fish Caught in the Michigan Waters of the Great Lakes
38
Appendix 1-h
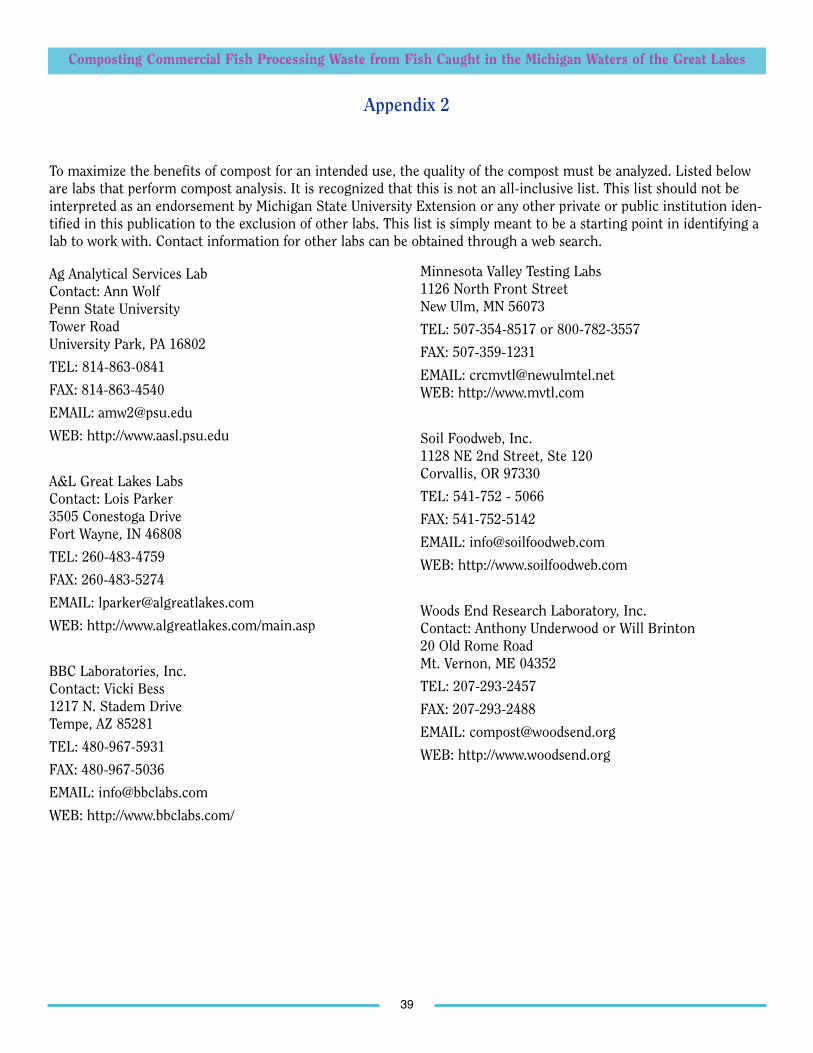
Composting Commercial Fish Processing Waste from Fish Caught in the Michigan Waters of the Great Lakes
39
To maximize the benefits of compost for an intended use, the quality of the compost must be analyzed. Listed beloware labs that perform compost analysis. It is recognized that this is not an all-inclusive list. This list should not beinterpreted as an endorsement by Michigan State University Extension or any other private or public institution iden-tified in this publication to the exclusion of other labs. This list is simply meant to be a starting point in identifying alab to work with. Contact information for other labs can be obtained through a web search.
Ag Analytical Services LabContact: Ann WolfPenn State UniversityTower RoadUniversity Park, PA 16802
TEL: 814-863-0841
FAX: 814-863-4540
EMAIL: [email protected]
WEB: http://www.aasl.psu.edu
A&L Great Lakes LabsContact: Lois Parker 3505 Conestoga DriveFort Wayne, IN 46808
TEL: 260-483-4759
FAX: 260-483-5274
EMAIL: [email protected]
WEB: http://www.algreatlakes.com/main.asp
BBC Laboratories, Inc.Contact: Vicki Bess1217 N. Stadem DriveTempe, AZ 85281
TEL: 480-967-5931
FAX: 480-967-5036
EMAIL: [email protected]
WEB: http://www.bbclabs.com/
Minnesota Valley Testing Labs1126 North Front StreetNew Ulm, MN 56073
TEL: 507-354-8517 or 800-782-3557
FAX: 507-359-1231
EMAIL: [email protected]: http://www.mvtl.com
Soil Foodweb, Inc. 1128 NE 2nd Street, Ste 120Corvallis, OR 97330
TEL: 541-752 - 5066
FAX: 541-752-5142
EMAIL: [email protected]
WEB: http://www.soilfoodweb.com
Woods End Research Laboratory, Inc.Contact: Anthony Underwood or Will Brinton 20 Old Rome RoadMt. Vernon, ME 04352
TEL: 207-293-2457
FAX: 207-293-2488
EMAIL: [email protected]
WEB: http://www.woodsend.org
Appendix 2

Composting Commercial Fish Processing Waste from Fish Caught in the Michigan Waters of the Great Lakes
40
MSU is an affirmative-action equal-opportunity institution. Michigan State University Extension programs and materials are open to all without regardto race, color, national origin, gender, religion, age, disability, political beliefs, sexual orientation, marital status, or family status. ■ Issued in further-ance of Extension work in agriculture and home economics, acts of May 8 and June 20, 1914, in cooperation with the U.S. Department ofAgriculture. Thomas Coon, Extension director, Michigan State University, E. Lansing, MI 48824. ■ This information is for educational purposes only.Reference to commercial products or trade names does not imply endorsement by MSU Extension or bias against those not mentioned. This bul-letin becomes public property upon publication and may be printed verbatim with credit to MSU. Reprinting cannot be used to endorse or advertise a
commercial product or company.
MICHIGAN STATEU N I V E R S I T Y
EXTENSION
For more materials available online, visit the MSU Extension Web site at:http://web2.msue.msu.edu/bulletins/intro.cfm