Composition evolution and coalescence behavior of …...METALS Composition evolution and coalescence...
12
METALS Composition evolution and coalescence behavior of titanium oxide particles in Iron-Nickel binary alloy melt Changji Xuan 1 and Wangzhong Mu 2, * 1 Uddeholms AB (a voestalpine company), Uvedsvägen 15, SE-683 85, Hagfors, Sweden 2 Department of Materials Science and Engineering, KTH Royal Institute of Technology, Brinellvägen 23, 100 44 Stockholm, Sweden Received: 25 September 2018 Accepted: 18 February 2019 Published online: 26 February 2019 Ó The Author(s) 2019 ABSTRACT Particle coalescence refers to the dispersed particles in a suspension sticking to each other through the random collisions. This phenomenon is of vital impor- tance for the process control and mechanical property of the metallic materials, such as Iron–Nickel binary alloy. The present work performed a fundamental study of the composition evolution and coalescence behavior of the Ti-oxide particles in the liquid Iron–Nickel binary alloy. The effect of the titanium addition amount on the composition of the inclusion particles is investigated through the Ti deoxidation experiments. The particle features are characterized by using a potentiostatic electrolytic extraction method. It shows that when the amount of the Ti addition arrives at a certain degree, the state of the oxide particles changes from the liquid to the solid. Meanwhile, the formation of the cluster can occur. The coalescence efficiency and attraction forces of the particles are calculated theoretically. It is found that the coalescence degree of the solid TiO x (x = 1.5–1.67) particle is close to that of the Al 2 O 3 particle. The initial sintering behavior of the particles after coalescence–collision is analyzed by measuring the sintered neck radius. The apparent self-diffusion of the TiO x (x = 1.5–1.67) particle is approximately 1.7 times larger than that of the Al 2 O 3 particle. Introduction Due to the excellent mechanical and magnetic prop- erties, Fe–Ni (Ni = 10–30%) alloy has an extensive application in different fields, e.g., magnetic and inductive device manufacturing [1–3]. Various research issues of Fe–(10–30%)Ni alloy have been performed in previous studies [4–8]. For instance, Li et al. [4] investigated the solidification structure of the undercooled alloy with different Ni addition. Zeng [5] reported the martensitic structure and hardness in the as-quenched Fe–Ni alloy. Nakada [6] directly observed the martensitic reversion from lenticular martensite to austenite in Fe–29%Ni alloy. Sato and Address correspondence to E-mail: [email protected] https://doi.org/10.1007/s10853-019-03458-z J Mater Sci (2019) 54:8684–8695 Metals
Transcript of Composition evolution and coalescence behavior of …...METALS Composition evolution and coalescence...
METALS
Composition evolution and coalescence behavior
of titanium oxide particles in Iron-Nickel binary alloy
melt
Changji Xuan1 and Wangzhong Mu2,*
1Uddeholms AB (a voestalpine company), Uvedsvägen 15, SE-683 85, Hagfors, Sweden2Department of Materials Science and Engineering, KTH Royal Institute of Technology, Brinellvägen 23, 100 44 Stockholm, Sweden
Received: 25 September 2018
Accepted: 18 February 2019
Published online:
26 February 2019
� The Author(s) 2019
ABSTRACT
Particle coalescence refers to the dispersed particles in a suspension sticking to
each other through the random collisions. This phenomenon is of vital impor-
tance for the process control and mechanical property of the metallic materials,
such as Iron–Nickel binary alloy. The present work performed a fundamental
study of the composition evolution and coalescence behavior of the Ti-oxide
particles in the liquid Iron–Nickel binary alloy. The effect of the titanium
addition amount on the composition of the inclusion particles is investigated
through the Ti deoxidation experiments. The particle features are characterized
by using a potentiostatic electrolytic extraction method. It shows that when the
amount of the Ti addition arrives at a certain degree, the state of the oxide
particles changes from the liquid to the solid. Meanwhile, the formation of the
cluster can occur. The coalescence efficiency and attraction forces of the particles
are calculated theoretically. It is found that the coalescence degree of the solid
TiOx (x = 1.5–1.67) particle is close to that of the Al2O3 particle. The initial
sintering behavior of the particles after coalescence–collision is analyzed by
measuring the sintered neck radius. The apparent self-diffusion of the TiOx
(x = 1.5–1.67) particle is approximately 1.7 times larger than that of the Al2O3
particle.
Introduction
Due to the excellent mechanical and magnetic prop-
erties, Fe–Ni (Ni = 10–30%) alloy has an extensive
application in different fields, e.g., magnetic and
inductive device manufacturing [1–3]. Various
research issues of Fe–(10–30%)Ni alloy have been
performed in previous studies [4–8]. For instance, Li
et al. [4] investigated the solidification structure of the
undercooled alloy with different Ni addition. Zeng
[5] reported the martensitic structure and hardness in
the as-quenched Fe–Ni alloy. Nakada [6] directly
observed the martensitic reversion from lenticular
martensite to austenite in Fe–29%Ni alloy. Sato and
Address correspondence to E-mail: [email protected]
https://doi.org/10.1007/s10853-019-03458-z
J Mater Sci (2019) 54:8684–8695
Metals

Zaefferer [7] reported the formation mechanism of
butterfly-type martensite in this ferrous alloy using
EBSD-based orientation microscopy. Besides the
research focusing on the solidification and
microstructure, the alloy preparation process is vital.
One of the most important points in the Fe–Ni alloy
manufacturing is to control and optimize the coales-
cence behavior of the undesirable non-metallic par-
ticles in the melt [8]. The particle coalescence in one
fluid is of interest in many important processes. It
normally occurs among the particles or droplets with
the size range from nanometer to several tens of
microns [9]. Different stirring methods, for instance
Ar-gas stirring and inductive stirring, can promote
the coalescence–collision frequency of the particles.
Meanwhile, the chemical composition of the particles
can also affect the coalescence behavior due to the
interfacial energy. The specific interest of this work is
to understand the composition evolution and coa-
lescence behavior of the titanium oxide particles in
the liquid Iron–Nickel binary alloy.
It is well known that the precipitation of the non-
metallic particles, referred as ‘inclusion’ from herein,
is un-avoided due to the effects of such interstitial
element such as oxygen. Many research investiga-
tions [10–15] have been performed to investigate the
behavior of the non-metallic inclusion in the liquid
metal. One effective solution of optimizing the
inclusion coalescence is to use the complex deoxida-
tion [11–15]. A weaker deoxidizer (e.g., Ti) is firstly
added into the melt to form the oxides. Afterward, a
stronger deoxidizer (e.g., Al, Mg, Ca) is added to
further decrease the oxygen content in the melt [11].
The addition amount of the deoxidizers needs to be
carefully evaluated. As a typical example, different
oxide phases can be precipitated with different
amount of the titanium addition. A large number of
works have been reported [16–21] to describe the
equilibrium reactions in the Fe–Ti–O system. How-
ever, a detailed study of the TiOx inclusion behavior
with different amount of the titanium addition is not
available in the open literature. In this work, different
amount of titanium is used in the laboratory-scale
deoxidation experiments to identify a precipitation
boundary of the different phases. Furthermore, the
coalescence behavior of the inclusions is analyzed
through both the experimental observation and the-
oretical consideration. The obtained understanding
can be applied in a comprehensive study of the
particle behavior in different metallic alloys, such as
aluminum–copper alloy [22].
Experimental methods
Metal sample preparation
Sample preparation experiments were carried out by
charging a Fe–10 mass%Ni alloy (* 160 g) in a high-
frequency induction furnace with an argon gas pro-
tection. A graphite susceptor was installed between a
high-purity Al2O3 crucible and induction coil to avoid
the induction stirring. The melt composition became
homogeneous after 20 min at a constant temperature
as 1873 K. After that, the melt was deoxidized using
different amount of the Ti addition as 0.03%, 0.1% and
0.2%, respectively. The reader is referred to Ref. [11]
for the detailed sampling procedure. The sample time
and chemical compositions of each specimen are
summarized in Table 1. The dissolved titanium con-
tent in the specimens was analyzed using the high-
frequency inductively coupled plasma atomic emis-
sion spectrometry (ICP-AES). We refer Ref. [23] for
more details of the equipment. The total oxygen con-
tent in the samples was determined using an inert gas
fusion-infrared absorptiometry [24]. The dissolved
oxygen content is estimated by (Ototal–Oinsol), where
Ototal and Oinsol are total and insoluble oxygen content
of the specimen. Oinsol is obtained from the chemical
analysis of insoluble Ti content in inclusion. The
details can be seen in Ref. [14].
Inclusion characterization
The inclusion characteristics in the metal specimens
were observed with a three-dimensional potentio-
static electrolytic extraction (E.E.) method. The
detailed experimental parameter for E.E. was
described in a previous study [11]. The investigation
was performed using a scanning electron microscope
(SEM) in combination with an energy-dispersive
spectroscopy (EDS) at a magnification of 1000 9–
10,000 9. The working acceleration voltage of SEM–
EDS is between 15 and 20 kV according to the specific
resolution, and the beam size of the spot analysis is
about 1–2 lm. The calibration material is the pure Fe
(= 99.99%). The SEM images were measured using an
image software WinROOF�. The equivalent diameter
was selected to define the inclusion size.
J Mater Sci (2019) 54:8684–8695 8685

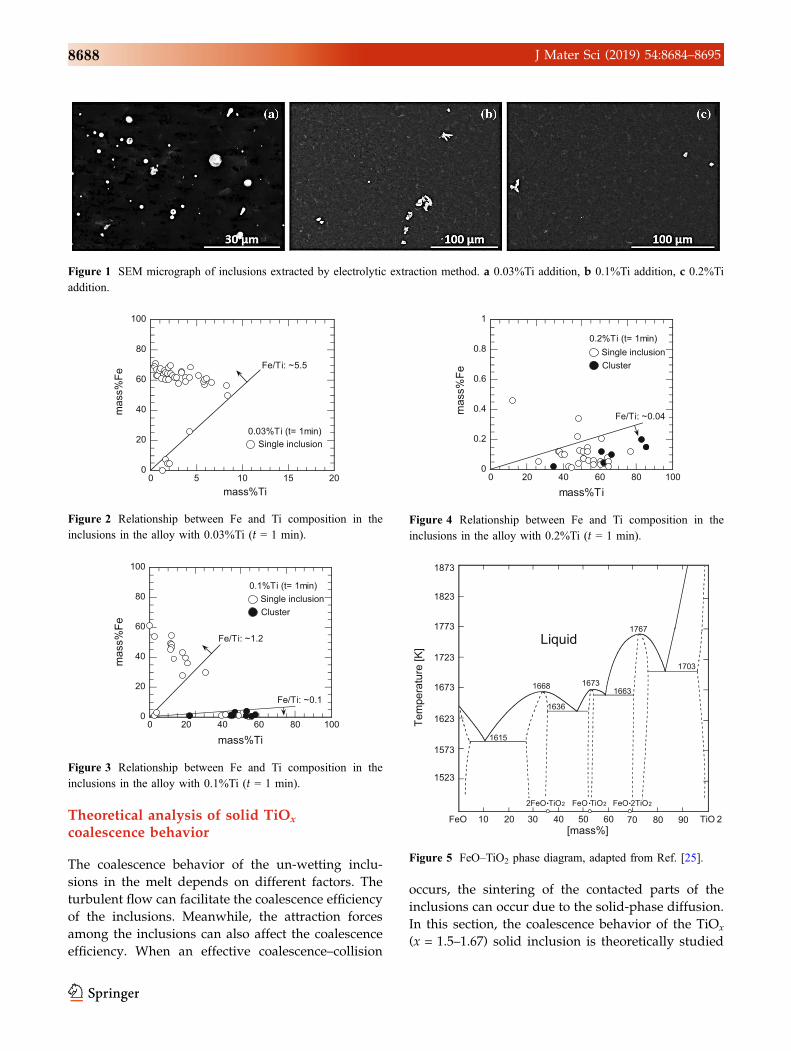
Results and discussion
Chemical composition of inclusion
Table 2 shows the chemical mapping images of the
typical oxide inclusions with different amount of the
titanium addition. In order to see a broader image of
more particles, the lower magnification of SEM
micrographs is provided in Fig. 1. The concentration
of Fe and Ti in the inclusions at the sampling time
t = 1 min is plotted in Figs. 2, 3 and 4. In the case of
Ti = 0.03%, the observed inclusions are the single
spheres rather than the clusters. The technical word
‘cluster’ is defined as a group of the agglomerated
inclusions. The size range of the single inclusions is
from 1.1 up to 6.1 lm, and the Fe/Ti ratio is larger
than 5.5, as is shown in Fig. 1. For the case Ti = 0.1%
(see Fig. 2), both the single spheres and clusters are
found with the size range as 1.1–3.7 lm and
4.5–14.2 lm, respectively. The Fe/Ti ratio is larger
than * 1.2 in most of the single spheres and smaller
than * 0.1 in the clusters. When the amount of the
titanium addition increases from 0.1 to 0.2%, both the
single inclusions (1.1–3.4 lm) and clusters
(6.3–12.4 lm) are identified as well, as is shown in
Fig. 4. However, the single inclusions have a polyg-
onal shape instead of a spherical shape. Meanwhile,
the ratios of Fe/Ti (\ 0.04) in both the single inclu-
sions and clusters are quite small.
Figure 5 shows a binary phase diagram of the FeO–
TiO2 system [20]. Using the above-mentioned Fe/Ti
ratio, the mass percentage of the FeO phase in the
inclusions is estimated and summarized in Table 3. It
can be seen that for the case of Ti = 0.03%, the inclu-
sions with a high FeO content ([ 81%) are liquid at the
experimental temperature of 1873 K. When the coa-
lescence–collision among the liquid inclusions occurs,
the agglomerated droplets will form into one large
droplet. Since the turbulent flow is avoided in the
experiments, the liquid inclusions can maintain the
spherical shape. Analogously, most of the single
spheres (FeO[ 48%) are liquid at the same tempera-
ture in the case of Ti = 0.1%. But the observed clusters
are solid due to the low FeO content (\ 7%). In the case
of Ti = 0.2%, both the single inclusions and clusters
with the low FeO content (\ 3%) are solid.
Thermodynamic consideration of critical Ticontent
Different phases can be precipitated using different
titanium amount [16] in the Fe–Ni deoxidation. Suzuki
et al. [17] reported that the FeO solubility in the TiO2
phase is much higher than that in the Ti3O5 phase. And
the liquid FeO cannot be dissolved into the Ti2O3
phase. The high erosion resistance of the Ti2O3 phase
with respect to the liquid FeO was mentioned by Xuan
et al. [26] as well. Thus, the thermodynamic data of the
TiO2 reaction are selected as an approximation of the
TiOx–FeO reaction. The different types of titanium
oxide reactions are given by
Reaction ð1Þ: TiO2ðs) ¼ ½Ti] þ 2½O]
logKð1Þ ¼ �5:938 ¼ logaTi � a2
O
aTiO2
� �¼ logð½mass%Ti�Þ
þ logfTi þ 2 logð½mass%O�Þ þ 2log fO
ð1Þ
Reaction ð2Þ: Ti3O5ðs) ¼ 3½Ti] þ 5½O]
logKð2Þ ¼ �16:191 ¼ loga3Ti � a5
O
aTi3O5
� �¼ 3 logð½mass%Ti�Þ
þ 3logfTi þ 5 logð½mass%O�Þ þ 5log fO
ð2Þ
Table 1 Basic conditions and content of oxygen and titanium in deoxidation experiments
Exp. no. Ti addition (mass%) Sampling
time (min)
Dissolved oxygen
content (ppm)
Dissolved Ti
content (ppm)
Undissolved Ti
content (ppm)
1 0.03%Ti (initial oxygen: 157 ppm) 1 130 302 33
5 103 254 20
2 0.1%Ti (initial oxygen: 168 ppm) 1 132 519 139
3 111 434 75
30 60 313 73
3 0.2%Ti (initial oxygen: 133 ppm) 1 112 1990 203
3 68 2000 116
10 57 1567 164
8686 J Mater Sci (2019) 54:8684–8695

Reaction ð3Þ:Ti2O3ðs) ¼ 2½Ti] þ 3½O]
logKð2Þ ¼ �9:810 ¼ loga2Ti � a3
O
aTi2O3
� �¼ 2 logð½mass%Ti�Þ
þ 2logfTi þ 3 logð½mass%O�Þ þ 3log fO
ð3Þ
log fO ¼ eTiO mass%Ti½ � þ eOO mass%O½ � þ rTiO mass%Ti½ �2
ð4Þ
log fTi ¼ eOTi mass%O½ � þ eTiTi mass%Ti½ � þ rOTi mass%O½ �2
ð5Þ
where K is the equilibrium constant. ai is the activity
of i. The activities of the TiO2, Ti3O5 and Ti2O3 phases
equal unity. fO and fTi denote the activity coefficients
of the dissolved oxygen and titanium. eij and ri
j are the
interaction parameters. The thermodynamic data of
the Fe–10%Ni system at 1873 K are calculated based
on the experimental results of Dashevskii et al. [16],
as is shown in Table 4. Figure 6 shows the equilib-
rium curve simulated using Eqs. (1)–(5). The [Ti] and
[O] contents in the cases of Ti = 0.03%, Ti = 0.1% and
Ti = 0.2% are plotted in Fig. 5 as well. It is clear to see
the concentrations in all the three cases toward the
equilibrium curve with the increased time. Particu-
larly, the concentration in the case of Ti = 0.1% has
almost arrived at the equilibrium state after
t = 30 min. In the Fe–Ti–O system at a constant
temperature as 1873 K, both Hadley et al. [27] and
Suzuki et al. [28] identified a boundary content
[Ti] & 0.04% between the TiOx–FeO and TiOx pre-
cipitation in the equilibrium state. According to
chapter 3.1 and Fig. 5, the experimental observation
in this work shows a good agreement with the
equilibrium boundary in the literature. It indicates
that the amount of the titanium addition needs to be
smaller than 0.1% to avoid the cluster formation in
the melt that includes a total oxygen O = 0.015%.
Table 2 Typical inclusions in Ti deoxidation experiment
Ti addition (mass%) Typical image
ElementTi Fe O
0.03
0.1
0.2
J Mater Sci (2019) 54:8684–8695 8687
Theoretical analysis of solid TiOx
coalescence behavior
The coalescence behavior of the un-wetting inclu-
sions in the melt depends on different factors. The
turbulent flow can facilitate the coalescence efficiency
of the inclusions. Meanwhile, the attraction forces
among the inclusions can also affect the coalescence
efficiency. When an effective coalescence–collision
occurs, the sintering of the contacted parts of the
inclusions can occur due to the solid-phase diffusion.
In this section, the coalescence behavior of the TiOx
(x = 1.5–1.67) solid inclusion is theoretically studied
Figure 1 SEM micrograph of inclusions extracted by electrolytic extraction method. a 0.03%Ti addition, b 0.1%Ti addition, c 0.2%Ti
addition.
0
20
40
60
80
100
0 5 10 15 20
0.03%Ti (t= 1min)
mas
s%Fe
mass%Ti
Single inclusion
Fe/Ti: ~5.5
Figure 2 Relationship between Fe and Ti composition in the
inclusions in the alloy with 0.03%Ti (t = 1 min).
0
20
40
60
80
100
0 20 40 60 80 100
mas
s%Fe
mass%Ti
0.1%Ti (t= 1min)Single inclusionCluster
Fe/Ti: ~0.1
Fe/Ti: ~1.2
Figure 3 Relationship between Fe and Ti composition in the
inclusions in the alloy with 0.1%Ti (t = 1 min).
0
0.2
0.4
0.6
0.8
1
0 20 40 60 80 100
0.2%Ti (t= 1min)
mas
s%Fe
mass%Ti
Single inclusionCluster
Fe/Ti: ~0.04
Figure 4 Relationship between Fe and Ti composition in the
inclusions in the alloy with 0.2%Ti (t = 1 min).
FeO 10 20 30 40
2FeO TiO2 FeO TiO2
60 90 TiO 280
FeO 2TiO2
50 70
Liquid
1615
1668
1636
16731663
1767
1703
[mass%]
Tem
pera
ture
[K]
1873
1823
1773
1723
1673
1523
1573
1623
Figure 5 FeO–TiO2 phase diagram, adapted from Ref. [25].
8688 J Mater Sci (2019) 54:8684–8695

from above-mentioned perspectives. As a typical
inclusion type, the Al2O3 inclusion is also analyzed
for a comparison.
Coalescence coefficient of turbulent collision
The coalescence coefficient, a, of the turbulent colli-
sions is formulated by an expression [29, 30]:
a ¼ 0:41lr3 qfe=lð Þ0:5
A121
" #�0:242
ð6Þ
where r is the equivalent radius of the inclusion.
q = 7000 kg/m3 denotes the density of the melt,
e = 0.01 m2/s3 [31] is the dissipation rate, and
l = 0.006 kg/m s is the viscosity of the melt. A121 is
the Hamaker constant of the solid particle in the melt
and is given by [32].
A121 ¼ffiffiffiffiffiffiffiffiA11
p�
ffiffiffiffiffiffiffiffiA22
p� �2ð7Þ
where A11 and A22 are the Hamaker constants of the
solid and liquid phases. The Hamaker constant of the
water and liquid iron equals 4.38 9 10-20 J [33] and
25.3 9 10-19 J [34]. The Hamaker constant of the
solid TiOx phase is derived using the surface tension
of the water. According to the Fowkes model, the
Hamaker constant, A121, between the solid particles
in the water is given as [35]
A121 ¼ 7:625 ds
ffiffiffiffifficds
q� dH2O
ffiffiffiffiffiffiffiffifficdH2O
q� �2
ð8Þ
where ds and dH2O denote the interfacial separations
of the atomic center at contact for the solid particle
and water. d equals 4.0 9 10-10 m for the inorganic
materials and 4.3 9 10-10 m for the water at the room
temperature. cds and cdH2Oare the contributions of the
London dispersion force to the surface tension of the
solid particle and water (= 0.0218 N/m [35]). The
London dispersion contribution, cds , is given as [29]
cds ¼ c2H2O
1 þ cos hð Þ=4cdH2Oð9Þ
where cH2O¼ 0:0728 N/m is the water surface ten-
sion [35]. The contact angle (h) of both TiO2 (67� ± 2�)and TiOx (x = 1.5–1.67) (18� ± 5�) in contact with the
water reported by Kuscer et al. [36] is selected for the
calculation. The Hamaker constant of the water
equals 4.38 9 10-20 J [33] using the Lifshitz equation.
Combining Eqs. (7)–(9), the Hamaker constants, A11,
of the TiO2 and TiOx (x = 1.5–1.67) phases are calcu-
lated. In the case of the TiO2 phase, the A11 equals
16.3 9 10-20–17.8 9 10-20 J that has a good agree-
ment with the reported data (15.3 9 10-20–
17.3 9 10-20 J [37]) using the Lifshitz equation. Thus,
the selection of Kuscer et al. [36] data is validated. In
this work, the calculated Hamaker constant of the
TiOx (x = 1.5–1.67) phase equals A11 = 31.9 9 10-20 J.
Table 3 Distribution of FeO in the inclusions with different Ti additions
Ti addition (mass %) FeO% in inclusion Criteria of inclusion state at temperature 1600 �C
Single inclusion Cluster
0.03 [ 81 – Liquid
0.1 [ 48 \ 7 Liquid ? solid
0.2 \ 3 Solid
Table 4 Equilibrium
constants for reactions (1)–(3),
interaction parameters for Fe–
10%Ni system at 1873 K
T (K) log K(1) log K(2) log K(3) eTiTi eTiO eOTi eOO rTiO rOTi
1873 - 5.938 - 16.191 - 9.810 0.0448 - 0.533 - 1.596 - 1.534 0.0385 - 0.355
0.0001
0.001
0.01
0.1
1
0.001 0.01 0.1 1
O c
onte
nt [m
ass%
]Ti content [mass%]
T=1873K 0.03%TiFe-10%Ni
0.2%Ti
1min5min 1min
3min10min
Calculated equilibrium line
0.04%TiOx-FeO TiOx
[8-10]
1min3min
30min
0.1%Ti
0.03%
Figure 6 Relation between dissolved Ti and O content in liquid
Fe–10%Ni alloy at 1873 K.
J Mater Sci (2019) 54:8684–8695 8689
Using the size r = 1 lm as an example, the coales-
cence coefficient of the TiOx inclusion a = 0.46 is
quite similar to that of the Al2O3 inclusion a = 0.50
[34].
Attraction force due to wettability
When the two inclusions with the low wettability
arrive at a certain distance, a void region starts to
form between the inclusions by ejecting the melt. The
critical distance of the melt ejection is described using
Eq. (10) [38].
� c � cosh � 7:3
r � P ¼ 0:4 þ 4drþ d
r
� �2
ð10Þ
where c = 1.75 N/m [35] is the surface tension of the
melt. h is the contact angle between the solid inclu-
sion and melt. P = qgh is the static pressure of the
melt. d denotes the critical distance. The attraction of
the inclusions is driven by the cavity bridge force.
The cavity bridge force, FC, describes the sum of the
pressure difference (DP = 3.86 9 103 Pa [39])
between the void region and melt, and the melt
surface tension. It is formulated using the Fisher
equation [40]
FC ¼ pR2DPþ 2pRc ð11Þ
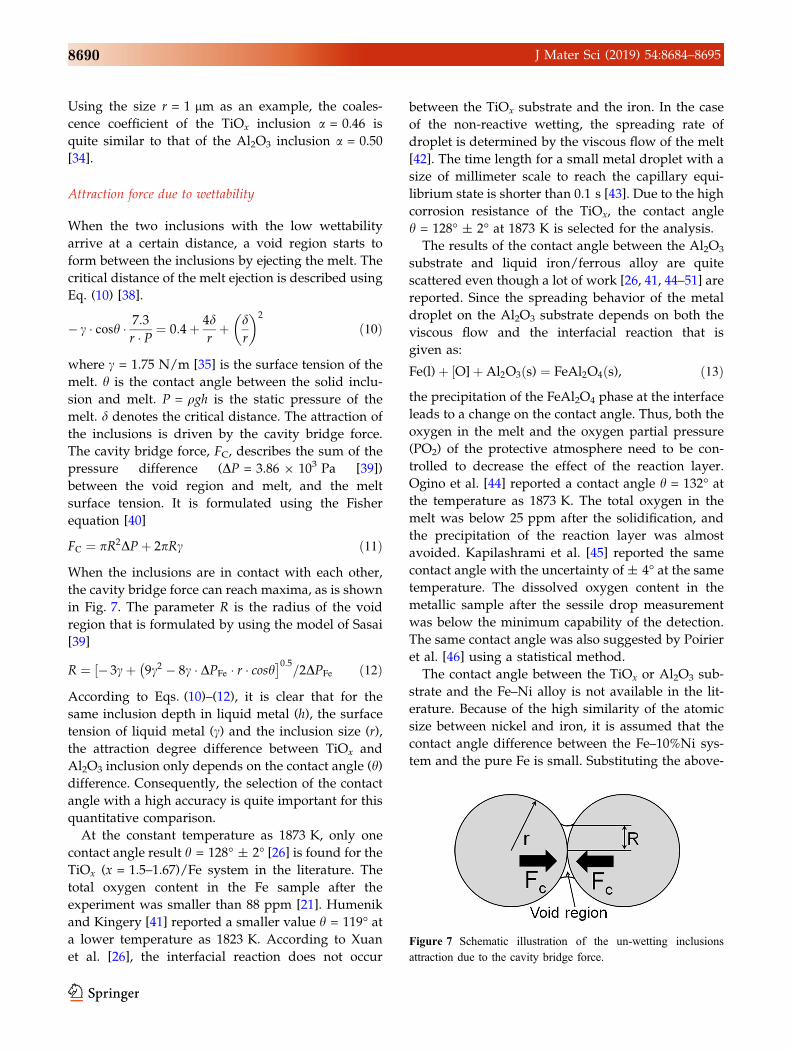
When the inclusions are in contact with each other,
the cavity bridge force can reach maxima, as is shown
in Fig. 7. The parameter R is the radius of the void
region that is formulated by using the model of Sasai
[39]
R ¼ ½� 3cþ 9c2 � 8c � DPFe � r � cosh� �0:5
=2DPFe ð12Þ
According to Eqs. (10)–(12), it is clear that for the
same inclusion depth in liquid metal (h), the surface
tension of liquid metal (c) and the inclusion size (r),
the attraction degree difference between TiOx and
Al2O3 inclusion only depends on the contact angle (h)
difference. Consequently, the selection of the contact
angle with a high accuracy is quite important for this
quantitative comparison.
At the constant temperature as 1873 K, only one
contact angle result h = 128� ± 2� [26] is found for the
TiOx (x = 1.5–1.67)/Fe system in the literature. The
total oxygen content in the Fe sample after the
experiment was smaller than 88 ppm [21]. Humenik
and Kingery [41] reported a smaller value h = 119� at
a lower temperature as 1823 K. According to Xuan
et al. [26], the interfacial reaction does not occur
between the TiOx substrate and the iron. In the case
of the non-reactive wetting, the spreading rate of
droplet is determined by the viscous flow of the melt
[42]. The time length for a small metal droplet with a
size of millimeter scale to reach the capillary equi-
librium state is shorter than 0.1 s [43]. Due to the high
corrosion resistance of the TiOx, the contact angle
h = 128� ± 2� at 1873 K is selected for the analysis.
The results of the contact angle between the Al2O3
substrate and liquid iron/ferrous alloy are quite
scattered even though a lot of work [26, 41, 44–51] are
reported. Since the spreading behavior of the metal
droplet on the Al2O3 substrate depends on both the
viscous flow and the interfacial reaction that is
given as:
Fe(l) þ ½O] þ Al2O3ðs) ¼ FeAl2O4ðs), ð13Þ
the precipitation of the FeAl2O4 phase at the interface
leads to a change on the contact angle. Thus, both the
oxygen in the melt and the oxygen partial pressure
(PO2) of the protective atmosphere need to be con-
trolled to decrease the effect of the reaction layer.
Ogino et al. [44] reported a contact angle h = 132� at
the temperature as 1873 K. The total oxygen in the
melt was below 25 ppm after the solidification, and
the precipitation of the reaction layer was almost
avoided. Kapilashrami et al. [45] reported the same
contact angle with the uncertainty of ± 4� at the same
temperature. The dissolved oxygen content in the
metallic sample after the sessile drop measurement
was below the minimum capability of the detection.
The same contact angle was also suggested by Poirier
et al. [46] using a statistical method.
The contact angle between the TiOx or Al2O3 sub-
strate and the Fe–Ni alloy is not available in the lit-
erature. Because of the high similarity of the atomic
size between nickel and iron, it is assumed that the
contact angle difference between the Fe–10%Ni sys-
tem and the pure Fe is small. Substituting the above-
Figure 7 Schematic illustration of the un-wetting inclusions
attraction due to the cavity bridge force.
8690 J Mater Sci (2019) 54:8684–8695
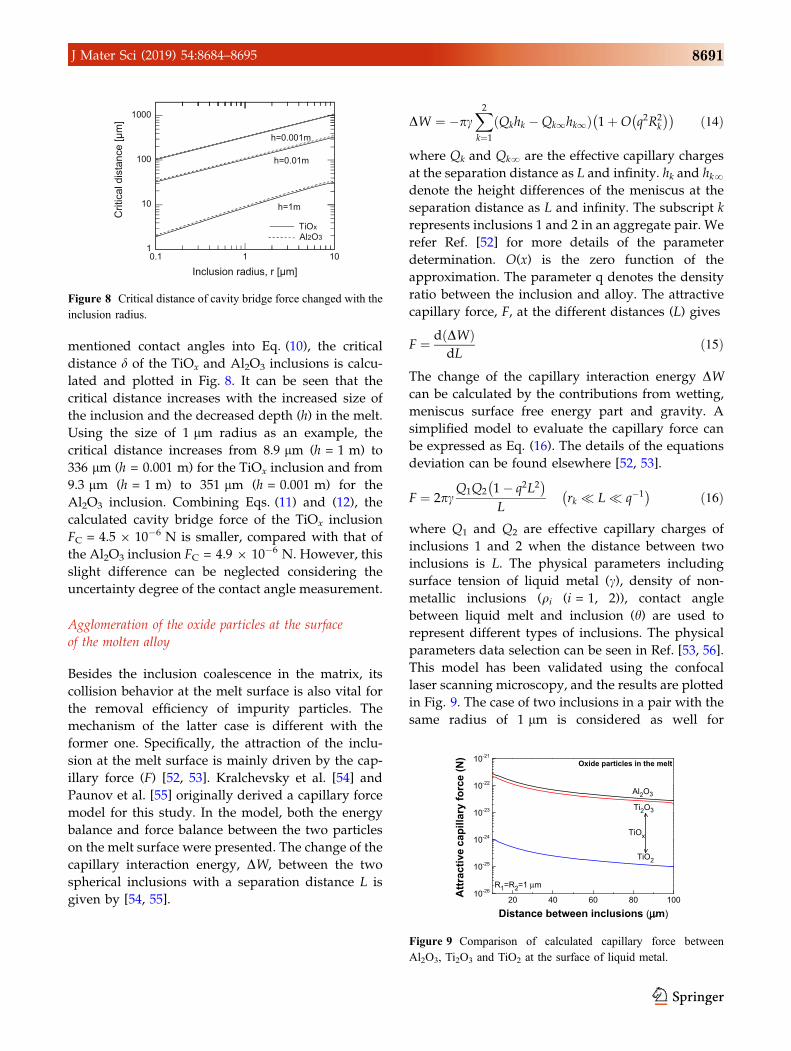
mentioned contact angles into Eq. (10), the critical
distance d of the TiOx and Al2O3 inclusions is calcu-
lated and plotted in Fig. 8. It can be seen that the
critical distance increases with the increased size of
the inclusion and the decreased depth (h) in the melt.
Using the size of 1 lm radius as an example, the
critical distance increases from 8.9 lm (h = 1 m) to
336 lm (h = 0.001 m) for the TiOx inclusion and from
9.3 lm (h = 1 m) to 351 lm (h = 0.001 m) for the
Al2O3 inclusion. Combining Eqs. (11) and (12), the
calculated cavity bridge force of the TiOx inclusion
FC = 4.5 9 10-6 N is smaller, compared with that of
the Al2O3 inclusion FC = 4.9 9 10-6 N. However, this
slight difference can be neglected considering the
uncertainty degree of the contact angle measurement.
Agglomeration of the oxide particles at the surface
of the molten alloy
Besides the inclusion coalescence in the matrix, its
collision behavior at the melt surface is also vital for
the removal efficiency of impurity particles. The
mechanism of the latter case is different with the
former one. Specifically, the attraction of the inclu-
sion at the melt surface is mainly driven by the cap-
illary force (F) [52, 53]. Kralchevsky et al. [54] and
Paunov et al. [55] originally derived a capillary force
model for this study. In the model, both the energy
balance and force balance between the two particles
on the melt surface were presented. The change of the
capillary interaction energy, DW, between the two
spherical inclusions with a separation distance L is
given by [54, 55].
DW ¼ �pcX2
k¼1
Qkhk �Qk1hk1ð Þ 1 þO q2R2k
� � ð14Þ
where Qk and Qk? are the effective capillary charges
at the separation distance as L and infinity. hk and hk?denote the height differences of the meniscus at the
separation distance as L and infinity. The subscript k
represents inclusions 1 and 2 in an aggregate pair. We
refer Ref. [52] for more details of the parameter
determination. O(x) is the zero function of the
approximation. The parameter q denotes the density
ratio between the inclusion and alloy. The attractive
capillary force, F, at the different distances (L) gives
F ¼ d DWð ÞdL
ð15Þ
The change of the capillary interaction energy DWcan be calculated by the contributions from wetting,
meniscus surface free energy part and gravity. A
simplified model to evaluate the capillary force can
be expressed as Eq. (16). The details of the equations
deviation can be found elsewhere [52, 53].
F ¼ 2pcQ1Q2 1 � q2L2
� L
rk � L � q�1�
ð16Þ
where Q1 and Q2 are effective capillary charges of
inclusions 1 and 2 when the distance between two
inclusions is L. The physical parameters including
surface tension of liquid metal (c), density of non-
metallic inclusions (qi (i = 1, 2)), contact angle
between liquid melt and inclusion (h) are used to
represent different types of inclusions. The physical
parameters data selection can be seen in Ref. [53, 56].
This model has been validated using the confocal
laser scanning microscopy, and the results are plotted
in Fig. 9. The case of two inclusions in a pair with the
same radius of 1 lm is considered as well for
1
10
100
1000
0.1 1 10
Crit
ical
dis
tanc
e [µ
m]
Inclusion radius, r [µm]
h=1m
h=0.01m
h=0.001m
TiOxAl2O3
Figure 8 Critical distance of cavity bridge force changed with the
inclusion radius.
20 40 60 80 10010-26
10-25
10-24
10-23
10-22
10-21
Oxide particles in the melt
R1=R2=1 µm
Attr
activ
eca
pilla
ry fo
rce
(N)
Distance between inclusions ( m)
TiO2
TiOx
Ti2O3
Al2O3
Figure 9 Comparison of calculated capillary force between
Al2O3, Ti2O3 and TiO2 at the surface of liquid metal.
J Mater Sci (2019) 54:8684–8695 8691
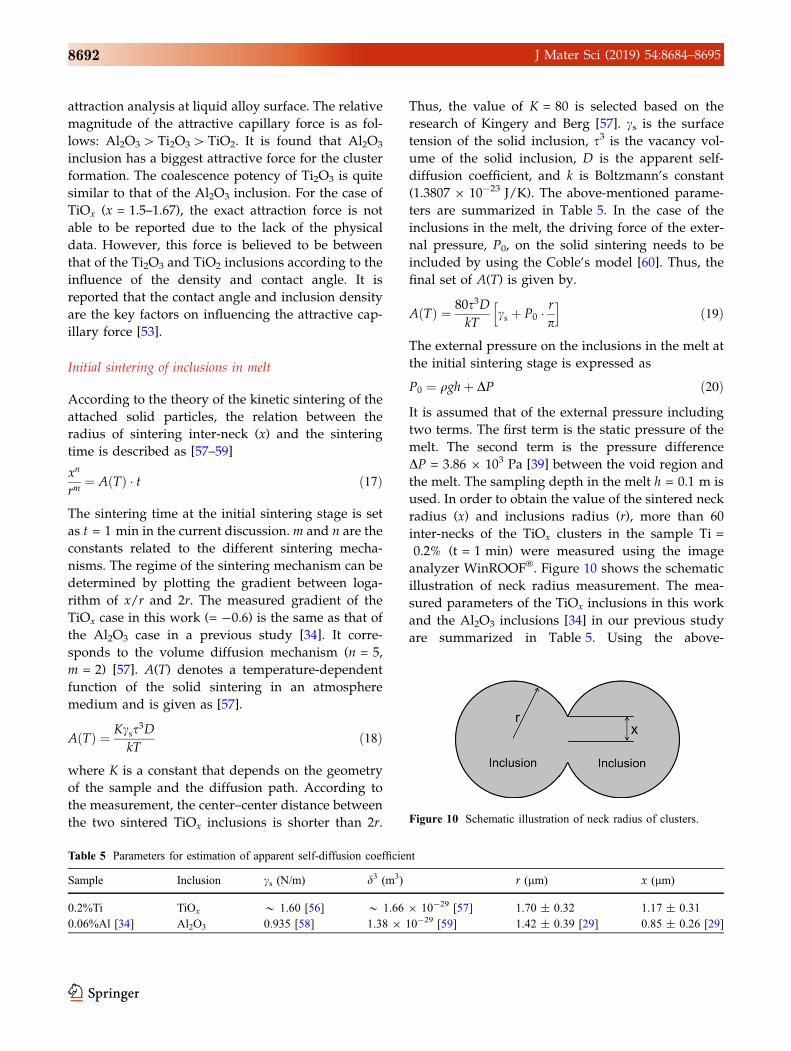
attraction analysis at liquid alloy surface. The relative
magnitude of the attractive capillary force is as fol-
lows: Al2O3[Ti2O3[TiO2. It is found that Al2O3
inclusion has a biggest attractive force for the cluster
formation. The coalescence potency of Ti2O3 is quite
similar to that of the Al2O3 inclusion. For the case of
TiOx (x = 1.5–1.67), the exact attraction force is not
able to be reported due to the lack of the physical
data. However, this force is believed to be between
that of the Ti2O3 and TiO2 inclusions according to the
influence of the density and contact angle. It is
reported that the contact angle and inclusion density
are the key factors on influencing the attractive cap-
illary force [53].
Initial sintering of inclusions in melt
According to the theory of the kinetic sintering of the
attached solid particles, the relation between the
radius of sintering inter-neck (x) and the sintering
time is described as [57–59]
xn
rm¼ A Tð Þ � t ð17Þ
The sintering time at the initial sintering stage is set
as t = 1 min in the current discussion. m and n are the
constants related to the different sintering mecha-
nisms. The regime of the sintering mechanism can be
determined by plotting the gradient between loga-
rithm of x/r and 2r. The measured gradient of the
TiOx case in this work (= -0.6) is the same as that of
the Al2O3 case in a previous study [34]. It corre-
sponds to the volume diffusion mechanism (n = 5,
m = 2) [57]. A(T) denotes a temperature-dependent
function of the solid sintering in an atmosphere
medium and is given as [57].
A Tð Þ ¼ Kcss3D
kTð18Þ
where K is a constant that depends on the geometry
of the sample and the diffusion path. According to
the measurement, the center–center distance between
the two sintered TiOx inclusions is shorter than 2r.
Thus, the value of K = 80 is selected based on the
research of Kingery and Berg [57]. cs is the surface
tension of the solid inclusion, s3 is the vacancy vol-
ume of the solid inclusion, D is the apparent self-
diffusion coefficient, and k is Boltzmann’s constant
(1.3807 9 10-23 J/K). The above-mentioned parame-
ters are summarized in Table 5. In the case of the
inclusions in the melt, the driving force of the exter-
nal pressure, P0, on the solid sintering needs to be
included by using the Coble’s model [60]. Thus, the
final set of A(T) is given by.
A Tð Þ ¼ 80s3D
kTcs þ P0 �
r
p
h ið19Þ
The external pressure on the inclusions in the melt at
the initial sintering stage is expressed as
P0 ¼ qghþ DP ð20Þ
It is assumed that of the external pressure including
two terms. The first term is the static pressure of the
melt. The second term is the pressure difference
DP = 3.86 9 103 Pa [39] between the void region and
the melt. The sampling depth in the melt h = 0.1 m is
used. In order to obtain the value of the sintered neck
radius (x) and inclusions radius (r), more than 60
inter-necks of the TiOx clusters in the sample Ti =
0.2% (t = 1 min) were measured using the image
analyzer WinROOF�. Figure 10 shows the schematic
illustration of neck radius measurement. The mea-
sured parameters of the TiOx inclusions in this work
and the Al2O3 inclusions [34] in our previous study
are summarized in Table 5. Using the above-
Table 5 Parameters for estimation of apparent self-diffusion coefficient
Sample Inclusion cs (N/m) d3 (m3) r (lm) x (lm)
0.2%Ti TiOx * 1.60 [56] * 1.66 9 10-29 [57] 1.70 ± 0.32 1.17 ± 0.31
0.06%Al [34] Al2O3 0.935 [58] 1.38 9 10-29 [59] 1.42 ± 0.39 [29] 0.85 ± 0.26 [29]
Figure 10 Schematic illustration of neck radius of clusters.
8692 J Mater Sci (2019) 54:8684–8695

mentioned set of equations, the self-diffusion coeffi-
cient D = 1.5 9 10-13 m2/s of the TiOx inclusion is
obtained. It is about 1.7 times larger than that of the
Al2O3 inclusion [34] at a constant temperature as
1873 K.
Conclusions
The focus of the present work is the composition
evolution and coalescence behavior of the titanium
oxide particles in the Iron-Nickel binary alloy melt.
The important conclusions were drawn here.
1. The morphology of the observed inclusion in Fe–
10%Ni melt has a tendency to change from a
single sphere to an agglomerated cluster with the
increase in Ti content.
2. The chemical ratio of Fe/Ti decreases obviously
with the increasing Ti addition amount from 0.03
to 0.2%, which leads to the inclusion evolution
from the liquid to the solid.
3. Both the experimental results and thermody-
namic calculation indicate that the amount of
the titanium addition needs to be smaller than
Ti = 0.1% to avoid the cluster formation in the
melt that includes a total oxygen as 0.015%.
4. The coalescence degree of the TiOx inclusion in
the liquid alloy matrix is smaller but closed to
that of the Al2O3 inclusion. The similar conclu-
sion can be made for the case of inclusion
coalescence at the melt surface, even if the
mechanism is the attraction capillary force.
5. The apparent self-diffusion of TiOx for solid
sintering is calculated to be about 1.7 times
stronger than that of Al2O3. This calculation leads
to a statement that TiOx cluster can build up a
stable structure more easily compared with
Al2O3.
Acknowledgements
CX would like to thank Docent Andrey Karasev and
Professor Par Jonsson at KTH Royal Institute of
Technology for the assistance of sample preparation
and discussion. WM would like to acknowledge the
financial support from the Swedish Foundation for
International Cooperation in Research and Higher
Education (STINT, No. PT2017-7330).
Open Access This article is distributed under the
terms of the Creative Commons Attribution 4.0
International License (http://creativecommons.org/
licenses/by/4.0/), which permits unrestricted use,
distribution, and reproduction in any medium, pro-
vided you give appropriate credit to the original
author(s) and the source, provide a link to the Crea-
tive Commons license, and indicate if changes were
made.
References
[1] Hamzaoui R, Elkedim O, Fenineche N, Gaffet E, Craven J
(2003) Structure and magnetic properties of nanocrystalline
mechanically alloyed Fe–10% Ni and Fe–20% Ni. Mater Sci
Eng A 360(1–2):299–305
[2] Hamzaoui R, Elkedim O, Gaffet E (2004) Milling conditions
effect on structure and magnetic properties of mechanically
alloyed Fe–10% Ni and Fe–20% Ni alloys. Mater Sci Eng A
381(1–2):363–371
[3] Hamzaoui R, Elkedim O (2013) Magnetic properties of
nanocrystalline Fe–10% Ni alloy obtained by planetary ball
mills. J Alloys Compd 573:157–162
[4] Li JF, Jie WQ, Yang GC, Zhou YH (2002) Solidification
structure formation in undercooled Fe–Ni alloy. Acta Mater
50(7):1797–1807
[5] Zeng T (2017) On the martensitic structure and hardness in
as-quenched Fe–Ni alloys. J. Alloys Compd. https://doi.org/
10.1016/j.jallcom.2017.08.285
[6] Nakada N (2017) Direct observation of martensitic reversion
from lenticular martensite to austenite in Fe–Ni alloy. Mater
Lett 187:166–169
[7] Sato H, Zaefferer S (2009) A study on the formation
mechanisms of butterfly-type martensite in Fe–30% Ni alloy
using EBSD-based orientation microscopy. Acta Mater
57(6):1931–1937
[8] Karasev AV, Suito H (2008) Characteristics of fine oxide
particles produced by Ti/M (M = Mg and Zr) complex
deoxidation in Fe–10mass% Ni alloy. ISIJ Int
48(11):1507–1516
[9] Pratsinis SE, Kim KS (1989) Particle coagulation, diffusion
and thermophoresis in laminar tube flows. J Aerosol Sci
20(1):101–111
[10] Mu W, Dogan N, Coley KS (2018) In situ observation of
deformation behavior of chain aggregate inclusions: a case
study for Al2O3 at a liquid steel/argon interface. J Mater
Sci 53:13203–13215. https://doi.org/10.1007/s10853-018-2
557-0
J Mater Sci (2019) 54:8684–8695 8693

[11] Xuan CJ, Karasev AV, Jonsson PG (2016) Evaluation of
agglomeration mechanisms of non-metallic inclusions and
cluster characteristics produced by Ti/Al complex deoxida-
tion in Fe–10mass% Ni alloy. ISIJ Int 56(7):1204–1209
[12] Malmberg KJ, Shibata H, Kitamura SY, Jonsson PG,
Nabeshima S, Kishimoto Y (2010) Observed behavior of
various oxide inclusions in front of a solidifying low-carbon
steel shell. J Mater Sci 45(8):2157–2164. https://doi.org/10.
1007/s10853-009-3982-x
[13] Mu W, Jonsson PG, Nakajima K (2014) Effect of sulfur
content on inclusion and microstructure characteristics in
steels with Ti2O3 and TiO2 additions. ISIJ Int
54(12):2907–2916
[14] Karasev A, Suito H (1999) Quantitative evaluation of
inclusion in deoxidation of Fe–10 mass pct Ni alloy with Si,
Ti, Al, Zr, and Ce. Metall Mater Trans B 30(2):249–257
[15] Sun MK, Jung IH, Lee HG (2008) Morphology and chem-
istry of oxide inclusions after Al and Ti complex deoxida-
tion. Met Mater Int 14:791–798
[16] Dashevskii VY, Aleksandrov AA, Kanevskii AG, Makarov
MA (2010) Deoxidation equilibrium of titanium in the iron–
nickel melts. ISIJ Int 50(1):44–52
[17] Suzuki K, Sanbongi K (1975) Equilibrium study on deoxi-
dation of steel with titanium. Trans Iron Steel Inst Jpn
15(12):618–627
[18] Evans EL, Sloman HA (1953) Studies in the deoxidation of
iron deoxidation by titanium. J Iron Steel Inst 174:318–324
[19] Chino H, Nakamura Y, Tsunetomi E, Segawa K (1966) The
deoxidation with titanium in liquid iron. Tetsu-to-Hagane
52(6):959–966
[20] Kojima Y, Inouye M, Ohi J (1969) Titanoxyd im Gleich-
gewicht mit Eisen–Titan–Legierungen bei 1600�C. Arch
Eisenhuttenwes 40(9):667–671
[21] Fruehan RJ (1970) Activities in liquid Fe–Al–O and Fe–Ti–
O alloys. Metall Trans 1(12):3403–3410
[22] Lombardi A, Mu W, Ravindran C, Dogan N, Barati M
(2018) Influence of Al2Cu morphology on the incipient
melting characteristics in B206 Al alloy. J Alloys Compd
747:131–139
[23] Sakata K, Suito H (1999) Dispersion of fine primary inclu-
sions of MgO and ZrO2 in Fe–10mass pct Ni alloy and the
solidification structure. Metall Mater Trans B
30(6):1053–1063
[24] Inoue R, Suito H (1991) Determination of oxygen in iron-
aluminum alloy by inert gas fusion-infrared absorptiometry.
Mater Trans JIM 32(12):1164–1169
[25] Macchesney JB, Muan A (1961) Phase equilibria at liquidus
temperatures in the system iron oxide-titanium oxide at low
oxygen pressures. Am Miner 46:572–582
[26] Xuan CJ, Shibata H, Sukenaga S, Josson PG, Nakajima K
(2015) Wettability of Al2O3, MgO and Ti2O3 by liquid iron
and steel. ISIJ Int 55(9):1882–1890
[27] Hadley RL, Derge G (1955) Equilibrium between titanium in
liquid iron and titanium oxides. Trans Metall Soc AIME
203:55–60
[28] Suzuki K, Omori Y, Sanbongi K (1967) Deoxidation of steel
by titanium. Bull Res Inst Miner Dress Metall 23:137–146
[29] Nakaoka T, Taniguchi S, Matsumoto K, Johansen ST (2001)
Particle-size-grouping method of inclusion agglomeration
and its application to water model experiments. ISIJ Int
41(10):1103–1111
[30] Lei H, Nakajima K, He JC (2010) Mathematical model for
nucleation, Ostwald ripening and growth of inclusion in
molten steel. ISIJ Int 50(12):1735–1745
[31] Nakanishi K, Szekely J (1975) Deoxidation kinetics in a
turbulent flow field. Trans Iron Steel Inst Jpn
15(10):522–530
[32] Fowkes FM (1964) Attractive forces at interfaces. Ind Eng
Chem 56(12):40–52
[33] Visser J (1972) On Hamaker constants: a comparison
between Hamaker constants and Lifshitz–van der Waals
constants. Adv Colloid Interface Sci 3(4):331–363
[34] Xuan CJ, Karasev AV, Jonsson PG, Nakajima K (2016)
Attraction force estimations of Al2O3 particle agglomera-
tions in the melt. Steel Res Int 87(2):1600090. https://doi.
org/10.1102/sirn.201600090
[35] Owens DK, Wendt RC (1969) Estimation of the surface free
energy of polymers. J Appl Poly Sci 13(8):1741–1747
[36] Kuscer D, Kovac J, Kosec M, Andriesen R (2008) The effect
of the valence state of titanium ions on the hydrophilicity of
ceramics in the titanium–oxygen system. J Eur Ceram Soc
28(3):577–584
[37] Bergstrom L (1997) Hamaker constants of inorganic mate-
rials. Adv Colloid Interface Sci 70:125–169
[38] Velarde MG and Zeytounian RK (Eds) (2002) Interfacial
phenomena and the Marangoni effect, vol 428. Vienna/New
York: Springer, p 256
[39] Sasai K (2015) Direct measurement of agglomeration force
exerted between alumina particles in molten steel. Tetsu-to-
Hagane 101(5):275–283
[40] Fisher RA (1926) On the capillary forces in an ideal soil.
J Agric Sci 16(3):492–505
[41] Humenik JRM, Kingery WD (1953) Metal-ceramic interac-
tions: III, surface tension and wettability of metal-ceramic
systems. J Am Ceram Soc 37(1):18–23
[42] Eustathopoulos N (1998) Dynamics of wetting in reactive
metal/ceramic systems. Acta Mater 46(7):2319–2327
[43] Naidich YV (1981) The wettability of solids by liquid
metals. In: Cadenhead DA, Danielli JF (eds), Progress in
8694 J Mater Sci (2019) 54:8684–8695

surface and membrane science, vol 14 Academic Press, New
York, pp 353–484
[44] Ogino K, Nogi K, Koshida Y (1973) Effect of oxygen on the
wettability of solid oxide with molten iron. Tetsu-to-Hagane
59(10):1380–1387
[45] Kapilashrami E, Jakobsson A, Seetharaman S, Lahiri AK
(2003) Studies of the wetting characteristics of liquid iron on
dense alumina by the X-ray sessile drop technique. Metal
Mater Trans B 34(2):193–199
[46] Poirier DR, Yin HB, Suzuki M, Emi T (1998) Interfacial
properties of dilute Fe–O–S melts on alumina substrates. ISIJ
Int 38(3):229–238
[47] Jimbo I, Cramb AW (1992) Computer aided interfacial
measurements. ISIJ Int 32(1):26–35
[48] Alle BC, Kingery WD (1959) Surface tension and contact
angle. Trans Met Soc AIME 215(1):30–37
[49] Takiuchi N, Taniguchi T, Tanaka Y, Shinozaki N, Mukai K
(1991) Effects of oxygen and temperature on the surface
tension of liquid iron and its wettability of alumina. J Jpn
Inst Met 55:180–185
[50] Takiuchi N, Taniguchi T, Shinozaki N, Mukai K (1991)
Effects of oxygen on the surface-tension of liquid iron and
the wettability of alumina by liquid-iron. J Jpn Inst Met
55:44–49
[51] Nakashima K, Takihira K, Mori K, Shinozaki N (1992)
Wettability of Al2O3 substrate by liquid iron-effects of
oxygen in liquid iron and purity of Al2O3 substrate. Mater
Trans JIM 33(10):918–926
[52] Mu W, Dogan N, Coley KS (2017) Agglomeration of non-
metallic inclusions at steel/Ar interface: in-situ observation
experiments and model validation. Metall Mater Trans B
48(5):2379–2388
[53] Mu W, Dogan N, Coley KS (2017) Agglomeration of non-
metallic inclusions at the steel/Ar interface: model applica-
tion. Metall Mater Trans B 48(4):2092–2103
[54] Kralchevsky PA, Paunov VN, Denkov ND, Ivanoc IBV,
Nagayama KM (1993) Energetical and force approaches to
the capillary interactions between particles attached to a
liquid-fluid interface. J Colloid Interface Sci 155:420–437
[55] Paunov VN, Kralchevsky PA, Denkov ND, Nagayama K
(1993) Lateral capillary forces between floating submil-
limeter particles. J Colloid Interface Sci 157(1):100–112
[56] Kobatake H, Brillo J (2013) Density and thermal expansion
of Cr–Fe, Fe–Ni, and Cr–Ni binary liquid alloys. J Mater
Sci 48(14):4934–4941. https://doi.org/10.1007/s10853-013-
7274-0
[57] Kingery WD, Berg M (1955) Study of initial stages of sin-
tering solids by viscous flow, evaporation-condensation, and
self-diffusion. J Appl Phys 26(10):1205–1212
[58] Kuczynski GG (1949) Self-diffusion in sintering of metallic
particles. Trans AIME 185:169–178
[59] Coble RL (1958) Initial sintering of alumina and hematite.
J Am Ceram Soc 41(2):55–62
[60] Coble RL (1970) Diffusion models for hot pressing with
surface energy and pressure effects as driving forces. J Appl
Phys 41:4798–4807
Publisher’s Note Springer Nature remains neutral with
regard to jurisdictional claims in published maps and
institutional affiliations.
J Mater Sci (2019) 54:8684–8695 8695