
Nanofiltration membranes based on polyvinylidene fluoride ...

Subscriber access provided by UNIV AUTO DEL ESTADO DE HIDALGO UAEH
Environmental Science & Technology is published by the American Chemical Society.1155 Sixteenth Street N.W., Washington, DC 20036
Article
Temperature Effects on the Morphology of PorousThin Film Composite Nanofiltration Membranes
Ramesh R. Sharma, and Shankararaman ChellamEnviron. Sci. Technol., 2005, 39 (13), 5022-5030• DOI: 10.1021/es0501363 • Publication Date (Web): 19 May 2005
Downloaded from http://pubs.acs.org on April 24, 2009
More About This Article
Additional resources and features associated with this article are available within the HTML version:
• Supporting Information• Access to high resolution figures• Links to articles and content related to this article• Copyright permission to reproduce figures and/or text from this article

Temperature Effects on theMorphology of Porous Thin FilmComposite NanofiltrationMembranesR A M E S H R . S H A R M A † A N DS H A N K A R A R A M A N C H E L L A M * , † , ‡
Department of Civil and Environmental Engineering,4800 Calhoun Road, University of Houston,Houston, Texas 77204-4003, and Department of ChemicalEngineering, University of Houston,Houston, Texas 77204-4004
Even though polymeric nanofiltration (NF) and reverseosmosis (RO) membranes often operate on surface watersand surficial groundwaters whose temperature variesover time and with season, very little detailed mechanisticinformation on temperature effects on membraneselectivity is available to date. Hence, a study wasundertaken to investigate the effects of operating temperature(5-41 °C) on the morphology and structure of twocommercially available thin film composite NF membranes.Application of hydrodynamic models to experimentalrejection of dilute solutions of hydrophilic neutral alcohols,sugars, and poly(ethylene glycol)s revealed changes inboth the sieving coefficient and permeability of solutesbelow the membrane glass transition temperature. The vastmajority of pores were smaller than 2 nm for bothmembranes (network pores) even though evidence for asmall fraction of larger aggregate pores (∼30 nm) was alsoobtained for one membrane. Increasing temperatureappears to cause structural changes in network pores byincreasing its pore size while simultaneously decreasingpore density. These increases in pore sizes partially explainreported reductions in contaminant (e.g. arsenic, salts,natural organic matter, hardness, etc.) removal by NF andRO membranes with increasing temperature.
Even though nanofiltration (NF) membranes achieve highremovals of several drinking water contaminants includingnatural organic matter and disinfection byproduct precursors(1, 2), endocrine disrupting compounds (3, 4), pesticides (5,6), nitrogenous compounds (7), arsenic (8), etc. the factorsgoverning their separation have not yet been comprehen-sively elucidated even at room temperature. Additionally,wide temperature variations (1-35 °C) of NF and reverseosmosis (RO) membrane feedwaters (9-11) necessitatemechanistic studies on temperature effects on membraneselectivity.
Most investigators have simply reported that increases inwater temperature increased passage of salts (9, 10, 12),hardness (13), natural organic matter (14), and arsenic (8)across polymeric membranes. Paradoxically, very little
detailed mechanistic information on temperature effects onmembrane selectivity is available to date.
The pore size distribution (PSD), pore density, andmorphology of nanofilters are essential to hindered diffusionand convection calculations that are central to understandingtheir intrinsic selectivity properties (4, 7, 15-17). In thismanuscript we relate changes in selectivity with temperatureto variations in the structure and morphology of the polymer(including PSD) constituting the active layer of the mem-brane.
Recently, we reported that employing a single log-normaldistribution for the PSD systematically over predictedexperimental sieving data for neutral solutes larger than 0.6nm for one nanofilter (18). An additional focus of this researchis to improve our recent work (18) and derive a single PSDdensity function (potentially bimodal) to accurately describemembrane sieving over a wide range of solute sizes.
The principal objective of this work is to deduce variationsin skin layer morphology of polymeric thin film compositeNF membranes (PSD, pore connectivity, and pore numberdensity) with operating temperature. Rejection of severalneutral solutes (that served as molecular tracers) by twocommercially available nanofilters was measured in theenvironmentally significant range 5-41 °C. PSDs at differenttemperatures were derived from solute sieving data usinghindered convection considerations. Also, diffusive perme-abilities of solutes with different molecular dimensions wereevaluated using a modified porous pathway model account-ing for PSD, pore density, and solute dependent tortuosity.
Theoretical WorkTransport Equations. For porous or “loose” nanofilters, inthe absence of specific chemical and electrostatic interac-tions, the local uncharged solute flux (JS) through a membranepore is due to contributions from diffusive and convectiveflows (4, 7, 15, 19)
where c is the radially averaged solute concentration in thepore, Jv is the radially averaged solution velocity in the pore,D∞ is the bulk solution diffusivity, and Kd and Kc are thehindrance factors for diffusion and convection, respectively.To obtain the solute sieving coefficient (Si), eq 1 has beenintegrated over the effective membrane thickness (∆x) withappropriate boundary conditions on the feed and permeateside and correcting for concentration polarization effectsusing film theory on membrane feed side as (19)
where Cp and Cb are the permeate and bulk phase soluteconcentrations, and k is the feed side mass transfer coef-ficient. All our experiments were designed to minimizeconcentration polarization effects (k f ∞) allowing themembrane phase concentration to be closely approximatedas the bulk concentration (see Experimental Work sectionand ref 18). S∞, the asymptotic sieving coefficient attained asPeclet number (Pe) f ∞ is a measure of solute transportsolely due to convection and is equal to the product ofequilibrium partitioning coefficient, Φ and Kc. The membranePeclet number is defined as (19)
* Corresponding author phone: (713)743-4265; fax: (713)743-4260;e-mail: [email protected].
† Department of Civil and Environmental Engineering.‡ Department of Chemical Engineering.
JS ) -KdD∞dcdx
+ KccJv (1)
Si )Cp
Cb)
S∞exp(Jv
k)(1 - exp(-Pe))(1 - S∞) + S∞exp(Jv
k)(2)
Environ. Sci. Technol. 2005, 39, 5022-5030
5022 9 ENVIRONMENTAL SCIENCE & TECHNOLOGY / VOL. 39, NO. 13, 2005 10.1021/es0501363 CCC: $30.25 2005 American Chemical SocietyPublished on Web 05/19/2005

where Ak is membrane surface porosity, ∆x is the effectivedistance traveled by solute or solvent through the membranepore (accounting for tortuosity), and PM is solute permeabilitycoefficient, which is the measure of solute transport due todiffusion. Membrane phenomenological parameters (S∞ andPM) and feed side mass transfer coefficient (k) were obtainedby fitting eq 2 to experimental measurements of Cp over awide range of volumetric fluxes (Jv) at a constant feed flowrate and feed concentration (18). Further, hydrodynamicmodels of hindered convection in cylindrical pores (20) andslit pores (15) were used to relate S∞ and pore radius or halfpore width.
Membrane Pore Size and Pore Size Distribution Ob-tained from (Hindered) Convection Calculations. Becausethe log-normal distribution may be most appropriate formembranes (18, 21, 22) it was used as the basis for PSDcalculations. A linear combination of a maximum of 2 log-normal distributions was used to quantify the entire rangeof pore sizes that were encountered:
The coefficients hi are non-negative and ∑ihi ) 1, fi(r)represents the ith log-normal distribution based on porenumber with mean rji and standard deviation SPi and r is thepore radius. hi represents the sieving contribution of the ithdistribution.
First, using a semiempirical approach adopted by severalauthors (18, 21-24), we assume that solute rejection is purelydue to geometric considerations. This approach, wherein asolute of radius r* permeates through all the pores whoseradii are larger than itself (r* to ∞) provides consistent results(23) even though it explicitly ignores any additional drag thesolute may experience in the confined environment of themembrane pore. The sieving coefficient according to thispurely sieving model is
Next, we have employed a mechanistic approach (19) thataccounts for the hydrodynamic lag and steric effects bynormalizing the convective hindrance coefficient for eachtype of pore on the basis of volumetric flow rate throughcylindrical and slit shape pores to calculate an averageasymptotic sieving coefficient, ⟨S∞⟩
where r is used interchangeably to represent pore radius forcylindrical pores (n ) 4) and or half width for slit pores (n) 3). Membrane pores were conceptualized to have theseshapes because closed form analytical expressions for thehindrance factors are available for these pore geometries(15, 20). Because slit and cylindrical pore models are bothonly model conceptualizations of the complex pore networkcharacteristic of NF membranes, one of them cannot be saidto be better than the other. Thus, both approaches (semiem-
pirical eq 5 and mechanistic eq 6) were used to investigategeneral trends in PSD with temperature. The PSD parameters(rji, and SPi) were then calculated by fitting eqs 5 and 6 to theexperimental asymptotic sieving coefficient using nonlinearleast squares regression. Integration was performed usingSimpson’s rule with a narrow step size and a truncation errorof 0.01%.
Analysis of Hindered Diffusion through MembranePores. We have incorporated steric hindrances to diffusionby introducing the hindrance factor to represent solutepermeability (25) in cylindrical pores as
The free diffusion coefficient of solutes employed in thiswork was obtained from the literature (26-28), and the poresize distribution has already been determined using eqs 5and 6 as described in the previous section. Thus, the onlyunknown in eq 7 is the term N0/∆x, which was calculated byfitting the experimental permeability data to the respectiveequations.
Membrane pores can be expected to be tortuous andpotentially interconnected with some surface pores not evenpenetrating the entire thickness of the active layer (29, 30).Hence, the effective membrane thickness ∆x is given by theproduct of the tortuosity (τp) and membrane thickness (L):
Recently, a closed form expression for tortuosity as afunction of pore and solute radius (τp(r*)) was derived for acubical network of cylindrical pores (31). We have modifiedtheir equation to account for hydrodynamic lag in the poresby introducing an additional parameter in the form of ahindrance factor for diffusion (Kd) as
Due to the cubical geometry of pore network, pores caneither be parallel or normal to the membrane surface. Thedistance between the two adjacent pores oriented parallelto the membrane surface is â and the distance between twonormal pores is η, which is related to pore density as
â and N0 were estimated by fitting eqs 7-10 to experi-mental permeability data after obtaining L from scanningelectron microscopy.
Solute Size Calculations. In this study, the Stokes radius,molecular width, and mean molecular radius (MMR) ofsolutes were all used to characterize NF membranes.Experimental reports of diffusion coefficients at 25 °C for allsolutes were obtained (26-28, 32) to calculate the Stokesradius. Bulk diffusivities of solutes at temperatures other than25 °C were estimated using temperature and viscositycorrections (27).
To better account for shape effects on the removal themolecular width and mean molecular radius were alsocalculated for the solutes employed. Giddings (33) theoreti-cally analyzed a variety of molecule shapes and showed thatpurely steric partitioning is dominated by the extreme groupsof the molecule, whereas internal shielded groups have noinfluence on it. Recognizing this result, we derive a meanmolecular radius that represents the mean length of projec-tion of the molecule along the X, Y, and Z axes using a
Pe )ΦKc
ΦKdD∞
Ak
∆x
Jv )ΦKc
PMJv (3)
f(r) ) ∑i)1
2
hifi(r) ) ∑i)1
2 hi
SPirx2πexp(-
(ln(r) - ln(rji))2
2SPi2 )
(4)
S∞(r*) ) ∑i)1
2
hi∫r*
∞ 1
SPirx2πexp(-
(ln(r) - ln(rji))2
2SPi2 )dr
(5)
⟨S∞⟩ )∫0
∞(ΦKc) f(r) rndr
∫0
∞f(r) rndr
(6)
PM ) D∞πN0
∆x∫0
∞ΦKd f(r)r2 dr (7)
∆x ) τpL (8)
τp(r*) ) 1 +4
5(η
â)∑n)1
∞
n(3
4)n-1
(∫r*
∞Kd f(r)dr)n (9)
η ) x 1N0
(10)
VOL. 39, NO. 13, 2005 / ENVIRONMENTAL SCIENCE & TECHNOLOGY 9 5023

commercially available software (Chem 3D, CambridgesoftCorp., v. 5). Details of MMR estimation and a comparisonof solute size parameters are given in the SupportingInformation.
Experimental WorkMembranes. Two commercially available, polyamide thinfilm composite membranes denoted as “DL” (Osmonics,Minnetonka, MN) and “TFCS” (Koch Fluid Systems, SanDiego, CA) were employed. The manufacturers provided noinformation regarding possible surface chemical modifica-tions. Operationally, sodium chloride rejection for DL andTFCS membrane (at 1 mequiv/L concentration and 345 kPa)were 52% and 77%, respectively. These low rejections indicatethat the DL and TFCS membranes should be considered asporous or “loose” nanofilters.
Solutes Employed. Tracers such as sugars and alcoholswhich have well-defined transport properties were chosenbecause of the need to quantify membrane morphologyrather than their presence in water supplies. All experimentswere conducted using reagent grade neutral organic solutesviz. methanol, ethanol, ethylene glycol, tert-butyl alcohol,dextrose, and sucrose (EM Science Gibbstown, NJ), xylose,glycerol, raffinose 5-hydrate, and R-cyclodextrin as well aspoly(ethylene glycol)s (PEGs) of 20 kDa, 35 kDa, and 100 kDa(Sigma Aldrich Company, St. Louis, MO). These alcohols,sugars, and PEGs are often employed in studies of hinderedtransport across membranes (16, 18, 30, 32). Similar to otherstudies (4, 34), the target feedwater concentration for allsolutes was set at 20 mg/L total organic carbon (TOC). Thisvalue facilitated easy, accurate, and precise measurementsof both feed and permeate concentrations necessary tocalculate rejection. The concentrations of all solutes wereanalyzed using a TOC analyzer (TOC5050A, Shimadzu,Columbia, MD). All results reported are an average of fouror five injections with a coefficient of variation < 2%.
Bench-Scale Cross-Flow Experimental Apparatus. Allexperiments were conducted at constant cross-flow velocitybut varying flux using a pressurized cell (Sepa CF cell,Osmonics, Minnetonka, MN) that accommodates a 19 cm ×14 cm flat membrane sheet (effective filtration area 155 cm2).The retentate and permeate streams were recycled to thefeed tank containing 20 L of water with a single organic solutemaintaining a constant feed concentration ∼20 mg/L TOC.A positive displacement gear pump (model 74011-11, Cole-Parmer, Chicago, IL) minimized pressure fluctuations. Thecross-flow velocity was maintained constant at 9.6 and 19.2cm/s for DL and TFCS membrane, respectively. Inertmaterials such as Teflon or stainless steel were used for alltubing, connections, pump-heads, and the membrane cell.
Filtration pressure and temperature were monitored usinganalogue transducers (PX303-200G5V and TJ120 CPSS 116G,Omega Engineering Company, Stamford, CT). For pure waterpermeability measurements, filtered water was continuouslycollected on a digital weighing balance (Ohaus NavigatorN1H110, Fisher Scientific, Houston, TX). The built-in RS232port in the balance was directly connected to a computer toobtain the digital signal corresponding to the weight. Theseanalogue and digital signals were acquired at a rate of 1 perminute using LabVIEW (Version 5.1, National Instruments,Austin, TX). Permeate and retentate flows were also manuallymeasured.
The complete cross-flow filtration apparatus was housedin a chamber whose temperature was adjusted to 5, 15, 23,35, and 41 °C. The entire apparatus including the water wasequilibrated to the chosen temperature for a minimum of 30h prior to the commencement of experiments.
Conduct of Experiments. Fresh membrane coupons werefirst soaked face down in ultrapure water that was replenished3 or 4 times over a 24 h period. This coupon was then placed
in the membrane holder, and ultrapure water was passedthrough the entire apparatus at ∼750-800 kPa pressure for24 h. Following this membrane-setting period, steady-statefluxes were measured for pressures in the range 100-760kPa.
All experiments were conducted at low feedwater recovery(<1%) in conjunction with high cross-flow velocity to reducechanges in bulk concentration. The permeate concentrationswere measured as a function of volumetric flux after theattainment of steady-state by varying pressure in randomorder to reduce systematic errors in our experimentalmeasurements. Five to seven different pressures in the range100-760 kPa were used for each combination of solute,membrane, and temperature. This pressure range resultedin initial fluxes between 0.77 and 10 µm/s at 23 °C. After bothpermeate flux and solute rejection were maintained at theirsteady-state values for at least 5-10 h, five separate 10 mLsamples of permeate water were collected for TOC analysis.Thus, each phenomenological coefficient corresponds to 25-35 measurements of solute rejection allowing increasedprecision of parameter estimates. The retentate flow rateand concentration were also measured in order to conductmass balances.
More details on the materials and experimental protocolscan be found in ref 18.
Results and DiscussionPores in nanofilters can be conceived as the polymer free(void) spaces in the membrane matrix through which soluteand water transport occurs (35). Such a system can becharacterized by calculating the number and diameter ofcylindrical or slit pores, which would have the same totalvolume as well as flow and transport properties as the actualmembrane itself (24, 30). Hence, membrane morphologicalparameters including pore size distribution, pore density,ratio of pore density to effective thickness, tortuosity, andpore spacing calculated using hydrodynamic transportmodels (eqs 5-10) should only be interpreted as being“effective” values. In other words, the exact values ofmembrane morphological parameters obtained by fitting thetransport model to experimental data should be cautiouslyinterpreted, and only the trends with changing temperatureare emphasized in this paper.
Pore Size Distributions Incorporating Hindered Con-vection. Experimental sieving coefficients for all solutesdecreased with increasing flux (pressure) at each temperature.For example, Figure 1 depicts sieving coefficients and model(eq 2) fits at 23 °C. As observed, excellent fits of thephenomenological model were obtained for all solutes inthe flux range employed. Similar results were obtained at theother temperatures investigated. Further, eq 2 predicts thatat very high fluxes (Pe f ∞) Si f S∞ corresponding to they-intercept in Figure 1. As shown in Figure 1, 25-35experimental measurements of the sieving coefficient ob-tained over a range of fluxes at each temperature were usedto calculate the asymptotic value (S∞) for each solute usingeq 2, which were used next to calculate membrane pore sizedistributions.
The discrete points in Figure 2 correspond to the respectiveS∞ values for each solute at room temperature. The curvesin Figure 2 correspond to calculations of the S∞ as a functionof the mean molecular radius using hydrodynamic modelsof cylindrical (Figure 2a) and slit (Figure 2b) pore geometryusing eq 6. Correlation coefficients for PSDs employing allsolutes for both pore geometries were not excellent (R2 ∼0.60) and had a bias wherein hindered convection factors forthe smallest solutes (methanol, ethanol, and ethylene glycol)were underpredicted. Much better fits of eq 6 were obtainedwhen these solutes were excluded from this analysis (R2 ∼0.80). This could be caused by the slippage of water on the
5024 9 ENVIRONMENTAL SCIENCE & TECHNOLOGY / VOL. 39, NO. 13, 2005

surface of solutes that are approximately the same size asitself (36), which leads to overprediction of drag by hydro-dynamic models. Additionally, the polar nature of thesecompounds further enhances their passage through themembrane pore (37). Therefore, methanol, ethanol, andethylene glycol were not included in PSD calculations, buttheir experimental data are superposed in Figure 2 only forthe sake of comparison.
As observed, experimental sieving coefficients at 23 °Cfor the DL membrane decreased monotonically with soluteMMR suggesting a monomodal pore size distribution. Asexpected, a single log-normal distribution was sufficient toaccurately fit eq 6 to experimental data. In contrast, sievingcoefficients for the TFCS membrane decreased monotonicallyinitially until reaching a constant value near 0.1 for soluteMMR in the range 0.33-6 nm, beyond which it againdecreased for the largest solute investigated (PEG 100K)suggesting a multimodal distribution. A bimodal log-normalPSD incorporating two types of cylindrical pores (type 1: rj1
) 0.48 nm and SP1 ) 0.005 nm and type 2: rj2 ) 16.0 nm andSP2 ) 0.1 nm), closely fit the entire range of experimentalsieving coefficients.
The presence of two distinct types of pores in the TFCSmembrane can be interpreted in terms of network pores andaggregate pores reported for some NF and RO membranes(35, 38, 39). The network pores arise from the spaces between
the segments constituting the polymer network within eachsupermolecular polymer aggregate in the film casting solu-tion, whereas the spaces between each neighboring super-molecular polymer aggregates themselves are referred to asaggregate pores (39). Consistent with these previous findings,the network pores dominated the pore sizes in the membraneskin (h1/h2 ) O(108)). Although, the area fraction of nonse-lective large pores is only 0.01% they dramatically increasethe breadth of the sieving curve (∼30-fold) as seen in Figure2 and control ∼10% of water permeability (see SupportingInformation). Bimodal PSDs indicate the need to determinethe entire sieving curve for each membrane rather than onlyspecifying the molecular weight cutoff.
The DL and TFCS membranes were manufactured by twodifferent corporations, which likely employed differentmaterials for the respective skin layer on each polymericmembrane, resulting in widely different pore size distribu-tions. Good fits between experimental data and theoreticalvalues obtained with eq 6 obtained for both membranes (R2
∼ 0.8) demonstrates the applicability of hindered convectionmodels even for NF membranes. Similar to previous findings(24), even better fits (R2 > 0.95) were obtained for the purelysieving model (see Supporting Information Figure S2).However, its use is limited because it explicitly ignores stericpartitioning and hydrodynamic lag in the pore making it astrictly empirical model. Nevertheless, both eqs 5 and 6 can
FIGURE 1. Estimation of phenomenological transport coefficients at 23 °C using neutral solutes of different molecular dimensions for theDL (a) and TFCS (b) membranes.
FIGURE 2. Comparison of pore size distributions for two NF membranes obtained by fitting the hindered convection models of cylindricalpore (a) and slit pore (b) to experimental asymptotic sieving data of various solutes at 23 °C. Note that small size solutes such as methanol,ethanol, and ethylene glycol have not been included in PSD calculation. They are superposed in this figure only for the sake of comparison.
VOL. 39, NO. 13, 2005 / ENVIRONMENTAL SCIENCE & TECHNOLOGY 9 5025

be used to accurately represent pore size distributions. Inthe next section, we use these models to quantify temperatureeffects on network and aggregate pore sizes.
Effect of Temperature on Pore Size Distributions.Experimental sieving coefficients of various solutes obtainedat 5, 15, 23, 35, and 41 °C for both membranes are superposedon theoretical predictions neglecting hindered convection(eq 5) in Figure 3. For the DL membrane, which only possesesnetwork pores, the entire PSD was shifted to higher valuesof pores sizes (Figure 3a), whereas for TFCS membranes,only the network pores were shifted to higher pore sizes(Figure 3b and its inset). In other words, temperature had astronger influence on the network pores compared toaggregate pores.
Figure 4 depicts the dependence of the asymptotic sievingcoefficient on the ratio of solute size to pore size corre-sponding to S∞ ) 0.5 (denoted as rp,S∞)0.5 in Figure 4) at eachtemperature as suggested by Michaels (22). Pore radius for
50% sieving (S∞ ) 0.5) at 23 °C refers to the x-coordinate ofthe point on the solid curve in Figure 2 corresponding to they-coordinate of 0.5. This exercise was repeated at alltemperatures for both membranes. The insets of Figure 4shows that the pore radius corresponding to S∞ ) 0.5 forboth membranes and pore geometries increased with tem-perature. The appropriate value from the inset was used fornormalization at each temperature, which collapsed allexperimental sieving coefficients in the range 0.1 < S∞ < 1.0to a single curve. Further, theoretical calculations using eq6 for all five temperatures overlapped in Figure 4, appearingas a single curve. Therefore, this normalization allowedsimultaneous comparison of sieving caused by network poresof both membranes in the entire temperature range inves-tigated. In other words, monomodal and bimodal log-normaldistributions are difficult to distinguish experimentally usinglarger values of the sieving coefficient. The choice ofcoordinate scaling suppresses the differences between two
FIGURE 3. Influence of temperature on experimental sieving data using purely sieving log-normal model. Network pore sizes shift to highervalues as temperature increases for both polymeric membranes employed in this study.
FIGURE 4. Dependence of asymptotic sieving coefficient on normalized solute radius (ratio of mean molecular radius and pore radiuscorresponding to 50% sieving, (rp,S∞ ) 0.5)) for both NF membranes. Insets show the increasing trend for pore radius corresponding to50% sieving with temperature for both pore geometries. Experimental sieving coefficients for the TFCS membrane are depicted as emptysymbols and those obtained for the DL membrane as filled symbols. The solid lines depict theoretical predictions of sieving coefficientsusing hindered transport models (eq 6) for both membranes at all five temperatures.
5026 9 ENVIRONMENTAL SCIENCE & TECHNOLOGY / VOL. 39, NO. 13, 2005
membrane structures to such an extent that only significantlydifferent membrane structural characteristics are visible. Forexample, bimodal distribution of the TFCS membranedistinguishes from the monomodal structure of the DLmembrane (both experimentally and theoretically) by thepresence of the second mode for S∞ < 0.1 (aggregate pores),while the first mode overlaps the monomodal distributionfor 0.1 < S∞ < 1.0 (network pores). This behavior is similarto the one reported by Wendt and Klein (40), where anexponential form for PSD was used. Further, assuming eithercylindrical or slit pore shapes only weakly influenced sievingin Figure 4a,b supporting the current understanding thatthis nondimensionalization cannot distinguish pore shapes(40).
Therefore, despite the differences in chemical compositionand the subsequent response to temperature, the solute tomembrane pore radius is the primary factor in determiningmembrane selectivity toward the alcohols and sugars em-ployed in this study. Further, the quantitative agreementbetween theoretical predictions and experimental data shownin Figures 2 and 4 suggests that available hydrodynamicmodels (15, 20) can provide important insights into solutetransport through the tortuous pores of NF membranes.
Network pores shrank in size as temperature decreasedwhether convective hindrances were included or not (seeTable S2 and associated text and Figure 3). Hence, deterio-rations in membrane selectivity with increasing temperaturecan be attributed primarily to the increase in network poresizes. Such increases in pore sizes can also partially explainthe decreases in arsenic (8), salt (9, 10, 12), hardness (13),and natural organic matter (14) rejection reported in theliterature as well as the nonviscous contributions to activatedtransport of water (12, 18, 41).
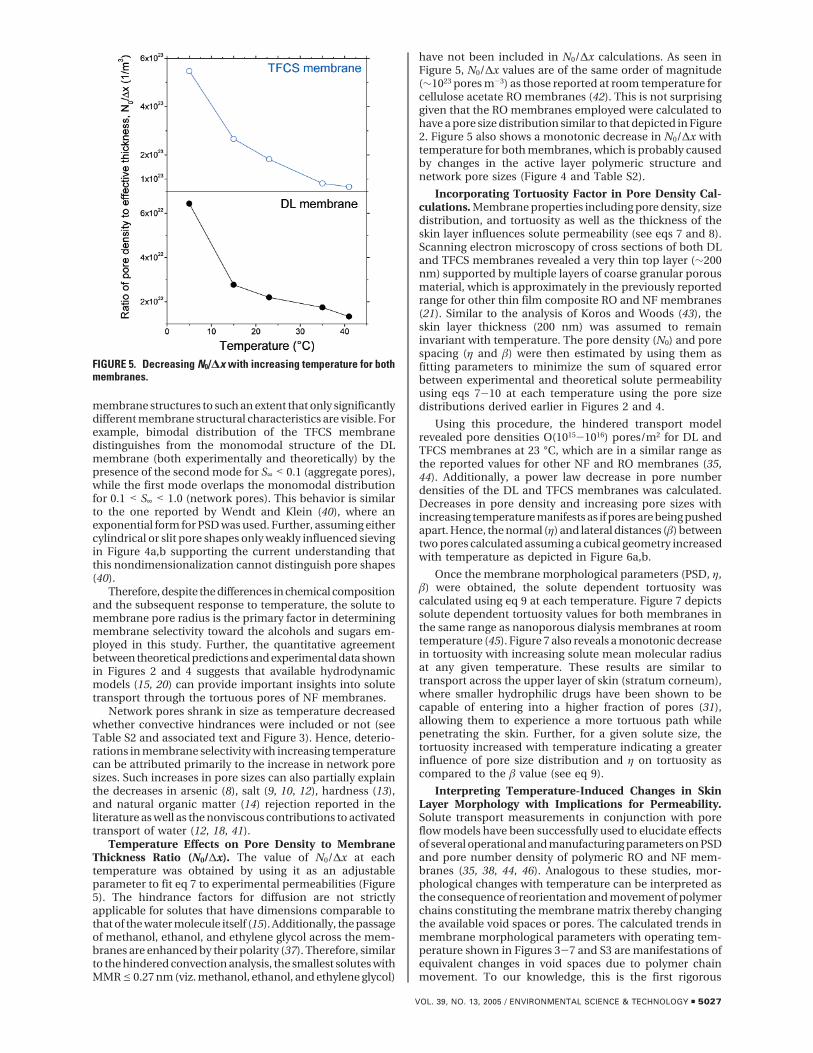
Temperature Effects on Pore Density to MembraneThickness Ratio (N0/∆x). The value of N0/∆x at eachtemperature was obtained by using it as an adjustableparameter to fit eq 7 to experimental permeabilities (Figure5). The hindrance factors for diffusion are not strictlyapplicable for solutes that have dimensions comparable tothat of the water molecule itself (15). Additionally, the passageof methanol, ethanol, and ethylene glycol across the mem-branes are enhanced by their polarity (37). Therefore, similarto the hindered convection analysis, the smallest solutes withMMR e 0.27 nm (viz. methanol, ethanol, and ethylene glycol)
have not been included in N0/∆x calculations. As seen inFigure 5, N0/∆x values are of the same order of magnitude(∼1023 pores m-3) as those reported at room temperature forcellulose acetate RO membranes (42). This is not surprisinggiven that the RO membranes employed were calculated tohave a pore size distribution similar to that depicted in Figure2. Figure 5 also shows a monotonic decrease in N0/∆x withtemperature for both membranes, which is probably causedby changes in the active layer polymeric structure andnetwork pore sizes (Figure 4 and Table S2).
Incorporating Tortuosity Factor in Pore Density Cal-culations. Membrane properties including pore density, sizedistribution, and tortuosity as well as the thickness of theskin layer influences solute permeability (see eqs 7 and 8).Scanning electron microscopy of cross sections of both DLand TFCS membranes revealed a very thin top layer (∼200nm) supported by multiple layers of coarse granular porousmaterial, which is approximately in the previously reportedrange for other thin film composite RO and NF membranes(21). Similar to the analysis of Koros and Woods (43), theskin layer thickness (200 nm) was assumed to remaininvariant with temperature. The pore density (N0) and porespacing (η and â) were then estimated by using them asfitting parameters to minimize the sum of squared errorbetween experimental and theoretical solute permeabilityusing eqs 7-10 at each temperature using the pore sizedistributions derived earlier in Figures 2 and 4.
Using this procedure, the hindered transport modelrevealed pore densities O(1015-1016) pores/m2 for DL andTFCS membranes at 23 °C, which are in a similar range asthe reported values for other NF and RO membranes (35,44). Additionally, a power law decrease in pore numberdensities of the DL and TFCS membranes was calculated.Decreases in pore density and increasing pore sizes withincreasing temperature manifests as if pores are being pushedapart. Hence, the normal (η) and lateral distances (â) betweentwo pores calculated assuming a cubical geometry increasedwith temperature as depicted in Figure 6a,b.
Once the membrane morphological parameters (PSD, η,â) were obtained, the solute dependent tortuosity wascalculated using eq 9 at each temperature. Figure 7 depictssolute dependent tortuosity values for both membranes inthe same range as nanoporous dialysis membranes at roomtemperature (45). Figure 7 also reveals a monotonic decreasein tortuosity with increasing solute mean molecular radiusat any given temperature. These results are similar totransport across the upper layer of skin (stratum corneum),where smaller hydrophilic drugs have been shown to becapable of entering into a higher fraction of pores (31),allowing them to experience a more tortuous path whilepenetrating the skin. Further, for a given solute size, thetortuosity increased with temperature indicating a greaterinfluence of pore size distribution and η on tortuosity ascompared to the â value (see eq 9).
Interpreting Temperature-Induced Changes in SkinLayer Morphology with Implications for Permeability.Solute transport measurements in conjunction with poreflow models have been successfully used to elucidate effectsof several operational and manufacturing parameters on PSDand pore number density of polymeric RO and NF mem-branes (35, 38, 44, 46). Analogous to these studies, mor-phological changes with temperature can be interpreted asthe consequence of reorientation and movement of polymerchains constituting the membrane matrix thereby changingthe available void spaces or pores. The calculated trends inmembrane morphological parameters with operating tem-perature shown in Figures 3-7 and S3 are manifestations ofequivalent changes in void spaces due to polymer chainmovement. To our knowledge, this is the first rigorous
FIGURE 5. Decreasing N0/∆x with increasing temperature for bothmembranes.
VOL. 39, NO. 13, 2005 / ENVIRONMENTAL SCIENCE & TECHNOLOGY 9 5027

investigation of the effects of feedwater temperature on skinlayer morphology of NF membranes.
Trends shown in Figures 3-7 and S3 suggest thatincreasing temperature results in structural and morpho-logical changes in network pores of the polymeric skin layerby increasing pore sizes while simultaneously decreasingpore density. This increase in the dimensions of thepermeation pathways at higher temperatures can explainthe reported reductions in contaminant rejection (8, 9, 12).Simultaneously, thermal expansion of the network poresdecreases the number of permeation pathways to weaken
the dependence of solute permeation on temperature.Movement of polymer chains with increasing temperaturethereby fusing together several network pores consequentlyreducing pore density while simultaneously shifting the poresize distribution to higher values can explain these results.These structural changes influences solute permeation andcorresponding activation energies of permeation as discussednext.
Substituting eq 8 in eq 7 reveals that solute permeationis proportional to the hindered diffusivity within membranepores, the pore density and inversely proportional to thetortuosity. Hence, the activation energy of solute permeation,Ep, is proportional to ED + EN0 - Eτp, where ED, EN0, and Eτp
are the contributions of effective diffusion, pore number,and pore connectivity, respectively. We have recently reportedincreasing pore sizes resulted in 20 < ED < 200 kJ/mol forthese solutes and membranes (18). Decreasing N0/∆x inFigure 5 indicates a net negative activation energy associatedwith pore number and connectivity. This is confirmed bydecreasing N0 (EN0 < 0) and increasing τp (Eτp > 0) withtemperature in Figures 6 and 7, respectively. The net negativecontribution of pore density and connectivity to activatedtransport (EN0 - Eτp < 0) weakens the influence of temperatureon permeability compared to the hindered diffusivity.
Changes in the permeation pathways in the membraneskin layer with temperature will result in the activatedtransport of contaminants. However, the negative enthalpyassociated with adsorption of natural organic matter (17)and hormones (4) will further serve to weaken the temper-ature dependence of their permeability.
NomenclatureAk membrane porosity
c solute concentration in pore (ML-3)
Cp permeate solute concentration (ML-3)
Cm membrane phase solute concentration (ML-3)
D∞ free solute diffusion coefficient (L2 T-1)
EP activation energy of permeation (ML2 T-2 mol-1)
ED activation energy of diffusion (ML2 T-2 mol-1)
EN0 activation energy of pore disappearance (ML2
T-2 mol-1)
EτP activation energy of pore connectivity (ML2 T-2
mol-1)
hi fraction of pores corresponding to ith pore sizedistribution
Jv volumetric pure water flux (LT-1)
Js solute flux (ML2 T-1)
Kc convective hindrance factor
Kd diffusive hindrance factor
L membrane thickness (L)
Lp pure water permeability (M-1 L2 T)
N0 total number of pores per unit area of membrane(L-2)
Pe Peclet number
PM solute permeability (LT-1)
∆P transmembrane pressure (ML-1 T-2)
r pore radius (L)
rji geometric mean pore radius of the ith distribu-tion (L)
FIGURE 6. Modifications in the membrane skin structure due totemperature changes depicted as an increase in the normal andlateral distances between pores for both membranes.
FIGURE 7. Increasing tortuosity with decreasing solute meanmolecular radius and increasing temperature for both polymericmembranes.
5028 9 ENVIRONMENTAL SCIENCE & TECHNOLOGY / VOL. 39, NO. 13, 2005

r* upper limit of solute radius in eq 5
Si solute sieving coefficient
S∞ asymptotic sieving coefficient
SPi geometric standard deviation of the ith distri-bution (L)
T temperature (K)
Greek lettersâ lateral distance between two pores (L)
∆x effective distance traveled by solute within themembrane matrix (L)
Φ solute equilibrium partitioning coefficient
η normal distance between two pores (L)
τP solute dependent tortuosity
µ water viscosity (ML-1 T-1)
AcknowledgmentsDavid Paulson and Peter Eriksson of Osmonics Inc. andRandolph Truby and Tom Stocker of Koch MembraneSystems Inc. generously donated membrane samples. PrasadTaranekar and Rigoberto Advincula from the Department ofChemistry assisted with molecular mechanics simulations.The detailed comments generated during anonymous peerreview of this manuscript are greatly appreciated. Thisresearch has been funded by a grant from the NationalScience Foundation CAREER program (BES-0134301). Thecontents do not necessarily reflect the views and policies ofthe sponsors nor does the mention of trade names orcommercial products constitute endorsement or recom-mendation for use.
Supporting Information AvailableEstimation of molecular width and mean molecular radius,choice of appropriate solute size parameter, experimentalreproducibility and quality assurance protocols, effect oftemperature on PSD, and temperature effects on N0/∆x usingwater permeability measurements (Tables S1 and S2 andFigures S1-S3). This material is available free of charge viathe Internet at http://pubs.acs.org.
Literature Cited(1) Tan, L.; Amy, G. L. Comparing Ozonation and Membrane
Separation for Color Removal and Disinfection By-ProductControl. J. Am. Water Works Assoc. 1991, 83, 74-79.
(2) Nilson, J. A.; DiGiano, F. A. Influence of NOM Composition onNanofiltration. J. Am. Water Works Assoc. 1996, 88, 53-66.
(3) Kimura, K.; Toshima, S.; Amy, G.; Watanabe, Y. Rejection ofNeutral Endocrine Disrupting Compounds (EDCs) and Phar-maceutically Active Compounds (PhACs) by RO Membranes. J.Membr. Sci. 2004, 245, 71-78.
(4) Nghiem, L. D.; Schafer, A. I.; Elimelech, M. Removal of the NaturalHormones by Nanofiltration Membranes: Measurement, Mod-eling, and Mechanisms. Environ. Sci. Technol. 2004, 38, 1888-1896.
(5) Kiso, Y.; Kon, T.; Kitao, T.; Nishimura, K. Rejection Propertiesof Alkyl Phthalates with Nanofiltration Membranes. J. Membr.Sci. 2001, 182, 205-214.
(6) Devitt, E. C.; Ducellier, F.; Cote, P.; Wiesner, M. R. Effects ofNatural Organic Matter and the Raw Water Matrix on theRejection of Atrazine by Pressure-Driven Membranes. WaterRes. 1998, 32, 2563-2568.
(7) Lee, S.; Lueptow, R. M. Membrane Rejection of NitrogenCompounds. Environ. Sci. Technol. 2001, 35, 3008-3018.
(8) Waypa, J. J.; Elimelech, M.; Hering, J. G. Arsenic Removal by ROand NF Membranes. J. Am. Water Works Assoc. 1997, 89, 102-114.
(9) Ventresque, C.; Turner, G.; Bablon, G. Nanofiltration: fromPrototype to Full Scale. J. Am. Water Works Assoc. 1997, 89,65-76.
(10) Taniguchi, M.; Kimura, S. Estimation of Transport Parametersof RO Membranes for Seawater Desalination. AIChE J. 2000, 46,1967-1973.
(11) Abdel-Jawad, M.; El-Sayed, E. E. F.; Ebrahim, S.; Al-Saffar, A.;Safar, M.; Tabtaei, M.; Al-Nuwaibit, G. Fifteen Years of R andD Program in Seawater Desalination at KISR Part II. RO SystemPerformance. Desal. 2001, 135, 155-167.
(12) Mehdizadeh, H.; Dickson, J. M.; Eriksson, P. K. TemperatureEffects on the Performance of Thin-Film Composite, AromaticPolyamide Membranes. Ind. Eng. Chem. Res. 1989, 28, 814-824.
(13) Schaep, J.; Van der Bruggen, B.; Uytterhoven, S.; Croux, R.;Vandecasteele, C.; Wilms, D.; Van Houtte, E.; Vanlerberghe, F.Removal of Hardness from Groundwater by Nanofiltration.Desal. 1998, 119, 295-302.
(14) Her, N.; Amy, G.; Jarusutthirak, C. Seasonal Variations ofNanofiltration (NF) Foulants: Identification and Control. Desal.2000, 132, 143-160.
(15) Deen, W. M. Hindered Transport of Large Molecules in Liquid-Filled Pores. AIChE J. 1987, 33, 1409-1424.
(16) Aimar, P.; Meireles, M.; Sanchez, V. A Contribution to theTranslation of Retention Curves into Pore Size Distributions forSieving Membranes. J. Membr. Sci. 1990, 54, 321-338.
(17) Combe, C.; Molis, E.; Lucas, P.; Riley, R.; Clark, M. M. The Effectof CA Membrane Properties on Adsorptive Fouling by HumicAcid. J. Membr. Sci. 1999, 154, 73-87.
(18) Sharma, R. R.; Agrawal, R.; Chellam, S. Temperature Effects onSieving Characteristics of Thin - Film Composite NanofiltrationMembranes: Pore Size Distributions and Transport Parameters.J. Membr. Sci. 2003, 223, 69-87.
(19) Mochizuki, S.; Zydney, A. L. Theoretical Analysis of Pore SizeDistribution Effects on Membrane Transport. J. Membr. Sci.1993, 82, 211-227.
(20) Bungay, P. M.; Brenner, H. The Motion of a Closely Fitting Spherein a Fluid Filled Tube. Int. J. Multiphase Flow 1973, 1, 25-56.
(21) Singh, S.; Khulbe, K. C.; Matsuura, T.; Ramamurthy, P. MembraneCharacterization by Solute Transport and Atomic Microscopy.J. Membr. Sci. 1998, 142, 111-127.
(22) Michaels, A. S. Analysis and Prediction of Sieving Curves forUltrafiltration Membranes: A Universal Correlation? Sep. Sci.Technol. 1980, 15, 1305-1322.
(23) Kassotis, J.; Shmidt, J.; Hodgins, L. T.; Gregor, H. P. Modelingof the Pore Size Distribution of Ultrafiltration Membranes. J.Membr. Sci. 1985, 22, 61-76.
(24) Van der Bruggen, B.; Schaep, J.; Dirk, W.; Vandecasteele, C. AComparison of Models to Describe the Maximal Retention ofOrganic Molecules in Nanofiltration. Sep. Sci. Technol. 2000,35, 169-182.
(25) Tezel, A.; Sens, A.; Mitragotri, S. Description of TransdermalTransport of Hydrophilic Solutes during Low-Frequency Sono-phoresis based on a Modified Porous Pathway Model. J. Pharm.Sci. 2003, 92, 381-393.
(26) International Critical Tables of Numerical Data, Physics, Chem-istry and Technology, 1st ed.; Washburn, E. W., Ed.; McGraw-Hill Book Company, Inc.: New York and London, 1929.
(27) Hayduk, W.; Laudie, H. Prediction of Diffusion Coefficients forNon-Electrolytes in Dilute Aqueous Solutions. AIChE J. 1974,20, 611-615.
(28) Wang, X.-L.; Tsuru, T.; Togoh, M.; Nakao, S.-I.; Kimura, S.Evaluation of Pore Structure and Electrical Properties ofNanofiltration Membranes. J. Chem. Eng. Jpn. 1995, 28, 186-192.
(29) Nakao, S.-i. Determination of Pore Size and Pore Size Distribu-tion 3. Filtration Membranes. J. Membr. Sci. 1994, 96, 131-165.
(30) Bowen, W. R.; Mohammad, A. W.; Hilal, N. Characterization ofNanofiltration Membranes for Predictive Purposes - Use ofSalts, Uncharged Solutes and Atomic Force Microscopy. J.Membr. Sci. 1997, 126, 91-105.
(31) Tezel, A.; Mitragotri, S. On the Origin of Size-DependentTortuosity for Permeation of Hydrophilic Solutes across theStratum Corneum. J. Controlled Release 2003, 86, 183-186.
(32) Tam, C. M.; Tremblay, A. Y. Membrane Pore Characterization- Comparison Between Single and Multicomponent SoluteProbe Techniques. J. Membr. Sci. 1991, 57, 271-287.
VOL. 39, NO. 13, 2005 / ENVIRONMENTAL SCIENCE & TECHNOLOGY 9 5029

(33) Giddings, J. C.; Kucera, E.; Russel, C.; Myers, M. N. StatisticalTheory for the Equilibrium Distribution of Rigid Molecules inInert Porous Networks: Exclusion Chromatography. J. Phys.Chem. 1968, 72, 4397-4408.
(34) Seidel, A.; Waypa, J.; Elimelech, M. Role of Charge (Donnan)Exclusion in Removal of Arsenic from Water by a NegativelyCharged Porous Nanofiltration Membrane. Environ. Eng. Sci.2001, 18, 105-113.
(35) Kosutic, K.; Kastelan-Kunst, L.; Kunst, B. Porosity of SomeCommercial Reverse Osmosis and Nanofiltration PolyamideThin Film Composite Membranes. J. Membr. Sci. 2000, 168,101-108.
(36) Marcus, Y. Ion Solvation; John Wiley & Sons Limited: New York,1985.
(37) Van der Bruggen, B.; Schaep, J.; Wilms, D.; Vandecasteele, C.Influence of Molecular size, Polarity and Charge on the Retentionof Organic Molecules by Nanofiltration. J. Membr. Sci. 1999,156, 29-41.
(38) Chan, K.; Matsuura, T.; Sourirajan, S. Effect of Evaporation Timeon Pore Size and Pore Size Distribution of Aromatic Polyami-dohydrazide RO/UF Membranes. Ind. Eng. Chem. Prod. Res.Dev. 1984, 23, 492-500.
(39) Nguyen, T. D.; Chan, K.; Matsuura, T.; Sourirajan, S. Effect ofShrinkage on Pore Size and Pore Size Distribution of DifferentCellulosic Reverse Osmosis Membranes. Ind. Eng. Chem. Prod.Res. Dev. 1984, 23, 501-508.
(40) Wendt, R. P.; Klein, E. Membrane Hetroporosity and theProbability Function Correlation. J. Membr. Sci. 1984, 17, 161-171.
(41) Chen, J. Y.; Nomura, H.; Pusch, W. Temperature Dependenceof Membrane Transport Parameters in Hyperfiltration. Desal.1983, 46, 437-446.
(42) Chan, K.; Tinghui, L.; Matsuura, T.; Sourirajan, S. Effect ofShrinkage on Pore Size and Pore Size Distribution of CelluloseAcetate Reverse Osmosis Membranes. Ind. Eng. Chem. Prod.Res. Dev. 1984, 23, 124-133.
(43) Koros, W. J.; Woods, D. G. Elevated Temperature Applicationof Polymer Hollow-Fiber Membranes. J. Membr. Sci. 2001, 181,157-166.
(44) Kosutic, K.; Kunst, B. Effect of Hydrolysis on Porosity of CelluloseAcetate Reverse Osmosis Membranes. J. Appl. Polym. Sci. 2001,81, 1768-1775.
(45) Kokubo, K.; Sakai, K. Evaluation of Dialysis Membranes Usinga Tortuous Pore Model. AIChE J. 1998, 44, 2607-2619.
(46) Van der Bruggen, B.; Geens, J.; Vandecasteele, C. Influence ofOrganic Solvents on the Performance of Polymeric Nanofil-tration Membranes. Sep. Sci. Technol. 2002, 37, 783-797.
Received for review January 20, 2005. Revised manuscriptreceived April 14, 2005. Accepted April 26, 2005.
ES0501363
5030 9 ENVIRONMENTAL SCIENCE & TECHNOLOGY / VOL. 39, NO. 13, 2005


![Preparation of hydrophilic nanofiltration membranes for …...ing nanofiltration (NF) and reverse osmosis (RO) membranes [6, 7]. Membrane fouling reduces membrane performance, increases](https://static.fdocuments.us/doc/165x107/611b4ef3f07ac85c23709bed/preparation-of-hydrophilic-nanofiltration-membranes-for-ing-nanofiltration-nf.jpg)