Component-cost and Performance Based Comparison of Flow and Static Batteries 2015
7
Component-cost and performance based comparison of flow and static batteries Brandon J. Hopkins a , Kyle C. Smith b, c , Alexander H. Slocum a , Yet-Ming Chiang b, * a Department of Mechanical Engineering, Massachusetts Institute of Technology, Cambridge, MA 02139, USA b Department of Material Science and Engineering, Massachusetts Institute of Technology, Cambridge, MA 02139, USA c Department of Mechanical Science and Engineering, University of Illinois at Urbana-Champaign, Urbana, IL 61801, USA highlights A cost and performance model is created comparing static and flow battery architectures. Battery chemistries are considered that can be used in static or flow batteries. Conditions for minimum stack cost are identified to inform low-cost battery design. Tank to reactor size ratio and fluid yield stress help determine the ideal design. article info Article history: Received 26 February 2015 Received in revised form 28 April 2015 Accepted 5 June 2015 Available online 16 June 2015 Keywords: Flow battery Cost model Vanadium Lithium iron phosphate Lithium titanium phosphate Electrochemistry abstract Flow batteries are a promising grid-storage technology that is scalable, inherently flexible in power/ energy ratio, and potentially low cost in comparison to conventional or “static” battery architectures. Recent advances in flow chemistries are enabling significantly higher energy density flow electrodes. When the same battery chemistry can arguably be used in either a flow or static electrode design, the relative merits of either design choice become of interest. Here, we analyze the costs of the electro- chemically active stack for both architectures under the constraint of constant energy efficiency and charge and discharge rates, using as case studies the aqueous vanadium-redox chemistry, widely used in conventional flow batteries, and aqueous lithium-iron-phosphate (LFP)/lithium-titanium-phosphate (LTP) suspensions, an example of a higher energy density suspension-based electrode. It is found that although flow batteries always have a cost advantage ($ kWh 1 ) at the stack level modeled, the advantage is a strong function of flow electrode energy density. For the LFP/LTP case, the cost advantages decreases from ~50% to ~10% over experimentally reasonable ranges of suspension loading. Such results are important input for design choices when both battery architectures are viable options. © 2015 Elsevier B.V. All rights reserved. 1. Introduction Low-cost electrical energy storage can greatly facilitate the integration of intermittent renewable power generation into the electric grid [1]. However, the cost of available energy storage technologies has been too high for most large-scale grid applica- tions [2,3]. Flow batteries are considered to be promising candi- dates for large-scale storage due to their inherent scalability and decoupled power and energy. The cost per stored energy, e.g., $ kWh 1 , of flow batteries generally decreases as the ratio of tank size to reactor size increases. However, simultaneously the power capability and round trip energy efficiency also decrease, all else being equal. Thus one may ask, “For any given chemistry, when is it cost effective to use a flow battery architecture as opposed to a conventional static-electrode architecture?” Cost analyses exist for both static [4e6] and flow [7e10] batteries independently, but we are not aware of published works that compare the cost merits of the two architectures for the same active materials and perfor- mance requirements. The question has increased in relevance with the emergence of flowable storage electrodes of high energy density. Historically, flow batteries have used dissolved redox molecules as electroactive materials [1]. Recently, however, alternative forms of flow elec- trodes including semi-solid suspensions of the electroactive * Corresponding author. E-mail address: [email protected] (Y.-M. Chiang). Contents lists available at ScienceDirect Journal of Power Sources journal homepage: www.elsevier.com/locate/jpowsour http://dx.doi.org/10.1016/j.jpowsour.2015.06.023 0378-7753/© 2015 Elsevier B.V. All rights reserved. Journal of Power Sources 293 (2015) 1032e1038
-
Upload
cristian-fernandez -
Category
Documents
-
view
212 -
download
0
description
Costos VRFB
Transcript of Component-cost and Performance Based Comparison of Flow and Static Batteries 2015

lable at ScienceDirect
Journal of Power Sources 293 (2015) 1032e1038
Contents lists avai
Journal of Power Sources
journal homepage: www.elsevier .com/locate/ jpowsour
Component-cost and performance based comparison of flow andstatic batteries
Brandon J. Hopkins a, Kyle C. Smith b, c, Alexander H. Slocum a, Yet-Ming Chiang b, *
a Department of Mechanical Engineering, Massachusetts Institute of Technology, Cambridge, MA 02139, USAb Department of Material Science and Engineering, Massachusetts Institute of Technology, Cambridge, MA 02139, USAc Department of Mechanical Science and Engineering, University of Illinois at Urbana-Champaign, Urbana, IL 61801, USA
h i g h l i g h t s
� A cost and performance model is created comparing static and flow battery architectures.� Battery chemistries are considered that can be used in static or flow batteries.� Conditions for minimum stack cost are identified to inform low-cost battery design.� Tank to reactor size ratio and fluid yield stress help determine the ideal design.
a r t i c l e i n f o
Article history:Received 26 February 2015Received in revised form28 April 2015Accepted 5 June 2015Available online 16 June 2015
Keywords:Flow batteryCost modelVanadiumLithium iron phosphateLithium titanium phosphateElectrochemistry
* Corresponding author.E-mail address: [email protected] (Y.-M. Chiang).
http://dx.doi.org/10.1016/j.jpowsour.2015.06.0230378-7753/© 2015 Elsevier B.V. All rights reserved.
a b s t r a c t
Flow batteries are a promising grid-storage technology that is scalable, inherently flexible in power/energy ratio, and potentially low cost in comparison to conventional or “static” battery architectures.Recent advances in flow chemistries are enabling significantly higher energy density flow electrodes.When the same battery chemistry can arguably be used in either a flow or static electrode design, therelative merits of either design choice become of interest. Here, we analyze the costs of the electro-chemically active stack for both architectures under the constraint of constant energy efficiency andcharge and discharge rates, using as case studies the aqueous vanadium-redox chemistry, widely used inconventional flow batteries, and aqueous lithium-iron-phosphate (LFP)/lithium-titanium-phosphate(LTP) suspensions, an example of a higher energy density suspension-based electrode. It is found thatalthough flow batteries always have a cost advantage ($ kWh�1) at the stack level modeled, theadvantage is a strong function of flow electrode energy density. For the LFP/LTP case, the cost advantagesdecreases from ~50% to ~10% over experimentally reasonable ranges of suspension loading. Such resultsare important input for design choices when both battery architectures are viable options.
© 2015 Elsevier B.V. All rights reserved.
1. Introduction
Low-cost electrical energy storage can greatly facilitate theintegration of intermittent renewable power generation into theelectric grid [1]. However, the cost of available energy storagetechnologies has been too high for most large-scale grid applica-tions [2,3]. Flow batteries are considered to be promising candi-dates for large-scale storage due to their inherent scalability anddecoupled power and energy. The cost per stored energy, e.g., $kWh�1, of flowbatteries generally decreases as the ratio of tank size
to reactor size increases. However, simultaneously the powercapability and round trip energy efficiency also decrease, all elsebeing equal. Thus one may ask, “For any given chemistry, when is itcost effective to use a flow battery architecture as opposed to aconventional static-electrode architecture?” Cost analyses exist forboth static [4e6] and flow [7e10] batteries independently, but weare not aware of published works that compare the cost merits ofthe two architectures for the same active materials and perfor-mance requirements.
The question has increased in relevance with the emergence offlowable storage electrodes of high energy density. Historically,flow batteries have used dissolved redox molecules as electroactivematerials [1]. Recently, however, alternative forms of flow elec-trodes including semi-solid suspensions of the electroactive

B.J. Hopkins et al. / Journal of Power Sources 293 (2015) 1032e1038 1033
materials typically used in nonaqueous Li-ion batteries [4] andconductive suspensions of high energy density solution chemistriessuch as lithium-polysulfide [11,12] have been reported. Theseelectrodes have the potential to increase the chemical energydensity by an order of magnitude or more over aqueous redox so-lutions. Evaluation of the performance/cost trade-off of differentbattery architectures is especially important in these instances.
We first answer the question of “when to build a flow battery”conceptually, and then support our conclusions with analysis andcase studies in the remainder of the paper. A flow battery architec-ture is in general more cost effective than a static battery architecturewhen chemical cost is low relative to the cost of the separator mem-brane and current collector, and when the anode and cathode solu-tions or suspensions have low volumetric energy densities. As energydensity of reactants increases, a flow battery design can remain moreattractive from a cost perspective, but the benefit over a static elec-trode architecture diminishes. A critical consideration in arriving atthis conclusion is the fact that for any given electrode chemistryused at a given C-rate of charge or discharge in a planar configu-ration, the polarization due to electrode resistance increases inproportion to the electrode thickness squared. This dependence,simple yet not widely appreciated, arises because polarization isthe product of current density and electrode resistance (i.e., Ohm'slaw); the resistance of a uniform electrode scales linearly with itsthickness, but so does the current density needed to maintain agiven C-rate.
Battery costs can be decreased by decreasing the inactive ma-terial content, e.g., the number of separator and current collectorlayers, and for a layered design this inactive content should betaken relative to the charge capacity per unit area of the electrodes(e.g., mAh cm�2), which is in turn proportional to thickness for agiven electrode composition. Thus, while low energy densityelectrodes must be thick in order to minimize the inactive materialcontent, increasing electrode thickness incurs a penalty in polari-zation that limits usable capacity (i.e., that is accessible within thevoltage window of the cell) and round-trip efficiency.
For these reasons, our model assumes a constraint of identicalround-trip efficiency when comparing flow and static-electrodearchitectures. The analysis presented below considers the vana-dium redox solution as the exemplar of an aqueous flow battery,and an aqueous suspension-based lithium-iron-phosphate (LFP)/lithium-titanium-phosphate (LTP) electrochemical couple, recentlydemonstrated in both static and flow battery configurations [15], asan example of a higher energy density chemistry, which was ach-ieved primarily using compounds of higher charge capacity per unitvolume. Given the expanding number of electroactive materialoptions that can be used in both static-electrode and flow batteries,our purpose is to present analysis methods that can be incorpo-rated into design tools for evaluating the economics and perfor-mance/cost trade-offs of battery designs.
2. Cost model
A cost model for either flow or conventional batteries wouldideally take into account the cost of all components (bill of mate-rials), manufacturing capital expenditures (depreciated over life-time), and labor/operating costs. We seek to avoid such specificityin the present work since the results are specific to particular de-signs (e.g., energy and duration for flow batteries; cell size andpower for conventional batteries) and can obscure the fundamentalrelationships that will be elucidated. Instead, we seek to compareflow and static-electrode batteries in terms of an irreducible sub-system shown in Fig. 1 that consists of the cell “stack” in the case ofa conventional laminated battery and its equivalent in the case ofthe flow battery. This subsystem contains all components of the
electrochemically active electrodesdcathode, anode, electrolyte,and additivesdand the separator films and cathode and anodecurrent collectors. Thus for the static-electrode cell, we model thecost of the stack and exclude the cost of packaging, tabs, and anycontrol electronics. For the flow battery, the model includes thetotal “chemical cost” and the major components of the power-generating reactor and excludes the balance of the plant.
In our model, we require that both the flow battery and static-electrode battery subsystems as defined above (i) have identicalround-trip energy efficiency at specified charge and dischargerates, (ii) use the same components for the current collector,separator, and solutions or suspensions, and therefore have thesame component unit costs, and (iii) consist of the same formula-tions, and therefore energy densities, for the chemically activeelectrodes. The theoretical capacity and energy of the system is thesame for both batteries (Fig. 1). The static-electrode battery willtherefore have thicker electrodes and more separator and currentcollector per unit of stored energy. The flow battery will utilize athinner, higher power stack through which the catholyte andanolyte must be flowed at the necessary rate to achieve the samesystem-level C-rate or power as the static-electrode battery.
The stack cost per kilowatt hour of a static or flow battery, Cst,under these assumptions is the total cost of the solution or sus-pension, Cac, separator membrane, Cs, and current collector, Cc,divided by the total amount of usable energy storage, E, orCst ¼ (Cac þ Cs þ Cc)/E. The total costs are calculated as follows,Cac ¼ (Pcac)/(Cre), Cm ¼ Ascs, Cc ¼ Accc, and E ¼ (Phe)/C. The variablescac, cs, and cc are the average cost of anode and cathode per unitmass, the separator cost per unit area, and the current collector costper unit area respectively. P is the average charging and dischargingpower. C is the system-level C-rate at which the battery charges/discharges. The theoretical gravimetric energy density is re, and heis the energetic efficiency. The variables Ac and As represent thetotal area of current collector and separator respectively and arerelated as Ac ¼ As(1 þ 1/n), assuming current collectors are sharedby adjacent cells and where n is the number of cells in the battery.
Flow batteries can use less separator and current collector thanstatic batteries for the same energy storage, which is why their costper kilowatt-hour decreases as their tank size increases. The trade-off, however, is that the C-rate of the flow battery stack must behigher, by a factor equal to the ratio of tank to stack capacity, toachieve a net C-rate equal to that of a comparable static battery. Toachieve the same energy efficiency as the static battery, the thinnerelectrode thickness is a benefit, but the higher C-rate is a detriment.Ourmodel takes both into account as well as the pumping losses forthe stack. We use the following terminology. The volume or chargecapacity that the stack alone can accommodate is referred to as aplug. The C-rate of an individual plug is defined as Cp. The number ofplugs in the system, or plug count, p, is the total anode or cathodecapacity in the system, taken as a multiple of that for the stack. Astatic battery has a plug count of one, and a flow battery has a plugcount greater than one. Fig. 1b illustrates a flow battery with a plugcount of four. The average charging and discharging power of thebattery, static or flowing, can be approximated as P ¼ 2hplwrreCpn.Electrode thickness (distance frommembrane to current collector),hp, is varied to achieve a particular energy efficiency for a specifiedsystem-level C-rate and plug count p. The variables l and w aredimensions of the area of separator required for a single cell asshown in Fig. 2, and r is the average of the gravimetric densities ofthe anode and cathode solutions or suspensions. If the total sepa-rator area Am, which is equal to lwn, is divided by both sides of theapproximated power expression, the total amount of requiredseparator is Am¼ P/(2hprreCp). These expressions can be substitutedinto the cost per kilowatt-hour expression to obtain the cost of thestack relative to system energy ($ kWh�1):
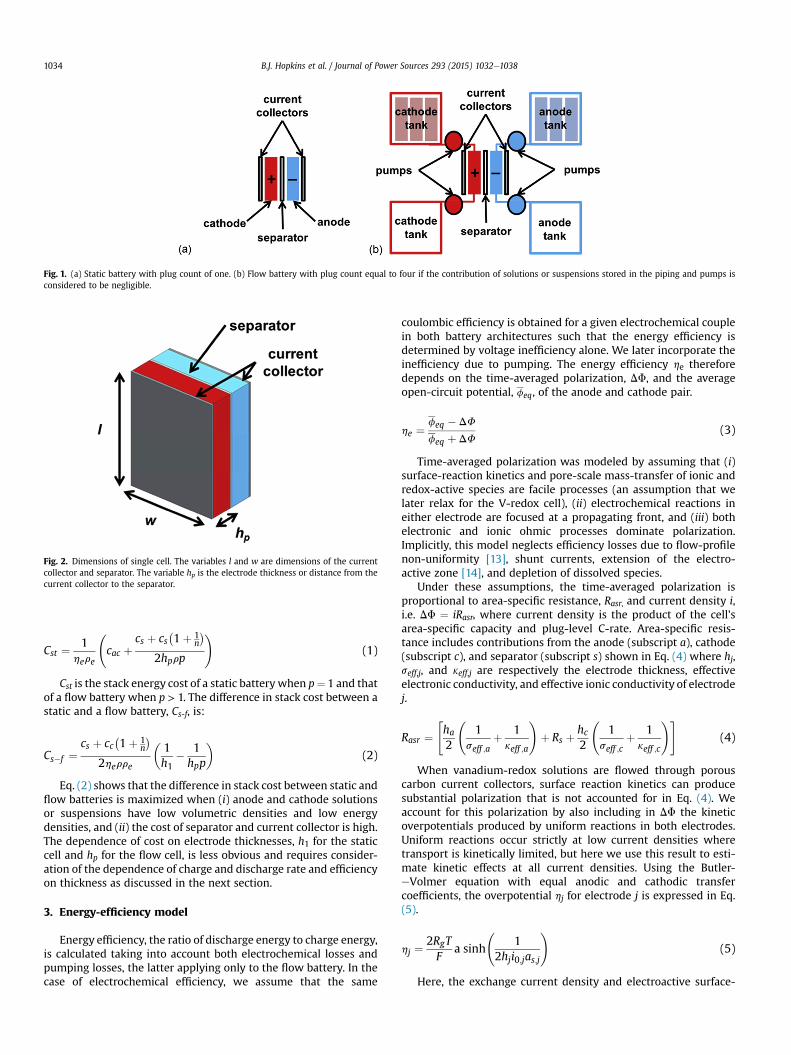
Fig. 1. (a) Static battery with plug count of one. (b) Flow battery with plug count equal to four if the contribution of solutions or suspensions stored in the piping and pumps isconsidered to be negligible.
Fig. 2. Dimensions of single cell. The variables l and w are dimensions of the currentcollector and separator. The variable hp is the electrode thickness or distance from thecurrent collector to the separator.
B.J. Hopkins et al. / Journal of Power Sources 293 (2015) 1032e10381034
Cst ¼ 1here
cac þ
cs þ cs�1þ 1
n
�2hprp
!(1)
Cst is the stack energy cost of a static battery when p¼ 1 and thatof a flow battery when p > 1. The difference in stack cost between astatic and a flow battery, Cs-f, is:
Cs�f ¼cs þ cc
�1þ 1
n
�2herre
�1h1
� 1hpp
�(2)
Eq. (2) shows that the difference in stack cost between static andflow batteries is maximized when (i) anode and cathode solutionsor suspensions have low volumetric densities and low energydensities, and (ii) the cost of separator and current collector is high.The dependence of cost on electrode thicknesses, h1 for the staticcell and hp for the flow cell, is less obvious and requires consider-ation of the dependence of charge and discharge rate and efficiencyon thickness as discussed in the next section.
3. Energy-efficiency model
Energy efficiency, the ratio of discharge energy to charge energy,is calculated taking into account both electrochemical losses andpumping losses, the latter applying only to the flow battery. In thecase of electrochemical efficiency, we assume that the same
coulombic efficiency is obtained for a given electrochemical couplein both battery architectures such that the energy efficiency isdetermined by voltage inefficiency alone. We later incorporate theinefficiency due to pumping. The energy efficiency he thereforedepends on the time-averaged polarization, DF, and the averageopen-circuit potential, feq, of the anode and cathode pair.
he ¼feq � DF
feq þ DF(3)
Time-averaged polarization was modeled by assuming that (i)surface-reaction kinetics and pore-scale mass-transfer of ionic andredox-active species are facile processes (an assumption that welater relax for the V-redox cell), (ii) electrochemical reactions ineither electrode are focused at a propagating front, and (iii) bothelectronic and ionic ohmic processes dominate polarization.Implicitly, this model neglects efficiency losses due to flow-profilenon-uniformity [13], shunt currents, extension of the electro-active zone [14], and depletion of dissolved species.
Under these assumptions, the time-averaged polarization isproportional to area-specific resistance, Rasr, and current density i,i.e. DF ¼ iRasr, where current density is the product of the cell'sarea-specific capacity and plug-level C-rate. Area-specific resis-tance includes contributions from the anode (subscript a), cathode(subscript c), and separator (subscript s) shown in Eq. (4) where hj,seff,j, and keff,j are respectively the electrode thickness, effectiveelectronic conductivity, and effective ionic conductivity of electrodej.
Rasr ¼"ha2
1
seff ;aþ 1keff ;a
!þ Rs þ hc
2
1
seff ;cþ 1keff ;c
!#(4)
When vanadium-redox solutions are flowed through porouscarbon current collectors, surface reaction kinetics can producesubstantial polarization that is not accounted for in Eq. (4). Weaccount for this polarization by also including in DF the kineticoverpotentials produced by uniform reactions in both electrodes.Uniform reactions occur strictly at low current densities wheretransport is kinetically limited, but here we use this result to esti-mate kinetic effects at all current densities. Using the Butler-eVolmer equation with equal anodic and cathodic transfercoefficients, the overpotential hj for electrode j is expressed in Eq.(5).
hj ¼2RgTF
a sinh
1
2hji0;jas;j
!(5)
Here, the exchange current density and electroactive surface-
B.J. Hopkins et al. / Journal of Power Sources 293 (2015) 1032e1038 1035
area per unit electrode-volume are i0,j and as,j, respectively, and Rg,T, and F are the universal gas constant, temperature, and Faraday'sconstant.
The flow battery has additional losses due to pumping the fluidthrough the stack channels. Due to the need for thin electrodes tomaximize electrochemical efficiency, the pumping losses are likelymuch greater in the stack than anywhere else in the system. Thepumping losses are a function of the fluid properties of the elec-trode, the electrode thickness, and the length of the flow channel,and are calculated as follows. Flow channels of length l with a highaspect ratio rectangular cross-section (w >> hp) are assumed, asthis cross-section minimizes pumping losses. The pumping lossesare calculated as a percentage of the theoretical energy density ofthe system by assuming that full depth-of-discharge is achieved ina single flow-pass, i.e., stoichiometric flow conditions are used. Theenergy density per unit volume dissipated to pump suspension orsolution through the cell in a single pass is calculated as DP(1�1/p).DP is the pressure-drop across the static cell's current collector, andits calculation depends on the type of fluid employed in the flowcell, as described subsequently. Solution and suspension pressure-drops were calculated according to the inset equations in Fig. S1aand b, respectively. For the suspension, plastic viscosity is neglec-ted, because for the cases shown, the elastic stresses dominate theflow, which is reflected by a Bingham number, the characteristicratio of elastic-to-viscous flow stresses, that is greater than unity[13].
The total energy efficiency including both electrochemical andmechanical losses is constrained to be 95% in most of the resultsshown. Channel lengths l of 100 mm to 3 m are evaluated, as thisencompasses a realistic range of stack dimensions. The pressuredrop DP is calculated as a function of plug count p for cells having(a) vanadium-redox solution and (b) suspension with 10 vol% LFP.For each plug count, DP was calculated for the thickness hp corre-sponding to the specified energy efficiency including electro-chemical and mechanical energy-losses at C/5 system-level rateand with separator length l. Continuous, stoichiometric flow con-ditions were assumed. The pressure drop results are shown inFig. S1 in the supplemental information to this article.
The LFP suspension was assumed to have a Bingham plasticrheology with yield shear-stress t0 equal to 6.5 Pa, as measuredpreviously for 10 vol% LFP with 1 vol% Ketjen black [15]. Suspen-sions with 20 vol% and 40 vol% active material were modeled withyield shear-stresses of 62 Pa and 172 Pa, respectively. These valueswere estimated by linear extrapolation of yield shear-stress data inRef. [15] with LFP loading for suspensions with 1 vol% Ketjen black.Solution pressure-drop caused by flow through a porous currentcollector wasmodeled using the inset equation in Fig. S1a assumingDarcy flow for a saturated VIV solution in 5 mol L�1 H2SO4 with aviscosity of 10mPa s [16] and a hydraulic permeability k of 10�11 m2
for 7 mm diameter carbon-fiber felt at 20 vol% [17]. The electrodethickness that gives 95% round trip energy efficiency (or othervalues noted later), taking into account both electrochemical andpumping losses, was then used as input to determine the relativecosts of the flow and static cells.
4. Properties of model chemistries
The average open-circuit potential is taken as 1.3 V for thevanadium-redox chemistry [18] and 0.9 V for the LFP/LTP chemistry[15]. For the 2 mol L�1 vanadium-redox solution, a volumetric ca-pacity of 53.6 mAh cm�3 is assumed. For the LFP/LTP chemistry, it isassumed that the cell is cathode-limited with a theoretical capacityof 610 mAh cm�3 based on LFP volume only [19]. The effectiveelectronic conductivity used for both electrodes of the vanadium-redox cell is 100 S m�1, estimated for a flow-through carbon felt.
The electronic conductivity of both electrodes of the LFP/LTP cell isassumed to be 0.1 S m�1, consistent with an aqueous semi-solidsuspension that uses a percolating network of nanoscale carbon[15]. The vanadium-redox cell is assumed to have an ionic con-ductivity for both electrodes of 600 mS cm�1 as expected for5 mol L�1 H2SO4 supporting electrolyte [20]. The electrolyte phaseof the LFP and LTP suspensions is taken to be an aqueous solution of1 mol L�1 LiNO3, which at 300 K has an ionic conductivity of7 S cm�1 [21]. Effective ionic conductivities for the particle-loadedsuspensions are calculated from the Bruggeman approximation(i.e., keff ¼ koε
1.5, where ε and ko are porosity and bulk ionic con-ductivity, respectively) assuming porosity is occluded only by theactive-material particles. For the area-specific resistance of the ion-selective separator in the vanadium-redox cell, we use a measuredvalue for Nafion 117 of Rs ¼ 200 mU-cm2 [22]. For the LFP/LTP cell,the area-specific resistance of the separator depends on its effectiveionic conductivity, keff,s, and thickness, hs, as Rs ¼ hs/keff,s. For a 50%porous, 25 mm separator in aqueous electrolyte, this produces anarea-specific resistance of 100 mU cm2. Exchange current densitiesfor the cathodic and anodic vanadium-redox reactions weremeasured in situ by Aaron et al. [23]. They tested solutions having0.1 mol L�1 vanadium, and therefore we scale their reported valuesof exchange-current density for the 2.0 mol L�1 solutions investi-gated here assuming first-order dependence on vanadium con-centration [24] i0,a ¼ 0.045 mA cm�2 and i0,c ¼ 2 mA cm�2. We usean electroactive surface area for both electrodes of 1.6� 105m�1 forSGL 10 AA carbon paper [25], which was used by Aaron et al. [23].
The assumed costs of components are as follows. The costs ofcarbon black, H2O, and H2SO4 are negligible compared to othercomponents. The costs of vanadium, LTP, and LFP are assumed to be21 $ kg�1 [7], 15 $ kg�1, and 15 $ kg�1, respectively [26]. For thevanadium redox battery, the cost of the current collector and car-bon felt combined is assumed to be 71 $ m�2 [7] and themembranecost is assumed to be 500 $m�2 [7]. For the LFP/LTP cell, the costs ofthe current collector and separator are assumed to be 0.90 $ m�2
and 2 $ m�2, respectively [26], assuming the aluminum currentcollector thickness is 15 mm.
5. Results and discussion
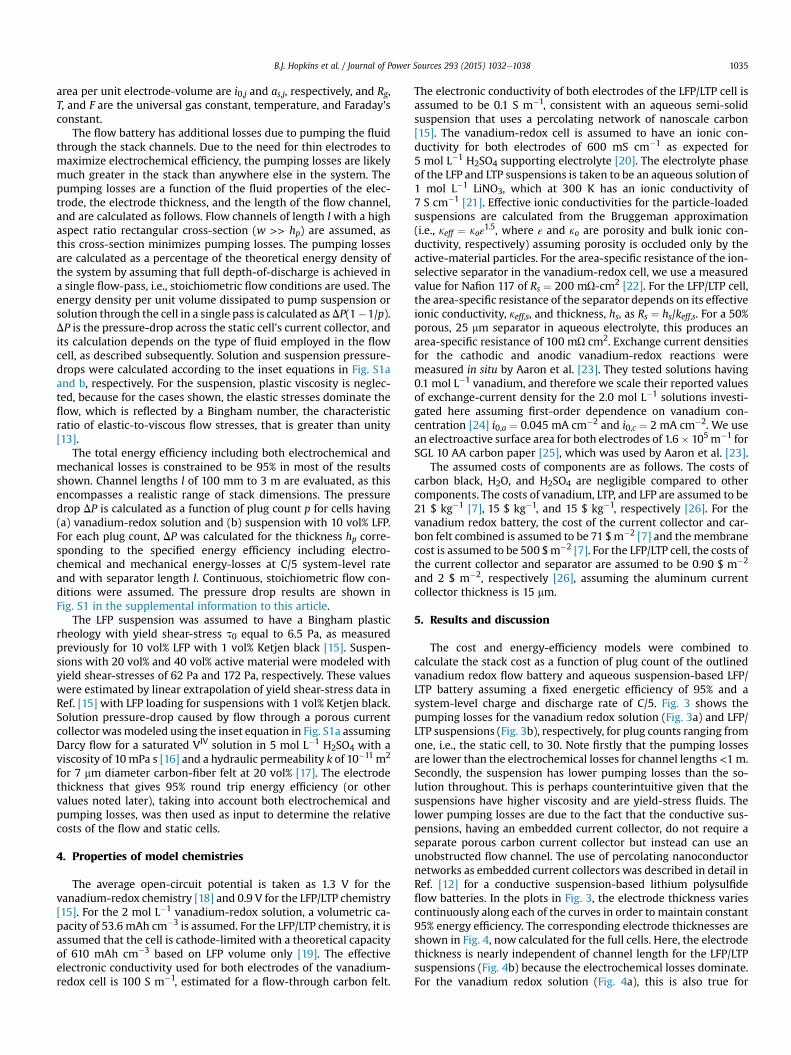
The cost and energy-efficiency models were combined tocalculate the stack cost as a function of plug count of the outlinedvanadium redox flow battery and aqueous suspension-based LFP/LTP battery assuming a fixed energetic efficiency of 95% and asystem-level charge and discharge rate of C/5. Fig. 3 shows thepumping losses for the vanadium redox solution (Fig. 3a) and LFP/LTP suspensions (Fig. 3b), respectively, for plug counts ranging fromone, i.e., the static cell, to 30. Note firstly that the pumping lossesare lower than the electrochemical losses for channel lengths <1m.Secondly, the suspension has lower pumping losses than the so-lution throughout. This is perhaps counterintuitive given that thesuspensions have higher viscosity and are yield-stress fluids. Thelower pumping losses are due to the fact that the conductive sus-pensions, having an embedded current collector, do not require aseparate porous carbon current collector but instead can use anunobstructed flow channel. The use of percolating nanoconductornetworks as embedded current collectors was described in detail inRef. [12] for a conductive suspension-based lithium polysulfideflow batteries. In the plots in Fig. 3, the electrode thickness variescontinuously along each of the curves in order to maintain constant95% energy efficiency. The corresponding electrode thicknesses areshown in Fig. 4, now calculated for the full cells. Here, the electrodethickness is nearly independent of channel length for the LFP/LTPsuspensions (Fig. 4b) because the electrochemical losses dominate.For the vanadium redox solution (Fig. 4a), this is also true for
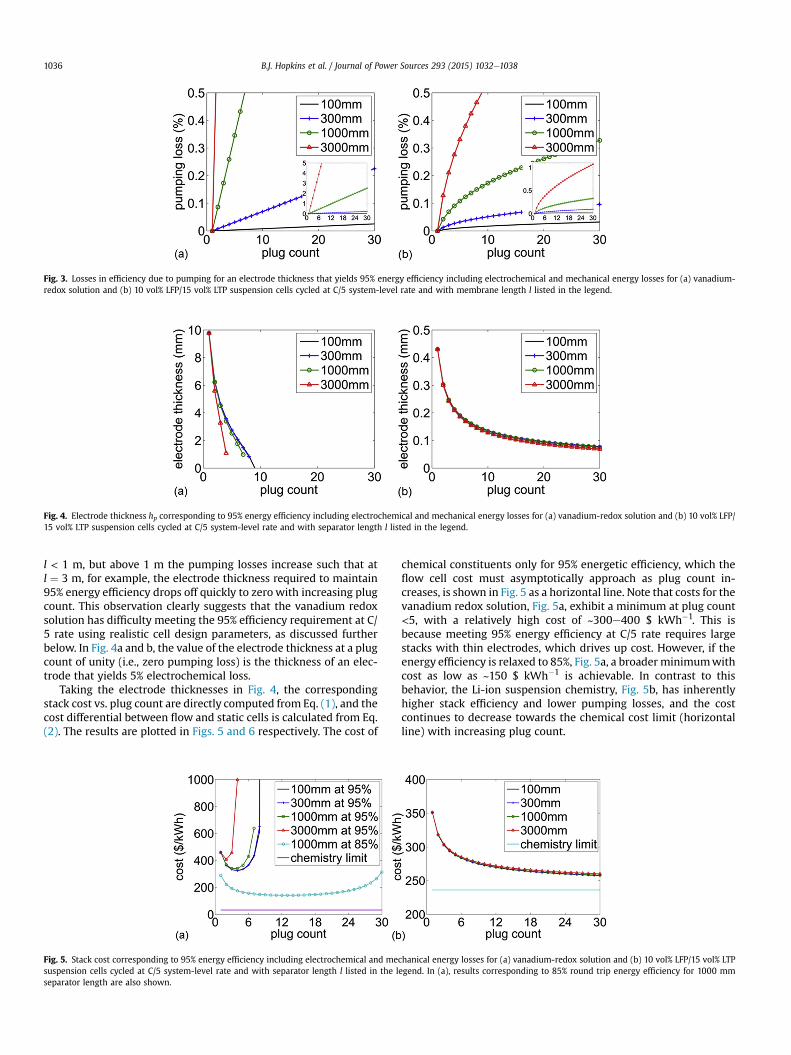
Fig. 3. Losses in efficiency due to pumping for an electrode thickness that yields 95% energy efficiency including electrochemical and mechanical energy losses for (a) vanadium-redox solution and (b) 10 vol% LFP/15 vol% LTP suspension cells cycled at C/5 system-level rate and with membrane length l listed in the legend.
Fig. 4. Electrode thickness hp corresponding to 95% energy efficiency including electrochemical and mechanical energy losses for (a) vanadium-redox solution and (b) 10 vol% LFP/15 vol% LTP suspension cells cycled at C/5 system-level rate and with separator length l listed in the legend.
B.J. Hopkins et al. / Journal of Power Sources 293 (2015) 1032e10381036
l < 1 m, but above 1 m the pumping losses increase such that atl ¼ 3 m, for example, the electrode thickness required to maintain95% energy efficiency drops off quickly to zero with increasing plugcount. This observation clearly suggests that the vanadium redoxsolution has difficulty meeting the 95% efficiency requirement at C/5 rate using realistic cell design parameters, as discussed furtherbelow. In Fig. 4a and b, the value of the electrode thickness at a plugcount of unity (i.e., zero pumping loss) is the thickness of an elec-trode that yields 5% electrochemical loss.
Taking the electrode thicknesses in Fig. 4, the correspondingstack cost vs. plug count are directly computed from Eq. (1), and thecost differential between flow and static cells is calculated from Eq.(2). The results are plotted in Figs. 5 and 6 respectively. The cost of
Fig. 5. Stack cost corresponding to 95% energy efficiency including electrochemical and mesuspension cells cycled at C/5 system-level rate and with separator length l listed in the lseparator length are also shown.
chemical constituents only for 95% energetic efficiency, which theflow cell cost must asymptotically approach as plug count in-creases, is shown in Fig. 5 as a horizontal line. Note that costs for thevanadium redox solution, Fig. 5a, exhibit a minimum at plug count<5, with a relatively high cost of ~300e400 $ kWh�1. This isbecause meeting 95% energy efficiency at C/5 rate requires largestacks with thin electrodes, which drives up cost. However, if theenergy efficiency is relaxed to 85%, Fig. 5a, a broader minimumwithcost as low as ~150 $ kWh�1 is achievable. In contrast to thisbehavior, the Li-ion suspension chemistry, Fig. 5b, has inherentlyhigher stack efficiency and lower pumping losses, and the costcontinues to decrease towards the chemical cost limit (horizontalline) with increasing plug count.
chanical energy losses for (a) vanadium-redox solution and (b) 10 vol% LFP/15 vol% LTPegend. In (a), results corresponding to 85% round trip energy efficiency for 1000 mm
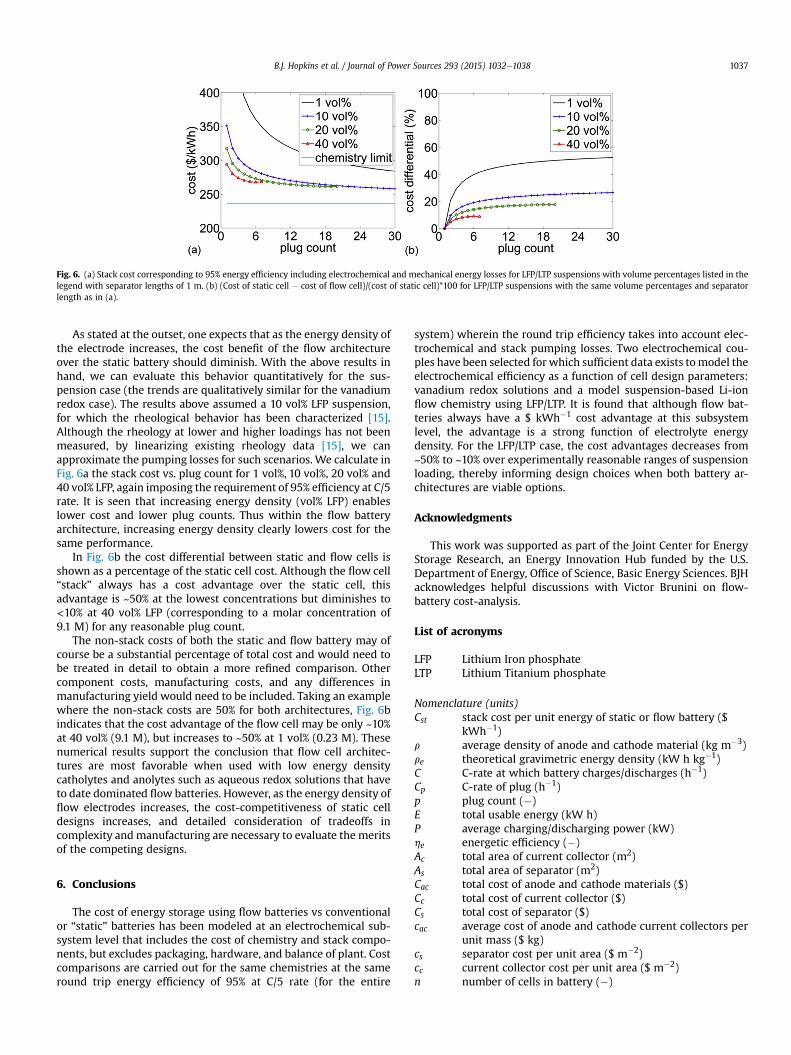
Fig. 6. (a) Stack cost corresponding to 95% energy efficiency including electrochemical and mechanical energy losses for LFP/LTP suspensions with volume percentages listed in thelegend with separator lengths of 1 m. (b) (Cost of static cell � cost of flow cell)/(cost of static cell)*100 for LFP/LTP suspensions with the same volume percentages and separatorlength as in (a).
B.J. Hopkins et al. / Journal of Power Sources 293 (2015) 1032e1038 1037
As stated at the outset, one expects that as the energy density ofthe electrode increases, the cost benefit of the flow architectureover the static battery should diminish. With the above results inhand, we can evaluate this behavior quantitatively for the sus-pension case (the trends are qualitatively similar for the vanadiumredox case). The results above assumed a 10 vol% LFP suspension,for which the rheological behavior has been characterized [15].Although the rheology at lower and higher loadings has not beenmeasured, by linearizing existing rheology data [15], we canapproximate the pumping losses for such scenarios. We calculate inFig. 6a the stack cost vs. plug count for 1 vol%, 10 vol%, 20 vol% and40 vol% LFP, again imposing the requirement of 95% efficiency at C/5rate. It is seen that increasing energy density (vol% LFP) enableslower cost and lower plug counts. Thus within the flow batteryarchitecture, increasing energy density clearly lowers cost for thesame performance.
In Fig. 6b the cost differential between static and flow cells isshown as a percentage of the static cell cost. Although the flow cell“stack” always has a cost advantage over the static cell, thisadvantage is ~50% at the lowest concentrations but diminishes to<10% at 40 vol% LFP (corresponding to a molar concentration of9.1 M) for any reasonable plug count.
The non-stack costs of both the static and flow battery may ofcourse be a substantial percentage of total cost and would need tobe treated in detail to obtain a more refined comparison. Othercomponent costs, manufacturing costs, and any differences inmanufacturing yield would need to be included. Taking an examplewhere the non-stack costs are 50% for both architectures, Fig. 6bindicates that the cost advantage of the flow cell may be only ~10%at 40 vol% (9.1 M), but increases to ~50% at 1 vol% (0.23 M). Thesenumerical results support the conclusion that flow cell architec-tures are most favorable when used with low energy densitycatholytes and anolytes such as aqueous redox solutions that haveto date dominated flow batteries. However, as the energy density offlow electrodes increases, the cost-competitiveness of static celldesigns increases, and detailed consideration of tradeoffs incomplexity andmanufacturing are necessary to evaluate the meritsof the competing designs.
6. Conclusions
The cost of energy storage using flow batteries vs conventionalor “static” batteries has been modeled at an electrochemical sub-system level that includes the cost of chemistry and stack compo-nents, but excludes packaging, hardware, and balance of plant. Costcomparisons are carried out for the same chemistries at the sameround trip energy efficiency of 95% at C/5 rate (for the entire
system) wherein the round trip efficiency takes into account elec-trochemical and stack pumping losses. Two electrochemical cou-ples have been selected for which sufficient data exists tomodel theelectrochemical efficiency as a function of cell design parameters:vanadium redox solutions and a model suspension-based Li-ionflow chemistry using LFP/LTP. It is found that although flow bat-teries always have a $ kWh�1 cost advantage at this subsystemlevel, the advantage is a strong function of electrolyte energydensity. For the LFP/LTP case, the cost advantages decreases from~50% to ~10% over experimentally reasonable ranges of suspensionloading, thereby informing design choices when both battery ar-chitectures are viable options.
Acknowledgments
This work was supported as part of the Joint Center for EnergyStorage Research, an Energy Innovation Hub funded by the U.S.Department of Energy, Office of Science, Basic Energy Sciences. BJHacknowledges helpful discussions with Victor Brunini on flow-battery cost-analysis.
List of acronyms
LFP Lithium Iron phosphateLTP Lithium Titanium phosphate
Nomenclature (units)Cst stack cost per unit energy of static or flow battery ($
kWh�1)r average density of anode and cathode material (kg m�3)re theoretical gravimetric energy density (kW h kg�1)C C-rate at which battery charges/discharges (h�1)Cp C-rate of plug (h�1)p plug count (�)E total usable energy (kW h)P average charging/discharging power (kW)he energetic efficiency (�)Ac total area of current collector (m2)As total area of separator (m2)Cac total cost of anode and cathode materials ($)Cc total cost of current collector ($)Cs total cost of separator ($)cac average cost of anode and cathode current collectors per
unit mass ($ kg)cs separator cost per unit area ($ m�2)cc current collector cost per unit area ($ m�2)n number of cells in battery (�)
B.J. Hopkins et al. / Journal of Power Sources 293 (2015) 1032e10381038
l length of separator in single cell (m)w width of separator in single cell (m)hp electrode thickness or distance from separator to current
collector (m)DF time-averaged polarization (V)feq average open-circuit potential (V)Rasr area-specific resistance (U m2)i current density (A m�2)h thickness of electrode (m)seff effective electronic conductivity of electrode (S m�1)keff effective ionic conductivity of electrode (S m�1)ε porosity (�)ko bulk ionic conductivity (S m�1)Rs area-specific resistance of the ion-selective separator in
the vanadium-redox cell (U m2)h overpotential (V)Rg universal gas constant (J K�1 mol�1)T temperature (K)F Faraday's constant (C mol�1)a electroactive surface-area per unit electrode-volume
(m�1)
Appendix A. Supplementary data
Supplementary data related to this article can be found at http://dx.doi.org/10.1016/j.jpowsour.2015.06.023.
References
[1] B. Dunn, H. Kamath, J.-M. Tarascon, Science 334 (2011) 928.[2] S.M. Schoenung, W.V. Hassenzahl, Long- vs. Short-term Energy Storage
Technologies Analysis: a Life-cycle Cost Study: a Study for the DOE EnergyStorage Systems Program, 2003. Albuquerque, New Mexico.
[3] “ Recovery Act ” Financial Assistance Funding Opportunity Announcement,2010. U. S.Department of Energy e Headquarters Advanced Research ProjectsAgency e Energy ( ARPA-E ) Grid-Scale Rampable Intermittent DispatchableStorage ( GRIDS ) DE-FOA-0000290.
[4] P.A. Nelson, K.G. Gallagher, I. Bloom, D.W. Dees, Modeling the performanceand cost of lithium-ion batteries for electric-drive vehicles, Argonne NationalLaboratory, 2012.
[5] M.A. Delucchi, T.E. Lipman, Transp. Res. Part D Transp. Environ. 6 (2001) 371.[6] D.N. Rakhmatov, S.B.K. Vrudhula, IEEE/ACM Int. Conf. Comput. Aided Des.
ICCAD 2001, IEEE/ACM Dig. Tech. Pap. (Cat. No.01CH37281), 2001, p. 488.[7] M. Zhang, M. Moore, J.S. Watson, T.A. Zawodzinski, R.M. Counce,
J. Electrochem. Soc. 159 (2012) A1183.[8] D.P. Scamman, G.W. Reade, E.P.L. Roberts, J. Power Sources 189 (2009) 1231.[9] R.M. Darling, K.G. Gallagher, J.A. Kowalski, S. Ha, F.R. Brushett, Energy Environ.
Sci. 7 (2014) 3459.[10] V. Viswanathan, A. Crawford, D. Stephenson, S. Kim, W. Wang, B. Li, G. Coffey,
E. Thomsen, G. Graff, P. Balducci, M. Kintner-Meyer, V. Sprenkle, J. PowerSources 247 (2014) 1040.
[11] Y. Yang, G. Zheng, Y. Cui, Energy Environ. Sci. 6 (2013) 1552.[12] F.Y. Fan, W.H. Woodford, Z. Li, N. Baram, K.C. Smith, A. Helal, G.H. McKinley,
W.C. Carter, Y. Chiang, Nano Lett. 14 (2014) 2210.[13] K.C. Smith, Y.-M. Chiang, W.C. Carter, J. Electrochem. Soc. 161 (2014) A486.[14] K.C. Smith, V.E. Brunini, Y. Dong, Y.-M. Chiang, W.C. Carter, Rev.. (n.d.).[15] Z. Li, K.C. Smith, Y. Dong, N. Baram, F.Y. Fan, J. Xie, P. Limthongkul, W.C. Carter,
Y.-M. Chiang, Phys. Chem. Chem. Phys. 15 (2013) 15833.[16] G. Oriji, Y. Katayama, T. Miura, Electrochim. Acta 49 (2004) 3091.[17] A.Z. Weber, M.M. Mench, J.P. Meyers, P.N. Ross, J.T. Gostick, Q. Liu, J. Appl.
Electrochem 41 (2011) 1137.[18] M. Skyllas-Kazacos, M. Rychcik, R.G. Robins, A.G. Fane, M.A. Green,
J. Electrochem. Soc. 133 (1986) 1057.[19] A.K. Padhi, K.S. Nanjundaswamy, J.B. Goodenough, J. Electrochem. Soc. 144
(1997).[20] F. Rahman, M. Skyllas-Kazacos, J. Power Sources 189 (2009) 1212.[21] A.N. Campbell, G.H. Debus, E.M. Kartzmark, Can. J. Chem. 33 (1955) 1508.[22] F.N. Büchi, G.G. Scherer, J. Electroanal. Chem. 404 (1996) 37.[23] D. Aaron, C.-N. Sun, M. Bright, A.B. Papandrew, M.M. Mench, T.A. Zawodzinski,
ECS Electrochem. Lett. 2 (2013) A29.[24] R.M. Darling, M.L. Perry, J. Electrochem. Soc. 161 (2014) A1381.[25] S.C. Barton, Y. Sun, B. Chandra, S. White, J. Hone, Electrochem. Solid-State Lett.
10 (2007) B96.[26] W.F. Howard, R.M. Spotnitz, J. Power Sources 165 (2007) 887.


![L 25 Electricity & Magnetism [2] static electricity –the van de Graff generator –electrostatic shielding lightning batteries and frogs legs electric circuits.](https://static.fdocuments.us/doc/165x107/56649e4c5503460f94b4108f/l-25-electricity-magnetism-2-static-electricity-the-van-de-graff-generator.jpg)