Complexity management in BiZZdesigner – an evaluation...
13
Complexity management in BiZZdesigner – an evaluation of a business process modelling tool Floor de Jong [email protected] ABSTRACT The understandability of business process models is often not as good as presumed. Most diagrams are too complex for novices to understand. BiZZdesigner is a CASE tool for modelling business processes and does not explicitly support complexity management. The support for decompositions is rather good and effective. But especially the navigation, integration between models and orientation can be improved. Amongst others a navigation screen with a locator map, the scale, level and neighbouring diagrams would improve BiZZdesigner and make the diagrams less complex. Keywords Complexity, business process modelling, CASE tool, decomposition. 1. INTRODUCTION Requirements modelling and modelling tools are widely used and criticized by scientists. In a more competitive world companies have to maximize the efficiency of their processes to make more profit and continue to grow [GT94]. Modelling business processes and if needed re-engineering them is standard in most larger companies and has proven its importance. But in the scientific field more often criticism is heard because most models are simply too difficult and complex to understand, while the main reason people use diagrams and pictures is because they are supposed to be worth “a thousand words” [Moo06a]. Complexity management can improve the understandability of diagrams by novices, making sure that diagrams indeed are worth the thousand words mentioned. Complexity management is the control of complexity with the goal to reduce excessive complexity in a diagram. In this research the number of elements in a diagram defines the complexity. Complexity can be reduced for example by decomposing models; dividing a large, complex model into several smaller ones. Or for example by adding marks for orientation, so that the user understands the place of a particular diagram in the bigger picture [Moo06a]. This research is about the evaluation of a business process tool of BiZZdesign, a Dutch company which is an consultancy and tools firm. The CASE tool evaluated in this research is BiZZdesigner, one of their main products. 2. PROBLEM STATEMENT The main goal of this research is as follows: To make an evaluation of the complexity management mechanisms BiZZdesigner uses and give recommendations for the improvement of this tool. This evaluation is set up according to the nine principles Moody identifies in [Moo06a]. These principles are introduced in paragraph 2.1 and explained further in chapter 3. A secondary goal of this evaluation is: To evaluate the complexity management principles and their applicability to business process models. This goal is subordinate to the first goal and not examined as much as the first goal. 2.1 Theoretical significance There has been done a lot of research in the field of modelling in general and modelling business processes in particular. An important study for this research is “Dealing with Absurdly Complex Diagrams” from Daniel Moody. In this study Moody proposes a set of principles to reduce the complexity in requirements models and reduce the overload users encounter, including for example decomposition, summarisation and signposting [Moo06a]. The evaluation in this research is based on these principles, the next chapter introduces these principles. Other research on complexity in models is done by L. Nguyen and P.A. Swatman [NS00]. They make a difference between two types of complexity; the essential and incidental complexities. According to Nguyen and Swatman the complexity inherent in the content should be increased and the complexity due to entropy should be minimized. Complexity in the context of modelling has not often been examined. More research is done on IS modelling in general, concluding that diagrammatic reasoning is hard to understand, especially with multiple diagrams [KHH00] and that radical change is needed [Moo06b]. Another research suggests that simulation tools are great to model business processes [GT94]. There are also some evaluations of business models, although not as much as expected from the amount of critical studies on models. Peter Green and Michael Rosemann evaluated the business process modelling approach ‘Architecture of Integrated Information Systems’ (ARIS) using the ‘Bunge- Wand-Weber’ (BWW) theory. They found that not all ARIS- views were useful or understandable and that the approach did not contain some of the BWW-constructs [GR99]. The BWW theory is also used to evaluate UML and shows that UML matches with the BWW-model, but can also be improved [OHS02]. Unfortunately the BWW theory does not have much to do with complexity and therefore is not usable as such in this evaluation. This research is relevant for the existing theories because it brings one of the most relevant and newest theories about complexity management into practice, namely [Moo06a]. This Permission to make digital or hard copies of all or part of this work for personal or classroom use is granted without fee provided that copies are not made or distributed for profit or commercial advantage and that copies bear this notice and the full citation on the first page. To copy otherwise, or republish, to post on servers or to redistribute to lists, requires prior specific permission. 6th Twente Student Conference on IT, Enschede, 2nd February, 2007 Copyright 2007, University of Twente, Faculty of Electrical Engineering, Mathematics and Computer Science
Transcript of Complexity management in BiZZdesigner – an evaluation...

Complexity management in BiZZdesigner – an evaluation of a business process modelling tool
Floor de Jong
ABSTRACT
The understandability of business process models is often not
as good as presumed. Most diagrams are too complex for
novices to understand. BiZZdesigner is a CASE tool for
modelling business processes and does not explicitly support
complexity management. The support for decompositions is
rather good and effective. But especially the navigation,
integration between models and orientation can be improved.
Amongst others a navigation screen with a locator map, the
scale, level and neighbouring diagrams would improve
BiZZdesigner and make the diagrams less complex.
Keywords
Complexity, business process modelling, CASE tool,
decomposition.
1. INTRODUCTION Requirements modelling and modelling tools are widely used
and criticized by scientists. In a more competitive world
companies have to maximize the efficiency of their processes
to make more profit and continue to grow [GT94]. Modelling
business processes and if needed re-engineering them is
standard in most larger companies and has proven its
importance. But in the scientific field more often criticism is
heard because most models are simply too difficult and
complex to understand, while the main reason people use
diagrams and pictures is because they are supposed to be
worth “a thousand words” [Moo06a].
Complexity management can improve the understandability of
diagrams by novices, making sure that diagrams indeed are
worth the thousand words mentioned. Complexity
management is the control of complexity with the goal to
reduce excessive complexity in a diagram. In this research the
number of elements in a diagram defines the complexity.
Complexity can be reduced for example by decomposing
models; dividing a large, complex model into several smaller
ones. Or for example by adding marks for orientation, so that
the user understands the place of a particular diagram in the
bigger picture [Moo06a].
This research is about the evaluation of a business process
tool of BiZZdesign, a Dutch company which is an
consultancy and tools firm. The CASE tool evaluated in this
research is BiZZdesigner, one of their main products.
2. PROBLEM STATEMENT
The main goal of this research is as follows:
To make an evaluation of the complexity management
mechanisms BiZZdesigner uses and give recommendations
for the improvement of this tool.
This evaluation is set up according to the nine principles
Moody identifies in [Moo06a]. These principles are
introduced in paragraph 2.1 and explained further in chapter
3. A secondary goal of this evaluation is:
To evaluate the complexity management principles and their
applicability to business process models.
This goal is subordinate to the first goal and not examined as
much as the first goal.
2.1 Theoretical significance There has been done a lot of research in the field of modelling
in general and modelling business processes in particular. An
important study for this research is “Dealing with Absurdly
Complex Diagrams” from Daniel Moody. In this study Moody
proposes a set of principles to reduce the complexity in
requirements models and reduce the overload users encounter,
including for example decomposition, summarisation and
signposting [Moo06a]. The evaluation in this research is
based on these principles, the next chapter introduces these
principles.
Other research on complexity in models is done by L. Nguyen
and P.A. Swatman [NS00]. They make a difference between
two types of complexity; the essential and incidental
complexities. According to Nguyen and Swatman the
complexity inherent in the content should be increased and
the complexity due to entropy should be minimized.
Complexity in the context of modelling has not often been
examined. More research is done on IS modelling in general,
concluding that diagrammatic reasoning is hard to understand,
especially with multiple diagrams [KHH00] and that radical
change is needed [Moo06b]. Another research suggests that
simulation tools are great to model business processes
[GT94].
There are also some evaluations of business models, although
not as much as expected from the amount of critical studies on
models. Peter Green and Michael Rosemann evaluated the
business process modelling approach ‘Architecture of
Integrated Information Systems’ (ARIS) using the ‘Bunge-
Wand-Weber’ (BWW) theory. They found that not all ARIS-
views were useful or understandable and that the approach did
not contain some of the BWW-constructs [GR99]. The BWW
theory is also used to evaluate UML and shows that UML
matches with the BWW-model, but can also be improved
[OHS02]. Unfortunately the BWW theory does not have
much to do with complexity and therefore is not usable as
such in this evaluation.
This research is relevant for the existing theories because it
brings one of the most relevant and newest theories about
complexity management into practice, namely [Moo06a]. This
Permission to make digital or hard copies of all or part of this work for personal
or classroom use is granted without fee provided that copies are not made or
distributed for profit or commercial advantage and that copies bear this notice and
the full citation on the first page. To copy otherwise, or republish, to post on
servers or to redistribute to lists, requires prior specific permission.
6th Twente Student Conference on IT, Enschede, 2nd February, 2007
Copyright 2007, University of Twente, Faculty of Electrical Engineering,
Mathematics and Computer Science

has never been done before and evaluates the usability of this
theory in practice, according to the second part of the goal of
this research.
2.2 Practical significance BiZZdesign is an innovative and growing company which has
a lot of important clients like the Belastingdienst, Laurus,
several universities and some financial institutions like ING
[Biz06]. It is important for the company to stay ahead of its
competitors and constantly improve their modelling tools.
The evaluation of BiZZdesigner points out weak elements in
the tool and gives some recommendations how to improve the
tool. This of course is of value for BiZZdesign and her
customers, because improving the tool on complexity issues
will increase the usability and understandability for users and
will improve the quality of BiZZdesigner as a whole.
3. PRINCIPLES TO REDUCE
COMPLEXITY As stated before, complexity of diagrams is defined by the
number of elements in the diagram. There are several ways to
reduce this number and thereby the complexity in a
requirements diagram. As said before articles on this subject
are hard to find. The most significant and apposite article for
this research is [Moo06a], about complexity management in
ER models. As the author says his research also “provides a
strong basis for generalising the research results to other types
of requirements diagrams”. The principles in the article are
specifically written for all kind of requirement models and not
only for ER diagrams. Therefore these principles are also
appropriate for the business models in this research.
Moody advises nine different principles to manage the
complexity of diagrams. These principles are listed below,
with their influence on complexity and practical interpretation
[Moo60a].
3.1 Decomposition One of the most used principles is decomposition, or dividing
diagrams into smaller parts of manageable size (sub-
diagrams). In this way diagrams fit better to the working
memory of a person and are more comprehensible.
According to Moody manageable size is a maximum of nine
elements per part. Each part should be given a meaningful
name and each element is assigned to one and only one sub-
diagram.
3.2 Summarisation The danger of decomposition is that the understanding of the
model as a whole becomes worse. Summarisation provides an
overview of the model to support conceptual integration. In
this way users can see the bigger picture.
A summary diagram of the model often is a diagram of all the
sub-models and the relationship between them. Other
conventions should be used to underline the difference with
the original diagrams, for example by using 3D-boxes instead
of normal nodes. Furthermore, only the most important
relationships should be shown to avoid cluttering the diagram.
3.3 Horizontal integration To relate a sub-diagram to other sub-diagrams horizontal
integration should be a part of every sub-diagram. Perceptual
cues help the user to integrate information from several
diagrams.
Redundancy of all related foreign elements is a way to
introduce horizontal integration. Elements related to the sub-
diagram should be incorporated in the sub-diagram shown
with dotted lines and with a reference to their ‘home’
diagram.
3.4 Vertical integration The user should always be aware of his navigation
possibilities in order to support full perceptual integration.
Signposting provides cues to navigate through diagrams.
Horizontal integration, as described in paragraph 3.3, is a part
of the signposting needed. Vertical navigation should also be
incorporated, by adding easily recognisable icons to zoom in
and out. In this way the user always knows what the parent
diagram is and where to find it (zoom out) and the same for
the child diagram(s) or textual definitions (zoom in).
3.5 Navigational map The navigational map displays the elements of the model and
the navigation possible between them. It shows the user how
to navigate in the ‘information space’.
This map can be formed as a tree map or a hierarchy chart.
The map provides an overview of the total model and says
something about the content of the sub-diagrams, which aids
navigation.
3.6 Orientation At every moment the user should be able to see where he is in
relation to other diagrams. Orientation is an important aspect
to increase the usability and understandability of the diagrams
because the user will not have to look back at the navigation
map.
Orientation elements are the diagram name, the level
numbering, the scale (level of abstraction) and a locator map
(a navigational map highlighting where the user is at the
moment). All parts should appear in the same place on every
diagram.
3.7 Indexing To be able to search efficiently, an index should be included
in every model. The index relates the location of an element to
the name of the element and avoids that the user has to search
through every diagram.
Indexing can be done per type of element and should include
all element names and possible synonyms. These should be
linked to the location of their ‘home’ diagram.
3.8 Spatial contiguity Normally, a person has to use his ‘working memory’ to take
knowledge about a diagram with him when viewing the next
diagram. This is a costly process for users, especially when
they have to compare two diagrams constantly. Spatial
contiguity is the idea of being able to have a parallel view of
two or more diagrams. This reduces the overload of working
memory of a user so that he is able to interpret the model
more easily.
For paper versions it often is enough to avoid to staple or bind
together the different diagrams. In this way a user can lay two
sheets next to each other. Virtual tools have to be able to
compare the models in different windows next to each other at
the same screen. This can be done manually by the user or
automatically by the system.

3.9 Perceptual grouping Perceptual grouping is the grouping of elements according to
the “Gestalt Laws of Perception”. This can be an alternative
or an addition to decomposition (paragraph 3.1). Grouping
elements decreases the number of ‘chunks’ the user has to
memorize in his working memory.
Two important Gestalt principles are proximity and common
region. Proximity means that elements that are close together
have to be grouped together and common region means that
elements within the same boundary have to be grouped
together.
4. RESEARCH QUESTIONS The main research question is derived from the goal of this
research as specified in chapter 2. This results in the following
main research question:
What complexity management mechanisms does BiZZdesigner
currently use and how effective are they?
The answer to the main question is found by answering the
following sub questions:
1. What are the problems experienced in working with
very large business processes?
2. How can the nine principles as described in chapter
3 be used to evaluate the tool BiZZdesigner?
3. What complexity management principles does
BiZZdesigner currently use?
4. How effective are these nine principles?
5. To what extent are the complexity management
principles applicable to business process models?
6. What are the main improvements for BiZZdesigner?
The first question is an orientation on the field of practice and
delivers the two or three biggest problems data experts and
users encounter. The answers to this question will be
discussed in chapter 6. The answer to the second question can
be found in chapter 7.1 and states how these aspects can be
transformed in a good evaluation method and how the tool
can be approached for this evaluation. The third question is
the answer to the first part of the main research question
(paragraph 7.2) and question 4 addresses the second part of
the main question (paragraph 7.3). The fifth question is the
question which gives an answer to the secondary problem
statement. This answer can be found in paragraph 7.4. The
last question contains the recommendations to improve
BiZZdesigner, which can be found in chapter 9.
5. RESEARCH METHOD To provide input for the evaluation of BiZZdesigner a real
case is used. This case is provided by a company using
another tool than BiZZdesigner to model it’s diagrams. This
company has diagrams of A0-size, which is 16 times as big as
a usual A4 sheet of paper (841 by 1189 millimetre, measuring
one square metre). The answer to sub question 1 is derived
from an interview with the diagram expert of this company
and is about the problems he experienced with these
diagrams.
In the evaluation the way in which the tool responds to such
huge and complex models is examined and the findings and
imperfections directly lead to the recommendations. Does
BiZZdesigner have efficient mechanisms to reduce the
complexity of these diagrams? During the evaluation the
original diagram is manipulated, reducing the complexity with
each step. An important part of the recommendations is about
what the BiZZdesigner diagrams can look like. This part is
like an action research, but without an extensive evaluation
cycle (Plan, Do, Check, Act-cycle). The cycle is run one-time:
Plan: Planning the visit to the company and the research.
Obtain a relevant case.
Do: Remodel the case in BiZZdesigner. Improve the models
according to the principles described in chapter 3.
Check: Evaluate the effectiveness of the principles in this
case and the effect and applicability on business process
diagrams in general.
There is no check with the company and BiZZdesigner if
these recommendations really are improvements and if it is
possible to implement them.
Act: There will be no action after the check. It is expected
that there will not be enough time to improve the
recommendations.
There has been no evaluation with users or action or
laboratory research because that is not where this research
focuses. Although user evaluations would probably add value
to the results, the evaluation in this research is only an
evaluation based on theory. Evaluation with users can be
interesting for further research.
6. CASE STUDY: PROBLEMS
EXPERIENCED IN PRACTICE WITH
COMPLEX PROCESS DIAGRAMS The diagram expert interviewed for this chapter pointed out
some problems he experienced in his work. One of the main
problems he encountered was that there is no clear standard to
model these diagrams in. A tool he used (BWise) uses another
format than he would like to, leading to unclear definitions
about the difference between OR-splits and AND-splits (and
joins). As an electrical engineer the splits and joins the tool
provided were completely the opposite of what he was used
to.
The tool he is using now (Flowcharter) is also not living up to
his demands. The splits and joins are also not very clear and
besides this problem there also was no clear way to show that
an element consisted of other elements.
Therefore he invented his own standard with AND- and OR-
splits and joins and an element which actually is a collapsed
sub-diagram. Also the team captains on the work floor made
their own diagrams (work instructions) in their own standard.
According to the expert that is no problem considering that
only his employees have to understand his annotation.
He also ran into the fact that there was no possibility to model
swimlanes. He made them himself with ordinary lines. The
actor-lanes would be clearer when the actors are also shown at
the bottom of the page.
Another big problem is that he had to print the diagrams on
enormous sheets of paper to be able to discuss them with the
stakeholders. There was no better way to discuss and explain
them to his colleagues and the team captains.
The expert also pointed out that it may be useful to use two
different diagram styles; one for experts (his colleagues) and
one for novices (the team captains). In the expert-diagram
annotations can be shorter and implicit while in the novice-
diagram annotations should be clearer and explained.
Concluding he definitely encountered some problems with
modelling the business processes. The problems described
above however are not very applicable to the nine principles

used within this research. Either way they illustrate some
other problems experienced in practice.
Another interview was done with a novice who had no
experience with requirement models at all, a physiotherapy
student. When he saw the initial diagram used in this research
he was totally astonished and did not see what it was about.
As he said, he was a little bit afraid of looking at it. When he
saw the decomposition of the diagram he thought it was a
completely different diagram because he understood what it
was about and did not turn away from it. Even though this is
only a very small experiment, it illustrates how people
respond to large diagrams and how their reaction changes
when they see a decomposition of the same diagram.
7. EVALUATION The tool BiZZdesigner is evaluated using the nine principles
from chapter 3. Let us recall the main question of this
research:
What complexity management mechanisms does BiZZdesigner
currently use and how effective are they?
In order to give a complete answer to this question this
chapter has been divided into three parts. Paragraph 7.1 gives
an explanation of the evaluation method used. The second
paragraph gives an answer to the first part of the main
question and addresses the complexity management
mechanisms currently used. This includes the nine principles
from the previous chapter, but also possible other solutions.
The third and last paragraph addresses the effectiveness of the
mechanisms used, which is the second part of the main
question.
7.1 Evaluation method The diagram used is derived from a case from a company
implementing a new ERP system. They use business process
modelling to make clear what business processes the company
has and have modelled three different processes. Two of these
models have been used for this research (see Figure 1 and
Figure 2).
7.1.1 Setting up the initial diagram The initial diagram for this research is derived from the two
diagrams in Figure 1 and Figure 2 below. The second diagram
called ProductieDossiers (translated ‘ProductionFiles’) is a
part of the first and main diagram VerkoopRegels (translated
‘SalesRules’). ProductieDossiers is a more detailed diagram
of the component ‘Engineering, WVD, Productie, Expeditie’
in VerkoopRegels. The third diagram mentioned before, but
not used in this research, is InkoopRegels
(‘ProcurementRules’) and a specification of the component
‘Inkopen’ in ProductieDossiers.
Figure 1 - Main process 'Verkoopregels'
Figure 2 - Imbedded process 'ProductieDossiers'
block
checkenkans
Legenda item*
OR-join
behaviour block
OR-split
repeating action
AND-join
AND-split
create the item
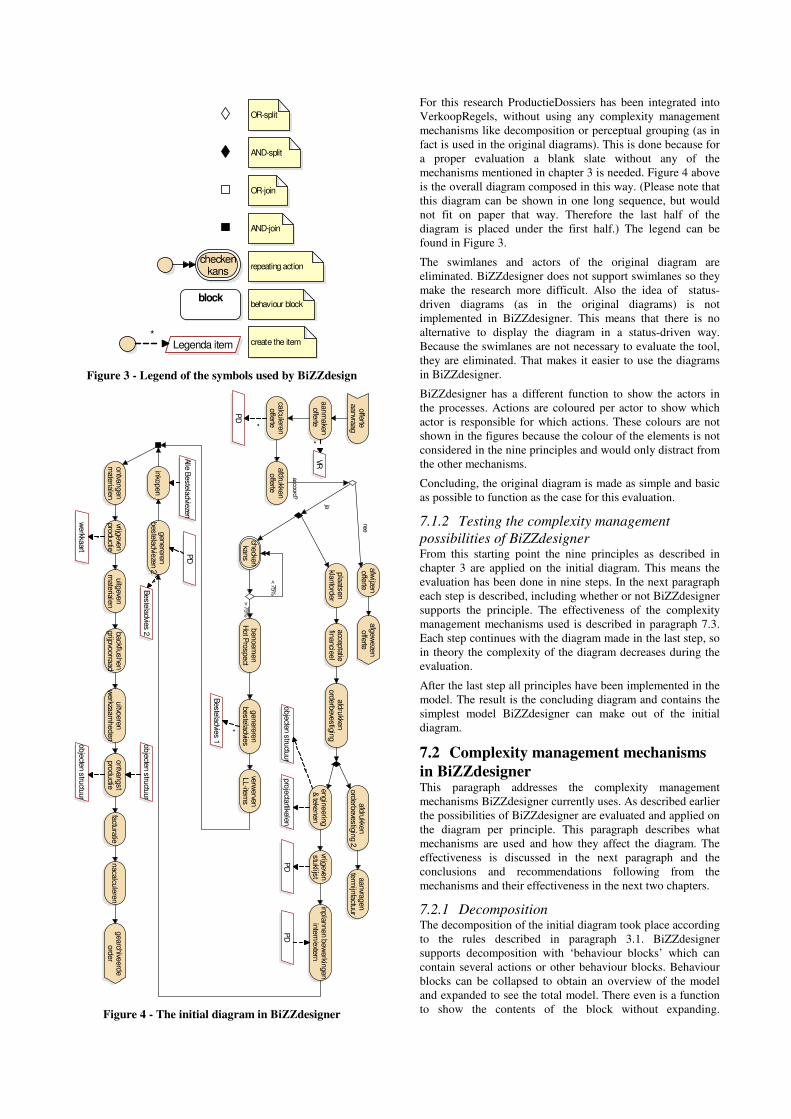
Figure 3 - Legend of the symbols used by BiZZdesign
Figure 4 - The initial diagram in BiZZdesigner
For this research ProductieDossiers has been integrated into
VerkoopRegels, without using any complexity management
mechanisms like decomposition or perceptual grouping (as in
fact is used in the original diagrams). This is done because for
a proper evaluation a blank slate without any of the
mechanisms mentioned in chapter 3 is needed. Figure 4 above
is the overall diagram composed in this way. (Please note that
this diagram can be shown in one long sequence, but would
not fit on paper that way. Therefore the last half of the
diagram is placed under the first half.) The legend can be
found in Figure 3.
The swimlanes and actors of the original diagram are
eliminated. BiZZdesigner does not support swimlanes so they
make the research more difficult. Also the idea of status-
driven diagrams (as in the original diagrams) is not
implemented in BiZZdesigner. This means that there is no
alternative to display the diagram in a status-driven way.
Because the swimlanes are not necessary to evaluate the tool,
they are eliminated. That makes it easier to use the diagrams
in BiZZdesigner.
BiZZdesigner has a different function to show the actors in
the processes. Actions are coloured per actor to show which
actor is responsible for which actions. These colours are not
shown in the figures because the colour of the elements is not
considered in the nine principles and would only distract from
the other mechanisms.
Concluding, the original diagram is made as simple and basic
as possible to function as the case for this evaluation.
7.1.2 Testing the complexity management
possibilities of BiZZdesigner From this starting point the nine principles as described in
chapter 3 are applied on the initial diagram. This means the
evaluation has been done in nine steps. In the next paragraph
each step is described, including whether or not BiZZdesigner
supports the principle. The effectiveness of the complexity
management mechanisms used is described in paragraph 7.3.
Each step continues with the diagram made in the last step, so
in theory the complexity of the diagram decreases during the
evaluation.
After the last step all principles have been implemented in the
model. The result is the concluding diagram and contains the
simplest model BiZZdesigner can make out of the initial
diagram.
7.2 Complexity management mechanisms
in BiZZdesigner This paragraph addresses the complexity management
mechanisms BiZZdesigner currently uses. As described earlier
the possibilities of BiZZdesigner are evaluated and applied on
the diagram per principle. This paragraph describes what
mechanisms are used and how they affect the diagram. The
effectiveness is discussed in the next paragraph and the
conclusions and recommendations following from the
mechanisms and their effectiveness in the next two chapters.
7.2.1 Decomposition The decomposition of the initial diagram took place according
to the rules described in paragraph 3.1. BiZZdesigner
supports decomposition with ‘behaviour blocks’ which can
contain several actions or other behaviour blocks. Behaviour
blocks can be collapsed to obtain an overview of the model
and expanded to see the total model. There even is a function
to show the contents of the block without expanding.
offe
rteaanvra
ag
afg
ew
eze
noffe
rteafw
ijzen
offe
rte
pla
ats
en
klanto
rder
aanm
ake
noffe
rte
VR
calcu
lere
noffe
rte
PD
afd
rukke
noffe
rte
benoem
en
Hot P
rospect
genere
ren
beste
ladvie
s
afd
rukke
n
ord
erb
evestigin
g
checke
nka
ns
Beste
ladvie
s 1
acce
ptatie
financie
el
gearch
iveerd
eord
er
factu
ratie
naca
lcule
ren
verw
erve
nLL-ite
ms
aanvra
gen
term
ijnfa
ctuur
afd
rukke
nord
erb
evestig
ing 2
engin
eering
& te
kenen
vrijgeve
nstu
klijst
inpla
nnen b
ew
erkin
gen
inte
rn/e
xtern
genere
ren
beste
ladvie
zen 2
inko
pen
ontva
ngen
mate
riale
nuitg
eve
nm
ate
riale
nbackflu
shen
grijp
voorra
ad
uitvo
ere
nw
erkza
am
heden
ontva
ngst
pro
ductie
vrijgeve
npro
ductie
obje
cten s
tructu
ur
pro
jecta
rtikele
nP
DP
D
PD
Beste
ladvie
s 2
werkka
art
obje
cten s
tructu
ur
obje
cten s
tructu
ur
Alle
Beste
ladvie
zen
nee
*
*
> 75%
< 75%
*
*
*
ja
accoord?
*

Contents are then shown in faded colours. Figure 5 contains a
decomposition made by BiZZdesigner. (Please note that this
diagram is split just like Figure 4.) The next figures, Figure 6
to Figure 9, are the sub-diagrams of the total model.
There is no limitation for the number of these blocks (sub-
diagrams), so the modeller himself can make sure that a block
does not contain more than 9 elements. On the other hand
there also is no minimum or guideline for the use of these
blocks, so the modeller can also make huge and very complex
diagrams without decomposition.
The modeller can name the blocks whatever he wants to, so
there is no problem in giving them meaningful names.
Figure 5 - Decomposition, overview
Figure 6 - Sub-diagram 'offerte administratie'
projectartikelen
genererenbesteladvies
vrijgevenstuklijst
engineering& tekenen
Besteladvies 2
objecten structuur
inplannen bewerkingenintern/extern
genererenbesteladvies
Besteladvies 1
PD
*
*
*
*
planning
Figure 7 - Sub-diagram 'planning'
acce
pta
tiefin
ancie
el
afd
rukke
n
ord
erb
eve
stig
ing
pla
ats
en
klanto
rder
afw
ijzen
offe
rte
checke
nka
ns
benoem
en
Hot P
rospect
afd
rukke
noffe
rteaanm
ake
noffe
rte
VR
calcu
lere
noffe
rte
PD
nee
ja
< 75%
> 75%
accoord?
**
offe
rte a
dm
inis
tratie
offe
rteaanvra
ag
gearch
iveerd
eord
er
obje
cten s
tructu
ur
backflu
shen
grijp
voorra
ad
uitg
eve
nm
ate
riale
nontva
ngst
pro
ductie
vrijgeve
npro
ductie
werkka
art
uitvo
ere
nw
erkza
am
heden
ontva
ngen
mate
riale
n
verw
erve
nLL-ite
ms
Alle
Beste
ladvie
zen
inko
pen
*
inkoop &
pro
ductie
factu
ratie
naca
lcule
ren
aanvra
gen
term
ijnfa
ctuur
factu
rere
n
pro
jecta
rtikele
n
genere
ren
beste
ladvie
svrijg
eve
nstu
klijst
engin
eerin
g&
teke
nen
Beste
ladvie
s 2
obje
cten s
tructu
ur
inpla
nnen b
ew
erkin
gen
inte
rn/e
xtern
genere
ren
beste
ladvie
s
Beste
ladvie
s 1
PD
* *
*
*
pla
nnin
g
acce
pta
tiefin
ancie
el
afd
rukke
n
ord
erb
eve
stig
ing
pla
ats
en
klanto
rder
afw
ijzen
offe
rte
checke
nka
ns
benoem
en
Hot P
rospect
afd
rukke
noffe
rteaanm
ake
noffe
rte
VR
calcu
lere
noffe
rte
PD
nee
ja
< 75%
> 75%
accoord?
**
offe
rte a
dm
inis
tratie
afg
ew
eze
noffe
rte

Figure 8 - Sub-diagram 'inkoop & productie'
facturatie nacalculeren
aanvragentermijnfactuur
factureren
Figure 9 - Sub-diagram 'factureren'
7.2.2 Summarisation There is no explicit function to make a summary. The user can
make a summary by collapsing the behaviour blocks as is
done in Figure 10. To give the summary a manageable size
the blocks are smaller, but the modeller has to do this himself,
BiZZdesigner does not automatically provide a clear lay-out.
It is easy to collapse the behaviour blocks in the
decomposition, but it is not so easy to give the decomposition
a clear lay-out. The lines connecting the blocks are not
redrawn automatically when the size and place of the blocks
change which results in a spaghetti-like diagram the modeller
has to lay-out himself.
Figure 10 – Summary by BiZZdesigner
In this case there was no need to choose the most important
boundary lines, because the blocks do not have as many
relationships as in an ER model. BiZZdesigner does not have
a function to indicate the most important boundary relations,
but that would only be useful in very large models where
decomposition blocks have more boundary relations. That is
not as common in business process modelling as in ER
modelling.
7.2.3 Horizontal Integration Horizontal integration is not supported by BiZZdesigner.
There is no function to show the direct foreign elements next
to the behaviour block without showing the complete
diagram.
7.2.4 Vertical Integration As with horizontal integration, BiZZdesigner does not support
vertical integration. In the view of an expanded behaviour
block there is no link to the parent diagram (zoom out) nor to
the child diagram or textual definitions (zoom in). The user
can not see what the relationship of the particular block is
with the levels above and below.
7.2.5 Navigational Map BiZZdesigner has a function to make a process structure of
the process in a behaviour block. This is more or less like a
navigational map, although it is not used this way. Within the
report that BiZZdesigner automatically generates, the process
structure is one of the last figures instead of a navigational
map which you would expect at the beginning.
BiZZdesigner uses the total diagram for the function of
navigational map, whereby the modeller can choose whether
to collapse or expand the behaviour blocks. This total view is
the top level of the decomposition and therefore can only be a
navigation map when the modeller collapses all blocks to
avoid needless information and when there is only one level
depth (like in this case). In fact the navigational map would
then be exactly the same as the summary (Figure 10). Most
diagrams have more decomposition levels and because the
summary only shows the first level a total view with collapsed
blocks would not be suitable as a navigational map.
A process structure of the total view would be a good
navigational map because it contains all decomposition
elements (behaviour blocks) and no other information.
Unfortunately BiZZdesigner can only make process structures
of behaviour blocks and can therefore only make a process
structure of the total diagram when the total diagram is put
into a behaviour block. For this case this results in Figure 11.
offerte administratie planning inkoop & productie factureren
verkoopproces
Figure 11 – Process structure and navigational map
Within the tool itself BiZZdesigner shows the modeller a
navigational map with all the open processes in the tool, see
Figure 12. This map is a tree structure whereby the modeller
can collapse and expand processes and diagrams.
Figure 12 - Navigational map, also functioning as a locator
map
offerteaanvraag
gearchiveerdeorder
inkoop & productie facturerenplanningofferte administratie
afgewezenofferte
objecten structuur
backflushengrijpvoorraad
uitgevenmaterialen
ontvangstproductie
vrijgevenproductie
werkkaart
uitvoerenwerkzaamheden
ontvangenmaterialen
verwervenLL-items
Alle Besteladviezen
inkopen
*
inkoop & productie
7.2.6 Orientation There are no special features to support orientation within the
model. As well on the computer as on paper (in the reports)
BiZZdesigner does not show the scale of the current diagram.
In the tool the navigational map is also used as a locator map
because the diagram currently displayed in BiZZdesigner is
made bold to show the current location (‘verkoopregels’ in
Figure 12). On paper there is no locator map.
The number of the current level is described in the header of
the paragraph in the reports. In the tool itself BiZZdesigner
does not display the level of a diagram.
The name of the diagram is displayed in the concerning
window or tab and if applicable also in the concerning
behaviour block. In the reports the name of the diagram is
described in the header of the paragraph and also in the
blocks.
7.2.7 Indexing BiZZdesigner does not provide an index to the modeller
within the tool. A modeller can search for e.g. actions by
using the ‘find’-function and fill out the criteria in the pop-up.
This is not an easy way to find elements, because it takes time
to fill out the form and after the search the user has to search
again within the model. All elements are faded except for the
involved ones, but the function does not list the found
elements and does not directly show the concerning elements
in the window.
In the RTF report BiZZdesigner uses a function of Microsoft
Word to generate an index. This index does not contain
synonyms for the elements and is rather complex itself. The
elements in this index are linked to a page in the report,
usually where the involved diagram is shown. Elements vary
from behaviour blocks to interaction points and the index
often contains different references to the same diagram
element. This makes the index complex and not easily
readable. Besides, when a user is searching for a term which is
not the first word of a name, it can not be found in the index.
For example, when a user looks for ‘offerte’ in the case of this
research he only finds “offerte aanvraag (1.1.1) (Trigger)”
instead of all the actions containing the word ‘offerte’.
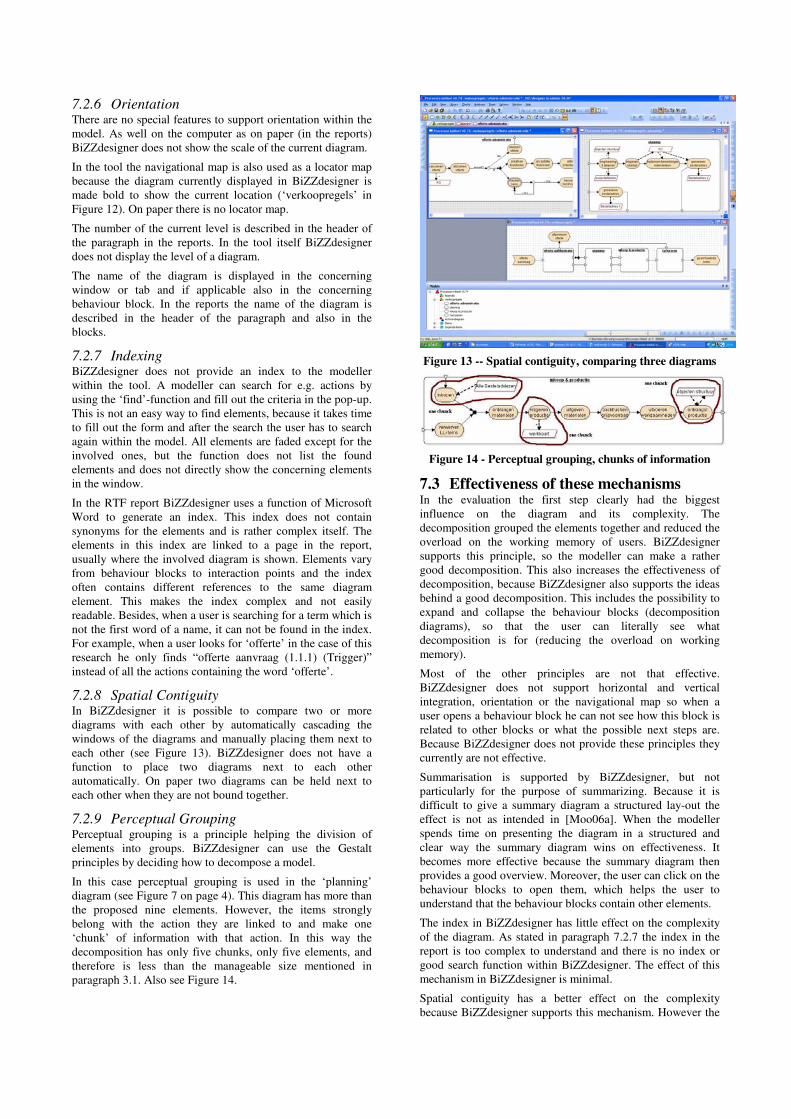
7.2.8 Spatial Contiguity In BiZZdesigner it is possible to compare two or more
diagrams with each other by automatically cascading the
windows of the diagrams and manually placing them next to
each other (see Figure 13). BiZZdesigner does not have a
function to place two diagrams next to each other
automatically. On paper two diagrams can be held next to
each other when they are not bound together.
7.2.9 Perceptual Grouping Perceptual grouping is a principle helping the division of
elements into groups. BiZZdesigner can use the Gestalt
principles by deciding how to decompose a model.
In this case perceptual grouping is used in the ‘planning’
diagram (see Figure 7 on page 4). This diagram has more than
the proposed nine elements. However, the items strongly
belong with the action they are linked to and make one
‘chunk’ of information with that action. In this way the
decomposition has only five chunks, only five elements, and
therefore is less than the manageable size mentioned in
paragraph 3.1. Also see Figure 14.
Figure 13 -- Spatial contiguity, comparing three diagrams
Figure 14 - Perceptual grouping, chunks of information
7.3 Effectiveness of these mechanisms In the evaluation the first step clearly had the biggest
influence on the diagram and its complexity. The
decomposition grouped the elements together and reduced the
overload on the working memory of users. BiZZdesigner
supports this principle, so the modeller can make a rather
good decomposition. This also increases the effectiveness of
decomposition, because BiZZdesigner also supports the ideas
behind a good decomposition. This includes the possibility to
expand and collapse the behaviour blocks (decomposition
diagrams), so that the user can literally see what
decomposition is for (reducing the overload on working
memory).
Most of the other principles are not that effective.
BiZZdesigner does not support horizontal and vertical
integration, orientation or the navigational map so when a
user opens a behaviour block he can not see how this block is
related to other blocks or what the possible next steps are.
Because BiZZdesigner does not provide these principles they
currently are not effective.
Summarisation is supported by BiZZdesigner, but not
particularly for the purpose of summarizing. Because it is
difficult to give a summary diagram a structured lay-out the
effect is not as intended in [Moo06a]. When the modeller
spends time on presenting the diagram in a structured and
clear way the summary diagram wins on effectiveness. It
becomes more effective because the summary diagram then
provides a good overview. Moreover, the user can click on the
behaviour blocks to open them, which helps the user to
understand that the behaviour blocks contain other elements.
The index in BiZZdesigner has little effect on the complexity
of the diagram. As stated in paragraph 7.2.7 the index in the
report is too complex to understand and there is no index or
good search function within BiZZdesigner. The effect of this
mechanism in BiZZdesigner is minimal.
Spatial contiguity has a better effect on the complexity
because BiZZdesigner supports this mechanism. However the

impact is not as big as with decomposition, because the user
chooses to lay or display two sheets next to each other.
Decomposition is a choice of the modeller and therefore has a
bigger effect on the complexity of the diagram. Spatial
contiguity has a bigger effect on the usability of the diagram,
which certainly influences the complexity in understanding
the diagram.
The effectiveness of perceptual grouping is hard to measure or
address in this research because it is an underlying mechanism
instead of a conscious choice. Perceptual grouping happens
anyway, supported or not by BiZZdesigner, and certainly has
its effect on a diagram. Because of perceptual grouping the
complexity of diagrams is reduced when elements clearly
belong to each other, in one chunk. An evaluation of the
effect of the perceptual grouping in BiZZdesigner reaches
beyond the topic of this research.
7.4 Applicability of the nine principles to
business processes This paragraph tries to fulfil the second problem statement: To
evaluate the complexity management principles and their
applicability to business process models.
Most principles are applicable to business process models.
For decomposition, summarisation, vertical integration, the
navigational map, orientation and indexing there is no
difference between ER diagrams as examined in [Moo06a]
and the models used in this evaluation. The main and one of
the few differences between ER modelling and business
process modelling is the fact that there is a flow in the
business process models. They can be read in only one
direction, while ER models do not have a direction.
This means that business process models have to deal with
‘reading gravity’. Reading gravity means that a reader always
reads form the top left corner to the lowest right corner
[Whe95]. Because business process models do not fit on one
sheet of paper (see Figure 4 and Figure 5) they flow from the
top right corner to the lowest left corner. A reader will not
immediately understand how the diagram flows because of
this unnatural direction.
Another effect of this flow is that horizontal integration is
much easier within business diagrams than in ER models.
Each element in a business diagram follows from another
element (except of course the starting point), making a logical
queue of elements. The same applies on sub-diagrams. The
queue in business processes makes that from one sub-diagram
logically follows a ‘next’ or ‘previous’ one, which can be
used in horizontal integration. In an ER model all elements
can be seen separately and there is no logical sequence within
the diagram. This means that deciding which element or sub-
diagram is the ‘next’ or ‘previous’ is in most of the cases
inappropriate and less useful than in business process models.
On the other side of the medal perceptual grouping is not very
useful in business process models. According to the Gestalt
principles elements with the same appearance group together,
but within business processes there are only four types of
elements; mainly actions and items and also some begin and
end triggers. A diagram consists mainly on actions and items,
if for example the actions group together that makes no sense
and does not reduce complexity. Moreover it is very difficult
to group actions together because the flow should remain
intact because of the reading gravity.
8. CONCLUSIONS FROM THE
EVALUATION This section gives the answers to the two problem statements.
The first paragraph addresses the answer to the main research
question: What complexity management mechanisms does
BiZZdesigner currently use and how effective are they?
The second paragraph answers in short the second question:
To what extent are the complexity management principles
applicable to business process models?
These conclusions are summarized in the table in the last
paragraph.
8.1 Complexity management in
BiZZdesigner Concluding BiZZdesign can certainly improve some things in
BiZZdesigner. The way BiZZdesigner handles decomposition
issues is nice, the behaviour blocks are okay to work with and
provide some useful functions like expanding and collapsing
sub-diagrams. Decomposition has a big effect on the
complexity of a model, helping to reduce the working memory
of a user. BiZZdesigner sufficiently supports this complexity
mechanism. Also the possibility to give meaningful names to
every element reduces the complexity, as does the possibility
to compare two (or more) models in one screen.
The navigation and integration between models is not well-
supported yet by BiZZdesigner. There is no sufficient and
consistent summary, navigational map, locator map or index
within the models. The diagrams also lack links to
neighbouring diagrams, zooming options and a clear
statement to which level a diagram belongs or on which scale
a sub-diagram is made.
Another challenge facing BiZZdesign is to see how to
automate certain complexity reducing mechanisms. For
example BiZZdesigner can propose a decomposition of a
given diagram, using the Gestalt principles and not exceeding
the manageable size of nine elements. BiZZdesigner can also
use this to indicate if a diagram follows other principles.
Concluding BiZZdesigner certainly uses and supports some of
the possible complexity management mechanisms in an
effective way. On the other hand there still is a lot to improve
especially in the navigation and integration between diagrams.
Before the business process models of BiZZdesigner are
perfectly ‘un-complex’ there still is a long way to go.
8.2 The nine principles in business process
models Most of the nine principles are independent from the type of
diagram and are as effective in an ER diagram as in a business
process diagram. The principle of horizontal integration is
even more applicable to business process diagrams than to ER
diagrams because business processes have a logical sequence
(flow). On the other hand perceptual grouping is not really
applicable to business process diagrams, because it is almost
impossible to group similar types of elements together without
disturbing the reading gravity of the diagram.
8.3 Concluding table The table below summarizes the findings of the paragraphs
7.2, 7.3 and 7.4. The second column contains the level of
support by BiZZdesigner, the third the effectiveness of the
concerning principle and the last the applicability of the
principle to business processes. The rankings in the table
mean the following:

++ perfect
+ good
+/- neutral
- almost not
-- not
Table 1 - Evaluation
Principle Supported Effectiveness Applicability
Decompo-
sition
+
Possible, but
no guidelines
how to.
++
Structures the
diagram
+/-
Summari-
sation
+
Possible, but
difficult with
lay-out
+
(With clear
lay-out)
+/-
Horizontal
Integra-
tion
--
Not supported
--
Not supported
++
Better
because of
logical
sequence
Vertical
Integra-
tion
--
Not supported
--
Not supported
+/-
Naviga-
tional
Map
+/-
Only within
the tool, not
on paper
-
Effective
within the
tool.
+/-
Orienta-
tion
-
Clear names,
but no scale,
no locater
map on paper,
no level in the
tool.
-
Only the
names have
effect
+/-
Indexing +/-
Complex
search
function in the
tool, index in
report.
-
Too complex /
unstructured
+/-
Spatial
Contiguity
+
Windows can
be shown
separately
+ +/-
Perceptual
Grouping
+/-
Not
specifically
supported
+
Chunks are
effective
-
Only Gestalt
Laws are
applicable
9. RECOMMENDATIONS This chapter gives some concrete recommendations how to
improve BiZZdesigner. They are stated per principle, as in
chapter 3 and 7.2.
These all are guidelines and it may not be perfect to use them
all together. All tips reduce the complexity of the diagram, but
it is imaginable that they increase the complexity of the tool
itself. However, they can also be used for the printed
diagrams. Whether or not to implement them is up to
BiZZdesign.
9.1 Decomposition There are some simple features that could help an expert to
make a proper decomposition. One is to propose the use of
behaviour blocks when a diagram exceeds the proposed 9
elements or chunks. According to the Gestalt principles, an
item and an action together count as one chunk.
Provide a function to make a ‘first-cut’ decomposition. Of
course this often will not be the decomposition desired by the
modeller, so it is important that he can adjust the
decomposition easily. The advantage for the modeller is that
the tool takes into account the “Gestalt Laws of Perception”.
Provide these guidelines also to the modeller, for example in
the help-function.
9.2 Summarisation Make a function to obtain a summary with small, 3D
behaviour blocks and automatically laid-out lines. An
example of the output is shown in Figure 15. The 3D blocks
illustrate that the particular diagrams contain other elements
(also see paragraph 3.2).
Figure 15 - Summary with 3D blocks
Simplify the lay-out of the collapsed blocks after they were
expanded. This does not directly influence the complexity of a
model, but an unstructured diagram is incomprehensible
anyway. The modeller now needs a lot of time to make a
better lay-out.
9.3 Horizontal Integration Showing the foreign elements of a diagram is a very effective
way to reduce the complexity. It avoids that the user has to
remember them (representation holding). Figure 16 is an
example of one of the sub-diagrams of this case with its
foreign elements.
Horizontal and vertical integration, navigation and orientation
can perfectly be combined into one screen, as illustrated in
Figure 17. Of course this is one of the many possible ways to
display these principles. The horizontal integration consists of
the arrows to the left and the right, which allow the user to see
directly what the name is of the previous and next diagram. In
BiZZdesigner itself it may be useful to make these arrows
clickable, so that users can navigate through the diagrams.

acceptatiefinancieel
afdrukken orderbevestiging
plaatsenklantorder
afwijzenofferte
checkenkans
benoemenHot Prospect
afdrukkenofferte
aanmakenofferte
VR
calculerenofferte
PD
nee
ja
< 75%
> 75%
accoord?
* *
offerte administratie [level 2]
projectartikelen
aanvragentermijnfactuur
[facturatie]
objecten structuur
afgewezenofferte
offerteaanvraag
Besteladvies 1
genererenbesteladvies
[planning]
engineering& tekenen[planning]
*
*
*
Figure 16 – Horizontal integration, showing foreign elements
Figure 17 - Example of a navigation screen
9.4 Vertical Integration Figure 17 also contains vertical integration arrows for
zooming. They make clear what is the parental and what is a
possible child diagram. Add these type of vertical integration
connectors to every diagram, as well as on screen within
BiZZdesigner as on paper when a diagram is printed. These
arrows could be clickable just as the horizontal integration
arrows.
9.5 Navigational Map Allow users to make a ‘process structure’ of the total diagram
without first putting a block around it. Place such a
navigational map in the beginning of each report to
immediately make clear how the diagrams relate to each other.
It is also important that the navigational paths between the
diagrams are shown. See the example in Figure 18.
Figure 18 - Navigational map with paths between sub-
diagrams
9.6 Orientation Each diagram should contain the scale and the level of the
current diagram and a locator map with the current location.
The locator map can be the navigational map when a model
has more than two levels, but when it only has two levels, as
in this case, the summary diagram will be more appropriate.
Figure 17 is an example with a summary diagram as a locator
map. The figure also shows the scale and the level of the
current diagram. This figure can be used within the tool, but
also within the report and other printed versions of the
diagram. It is important that the locator map, the arrows, the
scale and the diagram are always in the same place.
9.7 Indexing One of the functions of the index is to facilitate searching. It
would help to understand the diagrams within the tool when
the search function in BiZZdesigner would be easier. An
example is to automatically list the found items and allow the
user to click on them to find the particular element. It should
also be possible to search on synonyms.
Next to an improved search function, provide an index in the
tool with synonyms and a link to their home diagram. It would
be even better if the index can be sorted on home diagram.
Finally, cut back the size of the index in the report by deleting
all duplicate terms. Also add synonyms in this index.
9.8 Spatial Contiguity An automatic function to compare two diagrams side-by-side
would help novices to compare two diagrams. Let
BiZZdesigner suggest a division of the windows, taking into
account the size of the concerning diagrams.

Another recommendation is that BiZZdesigner could show
three diagrams next to each other; the current diagram in the
main window and the previous and next diagram in miniature
windows. Also the child and parental diagrams can be shown
in separate windows.
9.9 Perceptual Grouping As stated in paragraph 7.4, perceptual grouping is not very
applicable to business process diagrams. The Gestalt Laws of
Perception should be used to propose a decomposition, but
other forms of perceptual grouping would not reduce the
complexity of the diagrams.
9.10 Concluding table The table below summarizes the recommendations given in
the previous paragraphs. Most recommendations are also
important for printed diagrams.
Table 2 - Recommendations
Principle Recommendations
Decomposition Propose decomposition and/or make
a first cut decomposition. Also
provide decomposition-cues in the
help-function
Summarisation Make a summarisation-function.
Use 3D blocks.
Horizontal Integration Show foreign elements. Show
references to the previous and next
diagram.
Vertical Integration Show references to the parent and
child diagrams.
Navigational Map Add a function to make a
navigational map.
Orientation Show the scale and the level of the
current diagram and a locator map
with the current location.
Indexing Improve the search function. Add
an index with synonyms. Clean up
the index in the reports and add
synonyms.
Spatial Contiguity Add a function to compare two
windows automatically. Show next
and previous diagrams in separate
windows.
Perceptual Grouping Less applicable. Use Gestalt Laws
to suggest a first-cut decomposition.
10. DISCUSSION This research is only the beginning of the quest to define
complexity management mechanisms and test CASE tools on
this subject. This research could be improved in a number of
ways. For example the way the effectiveness of the principles
is tested (in paragraph 7.3) is rather subjective. It would be
better to do a study on how to measure effectiveness first, but
unfortunately there was no time to do so for this research.
A second improvement would be to finish and repeat the
PDCA-cycle mentioned in chapter 5. The act-phase is not
implemented in this research and also the check with
BiZZdesign and the company has not been a part of this
research.
Furthermore extra interviews with data experts and users
would add information on the problems experienced in
practice. The two interviews done for this research actually
are not sufficient to draw hard conclusions on this topic.
Moreover, one important improvement for further research on
this topic is an extensive user evaluation. What do users really
think about the complexity mechanisms and recommendations
proposed in this research? And what is the effect they
experience when applying the principles? The nine principles
from [Moo06a] are based on theories and experience in a
single domain (data or static structure modelling).
It would also be interesting to apply the principles on another
case, to test the conclusions and recommendations drawn in
this research. This could be another business process or
another type of requirement model. The nine principles from
[Moo06a] would certainly improve if they were tested on
other type of models than ER models and business processes.
In terms of the tool BiZZdesigner, it would be interesting to
compare the modelling language used by this tool with for
example activity diagrams in UML and with other CASE
tools. Also in the field of complexity management this would
be rather interesting, because the complexity management
mechanisms BiZZdesigner uses might be very sophisticated
and efficient compared to the mechanisms other tools use.
For the company that provided the original diagrams it would
be very interesting to see what effect it would have on the
complexity management if the swimlanes and actors are
included. Maybe the use of these structures can reduce the
complexity as well. And if they only make the model more
complex, what would be good solutions to avoid that effect?
ACKNOWLEDGMENTS I would like to thank Daniel Moody for leading this course
and for suggesting this research on complexity management at
BiZZdesign. Furthermore he has helped me enormously with
finding a case process and with reviewing and correcting my
paper. His enthusiasm was one of the reasons I enjoyed this
course until the end.
I would like to thank Egbert-Jan Holleman for his assistance
and enthusiasm with the original diagrams and of course for
providing them to me. The time he had for us was inspiring
and very useful for this research.
Finally I would like to thank the people from BiZZdesign for
providing BiZZdesigner to me and responding so quickly to
my e-mails. Their help was crucial for this research.
REFERENCES [Biz06] BiZZdesign website, Mar. 21, 2006,
http://www.bizzdesign.nl/html/index_en.html, visited Oct. 9,
2006
[GR99] Green, P., Rosemann, M. An Ontological Analysis of
Integrated Process Modelling, Advanced Information Systems
Engineering: 11th International Conference, Springer Berlin
Heidelberg, Germany, June 1999, 225.
[GT94] Gladwin, B. and Tumay, K. Modeling business
processes with simulation tools. In Proceedings of the 26th
conference on Winter simulation, Orlando, Florida, United
States, 1994, 114 – 121.
[KHH00] Kim, J., Hahn, J. and Hahn, H. How Do We
Understand a System with (So) Many Diagrams? Cognitive
Integration Processes in Diagrammatic Reasoning, In
Information Systems Research, volume 11 n.3, September
2000, 284-303.
[Moo06a] Moody, D. Dealing with Absurdly Complex
Diagrams: A Systematic Approach to Managing Complexity
of Diagrams in Requirements Analysis, Will be published in

Information and Software Technology in February 2007,
Amsterdam, The Netherlands, 2007.
(A shorter version, Dealing with “Map Shock”: A Systematic
Approach for Managing Complexity in Requirements
Modelling, is published on the Twelfth Working Conference
on Requirements Engineering: Foundation for Software
Quality, Luxembourg, Grand-Duchy of Luxembourg, 2006.)
[Moo06b] Moody, D. What makes a good diagram?
Improving the Cognitive Effectiveness of Diagrams in IS
Development, 15th international conference on information
systems development, Budapest, Hungary, 2006.
[NS00] Nguyen, L. and Swatman, P.A. Essential and
Incidental Complexity in Requirements Models. In
Requirements Engineering, 2000. Proceedings on the 4th
International Conference, Schaumburg, IL, USA, 2000, 130-
139.
[OHS02] Opdahl, A.L., Henderson-Sellers, B. Ontological
Evaluation of the UML Using the Bunge–Wand–Weber
Model, Software and Systems Modeling, Springer Berlin /
Heidelberg, Germany, Volume 1, Number 1 (September
2002), 43-67.
[Whe95] Wheildon, C., Type & Layout How typography and
design can get your message across – or get in the way,
Strathmoor Press, Berkeley, CA, USA, march 1995, 32-35.