
Complex interplay between cyclical Nordic Outlook ... · Complex interplay between cyclical and...
47
Complex interplay between cyclical and political factors lifts economy Industrial upturn broadens Swedish growth; Riksbank rate hike in 2017 Nordic Outlook February 2017
Transcript of Complex interplay between cyclical Nordic Outlook ... · Complex interplay between cyclical and...

Complex interplay between cyclical
and political factors lifts economy
Industrial upturn broadens
Swedish growth;
Riksbank rate hike in 2017
Nordic OutlookFebruary 2017

Contents
Nordic Outlook – February 2017│ 3
International overview 5
Theme: Treacherous waters for US monetary policy 13
The United States 15
Theme: Great uncertainty about US fiscal policy 18
Japan 20
The BRIC countries 21
The euro zone 24
The United Kingdom 27
Sweden 28
Theme: The risk of a Swedish bond shortage 32
Denmark 33
Norway 34
Theme: Norway’s debt ratio cap – lessons for Sweden? 36
Finland 38
Estonia 39
Latvia 40
Lithuania 41
Economic data 42
Boxes Politics vs economics: A complex interplay 6 US trade policy shifting towards protectionism 16 Major political reshuffle in late autumn 2017 21 Large outflows squeeze Beijing and the yuan 21

This report was published on February 7, 2017.
Cut-off date for calculations and forecasts was February 1, 2017.
Robert Bergqvist Chief Economist Japan + 46 8 506 230 16
Håkan Frisén Head of Economic Forecasting + 46 8 763 80 67
Daniel Bergvall The euro zone, Finland +46 8 506 23118
Erica Blomgren SEB Oslo Norway +47 2282 7277
Ann Enshagen Lavebrink + 46 8 763 80 77
Richard Falkenhäll United Kingdom, US +46 8 506 23133
Dainis Gaspuitis SEB Riga Latvia +371 67779994
Per Hammarlund Russia, Brazil +46 8 506 231 77
Carl Hammer +46 8 506 23128
Olle Holmgren Sweden +46 8 763 80 79
Johan Javeus +46 8 506 23019
Andreas Johnson China, India, US +46 73 523 77 25
Elisabet Kopelman + 46 8 506 23091
Mihkel Nestor SEB Tallinn Estonia +372 6655172
Tadas Povilauskas SEB Vilnius Lithuania +370 68646476
Lars Sparresø Merklin SEB Copenhagen Denmark +45 3124 6759
Thomas Thygesen SEB Copenhagen Denmark +45 3328 1008
SEB Research & Strategy, SE-106 40 Stockholm, Sweden

International overview
Nordic Outlook – February 2017 │ 5
Higher growth will speed up monetary policy normalisation
Many reasons for surge in global confidence
“Trumponomics”: Threats and opportunities
Political woes not stopping European upturn
EM sphere stabilising despite Trump rhetoric
Sweden: Broad-based growth, 2017 rate hike
Long-term yields will cautiously keep rising
Higher earnings and growth helping equities
Global economic signals have been positive in recent months. Sentiment indicators are generally at their highest since 2011. This partly reflects expectations of fiscal stimulus measures from President Donald Trump’s administration, but policy shifts in such areas as energy issues and financial regulation have also contributed to greater optimism. The upturn began before the US presidential election, which indicates that it is also driven by other factors. The oil price recovery, for example, has eased the pressure on over-extended producer countries and provided an injection for global stock markets, which are often relatively skewed towards energy and commodities. Meanwhile prices are still low enough to provide relief to countries that are net importers of oil. We are also probably in a phase of the economic cycle where resource utilisation has climbed to levels that will trigger a bit more capital spending and somewhat higher wage pressure. Historical experience indicates that the healing processes after financial crises usually take 6-8 years; a more robust upturn now would be consistent with this pattern.
But while the economy is showing signs of strength, there are major risks. Political events right now are clearly momentous, and the uncertainty surrounding both the Brexit process and Trump’s policies has actually increased in recent months. Most indications are that we are moving towards a hard Brexit, with the United Kingdom leaving the European Union’s single market completely. The negotiating process that will shape future British relations with the EU will be lengthy. Trump’s recent actions have been both arbitrary and provocative. The conflict level has escalated, both with regard to international and domestic relations, while the protectionist rhetoric of Trump’s campaign seems to be largely in the process of becoming actual policy.
We have revised our overall growth forecasts somewhat higher. In the United States, this is especially true of 2018, when fiscal stimulus measures will have a bigger impact. We
have also adjusted our 2018 Chinese GDP growth forecast slightly upward. We also believe that our relatively optimistic scenario for the Nordic countries has been confirmed, and we are adjusting our Swedish GDP growth forecast even higher. The clearest exception from this pattern is the UK. A weak pound will benefit exports, but uncertainty about trade relations with the EU is likely to hamper capital spending more than we had anticipated. Meanwhile the household savings ratio is already being squeezed at the outset. Today our overall forecast is that global growth will accelerate from 3.1 per cent in 2016 to 3.6 per cent in 2017 and 3.7 per cent in 2018: an upward revision of 0.1 points in both 2017 and 2018.
Global GDP growth Year-on-year percentage change
2015 2016 2017 2018 United States 2.6 1.6 2.6 2.6 Japan 1.2 0.9 0.6 0.5 Germany 1.8 1.9 1.8 1.8 China 6.9 6.7 6.6 6.2 United Kingdom 2.2 2.0 1.1 1.2 Euro zone 2.0 1.8 1.8 1.9 Nordic countries 2.3
2.0 2.1 2.1 Baltic countries 2.0 1.8 2.7 3.1 OECD 2.4 1.8
2.1 2.1
Emerging markets 4.0 4.1 4.6 4.8 World, PPP* 3.3 3.1 3.6 3.7 Source: OECD, SEB * Purchasing power parities
Questions about resource utilisation and inflation dynamics will be crucial to financial markets over the next couple of years. From a stabilisation policy perspective, it is a bit late to launch major stimulus programmes now, when the economies of many countries are close to normal resource utilisation. Protectionist currents may also drive up inflation and increase the role of domestic conditions in the inflation process. We have thus made some upward adjustments in our inflation forecasts, but we still believe that the low-inflation environment will mainly persist during 2017-2018. One reason is that there is probably more idle capacity in the economy than registered employment figures indicate, especially in the US. American tax cuts and infrastructure investments may also have a positive supply-side effect, although they will probably not be so important during the next couple of years.
Our relatively optimistic view of both demand- and supply-side conditions in 2017-2018 will allow central banks significant manoeuvring room, but the increasingly clear drawbacks of

International overview
6 │ Nordic Outlook – February 2017
ultra-loose monetary policy will increase their inclination to begin a normalisation process. We are sticking to our assessment that the US Federal Reserve will hike its key interest rate twice this year but speed up the pace to three rate hikes in 2018, reaching 1.75-2.00 per cent. Elsewhere, too, monetary stimulus programmes are beginning to be phased out or are being withdrawn. Although we expect the European Central Bank (ECB) to extend its bond purchases into next year,
monthly purchases will be lowered further starting in October. The quantitative easing (QE) programme of Sweden’s Riksbank will end as planned this summer, with cautious key interest rate hikes starting in December 2017.
The upward trend in long-term bond yields will persist, amid accelerating economic growth and inflation. In the short term – as the world leaves behind the zero-inflation
Politics vs economics: A complex interplay Experience from 2016 has shown that the interplay between economics and politics is difficult to explain. It was hardly strange that economic analysts were unable to predict the Brexit referendum outcome or Trump’s victory, when public opinion polling organisations and betting firms failed to do so, but lessons can be learned from the economic impact assessments they made. Economists probably tend to exaggerate the importance of more general political phenomena and are sometimes tempted to make rather alarmist projections about election outcomes that seem improbable or unpleasant. Historically, for example, it is hard to see any correlation between heightened security policy tensions and economic activity. This is perhaps because the uncertainty that may arise is offset by higher investments in a defence build-up, for example. Only when the concrete conditions that determine profitability and investment appetite are affected, for example via rising oil prices or poorly functioning financial markets, will the effects become clear.
In light of this, one can analyse various risk scenarios. The recent surge in sentiment indicators could conceivably be the forerunner of a much stronger growth wave than our main scenario implies, but such a wave may be driven at least partly by factors that are neither desirable nor sustainable in the long term. Large unfunded stimulus measures in the US, a de-prioritisation of global and national environmental targets that benefits the energy sector in the short term, a defence build-up due to growing security policy tensions and a phase-out of financial market regulations implemented in response to the financial crisis might be such driving forces. These forces might then be amplified by underlying pent-up consumption and capital spending needs in many countries, where growing wealth and high household savings ratios represent a potential. Secondary effects from the US to other countries may also be bigger than expected. Such a mix of “good and evil” growth forces has certain similarities with the recovery of the 1930s. How long such a growth period may last depends mainly on conditions on the supply side of the economy. If policies lead only to demand stimulus and have no positive supply-side effects, after a few years the result may be overheating and a rather sharp inflation surge.
On the downside, the main risk is that an escalation of political uncertainty may ultimately have economic consequences. This may occur because the conflict between the Trump administration and other key players in American society deepens in a more or less dangerous way. The US may also change its policies in ways that lead to
trade wars or crucial disruptions in the functioning of international organisations like the United Nations, International Monetary Fund or World Bank.
A political collapse in Europe because anti-EU forces gain an extra tailwind after Brexit and Trump’s victory is also conceivable. Political crises of this type may have significant negative consequences within our forecast horizon, although they are more likely to pose long-term risks.
How has “Trumponomics”, despite all its unclear and bizarre aspects, been able to awaken such great hopes in financial markets and among economists? One important reason may be that in various areas, established economic policies since the financial crisis have reached an impasse. For example, exceptional monetary policy has once again inflated balance sheets and asset prices, thereby creating wider wealth gaps without convincingly affecting growth. In such a climate, there is fertile ground for new ideological impulses. Many leading economists advocate the classical Keynesian features of demand stimulus programmes. And although many people fear the threat of protectionism, there is also widespread criticism of trade agreements that now exist or were about to be signed. This criticism is based on the contention that these agreements arbitrarily benefit specific sectors and are designed to generate artificially high profits for financial institutions and multinational corporations. The general efficiency gains that trade is theoretically supposed to create are far from obvious outcomes of the prevailing agreement structures, according to influential economists.
Another type of reasoning states that in a number of areas the Trump administration is now, albeit in a brutal and pop-ulist fashion, pushing the US in a direction that was never-theless unavoidable, considering the country’s relatively weakened economic position. Corporatist tendencies that assign a greater role to cooperation, for both better and worse, between business and government may also become a trend. We have already seen such tendencies in the UK. To summarise, Trumponomics is certainly not the solution to the global economic problems we now face, but it may very well raise challenging questions and move the discussion forward by revealing weaknesses and dead-ends in once-predominant approaches. But it is still too early to say whether we are facing a paradigm shift similar to the breakthrough of active fiscal policy in the 1930s, the collapse of the Bretton Woods system in the early 1970s or the breakthroughs of the neo-conservative era including financial deregulation and inflation targeting.
International overview
Nordic Outlook – February 2017 │ 7
environment – rising risk premiums will be the most important driver of higher long-term yields. We have boosted our forecast of US 10-year Treasury yields by 35 basis points compared to November’s Nordic Outlook; we expect them to reach 3.20 per cent by the end of 2018.
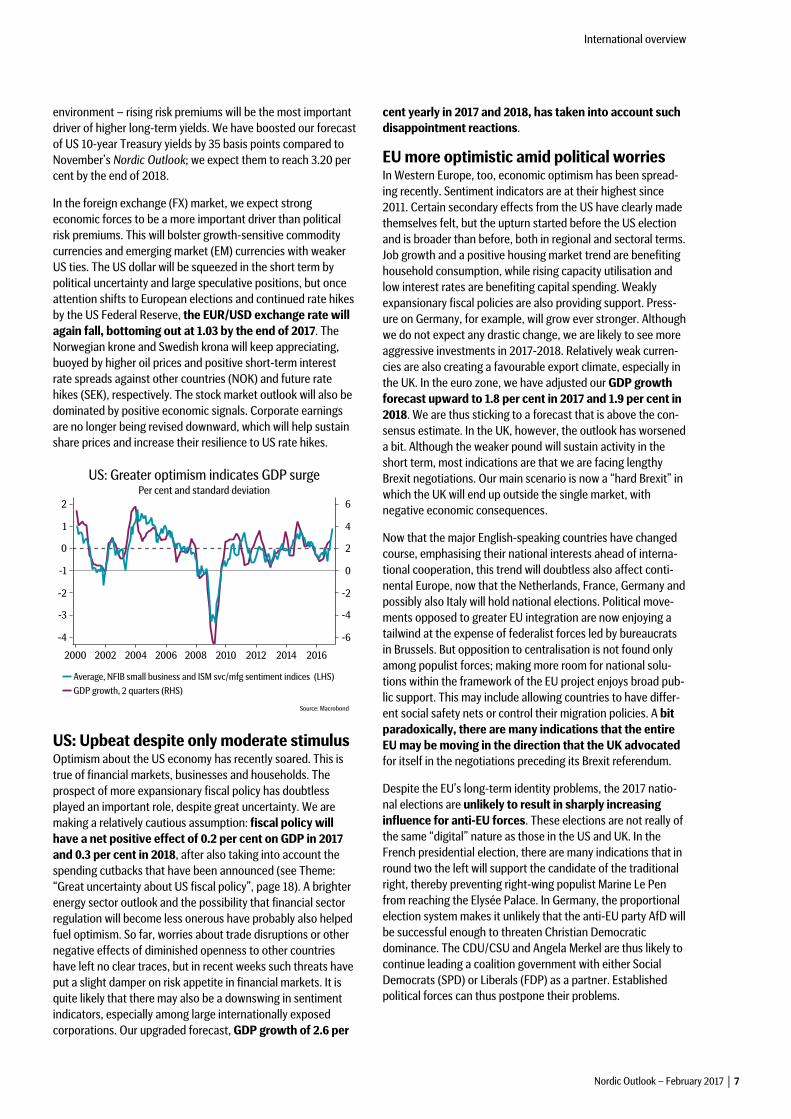
In the foreign exchange (FX) market, we expect strong economic forces to be a more important driver than political risk premiums. This will bolster growth-sensitive commodity currencies and emerging market (EM) currencies with weaker US ties. The US dollar will be squeezed in the short term by political uncertainty and large speculative positions, but once attention shifts to European elections and continued rate hikes by the US Federal Reserve, the EUR/USD exchange rate will again fall, bottoming out at 1.03 by the end of 2017. The Norwegian krone and Swedish krona will keep appreciating, buoyed by higher oil prices and positive short-term interest rate spreads against other countries (NOK) and future rate hikes (SEK), respectively. The stock market outlook will also be dominated by positive economic signals. Corporate earnings are no longer being revised downward, which will help sustain share prices and increase their resilience to US rate hikes.
US: Upbeat despite only moderate stimulus Optimism about the US economy has recently soared. This is true of financial markets, businesses and households. The prospect of more expansionary fiscal policy has doubtless played an important role, despite great uncertainty. We are making a relatively cautious assumption: fiscal policy will have a net positive effect of 0.2 per cent on GDP in 2017 and 0.3 per cent in 2018, after also taking into account the spending cutbacks that have been announced (see Theme: “Great uncertainty about US fiscal policy”, page 18). A brighter energy sector outlook and the possibility that financial sector regulation will become less onerous have probably also helped fuel optimism. So far, worries about trade disruptions or other negative effects of diminished openness to other countries have left no clear traces, but in recent weeks such threats have put a slight damper on risk appetite in financial markets. It is quite likely that there may also be a downswing in sentiment indicators, especially among large internationally exposed corporations. Our upgraded forecast, GDP growth of 2.6 per
cent yearly in 2017 and 2018, has taken into account such disappointment reactions.
EU more optimistic amid political worries In Western Europe, too, economic optimism has been spread-ing recently. Sentiment indicators are at their highest since 2011. Certain secondary effects from the US have clearly made themselves felt, but the upturn started before the US election and is broader than before, both in regional and sectoral terms. Job growth and a positive housing market trend are benefiting household consumption, while rising capacity utilisation and low interest rates are benefiting capital spending. Weakly expansionary fiscal policies are also providing support. Press-ure on Germany, for example, will grow ever stronger. Although we do not expect any drastic change, we are likely to see more aggressive investments in 2017-2018. Relatively weak curren-cies are also creating a favourable export climate, especially in the UK. In the euro zone, we have adjusted our GDP growth forecast upward to 1.8 per cent in 2017 and 1.9 per cent in 2018. We are thus sticking to a forecast that is above the con-sensus estimate. In the UK, however, the outlook has worsened a bit. Although the weaker pound will sustain activity in the short term, most indications are that we are facing lengthy Brexit negotiations. Our main scenario is now a “hard Brexit” in which the UK will end up outside the single market, with negative economic consequences.
Now that the major English-speaking countries have changed course, emphasising their national interests ahead of interna-tional cooperation, this trend will doubtless also affect conti-nental Europe, now that the Netherlands, France, Germany and possibly also Italy will hold national elections. Political move-ments opposed to greater EU integration are now enjoying a tailwind at the expense of federalist forces led by bureaucrats in Brussels. But opposition to centralisation is not found only among populist forces; making more room for national solu-tions within the framework of the EU project enjoys broad pub-lic support. This may include allowing countries to have differ-ent social safety nets or control their migration policies. A bit paradoxically, there are many indications that the entire EU may be moving in the direction that the UK advocated for itself in the negotiations preceding its Brexit referendum.
Despite the EU’s long-term identity problems, the 2017 natio-nal elections are unlikely to result in sharply increasing influence for anti-EU forces. These elections are not really of the same “digital” nature as those in the US and UK. In the French presidential election, there are many indications that in round two the left will support the candidate of the traditional right, thereby preventing right-wing populist Marine Le Pen from reaching the Elysée Palace. In Germany, the proportional election system makes it unlikely that the anti-EU party AfD will be successful enough to threaten Christian Democratic dominance. The CDU/CSU and Angela Merkel are thus likely to continue leading a coalition government with either Social Democrats (SPD) or Liberals (FDP) as a partner. Established political forces can thus postpone their problems.

International overview
8 │ Nordic Outlook – February 2017
Accelerating EM growth despite challenges Emerging market (EM) economies, especially the BRIC countries, face unusually many pressures, which are creating great uncertainty. Some of President Trump’s more bombastic statements are connected to relations between the United States and EM economies, for example trade and security policies. How far his administration actually intends to go in its confrontation policy against China will be especially important to global economic growth, but we are cautiously optimistic about the EM outlook. Despite his tough rhetoric, Trump has indicated that he will negotiate − which points to compromises. A major upturn in US interest rates and bond yields, partly driven by a more expansionary fiscal policy, might also generate capital outflows from EM economies, thus making them more vulnerable. But the compromises and cutbacks that we expect the US Congress to force through will reduce risks in this area too. Accelerating global growth, more stable commodity prices and continued low international interest rates will generally help sustain most EM currencies; meanwhile, their stock markets still look cheap.
GDP growth, BRIC countries and EM sphere Year-on-year percentage change
2015 2016 2017 2018 China 6.9 6.7 6.6 6.2 India 7.3 6.9 7.6 8.0 Brazil -3.8 -3.4 0.7 2.0 Russia -2.8 -0.2 1.0 1.5 Emerging markets, total 4.0 4.1 4.6 4.8 Source: OECD, SEB
China’s controlled growth slowdown will continue, though large-scale currency outflows are causing headaches in Beijing. In 2016 the authorities achieved their growth target, aided by credit expansion, but late in the year they initiated a cautious tightening. Ahead of next autumn’s reshuffle in the Communist Party leadership, we expect Beijing to pursue the most cautious economic policy it can. Only in 2018 are reform policies likely to resume in China. The Indian economy is being hampered in the short term by the sub-optimal way that the government
implemented its important currency reform, creating sizeable liquidity problems. But the underlying strength of the economy remains. A number of key reforms have been enacted, for example related to competition law. Although the pace of reform is now slowing ahead of upcoming state elections, we foresee potential for GDP growth to accelerate to 8 per cent by 2018. In both Brazil and Russia, the recession is over and we predict weakly positive growth in 2017-2018. This will help overall GDP growth in the EM sphere climb from 4.1 per cent in 2016 to 4.6 per cent this year and 4.8 per cent in 2018. Reform policies have strengthened the outlook in Brazil, but new political risks related to corruption scandals represent a continued downside risk. Russia still faces major structural problems, but higher oil prices will provide breathing room. The potential for easing of Western sanctions has improved.
Stable oil prices in 2017-2018 Oil prices have trended higher in the past six months. The agreement on production limits that the Organisation of the Petroleum Exporting Countries (OPEC) and other major producer countries such as Russia concluded late in 2016 has helped keep Brent crude prices above USD 50 per barrel. The main purpose is to bring about a reduction in large oil stockpiles. This time around, discipline in complying with the agreement seems better than for years. In the short term, prices will probably be pushed a bit higher as inventory draw-downs continue and demand strengthens a bit. But it is not in the interest of the OPEC countries to drive prices much higher, since that would trigger a new wave of investment in uncon-ventional (North American) oil production. We estimate that USD 60/barrel will be a price ceiling during 2017-2018. The rapid productivity growth of shale oil extraction will exert effective long-term downward price pressure. We thus believe that in 2018, oil prices will fluctuate between USD 50 and 55 per barrel. Meanwhile the recovery in oil prices from earlier lows has eased pressure on the public finances of many producer countries, yet prices are still low enough to have a generally expansionary effect on the overall world economy.
Low-inflation environment being tested Inflation has continued to rise in recent months. The era of zero inflation seems to be over in most countries.
International overview
Nordic Outlook – February 2017 │ 9
The upturn has mainly been driven by base effects, as earlier energy price declines have vanished from 12-month figures and oil prices have instead continued to climb cautiously. Rising food prices have also helped push the Consumer Price Index up to the same level as underlying inflation. Looking ahead, there are several reasons to expect higher inflation than we have become used to in recent years. Resource utilisation is becoming ever tighter in various countries, while protectionist currents may strengthen the correlation between the resource situation and higher pay and prices. In the US, planned border taxes may also have a direct impact on inflation. In the short term, there are further risks of secondary effects from higher energy and food prices. Currency depreciation will also lead to inflation impulses, especially in the UK but also in Sweden. In the euro zone, too, total CPI will come close to 2 per cent in early 2017.
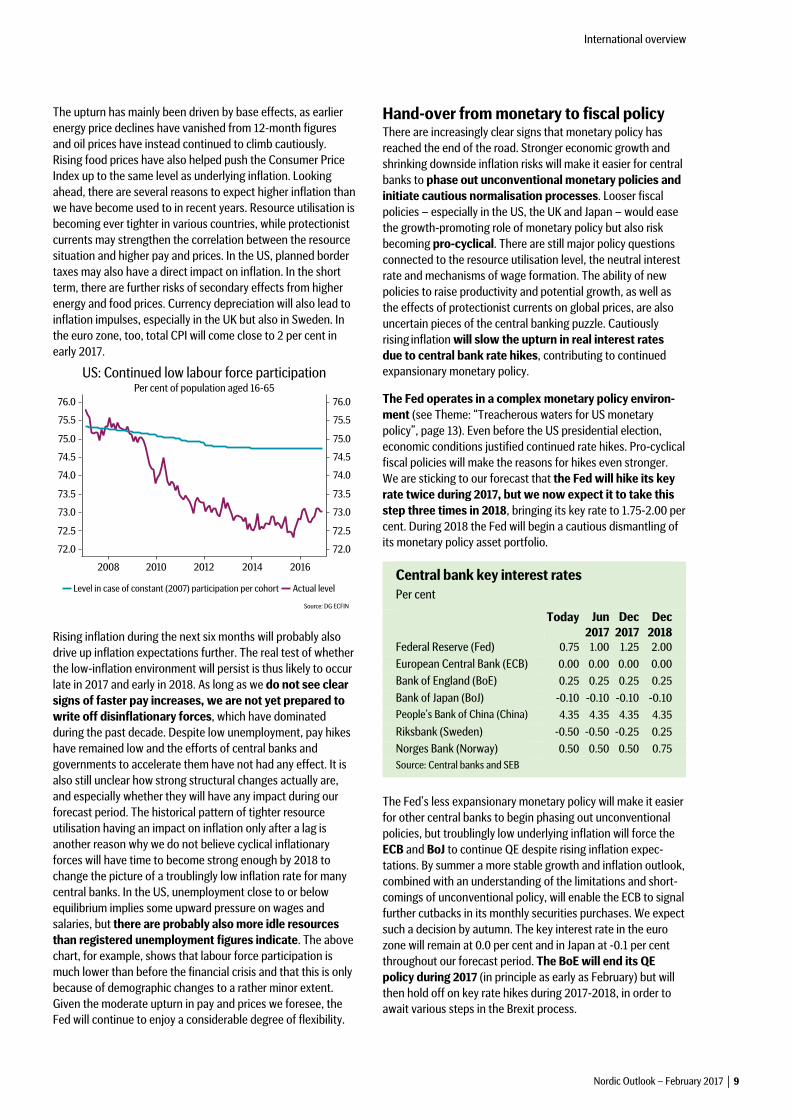
Rising inflation during the next six months will probably also drive up inflation expectations further. The real test of whether the low-inflation environment will persist is thus likely to occur late in 2017 and early in 2018. As long as we do not see clear signs of faster pay increases, we are not yet prepared to write off disinflationary forces, which have dominated during the past decade. Despite low unemployment, pay hikes have remained low and the efforts of central banks and governments to accelerate them have not had any effect. It is also still unclear how strong structural changes actually are, and especially whether they will have any impact during our forecast period. The historical pattern of tighter resource utilisation having an impact on inflation only after a lag is another reason why we do not believe cyclical inflationary forces will have time to become strong enough by 2018 to change the picture of a troublingly low inflation rate for many central banks. In the US, unemployment close to or below equilibrium implies some upward pressure on wages and salaries, but there are probably also more idle resources than registered unemployment figures indicate. The above chart, for example, shows that labour force participation is much lower than before the financial crisis and that this is only because of demographic changes to a rather minor extent. Given the moderate upturn in pay and prices we foresee, the Fed will continue to enjoy a considerable degree of flexibility.
Hand-over from monetary to fiscal policy There are increasingly clear signs that monetary policy has reached the end of the road. Stronger economic growth and shrinking downside inflation risks will make it easier for central banks to phase out unconventional monetary policies and initiate cautious normalisation processes. Looser fiscal policies – especially in the US, the UK and Japan – would ease the growth-promoting role of monetary policy but also risk becoming pro-cyclical. There are still major policy questions connected to the resource utilisation level, the neutral interest rate and mechanisms of wage formation. The ability of new policies to raise productivity and potential growth, as well as the effects of protectionist currents on global prices, are also uncertain pieces of the central banking puzzle. Cautiously rising inflation will slow the upturn in real interest rates due to central bank rate hikes, contributing to continued expansionary monetary policy.
The Fed operates in a complex monetary policy environ-ment (see Theme: “Treacherous waters for US monetary policy”, page 13). Even before the US presidential election, economic conditions justified continued rate hikes. Pro-cyclical fiscal policies will make the reasons for hikes even stronger. We are sticking to our forecast that the Fed will hike its key rate twice during 2017, but we now expect it to take this step three times in 2018, bringing its key rate to 1.75-2.00 per cent. During 2018 the Fed will begin a cautious dismantling of its monetary policy asset portfolio.
Central bank key interest rates Per cent
Today Jun 2017
Dec 2017
Dec 2018
Federal Reserve (Fed) 0.75 1.00 1.25 2.00 European Central Bank (ECB) 0.00 0.00 0.00 0.00 Bank of England (BoE) 0.25 0.25 0.25 0.25 Bank of Japan (BoJ) -0.10 -0.10 -0.10 -0.10 People’s Bank of China (China) 4.35 4.35 4.35 4.35 Riksbank (Sweden) -0.50 -0.50 -0.25 0.25 Norges Bank (Norway) 0.50 0.50 0.50 0.75 Source: Central banks and SEB
The Fed’s less expansionary monetary policy will make it easier for other central banks to begin phasing out unconventional policies, but troublingly low underlying inflation will force the ECB and BoJ to continue QE despite rising inflation expec-tations. By summer a more stable growth and inflation outlook, combined with an understanding of the limitations and short-comings of unconventional policy, will enable the ECB to signal further cutbacks in its monthly securities purchases. We expect such a decision by autumn. The key interest rate in the euro zone will remain at 0.0 per cent and in Japan at -0.1 per cent throughout our forecast period. The BoE will end its QE policy during 2017 (in principle as early as February) but will then hold off on key rate hikes during 2017-2018, in order to await various steps in the Brexit process.

International overview
10 │ Nordic Outlook – February 2017
First Riksbank rate hike late in 2017 Growth forces in the Swedish economy have recently broad-ened, due to a clear upswing in manufacturing. Aside from rapidly increasing residential construction and rising public sector consumption due to the refugee crisis, exporters will also contribute to GDP growth that will reach 3.1 per cent in 2017, slowing to 2.4 per cent in 2018. Rapid growth will also help push resource utilisation to its highest since the 1980s. Inflation will accelerate towards 2 per cent in 2017 but be dri-ven largely by effects from higher energy prices and earlier krona depreciation. Since the national wage round again looks likely to end up with relatively low yearly pay increases (2.4 per cent, compared to last year’s 2.2), inflation will probably fall in 2018 as energy and exchange rate contributions fade. Yet we are seeing signs that the Riksbank will gradually prepare a policy shift and become less fixated on minor deviations from its 2 per cent inflation target. We are thus sticking to our fore-cast that the first key rate hike will occur in December 2017, followed by two rate hikes that will bring the repo rate to +0.25 per cent at the end of 2018.
Nordics, GDP growth Year-on-year percentage change
2015 2016 2017 2018 Sweden 4.1 3.5 3.1 2.4 Norway 1.6 0.5 1.1 1.7 Denmark 1.6 1.0 1.8 2.2 Finland 0.2 1.4 1.5 1.6 Source: OECD, SEB
In Norway, recovery from the earlier oil price-driven slump is continuing. Last year growth remained steady in domestically oriented sectors, especially housing investments and public sector consumption. During 2017 the recovery will broaden, with larger contributions from private consumption and a gradual turnaround in non-oil-related capital spending as well as traditional exports. However, due to a continued decline in oil-related investments, GDP growth in the overall economy will reach only 1.1 per cent in 2017 and 1.7 per cent in 2018. Inflation is now falling steeply as import price effects fade, while domestic price and labour cost pressures remain
subdued. This will require monetary policymakers to strike a balance. Risks of rising home prices and lending suggest no further key rate cuts, but due to the low inflation outlook, Norges Bank is in no hurry to tighten its policy. We believe that its first rate hike, to 0.75 per cent, will not occur until late 2018.
Yields will rise after zero inflation era ends The upturn in long-term US bond yields fizzled out early in 2017, but we believe this is a temporary pause and that yields will keep trending higher in an environment where both economic growth and inflation are on their way up. Fed rate hikes will continue. Meanwhile the ECB will lift its foot further off the gas pedal, thereby also helping sustain the upturn. An additional factor will be changes in supply and demand conditions as the Fed cautiously reduces its bond portfolio, while fiscal policy changes will lead to an increase in issuance of US Treasury securities. China will continue to reduce its holdings of US Treasury bonds, helping boost supply in a way that will drive US long-term yields higher. The ECB is also nearing the end of its exceptional monetary policy stimulus of recent years, though refi rate hikes are still far away. A shortage of long-term German government bonds may force the ECB to purchase more securities with shorter maturities, which will also help steepen the yield curve in the euro zone.
In the near term, however, rising risk premiums as the world leaves behind the zero inflation environment will be the most important driving force behind higher long-term yields. Aside from slightly higher inflation forecasts, the risk picture has also changed now that fiscal stimulus measures will be enacted at a time when the US labour market is close to a normal situation. Overheating scenarios will thus become more likely, and if tendencies towards more closed and less market-oriented economic policies in the US and UK should spread, the low-inflation environment of recent decades may need to be reassessed to a greater extent.
Our forecast is that 10-year US Treasury yields will climb to 2.85 per cent at the end of 2017 and 3.20 per cent at the end of 2018. The equivalent German government bonds will trade at 0.75 per cent at the end of 2017 and 1.25 per cent at the end of 2018. The spread between 10-year US and German yields will thus remain around 200 basis points during most of our forecast period, consistent with the widest spreads since the late 1980s. Compared to the November Nordic Outlook, our forecast of long-term US yields at the end of 2018 has been revised upward by 35 bps. The risk picture is divided; on the upside the main risk is higher inflation due to greater protectionism, and on the downside the dominant risks are new economic reversals and financial market turmoil due to an escalation of trade wars and/or geopolitical crises.
In Sweden, the combination of continued Riksbank bond purchases and smaller debt issuance volumes will continue to squeeze yield spreads against Germany. Next autumn, when the Riksbank cautiously begins to signal future interest rate hikes in its rate path, the yield spread will widen again. This movement will intensify as the Riksbank begins to deliver key rate hikes late in 2017. We also foresee an increased risk that
International overview
Nordic Outlook – February 2017 │ 11
investors will begin to demand a certain premium for liquidity risks in the Swedish government bond market when the supply of government bonds, excluding Riksbank holdings, at year-end falls below 10 per cent of GDP. Our forecast is that the yield spread against Germany will be 50 bps at the end of 2017 and 70 bps at the end of 2018. Swedish 10-year yields will thus climb to nearly 2 per cent at the end of 2018.
A negative net bond supply, a positive outlook for the krone and rapidly falling inflation suggest that the upturn in Nor-wegian bond yields may be smaller than that of German yields. Because Norges Bank is in no hurry to begin hiking its key rate, monetary policy will probably not pose any threat to Norway’s bond market this year. However, we believe that supply factors, due to the introduction of a new 10-year bond in mid-February, may exert some upward pressure on long-term yields during the first half of 2017, leading to a somewhat steeper yield curve. At the end of 2017, we foresee a 10-year spread against Germany that has narrowed to 105 bps, equivalent to a yield of 1.80 per cent. The spread will stabilise at around 90 points by the end of 2018 when the market begins to prepare for cautious rate hikes by Norges Bank.
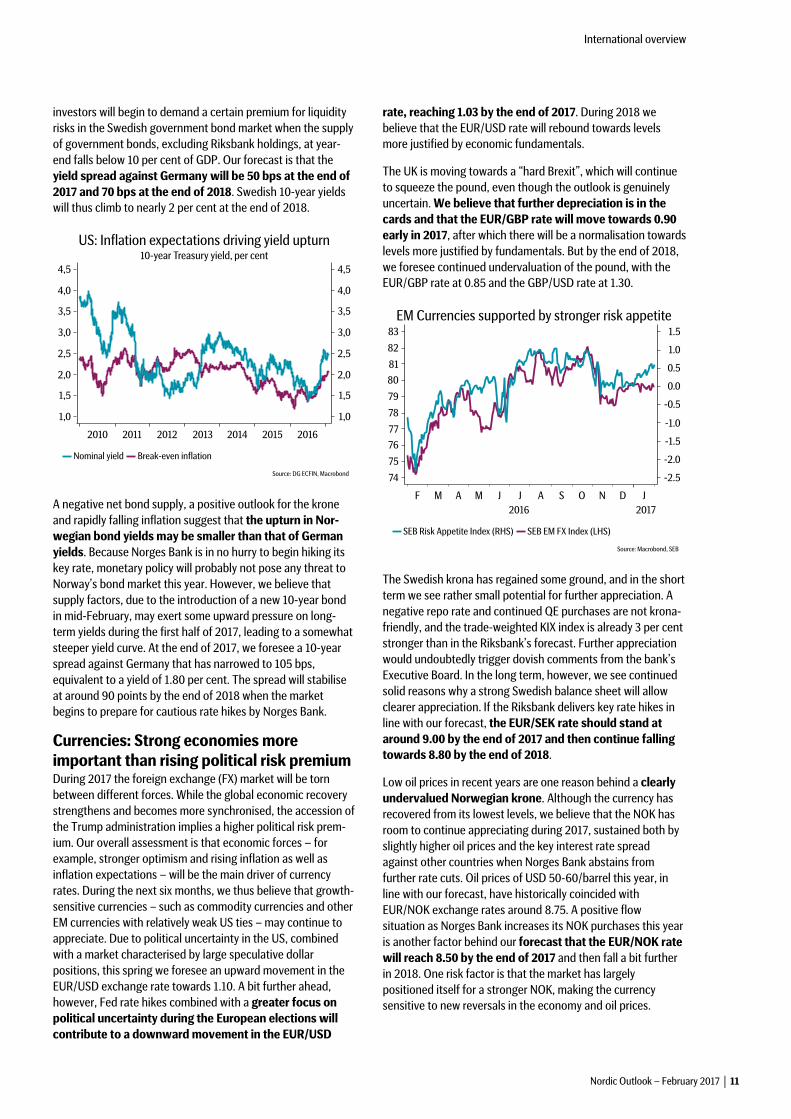
Currencies: Strong economies more important than rising political risk premium During 2017 the foreign exchange (FX) market will be torn between different forces. While the global economic recovery strengthens and becomes more synchronised, the accession of the Trump administration implies a higher political risk prem-ium. Our overall assessment is that economic forces – for example, stronger optimism and rising inflation as well as inflation expectations – will be the main driver of currency rates. During the next six months, we thus believe that growth-sensitive currencies − such as commodity currencies and other EM currencies with relatively weak US ties − may continue to appreciate. Due to political uncertainty in the US, combined with a market characterised by large speculative dollar positions, this spring we foresee an upward movement in the EUR/USD exchange rate towards 1.10. A bit further ahead, however, Fed rate hikes combined with a greater focus on political uncertainty during the European elections will contribute to a downward movement in the EUR/USD
rate, reaching 1.03 by the end of 2017. During 2018 we believe that the EUR/USD rate will rebound towards levels more justified by economic fundamentals.
The UK is moving towards a “hard Brexit”, which will continue to squeeze the pound, even though the outlook is genuinely uncertain. We believe that further depreciation is in the cards and that the EUR/GBP rate will move towards 0.90 early in 2017, after which there will be a normalisation towards levels more justified by fundamentals. But by the end of 2018, we foresee continued undervaluation of the pound, with the EUR/GBP rate at 0.85 and the GBP/USD rate at 1.30.
The Swedish krona has regained some ground, and in the short term we see rather small potential for further appreciation. A negative repo rate and continued QE purchases are not krona-friendly, and the trade-weighted KIX index is already 3 per cent stronger than in the Riksbank’s forecast. Further appreciation would undoubtedly trigger dovish comments from the bank’s Executive Board. In the long term, however, we see continued solid reasons why a strong Swedish balance sheet will allow clearer appreciation. If the Riksbank delivers key rate hikes in line with our forecast, the EUR/SEK rate should stand at around 9.00 by the end of 2017 and then continue falling towards 8.80 by the end of 2018.
Low oil prices in recent years are one reason behind a clearly undervalued Norwegian krone. Although the currency has recovered from its lowest levels, we believe that the NOK has room to continue appreciating during 2017, sustained both by slightly higher oil prices and the key interest rate spread against other countries when Norges Bank abstains from further rate cuts. Oil prices of USD 50-60/barrel this year, in line with our forecast, have historically coincided with EUR/NOK exchange rates around 8.75. A positive flow situation as Norges Bank increases its NOK purchases this year is another factor behind our forecast that the EUR/NOK rate will reach 8.50 by the end of 2017 and then fall a bit further in 2018. One risk factor is that the market has largely positioned itself for a stronger NOK, making the currency sensitive to new reversals in the economy and oil prices.

International overview
12 │ Nordic Outlook – February 2017
Solid economy key factor for equities The stock market reacted quickly to the prospect of changes in US economic policy, and American equity indices have set new records early in 2017. In such a situation, there is a great risk of reversals if Donald Trump continues to act arbitrarily and provocatively. But now that the upturn of the past six months in economic indicators is on its way to having an impact on hard data, our assessment is still that the strength of the economy is a more important stock market driver than political uncertainty. Share prices will thus enjoy further support during the next few quarters, even if momentum weakens a bit as the initial surprise factor fades.
So far, the corporate report season has been somewhat better than expected and the earlier trend towards downward revisions in earnings forecasts appears to have ended. Due to improved earnings, the stock market is not as dependent as before on liquidity support from central banks. Fed rate hikes and tapering of monetary stimulus by the ECB thus need not be such a negative factor for the stock market in the future.
Overall, we are sticking to our positive view of equities, especially in Europe (including Sweden) and Japan. Partly because of weaker economic growth and lower profit margins, European equities have performed considerably worse than their US counterparts since the financial crisis of 2007. But looking ahead, both these factors appear likely to benefit Europe more than the US. Labour and interest costs in the US are expected to climb, while a less strained resource situation and continued ECB stimulus will ease the pressure on margins in European companies. Euro zone exports will also benefit from both improved global economic conditions and eventually from renewed currency depreciation against the dollar. The rather cyclical and export-heavy Tokyo Stock Exchange should benefit from increased global demand and a relatively weak currency as well. EM equities are generally expected to provide the same returns as those of advanced countries, but with greater volatility. EM share valuations are low in a historical perspective, and exports should benefit from earlier favourable exchange rate trends as well as from a stronger US economy. Offsetting this are bigger geopolitical risks, protectionist tendencies in the US and a slow pace of reforms (for example in Brazil, Turkey and Russia).
On the whole, Nordic equities have flat-lined during the past year and have thus performed worse than the global average. This may partly be due to currency rate effects, and in the case of Denmark heavy dependence on the pharmaceutical sector, which had a bad year in 2016. After several years of weak earnings growth, Nordic stock markets have a more positive outlook ahead, while valuations are close to their historical average. We predict a total return including dividends of about 10 per cent in 2017 for Nordic stock markets. Usually, strong global growth is especially favourable to share prices in the open Nordic economies, but after disappointing growth in recent years, we have made relatively cautious estimates of the earnings outlook. Meanwhile a heightened political risk premium, due to such factors as Brexit and the US election, may limit valuation potential. One interesting market theme is the ongoing rotation from growth to value shares. This rotation, which became apparent last autumn, means that the market has shifted out of equities with high valuations due to expectations of rapid future earnings growth and instead invested in equities with generally lower valuations in which a cyclical upswing would have a more direct impact on earnings. The last time we saw such a rotation was during the dotcom bubble collapse in 2000. That rotation continued until 2007, when growth shares again took over the leading role. This shows that such regime changes can persist for a long time.

Theme: Treacherous waters for US monetary policy
Nordic Outlook – February 2017 │ 13
Complex policy environment – various factors suggest slow normalisation process
Fed’s new test balloons on trimming its bond portfolio point towards action in 2018
With two key interest rate hikes, the US Federal Reserve (Fed) has begun a complex monetary policy normalisation process after the Great Recession of 2008-2009. With its key rate at 0.50-0.75 per cent and a securities portfolio (System Open Market Account, SOMA) of 4.2 trillion dollars – 10 times larger than in 2008 – the situation is unique in many ways. The election of Donald Trump as president adds new challenges.
The Fed’s monetary policy challenges and headaches are multi-facetted and can be summarised in seven main points: 1. Assessing levels and changes in the US resource situation 2. The Trump administration’s new (economic) policies 3. The neutral real interest rate: levels and changes 4. The SOMA’s impact on interest rate decisions and the USD 5. The Fed’s impact on financial conditions (long yields) 6. International secondary effects 7. The Fed’s independence and future manoeuvring room
1. Fed’s tough conclusions on resources The Fed’s analysis of the situation, especially in the labour market, shows that the US is already close to full resource utilisation, with equilibrium unemployment of 4.8 per cent. The Fed believes that if the number of new non-farm jobs exceeds 100,000/month (2016 average growth: 180,000), unemployment should fall. For more than two years, year-on-year pay increases (3 per cent today) have been trending higher. The Fed is thus increasingly satisfied that inflation can reach its 2 per cent target with fading negative effects from earlier oil price declines and USD appreciation. Given this background, the Fed believes that the shape of fiscal policy will
be a very important factor behind how monetary policy will shift in 2017-2018. Unless Trump’s policies are able to increase the supply side and boost productivity growth in the US economy, the Fed may be forced to speed up its current monetary policy normalisation process.
2. Policies with unclear economic effects Trump’s economic policies and their demand- and supply-side effects are hard to assess (see theme article, page 18). There are many unanswered questions about the contents, implementation and outcome of these policies. The Fed reasonably assumes that the US needs no counter-cyclical fiscal stimuli, but that there is a risk they may become pro-cyclical. In late February the administration is expected to unveil its policy framework, and in late April a full budget.
The San Francisco Fed estimates that tax cuts may lift US GDP by a total of about 0.4 per cent in 2017-2018. There would also be demand effects from infrastructure investments, but with a time lag. Expected major cutbacks in the public sector and the negative impact of immigration restrictions and trade disruptions are expected to push growth lower. If it is possible to boost potential growth, this would also increase monetary policy manoeuvring room. The current conclusion is that the Fed probably needs to increase its preparedness for more hikes in the key rate more than it assumed last autumn.
3. Slow upturn in neutral interest rate Various factors (as explained in earlier issues of Nordic Outlook) suggest that the neutral − or natural − real interest rate will remain very low. The global price of money is being squeezed by generally higher savings ratios and restrained capital spending, due to such factors as demographic forces, high global debt, transformative technologies and political uncertainty. The Fed says that the nominal neutral interest rate is 3 per cent, but in the short and medium term we expect it to be well below this, limiting the Fed’s ability to hike its key rate rapidly from today’s 0.50-0.75 per cent.

Theme: Treacherous waters for US monetary policy
14 │ Nordic Outlook – February 2017
Conclusions about neutral interest rate levels and changes have an impact on the interpretation of monetary policy rules (including the “Taylor rule”). There are many indications that these rules exaggerate the need for tightening, since their parameters and new circumstances are very hard to interpret.
4. SOMA portfolio will be phased out slowly The expansion of the SOMA by USD 3.5 trillion between 2008 and 2014 was both a substitute and a complement to conventional monetary policy. In 2010 the US had a negative output gap of 4-5 per cent of GDP. Using traditional simple monetary policy rules, it needed a key rate of -3 per cent or lower. Due to the zero lower bound, securities purchases became a substitute for rate cuts. But the purposes of the SOMA also included reinforcing the message of long-lasting low interest rates, boosting optimism, expanding the monetary base, improving market function, facilitating a credit expansion and boosting asset prices. Several of these motives are now less relevant, which may justify a cutback in the SOMA.
Normalisation principle & phase-out plan According to the Fed’s monetary policy strategy, the Federal Open Market Committee should reduce the size of the monetary policy securities portfolio after starting to hike the key rate. The Fed should do so mainly by not reinvesting the proceeds of maturing securities. The strategy thus stipulates not actively selling securities in the market. Today nearly 60 per cent of the SOMA portfolio consists of Treasury securities.
Year 2017 2018 2019 2020 2021 2022
Maturing 192 426 346 220 239 177
The Fed has started releasing test balloons on reducing the SOMA. We believe this will happen in 2018, with a small portion of proceeds from maturing Treasury securities not being reinvested. But current and former Fed chairs indicate that it is too early to make such a decision. Their reasons are: The portfolio’s automatic maturity-shortening mechanism will push long-term yields 15 basis points higher in 2017, all else being equal. The Fed says this is equivalent to two 25 bps rate hikes. Tightening would thus be too sharp if the Fed follows its main scenario of three rate hikes this year. In a ten-year perspective, the SOMA portfolio is not overly large if we take into account economic growth – the Fed can thus grow into its portfolio without doing anything.
No technical or market obstacles prevent the Fed from continuing to roll over its SOMA portfolio. There may be criticism against central banks and the Fed for helping finance public debt by printing money. But implementing monetary tightening via SOMA maturities may also be a useful way to avoid USD appreciation (which may be larger using rate hikes). We assume debate on SOMA will continue in 2017 and expect the Fed to allow a small portion to mature during 2018.
5. Long yields pushed higher by supply side There are many indications that rapid, unfunded tax cuts would lead to weaker near-term public finances – even though Republicans are normally notorious budget hawks. There are
reasons not to exaggerate the risk that a larger supply of US Treasuries would push their yields far higher: The Fed owns some USD 200 billion in Treasuries maturing in 2017 that it will reinvest. Only a small portion of total 2018 maturities (USD 426 billion) are expected to affect the market. China may sell US Treasuries and other holdings due to continued capital outflows (see box, page 21). These sell-offs are not expected to exceed USD 200 billion in 2017. Trump’s policies may also include major cost-cutting. There should be demand for US government securities from investors in Japan, Europe and elsewhere due to BoJ and ECB monetary policies and a continued search for returns. Accumulated earnings of US corporations abroad, estimated at USD 2.5 trillion, may need to be reinvested in US fixed income assets if they are repatriated to the US as a result of Trump’s carrot-and-stick policy.
6. Effects from abroad via growth & USD The Fed’s mandate from Congress specifies “the goals of maximum employment, stable prices, and moderate long-term interest rates.” Fed actions in recent years indicate a shift of emphasis, with international conditions now playing a more important role in shaping its monetary policy.
International trade accounts for a mere 15 per cent of the US economy, which means that in many respects it is a closed economy. In financial markets, interdependence is greater. Emerging countries, which make up about 60 per cent of the world economy, are affected both directly and indirectly by US policies via several channels: financially via their high USD debt, and via global trade, commodity prices and security policy changes. The question is what future allowances the Fed will make for these effects, which may be consequences of US policies. Signals from Trump may lead the Fed to be less sensitive to its own adverse effects on other countries.
7. Increased political pressure on the Fed Trump has clearly criticised the Fed’s unconventional monetary policy, indicating that he may support a more model-based policy (like the Taylor rule) and that Fed Chair Janet Yellen may be replaced when her term ends a year from now. Treasury Secretary-designate Steven Mnuchin has adopted a gentler approach. It is not unusual for central banks to face criticism. Some people believe that their impact on growth, jobs and inflation is meagre. Fed policy has also helped push asset prices higher and widen economic inequality.
Today the Fed has two vacancies on its seven-member Board of Governors. We do not believe that Vice Chairman Stanley Fischer wants to stay on after his current term ends in June 2018. Trump thus has a good chance of bringing in his own people without creating turbulence at the Fed. Given the unpredictability of his White House, Trump is highly likely to try to influence the Fed and its monetary policy. This remains to be seen, but there is a greater risk of higher interest rates, bond yields and USD exchange rates.

The United States
Nordic Outlook – February 2017 │ 15
Brighter outlook, but Trump-driven uncertainty
Trump is creating worries in other countries
…but US households and small businesses are optimistic
Potential for stronger consumption
Tighter labour market will push pay higher
Gradually accelerating inflation
Two Fed rate hikes in 2017, three in 2018
Donald Trump’s presidential election victory has increased uncertainty about the American economy by generating both worries and hopes. Trump’s choices to fill key posts and his aggressive rhetoric indicate that he is prepared to implement at least some of the strongly protectionist trade policies that were a cornerstone of his campaign (see box). This has created worries in emerging economies like China and Mexico, but a large-scale trade war would also damage the US economy. Meanwhile expectations of more expansionary fiscal policy on the home front – tax cuts, infrastructure investments and expanded defence spending – have caused the US dollar, stock markets and bond yields to climb. Improved sentiment extends beyond the financial markets, however. Consumer confidence has risen sharply, probably driven by hopes of lower taxes and new jobs. Small businesses have become substantially more optimistic as well, with the National Federation of Independent Business (NFIB) index soaring to its highest level since 2004. The housing market also seems to have surged on hopes of more expansionary fiscal policy.
Although expectations of positive effects from “Trumponomics” now appear exaggerated, to some extent we share this upbeat view of the US economy. We expect more expansionary fiscal policy to generate a dose of economic stimulus, but the impact of planned tax cuts will be offset by public spending cutbacks, while infrastructure investments will begin to be implemented only after the end of our forecast period (see Theme: “Great uncertainty about US fiscal policy”, page 18). We estimate that stimulus will total some 0.2 per cent of GDP in 2017 and 0.3 per cent in 2018. Though the net effect of fiscal policy will thus not be so large, other factors such as favourable conditions for the energy sector and fewer financial service regulations may benefit business investments. An ever-stronger labour market will also continue to sustain private consumption. There are thus other reasons besides more expansionary fiscal policy behind the upward adjustment in our GDP growth forecast to 2.6 per cent in 2017 and 2018: a revision of 0.3 and 0.4 points respectively.
Given this more optimistic growth forecast, we believe that the Federal Reserve will accelerate its monetary policy tightening. We are sticking to our forecast of two key interest rate hikes in 2017, but we now predict three hikes in 2018. This means a key rate of 1.75-2.0 per cent at the end of our forecast period. We also believe that the Fed will begin unwinding its monetary policy securities portfolio (see Theme: “Treacherous waters for US monetary policy”, page 13).
Stronger private consumption on the way Various factors indicate potentially faster consumption growth ahead. Consumer confidence has bounced back from last autumn’s downward trend. Confidence improved greatly in November and December, and there are a number of reasons for households to feel optimistic. Trump has promised tax cuts for all income categories, while a stock market rally and rising home prices are benefiting consumption through the wealth effect. Household net worth is at record levels, although its distribution is skewed. Continued labour market improvement is also sustaining consumption. An initial upturn in home mortgage rates is pulling in the opposite direction, but household debt has meanwhile fallen greatly in recent years, so borrowing costs are low.
Because of earlier improvements in fundamental factors, however, households have boosted their saving instead of their consumption. In recent years, the savings ratio has been slightly below 6 per cent. Due to expectations of tax cuts and an accelerating rate of pay increases, households are nevertheless expected to ease off on saving during the next couple of years. Our forecast is that the savings ratio will fall

The United States
16 │ Nordic Outlook – February 2017
to 5.6 per cent by the end of 2018. Overall, this means that we are revising our forecast of private consumption somewhat to an increase of 2.8 per cent in 2017 and 2.5 per cent in 2018.
Cautious recovery in capital spending Stimulating the expansion of US manufacturing through protectionist measures is one of Trump’s explicit goals (see box). His focus is on restoring lost jobs, but the weak trend of industrial production for many years has slowed business investments and thus also GDP growth. There are now cautious signs of improvement. The ISM index of manufacturing sentiment has climbed from a low of 49.4 in August to 56.0 in January, probably driven in part by Trump’s campaign promises of tax cuts and business deregulation. Aside from clearly improved sentiment, there are also more concrete signs of a rebound in the form of increased oil-drilling and mining activity, due to higher oil prices and better productivity. The steep capital spending decline in these sectors has thus ended, and Trump’s energy policy – which looks set to be less environmentally minded than President Obama’s – may fuel further growth ahead.
However, other factors will restrain the recovery in capital spending. The strong dollar will remain a drag on the manufacturing sector. Meanwhile capacity utilisation remains just above 75 per cent, a historically low level. Business investments do not usually take off before capacity utilisation exceeds 80 per cent. The weak productivity growth trend since the financial crisis may also have a restraining effect if it reflects a shortage of profitable investment opportunities. Our overall assessment is that capital spending will recover but that its increase will be moderate. Investments will climb by 3.9 per cent in 2017 and 4.6 per cent in 2018.
Tighter labour market will push pay higher During 2016 monthly job growth averaged 180,000, compared to 230,000 in 2015. Despite this slowdown, growth is fast enough to keep unemployment falling. In January the jobless rate was 4.8 per cent, only one tenth of a per cent lower than at the beginning of 2016. The sluggish downturn during 2016 is explained by a rising labour force participation rate. Since bottoming out in September 2015, the participation rate has recovered by a few tenths of a point but remains around 4.5 points below its peak in 2000. The employment rate (ages 25-65), in turn, is some 4 percentage points lower than in 2000 and around 3 points lower than the average for 2007. This means that the labour market probably has more slack than official labour market figures indicate, although demographic factors will make it harder to reach the peaks of the previous decade. Our overall assessment is that unemployment will fall further, levelling out at just above 4 per cent in 2018. This is a somewhat lower level than in November’s Nordic Outlook.
Low unemployment is now starting to have an increasingly clear impact on wage formation. The upturn in average hourly earnings has continued to accelerate; the December rate of 2.9 per cent was the highest since 2009 although there was a deceleration in January due to base effects. Our forecast is that the rate of pay increases will accelerate further during 2017, reaching a rate of 3.5 per cent by year-end.
US trade policy shifting towards protectionism One of Donald Trump’s main campaign promises was to turn around the US manufacturing sector, which has lost around 5 million jobs since 2000. According to Trump, the main reason is skewed competition, which is why protectionism will help restore the sector. His main targets have been China and Mexico. Aside from restoring lost jobs, another explicit goal is to reduce the US trade deficit. Earlier there were hopes that people around Trump would help modify these policies, but it is now obvious that the new administration will shift US trade policy in a clearly protectionist direction. Robert Lighthizer, Peter Navarro and Wilbur Ross – who hold key posts in the administration – are all clearly protectionist and critical of China. Their views are expected to permeate trade policy. It is harder to say what concrete expressions these ideas will take, although some steps have already been taken. For example, as expected the US has left the Trans-Pacific Partnership (TPP) and will also try to renegotiate the North American Free Trade Agreement (NAFTA). Declaring China a currency manipulator would have little impact, but there is a risk that the US will eventually impose tariffs on imports mainly from China and Mexico. China has good potential to respond to this with its own trade barriers, and a conflict risks escalating to a trade war. This is not our main scenario, but it poses a downside risk to US economic growth.

The United States
Nordic Outlook – February 2017 │ 17
Accelerating inflation rate Last autumn’s inflation upswing continued. In December the Consumer Price Index (CPI) rose for the fifth straight month, reaching 2.1 per cent. The main explanation is that earlier energy price declines have disappeared from the 12-month figures. This effect will continue to influence the figures for the next few months. CPI inflation has now reached the same level as core inflation (CPI excluding food and energy), which has hovered around 2 per cent since late 2015. Higher pay may help push core inflation up even further, but so far the rate of increase has been moderate. We believe that rising pay pressure will not start to have an impact until well into 2017.
Measured as annual averages, inflation is expected to rise from 1.3 per cent in 2016 to 2.1 per cent in 2017 and 2.2 per cent in 2018. We expect core CPI to show about the same rate. The Fed’s main metric, however, is core inflation using the personal consumption expenditures (PCE) deflator. The earlier upturn has ended, and during 2016 core PCE was around 1.6 per cent. We expect core PCE to increase by annual averages of 1.8 per cent in 2017 and 2.0 per cent in 2018. Fiscal stimulus measures and import tariffs pose an upside risk to our inflation forecast in a situation where the rate of pay increases is accelerating, while a stronger dollar poses a downside risk.
According to the University of Michigan consumer sentiment survey, household inflation expectations fell to record lows but recovered clearly in January. Break-even inflation expectations have risen rapidly since November’s presidential election, but their acceleration has recently levelled out. An actual rise in CPI inflation, combined with more expansionary fiscal policies ahead, implies that inflation expectations will probably continue upward.
Fed will gradually speed up its tightening The Fed’s key interest rate hike to 0.50-0.75 per cent in December had been completely priced in by financial markets. Fed policy committee members’ own forecasts now indicate three hikes each in 2017 and 2018. The minutes of their December meeting were dominated by great uncertainty about US fiscal policy. Members stated that their forecasts had
only partially taken more expansionary fiscal policy into account. Overall, the minutes indicated stronger growth optimism, which was not dependent only on “Trumponomics”. Fiscal policy will probably have an impact on the Fed’s rate hikes, and increased stimulus measures will mean that the Fed can normalise monetary policy more rapidly. Meanwhile market expectations about Trump’s fiscal policy have contributed to a stronger dollar, which has the opposite effect on monetary policy. Further USD appreciation during 2017 risks slowing down both inflation and economic growth. Financial conditions have already tightened somewhat, due to the stronger dollar and rising bond yields. Also, the Fed’s own Taylor rule indicates that monetary policy should be much tighter based on current price pressure and economic growth.
So far the Fed has been very cautious about tightening its monetary policy, which is clearly illustrated by the fact that it managed only one rate hike during 2016. As long as its key interest rate is very low, this cautious behaviour is likely to persist, since the Fed’s potential for countering any negative consequences of overly rapid tightening is extremely limited. We believe that the Fed will also begin to reduce its balance sheet by phasing out bond holdings as another way of making its monetary policy less expansionary (see theme article on page 13). This will also contribute to a decreasing need for rate hikes during our forecast period.
Meanwhile both US economic growth and inflation appear likely to be somewhat higher in 2017, and especially in 2018, compared to our earlier assessments. We are sticking to our forecast that the Fed will hike its key rate twice in 2017, which is in line with market pricing. The Fed wants a gradual tightening of monetary policy, and we also continue to believe that its hikes will occur in June and December. During 2018 we expect three hikes, which implies a federal funds rate of 1.75-2.00 per cent at the end of our forecast period.

Theme: Great uncertainty about US fiscal policy
18 │ Nordic Outlook – February 2017
??
A clearer picture by this spring?
Tax cuts, reductions in public spending and infrastructure investments will provide...
…small but positive growth effects
A border tax would fundamentally change the corporate taxation system
The Trump administration’s signals about major fiscal stimulus programmes have been one main reason for increased optimism among various economic players. At present there is great uncertainty, but we expect the picture to become clearer by this spring. The administration’s aim is to publish a document containing guidelines within 45 days of Trump’s January 20 inauguration and unveil a detailed budget within 100 days, that is, before the end of April. However, even now it is important to try to estimate the scope and direction of federal fiscal policy, although this must be based on a patchwork of reports, statements, press releases and tweets.
The new fiscal policy is expected to have three main components: 1) tax cuts for households and businesses, 2) reductions in public spending and federal bureaucracy and 3) infrastructure investments. Changes in taxes and public spending, in particular, have the potential to affect economic growth during our forecast period, whereas infrastructure investments will only have an impact further ahead. The positive growth effects of planned tax cuts will be offset to some extent by cuts in public spending, which will decrease the overall impact of fiscal policy.
Based on the information available at present, our assessment is that the growth effect of Trump’s fiscal policy would be weakly positive, equivalent to a stimulus dose of about 0.2 per cent of GDP in 2017 and 0.3 per cent in 2018. Great uncertainty prevails, but this is a cautious forecast. There is consequently some upside risk to our GDP forecast, in the form of potentially larger fiscal policy effects.
Substantial tax cuts are planned The planned tax cuts for households and businesses are equivalent to around USD 5-6 trillion over ten years, but the picture is complicated by discussions about introducing a “border tax”, which would represent a very far-reaching change in the corporate taxation system. This tax is controversial and there is great uncertainty as to whether it will be enacted.
Income taxation
Tax cuts would be implemented for all income categories. The number of tax brackets would be reduced from seven to three and the highest federal marginal tax would be lowered from
39.6 per cent to 33 per cent. Meanwhile the standard deduction would be raised. Property, gift and inheritance taxes would be abolished. The effects of these cuts would be biggest for high-income earners, both in absolute and percentage terms. Since high-income households tend to save much of any increase in disposable income, the effects of these tax cuts on economic growth are expected to be limited.
Corporate taxation and border tax
Corporate tax would be cut from its current internationally high level of 35 per cent to 20 or 15 per cent. In practice, major corporations pay an effective tax far below 35 per cent. The corporate tax cut would thus primarily benefit small and medium-sized companies.
The idea is to combine corporate taxation with the introduction of a border tax. The purpose of the latter would be to deal with what the United States perceives as unfair and harmful trade agreements, as well as to generate tax revenues that can offset the revenue reduction due to the corporate tax cut. A border tax would help remedy the problem of profits being shifted to low-tax jurisdictions.
If the border tax is enacted, the US would be abandoning the current system in which taxation is based on the difference between a company’s global revenue and costs. Instead the tax would be calculated using the difference between a company’s revenue in the US and its costs in the US. Merchandise and service imports would thus no longer be subtracted from revenue, but would instead be taxed. Meanwhile a company’s exports could instead be subtracted from its revenues. In practice, this means that exports would be subsidised. Companies with large exports like Boeing and General Electric would benefit, while Walmart and other retailers would be hurt.
Because of the US trade deficit, a border tax would generate tax revenue. A 20 per cent tax on imports would provide revenue that exceeds the cost of the corresponding export subsidy. The US trade deficit is around USD 500 billion per year, and a 20 per cent border tax would generate tax revenues of USD 100 billion per year. Trump was previously sceptical about introducing a border tax but has changed his mind. His whole-hearted support is probably required in order to push through a border tax. Importers would be hard hit and lobbying efforts aimed at stopping the tax have already begun.
Difficult to make big spending cuts The Trump administration has unveiled proposals for large-scale cutbacks in federal spending. Their scope is very uncertain, too, but the proposed cost savings are estimated at between USD 8 and 10 trillion over ten years. The cutbacks would consist of eliminating public sector activities and organisations as well as public subsidy programmes. Preliminary proposals have been sent to federal departments

Theme: Great uncertainty about US fiscal policy
Nordic Outlook – February 2017 │ 19
to enable them to state their opinions, and the cutbacks will probably encounter stiff resistance.
Federal expenditures 2015
Spending area USD bn % of GDP Discretionary spending* 1,165
6.5
Social Security 882
5.0
Medicare 539
3.0
Other (incl unemployment) 528
3.0
Medicaid 350
2.0
Interest payments (net) 224 1.3 Total 3,688
20.8
* Including defence spending of USD 582 billion. Source: Congressional Budget Office
It is unclear whether Trump’s first budget will include reforms of Social Security and Medicaid/Medicare. During his campaign, Trump promised not to cut these programmes, which are behind much of the federal budget deficit. Together, these three areas are equivalent to around 10 per cent of GDP and nearly half of total budget expenditures. But among Republicans, for years there has been a desire to cut these programmes. House Speaker Paul Ryan has previously proposed extensive changes and cost-cutting. There are thus major differences between Trump and the Republican Party about how to deal with these programmes. At present, it is thus impossible to know how these issues will be treated in the budget. In addition, the budget includes discretionary expenditures equivalent to 6-7 per cent of GDP, including defence spending, which Trump has said will be increased. On the whole, it seems highly improbable that public spending cutbacks can reach the level that has been proposed. It will thus also be difficult to carry out the planned tax cuts without sharply increasing the budget deficit.
Big infrastructure investments on the way A more or less detailed infrastructure package is expected later in 2017. The size of the existing proposals ranges between USD 500 billion and USD 1 trillion over ten years. They
include traditional infrastructure investments but also deregulation aimed at speeding up individual projects.
The perception that US infrastructure is deficient and that large-scale investments are needed is uncontroversial, but the difficulty lies in funding these investments without weakening federal finances. Many Republicans have expressed hesitation about spending as much as USD 1 trillion (more than 5 per cent of annual GDP). A figure at the low end of the range, or even below USD 500 billion, thus seems more likely. The aim is to implement most of these investments using private funds and persuade companies to participate by means of financial incentives. Basing these investments primarily on private funding would make them more palatable to Republicans. The Democrats have unveiled their own proposals for major infrastructure investments, and there is thus potential for cooperation between the parties.
We believe that there is good potential to push through infrastructure investments. However, we expect the size of the programme to end up in the lower portion of the administration’s range. The programme will not have any measurable impact on economic growth until after the end of our forecast period.

Japan
20 │ Nordic Outlook – February 2017
Global conditions raise hopes of better Japanese growth
Progress has been surprisingly slow, despite last year’s major stimulus measures
BoJ policy is “isolating” Japan from rising bond yields and helping to weaken the yen
During 2016, Japanese GDP growth was aided by three large fiscal stimulus packages – the latest in August worth 1-1.5 per cent of GDP – and Bank of Japan (BoJ) monetary interventions (see more below). Yet growth remains relatively weak. The risk picture is balanced for growth as well as the inflation outlook. In 2016, the yen appreciated by about 5 per cent against a currency basket. However, we believe that the outlook has become somewhat brighter – helped by better global growth, an undervalued yen and expectations of stronger private consumption. We expect GDP to grow by 0.6 per cent this year and 0.5 per cent in 2018. The final GDP growth figure for 2016 was pushed higher by systemic and data changes in the national accounts to 0.9 per cent.
The Shinzo Abe government’s latest fiscal package is front-loaded, with measures to be implemented before the end of March, but various structural reforms are still conspicuously absent. The package jeopardises budget targets; over the next two years we expect deficits of 4-5 per cent of GDP, making it harder to stabilise public sector debt by 2020. In two years Japan’s debt will reach 255 per cent of GDP. It is uncertain whether the government can enact its postponed hike in consumption tax from 8 to 10 per cent by 2019 as promised.
Continued reforms to promote labour market mobility and availability are necessary in order to boost the country’s potential growth, which is 0-0.5 per cent at present. Priorities include raising labour force participation by women, making it easier for older people to keep working and deregulating markets. Hopefully this will lift Japan’s neutral interest rate, thus also making today’s monetary policy more expansionary.
Stage set for pay hikes, but will they come? Pay increases have speeded up slightly but are surprisingly weak in light of the tight labour market and verbal interventions by the government and central bank – as well as international organisations – about the need for higher pay. Corporate earnings are also still historically high. The government is sticking to its 3 per cent yearly target for raising minimum wages. Deflation expectations have eased a bit but still extend deeply into the economy and are difficult to reverse quickly. We expect today’s unemployment of 3 per cent – close to equilibrium – to fall marginally during our forecast period.
Somewhat higher wage and salary growth (0.6 per cent yearly in 2017 and 2018) and stable oil prices, plus a weaker yen, are expected to help push inflation higher. CPI inflation will in-crease to 0.7 per cent this year and 2018 (up from -0.1 per cent in 2016). The BoJ is not expected to change its monetary policy strategy. Yearly government securities purchases of some JPY 90 trillion, which may vary depending on international yields, will continue as before.
In practice, Japan has begun to use “helicopter money” (see Nordic Outlook, November 2016: “BoJ is breaking new mone-tary policy ground”). The central bank is guaranteeing the Japanese government that all borrowing with maturities of up to 10 years will occur at close to 0 per cent interest. For the time being, this gives Japan’s domestically oriented sectors relative advantages in a world where bond yields have risen late in 2016 and early in 2017. The greater the global yield pressure is, the more the BoJ may be forced to buy government securities. This will also squeeze the value of the yen. In addition, the BoJ is also pledging that inflation will exceed its 2 per cent target. Overall, this will set the stage for lower real interest rates and support for the export sector, while Japanese investors will be forced to send more of their money abroad. We expect a USD/JPY exchange rate of 120 at the end of 2017 and 124 at the end of 2018.

The BRIC countries
Nordic Outlook – February 2017 │ 21
Brighter outlook, despite Trump
China: Seeking stability ahead of next autumn’s political reshuffle
India: Currency reform has damaged growth
Russia announces budget cuts
Brazil: Recovery, but domestic politics and government finances a source of concern
China: Stable growth due to political tactics In 2016 continued credit expansion was Beijing’s main tool for achieving the 5-year plan’s 6.5-7.0 per cent GDP growth target: the outcome was 6.7 per cent. Although this growth model is providing a short-term upswing, risks to long-term economic stability are increasing. This was one reason why the authorities initiated a cautious credit tightening last autumn.
Major political reshuffle in late autumn 2017 Every five years, the Chinese Communist Party’s seven-man Standing Committee undergoes a renewal to ensure the necessary political generation shifts. This change will occur during the fourth quarter of 2017. President Xi Jinping and Prime Minister Li Keqiang are serving five-year terms of office that are expected to be extended until 2022. The other five Standing Committee members will probably be replaced. This hand-over is important to enable President Xi to put the right people at the top of the party so he can carry out his political agenda for the following five years. Today’s leadership was influenced by earlier presidents (Hu Jintao and Jiang Zemin). To make this autumn's selection process easier, Xi is expected to try to ensure that the economy grows in a stable way during 2017, without disruptive financial market movements. As a result, the reform agenda will be thinner during the coming year. The new leadership is not expected to take fresh political initiatives until early 2018.
China is continuing its controlled deceleration. This year, we expect GDP to grow by 6.6 per cent and in 2018 by 6.2 per cent. Due to political changes next autumn (see above), we expect Beijing to avoid actions/reforms that jeopardise growth and employment. Heavy industry will be a drag on growth as the authorities try to rebalance the economy away from capital- and credit-intensive sectors. The service sector, which accounts for more than half the economy, has offset the slowdown in manufacturing. Services have contributed to high employment through the growth of small- and micro-sized companies. How much GDP growth will slow in 2017 and 2018
depends largely on labour market developments, but given yearly job growth of 10 million, unemployment is expected to remain stable. This will benefit consumption and growth. One big question mark, of course, is Chinese-US trade and security relations. The next few months will show how much they may affect China’s economic outlook.
Large outflows squeeze Beijing and the yuan China’s currency outflow in 2016 was about USD 570 billion. The current account surplus reached an estimated USD 205 billion, but international reserves fell by USD 320 billion. Despite attempts to use actual/verbal capital controls, outflows may be equally large in 2017, driven by repayments of USD loans, greater Chinese appetite for foreign currencies and more interest among foreign and Chinese companies in currency hedging. Yet, China is far – about USD 1 trillion – away from reaching a critical reserve level.
Given a currency reserve near the psychologically important USD 3 trillion level and the USD/CNY exchange rate about to exceed 7.00, there may be increased speculation about a big devaluation (which would violate the principles for a currency included in the IMF’s Special Drawing Rights or SDR basket). The probability of such an action is low, however. The decrease in the reserve is a headache for the US. Since about 60 per cent of it consists of US government securities, a continued sell-off may help push long-term yields higher. According to Fed calculations, a USD 100 billion sell-off during a short period would cause yields to climb by 40–60 basis points.
Inflation will accelerate from 2.2 per cent in 2016 to 2.5 per cent in 2017 and 2018. While monetary policy will be somewhat less expansionary ahead, fiscal policy will move in the opposite direction; the 2017 and 2018 budget deficits are
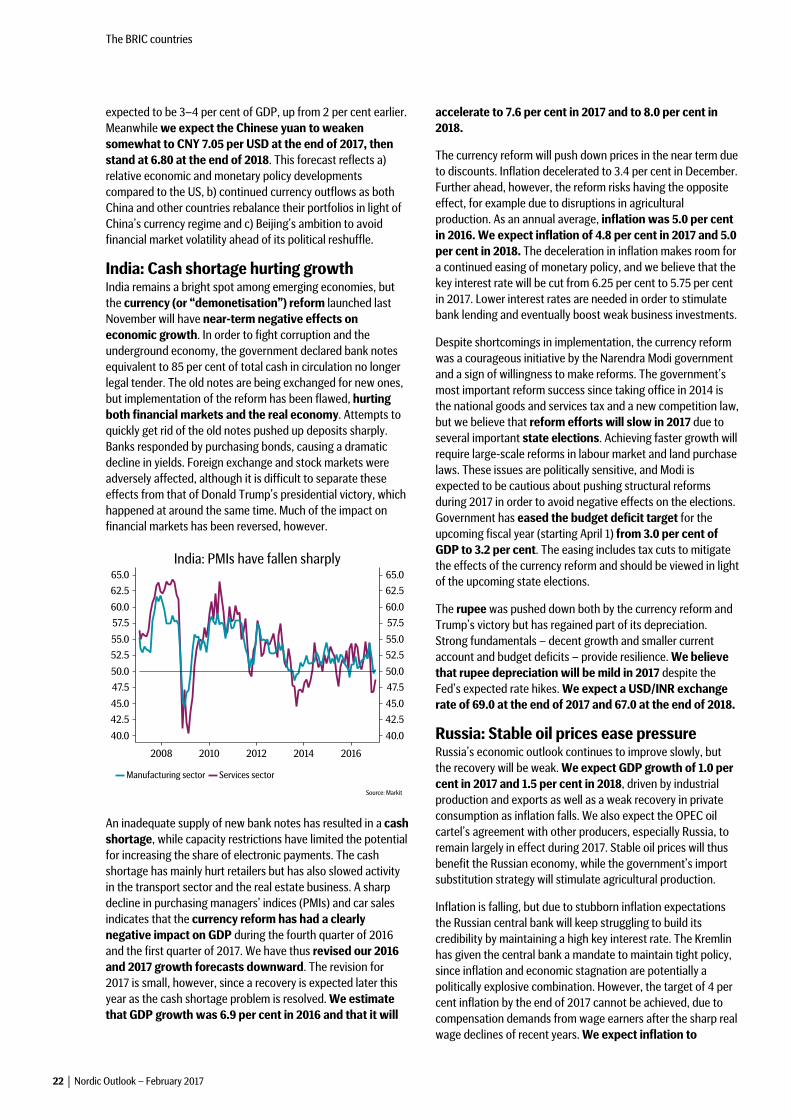
The BRIC countries
22 │ Nordic Outlook – February 2017
expected to be 3–4 per cent of GDP, up from 2 per cent earlier. Meanwhile we expect the Chinese yuan to weaken somewhat to CNY 7.05 per USD at the end of 2017, then stand at 6.80 at the end of 2018. This forecast reflects a) relative economic and monetary policy developments compared to the US, b) continued currency outflows as both China and other countries rebalance their portfolios in light of China’s currency regime and c) Beijing’s ambition to avoid financial market volatility ahead of its political reshuffle.
India: Cash shortage hurting growth India remains a bright spot among emerging economies, but the currency (or “demonetisation”) reform launched last November will have near-term negative effects on economic growth. In order to fight corruption and the underground economy, the government declared bank notes equivalent to 85 per cent of total cash in circulation no longer legal tender. The old notes are being exchanged for new ones, but implementation of the reform has been flawed, hurting both financial markets and the real economy. Attempts to quickly get rid of the old notes pushed up deposits sharply. Banks responded by purchasing bonds, causing a dramatic decline in yields. Foreign exchange and stock markets were adversely affected, although it is difficult to separate these effects from that of Donald Trump’s presidential victory, which happened at around the same time. Much of the impact on financial markets has been reversed, however.
An inadequate supply of new bank notes has resulted in a cash shortage, while capacity restrictions have limited the potential for increasing the share of electronic payments. The cash shortage has mainly hurt retailers but has also slowed activity in the transport sector and the real estate business. A sharp decline in purchasing managers’ indices (PMIs) and car sales indicates that the currency reform has had a clearly negative impact on GDP during the fourth quarter of 2016 and the first quarter of 2017. We have thus revised our 2016 and 2017 growth forecasts downward. The revision for 2017 is small, however, since a recovery is expected later this year as the cash shortage problem is resolved. We estimate that GDP growth was 6.9 per cent in 2016 and that it will
accelerate to 7.6 per cent in 2017 and to 8.0 per cent in 2018.
The currency reform will push down prices in the near term due to discounts. Inflation decelerated to 3.4 per cent in December. Further ahead, however, the reform risks having the opposite effect, for example due to disruptions in agricultural production. As an annual average, inflation was 5.0 per cent in 2016. We expect inflation of 4.8 per cent in 2017 and 5.0 per cent in 2018. The deceleration in inflation makes room for a continued easing of monetary policy, and we believe that the key interest rate will be cut from 6.25 per cent to 5.75 per cent in 2017. Lower interest rates are needed in order to stimulate bank lending and eventually boost weak business investments.
Despite shortcomings in implementation, the currency reform was a courageous initiative by the Narendra Modi government and a sign of willingness to make reforms. The government’s most important reform success since taking office in 2014 is the national goods and services tax and a new competition law, but we believe that reform efforts will slow in 2017 due to several important state elections. Achieving faster growth will require large-scale reforms in labour market and land purchase laws. These issues are politically sensitive, and Modi is expected to be cautious about pushing structural reforms during 2017 in order to avoid negative effects on the elections. Government has eased the budget deficit target for the upcoming fiscal year (starting April 1) from 3.0 per cent of GDP to 3.2 per cent. The easing includes tax cuts to mitigate the effects of the currency reform and should be viewed in light of the upcoming state elections.
The rupee was pushed down both by the currency reform and Trump’s victory but has regained part of its depreciation. Strong fundamentals – decent growth and smaller current account and budget deficits – provide resilience. We believe that rupee depreciation will be mild in 2017 despite the Fed’s expected rate hikes. We expect a USD/INR exchange rate of 69.0 at the end of 2017 and 67.0 at the end of 2018.
Russia: Stable oil prices ease pressure Russia’s economic outlook continues to improve slowly, but the recovery will be weak. We expect GDP growth of 1.0 per cent in 2017 and 1.5 per cent in 2018, driven by industrial production and exports as well as a weak recovery in private consumption as inflation falls. We also expect the OPEC oil cartel’s agreement with other producers, especially Russia, to remain largely in effect during 2017. Stable oil prices will thus benefit the Russian economy, while the government’s import substitution strategy will stimulate agricultural production.
Inflation is falling, but due to stubborn inflation expectations the Russian central bank will keep struggling to build its credibility by maintaining a high key interest rate. The Kremlin has given the central bank a mandate to maintain tight policy, since inflation and economic stagnation are potentially a politically explosive combination. However, the target of 4 per cent inflation by the end of 2017 cannot be achieved, due to compensation demands from wage earners after the sharp real wage declines of recent years. We expect inflation to

The BRIC countries
Nordic Outlook – February 2017 │ 23
average 5.0 per cent in 2017, then slow to 4.8 per cent in 2018. The key rate will be cut gradually from its current 10.0 per cent to 8.0 per cent at the end of 2017 and remain unchanged in 2018.
The Reserve Fund, which Russia built up during the period of high oil prices, is running out and will probably be empty this year. The Finance Ministry has announced sharp federal budget cuts in 2017-2018, with the aim of limiting the deficit to 1.2 per cent of GDP in 2019. Its ambition is to trim spending by one per cent of GDP per year. Unlike previous budget bills, the government has announced cutbacks in defence spending as well, but our assessment is that it will miss this target. The defence establishment have a strong position and will push for continued resources in a threatening and uncertain world. The presidential election in March 2018 will also complicate budget policy. President Vladimir Putin will not risk protests from pensioners and government employees during an election year. The political activist and anti-corruption blogger Alexei Navalny has indicated that he will be a candidate for president, but his chances of defeating the much more popular Putin are small.
The USD/RUB exchange rate will probably weaken to 63.5 by December 2017 due to rate cuts and the central bank’s need to rebuild its currency reserve. Russian-US relations may improve, among other things leading to easing of sanctions that may decrease downward pressure on the rouble.
Brazil: Reforms will strengthen growth As in Russia, the Brazilian economy is entering a recovery phase. Net exports have already begun to contribute positively to GDP, and this trend will probably strengthen in an environment of weak domestic recovery and stronger growth in Brazil’s export markets. The Brazilian real remains relatively weak despite recent appreciation, giving the export sector a good competitive position. Capital spending has fallen by 25 per cent in fixed prices since 2013, but rising commodity prices and reforms appear likely to stimulate foreign investments in Brazil’s oil sector and infrastructure, resulting in stabilisation or weak recovery. In addition, the litigation in the “Car Wash” corruption case is entering a phase where the oil group Petrobras, by far the biggest single investor in Brazil, can
resume projects that have been frozen and also start new ones. We expect GDP to grow by 0.7 per cent in 2017 and 2.0 per cent in 2018.
The reform ambitions of the new administration under President Michel Temer are expected to help drive economic growth. After the government managed to establish a 20-year public expenditure ceiling, confidence in federal finances has increased. The government has a far-reaching programme of deregulation and other major reforms. The absolutely crucial point is a reform of the pension system, which will probably receive congressional approval during the first half of 2017.
Thanks to the recovery of the real and the decline in domestic demand, inflation is on its way down and will probably reach the mid-point of the central bank’s 4.5 ± 2 per cent target as early as this August or September. We expect inflation to average 5.2 per cent in 2017 and 4.9 per cent in 2018. At first the central bank will probably cut its key rate rapidly, later slowing the pace of cuts if global market interest rates and yields climb as a result of expansionary US fiscal policy. We expect the key rate to be 10 per cent at the end of 2017 and 9 per cent at the end of 2018. Continued relatively high inflation will also contribute to a renewed weakening of the real ahead.
In addition to risks of less satisfactory international developments, mainly affecting Brazil’s most important current trading partner China, there are domestic political sources of concern. In connection with the Car Wash corruption case, Odebrecht and Camargo Correa – two of Brazil’s largest construction companies – have reached an agreement with prosecutors that may implicate President Temer or members of his government. If this leads to a shelving of the president’s reform programme, the confidence and optimism prevailing in the private sector since January 2016 may rapidly disappear.

The euro zone
24 │ Nordic Outlook – February 2017
Economic strength is resilient to political uncertainty
Indicators at highest levels since 2011
Households the main growth driver, but exports and capital spending will speed up
Higher inflation, but below ECB target
ECB will hold off this spring but reduce bond purchases after the summer
The economic outlook has improved and there are many signs that growth has accelerated in recent months. Sentiment indicators are at their highest since 2011, and the upturn is more balanced than before. Several factors are pulling in the right direction: rising employment and low interest rates are benefiting households, while the export outlook is improving. This will lead to broad-based growth, also reflected in rising business investments and optimism. We are revising our GDP forecast upward to 1.8 and 1.9 per cent in 2017 and 2018 respectively. European Central Bank (ECB) asset purchases will follow the current plan in the first half, with further cuts in monthly purchases next autumn.
Uncertain votes, but little effect on growth After the British referendum and US elections the focus will now shift to the euro zone, where a number of important countries will hold elections in 2017, including the Netherlands in March, France in April-June and Germany in September. Now that major English-speaking countries have so clearly turned inward, emphasising national interests ahead of international cooperation, political conditions are also changing in the euro zone. Movements opposed to greater
economic integration are now enjoying a tailwind at the expense of federalist forces led by EU bureaucrats in Brussels.
Opposition to federalism is found not only among populist forces; making more room for national solutions within the framework of the EU project enjoys broad public support. This may include allowing countries to have different social safety networks that cannot be fully utilised as part of free movement. National control of migration policies is also important to many countries. The bigger the EU has become, the harder it seems to achieve consensus on many issues. This increases the need for alternatives to “one-size-fits-all” solutions in order to ensure the long-term survival of the project. A bit paradoxically, there are many indications that the entire EU may be moving in the direction the UK advocated for itself in the negotiations preceding its “Brexit” referendum.
Despite the EU’s long-term identity problems, the 2017 elections are unlikely to result in any revolutionary successes for populist, anti-EU forces. Support for the EU and euro zone is at decent levels in many countries. This spring’s EU summits, including the 60th anniversary of the Treaty of Rome, are unlikely to feature provocative federalist initiatives. Instead they will focus on issues requiring cooperation among countries, such as combating terrorism, defence and ensuring that the huge 2015 refugee influx is not repeated. Our main forecast is also that in the second round of France’s presidential election, the left will support the candidate of the traditional right, thereby preventing populist leader Marine Le Pen from reaching the Elysée Palace. In Germany, advances by the anti-EU party AfD will probably not be enough to keep the current Christian/Social Democratic grand coalition from remaining in power. The established political forces can thus postpone some of their problems.
GDP forecasts Year-on-year percentage change
2015 2016 2017 2018 Germany 1.7 1.9 1.8 1.8 France 1.3 1.2 1.2 1.4 Italy 0.7 0.9 0.9 1.2 Spain 3.2 3.3 2.8 2.8 Euro zone 2.0 1.8 1.8 1.9
Source: Eurostat, SEB
Given our main political scenario, the economic consequences will not be so great in 2017-2018. Some nervousness about the elections will marginally affect growth, and if opinion polls before the French presidential election indicate an even

The euro zone
Nordic Outlook – February 2017 │ 25
second round, financial market worries may become more apparent. The biggest risks of long-lasting economic disrup-tions are connected to events in Italy. The victory of the No side in last autumn’s constitutional referendum and Prime Minister Matteo Renzi’s resignation make a snap election likely this year. Already weak growth, austerity demands from Brussels and banking sector problems make Italy especially vulnerable. Due to the size of the economy, any secondary effects may be substantial. Events in Italy may also have broad consequences on the political level. Brussels would lose credibility if a big country like Italy ignored its call for belt-tightening. Intervention in the Italian banking sector is also likely to include a public sector bail-out, violating the prevailing principle that private funds (a bail-in) should resolve the need for recapitalisation. Another risk is Greece, which will require further bail-out disbursals by July. As earlier, there is a discussion between Greece, the EU and the IMF on disbursal terms, but we expect the outcome to be in line with similar recent occasions: the bail-out will finally be disbursed and Greece will be granted further loan concessions.
Weakly expansionary fiscal policies Public finances have improved, due to stronger economic conditions and previous austerity programmes, but high government debt in many countries will prevent them from following the US example of a more expansionary fiscal policy. Yet overall fiscal policies will be weakly expansionary in 2017-2018 as austerity eases and countries with fiscal flexibility enact moderate stimulus. Despite rising yields, interest cost for government debt is falling, creating some room to increase spending. Brussels will probably continue to demand austerity in various countries, but sanctions against those who do not follow instructions are increasingly unlikely, despite German protests. Expenditures related to the refugee crisis, defence or combating terrorism will be viewed with especially great understanding by EU institutions. German public finances have surprised on the upside, with the growing current account surplus now at 8-9 per cent of GDP. This implies continued external pressure for German stimulus measures, which can also be tied to Donald Trump’s statements that Germany and other EU countries will have to accept a larger responsibility for NATO expenditures related to defending Western Europe. Overall, the euro zone’s public sector deficit will gradually shrink towards 1.5 per cent of GDP in 2018, while government debt will fall towards 90 per cent of GDP.
Clear improvement in indicator data Sentiment indicators have recently rebounded. The composite purchasing managers’ index (PMI) and the European Commission’s Economic Sentiment Indicator (ESI) are both at their highest for over 5 years. This upturn is geographically broad-based, with the PMI in France and Italy now also a bit above the neutral 50 mark. In sectoral terms, the upturn is driven mainly by improved confidence in manufacturing, but the construction sector is also more optimistic. The order situation has brightened both for domestic and export markets. The euro is weak against the US dollar, but in trade-weighted terms the picture is more complex. The euro rose by
3-4 per cent in 2016 but is weaker than its average for the past 10 years. Late in 2016, exports and industrial production showed more stable increases than earlier. Overall, we expect industrial output to rise by 1.5 per cent in 2017 and 2 per cent in 2018, while exports will grow by about 4-4.5 per cent annually.
Continued upturn in capital spending Despite some recovery in recent years, capital spending is still about 10 per cent lower than in 2008. Various factors indicate that investments will keep increasing further. Industrial production is rising and capacity utilisation in manufacturing is above its historical average. Demand for loans among non-financial companies is at a decent level and lending is pointing higher, but the pace of increase is not yet impressive in a historical perspective. Expansionary ECB policy is also helping, but there are major regional differences. In countries where the banking sector is still weighed down by a large quantity of bad loans, ECB policies do not have the same impact. In Italy and Spain, for example, credit growth remains weak. Meanwhile residential investments are increasing. Home prices are climbing in many euro zone countries, and demand is being pushed higher by immigration and because the labour force is moving to those parts of the euro zone that have stronger economic conditions. Overall, capital spending will increase by 3.5 per cent yearly in 2017 and 2018.
Consumption will keep climbing There are several indications that households will continue to be the main driver of GDP growth. Employment will continue to increase, while retail and car sales will show robust growth. Rising home prices and demand for loans in most countries, combined with consumer confidence which is now at its highest level since spring 2015, will also strengthen the situation. Incomes are now benefiting because major belt-tightening is now past, but purchasing power is meanwhile held back by somewhat higher inflation. Overall real incomes will climb by 1.5 per cent in 2017, but the household savings ratio has been relatively low for the past 3-4 years. This means there is no large savings buffer to draw upon if incomes should grow more slowly than expected. Household consumption will increase by nearly 2 per cent yearly in 2017-2018.

The euro zone
26 │ Nordic Outlook – February 2017
Falling unemployment, low pay increases Unemployment was 9.6 per cent in December 2016: 0.8 per-centage points lower than at the start of the year. The down-turn has been broad-based, although the jobless rate is troub-lingly high in many countries. Italy stands out among the larg-est countries because unemployment rose. Employment in the region has risen by nearly 2 million in the past year and is now close to its 2008 peak. Job growth is fastest in Germany, followed by Spain. An improved growth outlook, as well as expansionary hiring plans, indicates that the positive trend will continue. Meanwhile labour force participation continues to rise, slowing the downturn in unemployment a bit. Unem-ployment will fall from 10.1 per cent in 2016 to 9.6 per cent in 2017 and 9.1 per cent in 2018. We estimate that structural equilibrium unemployment is 8.0-8.5 per cent, but the jobless rate in Germany is very close to equilibrium. Lower unemploy-ment will eventually result in higher wages and salaries, but pay increases in 2017-2018 will remain low. In the euro zone as a whole, they will accelerate from the current 1 per cent to 1.5 per cent in 2018. Even in countries with low unemployment, pay hikes are moderate. German labour unions are calling for around 4.5-6.0 per cent, but pay increases are likely to end up at roughly 2.5-3.0 per cent. Higher inflation will boost pay demands, but these will take time to have an impact.
Inflation temporary near 2 per cent After hovering around zero, inflation has accelerated relatively fast. Between June and December 2016, the inflation rate rose from 0.1 to 1.1 per cent, the highest since autumn 2013. The upturn will continue for another few months. Inflation will reach 2 per cent in spring 2017 before dropping back to-wards 1 per cent late in the year. The upturn is driven largely by energy prices in the wake of oil price increases in 2016, but food prices have also accelerated from depressed levels. A weak euro and higher international prices will keep inflation up in the months ahead. Differences in economic conditions are also having an ever-clearer impact on inflation figures, causing an increasingly apparent headache for the ECB. In December, inflation was 1.9 per cent in Germany and 3.0 per cent in Spain, but 1.6 per cent in France. Inflation according to the harmo-nised index of consumer prices (HICP) will average 1.6 per cent in 2017 and 1.0 per cent in 2018. Core CPI has been
more subdued, staying around 1 per cent in the past 3½ years. Weakly accelerating pay hikes will lead to marginally higher underlying inflation pressure, but core HICP will remain close to 1 per cent in 2017 and 2018.
ECB: Purchases will fall again after summer At the ECB’s latest policy meeting, President Mario Draghi gave with one hand and took back with the other by extending bond purchases for 9 months while reducing monthly amounts to EUR 60 billion. Despite lower purchases, the announcement was interpreted as dovish. Since inflation has finally risen above zero and the growth picture looks somewhat brighter, pressure for ECB stimulus has eased. Also, inflation expec-tations have risen markedly since summer 2016. On the one hand, countries struggling with large public debts, credit market disruptions and political problems still need very loose monetary policy. In the near term, the ECB will thus try to dampen speculation about imminent policy normalisation due to the brighter economic outlook. The ECB’s message that it may boost bond purchases if developments are worse than expected, while stating that it has not discussed the possibility of tapering (lower purchases) if economic data surprise on the upside, leads to an asymmetric picture of its reaction function. This may be hard to justify in the long term. At the least, it is likely that Draghi’s announcement of unchanged purchases throughout 2017 will be challenged by those countries, led by Germany, that want to see tighter ECB policies.
We believe the ECB will stick to its current key interest rate in 2017-2018 but announce in June and decide in September that monthly purchases will be reduced further to EUR 40 billion from October, while extending the programme by a further 3-6 months. Late in 2017 and early in 2018, it will make similar decisions phasing out bond purchases by spring or summer 2018. One argument for this is that it is becoming more and more difficult for the ECB to buy the bonds of certain countries. It is also conceivable that the ECB will speed up its tapering because it sees a diminishing marginal benefit from further purchases, although this will hardly be highlighted in its communication. Important arguments against our forecast that purchases will be tapered in 2017 are our belief that underlying inflation will remain low as well as concerns that euro zone yield spreads will widen.

The United Kingdom
Nordic Outlook – February 2017 │ 27
Political uncertainty will slow economic growth
Article 50 will be activated this spring
Exit negotiations create uncertainty
Pound slide and fiscal policy ease the shock
The decline in growth that was feared as an immediate effect
of the Brexit referendum has not materialised so far. Instead,
monetary easing and a substantial depreciation in the pound
have helped keep economic expansion at close to trend. We
believe that political uncertainty will increasingly slow
future growth, for example via weaker capital spending. This
year it will fall to 1.1 per cent. In 2018 GDP will grow by 1.2
per cent: our forecast is marginally below consensus. The
labour market will also be hurt by rising unemployment, which
will reach 5.3 per cent by the end of our forecast period.
Economic activity in 2017-2018 will be greatly affected by the
shape of UK withdrawal from the EU. Not until now, nearly
eight months after the Brexit referendum, has the government
apparently devised an exit strategy, in the form of a 12-point
programme. Its policy is to withdraw completely from the
EU. The UK’s demands for controls on immigration from other
EU countries, full influence on legislation and the ability to
conclude its own free trade agreements with other regions are
incompatible with “limited membership” such as in the
European Economic Area (EEA), which would otherwise be one
way to give British companies continued access to the EU
single market. Instead, the government intends to negotiate a
free trade agreement with the EU in order to maintain
good EU-British trade relations after withdrawal. A lot is at
stake for the UK, since 44 per cent of exports (or 12 per cent of
GDP) goes to other EU countries.
Prime Minister Theresa May has now been mandated by the
House of Commons (lower house of Parliament) to activate the
exit clause, Article 50 in the Lisbon Treaty. A decision by the
House of Lords (upper house) is expected in early March. There
are thus many indications that the exit process will start soon.
If negotiations head in the direction of a hard Brexit, they
might cause domestic policy infighting at a later stage and a
scenario where the UK stays in the EU cannot be ruled out.
In recent years, household consumption has driven UK
economic growth, but we now fear a slight deceleration.
Consumer confidence has begun to fall. Meanwhile higher
inflation and a weaker labour market are undermining
purchasing power. Year-on-year inflation will peak around
2.5-3 per cent in 2018, and inflation measured as annual
averages will be 2.3 per cent in 2017 and 2.4 per cent in
2018. At the same time, households have gradually reduced
their savings ratio, which rose sharply after the financial crisis.
Room for further reductions ahead is limited, but the
continued weakness of the pound combined with looser fiscal
policy will also ease the economic slowdown. A 12 per cent
depreciation in the pound during the past year is benefiting
exports, whose order bookings still look strong. Yet withdrawal
from the EU will increase calls for fiscal stimulus measures.
Last autumn, the government abandoned its ambition to
achieve a budget surplus by the end of its regular term of
office. It has announced a number of measures including a
gradual lowering of corporation tax to 17 per cent by
2020. More important, however, are new investments in
research and development as well as infrastructure.
Economic growth has not been as weak as the Bank of England
(BoE) feared last summer when it cut its key interest rate to a
record-low 0.25 per cent. Even though inflation is expected to
climb above the BoE’s target in 2017-2018, the central bank
will choose to leave its key rate unchanged until the end of
2018. It will nevertheless stop buying government securities in
February and is not expected to further raise the target for the
size of its bond portfolio. Since the beginning of 2017, the
pound has fallen sharply against most currencies and has lost
nearly 20 per cent against both the euro and the dollar.
Currency trends are uncertain and are likely to continue being
driven by political events. We thus fear a further pound
depreciation this year. The pound is already clearly
undervalued, especially against the dollar. We thus believe that
the pound should eventually appreciate. The GBP/USD
exchange rate will reach 1.30 at the end of 2018, while the
EUR/GBP rate at that time will be 0.83.
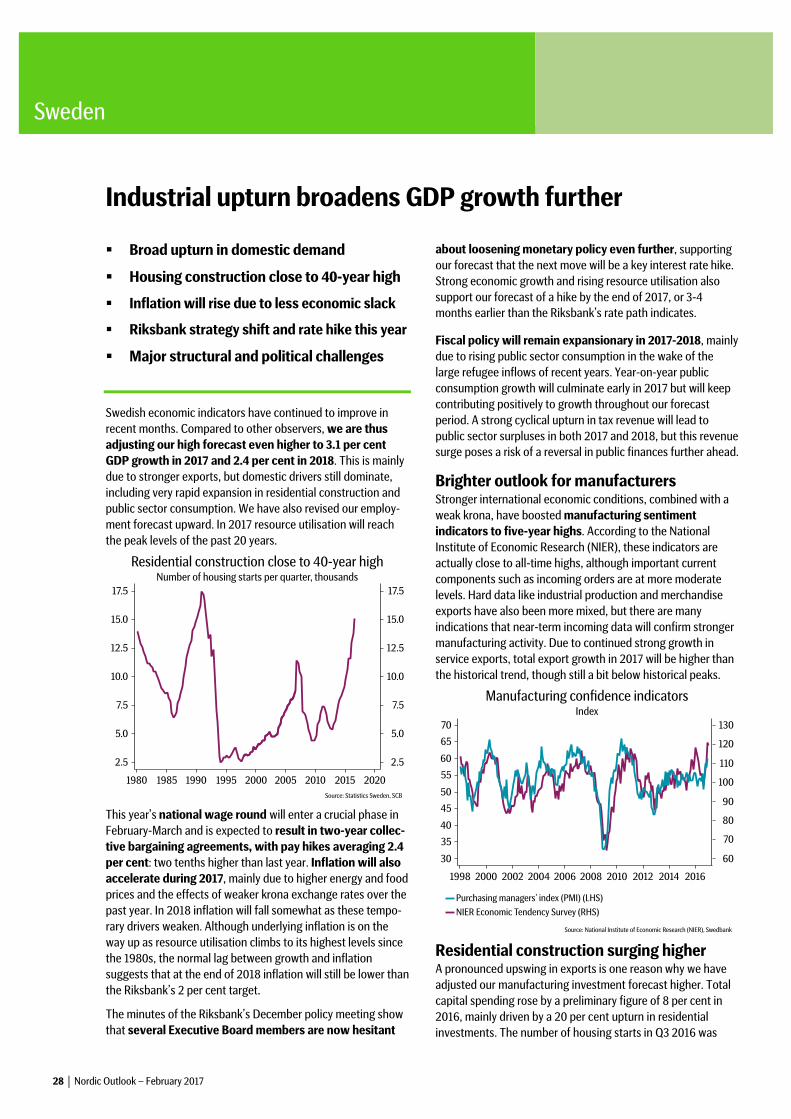
Sweden
28 │ Nordic Outlook – February 2017
Industrial upturn broadens GDP growth further
Broad upturn in domestic demand
Housing construction close to 40-year high
Inflation will rise due to less economic slack
Riksbank strategy shift and rate hike this year
Major structural and political challenges
Swedish economic indicators have continued to improve in recent months. Compared to other observers, we are thus adjusting our high forecast even higher to 3.1 per cent GDP growth in 2017 and 2.4 per cent in 2018. This is mainly due to stronger exports, but domestic drivers still dominate, including very rapid expansion in residential construction and public sector consumption. We have also revised our employ-ment forecast upward. In 2017 resource utilisation will reach the peak levels of the past 20 years.
This year’s national wage round will enter a crucial phase in February-March and is expected to result in two-year collec-tive bargaining agreements, with pay hikes averaging 2.4 per cent: two tenths higher than last year. Inflation will also accelerate during 2017, mainly due to higher energy and food prices and the effects of weaker krona exchange rates over the past year. In 2018 inflation will fall somewhat as these tempo-rary drivers weaken. Although underlying inflation is on the way up as resource utilisation climbs to its highest levels since the 1980s, the normal lag between growth and inflation suggests that at the end of 2018 inflation will still be lower than the Riksbank’s 2 per cent target.
The minutes of the Riksbank’s December policy meeting show that several Executive Board members are now hesitant
about loosening monetary policy even further, supporting our forecast that the next move will be a key interest rate hike. Strong economic growth and rising resource utilisation also support our forecast of a hike by the end of 2017, or 3-4 months earlier than the Riksbank’s rate path indicates.
Fiscal policy will remain expansionary in 2017-2018, mainly due to rising public sector consumption in the wake of the large refugee inflows of recent years. Year-on-year public consumption growth will culminate early in 2017 but will keep contributing positively to growth throughout our forecast period. A strong cyclical upturn in tax revenue will lead to public sector surpluses in both 2017 and 2018, but this revenue surge poses a risk of a reversal in public finances further ahead.
Brighter outlook for manufacturers Stronger international economic conditions, combined with a weak krona, have boosted manufacturing sentiment indicators to five-year highs. According to the National Institute of Economic Research (NIER), these indicators are actually close to all-time highs, although important current components such as incoming orders are at more moderate levels. Hard data like industrial production and merchandise exports have also been more mixed, but there are many indications that near-term incoming data will confirm stronger manufacturing activity. Due to continued strong growth in service exports, total export growth in 2017 will be higher than the historical trend, though still a bit below historical peaks.
Residential construction surging higher A pronounced upswing in exports is one reason why we have adjusted our manufacturing investment forecast higher. Total capital spending rose by a preliminary figure of 8 per cent in 2016, mainly driven by a 20 per cent upturn in residential investments. The number of housing starts in Q3 2016 was

Sweden
Nordic Outlook – February 2017 │ 29
higher than peak levels during the construction boom that occurred around 1990. This suggests that housing invest-ments will keep rising rapidly in 2017; we expect a further upturn of 15 per cent. Rapid population growth will generate continued heavy demand for new homes, but during 2018 there will be a slight deceleration as capacity restrictions begin to make themselves felt. As a share of GDP, residential con-struction will total seven per cent at the end of 2018, which is somewhat higher than the levels in Norway and Denmark before the financial crisis, but still far below the corresponding levels in Spain and Ireland. Other investments continue to increase at a rapid pace, especially in the public sector. Overall capital spending will grow by 7.7 per cent this year and by 4.7 per cent next year. In 2016 it reached its highest share of GDP since 1990, and this share will rise further in 2017-2018.
Public consumption is continuing to grow The population increase is also a strong driver of expanding public consumption. Last year’s growth, more than 3 per cent, was the strongest since the 1980s. Although direct spending for refugee resettlement is falling, there are many indications that public consumption will keep rising this year because local governments are responsible for providing new arrivals who have received residence permits with schooling, health care etc. Year-on-year public consumption growth will nevertheless slow to 2.5 per cent in 2017 and to less than 1 per cent in 2018: somewhat below the historical trend.
Household consumption increased somewhat more slowly than expected in 2016. Despite good fundamentals − job growth as well as rising incomes and asset prices − households are continuing to hold back. Their savings ratio has reached new record levels. This is probably due to worries about a future home price decline (see theme article) as well as low confidence in Sweden’s economic future. But late in 2016, consumer confidence rose clearly, suggesting that the savings ratio is at least on its way towards levelling out and that consumption may thus accelerate this year. One technical factor that has held down consumption in recent years is that in the national accounts, consumption by asylum seekers is recorded as a service export. As asylum seekers receive residence permits, their spending is redefined in a way that boosts household consumption while reducing service exports.
Job growth accelerating from high level Labour market indicators confirm the picture of increasingly strong growth. Hiring plans according to the NIER’s Economic Tendency Survey, for example, have risen to their highest levels since 2011. In other words, the already high number of employees in the business sector appears to be rising further. Together with a continued rapid increase in public sector employees, this means we expect job growth of nearly 2 per cent in 2017; the risks are also on the upside. Since the size of the labour force is also growing, the unemployment outlook is more uncertain, but we expect the upturn in labour supply to culminate soon. This will help the gradual downturn in the jobless rate over the past few years to continue. In the medium term, the labour force will probably increase again as large groups of recent immigrants seek jobs. Because a rapidly rising share of the unemployed were born outside Europe and/or have little formal education, the future unemployment trend will depend more on government structural and labour market policies than on cyclical factors. There are many indications that in the medium term, unemployment will begin to climb again from a relatively high level in historical terms.
Pay hikes will accelerate from low level This year’s national wage round will enter a crucial phase during February and March. Labour union demands are a couple of tenths of a per cent higher than last year, taking into account this year’s extra programmes for low-wage earners. The employer side’s opening bids are also somewhat higher, and we expect negotiations to result in two-year collective agreements with yearly pay hikes of 2.4 per cent: 0.2 points higher than in 2016. Pay increases in addition to collec-tive agreements have been unexpectedly low in the past two years, but the increasingly tight labour market situation suggests an upturn in this area as well. Yet we have adjusted our forecast of total pay hikes two tenths lower, to 2.7 per cent. Our forecast for 2018 is unchanged at 3.2 per cent. In December, CPIF inflation − CPI less interest rate changes − rose to 1.9 per cent, its highest since 2010. The main drivers were higher energy prices and to some extent food prices. Meanwhile core inflation fell to 1.3 per cent in December. Both energy and food prices will continue to push inflation higher during most of 2017. Our forecast of 1.7 per cent CPIF

Sweden
30 │ Nordic Outlook – February 2017
inflation is somewhat higher than the Riksbank’s. The core inflation outlook is more modest this year, however. Base effects from unusually large price increases for services in January 2016 (partly explained by indirect taxes) suggest that core inflation will fall towards one per cent in January 2017, but during the year inflation will rise gradually – driven by the weaker krona and to some extent by rising pay.
A rising rate of pay increases and accelerating international prices will push CPIF inflation higher in 2018. Meanwhile the contributions from energy prices and exchange rates will shrink compared to 2017, resulting in an average CPIF upturn of only 1.6 per cent. Because international prices have shifted from falling to rising, there is a higher probability that inflation will climb to 2 per cent, but the historical pattern suggests that inflation will not rise above the Riksbank’s 2 per cent target until the economic upturn is about to culminate.
Repo rate hike late this year Although inflation will fall below target in 2018 as well, we are sticking to our forecast that the repo rate will be hiked late in 2017. According to our forecast, economic growth and the labour market will both be considerably stronger than in the Riksbank’s December 2016 estimate. Meanwhile resource utilisation is continuing to climb and rapidly approaching its
peaks of the past 20 years. Recent Riksbank’s Monetary Policy Reports have highlighted the significant historical time lags between high resource utilisation and inflation. The Riksbank should thus be able to feel greater confidence that eventually inflation will actually rise. There are also clear signs that an increasing number of Executive Board members are emphasising the downsides of further monetary policy easing.
However, it will take time for the Riksbank to shift away from today’s bias towards further monetary easing and move closer to hiking its key interest rate. Although this year’s inflation is being driven by temporary factors, we still believe that the combination of rising long-term inflation expectations and ever-higher resource utilisation will gradually make rate hikes more acceptable. Over the next six months, we expect the Executive Board to remove the downside risk in the Riksbank’s rate path, shifting next autumn towards signalling that monetary policy will begin to be tightened. We are sticking to our forecast that a first repo rate hike to -0.25 per cent will occur in December 2017, 3-4 months earlier than in the current rate path. After that, we foresee two further hikes in 2018 to +0.25 per cent, unchanged since our earlier forecast.
Another factor that suggests such a course is that the Financial Supervisory Authority (FSA) is now openly appealing to the Riksbank to “lean against the wind” and take financial stability into account in its monetary policy, though the bank has not shown any responsiveness on this issue. An examination of how the Riksbank acted in earlier cycles shows that the key rate has been hiked earlier than signalled and that inflation has generally been below-target when tightening has begun. A potentially stronger krona due to rate hike signals is a downside risk for our rate forecast. The Executive Board seems unanimous in believing that it should take action if an overly rapid krona upturn threatens the chances of meeting its target.
Krona will appreciate due to key rate hikes The interplay between rate hikes and krona responses will determine exchange rate movements in 2017. In the short run we are making a cautious assessment of appreciation potential. Although the Riksbank’s Executive Board was divided at its December meeting about continued loosening, it will be some time before we see any clear signal that a more

Sweden
Nordic Outlook – February 2017 │ 31
neutral or hawkish stance is imminent. A negative repo rate and continued QE purchases are not krona-friendly, and the response to strong macroeconomic data has already driven the KIX trade-weighted index to a level 3 per cent stronger than in the Riksbank’s forecast. Further appreciation of a few per cent would undoubtedly trigger dovish comments from the Board.
But in the long run, we see continued solid reasons why a strong Swedish balance sheet will allow clearer appreciation. If the Riksbank delivers rate hikes in line with our forecast, the EUR/SEK exchange rate should be around 9.00 by year-end, continuing down towards 8.75-8.80 by late 2018. Corresponding USD/SEK rates will be 8.70 and 8.15. The krona probably has such strong long-term defensive qualities that it could appreciate even if global growth slowed. Only in a domestically generated crisis scenario do we see risks of a renewed EUR/SEK depreciation towards around 10.
Continued strong public sector finances Despite increased costs related to integration and migration policies, the public sector showed a slight surplus (0.2 per cent of GDP) in 2015 after six years of deficits. High growth, also driven by heavily taxed components of the economy, has pushed up tax revenue more than expected. We expect surpluses of just above zero in 2017-2018 as well. Tax revenue will keep rising at a fairly rapid pace, but because of spending pressures and reforms ahead of the September 2018 election, net lending will not improve further in keeping with the normal cyclical pattern. Although direct refugee resettlement costs will fall, pressure on labour market and integration programmes will remain heavy. There will also be spending pressure from the police, defence forces and other areas. As responsibility for new migrants shifts increasingly to local governments, we also foresee sharply higher grants to the county and municipal sectors during 2017-2018 (see the theme article in Nordic Outlook, November 2016). Ahead of the election year 2018 it is also likely that unexpectedly strong finances will be one reason why the government will unveil an expansionary budget next autumn. We expect about SEK 20 billion worth of reforms for next year, which implies that fiscal policy will be weakly expansionary in both 2017 and 2018.
The central government is now showing a big budget surplus − SEK 85 billion in 2016 (2 per cent of GDP) − but the surplus was driven artificially high because households and companies used their Swedish Tax Agency accounts as a bank. This is one reason why there is an unusually wide range of views about central government finances today. The National Debt Office (NDO) expects the big 2016 surplus to turn into a deficit of SEK 33 billion in 2017, but we believe the NDO is too pessimistic about both tax revenues and 2017 GDP growth (NDO 1.9 per cent vs SEB 3.1 per cent). We expect a continued surplus of SEK 25 billion this year. In other words, we are forecasting a 2017 government borrowing requirement a full SEK 60 billion lower than the NDO’s December forecast. Other forecasters such as the National Financial Management Authority (ESV), the NIER and the Finance Ministry are closer to our numbers when it comes to central government finances.
Public finances Per cent of GDP
2015 2016 2017 2018 Net lending 0.2 0.5 0.3 0.1 Borrowing req., SEK bn 33 -85 -25 -20 Gen. gov’t gross debt 43.9 40.7 38.7 36.8 Source: Statistics Sweden, SEB
The Social Democratic-Green Party government’s weak parliamentary base was underscored when Ann Kinberg Batra and her Moderates, largest of four parties in the non-socialist Alliance, declared that she was prepared to introduce a joint Alliance budget as early as this year, thereby forcing the resignation of the government. It is no coincidence that this initiative occurred now, since the Moderate leadership is under pressure from internal forces, especially the party’s youth organisation, which want to force the minority government out of office. After the Centre and Liberals, which are also part of the Alliance, rejected Batra’s plans, our main scenario is that the government will stay in power until its term ends in September 2018. The opposition may try to harass the government further during next autumn’s budget process in order to show it is actively pursuing its policies and that the government has only a weak mandate. The Social Democrats may also be less inclined to enact measures that the Alliance might perceive as provocative, for example in tax policy.
Batra’s initiative may also open up the political field and at least provide a hint about how future political positioning will look. The Moderates are taking steps towards accepting support from the right-wing populist Sweden Democrats, which the Centre and Liberals reject. These cracks in the Alliance are thus also opening the way for speculation about alternative governing coalitions after the 2018 election. The probability of a leftist-Alliance coalition has thus increased a bit, although the “middle” parties (Centre and Liberals) would certainly be very reluctant to split the Alliance by joining a government with the Social Democrats. It thus remains difficult to foresee a strong post-election governing constellation that can bring an end to the current paralysis caused by the kingmaker role of the Sweden Democrats.

Theme: The risk of a Swedish bond shortage
32 │ Nordic Outlook – February 2017
Shrinking bond issues, due to strong central government finances
Bond supply, excluding Riksbank holdings, is falling towards 10 per cent of GDP
Supply shortage will squeeze yield spread against Germany during next six months
Liquidity premium may amplify yield upturn in long term
The Riksbank’s stimulative bond purchases have so far not had any serious consequences for liquidity in the Swedish fixed income market. One reason is that foreign market players began selling off their holdings when the Riksbank initiated its purchases. But today we see a greater risk that a supply shortage may emerge. As a consequence of stronger finances, this year the Swedish National Debt Office (NDO) is likely to gradually decrease its auction volumes from SEK 3 billion to 2 billion per two-week period. As a result, during 2017 the outstanding volume of bonds would shrink by nearly SEK 20 billion. However, one caveat in these calculations is that uncertainty about the 2017 budget balance and government borrowing requirement is abnormally high. This is mainly because part of the large budget surplus (just over 2 per cent of GDP) in 2016 is explained by both households and companies using their tax payment accounts as bank accounts due to favourable interest rate conditions. In January the interest rate on all tax accounts was lowered to zero, which means that the balances will presumably decrease, contributing to an increased borrowing requirement. But there is great uncertainty regarding both the extent of overpayments to tax accounts and how quickly they will be withdrawn.
Since the Riksbank is continuing to buy bonds, the supply of outstanding central government bonds aside from its holdings will decrease by nearly SEK 50 billion in 2017. The supply of outstanding bonds (excluding Riksbank holdings) will be 40 per cent lower at the end of 2017 than when its purchases began in 2015. There are many indications that over the next six months, the Riksbank will find it increasingly difficult to find sellers in its reverse auctions. During 2015 it was mainly foreign bond holders who drew down their positions, and during 2016 it appears as if banks and the Swedish national pension funds sold bonds. Private pension and life insurance companies, which hold a very large share of the remaining bonds, instead appear to have increased their holdings. Our assessment is that it is very doubtful that they are willing or able to reduce their holdings in the future. Continued Riksbank purchases and increasingly unwilling sellers will hold down bond yields in the near term, causing the 10-year yield spread against Germany to shrink to 20 basis points during the spring.
Liquidity premium may amplify upturn Once the Riksbank’s bond purchases end in June and the central bank signals that it will hike its key rate, however, the yield spread to Germany will widen again. Towards the end of 2017, there is also a great risk that the upturn in yields will be amplified by a liquidity premium on Swedish securities when the supply of outstanding nominal bonds (excluding Riksbank holdings) falls below 10 per cent of GDP. Taken together, our forecast implies that the 10-year spread against Germany will again widen to 50 basis points at the end of 2017 and further to70 bps at the end of 2018. This implies a yield of 1.25 per cent at the end of 2017 and 1.95 per cent at the end of 2018.

Denmark
Nordic Outlook – February 2017 │ 33
Changing growth composition
New data solve growth puzzle
Credit standards are being tightened
We expect exports to drive growth higher
In light of the new quarterly national accounts, we have revised our growth expectation to fit the new data. Over 2014 and 2015 GDP growth has been upgraded by a full percentage point. The revised data paint a picture much more in line with other indicators: The recovery has been stronger and faster than previously thought. Hence, a discussion is starting to take place as to whether or not overheating is becoming an issue. In our view, we are still 3-4 years away from both competitiveness and debt becoming a problem.
Nonetheless, measures have been and are being taken to lean against the economic tailwinds. The discretionary part of fiscal policy is expected to tighten slightly over the forecast horizon and banks have already started to do more prudent lending, partly after prodding by the FSA. Consumers have faced increasingly strict credit standards since late 2015. In 2016, confidence declined and spending stagnated.
These headwinds are also likely to hold consumption back in the first part of 2017, but should fade over our forecast horizon, while employment and real wages are expected to continue improving. We are thus forecasting weak average private consumption growth of 1.1 per cent in 2017, rebounding to 2.0 per cent in 2018.
Consumption has been soft, but foreign demand seems to be strengthening, Danish competitiveness is strong and credit
standards are actually being loosened for firms. Hence, we think net exports will be a dominant source of expansion in 2017. As the housing market continues its recovery and the output gap slowly closes, we also expect capital spending to pick up. Right now, we estimate that the economy will expand at a pace of roughly 2 per cent 2017, picking up in 2018 as consumption contributes a larger share again.
This level of growth is optimistic in light of recent history, but we still expect nominal wage growth to remain at 2 per cent a year. The labour market has proved quite elastic in recent years, having expanding at 10,000 jobs per quarter and has only exerted a small downward pressure on unemployment, which now hovers above 6 percent. We expect inflation to slowly accelerate towards an average of 1.4 percent in 2018.
The outlook for capacity utilisation, unemployment, private sector wage growth, broad inflation, the housing market and credit growth all suggest the economy has ample room for further expansion with no imbalances requiring urgent action. The FSA’s precautionary tightening has helped avoid such excesses, so there is little need for fiscal tightening in 2017.
The krone is currently trading at the strong end of its peg against the EUR. We think this will continue, since both external and internal balances are solid, exerting downward pressure on money market rates.
Our economic forecast is upbeat and reflects the fact that most global indicators keep pointing to higher growth. Should this fail to materialise, our forecast is likely to be too optimistic. On the other hand, we expect households to maintain a high savings ratio due to tight FSA credit conditions. A change of course here is the main upside risk to the forecast.

Norway
34 │ Nordic Outlook – February 2017
Norges Bank’s policy dilemma
Oil sector investments a drag, but mainland domestic demand remains firm
Sharply higher home prices a downside risk
Rapidly falling inflation delays rate hikes
The Norwegian economy started its recovery from the oil slump last winter in line with rebounding sentiment indicators. The turn was home-made and led by a jump in mainland capital spending, with non-oil domestic demand rising 2.7 per cent in the third quarter from a year earlier. The economy has certainly weathered the downturn better than most feared, but activity will remain below normal in the next couple of years. A somewhat better momentum is expected in 2017, since growth in mainland GDP likely improved somewhat further in the fourth quarter. The national accounts for Q4 and the full year will be published on February 9. Rebounding private consumption in line with real disposable income growth should help to sustain the recovery and give it a broader base.
The contraction in oil sector capital spending has not yet bottomed out, and the drop this year is now expected to be somewhat larger than we forecast in the November edition of Nordic Outlook. The drag from petroleum investments is still expected to gradually diminish, but the downbeat investment outlook is holding back the recovery in petroleum-related manufacturing and exports. The outlook is thus still marked by strong crosscurrents. We are lowering our growth forecast for mainland GDP slightly to 1.6 per cent in 2017 and 2.0 per cent in 2018. Total GDP should be up 1.1 per cent in 2017 (1.3 per cent in the November report) and 1.7 per cent in 2018.
Fiscal expansion continues, although at a more moderate pace; the government’s budget for 2017 implies that the fiscal contribution to mainland GDP will drop from 0.8 per cent last year to 0.4 per cent in 2017. The upcoming general election in September is likely to be a close race between the ruling right-wing minority government and the opposition. The broader contours of fiscal policy are nonetheless likely to remain intact.
Oil sector investments remain a drag Capital spending in the petroleum sector has been in deep contraction in recent years. Judging by Statistics Norway’s latest oil investment survey there will be no imminent turnaround. Operators on the Norwegian continental shelf estimate nominal investment of NOK 146 billion in 2017, implying a 13 per cent decline from the expected level in 2016. Since overall price deflation in the sector is now starting to flow through, the decline is more likely a reflection of cost cuts to nominal spending rather than any similar reduction in activity. We have adjusted our 2017 forecast for capital spending in the petroleum sector lower to 9.5 per cent (previously -6.5 per cent). We are leaving our 2018 forecast unchanged at 3 per cent since improved project economics and very low reserve replacement ratios are likely to trigger more final investment decisions in the coming years.
Weakness in the petroleum-related supply industry has contributed to sequential declines in manufacturing output over the past eight quarters. Hence, the follow-through from the initial rebound in survey-based indicators early last year has been disappointing. While improving, the latest Business Tendency Survey is consistent with ongoing sub-par activity in the manufacturing sector. However, non-petroleum sectors should recover further, as indicated by both orders and production expectations lifting to more normal levels.
Exports of traditional goods have been disappointing, reflecting the large share of such shipments indirectly related to petroleum. The cyclical turnaround taking hold among Norway’s trading partners suggests that export growth is about to resume, but a stronger krone will dampen the upturn. Since non-oil imports should start to recover, we believe net foreign trade will make a fairly neutral contribution to mainland GDP.
Mainland demand driving the upturn The strong recovery in mainland capital spending has been vital for the upturn in non-oil domestic demand. Residential investments showed solid 10.2 per cent year-on-year growth in Q3 2016 and the strong rise in home prices and housing starts suggests a further rise. We expect strong growth in such investments this year, although the annual average should be

Norway
Nordic Outlook – February 2017 │ 35
slightly down from 2016. Non-oil business investments bottomed out last autumn, following weak performance over the past years. Depressed manufacturing capacity utilisation makes a strong recovery unlikely, but capital spending in the sector should no longer contribute negatively to growth.
The momentum of private consumption slowed over the first three quarters of 2016, due to stalling domestic demand for goods. This was accompanied by decelerating real disposable income growth. Several fundamental factors suggest a recovery in overall consumption during 2017; an increase in real wages, improving employment growth and expansionary fiscal policy will all add to household income. Moreover, while the sharp increase in home prices has helped to lift consumer confidence, it has yet to have an impact on household spending. Rebounding goods consumption should be accompanied by a slight moderation in spending on services from high levels. We expect overall private consumption of 2.0 per cent in 2017 and 2.5 per cent in 2018, unchanged from our November forecast.
Unemployment has peaked The rise in registered unemployment was surprisingly benign last year, considering the earlier increase in layoffs. We expect most labour cuts within petroleum-related sectors to be past and believe that registered unemployment has peaked. Unemployment according to the Labour Force Survey stabilised last autumn, driven by a contraction in the labour force. Employment fell 0.1 per cent on average in 2017, the weakest outcome since 2009. Unsurprisingly, job growth was weakest in the manufacturing sector while public employment offset the overall downturn. The recovery in employment is expected to be slow in coming, given below-trend growth in the economy. Since the labour force is expected to increase in line with job creation, the decline in the LFS unemployment rate will be very gradual. LFS unemployment should average 4.7 per cent in 2017 and 4.6 per cent in 2018.
Higher supply dampens home price gains Existing home prices accelerated throughout 2016 and were up 12.8 per cent in December from a year earlier. In Oslo, prices rose more than 20 per cent. While prices seem a bit inflated relative to the historical trend, there are fundamental reasons for the upturn such as record-low interest rates and years of constant under-supply. Low interest rates will remain supportive, but following very strong gains in housing starts over the past year, completions are on course to catch up and exceed household formation in 2017. There are already signs that the momentum of the price upturn is stabilising. An improving supply-demand balance will eventually put a lid on existing home prices. On a national basis we expect positive home price growth in 2017 and stabilisation in 2018.
The sharp acceleration in home prices makes it easy to sympathise with the assessment of Norges Bank that “the rapid rise in house prices and household debt has increased the risk of a sharp fall in demand further out”. Norwegian households historically have a large share of their savings in housing, making private consumption vulnerable to any hefty
price corrections. While not our main forecast, one cannot disregard a 2013-like scenario in which fears of a larger correction drove up the supply of homes for sales, resulting in a short-lived price decline (since demand remained solid). Hence, the housing market and rising household debt levels now appear as a downside risk to the economic outlook.
In response to rising household debt levels, late last year the government introduced new mortgage lending rules effective from 2017. The introduction of a cap on total debt, equivalent to five times annual gross income, will make it more difficult for first-time buyers to enter the market. Moreover, a 40 per cent equity requirement on second homes in Oslo will limit speculative buying in the capital. Since the rules only apply to new mortgages we expect no immediate effect. Over time, however, it will help to slow the rise in prices.
Inflation falling rapidly After having been significantly above the 2.5 per cent target for most of last year, the inflation rate adjusted for energy and taxes (CPI-ATE) fell rapidly in late 2016 and returned to target in December. The high inflation rate in recent years is mostly attributed to the previous krone depreciation, which resulted in inflation on imported goods occasionally rising above 4 per cent. Such inflation started to moderate last autumn, although the annual growth rate in December remained above 3 per cent. The turnaround to a higher-trending krone at the start of 2016 suggests that the inflation rate for imported goods will continue to gradually ease. We expect the annual rate of change to fall to zero towards the end of the year.
Domestic inflation has been considerably more subdued, and price increases have been slower than normal. Wage growth has slowed in recent years and although some acceleration is likely, domestic inflation will remain subdued. We expect CPI-ATE inflation to fall to 2 per cent over the next 6 months and further to around 1.5 per cent by year-end. In 2018, we expect a gradual acceleration, driven by waning downward pressure from imported inflation. Total CPI will rise faster than CPI-ATE this year due to rising energy prices.
Norges Bank’s balancing act The key interest rate trough was reached last March when Norges Bank lowered the key rate to 0.50 per cent. The bank’s rate path still holds a dovish bias, but heightened risks related to the housing market and household debt strongly suggest no rate cut. Meanwhile, the need for a more stimulus will diminish in line with recovering economic activity. Focus will thus gradually shift towards a neutral policy and the timing of the first rate hikes. Such a policy shift will, however, be questioned given rapidly falling inflationary pressure. Our downward adjusted CPI-ATE forecast is below Norges Bank’s for most of 2017 and 2018. We expect the bank’s policy focus to gradually shift from growth- to inflation-oriented. Unlike other central banks, which have dug more deeply into their toolkits, the bank will thus be in no rush to reverse policy. We now expect Norges Bank to remain on hold until a first hike in December 2018. (See the “International overview” for implications on the NOK and Norwegian government bonds).

Theme: Norway’s debt ratio cap – lessons for Sweden?
36 │ Nordic Outlook – February 2017
Similar 20-year home price upturns in Sweden vs Norway and Stockholm vs Oslo
Cap on debt-to-income ratio and regional differentiation in Norway
Greater obstacles to introduction of macroprudential measures in Sweden
Sharply rising home prices in Sweden and Norway pose risks to financial and macroeconomic stability. Looking back 20 years, price trends in Sweden and Norway have largely gone hand in hand. The trends in the capital regions of Stockholm and Oslo also resemble each other. Yet so far the two countries have dealt with the issue in rather different ways. In Sweden both the Financial Supervisory Authority (FSA) and the Riksbank are mutually appealing to each other to implement steps that may slow the price increase, but both feel they are themselves prevented from acting. In Norway, however, a number of new rules have been introduced. These are partly regional in nature, since they try to deal with the especially rapid home price increases in Oslo. The latest addition is a cap on the debt-to-income ratio and rules governing purchases of more than one residence.
In Denmark, the situation is a little different. After a sharp home price downturn because of the financial crisis, the market has recovered noticeably, especially in the Copenhagen region, where prices of flats are now above their previous peak. To prevent a new bubble, Danish authorities have imposed far-reaching restrictions on lending to households and for homes. At present, we see a risk that they will become so far-reaching that tight credit conditions will hamper general economic growth, especially if combined with tight fiscal policy.
Norway: Repayment requirement, debt ratio cap and tougher rules in Oslo To get a handle on higher household debt and reduce consumer vulnerability, the Norwegian government has introduced new and tougher rules on new home mortgage loans starting on January 1, 2017. The rules are temporary and are effective until June 30, 2018. They spell out clear bank lending requirements, while giving banks a degree of flexibility in making exceptions from the requirements and deciding for themselves what sound lending practices are. One reason is to make it easier for young people to become first-time home buyers. Since home prices have climbed fastest in the city of Oslo and since buy-to-let is very common in the Oslo region, there are special rules for the capital. These rules are also designed to give banks a degree of flexibility in their lending.
The following applies throughout Norway: - A debt ratio cap of 5 times gross income. - Principal repayments are required until the balance falls to a 60 per cent loan-to-value (LTV) ratio. The minimum requirement is 2.5 per cent yearly, or the cost of a 30-year annuity loan, whichever is lower. - Banks are still given flexibility in granting loans above the limits to 10 per cent of their mortgage customers by volume.
Special City of Oslo rules (in addition to the above): - A 40 per cent cash down payment i2 required when buying a secondary residence in Oslo (15 per cent in the rest of Norway). - Banks are given flexibility in granting loans above the limits to 8 per cent (previously the limit was 10 per cent) of mortgage customers per quarter, or up to a maximum of NOK 10 million per individual loan.
Denmark: Tighter rules in Copenhagen Surveys among banks and mortgage institutions show a clear tightening of household lending conditions since the end of 2015. This has coincided with a slowdown in credit demand,

Theme: Norway’s debt ratio cap – lessons for Sweden?
Nordic Outlook – February 2017 │ 37
despite keen competition among lenders. In January 2016 the Danish FSA issued special instructions related to debt ratios for regions with high and rapidly rising home prices, currently including Copenhagen and vicinity plus Århus. Among other things, they state that households with large loans in relation to income (ratios between 4 and 5) must be able to cope with a home price decline of 10 per cent, and households with debt ratios above 5 must have a positive net worth even after a 25 per cent home price decline. As in Norway, banks have some flexibility to make exceptions from the rules. For example, this applies to households with high job security and fixed interest loans that are being paid off, as well as young people in the education system with good future prospects of a job. Denmark imposes an 80 per cent loan-to-value cap on home mortgages, plus a 5 per cent cash down payment requirement. The FSA also has rules on the composition of loan portfolios at individual mortgage institutions, for example regarding LTV ratios and the share of fixed versus floating loans.
Continued imbalances in Swedish market After new loan repayment (“amortisation”) requirements were introduced in Sweden in June 2016, the growth in household lending fell from a year-on-year rate of nearly 8 per cent to a bit above 7 per cent (December). The strong increase in residential construction − of which nearly 50 per cent consists of single-family homes and tenant-owned cooperative units − suggests continued heavy demand for loans during 2017-2018. This illustrates how difficult it is to regulate lending given the current situation of the Swedish housing market. It is also important to factor in the Riksbank’s interest rate policy when evaluating effects and the need for tougher macroprudential regulations. As shown in the above chart, the correlation between the Riksbank’s key interest rate and lending has been relatively strong during the past decade. Between late 2009 and early 2011, for example, short-term household mortgage rates tripled from 1.5 to 4.5 per cent, which caused lending growth to decelerate from about 9 to less than 5 per cent while home prices levelled out. Rising debt actually suggests that interest rate sensitivity has increased, but the small rate interest hikes that we foresee in 2017 and 2018
will hardly slow down lending very much. This indicates that the need for macroprudential measures will persist.
Worse political gridlock than in Norway Although its need for macroprudential measures is as least as great as that of neighbouring Nordic countries, Sweden requires a substantially more lengthy process to get them in place. There may be several reasons for this. Since 2010 Sweden has had weak governments. Since housing policy is traditionally characterised by major ideological impasses, in this environment it has been especially hard to achieve broad agreements across the left-right political divide. The climate of cooperation between Swedish government agencies may also contribute to this gridlock. Since the Swedish FSA was assigned the main responsibility for macroprudential tools a few years ago, the Riksbank (which previously handled these matters) has gradually and almost demonstratively focused on meeting its inflation target and has absolved itself of responsibility for excesses related to the residential market and household borrowing. Meanwhile events have shown that the FSA’s legal authority to undertake macroprudential actions is limited and that it will now need parliamentary approval to ensure that it can actually use its potential tools.
Swedish public discourse also seems to focus more than that of neighbouring countries on the downsides of mortgage lending restrictions. This is true, for example, of rules that make it more difficult for young people to buy their first home. Instead it has been easier to retain regulations that make it harder to buy homes for speculative purposes. In spite of this, the speculative element of new tenant-owned cooperative construction has become so big that it has become a vital part of discussions about bubble risks. A rapid population increase has contributed to a much larger housing shortage in Sweden than in other Nordic countries, which has also played a part in slowing changes in policy. This leads to underlying ambivalence, since it is not so easy to design restrictions in ways that actually tighten lending without jeopardising a much-needed upturn in housing construction.
The most urgent concrete issue today is a debt ratio cap. The FSA expects legislation allowing the introduction of such a cap to be in place during 2018, which we also believe will happen. In Sweden, public discourse has mainly focused on formulating the cap to reflect disposable rather than gross income. In practice, one can argue that such a debt ratio cap already exists, since most Swedish banks already include some form of cap in their lending standards. But formalising exceptions to the regulations, as in Norway, might help ease certain undesired side effects such as making it harder for young people to buy their first home. Measures aimed at slowing the growth of household debt which are the direct responsibility of Parliament and the government − such as reducing mortgage interest deductions − are unlikely to be enacted before the September 2018 election. To summarise, all indications are that household debt will continue to increase. Our estimate is that home prices will climb another 5-10 per cent in 2017.

Finland
38 │ Nordic Outlook – February 2017
Broad-based acceleration
Better future prospects
Industrial production is increasing again
Rising inflation will squeeze households
The Finnish economy has (finally) accelerated, leaving stagnation behind. The outlook seems much better than before, yet the recovery is slower than average euro zone growth. As elsewhere in the euro zone, sentiment has recently improved. Industrial production rose in 2016 for the first time in several years and the order situation is better. Households are an important growth engine. Confidence has climbed noticeably, but stubbornly high unemployment combined with tight fiscal policy and rising inflation will hold back real income increases and thus also the potential for a consumption upturn. We are revising our overall GDP growth forecast upward to 1.5 per cent in 2017 and 1.6 per cent in 2018.
Indicator improvements are broad-based but are clearest in the manufacturing sector, which has performed weakly for some years. According to the European Commission’s ESI survey, manufacturing confidence is at its highest since mid-2011. Industrial production is now rising for the first time in years and is expected to speed up further, among other things due to somewhat better overall economic conditions in the euro zone. Although exports remain weak, imports are even weaker. Improved competitiveness will benefit exports even if this effect is slow in materialising. Shrinking inventories have recently held back growth, which may be one reason behind weak imports. Looking ahead, smaller inventories may indicate potentially faster-than-expected production increases, now that businesses and households are more optimistic.
Capital spending has climbed, but it is mainly driven by higher residential construction. Home prices have fallen slightly for several years and new construction has been low. Now that prices have started rising again and household optimism has improved, an underlying shortage of homes has led to increased construction, especially in major cities. The number of building permits is trending higher, indicating a further upturn ahead. In other sectors, the capital spending outlook remains weak. Capacity utilisation is still relatively low, as is lending to non-financial companies, but low interest rates and rebounding production suggest somewhat higher investments outside the housing sector as well. We predict that total capital spending will grow by about 2 per cent yearly in 2017 and 2018.
Unemployment has been unchanged at 8.7 per cent for several months. This is not unexpected, given its earlier rapid decline, which is now expected to resume. Employment is increasing but remains well below earlier peaks. Meanwhile there are more and more job vacancies, raising questions about mismatches between job seekers and openings and to what extent skills training programmes can cope with structural change. Unemployment will continue falling to annual averages of 8.4 per cent in 2017 and 8.1 per cent in 2018.
Consumer confidence is at its highest level since February 2011, which is an upside risk to our forecast, but the main improvement has been in optimism rather than in how people perceive the current situation. One reflection of this is that the upturn in retail sales and consumption has still been rather modest. Job growth is an important positive factor, but last summer’s Competitiveness Pact in the labour market has held back pay hikes. Inflation will accelerate from around zero in 2015-2016 to 1.5 and 1 per cent respectively in 2017 and 2018, which will also limit real income increases. The household savings ratio is low at present, heightening sensitivity to disappointing incomes and also holding back consumption. Household consumption growth will remain at about 1.5 per cent yearly in 2017-2018.
Public sector finances are still being squeezed, but the budget deficit will slowly shrink to 2.0 per cent of GDP in 2018 compared to 2.5-3.0 per cent in recent years. Gross government debt will continue increasing to nearly 68 per cent of GDP in 2018. The Competitiveness Pact requires belt-tightening among households in the short term, but their situation is being eased by tax cuts in 2017. Looking ahead, the Pact will have positive effects on the economy by means of lower production costs, which will benefit exports.

Estonia
Nordic Outlook – February 2017 │ 39
Growth outlook cautiously positive
Higher capital spending will drive growth
Labour market remains strained
Last year, Estonia’s economic growth again did not meet expectations. According to SEB’s estimates, GDP grew by a meagre 1.3 per cent. However due to the positive outlook for exports and capital spending, GDP growth should climb to 2.2 per cent in 2017 and 3.1 per cent in 2018.
Weak growth arises from the structure of the economy. Although gross capital formation has shrunk during most quarters since 2013 as a share of GDP, Estonia ranks third among EU member states. Increased imports of capital goods and a surge in corporate lending early in 2016 raised hopes that the low tide of investments had come to an end. Indeed, capital spending in the second quarter surged by 5.6 per cent; however it dropped by 8.4 per cent drop in Q3. The outlook for the next two years is nevertheless positive. Public sector investments should increase in both 2017 and 2018. Demand for housing also remains high. The recovery in business investments is the most uncertain part of the equation, but with capacity utilisation at its highest level since 2007 and corporate lending on the rise, there is good potential for investments to expand. We estimate that gross fixed capital formation will increase by 3.8 per cent in 2017 and 4.5 per cent in 2018.
Exports improved markedly in 2016. During the first three quarters, exports of goods and services surged by 3.8 per cent in real terms. However, growth has not been broad-based. Export of goods increased mainly thanks to the recovery of
electronics and shale oil sales, which involve a few large companies. Core sectors of the economy were actually doing better in 2015, since export growth has decelerated in the wood processing industry and turned negative in the metal industry. Due to marginally better import forecasts for Estonia’s main trading partners, export growth is expected to be around 4 per cent during the next two years.
The largest concern for the economy continues to be the labour market. While the sales revenue of non-financial enterprises increased by a meagre 1.7 per cent during the first three quarters of 2016, average wage growth climbed to 7.6 per cent. Compensation to employees is approaching 50 per cent of GDP, far above the levels in the other Baltic countries, but also in Sweden. As the mismatch between the growth of business revenues and salaries has already lasted for some time, the consequences have been long-awaited. The adjustment may have started in Q3 as the unemployment rate rose to 7.5 per cent from 6.5 in Q2 and 5.2 per cent in Q3 2015. At the same time, the number of vacancies has increased. In Q3 the rate of job vacancies stood at 2 per cent, the highest level since 2008. Some relief to the strained labour market has been the turnaround in population. For two consecutive years, population has grown thanks to positive net migration. There is also an ongoing policy reform to bring a large number of people with reduced working ability back into the labour market. In the short term at least, that may instead show up as higher unemployment, since there is a lack of suitable jobs. We expect the unemployment rate to reach 8 per cent in 2018. As unemployment remains below its natural rate, nominal wage growth is expected to remain high in 2017. However, real income growth will be more subdued, since the surge in excise duties will drive the harmonised consumer price index up by 2.8 per cent this year and 2.7 per cent in 2018.
Estonia’s new government, in office for more than two months now, has focused on income equality and plans to pursue a more expansionary fiscal policy to boost growth. One of its biggest reforms will be a higher threshold for charging personal income tax. Today personal incomes above EUR 180 are taxed at a flat rate of 20 per cent. Starting in 2018 the threshold will rise to EUR 500 for incomes below EUR 1,200, after which the tax-exempt minimum will gradually start to decrease. This will have a significant effect on real incomes and private consumption, with the latter reaching a 4 per cent growth rate in 2018. Lower taxation of low income earners has long been advised by international institutions, while the need to boost domestic demand with higher public sector investments will remain a bone of contention.

Latvia
40 │ Nordic Outlook – February 2016
Brightening prospects despite structural problems
EU funds, consumption and exports will boost GDP growth in 2017
Focus turns to tax system reforms
Faced with a wide range of challenges, the Latvian economy got stuck in a low-growth gear in 2016. One major reason for the slowdown was a delay in disbursement of EU funds, which led to a fall in construction spending by 20 per cent, peeling off 1.1 percentage points from real GDP growth. The recession in neighbouring Russia also acted as a drag on growth, although its negative effects are dissipating. Lingering uncertainty weighed on the real estate market, consumption and investment activity. Yet available fourth quarter data indicate increasing activity, with retail sales, industrial production and exports surging in November, a trend that we expect to continue this year. Our forecast is that GDP will grow by 3.5 per cent in 2017 and 2018, up from 1.6 per cent in 2016.
Growth prospects for the coming two years are based on increasing EU funding inflows that will accelerate growth by activating investments and pulling up consumption. A rebound in construction activity will also be driven by several large private projects. An uptick in global sentiment indicators suggests that growth in manufacturing will continue, albeit at a slightly more leisurely pace of 4.5 per cent in 2017. Nevertheless, the pace will be strong enough to drive capital spending higher, in turn lifting future growth. The export sector will face familiar headwinds in the form of low diversification and sluggish external demand growth. However, we expect exports to eke out higher growth this year.
For now, gross capital formation depends largely on EU funding intended to lay the foundation for self-sustaining investments in the future. However, it is far from certain whether that objective will be achieved and what will happen to growth after 2020 when EU funding will be reduced. One of the main priorities in the coming years will be reform of the tax system. The government has set a goal of increasing tax revenue to 32 per cent of GDP by 2020. Last year’s total tax take was around 30 per cent of GDP. The plan is very ambitious. In order to achieve the desired level, it will be necessary to implement large-scale reforms, especially reducing the grey economy and combating tax evasion. Above all, the government needs to build broad political coalitions across party lines by garnering public support for its proposals in order to avoid reversals and confusion upon changes of government. It will be a delicate process prone to setbacks.
Average inflation was only 0.1 per cent in 2016, but that masks a jump in December when prices climbed 2.2 per cent year-on-year. We expect inflation to rise further in the coming months. Annual inflation may temporarily approach 3 per cent, the highest level in recent years. One of the main reasons is the rebound in energy and food prices, especially dairy products. The surge in milk prices, in turn, raises concerns about the dairy industry’s competitiveness and its consolidation. In addition, the service sector will also be a substantial contributor to headline inflation. Our CPI forecast for this year is 2.1 per cent and 1.8 per cent next year.
Unemployment is on a downward trend, dropping to 9.5 per cent in Q3 from 9.8 per cent at the end of 2015 and 21.3 per cent in 2010. We expect it to fall further as construction activity picks up in 2017–2018. Employment is now above the EU average and not far from pre-crisis levels. Part of this improvement is due to economic recovery, but other factors include emigration and an ageing population, which have reduced the work force. However, low labour mobility and skill mismatches will become a serious obstacle to economic growth in the near future and leave the jobless rate uncomfortably high. Thus, there is a need for measures that increase labour market flexibility by promoting part-time employment and raising the participation rate further. Our forecast of average annual unemployment is 8.6 per cent in 2017 and 7.7 per cent in 2018.
Average gross wages rose 2.2 per cent in Q3 2016, down from 5.3 per cent in Q1. The drop was partly due to changes in methodology. We expect growth to accelerate to 4.0–4.5 per cent in 2017 and 2018. Employers will stay focused on cost control, and wage hikes will be selective. There will be a shift towards remuneration measures other than pay increases, though pressure from labour unions to raise wages will mount.

Lithuania
Nordic Outlook – February 2017 │ 41
Skilled labour shortage increasingly hinders growth
Cautious acceleration in GDP
Investments and exports main drivers
Inflation is picking up
The Lithuanian economy expanded slightly faster in 2016 than in 2015, but it still did not exploit all its capabilities. We believe that GDP growth will accelerate to 2.5 per cent this year and 3.0 per cent 2018. Our projections assume a recovery in public investments and marginally stronger exports of goods. However, the growth in private consumption will slow down after a substantial increase in 2016.
Average pay jumped in 2016 due to lower unemployment, a skilled labour shortage and two hikes in the minimum monthly wage. No such minimum wage increases are planned this year. The growth in average gross wages will thus be around 6 per cent in both 2017 and 2018. Net wages will go up faster than gross wages this year because the tax-exempt amount was boosted from EUR 200 to EUR 310 per month.
The labour market is heating up in Lithuania and businesses face more problems finding employees with the most needed skills. First, owing to negative demographic tendencies the labour force is close to its peak potential. The activity rate among people aged 20-64 age was 82 per cent in Lithuania during the third quarter of 2016, close to the level in the Nordic countries. Secondly, the education system in Lithuania is not preparing enough people for the skilled jobs required now and in the future. The new government is prepared to start reforming the country’s educational system, but it will be a long and winding road. Meanwhile, unemployment rate will drop to 7.5 per cent in 2017 and 7.2 per cent in 2018.
Inflation will accelerate faster than we expected earlier. The average growth in prices will be 2.5 per cent in 2017 and 2.4 per cent in 2018. Last year prices went up by 0.7 per cent in Lithuania. Parliament decided to sharply increase excise duties for alcoholic beverages and that will push up the prices of beer or wine by around 15 per cent starting March 1, 2017. Base effects and rising labour costs will also contribute to the much higher inflation rate that is expected this year.
Nominal merchandise exports were down in 2016 due to lower prices, but real-term export growth was around 1 per cent. It is worth noting that exports of furniture again demonstrated very solid growth last year. Overall, recent industrial confidence indicators reveal slight optimism among manufacturing companies. Capacity utilisation again climbed to a record level
in Q4 2016. However, uncertainties mostly related to geopolitical factors are still making businesses rather cautious about planning long term investments. Although companies will invest more in 2017, their capital spending level still lags other countries in Central and Eastern Europe. Yet we are optimistic about merchandise exports and forecast that they will increase by 6 per cent this year on both higher prices and volumes.
Residential property prices are climbing in Lithuania. In Vilnius, the capital, the prices of flats increased by around 7 per cent and the number of transactions was record-high in 2016. However, prices still did not reach their pre-crisis level. The market for new flats is driven by growing demand, while up to third of such purchases are for investment purposes since interest rates remain historically low and the demand for rental units is also strong enough. But contrary to pre-crisis times, the majority of residential properties purchased by households for investment are financed with savings.
The national budget turned out well in 2016 due to higher than forecast growth in average wages and abundant dividends from state-owned energy companies. Total budget revenue was 3.2 per cent higher than the Ministry of Finance had projected, thus the year of 2016 ended with a minimal general government deficit. We forecast that the budget deficit will increase this year because of higher pension and defence spending and will total around 0.5 per cent of GDP.

Key economic data
42 │ Nordic Outlook – February 2017
GLOBAL KEY INDICATORS Yearly change in per cent 2015 2016 2017 2018 GDP OECD 2.4 1.8 2.1 2.1 GDP world (PPP) 3.3 3.1 3.6 3.7 CPI OECD 0.6 1.1 2.0 1.8 Export market OECD 3.0 2.1 3.0 3.6 Oil price. Brent (USD/barrel) 53.4 45.2 55.0 60.0
USA Yearly change in per cent 2015 level, USD bn 2015 2016 2017 2018 Gross domestic product 18,223 2.6 1.6 2.6 2.6 Private consumption 12,439 3.2 2.7 2.8 2.5 Public consumption 3,245 1.8 0.9 0.7 0.8 Gross fixed investment 3,060 3.9 0.7 3.9 4.6 Stock building (change as % of GDP) 0.2 -0.4 0.0 0.0 Exports 2,212 0.1 0.4 3.2 2.7 Imports 2,733 4.6 1.1 3.3 2.9 Unemployment (%) 5.3 4.9 4.4 4.1 Consumer prices 0.1 1.3 2.1 2.2 Household savings ratio (%) 5.8 5.7 5.7 5.6
EURO ZONE Yearly change in per cent 2015 level, EUR bn 2015 2016 2017 2018 Gross domestic product 10,456 2.0 1.8 1.8 1.9 Private consumption 5,744 1.8 1.8 1.7 1.8 Public consumption 2,164 1.4 1.7 1.3 1.0 Gross fixed investment 3.2 3.5 3.5 3.5 Stock building (change as % of GDP) -0.2 0.0 0.0 0.0 Exports 4,833 6.5 2.5 3.8 4.4 Imports 4,358 6.4 3.3 4.3 4.7 Unemployment (%) 10.9 10.0 9.6 9.1 Consumer prices 0.0 0.2 1.6 1.0 Household savings ratio (%) 6.0 6.2 6.3 6.2

Key economic data
Nordic Outlook – February 2017 │ 43
OTHER LARGE COUNTRIES Yearly change in per cent 2015 2016 2017 2018 GDP United Kingdom 2.2 2.0 1.1 1.2 Japan 1.2 0.9 0.6 0.5 Germany 1.7 1.9 1.8 1.8 France 1.3 1.2 1.2 1.4 Italy 0.7 0.9 0.9 1.2 China 6.9 6.7 6.6 6.2 India 7.3 6.9 7.6 8.0 Brazil -3.8 -3.4 0.7 2.0 Russia -2.8 -0.2 1.0 1.5 Poland 3.6 2.8 3.2 3.4 Inflation United Kingdom 0.1 0.4 2.3 2.4 Japan 0.8 -0.1 0.7 0.7 Germany 0.2 0.8 2.1 1.8 France 0.3 0.2 1.5 0.8 Italy 0.0 0.2 1.2 0.8 China 1.4 2.2 2.5 2.5 India 4.9 5.0 4.8 5.0 Brazil 9.0 8.8 5.2 4.9 Russia 15.6 7.1 5.0 4.8 Poland -0.9 -0.6 1.8 2.2 Unemployment (%) United Kingdom 5.4 4.9 4.9 5.2 Japan 3.4 3.1 3.0 2.8 Germany 4.6 4.1 4.0 4.2 France 10.2 9.8 9.6 9.5 Italy 12.4 12.2 12.0 12.0
THE BALTICS 2015 2016 2017 2018 GDP, yearly change in per cent Estonia 1.4 1.3 2.2 3.1 Latvia 2.7 1.6 3.5 3.5 Lithuania 1.8 2.2 2.5 3.0 Inflation, yearly change in per cent Estonia 0.1 0.8 2.8 2.7 Latvia 0.2 0.1 2.1 1.8 Lithuania -0.7 0.7 2.5 2.4

Key economic data
44 │ Nordic Outlook – February 2017
FINANCIAL FORECASTS 01-Feb Jun-17 Dec-17 Jun-18 Dec-18 Official interest rates US Fed funds 0.75 1.00 1.25 1.50 2.00 Japan Call money rate -0.10 -0.10 -0.10 -0.10 -0.10 Euro zone Refi rate 0.00 0.00 0.00 0.00 0.00 United Kingdom Repo rate 0.25 0.25 0.25 0.25 0.25 Bond yields US 10 years 2.45 2.65 2.85 3.00 3.20 Japan 10 years 0.08 0.10 0.10 0.10 0.10 Germany 10 years 0.48 0.60 0.75 1.00 1.25 United Kingdom 10 years 1.41 1.70 1.95 2.10 2.25 Exchange rate USD/JPY 113 117 120 122 124 EUR/USD 1.08 1.06 1.03 1.05 1.08 EUR/JPY 122 124 124 128 134 GBP/USD 1.26 1.20 1.18 1.24 1.30 EUR/GBP 0.86 0.88 0.87 0.85 0.83
SWEDEN Yearly change in per cent 2015 level, SEK bn 2015 2016 2017 2018 Gross domestic product 4,181 4.1 3.5 3.1 2.4 Gross domestic product, working day adjustment 3.9 3.2 3.4 2.5 Private consumption 1,884 2.7 2.5 2.7 2.5 Public consumption 1,086 2.5 3.6 2.5 0.7 Gross fixed investment 989 7.2 8.0 7.7 4.7 Stock building (change as % of GDP) 23 0.3 0.2 0.0 0.0 Exports 1,906 5.6 3.7 4.6 3.0 Imports 1,708 5.5 5.7 6.7 3.5 Unemployment (%) 7.4 6.9 6.3 6.1 Employment 1.4 1.5 1.8 1.3 Industrial production 3.3 2.6 3.7 2.5 CPI 0.0 1.0 1.7 1.6 CPIF 0.9 1.4 1.8 1.6 Hourly wage increases 2.5 2.4 2.7 3.1 Household savings ratio (%) 16.3 16.2 16.4 15.4 Real disposable income 2.4 2.7 2.6 1.7 Current account. % of GDP 4.7 4.3 4.0 3.7 Central government borrowing. SEK bn 33 -85 -25 -20 Public sector financial balance. % of GDP 0.2 0.5 0.3 0.1 Public sector debt, % of GDP 43.9 40.7 38.7 36.8 FINANCIAL FORECASTS 01-Feb Jun-17 Dec-17 Jun-18 Dec-18 Repo rate -0.50 -0.50 -0.25 0.00 0.25 3-month interest rate, STIBOR -0.56 -0.50 -0.30 0.05 0.45 10-year bond yield 0.73 0.85 1.25 1.60 1.95 10-year spread to Germany, bp 25 25 50 60 70 USD/SEK 8.74 8.77 8.69 8.38 8.15 EUR/SEK 9.45 9.3 8.95 8.8 8.8 KIX 112.2 110.5 107.1 105.2 104.9

Key economic data
Nordic Outlook – February 2017 │ 45
NORWAY Yearly change in per cent 2015 level, NOK bn 2015 2016 2017 2018 Gross domestic product 3,191 1.6 0.5 1.1 1.7 Gross domestic product (Mainland) 2,561 1.1 0.8 1.6 2.0 Private consumption 1,311 2.1 1.7 2.0 2.5 Public consumption 706 2.1 2.2 1.9 1.7 Gross fixed investment 711 -3.8 0.1 0.6 2.7 Stock building (change as % of GDP) 0.2 0.2 0.0 0.0 Exports 1,266 3.7 -1.5 0.8 1.4 Imports 956 1.6 0.9 2.0 3.0 Unemployment (%) 4.4 4.8 4.7 4.6 CPI 2.2 3.5 2.1 1.7 CPI-ATE 2.7 3.1 1.9 1.6 Annual wage increases 2.8 2.5 2.9 3.1 FINANCIAL FORECASTS 01-Feb Jun-17 Dec-17 Jun-18 Dec-18 Deposit rate 0.50 0.50 0.50 0.50 0.75 10-year bond yield 1,71 1.70 1.80 1.90 2.15 10-year spread to Germany, bp 124 110 105 90 90 USD/NOK 8.23 8.25 8.25 8.05 7.78 EUR/NOK 8.89 8.75 8.50 8.45 8.40
DENMARK Yearly change in per cent 2015 level, DKK bn 2015 2016 2017 2018 Gross domestic product 2,027 1.6 1.0 1.8 2.2 Private consumption 962 2.0 1.8 1.1 2.0 Public consumption 521 0.6 1.1 0.6 0.8 Gross fixed investment 390 2.5 3.7 3.0 3.4 Stock building (change as % of GDP) -0.3 -0.5 0.0 0.0 Exports 1,120 1.8 0.4 3.1 3.0 Imports 970 1.3 1.1 2.5 2.7 Unemployment, OECD harmonised (%) 6.2 6.4 6.1 5.8 CPI, harmonised 0.2 0.0 0.9 1.4 Hourly wage increases 1.5 1.7 1.8 1.9 Current account, % of GDP 7.0 6.0 6.0 6.0 Public sector financial balance, % of GDP -1.7 -0.6 -1.6 -1.1 Public sector debt, % of GDP 40.2 40.4 40.8 40.5 FINANCIAL FORECASTS 01-Feb Jun-17 Dec-17 Jun-18 Dec-18 Lending rate 0.05 0.05 0.05 0.05 0.05 10-year bond yield 0.64 0.75 0.90 1.15 1.40 10-year spread to Germany, bp 16 15 15 15 15 USD/DKK 6.88 7.02 7.22 7.09 6.89 EUR/DKK 7.44 7.44 7.44 7.44 7.44
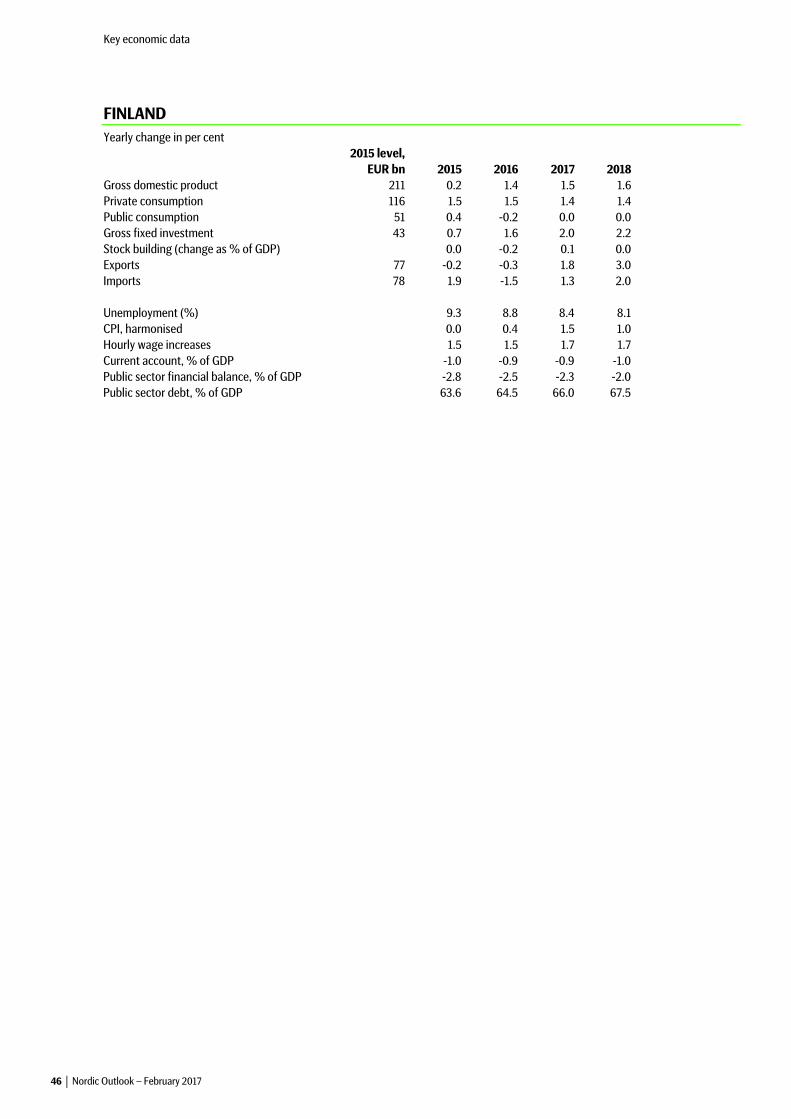
Key economic data
46 │ Nordic Outlook – February 2017
FINLAND Yearly change in per cent 2015 level, EUR bn 2015 2016 2017 2018 Gross domestic product 211 0.2 1.4 1.5 1.6 Private consumption 116 1.5 1.5 1.4 1.4 Public consumption 51 0.4 -0.2 0.0 0.0 Gross fixed investment 43 0.7 1.6 2.0 2.2 Stock building (change as % of GDP) 0.0 -0.2 0.1 0.0 Exports 77 -0.2 -0.3 1.8 3.0 Imports 78 1.9 -1.5 1.3 2.0 Unemployment (%) 9.3 8.8 8.4 8.1 CPI, harmonised 0.0 0.4 1.5 1.0 Hourly wage increases 1.5 1.5 1.7 1.7 Current account, % of GDP -1.0 -0.9 -0.9 -1.0 Public sector financial balance, % of GDP -2.8 -2.5 -2.3 -2.0 Public sector debt, % of GDP 63.6 64.5 66.0 67.5

This report has been compiled by SEB Large Corporates & Financial Institutions, a division within Skandinaviska Enskilda
Banken AB (publ) (“SEB”) to provide background information only.
Opinions, projections and estimates contained in this report represent the author’s present opinion and are subject to
change without notice. Although information contained in this report has been compiled in good faith from sources
believed to be reliable, no representation or warranty, expressed or implied, is made with respect to its correctness,
completeness or accuracy of the contents, and the information is not to be relied upon as authoritative. To the extent
permitted by law, SEB accepts no liability whatsoever for any direct or consequential loss arising from use of this
document or its contents.
The analysis and valuations, projections and forecasts contained in this report are based on a number of assumptions
and estimates and are subject to contingencies and uncertainties; different assumptions could result in materially
different results. The inclusion of any such valuations, projections and forecasts in this report should not be regarded as
a representation or warranty by or on behalf of the SEB Group or any person or entity within the SEB Group that such
valuations, projections and forecasts or their underlying assumptions and estimates will be met or realised. Past
performance is not a reliable indicator of future performance. Foreign currency rates of exchange may adversely affect
the value, price or income of any security or related investment mentioned in this report. Anyone considering taking
actions based upon the content of this document is urged to base investment decisions upon such investigations as they
deem necessary.
In the UK, this report is directed at and is for distribution only to (I) persons who have professional experience in matters
relating to investments falling within Article 19(5) of the Financial Services and Markets Act 2000 (Financial Promotion)
Order 2005 (The ‘‘Order’’) or (II) high net worth entities falling within Article 49(2)(a) to (d) of the Order (all such persons
together being referred to as ‘‘relevant persons’’. This report must not be acted on or relied upon by persons in the UK
who are not relevant persons. In the US, this report is distributed solely to persons who qualify as ‘‘major U.S. institutional
investors’’ as defined in Rule 15a-6 under the Securities Exchange Act. U.S. persons wishing to effect transactions in any
security discussed herein should do so by contacting SEBEI.
The distribution of this document may be restricted in certain jurisdictions by law, and persons into whose possession
this documents comes should inform themselves about, and observe, any such restrictions.
This document is confidential to the recipient, any dissemination, distribution, copying, or other use of this
communication is strictly prohibited.
Skandinaviska Enskilda Banken AB (publ) is incorporated in Sweden, as a Limited Liability Company. It is regulated by
Finansinspektionen, and by the local financial regulators in each of the jurisdictions in which it has branches or
subsidiaries, including in the UK, by the Financial Services Authority; Denmark by Finanstilsynet; Finland by
Finanssivalvonta; and Germany by Bundesanstalt für Finanzdienstleistungsaufsicht. In Norway, SEB Enskilda AS (‘ESO’) is
regulated by Finanstilsynet. In the US, SEB Securities Inc (‘SEBEI’) is a U.S. broker-dealer, registered with the Financial
Industry Regulatory Authority (FINRA). SEBEI and ESO are direct subsidiaries of SEB.

SEB is a leading Nordic financial services group. As a relationship bank, SEB
in Sweden and the Baltic countries offers financial advice and a wide range
of financial services. In Denmark, Finland, Norway and Germany the bank’s
operations have a strong focus on corporate and investment banking based on
a full-service offering to corporate and institutional clients. The international
nature of SEB’s business is reflected in its presence in some 20 countries
worldwide. At 31 December 2016, the Group’s total assets amounted to SEK
2,621bn while its assets under management totalled SEK 1,781bn. The Group has
around 15,300 employees. Read more about SEB at www.sebgroup.com.
With capital, knowledge and experience, we generate value for our customers −
a task in which our research activities are highly beneficial.
Macroeconomic assessments are provided by our SEB Research & Strategy unit.
Based on current conditions, official policies and the long-term performance of
the financial market, the Bank presents its views on the economic situation −
locally, regionally and globally.
One of the key publications from the SEB Research & Strategy unit is the
quarterly Nordic Outlook, which presents analyses covering the economic
situation in the world as well as Europe and Sweden.
www.sebgroup.com
SE
GR
0111
201
7.02
Beijing
Shanghai
New York
São Paulo
Singapore
Moskva
St: Petersburg
Geneve
London
Luxembourg
Warsaw
Kiev
New Delhi
Germany
Estonia
Russia
Latvia
Lithuania
Sweden
Norway
Denmark
Finland
Poland
Ukraine
Dublin
Moscow
St. Petersburg
Hong Kong


![A Complex Interplay of Three R2R3 MYB …...A Complex Interplay of Three R2R3 MYB Transcription Factors Determines the Profile of Aliphatic Glucosinolates in Arabidopsis1[C][W][OA]](https://static.fdocuments.us/doc/165x107/5e9095cd0003c25f3b3a1578/a-complex-interplay-of-three-r2r3-myb-a-complex-interplay-of-three-r2r3-myb.jpg)