Completion Design and Execution Strategy for Increasing ...
85
University of Canterbury Master of Engineering Management Completion Design and Execution Strategy for Increasing Maui Reserve Prepared by Amy M Hardy Version 1.0 13 December 2013
Transcript of Completion Design and Execution Strategy for Increasing ...
University of Canterbury
Master of Engineering Management
Completion Design and Execution
Strategy for Increasing Maui Reserve
Prepared by Amy M Hardy Version 1.0
13 December 2013

Completion Design and Execution Strategy for Increasing Maui Reserve
Confidential Page ii 1/12/2013
Disclaimer
This Report has been submitted to the University of Canterbury for the partial fulfillment of the Master of Engineering Management degree requirements. The Report has been made available to Shell Todd Oil Services Limited on the condition that neither the author nor the University will have any legal responsibility for the statements or recommendations made therein. Should Shell Todd Oil Services rely on the contents of the Report, or to implement any its recommendations it must do so solely in reliance on its own judgment.

Completion Design and Execution Strategy for Increasing Maui Reserve
Confidential Page iii 1/12/2013
Abstract
This report provides Shell Todd Oil Service’s Completion and Well Intervention Engineering Department with feasible options for the completion design and execution strategy for proposed sidetrack wells for Maui B. The project provides results and recommendations that can be carried forward into the next project phase, including:
Completion design for the three proposed sidetrack well types for Maui B: crestal, down-dip and the extended reach Maui B North
Stress analysis for each proposed design
Execution program outline for the crestal wells
Cost analysis
Benchmarking against industry standard
Analysis of Completion and Well Intervention Engineering departmental communication and synergies
The successes and failures of previous completion campaigns were analysed and heavily influenced the completion design for proposed sidetrack wells on Maui B. Shell standards, guidelines and open literature were called upon for the design.
Findings in this report provide evidence of issues that should be addressed for the continuous improvement of both primary completion design and it’s synergy with the entire project group. Conclusions and recommendations have been provided for the consideration of Shell Todd Oil Service’s Completion and Well Intervention Team, Well Delivery Lead and Maui B Increased Recovery Project Team.
This project has been prepared in partial fulfilment of the Master of Engineering Management (MEM) degree at the University of Canterbury for ENMG 606.
Completion Design and Execution Strategy for Increasing Maui Reserve
Confidential Page iv 1/12/2013
Acknowledgements
I acknowledge my supervisor Professor Piet Beukman for his honest advice, prompt responses and providing essential support as required. To my friends and family, who have supported my tertiary education and entry into the oil and gas industry.
Acknowledgement to Seamus Breeze and William Kyle for finding a position for me at Shell Todd Oil Services. To my sponsor, Nicole Hughes for her consistent advice and always making time for me in her busy schedule. Her ongoing support has been essential to the success of this project. Finally, to my colleagues Pete Marshall, Jian Chew, Ryan Ashworth and Aaron Wong for their ongoing technical support.
Completion Design and Execution Strategy for Increasing Maui Reserve
Confidential Page v 1/12/2013
Executive Summary
Project Outline
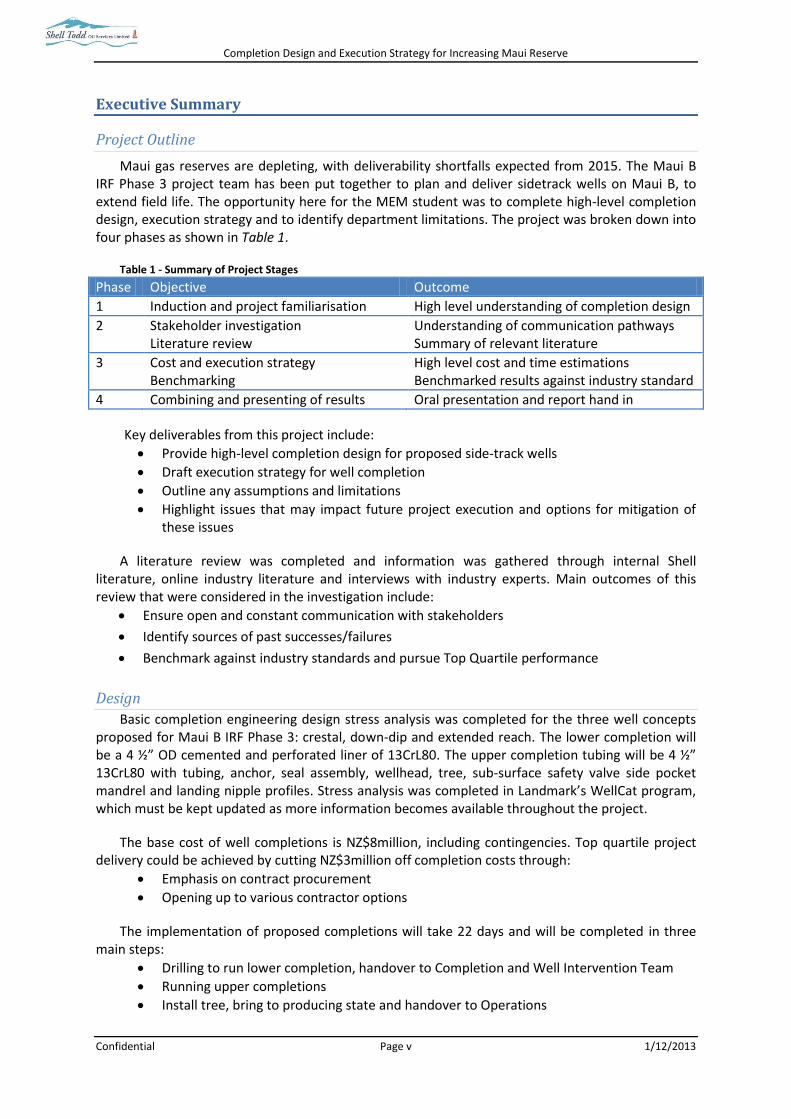
Maui gas reserves are depleting, with deliverability shortfalls expected from 2015. The Maui B IRF Phase 3 project team has been put together to plan and deliver sidetrack wells on Maui B, to extend field life. The opportunity here for the MEM student was to complete high-level completion design, execution strategy and to identify department limitations. The project was broken down into four phases as shown in Table 1.
Table 1 - Summary of Project Stages
Phase Objective Outcome
1 Induction and project familiarisation High level understanding of completion design
2 Stakeholder investigation Literature review
Understanding of communication pathways Summary of relevant literature
3 Cost and execution strategy Benchmarking
High level cost and time estimations Benchmarked results against industry standard
4 Combining and presenting of results Oral presentation and report hand in
Key deliverables from this project include:
Provide high-level completion design for proposed side-track wells
Draft execution strategy for well completion
Outline any assumptions and limitations
Highlight issues that may impact future project execution and options for mitigation of these issues
A literature review was completed and information was gathered through internal Shell literature, online industry literature and interviews with industry experts. Main outcomes of this review that were considered in the investigation include:
Ensure open and constant communication with stakeholders
Identify sources of past successes/failures
Benchmark against industry standards and pursue Top Quartile performance
Design
Basic completion engineering design stress analysis was completed for the three well concepts proposed for Maui B IRF Phase 3: crestal, down-dip and extended reach. The lower completion will be a 4 ½” OD cemented and perforated liner of 13CrL80. The upper completion tubing will be 4 ½” 13CrL80 with tubing, anchor, seal assembly, wellhead, tree, sub-surface safety valve side pocket mandrel and landing nipple profiles. Stress analysis was completed in Landmark’s WellCat program, which must be kept updated as more information becomes available throughout the project.
The base cost of well completions is NZ$8million, including contingencies. Top quartile project delivery could be achieved by cutting NZ$3million off completion costs through:
Emphasis on contract procurement
Opening up to various contractor options
The implementation of proposed completions will take 22 days and will be completed in three main steps:
Drilling to run lower completion, handover to Completion and Well Intervention Team
Running upper completions
Install tree, bring to producing state and handover to Operations

Completion Design and Execution Strategy for Increasing Maui Reserve
Confidential Page vi 1/12/2013
Investigation Recommendations
Observations were made on department proceedings. Through recognising day-to-day business challenges and synthesising the skills and principles learnt in the MEM program, several recommendations have been provided to add value for both the Wells department and STOS as an organization. These are provided in Table 9.
Table 2 - Project Conclusions and Recommendations
Priority Conclusions Recommendations
1 Front end planning is not completed
adequately within STOS
Increase emphasis and awareness on front end work – include all relevant staff (that may not be critical up front) in front end planning. Focus on
Improved project definition
Make timely key decisions, don’t leave options too open
Ensure historical findings are analysed and acted upon
2 CWI has developed a clear direction and open communication of strategy throughout the department
Keep staff engaged and challenged through
providing overseas opportunities to broaden their
knowledge and experience base
3 Inter-department communication is weak
In the planned interior redecorating of the STOS building, explore options improving flow between different departments
4 The main project risks include:
Scope creep
Lack of front end planning
HSE disaster
These situations can be mitigated through:
Admittance of a Project Manager early in the process
Increased project scope definition and assurance plan
5 Benchmarking is not a priority for
completion design
Improve emphasis on benchmarking against industry standard. This gives international perspective on STOS cost and time requirements
Through the implementation of recommendations made in this report, CWI and the greater STOS could improve their business processes. This will ensure both Maui B IRF Phase 3 completions and all future projects are executed to their maximum potential.

Completion Design and Execution Strategy for Increasing Maui Reserve
Confidential Page vii 1/12/2013
Contents
Abstract .................................................................................................................................................. iii
Acknowledgements ................................................................................................................................ iv
Executive Summary ................................................................................................................................. v
Abbreviations ......................................................................................................................................... ix
1.0 Introduction ................................................................................................................................ 1
1.1 Background ............................................................................................................................. 1
1.2 Project Focus ........................................................................................................................... 1
1.2.1 Maui B IRF Phase 3 Project ............................................................................................. 1
1.2.2 MEM Project Deliverables ............................................................................................... 2
1.3 Scope of Works ....................................................................................................................... 2
1.3.1 Phase One ....................................................................................................................... 2
1.3.2 Phase Two ....................................................................................................................... 2
1.3.3 Phase Three ..................................................................................................................... 2
1.3.4 Phase Four ....................................................................................................................... 3
2 Industry and Literature Review ....................................................................................................... 4
2.1 Industry ................................................................................................................................... 4
2.1.1 Shell Practice ................................................................................................................... 4
2.1.1.2 Standards ........................................................................................................................ 4
2.1.2 Previous Experience ........................................................................................................ 5
2.2 Literature ................................................................................................................................ 5
2.2.1 Success Factors ............................................................................................................... 5
2.2.2 Ethical Considerations ......................................................................................................... 5
2.2.2 Benchmarking ................................................................................................................. 6
2.3 Summary ................................................................................................................................. 6
3.0 Observations ............................................................................................................................... 6
3.1 Organisation Structure ............................................................................................................ 6
3.2 Department Structure ............................................................................................................. 6
3.2.1 Department Communications ......................................................................................... 7
3.2.2 Stakeholders.................................................................................................................... 8
3.2.3 Strategy ........................................................................................................................... 8
3.2.4 Critical Success Factors ................................................................................................... 9
3.3 Summary ................................................................................................................................. 9
4.0 Design .......................................................................................................................................... 9
Completion Design and Execution Strategy for Increasing Maui Reserve
Confidential Page viii 1/12/2013
4.1 Completion Design ................................................................................................................ 10
4.2 Stress Analysis ....................................................................................................................... 10
4.2.1 Crestal Sidetrack Well ................................................................................................... 11
4.2.2 Down-Dip Sidetrack Well .............................................................................................. 11
4.2.3 NB-North Sidetrack Well ............................................................................................... 12
4.3 Summary ............................................................................................................................... 12
5.0 Cost Analysis ............................................................................................................................. 13
6.0 Execution Strategy .................................................................................................................... 14
6.1 Key Performance Indicators .................................................................................................. 14
6.2 Key Programme Steps ........................................................................................................... 14
6.3 Risk Assessment .................................................................................................................... 15
7.0 Review ....................................................................................................................................... 16
7.0 After Action Review .................................................................................................................. 19
7.1 Project Strengths ................................................................................................................... 19
7.2 Future Project Improvements ............................................................................................... 19
7.3 Reflection of Personal Value ................................................................................................. 19
8.0 Conclusions and Recommendations ......................................................................................... 20
9.0 Bibliography .............................................................................................................................. 21

Completion Design and Execution Strategy for Increasing Maui Reserve
Confidential Page ix 1/12/2013
Abbreviations
AAR After Action Review
AD Asset Development
BOM Business Opportunity Manager
CSV Completion Supervisor
CWI Completion and Well Intervention
DCAF Discipline Controls and Assurance Framework
DSF Design Safety Factor
EPA Asia-Pacific Region
GWDP Global Well Delivery Process
HSE Health, Safety and Environment
IG Integrated Gas
IRF Increased Recover Factor
JV Joint Venture
KPI Key Performance Indicator
MA Maui A
MB Maui B
MEM Master of Engineering Management
MPS Maui Production Station
NPT Non Productive Time
PCAP Project Controls and Assurance Plan
Ph2 Phase 2
Ph3 Phase 3
PM Project Manager
POC Point of contact
PT Production Technologist
RE Reservoir Engineer
Shell Royal Dutch Shell
SITS Subsurface Integrity Tests
SNZ Shell New Zealand
SPM Side Pocket Mandrel
STOS Shell Todd Oil Services Limited
TA Technical Authority
TRSCSSSV Tubing Retrievable Surface Control Subsurface Safety Valve
VP Vice President
WITS Wellhead Integrity Tests

Completion Design and Execution Strategy for Increasing Maui Reserve
Confidential Page 1 1/12/2013
1.0 Introduction
The project has been completed as part of the University of Canterbury’s Master of Engineering Management program (MEM). The contract was for employment at Shell Todd Oil Services (STOS) Limited during the period 15 October 2013 to 14 February 2014 in the Completion and Well Intervention (CWI) Engineering Department, based in the New Plymouth Office.
Henceforth, Shell Todd Oil Services will be referred to as STOS, and Completion and Well Intervention Engineering as CWI.
The due diligence addressed in this report includes data collected, results of analysis, development of a course of action, benchmark and analysis explanation, recommendations and an implementation proposal. Design of completions for the Maui B IRF Phase 3 wells, a high level cost analysis and program will be completed. This will provide a basis for credible conclusions and recommendations for STOS to take forward into the next stage of the Global Well Delivery Process (GWDP).
1.1 Background
Shell Todd Oil Services is a New Zealand pioneer in the oil and gas industry. Based in Taranaki, STOS is a joint venture of Shell New Zealand Ltd. and Todd Petroleum Mining. STOS is responsible for producing the majority of New Zealand’s energy through the operation of three main gas fields:
Maui
Kapuni
Pohokura
This project will focus on work around the Maui field that STOS operates for Shell, Todd Energy and OMV. Maui is located offshore and the hydrocarbon reservoirs cover 157 square km, 3km below sea-level. Maui B platform was installed in 1992; 15 years after Maui A, to enhance drainage of hydrocarbons from the field and allow oil production from deeper reservoirs.
The production forecast for the Maui field is declining, with deliverability shortfalls from 2015. The opportunity for STOS is to appraise and develop remaining gas opportunities in Maui B that have previously been bypassed. The goal of the project is to access bypassed reserves and extend the remaining field life.
1.2 Project Focus
Through recognising day-to-day business challenges and synthesising the skills and principles learned in the Master of Engineering Management (MEM) program, all recommendations provided in this report aim to benefit both the Wells department and STOS as an organisation.
1.2.1 Maui B IRF Phase 3 Project
Maui B IRF Phase 3 project summary points:
Objective is to target bypassed gas in the multiple layers of the Maui reservoir layers from the Maui B fixed leg platform, offshore Taranaki
Currently in the Concept Select phase of the Global Well Delivery Process (GWDP)
Down-hole abandonment of up to seven depleted wells on the platform and drilling sidetracks from the donor wells to target the remaining producible reserves

Completion Design and Execution Strategy for Increasing Maui Reserve
Confidential Page 2 1/12/2013
1.2.2 MEM Project Deliverables
The MEM contribution to the Maui B IRF Phase 3 project is defined through deliverables:
Provide high-level completion design for STOS Maui B IRF Phase 3 side-track wells
Draft an execution strategy for well completion
Outline any assumptions and limitations.
Highlight issues that may impact future project execution and options for mitigation of these issues
1.3 Scope of Works
The project was divided into four main phases. A summary of the project progression plan is illustrated in Figure 1, with an explanation of proceedings explained further in sections 1.3.1 through 1.3.4. Appendix I – Figure 3 gives this in further detail. The bulk of work remained within scope throughout the project, preventing cost overruns.
1.3.1 Phase One
A project proposal, charter and plan were completed to detail the scope, approach and structure of the investigation whilst providing a foundation document that defined boundaries and objectives. Scheduled deliverables and milestones defined here were fundamental in monitoring progress toward the project deadline.
Phase one allowed for time to become familiar with the oil and gas industry. Time was allocated for inductions, a BOSIET (Basic Offshore Safety Induction and Emergency Training), a forty hour WellCat course and the opportunity to interact with colleagues both in CWI and other departments.
1.3.2 Phase Two
Focus here was on interaction with project stakeholders and understanding the information different departments could provide for the project. Collection of information was completed by verbal and written stakeholder engagement and focused investigation to determine:
Previous (related) project results
Inter-department relationships
Standards and regulations
Documentation storage
Information was collated and recorded in Section 2, Industry and Literature Review. Observations from this investigation are described in Section 3. The second stage of Phase Two involved using completion design for the Maui B IRF Phase 3 crestal, down dip and Maui B North wells. WellCat was used for stress analysis on proposed completion design. The results from this analysis were compiled in reports; Appendices V, VI & VII.
1.3.3 Phase Three
A high level capital cost analysis was completed at this stage, drawing on previous information and contractor quotes. The proposed costing was analysed and benchmarked against similar cases. This cost analysis involved:
Identifying industry best practice
Recognising similar industry challenges, lessons learned and courses of action
Identifying Lean and Total Quality Management leaders, guidelines and methodologies

Completion Design and Execution Strategy for Increasing Maui Reserve
Confidential Page 3 1/12/2013
It is important to acknowledge that the program will not be executed until 2016 at the earliest, and will be re-assessed and updated at later phases in the GWDP as more information becomes available.
1.3.4 Phase Four
Information gathered and work completed throughout the project was compiled to form a final report. Project recommendations were crafted and evaluated against previous jobs to ensure a realistic implementation plan was achieved, that would meet the needs of the department. The priority and practicality of improvement initiatives were considered at all stages of the recommendation process.
The implementation plan covers a high level proposal for the completion program. An in-depth implementation plan should be formulated with the input of the team if recommendations are taken forward.
Phase four involved verbal presentations of the project results to the Maui B IRF Phase 3 project team and the CWI group.
Figure 1 – Summary of Project Progression
Phase 4
Results
Phase 3
Implementation Program
Phase 2
Well Design
Phase 1
Project Introduction
Induction WellCat Course
Project Familarisation
Stakeholder Investigation
Industry/Literature Review
Completion Design
Stress Analysis
Costing and Execution Strategy
Benchmarking
Coalition of Results
Make Recommendations
Present Results
High level understanding of: o STOS o CWI engineering
Phase Action Result
One-on-one time with stakeholders
Research through available literature: o Shell specific o Public
Estimation of time and cost
Comparison with industry standard
Coalition of most relevant information in report
Presentation of results: o MB IRF Ph3 Project
Group o Wells Department

Completion Design and Execution Strategy for Increasing Maui Reserve
Confidential Page 4 1/12/2013
2 Industry and Literature Review
A literature review and inquiry of industry knowledge has helped identify relevant standards and highlight current techniques and modern technologies.
2.1 Industry
This review was to put together as a guide to help understand typical industry proceedings. It highlights the importance of:
Current Shell standards and protocols
Implementing historical lessons learnt
Interviews were conducted with industry professionals and internal Shell literature was consulted to compile relevant information. The intention was to ensure the completion design meets minimum required safety factors and required inflow performance, and give apt recommendations for future completion design work done within CWI.
Due to the international nature of the oil and gas industry, social and cultural differences may contribute to the communication issues faced. It must be acknowledged that political, socio-cultural, technological, legal and economic factors influence each organisation and department differently.
2.1.1 Shell Practice
There are a series of Shell standards and manuals that STOS follows for well design and execution, some of which are outlined in Section 2.1.1.2 - Standards.
Once the concept has been selected and detailed design work done and assessed by the relevant technical authorities (TA’s), as Well and CWI Engineers draft engineering programs. These programs form instructions for well construction and completion installation, to be executed by the drilling rig contract company and third party services, under supervision of STOS Drilling and CWI Supervisors.
2.1.1.2 Standards
The Global Well Delivery Process (GWDP) Appendix I, Figure 1 is the founding procedure for the implementation of Well projects in STOS. This process provides a structure that sets all projects up for success, with certain deliverables and set decision gates. Within this, Project Controls and Assurance Plan (PCAP) is a framework that assigns people to particular tasks and project deliverables.
As previously mentioned, the Maui B IRF Phase 3 project is in the select phase of the global well delivery process. This in the second stage of the five stage GWDP in which the feasibility of proposed options is investigated.
Shell Casing and Tubing Design Manual (CTDM) guides Engineers through the design process,
outlines design features such as minimum required safety factors, material selection, pipe strengths, design load scenarios, etc (Klever, 2013). Shell Well Cost Estimating Code of Practice provide a guideline for cost estimation (Halal, Jablonowski, & Adeleye, 2008)
Completion Design and Execution Strategy for Increasing Maui Reserve
Confidential Page 5 1/12/2013
2.1.2 Previous Experience
To improve, companies should implore focus on learning-by-doing (experience) from proficient projects (Okstad, 2006). This section investigates Maui B IRF Phase 2, executed in 2012 and draws on the project’s completion experience.
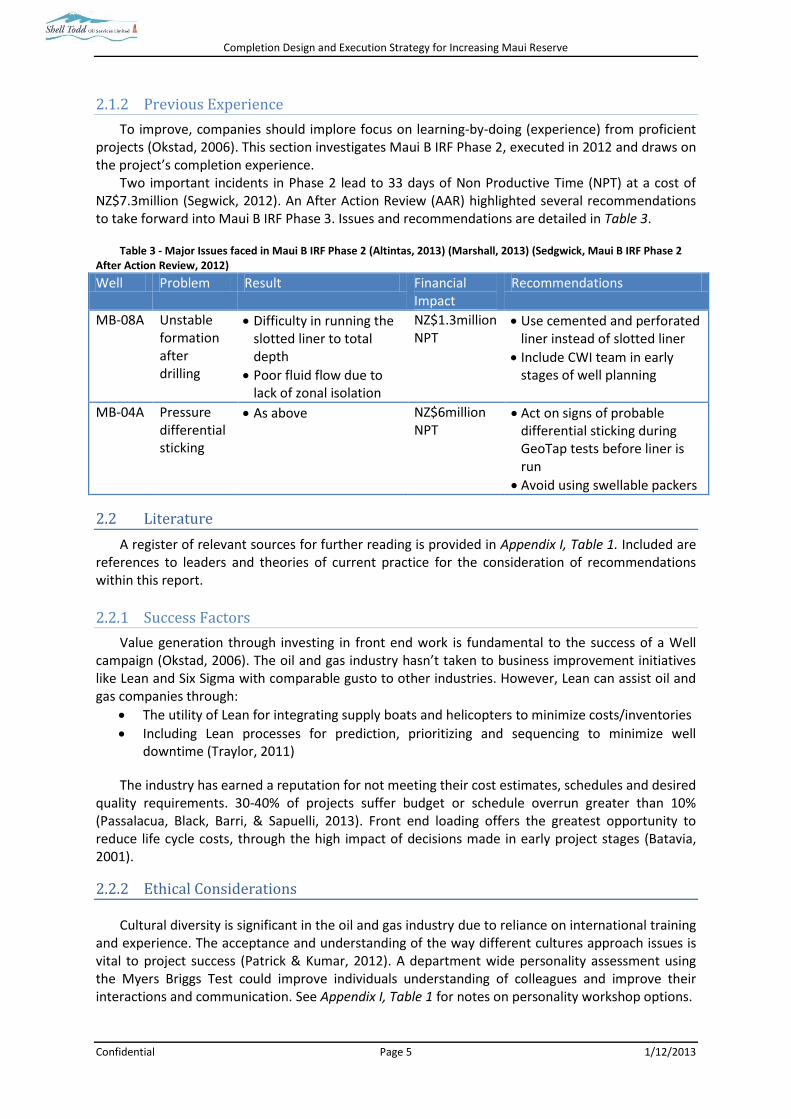
Two important incidents in Phase 2 lead to 33 days of Non Productive Time (NPT) at a cost of NZ$7.3million (Segwick, 2012). An After Action Review (AAR) highlighted several recommendations to take forward into Maui B IRF Phase 3. Issues and recommendations are detailed in Table 3.
Table 3 - Major Issues faced in Maui B IRF Phase 2 (Altintas, 2013) (Marshall, 2013) (Sedgwick, Maui B IRF Phase 2 After Action Review, 2012)
Well Problem Result Financial Impact
Recommendations
MB-08A Unstable formation after drilling
Difficulty in running the slotted liner to total depth
Poor fluid flow due to lack of zonal isolation
NZ$1.3million NPT
Use cemented and perforated liner instead of slotted liner
Include CWI team in early stages of well planning
MB-04A Pressure differential sticking
As above
NZ$6million NPT
Act on signs of probable differential sticking during GeoTap tests before liner is run
Avoid using swellable packers
2.2 Literature
A register of relevant sources for further reading is provided in Appendix I, Table 1. Included are references to leaders and theories of current practice for the consideration of recommendations within this report.
2.2.1 Success Factors
Value generation through investing in front end work is fundamental to the success of a Well campaign (Okstad, 2006). The oil and gas industry hasn’t taken to business improvement initiatives like Lean and Six Sigma with comparable gusto to other industries. However, Lean can assist oil and gas companies through:
The utility of Lean for integrating supply boats and helicopters to minimize costs/inventories
Including Lean processes for prediction, prioritizing and sequencing to minimize well downtime (Traylor, 2011)
The industry has earned a reputation for not meeting their cost estimates, schedules and desired quality requirements. 30-40% of projects suffer budget or schedule overrun greater than 10% (Passalacua, Black, Barri, & Sapuelli, 2013). Front end loading offers the greatest opportunity to reduce life cycle costs, through the high impact of decisions made in early project stages (Batavia, 2001).
2.2.2 Ethical Considerations
Cultural diversity is significant in the oil and gas industry due to reliance on international training and experience. The acceptance and understanding of the way different cultures approach issues is vital to project success (Patrick & Kumar, 2012). A department wide personality assessment using the Myers Briggs Test could improve individuals understanding of colleagues and improve their interactions and communication. See Appendix I, Table 1 for notes on personality workshop options.

Completion Design and Execution Strategy for Increasing Maui Reserve
Confidential Page 6 1/12/2013
Major ethical considerations in this industry are the importance of safety, in regards to both personal safety and the environment. This has been identified in Section 6.3 – Risk Assessment and options for mitigation have been explored.
2.2.2 Benchmarking
Rushmore Reviews is an online database through which oil and gas operators can “gain value through sharing high quality well data as efficiently as possible (Rushmore Reviews, 2014).” Operators upload well data for the completion type, including time taken and total costs. The collaboration of this data allows Top Quartile (TQ) and Best in Class (BIC) standards to be established, providing international benchmarks for the industry to strive towards.
2.3 Summary
Adherence to guidelines provided in Shell standards and manuals is encouraged to ensure work achieves above and beyond government requirements. Success of well completions is not solely based on cost efficiency which, whilst important, is just one factor amongst others such as successful implementation, safety, environmental awareness and timeliness. To ensure these factors are met:
Ensure open and constant communication with stakeholders
Identify sources of past successes/failures
Benchmark against industry standards and pursue ‘Best In Class’ performance
3.0 Observations
The oil and gas industry is not covered by New Zealand education systems. Therefore, onsite training was an important ongoing factor throughout the project. The work breakdown structure was created in the Project Charter, alongside Nicole Hughes, Sponsor. This helped ensure the project was broken down systematically, allowing time for each area presumed relevant to the project.
3.1 Organisation Structure
STOS represents the best interests of all joint venture stakeholders and is working towards a more consistent following of Shell’s processes and procedures. The STOS structure in the Wells Department is evolving to become more aligned with the Global Shell Wells organisation.
STOS’s Information Technology (I.T.) framework is tied back to the Global Shell network. Locally developed applications are also utilised in some instances, but the base systems (modelling programs, email, etc) are all tied into the global network.
Historically completion design has not been prepared by STOS CWI employees as the department had been set up to support well intervention activities (maintaining well integrity and optimising production) only. The goal is to build completion capabilities in house and resources are now being allocated by bringing in experienced global Shell personnel and investing in training new graduates.
3.2 Department Structure
STOS has a relatively rigid hierarchical structure and reasonably high staff turnover. The CWI departmental hierarchy is led by Nicole Hughes, the Wells Engineering Team Lead (CWI). Her superior is the New Zealand Well Delivery Lead, Owen Hey, and then VP Wells in Kuala Lumpa, Davie Stewart. Details of the departmental structure can be found in Figure 2.

Completion Design and Execution Strategy for Increasing Maui Reserve
Confidential Page 7 1/12/2013
3.2.1 Department Communications
Internal communication between Wells and other STOS departments is a recognised area for improvement. This is widely acknowledged within the team but less accepted externally. To mitigate these issues, this project has focused on working closely with those in asset development and the drilling engineers to understand their views and contribution to the project.
Intra-communication (within the CWI team) is strong as the engineers work in an open plan office space. This environment facilitates impromptu face-to-face interaction on projects and allows engineers to readily obtain professional opinions and advice from their peers.
Figure 2 - CWI team hierarchy
Relationships between the CWI department and contractors appear to be strong. This has been observed as:
Weekly contractor meetings discussing planning and operations
First name basis on which contractors and STOS CWI Engineers regard each other
Frequency of phone communicate between staff
These relationships provide an avenue for the CWI Engineers to keep contractors up to date with project proceedings and unexpected issues, allowing external parties to respond rapidly.
Vice President Wells
Davie Stewart
Well Delivery Lead
Owen Hey
Well Engineering Execution Lead
John Beardman
Wells Engineering Team Lead (CWI)
Nicole Hughes
Senior CWI Engineers
CWI Engineers Senior CWI Supervisor
CWI Technician CWI Technician
Trainee CWI Supervisor
Workshop Maintenance
Senior HSE Advisor
Stewart Logan
Well Support Team Lead
Debbie
STOS Completion & Well Intervention Department
Completion Design and Execution Strategy for Increasing Maui Reserve
Confidential Page 8 1/12/2013
3.2.2 Stakeholders
There are several major stakeholders in the Completion Design and Execution Strategy for Increasing Maui Reserves project. These have been outlined in Sections 3.2.2.1 & 3.2.2.2.
3.2.2.1 Internal Stakeholders
Amy Hardy MEM Student, University of Canterbury Responsible for ensuring that milestones and deliverables are met,
whilst keeping both the project Sponsor and Supervisor up to date with project progress.
Nicole Hughes Project Sponsor, STOS Role is to assist the student with background and provide information
needed for project completion. Also, meet regularly with the student to review progress and provide feedback.
Piet Beukman Project Supervisor, University of Canterbury Providing advice to ensure standards and criteria of the MEM program
are being adhered to.
3.2.2.2 External Stakeholders
David Hadley Maui B IRF Phase 3 Project Business Opportunity Manager
Keith Seddon Maui B IRF Phase 3 Front End Development Manager
Ewan Robertson Lead Subsurface Engineer involved with the Maui B IRF Phase 3 Project
Paul Sedgwick Well Engineering Lead for the Maui B IRF Phase 3 Project (w/ Bernard Poon)
Joanna Breare Exploration and Development Manager
Megan Alexander STOS Contracting and Procurement
Shabbir Syed STOS Production Technologist
Contractors Halliburton - Completions equipment
Cameron – Well head equipment
3.2.3 Strategy
The department strategy is developed by the VP of Wells Integrated Gas (IG), Davie Stewart. He communicates this to each country’s Well Delivery Lead and distributes it to all Shell Well employees throughout IG. The top 5 strategic actions for 2014 have been highlighted as:
Better-to-best – Improve application of the GWDP
Well, Reservoir and Facilities Management (WRFM) – Increase production from well intervention activity
Wells resourcing strategy and people plan – Emphasis on recruitment and training
DROPS – Continue implementation of safety initiative to avoid drops
Contractor management and quality control of installed equipment
n.b. Integrated Gas (IG) is the term used to group the countries in this region, headed by Malaysia. Countries included under the IG title include; Malaysia, Australia, New Zealand, Brunei and Qatar.

Completion Design and Execution Strategy for Increasing Maui Reserve
Confidential Page 9 1/12/2013
3.2.4 Critical Success Factors
Stakeholders expect quality completion design, delivery of which is vital to the projects success. Quality can be defined as compliant, accurate and safe design with a strong execution strategy. Additionally results must be within the scope of stakeholder requirements, meet budgets, schedules and be highly reliable. Critical factors for completion design are:
Design safety factors
Relationships with stakeholders
Budgeting compliance
Strong community relations (Iwi, farmers)
Compliance with HSE standards
Available resources
3.3 Summary
Historically in STOS, CWI was a Well Intervention group only and had no resourcing for front end planning. Over the past two years, resources have been building to provide STOS CWI Engineering department with the capability of taking on front end work. Their strengths lie in the areas of relationships within the department, and with contractors. Gaps that have been observed in the CWI department include:
Lack of front end planning
Lack of in house knowledge
Lack of human resources
Lack of department strategy
Lack of inter-department
communication
Completion design has a high impact on many stakeholders and the cost of each completion campaign is in the order of many millions. It is therefore vital that the design work is completed accurately at the front end so that later remedial work can be avoided.
Recommendation
Continued investment in the departments training of new engineers, alongside maintaining consistent staff with varied industry experience will assist in their ability to design support front end design on well projects. This is important to help optimise project execution plan and define the optimal solution.
Inter-department communication and alignment of senior management should be an area of focus for STOS. CWI projects require collaborative efforts from all STOS departments, and only through communication can members of each area learn from and build upon the experiences of their colleagues.
4.0 Design
The completion design for Maui B IRF Phase 3 was based on models created in Maui B IRF Phase 2 and sidetrack wells currently being completed at Maui A. An individual design was completed for each of the different well types anticipated for the project: crestal (targeting the top of the reservoir crest), down-dip (the direction going down the tilt angle of the formation) (PetroWiki, 2013) and Maui B North (an extended reach well). Information required for design is correlated from all disciplines including:
Drilling Engineers - Well trajectory and casing schematic
Production Technologists (PT) - Expected flow rates, suggested tubing sizes, water build up
Reservoir Engineers (RE) - Fluid flow in reservoirs and aquifers

Completion Design and Execution Strategy for Increasing Maui Reserve
Confidential Page 10 1/12/2013
4.1 Completion Design
Decisions made for completions were based on recommendations outlined in Section 3.1.2. A ranking sheet for proposed completion options can be found in Appendices I – Table 2. Key decisions made for the high level completion design required include:
Cemented liner with liner hanger – to avoid issues faced with slotted liner (Dyke, 2009)
4-1/2” tubing and liner – to achieve flow rates predicted (Klever, 2013)
13Cr L80 Material – due to non-sour, corrosive environment (Bellarby, 2012)
Side Pocket Mandrel (SPM) – to underbalance well prior to perforation
Tubing Retrievable Surface Control Subsurface Safety Valve (TRSCSSSV) – fail-safe shut in device
Tubing anchor – keeps the tubing from moving (PetroWiki, 2013)
Seal assembly – isolate production tubing from annulus (Halliburton, 2013)
Data sheets for the equipment outlined can be found in Appendix III – Tables 1, 2 3 and 4. Other completion options were not investigated during stress analysis and this level of detail can be considered at later project stages.
4.2 Stress Analysis
Stress Analysis was completed to ensure the proposed completion design could withstand subsurface conditions, thermal operations and loads that may be imposed on the completion throughout its expected life.
Table 4 - Minimum allowable design safety factors
Halliburton’s Landmark program WellCat was used for stress analysis, allowing the simulation of fluid flow, analysis of tubing loads, movements, and design integrity under mechanical and thermal loading conditions (Halliburton Landmark, 2013). Thermal operations load cases considered during stress analysis can be found in Appendix II, Tables 1 and 2. Stresses were calculated to the design safety factors shown in Table 4.

Completion Design and Execution Strategy for Increasing Maui Reserve
Confidential Page 11 1/12/2013
4.2.1 Crestal Sidetrack Well
Figure 3 - Well schematic and design limits plot for MB-04C
The crestal well used for completion design was MB-04C. Figure 3 shows the well schematic and associated design limits plot for MB-04C completions. Figure 3 and details found in Appendix V, it can be stated the completion design is strong enough to withstand all load cases outlined in Section 4.3.
4.2.2 Down-Dip Sidetrack Well
The down-dip well used for completion design was MB-09A. This should stand similar for the other down-dip wells proposed for Maui B IRF Phase 3: MB-02B, MB-10A and MB-12A.
Figure 4 - Well schematic and design limits plot for MB-09A
The proposed cemented liner and hanger design for the down-dip sidetrack well’s on Maui B appear to meet the design requirements outlined in the Casing and Tubing Design Manual. Details for this can be found in Appendix VI. Note: MB-09A can only withstand a tubing overpull of 80kips.
Completion Design and Execution Strategy for Increasing Maui Reserve
Confidential Page 12 1/12/2013
4.2.3 NB-North Sidetrack Well
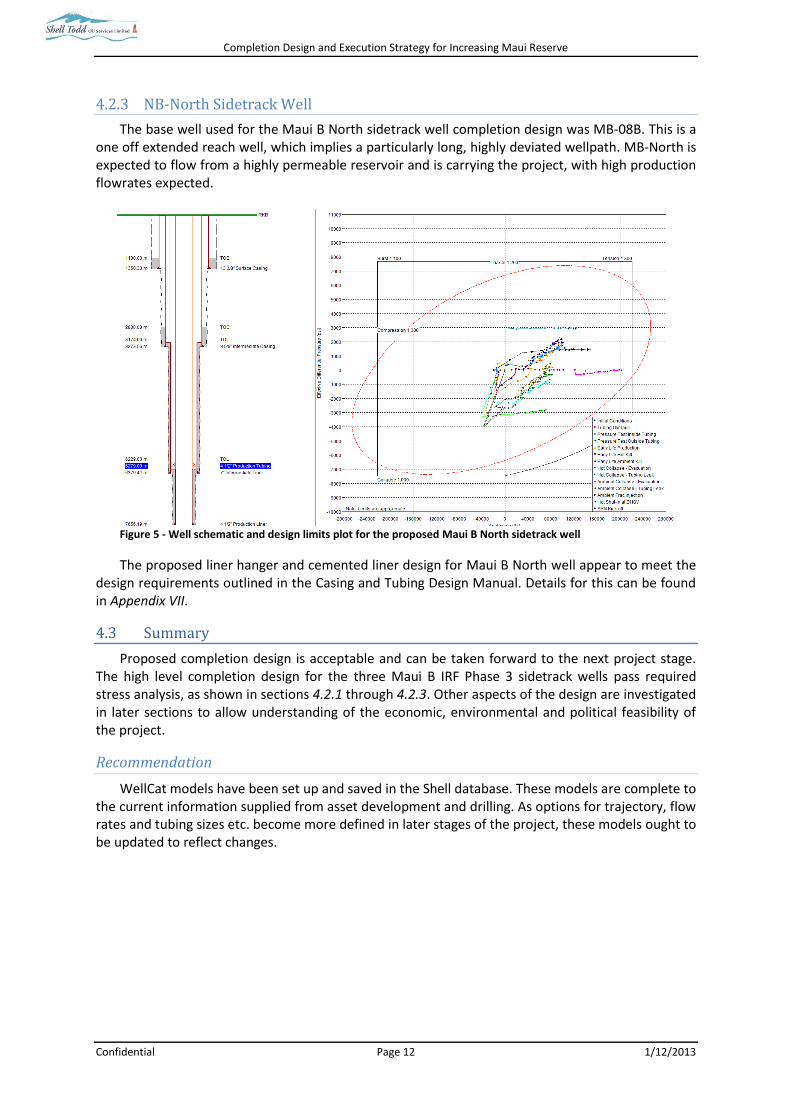
The base well used for the Maui B North sidetrack well completion design was MB-08B. This is a one off extended reach well, which implies a particularly long, highly deviated wellpath. MB-North is expected to flow from a highly permeable reservoir and is carrying the project, with high production flowrates expected.
Figure 5 - Well schematic and design limits plot for the proposed Maui B North sidetrack well
The proposed liner hanger and cemented liner design for Maui B North well appear to meet the design requirements outlined in the Casing and Tubing Design Manual. Details for this can be found in Appendix VII.
4.3 Summary
Proposed completion design is acceptable and can be taken forward to the next project stage. The high level completion design for the three Maui B IRF Phase 3 sidetrack wells pass required stress analysis, as shown in sections 4.2.1 through 4.2.3. Other aspects of the design are investigated in later sections to allow understanding of the economic, environmental and political feasibility of the project.
Recommendation
WellCat models have been set up and saved in the Shell database. These models are complete to the current information supplied from asset development and drilling. As options for trajectory, flow rates and tubing sizes etc. become more defined in later stages of the project, these models ought to be updated to reflect changes.
Completion Design and Execution Strategy for Increasing Maui Reserve
Confidential Page 13 1/12/2013
5.0 Cost Analysis
The crestal well MB-04C was used as a basis for cost analysis of the completion for Maui B IRF Phase 3. Values used were taken from historical information, including historical costs, quotes and budget blow-outs.
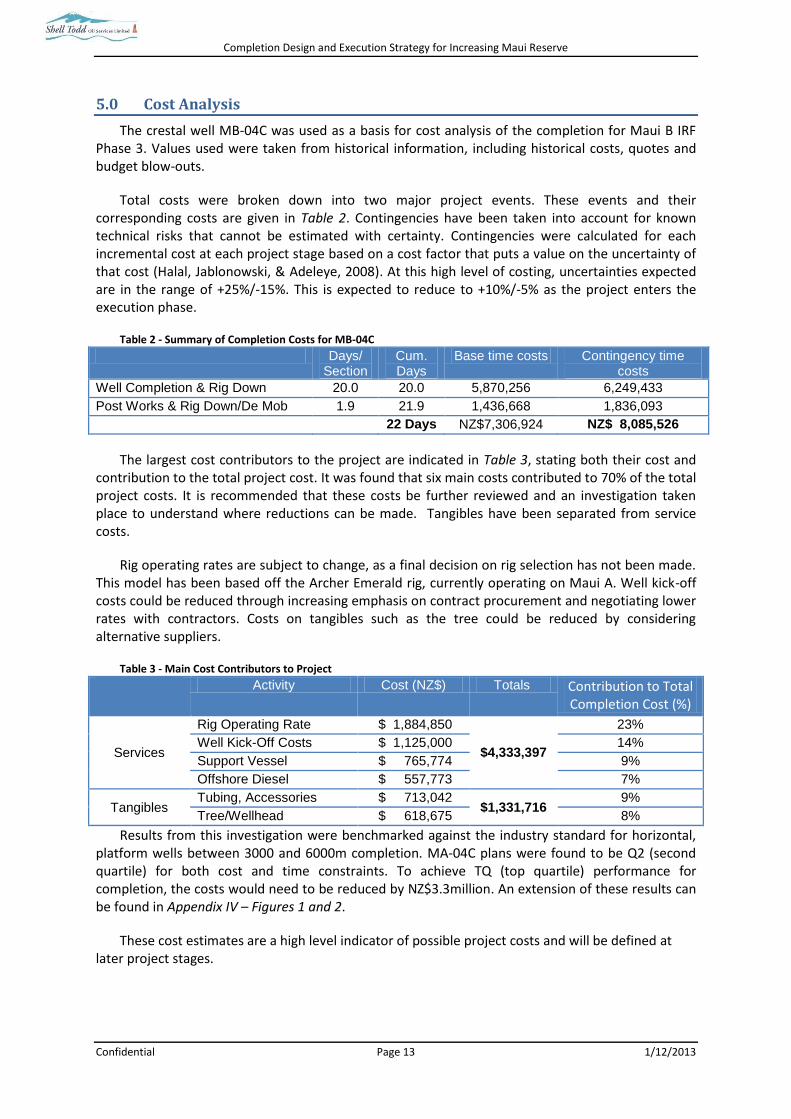
Total costs were broken down into two major project events. These events and their corresponding costs are given in Table 2. Contingencies have been taken into account for known technical risks that cannot be estimated with certainty. Contingencies were calculated for each incremental cost at each project stage based on a cost factor that puts a value on the uncertainty of that cost (Halal, Jablonowski, & Adeleye, 2008). At this high level of costing, uncertainties expected are in the range of +25%/-15%. This is expected to reduce to +10%/-5% as the project enters the execution phase.
Table 2 - Summary of Completion Costs for MB-04C
Days/ Section
Cum. Days
Base time costs Contingency time costs
Well Completion & Rig Down 20.0 20.0 5,870,256 6,249,433
Post Works & Rig Down/De Mob 1.9 21.9 1,436,668 1,836,093
22 Days NZ$7,306,924 NZ$ 8,085,526
The largest cost contributors to the project are indicated in Table 3, stating both their cost and contribution to the total project cost. It was found that six main costs contributed to 70% of the total project costs. It is recommended that these costs be further reviewed and an investigation taken place to understand where reductions can be made. Tangibles have been separated from service costs.
Rig operating rates are subject to change, as a final decision on rig selection has not been made. This model has been based off the Archer Emerald rig, currently operating on Maui A. Well kick-off costs could be reduced through increasing emphasis on contract procurement and negotiating lower rates with contractors. Costs on tangibles such as the tree could be reduced by considering alternative suppliers.
Table 3 - Main Cost Contributors to Project
Activity Cost (NZ$) Totals Contribution to Total Completion Cost (%)
Services
Rig Operating Rate $ 1,884,850
$4,333,397
23%
Well Kick-Off Costs $ 1,125,000 14%
Support Vessel $ 765,774 9%
Offshore Diesel $ 557,773 7%
Tangibles Tubing, Accessories $ 713,042
$1,331,716 9%
Tree/Wellhead $ 618,675 8%
Results from this investigation were benchmarked against the industry standard for horizontal, platform wells between 3000 and 6000m completion. MA-04C plans were found to be Q2 (second quartile) for both cost and time constraints. To achieve TQ (top quartile) performance for completion, the costs would need to be reduced by NZ$3.3million. An extension of these results can be found in Appendix IV – Figures 1 and 2.
These cost estimates are a high level indicator of possible project costs and will be defined at later project stages.
Completion Design and Execution Strategy for Increasing Maui Reserve
Confidential Page 14 1/12/2013
6.0 Execution Strategy
The Maui B IRF Phase 3 project is a campaign where a series of wells will be planned, drilled and complete, following the structure of GWDP. The Discipline Controls and Assurance Framework (DCAF) was used to QA/QC business critical elements of the project.
Through working on a campaign, momentum is built in a way that is not possible in the
execution of single wells. The synergy achieved through this momentum improves the flow of the project. The campaign supports reduced inventories through collaboration of resources. The inclusion of future Maui A work in the campaign is an option to be explored, to capitalise on synergies and possible cost savings.
The recommendations from MB IRF Phase 2 are being adhered in these early stages of planning.
As the project proceeds, it is important to have CWI input at the early stages and throughout. The Maui B IRF Phase 3 project has implemented this through providing a CWI presence at weekly project meetings, project reframing, risk management planning and the Well Feasibility Report.
6.1 Key Performance Indicators
Operation completed with ZERO environmental and personal safety incidents
Completion operation run to timeline provided
Adherence to budget
Delivery of high quality with all acceptance criteria met
Achieve a Non Productive Time (NPT) of ≤11%
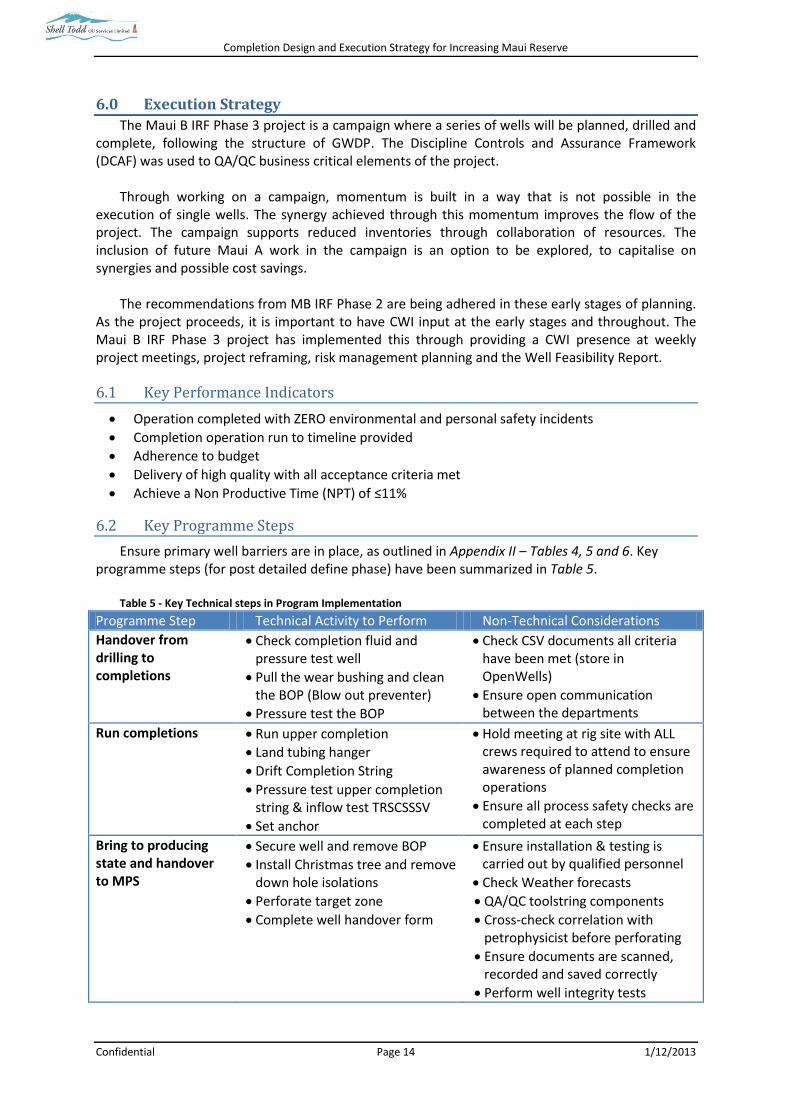
6.2 Key Programme Steps
Ensure primary well barriers are in place, as outlined in Appendix II – Tables 4, 5 and 6. Key programme steps (for post detailed define phase) have been summarized in Table 5.
Table 5 - Key Technical steps in Program Implementation
Programme Step Technical Activity to Perform Non-Technical Considerations
Handover from drilling to completions
Check completion fluid and pressure test well
Pull the wear bushing and clean the BOP (Blow out preventer)
Pressure test the BOP
Check CSV documents all criteria have been met (store in OpenWells)
Ensure open communication between the departments
Run completions
Run upper completion
Land tubing hanger
Drift Completion String
Pressure test upper completion string & inflow test TRSCSSSV
Set anchor
Hold meeting at rig site with ALL crews required to attend to ensure awareness of planned completion operations
Ensure all process safety checks are completed at each step
Bring to producing state and handover to MPS
Secure well and remove BOP
Install Christmas tree and remove down hole isolations
Perforate target zone
Complete well handover form
Ensure installation & testing is carried out by qualified personnel
Check Weather forecasts
QA/QC toolstring components
Cross-check correlation with petrophysicist before perforating
Ensure documents are scanned, recorded and saved correctly
Perform well integrity tests
Completion Design and Execution Strategy for Increasing Maui Reserve
Confidential Page 15 1/12/2013
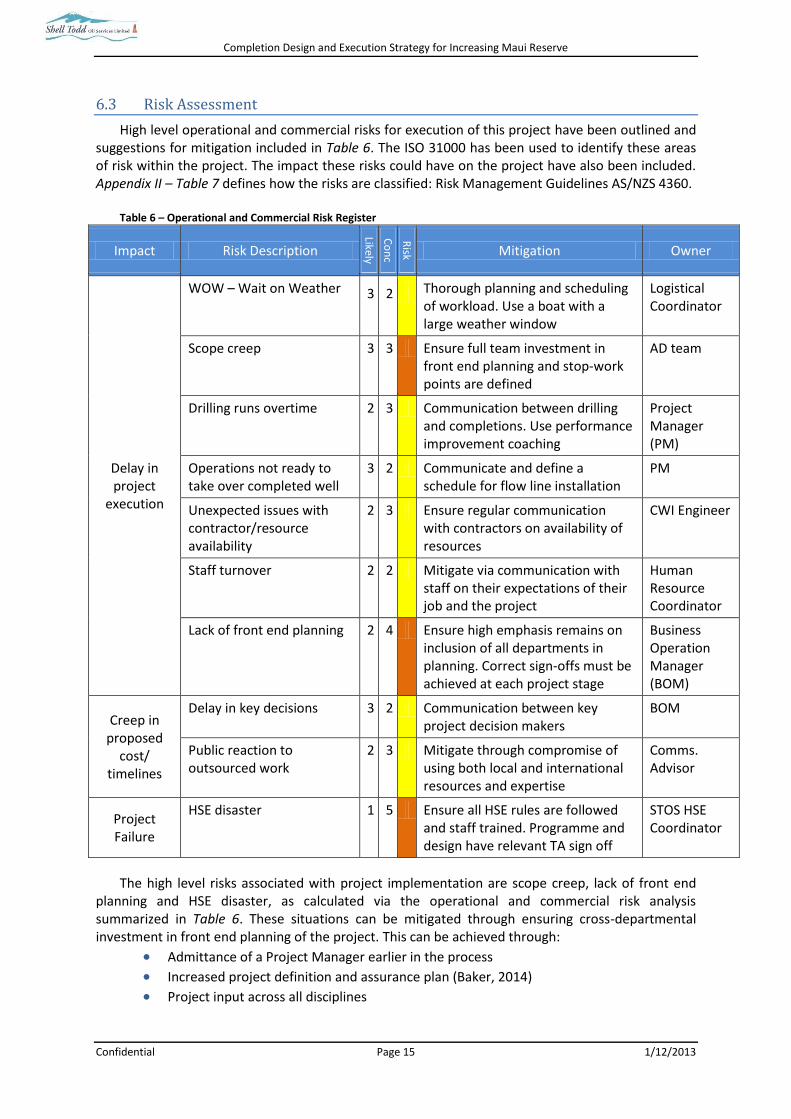
6.3 Risk Assessment
High level operational and commercial risks for execution of this project have been outlined and suggestions for mitigation included in Table 6. The ISO 31000 has been used to identify these areas of risk within the project. The impact these risks could have on the project have also been included. Appendix II – Table 7 defines how the risks are classified: Risk Management Guidelines AS/NZS 4360.
Table 6 – Operational and Commercial Risk Register
Impact Risk Description
Likely
Co
nc
Risk Mitigation Owner
Delay in project
execution
WOW – Wait on Weather 3 2 Thorough planning and scheduling of workload. Use a boat with a large weather window
Logistical Coordinator
Scope creep 3 3 Ensure full team investment in front end planning and stop-work points are defined
AD team
Drilling runs overtime 2 3 Communication between drilling and completions. Use performance improvement coaching
Project Manager (PM)
Operations not ready to take over completed well
3 2 Communicate and define a schedule for flow line installation
PM
Unexpected issues with contractor/resource availability
2 3 Ensure regular communication with contractors on availability of resources
CWI Engineer
Staff turnover 2 2 Mitigate via communication with staff on their expectations of their job and the project
Human Resource Coordinator
Lack of front end planning 2 4 Ensure high emphasis remains on inclusion of all departments in planning. Correct sign-offs must be achieved at each project stage
Business Operation Manager (BOM)
Creep in proposed
cost/ timelines
Delay in key decisions 3 2 Communication between key project decision makers
BOM
Public reaction to outsourced work
2 3 Mitigate through compromise of using both local and international resources and expertise
Comms. Advisor
Project Failure
HSE disaster 1 5 Ensure all HSE rules are followed and staff trained. Programme and design have relevant TA sign off
STOS HSE Coordinator
The high level risks associated with project implementation are scope creep, lack of front end planning and HSE disaster, as calculated via the operational and commercial risk analysis summarized in Table 6. These situations can be mitigated through ensuring cross-departmental investment in front end planning of the project. This can be achieved through:
Admittance of a Project Manager earlier in the process Increased project definition and assurance plan (Baker, 2014) Project input across all disciplines
Completion Design and Execution Strategy for Increasing Maui Reserve
Confidential Page 16 1/12/2013
7.0 Review
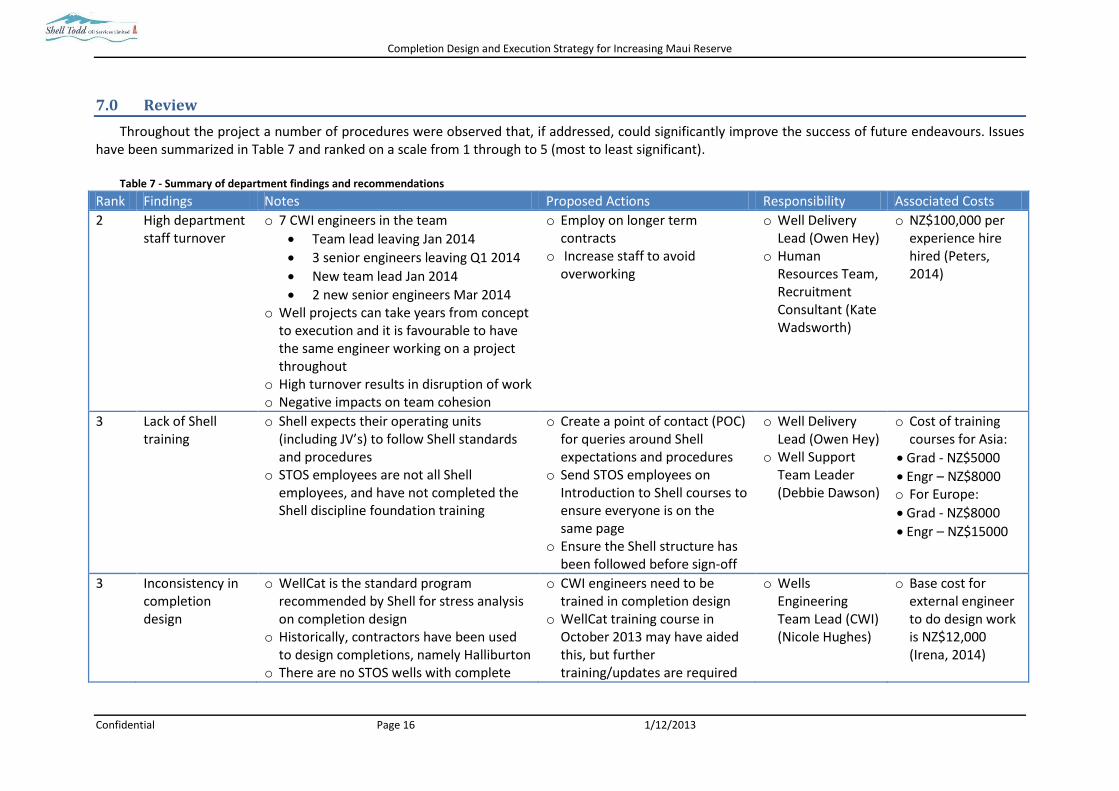
Throughout the project a number of procedures were observed that, if addressed, could significantly improve the success of future endeavours. Issues have been summarized in Table 7 and ranked on a scale from 1 through to 5 (most to least significant).
Table 7 - Summary of department findings and recommendations
Rank Findings Notes Proposed Actions Responsibility Associated Costs
2 High department staff turnover
o 7 CWI engineers in the team
Team lead leaving Jan 2014
3 senior engineers leaving Q1 2014
New team lead Jan 2014
2 new senior engineers Mar 2014 o Well projects can take years from concept
to execution and it is favourable to have the same engineer working on a project throughout
o High turnover results in disruption of work o Negative impacts on team cohesion
o Employ on longer term contracts
o Increase staff to avoid overworking
o Well Delivery Lead (Owen Hey)
o Human Resources Team, Recruitment Consultant (Kate Wadsworth)
o NZ$100,000 per experience hire hired (Peters, 2014)
3 Lack of Shell training
o Shell expects their operating units (including JV’s) to follow Shell standards and procedures
o STOS employees are not all Shell employees, and have not completed the Shell discipline foundation training
o Create a point of contact (POC) for queries around Shell expectations and procedures
o Send STOS employees on Introduction to Shell courses to ensure everyone is on the same page
o Ensure the Shell structure has been followed before sign-off
o Well Delivery Lead (Owen Hey)
o Well Support Team Leader (Debbie Dawson)
o Cost of training courses for Asia:
Grad - NZ$5000
Engr – NZ$8000 o For Europe:
Grad - NZ$8000
Engr – NZ$15000
3 Inconsistency in completion design
o WellCat is the standard program recommended by Shell for stress analysis on completion design
o Historically, contractors have been used to design completions, namely Halliburton
o There are no STOS wells with complete
o CWI engineers need to be trained in completion design
o WellCat training course in October 2013 may have aided this, but further training/updates are required
o Wells Engineering Team Lead (CWI) (Nicole Hughes)
o Base cost for external engineer to do design work is NZ$12,000 (Irena, 2014)

Completion Design and Execution Strategy for Increasing Maui Reserve
Confidential Page 17 1/12/2013
data in WellCat o Support must be provided to CWI engineers as they endeavour to design completion in-house
o Stop using contractors for completion design and turn focus into our own department
2 Lack of inter-department communication
o This leads to NPT time, project overrun and non adherence to budgets
o CWI department has regular (twice-weekly) meetings with high attendance, allowing easy flow of communication
o Wells department (Drilling and CWI) have regular (fortnightly) meetings with high attendance allowing flow of information on proceedings
o The MB IRF Ph3 project group has regular (weekly) meetings, however these are often met with poor attendance from key parties in the asset development group, causing:
Lack of clear communication
Overstretching of deadlines as absence of required personnel
Project delays
o Insist on attendance from all key project member
o Enforce set deadlines
o Project Leader (in this case, David Hadley)
o Wells Engineering Team Lead (CWI) (Nicole Hughes)
o Difficult to quantify, see Project overrun and Acceptance of exceeding budgets
1 Project overrun o Project overrun can cost up to NZ$220,000/day in NPT
o During the last MB IRF Ph2 completions, NPT cost the project NZ$7.5million
o Increase front end planning o Carry out more thorough AAR’s
to increase understanding of why these mistakes are occurring
o Run sensitivity analysis on budgets in areas that have been known to blow out
o Well Delivery Lead (Owen Hey)
o Wells Engineering Team Lead (CWI) (Nicole Hughes)
o CWI Engineer
o Project overrun can cost up to NZ$220,000/day in NPT
Completion Design and Execution Strategy for Increasing Maui Reserve
Confidential Page 18 1/12/2013
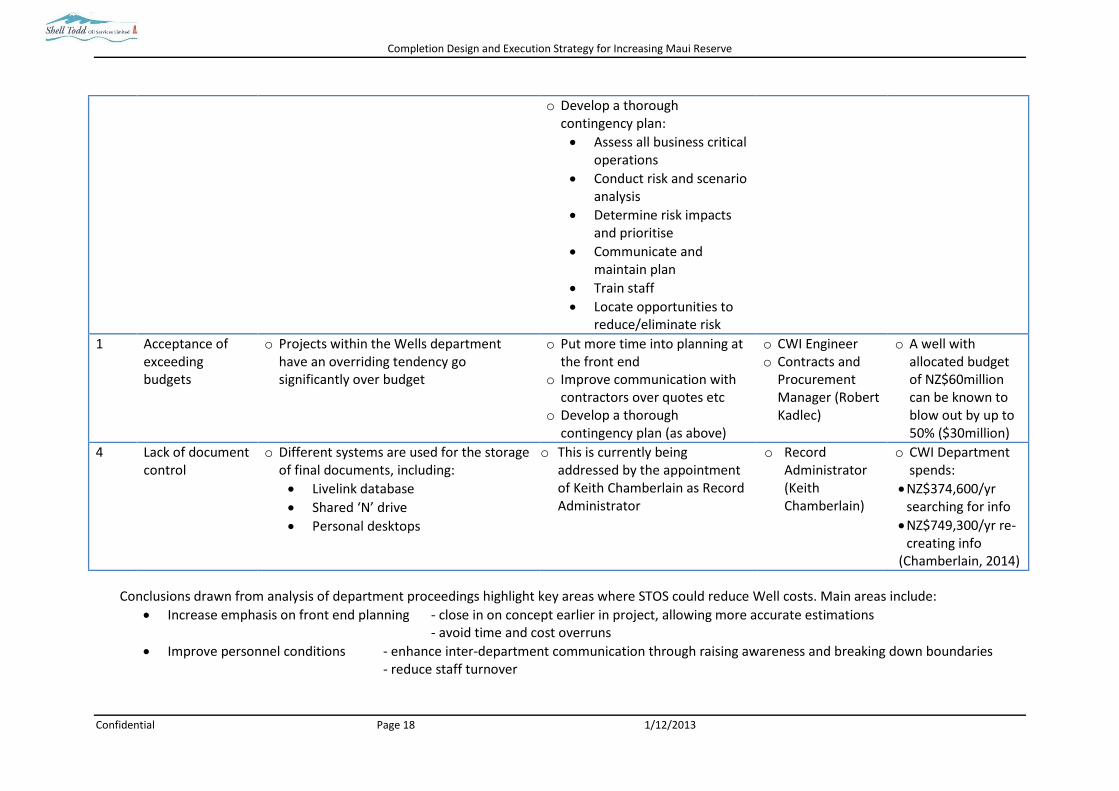
o Develop a thorough contingency plan:
Assess all business critical operations
Conduct risk and scenario analysis
Determine risk impacts and prioritise
Communicate and maintain plan
Train staff
Locate opportunities to reduce/eliminate risk
1 Acceptance of exceeding budgets
o Projects within the Wells department have an overriding tendency go significantly over budget
o Put more time into planning at the front end
o Improve communication with contractors over quotes etc
o Develop a thorough contingency plan (as above)
o CWI Engineer o Contracts and
Procurement Manager (Robert Kadlec)
o A well with allocated budget of NZ$60million can be known to blow out by up to 50% ($30million)
4 Lack of document control
o Different systems are used for the storage of final documents, including:
Livelink database
Shared ‘N’ drive
Personal desktops
o This is currently being addressed by the appointment of Keith Chamberlain as Record Administrator
o Record Administrator (Keith Chamberlain)
o CWI Department spends:
NZ$374,600/yr searching for info
NZ$749,300/yr re-creating info
(Chamberlain, 2014)
Conclusions drawn from analysis of department proceedings highlight key areas where STOS could reduce Well costs. Main areas include:
Increase emphasis on front end planning - close in on concept earlier in project, allowing more accurate estimations - avoid time and cost overruns
Improve personnel conditions - enhance inter-department communication through raising awareness and breaking down boundaries - reduce staff turnover
Completion Design and Execution Strategy for Increasing Maui Reserve – Appendix I
Confidential Page 19 1/12/2013
7.0 After Action Review
This section documents project strengths to be replicated in future projects and opportunities for improvement. It also includes a summary of personal development throughout the course of the project.
7.1 Project Strengths
Communication with project Sponsor was a strong contributor to project success, as regular weekly meetings proceeded throughout the course of the project
Assistance from respective team members (both CWI and MB IRF Ph3) was excellent throughout the project, and final successes would not have been achievable without the support received
Schedule adherence was strong towards the end of the project. Sponsor Nicole Hughes, resigned from STOS on the 31st January 2014 so final project draft was completed and checked earlier that anticipated
7.2 Future Project Improvements
Technical aspects of the project were challenging this caused a slight timeline overrun in the early stages of the project. This time was re-made in Phase 2 of the project
Human resources are an important aspect of project success, but consultation with different staff can be difficult and it is recommended that meetings be organised well in advance of requirement
7.3 Reflection of Personal Value
Entry into the oil and gas industry proved difficult on a number of levels; technically, administratively and socially. I had an intensive four weeks coming up to speed on wells and in particular, completion design. This was only achieved through the help of my direct CWI team, and those contributing to my project from the Asset Development group and the Maui B IRF Phase 3 team.
Administratively it was challenging moving to a new town and entering an environment that greatly contrasted the five years spent as a student of the University of Canterbury. I encountered difficulty explaining my position at STOS; I was working here in both a short term (MEM project) and long term (Shell Graduate) capacity. I found the response from staff encouraging and this helped me succeed in my contractor role.
Oil and gas is a male dominated industry, with only 10% of Wells Engineers being female. The average age in the industry is relatively high, with many current STOS Well Engineers looking at retirement within the next 10 years. Whilst I certainly found it challenging moving into this environment, I found I was greeted warmly and have had ongoing support from a range of people throughout STOS. Nicole Hughes has become a valued role model to me, as a young woman achieving so highly in the career path I hope to follow.
The acceptance, encouragement and inclusiveness I received from members of the Maui B IRF Phase 3 was vital in improving my professional confidence. These experiences allowed me to build business relationships and understand STOS in a broader context than would otherwise have been achievable.

Completion Design and Execution Strategy for Increasing Maui Reserve – Appendix I
Confidential Page 20 1/12/2013
8.0 Conclusions and Recommendations
Feasible options for completion design and execution strategy for proposed sidetrack wells on Maui B were investigated. Through recognising day-to-day business challenges and synthesising the skills and principles learnt in the MEM program, several recommendations have been provided to add value for both the CWI department and STOS as an organization – Table 9.
Table 8 - Technical Conclusions and Recommendations
Priority Conclusions Recommendations
1 The base cost of well completions is NZ$8million, including contingencies
Reduce costs by NZ$3million to achieve top quartile performance, focus on:
Emphasis on contract procurement
Opening up to various contractor options
2 Proposed completion design is structurally feasible for the trajectories investigated for the three wells
Ensure WellCat models are updated as information becomes more defined at later stages of the project
3 Well completion will be completed in three stages and take a total of 22 days:
Handover from drilling to completions
Running completions
Bring to producing state and handover
Engage with involved staff to ensure everyone is aware of the work to be done, safety requirements and deadlines that must be met
Table 9 - Project Conclusions and Recommendations
Priority Conclusions Recommendations
1 Front end planning is not
completed adequately within
STOS
Increase emphasis and awareness on front end work – include all relevant staff (that may not be critical up front) in front end planning. Focus on
Improved project definition
Make timely key decisions, don’t leave options too open
Ensure historical findings are analysed
2 CWI has developed a clear direction and open communication of strategy throughout the department
Keep staff engaged and challenged through providing
overseas opportunities to broaden their knowledge and
experience base
3 Inter-department communication is weak
In the planned interior redecorating of the STOS building, explore options improving flow between different departments
4 The main project risks include:
Scope creep
Lack of front end planning
HSE disaster
These situations can be mitigated through:
Admittance of a Project Manager early in the process
Increased project definition and assurance plan
5 Benchmarking is not a priority for
completion design
Improve emphasis on benchmarking against industry standard. This gives international perspective on STOS cost and time requirements

Completion Design and Execution Strategy for Increasing Maui Reserve – Appendix I
Confidential Page 21 1/12/2013
9.0 Bibliography
Adeleye, S. (2013). Appendix 1 Well Cost Estimating Code of Practice Summary. Shell International Global Networks.
Altintas, A. (2013, November 21). Reservoir Engineering in MBIRF Ph3. (A. Hardy, Interviewer)
Baker, T. (2014, 1 28). Project Management. (A. Hardy, Interviewer)
Batavia, R. (2001). Front End Loading for Life Cycle Success. Offshore Technology Conference (p. 7). Houston: Offshore Techology Conference.
Bellarby, J. (2012). Well Completion Design. Amsterdam: Blsevier Publications.
Chamberlain, K. (2014, 1 27). Document Management. (A. Hardy, Interviewer)
Chew, J. (2013). MA-09B Completion Programme. New Plymouth: Shell Todd Oil Services Ltd.
Dyke, K. V. (2009). A Primer of Oilwell Service, Workover, and Completion. Austin: Petroleum Extension Service.
Halal, A., Jablonowski, C., & Adeleye, S. (2008). Well Cost Estimating Code of Practise. Houston: Shell International Exploration and Production Inc.
Halliburton. (2013). Completion Solutions. Halliburton.
Halliburton Landmark. (2013). WellCat. Retrieved 01 15, 2014, from Halliburton Landmark: https://www.landmarksoftware.com/Pages/WELLCAT.aspx
Hardy, A. (2013). Maui B IRF Phase 3 Project Charter. New Plymouth.
Irena, N. (2014, 1 22). Halliburton Invoices. (A. Hardy, Interviewer)
Klever, F. J. (2013). Casing and Tubing Design Manual. Royal Dutch Shell.
Marshall, P. (2013, November 8). CWI perspective on MBIRF Ph2. (A. Hardy, Interviewer)
Okstad, E. H. (2006). Decision Framework for Well Delivery Processes. Trondheim: Norwegian University of Science and Technology.
Passalacua, H., Black, A., Barri, K., & Sapuelli, L. A. (2013). Front End Loading (FEL) Process Supporting Optimum Field Development Desicion Making. Journal of Petroleum Engineers , 12.
Patrick, H. A., & Kumar, V. R. (2012). Managing Workplace Diversity. Sage Journals , 15.
Peters, M. (2014, January 20). Human Resources Delivery Services Advisor. (A. Hardy, Interviewer)
PetroWiki. (2013, 09 12). Glossary. Retrieved 2 3, 2014, from PetroWiki: http://petrowiki.org/Glossary%3ATubing_anchor
Completion Design and Execution Strategy for Increasing Maui Reserve – Appendix I
Confidential Page 22 1/12/2013
PetroWiki. (2013, September 16). PetroWiki. Retrieved January 16, 2014, from Glossary: http://petrowiki.org/Glossary%3ADown_dip
Royal Dutch Shell. (2011, April 4). Global Well Delivery Process. Retrieved 01 17, 2014, from Shell Wiki: http://sww.wiki.shell.com/wiki/index.php/GWDP
Royal Dutch Shell. (2013, 01 7). Opportunity Assurance Plan (OAP), including PCAP. Retrieved 01 17, 2014, from Shell Wiki: http://sww.wiki.shell.com/wiki/index.php/Project_Controls_and_Assurance_Plan
Rushmore Reviews. (2014). Vision and Mission. Retrieved 2014, from Rushmore Reviews offset well data: http://www.rushmorereviews.com/liveMarketing/AboutUs
Sedgwick, P. (2012). Maui B IRF Phase 2 After Action Review. New Plymouth: Shell Todd Oil Services Ltd.
Sedgwick, P., & Hughes, N. (2013). Maui-B IRF Phase 3 - Wells Feasibility Report . New Plymouth: Shell Todd Oil Services.
Traylor, G. (2011). Lean interacts with the oil, gas industry. Exploration and Production , 3.

Completion Design and Execution Strategy for Increasing Maui Reserve – Appendix I
Confidential Page 23 1/12/2013
Appendix I - Research
1.0 Literature Review
A literature review was carried out to develop understanding and critically analyse topics within the scope of the project. Four main topics were covered in this literature review and these are discussed in Sections 1.1 through 1.4.
1.1 Completion Design
Completion and Well Intervention Engineering is a growing industry. New Zealand currently lacks competencies in this area and an educational system to build the relevant skills. Shell New Zealand (through STOS) recruits engineering graduates and trains them in an international Completion and Well Intervention Engineering course. Despite the lack of local knowledge, there is a lot of information available in the form of textbooks, research papers, previous completion designs and reviews on historical work.
There are several different completion types that can be implemented in a well. A liner is a completion type that hangs from the bottom of the intermediate casing, instead of reaching all the way to the surface. A cemented and perforated liner is cemented in place as the casing would be. Perforations are then created through the liner and cement into the formation (Halliburton, 2013). Cement is applied around the liner to prevent the escaping of hydrocarbons. Perforating is the process of breaking through the liner and cement, into the formation using charge. A perforating gun is used for this action. The gun creates perforations through the liner that allow fluid to flow from the formation into the well (Dyke, 2009).
In contrast to a perforated liner, a slotted liner is one that has pre-made holes. Because of this, the slotted liner needs to be aligned in the correct position (in the reservoir targeted) when it is being run in hole. It is important to consider these factors, and the implications of not reaching Total Depth (TD) of the well with the slotted liner. A perforated liner is the more reliable option as the position of perforations can be adjusted if there are issues with the liner reaching TD.
Figure 6 - Metallurgy Selection (Bellarby, 2012)
Completion Design and Execution Strategy for Increasing Maui Reserve – Appendix I
Confidential Page 24 1/12/2013
The material selected for the tubing and liner was 13Cr L80. This material is designed to withstand corrosive (above average CO2) and non sour (very low N2S) environments. The cost of the material is approximately three times the cost of carbon steel so should be deemed necessary before implementation (Bellarby, 2012).
The program used for stress analysis on completions was Halliburton’s Landmark program, WellCat. This allows the simulation of fluid flow and heat transfer during completion, production, stimulation, testing and well-servicing operations. It is used to analyse tubing loads and movements, buckling behaviour, and design integrity under complex mechanical, fluid-pressure, and thermal-loading conditions (Halliburton Landmark, 2013).
In summary, WellCat is used to understand the likelihood of negative effects on the completion, such as annular trap pressure and unstable load stresses. It ensures the design is safe and can withstand all stresses that may be applied to the completion throughout its life.
Being a niche industry, there are no competing products that carry out the same function as WellCat. Schlumberger are developing a similar programme but as of now, there is nothing at a comparable level.
1.2 Shell Standards
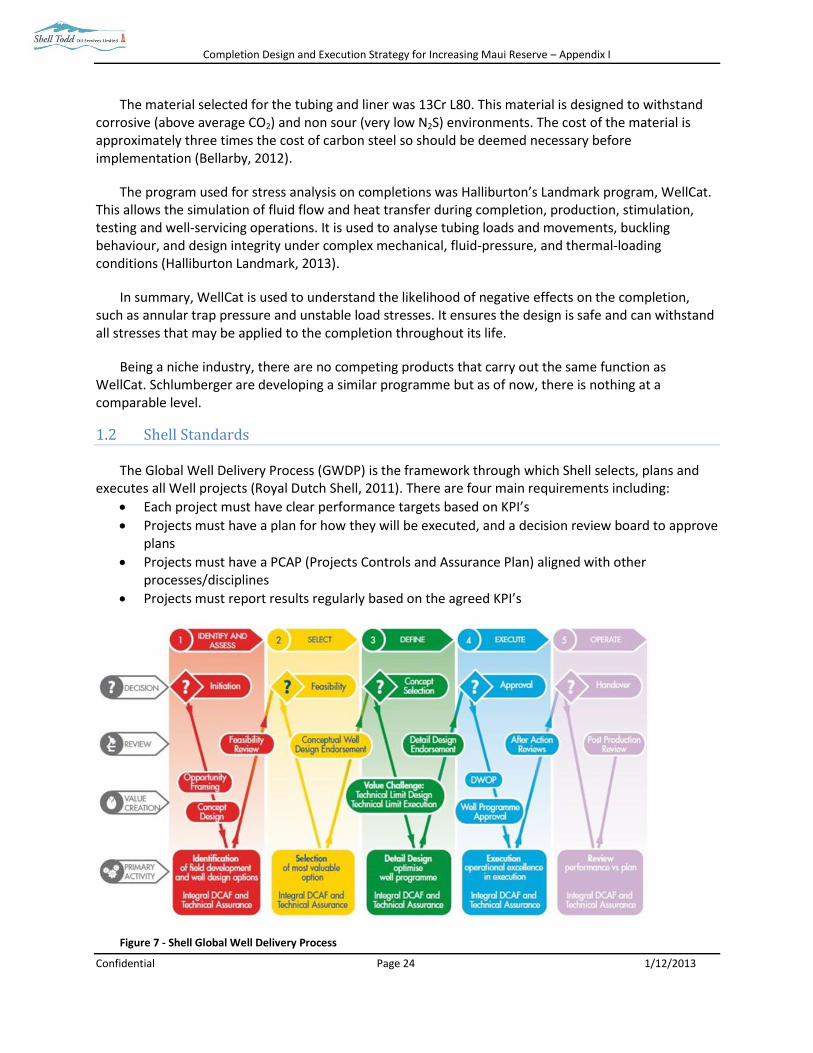
The Global Well Delivery Process (GWDP) is the framework through which Shell selects, plans and executes all Well projects (Royal Dutch Shell, 2011). There are four main requirements including:
Each project must have clear performance targets based on KPI’s
Projects must have a plan for how they will be executed, and a decision review board to approve plans
Projects must have a PCAP (Projects Controls and Assurance Plan) aligned with other processes/disciplines
Projects must report results regularly based on the agreed KPI’s
Figure 7 - Shell Global Well Delivery Process

Completion Design and Execution Strategy for Increasing Maui Reserve – Appendix I
Confidential Page 25 1/12/2013
Decision Gates (DGs) must be met at the end of each project phase, as defined in the GWDP. It must be ensured that Discipline Controls and Assurance Framework (DCAF) and Technical Assurance (TA) are employed throughout the project to ensure it remains on track to meeting predefined requirements.
As a part of the GWDP, the DCAF is implemented to standardise technical assurance across all disciplines. The DCAF enhances transparency by clarifying which deliverables are business-critical (Okstad, 2006). In summary, the DCAF is a Quality Assurance/Quality Control (QA/QC) framework vital in all opportunity realisation process phases. Through standardisation of these processes, Shell is ensuring each process is being checked to an appropriate standard.
The Well Cost Estimating Cost of Practice states that the required accuracy for costing in the Select Phase of GWDP is 15%. This can be found in the Shell International Global Networks system. Major risks, expected downtime, spread in contracts and durations should be quantified in Select Phase of GWDP. The practice ensures that relevant historical performance is considered in appropriate detail for putting together cost estimates (Adeleye, 2013).
The major strength of using the Well Cost Estimating Cost of Practice is the consistency with which costs are calculated throughout all projects. It provides structure and uniformity throughout the entire business. Limitations of the system arise where completion design is out of the ordinary scope, or new work is being done in a different area and historical costs are not applicable.
1.3 Improvements in Completion Engineering
1.3.1 Benchmarking
Benchmarking is a global technique used to compare business processes and performance against industry standards and best practice. The use of this technique in well engineering ensures employees understand how the company is performing relative to industry competitors. Rushmore Performance Reviews is an online database that serves as a specific tool for well engineers to benchmark their work.
It can be difficult to benchmark completion and well intervention activities due to the nature of their incremental production increases. However, by looking at planned versus actual ratios for Operational Time (OT) for specific activities, the work completed can be benchmarked (Rushmore Reviews, 2014).
Rushmore Reviews is an industry standard for life-cycle well data sharing with the participation of the majority of oil and gas operators globally. The website provides a quick and easy forum for accessing essential data that can be used for benchmarking. Conversely, the site has no direct competition which could lead to a manipulation of the market and information. To date however, the review website has had excellent feedback and is considered a useful tool that should be utilised further throughout the industry.
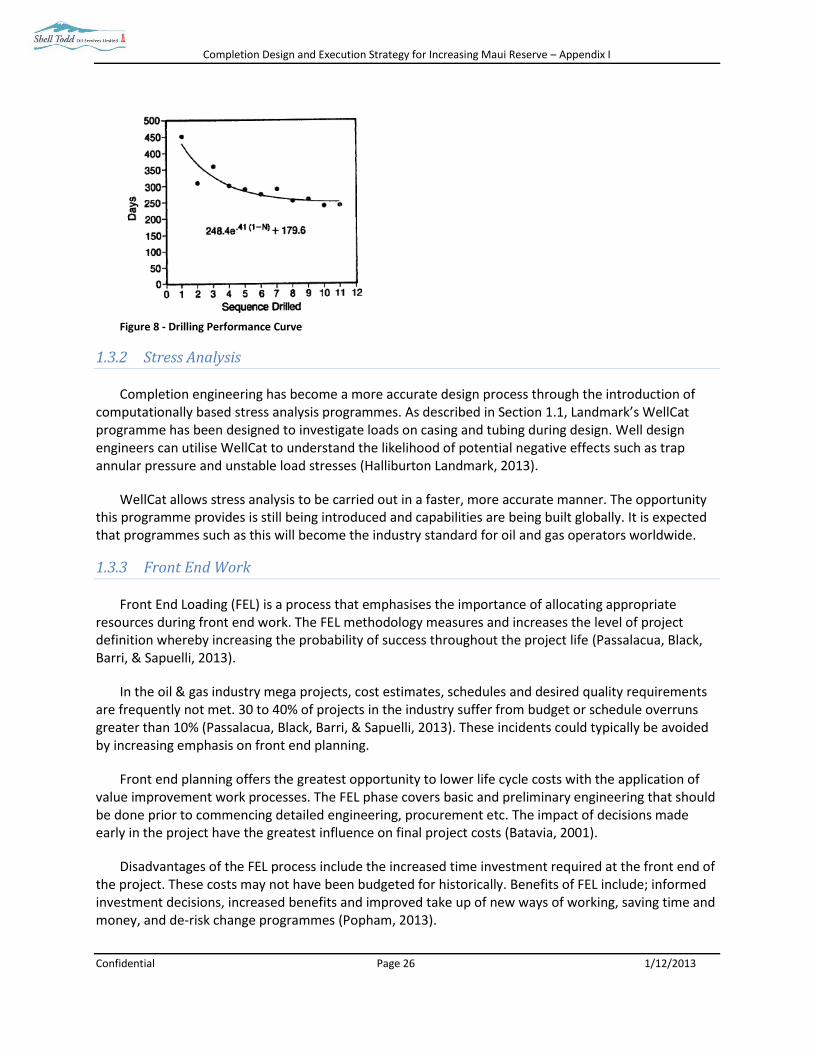
The Drilling Performance Curve (DPC) is another tool that can be used to rank Well Engineering performance. The DPC is used to assess the drilling performance in an area over a consecutive series of similar wells. The method can dictate the strategy for a drilling programme. Figure 8 shows a typical learning curve for a sequence of drilling events in a similar area. A DCP can indicate an organisations technological and operational capability and rate of learning (Brett & Millheim, 1986). This method could be implemented by the organisation to ensure their campaigns as they progress from well to well.
Completion Design and Execution Strategy for Increasing Maui Reserve – Appendix I
Confidential Page 26 1/12/2013
Figure 8 - Drilling Performance Curve
1.3.2 Stress Analysis
Completion engineering has become a more accurate design process through the introduction of computationally based stress analysis programmes. As described in Section 1.1, Landmark’s WellCat programme has been designed to investigate loads on casing and tubing during design. Well design engineers can utilise WellCat to understand the likelihood of potential negative effects such as trap annular pressure and unstable load stresses (Halliburton Landmark, 2013).
WellCat allows stress analysis to be carried out in a faster, more accurate manner. The opportunity this programme provides is still being introduced and capabilities are being built globally. It is expected that programmes such as this will become the industry standard for oil and gas operators worldwide.
1.3.3 Front End Work
Front End Loading (FEL) is a process that emphasises the importance of allocating appropriate resources during front end work. The FEL methodology measures and increases the level of project definition whereby increasing the probability of success throughout the project life (Passalacua, Black, Barri, & Sapuelli, 2013).
In the oil & gas industry mega projects, cost estimates, schedules and desired quality requirements are frequently not met. 30 to 40% of projects in the industry suffer from budget or schedule overruns greater than 10% (Passalacua, Black, Barri, & Sapuelli, 2013). These incidents could typically be avoided by increasing emphasis on front end planning.
Front end planning offers the greatest opportunity to lower life cycle costs with the application of value improvement work processes. The FEL phase covers basic and preliminary engineering that should be done prior to commencing detailed engineering, procurement etc. The impact of decisions made early in the project have the greatest influence on final project costs (Batavia, 2001).
Disadvantages of the FEL process include the increased time investment required at the front end of the project. These costs may not have been budgeted for historically. Benefits of FEL include; informed investment decisions, increased benefits and improved take up of new ways of working, saving time and money, and de-risk change programmes (Popham, 2013).
Completion Design and Execution Strategy for Increasing Maui Reserve – Appendix I
Confidential Page 27 1/12/2013
1.4 Ethical Considerations
In the oil and gas industry, cultural diversity is prevalent in the workplace. There is no education system for training oil and gas engineers locally and therefore, companies up-skill local staff or hire experienced international personnel. Typically, oil and gas operators have both local and expatriate staff, creating an environment containing varied cultural beliefs. Therefore it is crucial that this workplace diversity is managed in a way that promotes a positive working environment.
The predominant barriers to accepting diversity are discrimination, prejudice, and ethnocentrism. Strategies that can be used in increasing inclusiveness in organisations include education about cultural differences, encouraging employees to take overseas assignments, and encouraging awareness of biases and prejudices that may be prevalent (Patrick & Kumar, 2012). Organisations should implement a combination of these techniques, allowing the company to maximise on the benefits of diversity whilst reducing prejudices.
There are numerous personality tests that can be utilised to improve the understanding of individuals’ behaviours and actions. The purpose of these tests in a corporate environment is to enhance employees understanding of their colleagues behaviours and improve interactions. The Myers Briggs Type Indicator (MBTI) test is designed to make the theory of different psychological types understandable and useful in everyday life. The idea is that seemingly random behaviour is actually quite orderly, due to differences in individuals perceptions and/or judgments.
There are critics to the Myers Briggs test that bring to light the possibility of people being incorrectly categorised. Critics state that similar scores may be given to people with vastly different personalities, i.e. introverts and extraverts (Moffa, 2011). However MBTI has many positives, as shown by its popularity (utilised globally) and resilience in the market despite numerous competitors. Myers Briggs is understood to be one of the best methods for promoting understanding and appreciation of differences between personality types (The Myers & Briggs Foundation).
Another popular personality test is the 16 Personality Factor (16PF) questionnaire that describes five main personality factors as being extraversion, tough-mindedness, self-control, anxiety and independence. The questionnaire is designed as a tool to aid professionals in recruitment of appropriate individuals for the organisation’s needs, particularly in terms of problem solving styles and interpersonal skills (IPAT People Insights, 2013). Downsides to 16PF include the non-replication of the theory and the factors and their descriptions do not correlate. These issues need to be acknowledged if the test is to be implemented (Psychology of Personality).
Belbin team roles are a measure of behaviour rather than personality. It highlights individuals tendencies to “behave, contribute and interrelate with others in a particular way,” states Dr Meredith Belbin. The aim of this method is to understand behaviour and ensure workplaces are employing a range of these types (Leadership Solutions Belbin NZ, 2007). Limitations of Belbin include its focus on a work and team setting. However, Belbin has a cultural bias as the theory is mainly focused around upper-management level executives in Britain (Belbin Improving Teams).
Myers Briggs Type Indicator is the most relevant method for the oil and gas industry, as determined through comparing and contrasting different methods for enhancing cohesion within diverse groups. This is due to its applicability over a range of demographics. Whilst the implementation of this programme may not be infallible, it promotes discussion around the topic and brings to light issues of diversity that may otherwise be swept under the table.

Completion Design and Execution Strategy for Increasing Maui Reserve – Appendix I
Confidential Page 28 1/12/2013
Bibliography
Adeleye, S. (2013). Appendix 1 Well Cost Estimating Code of Practice Summary. Shell International Global Networks.
Batavia, R. (2001). Front End Loading for Life Cycle Success. Offshore Technology Conference (p. 7). Houston: Offshore Techology Conference.
Belbin Improving Teams. (n.d.). Limitations of Belbin. Retrieved 2 10, 2014, from Belbin Improving Teams: http://www.improvingteams.com/blog/the-limitations-of-belbin/
Bellarby, J. (2012). Well Completion Design. Amsterdam: Blsevier Publications.
Brett, J. F., & Millheim, K. K. (1986). The Drilling Performance Curve: A Yardstick for Judging Drilling. Society of Petroleum Engineers Journal , 12.
Dyke, K. V. (2009). A Primer of Oilwell Service, Workover, and Completion. Austin: Petroleum Extension Service.
Halal, A., Jablonowski, C., & Adeleye, S. (2008). Well Cost Estimating Code of Practise. Houston: Shell International Exploration and Production Inc.
Halliburton Landmark. (2013). WellCat. Retrieved 01 15, 2014, from Halliburton Landmark: https://www.landmarksoftware.com/Pages/WELLCAT.aspx
IPAT People Insights. (2013). 16PF Questionnaire. Retrieved 2 13, 2014, from ipat people insights: http://www.ipat.com/16PFQuestionnaire/Pages/default.aspx
Klever, F. J. (2013). Casing and Tubing Design Manual. Royal Dutch Shell.
Leadership Solutions Belbin NZ. (2007). The Concepts . Retrieved 2 13, 2014, from Leadership Solutions Belbin NZ: http://www.leadershipsolutions.co.nz/belbin.cfm
Moffa, M. (2011, 4 1). A Critique of the Myers Briggs Type Indicator. Retrieved 2 13, 2014, from Recruiter: Recruiter.comhttp://www.recruiter.com/i/critique-of-the-myers-briggs-type-indicator-critique/
Okstad, E. H. (2006). Decision Framework for Well Delivery Processes. Trondheim: Norwegian University of Science and Technology.
Passalacua, H., Black, A., Barri, K., & Sapuelli, L. A. (2013). Front End Loading (FEL) Process Supporting Optimum Field Development Desicion Making. Journal of Petroleum Engineers , 12.
Patrick, H. A., & Kumar, V. R. (2012). Managing Workplace Diversity. Sage Journals , 15.
Popham, M. C. (2013). Front End Loading for Change Management and Capability Delivery. Society of Petroleum Engineers .

Completion Design and Execution Strategy for Increasing Maui Reserve – Appendix I
Confidential Page 29 1/12/2013
Psychology of Personality. (n.d.). Cattell's Personality Theory. Retrieved 2 13, 2014, from Psychology of Personality: https://sites.google.com/site/psychologyofpersonalityperiod1/home/type-and-trait-theories/cattell-s-personality-theory
Royal Dutch Shell. (2011, April 4). Global Well Delivery Process. Retrieved 01 17, 2014, from Shell Wiki: http://sww.wiki.shell.com/wiki/index.php/GWDP
Royal Dutch Shell. (2013, 01 7). Opportunity Assurance Plan (OAP), including PCAP. Retrieved 01 17, 2014, from Shell Wiki: http://sww.wiki.shell.com/wiki/index.php/Project_Controls_and_Assurance_Plan
Rushmore Reviews. (2014). Vision and Mission. Retrieved 2014, from Rushmore Reviews offset well data: http://www.rushmorereviews.com/liveMarketing/AboutUs
The Myers & Briggs Foundation. (n.d.). MBTI Basics. Retrieved 2 13, 2014, from The Myers & Briggs Foundation: http://www.myersbriggs.org/my-mbti-personality-type/mbti-basics/
Figure 4 - Graphical explanation of the Opportunity Assurance Plan (OAP) (Royal Dutch Shell, 2013)

Completion Design and Execution Strategy for Increasing Maui Reserve – Appendix I
Confidential Page 30 1/12/2013
Table 1 - Completion Options Ranking (Sedgwick & Hughes, Maui-B IRF Phase 3 - Wells Feasibility Report , 2013)
Completion
Component Options
Cemented liner w/
liner hanger and
anchor
Cemented liner w/
drop off liner and
packer
Drilled-in
cemented liner,
perforate
Cemented liner
with swell
packers
Slotted liner, swell
packers w/ liner
hanger and anchor
Sliding sleeves
and swell
packers,
uncemented
Cemented
Monobore
Blank liner,
uncemented, with
swell packers,
perforate
Cemented liner w/
drop off liner and
on/off connector
Sliding sleeves,
cemented
Smart (surface
operated sleeves,
valves, gauges, etc)
Relative ranking High, Medum, Low High High High Med Med Med Med-Low Med-Low Low Low Low
Production tree Tbg size dependent Same Same Same Same Same Same Same Same Same Same
Extra control line
outlets and surface
facilities required
Tubing hanger Tbg size dependent Same Same Same Same Same Same Same Same Same Same
Extra control line
ports required
Tubing 4.5", 5", 5-1/2", 7"? As required As required As required As required As required As required No crossovers As required As required As required As required
SCSSSV WR, TR Same Same Same Same Same Same Same Same Same Same Same
Tubing 4.5", 5", 5-1/2", 7"? As required As required As required As required As required As required No crossovers As required As required As required As required
Accessory
Nipple, permanent
gauges, SSD - must be
set at low deviation to
be accessed via slickline Same Same Same Same Same Same Same Same Same Same Same
Bottom of upper
completion
Packer, anchor, seal
stack, centralizers,
on/off connector... Anchor, seal assy Packer, overshot
Anchor, seal
assy Anchor, seal assy
Anchor, seal
assy N/A Anchor, seal assy On/Off Anchor, seal assy
Top of lower
completion
Packer liner hanger,
drop-off liner,
centralizers, ID
considerations, PBR,
On/Off connector Liner hanger, PBR
Drop off liner,
external PBR
(depending on MA08,
06 experience)
Liner hanger,
PBR Liner hanger, PBR
Liner hanger,
PBR N/A Liner hanger, PBR
On/Off - rely on
seals on connector
for isolation.
Cement through
entire string,
disconnect and
circulate, latch and
land Liner hanger, PBR Control line ports
Accessory
Nipple - possible need to
isolate reservoir while
running and testing
upper completion; use in
setting gauges
Not recommended
(unable to access
via slickline if at
high deviation)
Not recommended
(unable to access via
slickline if at high
deviation) Control line ports?
Reservoir
completion
Reservoir isolation -
cement, swell packers,
external casing packers,
nothing... How will the
reservoir be accessed?
Cemented liner;
perforate
Cemented liner;
perforate
Cemented liner,
perforate
Cemented
liner, swell
packers,
perforate
Slotted liner w/
external swell packers
Sliding sleeves,
swell packers
Cemented
liner; perforate
Uncemented liner
w/ external swell
packers, perforate
Cemented liner;
perforate
Cemented sliding
sleeves; require
pressure
application to break
down cement
ECPs, control lines
to sleeves
Shoe
See Lower Completion
sheet for shoe details
Experience,
Reliability
Have we done it before?
Have we been
successful? Why should
we/should we not? Is
this really the best
choice for the life of the
well?
Swell packers
may impede
success running
lower
completion
Swell packers may
impede success
running lower
completion
Swell packers
may impede
success running
lower
completion
Swell packers may
impede success
running lower
completion
Best in low
deviation. Cannot
rotate during
cementing.
Would be a first for
the field
Production
implications
Inflow area, produced
fluids
Drilling fluid handling
during kickoff and
production - wash
string will never clean
all drilling fluid
Drilling fluid
handling during
kickoff and
production
Drilling fluid
handling during
kickoff and
production
Control production
with no
intervention
Reservoir
management
Gauges, ability to shut
off/open up flow paths
Difficult to isolate
lower zones
Difficult to
isolate lower
zones
Difficult to isolate
lower zones
Control
production,
monitor reservoir
conditions with no
intervention
Abandonment
implications
Cement top in liner,
production casing,
relative to cap rock;
condition of annuli,
Moki etc
No cement in lower
completion - more
expensive and difficult
abandonment
No cement in
lower
completion -
more expensive
and difficult
abandonment
No cement in
lower completion -
more expensive
and difficult
abandonment
Accessories left in
hole. Need to
address non-
cemented
intervals.

Completion Design and Execution Strategy for Increasing Maui Reserve – Appendix I
Confidential Page 19 1/12/2013
Figure 5 - Project plan (Hardy, 2013)

Completion Design and Execution Strategy for Increasing Maui Reserve – Appendix I
Confidential Page 19 1/12/2013
Appendix II – Design
Table 10 - Thermal Operations considered during Stress Analysis (Klever 2013)
CTDM Section Thermal Operation
11.3.1 Initial Conditions
11.3.2 Early-Life Production
11.3.3 Late-Life Production
11.3.4 Immediate Shut-in from Early-Life
11.3.5 Cold Injection
Table 11 - Load Cases on the Tubing considered during Stress Analysis (Klever, 2013)
CTDM Section Load Cases for Tubing
11.4.1 Running the tubing
11.4.2 Initial conditions
11.4.3 Tubing overpull
11.4.4 Pressure test inside the tubing
11.4.5 Pressure test outside the tubing
11.4.6 Production
11.4.7 Early-life hot kill
11.4.8 Early-life ambient kill
11.4.9 Hot collapse-evacuation
11.4.10 Hot collapse tubing leak
11.4.11 Ambient collapse evacuation
11.4.12 Ambient collapse tubing leak
11.4.13 Cold frac injection
11.4.14 Ambient frac injection
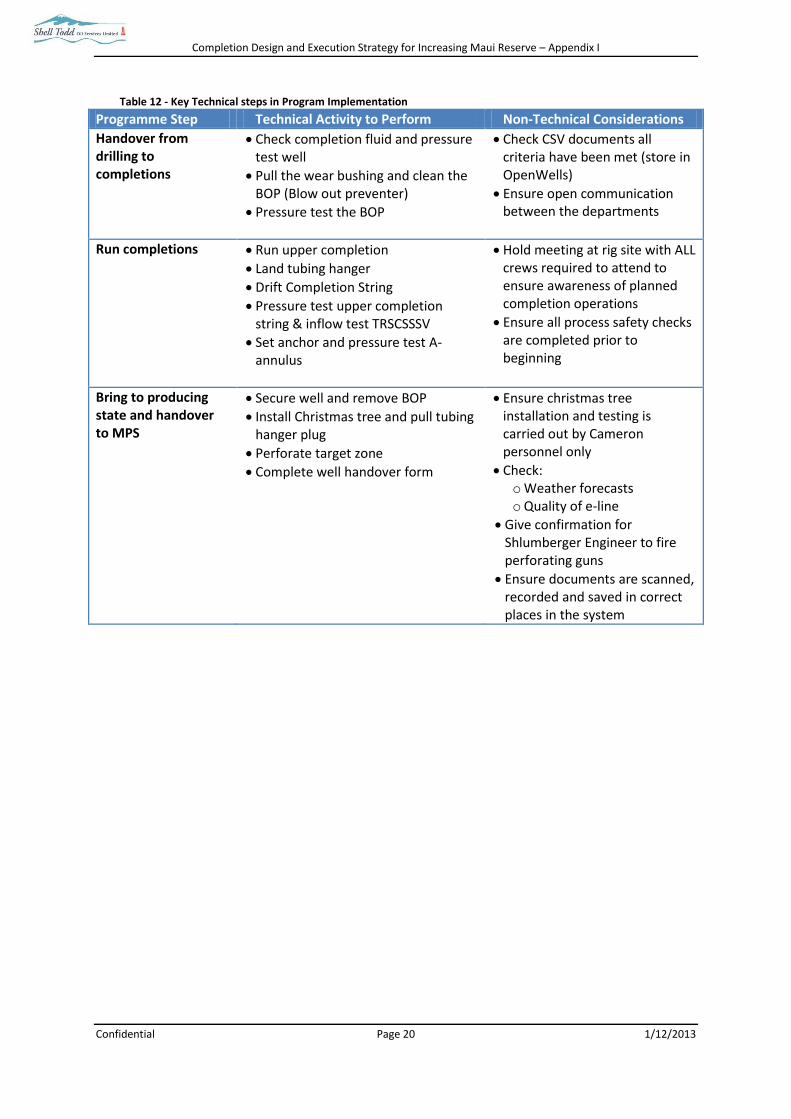
Completion Design and Execution Strategy for Increasing Maui Reserve – Appendix I
Confidential Page 20 1/12/2013
Table 12 - Key Technical steps in Program Implementation
Programme Step Technical Activity to Perform Non-Technical Considerations
Handover from drilling to completions
Check completion fluid and pressure test well
Pull the wear bushing and clean the BOP (Blow out preventer)
Pressure test the BOP
Check CSV documents all criteria have been met (store in OpenWells)
Ensure open communication between the departments
Run completions
Run upper completion
Land tubing hanger
Drift Completion String
Pressure test upper completion string & inflow test TRSCSSSV
Set anchor and pressure test A-annulus
Hold meeting at rig site with ALL crews required to attend to ensure awareness of planned completion operations
Ensure all process safety checks are completed prior to beginning
Bring to producing state and handover to MPS
Secure well and remove BOP
Install Christmas tree and pull tubing hanger plug
Perforate target zone
Complete well handover form
Ensure christmas tree installation and testing is carried out by Cameron personnel only
Check: o Weather forecasts o Quality of e-line
Give confirmation for Shlumberger Engineer to fire perforating guns
Ensure documents are scanned, recorded and saved in correct places in the system
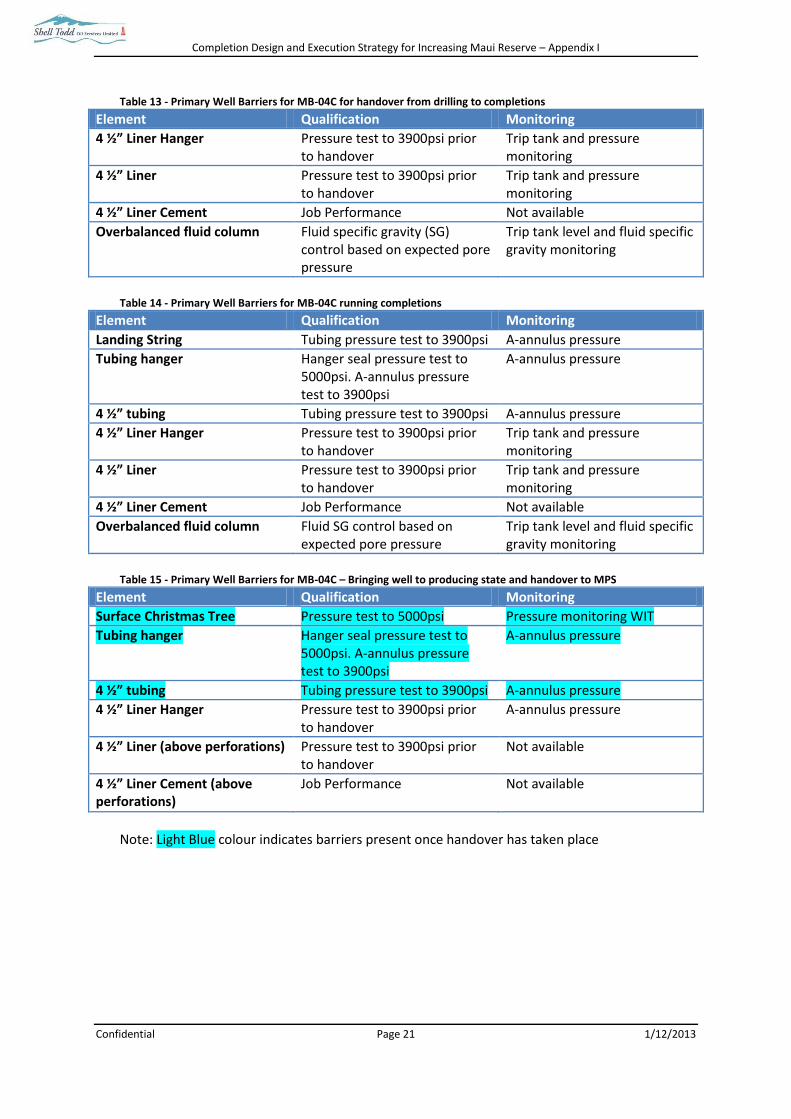
Completion Design and Execution Strategy for Increasing Maui Reserve – Appendix I
Confidential Page 21 1/12/2013
Table 13 - Primary Well Barriers for MB-04C for handover from drilling to completions
Element Qualification Monitoring
4 ½” Liner Hanger Pressure test to 3900psi prior to handover
Trip tank and pressure monitoring
4 ½” Liner Pressure test to 3900psi prior to handover
Trip tank and pressure monitoring
4 ½” Liner Cement Job Performance Not available
Overbalanced fluid column Fluid specific gravity (SG) control based on expected pore pressure
Trip tank level and fluid specific gravity monitoring
Table 14 - Primary Well Barriers for MB-04C running completions
Element Qualification Monitoring
Landing String Tubing pressure test to 3900psi A-annulus pressure
Tubing hanger Hanger seal pressure test to 5000psi. A-annulus pressure test to 3900psi
A-annulus pressure
4 ½” tubing Tubing pressure test to 3900psi A-annulus pressure
4 ½” Liner Hanger Pressure test to 3900psi prior to handover
Trip tank and pressure monitoring
4 ½” Liner Pressure test to 3900psi prior to handover
Trip tank and pressure monitoring
4 ½” Liner Cement Job Performance Not available
Overbalanced fluid column Fluid SG control based on expected pore pressure
Trip tank level and fluid specific gravity monitoring
Table 15 - Primary Well Barriers for MB-04C – Bringing well to producing state and handover to MPS
Element Qualification Monitoring
Surface Christmas Tree Pressure test to 5000psi Pressure monitoring WIT
Tubing hanger Hanger seal pressure test to 5000psi. A-annulus pressure test to 3900psi
A-annulus pressure
4 ½” tubing Tubing pressure test to 3900psi A-annulus pressure
4 ½” Liner Hanger Pressure test to 3900psi prior to handover
A-annulus pressure
4 ½” Liner (above perforations) Pressure test to 3900psi prior to handover
Not available
4 ½” Liner Cement (above perforations)
Job Performance Not available
Note: Light Blue colour indicates barriers present once handover has taken place

Completion Design and Execution Strategy for Increasing Maui Reserve – Appendix I
Confidential Page 22 1/12/2013
Table 16 - AS/NZS 4360 Risk Impact Table
Likelihood Consequences
1. Insignificant
2. Minor (some disruption)
3. Moderate (significant time and resources)
4. Major (operations severely damaged)
5. Catastrophic (business survival risk)
5. Almost certain >90%
Medium High High Very High Very High
4. Likely 50%- 90%
Medium Medium High High Very High
3. Moderate 5%-50%
Low Medium High High High
2. Unlikely 1%-5%lowlow
low Low Medium Medium High
1. Very unlikely <1%
low Low Medium Medium High

Completion Design and Execution Strategy for Increasing Maui Reserve – Appendix I
Confidential Page 23 1/12/2013
Appendix III – Technical
Table 17 - Connection Data Sheet for the 4 ½ tubing
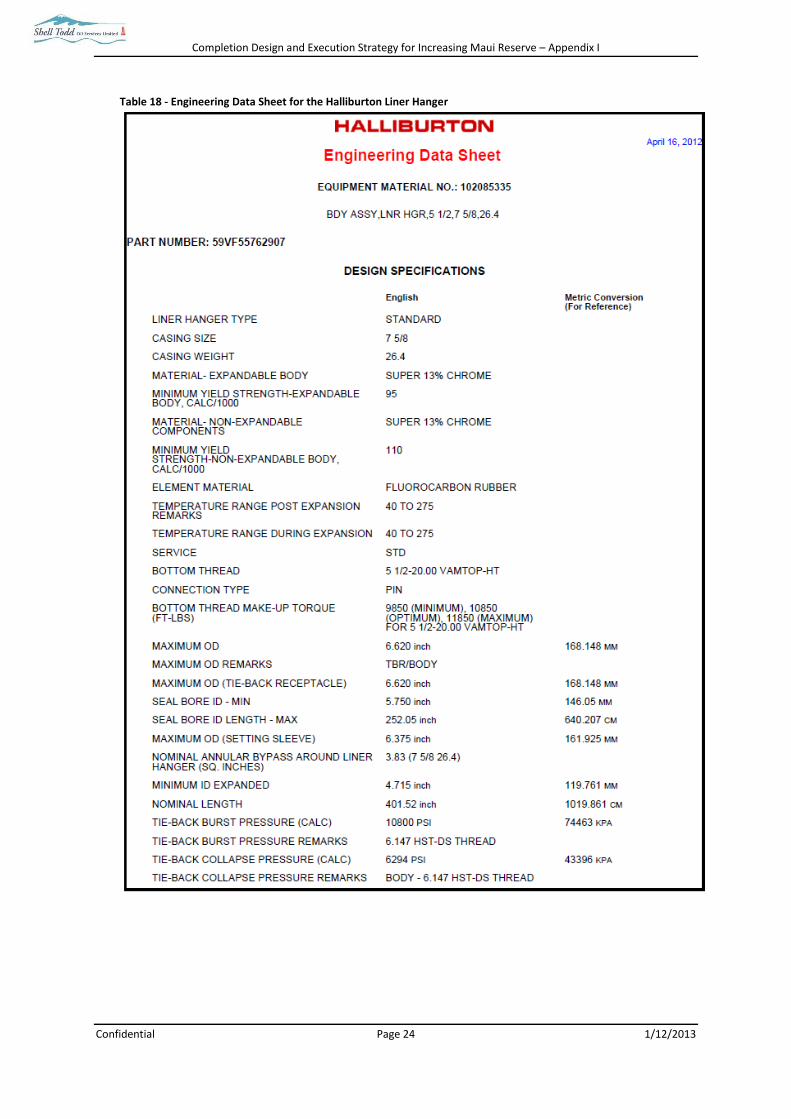
Completion Design and Execution Strategy for Increasing Maui Reserve – Appendix I
Confidential Page 24 1/12/2013
Table 18 - Engineering Data Sheet for the Halliburton Liner Hanger

Completion Design and Execution Strategy for Increasing Maui Reserve – Appendix I
Confidential Page 25 1/12/2013
Table 19 - Engineering Data Sheet for the Side Pocket Mandrel
Table 20 - Engineering Data Sheet for the Tubing Retrievable Surface Control Subsurface Safety Valve

Completion Design and Execution Strategy for Increasing Maui Reserve – Appendix I
Confidential Page 26 1/12/2013
Table 21 Engineering Data Sheet for the Anchor

Completion Design and Execution Strategy for Increasing Maui Reserve – Appendix I
Confidential Page 27 1/12/2013
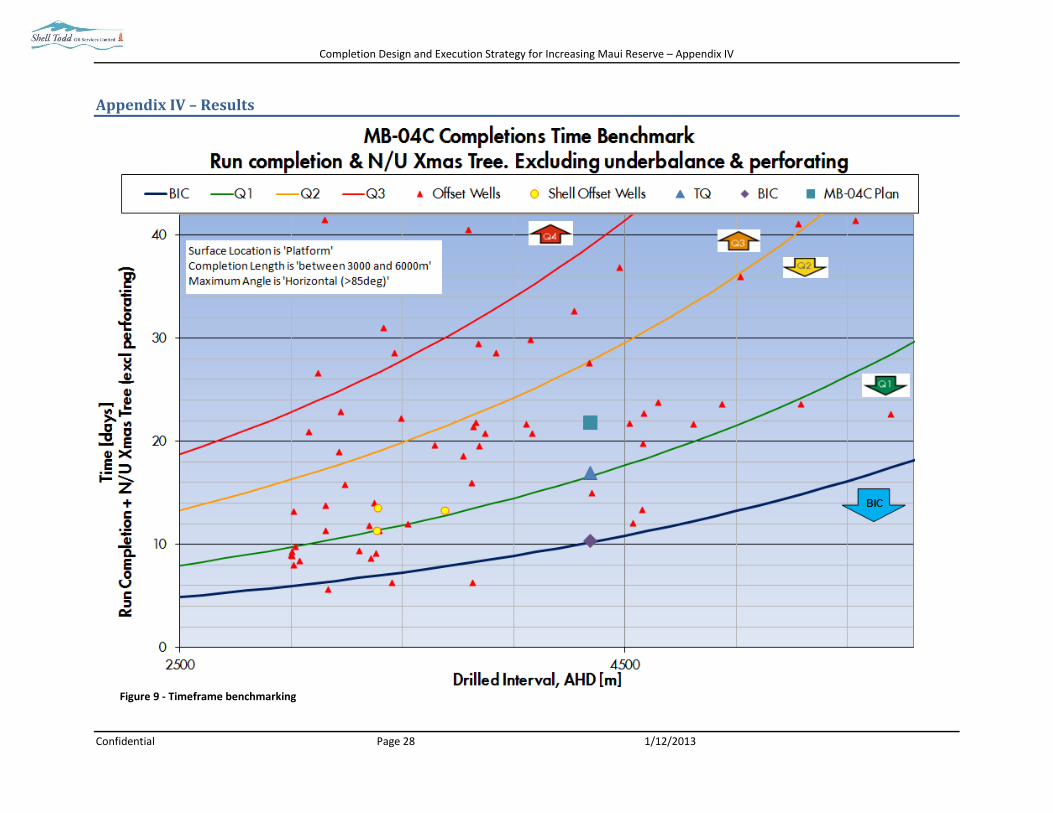
Completion Design and Execution Strategy for Increasing Maui Reserve – Appendix IV
Confidential Page 28 1/12/2013
Appendix IV – Results
Figure 9 - Timeframe benchmarking

Completion Design and Execution Strategy for Increasing Maui Reserve – Appendix IV
Confidential Page 29 1/12/2013
Figure 10 - Cost Benchmarking
Completion Design and Execution Strategy for Increasing Maui Reserve – Appendix IV
Confidential Page 30 1/12/2013
Appendix V - Crestal Well
MB04 Sidetrack Offshore Tubing Design
Author: Amy Hardy
Completion and Well Intervention Engineering Graduate With supervision from Nicole Hughes
December 2013

Completion Design and Execution Strategy for Increasing Maui Reserve – Appendix IV
Confidential Page 31 1/12/2013
Contents
1.0 Introduction ................................................................................................................................ 32
1.1 Design Factors ......................................................................................................................... 32
1.2 Trajectory ................................................................................................................................ 32
1.3 Sand Composition ................................................................................................................... 33
2.0 Basis for Design ........................................................................................................................... 34
2.1 Reference Documents ......................................................................................................... 34
2.2 Design Software ...................................................................................................................... 34
2.3 Well Trajectory ........................................................................................................................ 34
2.4 Design Pressures ..................................................................................................................... 35
3.0 Casing & Tubing Design Load Cases ............................................................................................ 36
3.1 4-1/2” Production Liner .......................................................................................................... 36
3.2 4-1/2” Production Tubing ....................................................................................................... 36
3.2.1 Design Objective ............................................................................................................. 36
3.2.2 Operations and Loads ..................................................................................................... 36
3.2.2 Properties ........................................................................................................................ 37
3.2.3 Minimum Safety Factors ................................................................................................. 37
3.2.4 Non-Compliance with Standards .................................................................................... 38
3.2.5 Graphical Representation ............................................................................................... 38

Completion Design and Execution Strategy for Increasing Maui Reserve – Appendix IV
Confidential Page 32 1/12/2013
1.0 Introduction
1.1 Design Factors
Note that the Minimum Allowable Design Safety Factors (Table 22) used in this document are taken
directly from the Shell Casing and Tubing Design Manual.
Table 22 - Minimum Design Safety Factors (DSFmin) for Use in the Design Check Equations
1.2 Trajectory
The well trajectory version that has been used for the tubing design for MB-04 C (sidetrack) well.
This is subject to change, but this should not have significant impact on the resulting load cases. Figure 11 gives a graphical representation of the current well trajectory. This was taken from Compass file MB-04 Sidetrack (IRF Ph3).

Completion Design and Execution Strategy for Increasing Maui Reserve – Appendix IV
Confidential Page 33 1/12/2013
Figure 11 - Proposed Well Trajectory
1.3 Sand Composition
The rock composition for the proposed MB-04 Sidetrack well was modeled from the more generic
Maui B Upper C-Sands compositions.
Table 23 - Composition of Maui B Upper C Sands
Component Mol % Mol wt Liquid Density
% g/cm³
N2 2.024 28.014
CO2 2.042 44.01
C1 78.445 16.043
C2 6.649 30.07
C3 3.199 44.097
iC4 0.804 58.124
nC4 1.090 58.124
iC5 0.518 72.151
nC5 0.438 72.151
C6 0.659 86.178 0.664
C7 0.921 92 0.7466
C8 1.022 102 0.7688
C9 0.612 114 0.7887
C10 0.408 129 0.7915
C11 0.249 144 0.7953
C12 0.189 156 0.808
C13 0.231 175 0.8217

Completion Design and Execution Strategy for Increasing Maui Reserve – Appendix IV
Confidential Page 34 1/12/2013
C14 0.157 190 0.8345
C15 0.107 206 0.8463
C16 0.074 222 0.8574
C17-C18 0.086 242.693 0.8719
C19-C42 0.076 292.704 0.9063
2.0 Basis for Design
2.1 Reference Documents
For the Tubing design, the following documents were utilized for guidance and design specifications.
Shell Casing and Tubing Design Manual Issued 1st June 2013
WellCat Training Workbook Issued 2013 by Altus Well Experts
2.2 Design Software
Modeling has been completed using the Halliburton’s WellCat Software (version 5000.1.10.0).
2.3 Well Trajectory
Figure 12 - Plan View of the MB-04 Well Trajectory

Completion Design and Execution Strategy for Increasing Maui Reserve – Appendix IV
Confidential Page 35 1/12/2013
Figure 13 - Section View of the MB-04 Well Trajectory
2.4 Design Pressures
Table 24 - MB-04C Well Life Parameters
Condition Units Start of Life Normal Op. End of Life
CITHP bar 170 160 140 CITHT ºC 15 to 17 15 to 17 15 to 17 FTHP bar 150 110 90 FTHT ºC 60 to 65 60 to 65 60 to 65
WGR m3 water/ mln m3 gas 8 8 2500 IRF Well Gas Flow STDm3/s 7 5 2

Completion Design and Execution Strategy for Increasing Maui Reserve – Appendix IV
Confidential Page 36 1/12/2013
3.0 Casing & Tubing Design Load Cases
The Shell Casing and Tubing Design Manual – released June 1
st 2013 – was followed throughout the design as the
design as the minimum standard. A summary of these values can be seen in
.
3.1 4-1/2” Production Liner
The 4 ½” cemented production liner will be set in the Maui B C sands. The casing and tubing design it has been verified whether the casing can withstand all the load cases as per the latest revision of the casing and tubing design manual, based on the normal pipe body properties of the 4 ½” slotted liner.
This production liner has a Shell qualified connection.
3.2 4-1/2” Production Tubing
3.2.1 Design Objective
The 4 ½” production tubing, together with the 4 ½” production liner and including the completion components for the completion conduit through which the hydrocarbons are brought to the surface.
The tubing design (Completed using WellCat) has verified that this tubing can withstand all the load cases in compliance with the Shell Wells Standards.
The tubing used has a Shell qualified connection.
3.2.2 Operations and Loads
Table 25 shows the thermal operations modeled in WellCat for the MB-04C Well. Table 26 shows the load cases applied on the tubing in WellCat, and what parameters were used.
Table 25 - Thermal Operations for Producing Wells
Operation Pressure (bar) Position Comment
Early-life Production 150 Wellhead Late-life Production 90 Wellhead Early-life Hot Shut In 170 Wellhead
Table 26 - Load Cases for Tubing
Operation Summary
Tubing Overpull Run with seawater with force of 100,000 lbf Pressure Test Inside Pump pressure in tubing of 20,000kPa, anchor at 3048mMD Pressure Test Outside Pump pressure in tubing 0kPa, in annulus 20,000kPa Early Life Production Steady state 150barTHP, 65°C, 5 STDm3/s, 0bbl/min water Late Life Production Steady state 90barTHP, 65°C, 2 STDm3/s gas, 2bbl/min water Early Life Shut In Shut in at 170bar, 1min Early Life Hot Kill 2387psiTHP, 1 min Early Life Ambient Kill 2387psiTHP, 20 yr Hot Collapse-Evacuation Tubing evacuation at “Early Life Production” conditions Hot Collapse Tubing Leak “Early Life Production” tubing conditions, annulus pressure 2387psi

Completion Design and Execution Strategy for Increasing Maui Reserve – Appendix IV
Confidential Page 37 1/12/2013
(SIWHP + 500psi) Ambient Collapse Evacuation Tubing evacuation at “Early Life Ambient Shut In,” pressure in tubing
2387psi, 20yrs Ambient Collapse Tubing Leak “Early Life Shut In” tubing condition, annulus pressure 2387psi Cold Frac Injection Undisturbed prior, 100bar, 17°C , 1200m3/day, 1 min Ambient Frac Injection Undisturbed prior, 100bar, 17°C , 1200m3/day, 6 mths Side Pocket Mandrill Kick-off SPMD set at 1680m, “Early Life Production” tubing conditions Hot Shut in at DHSV DHSV set at 350m, “Early Life Production” tubing conditions
*Assume annulus pressure is 0psi unless otherwise stated **Initial Conditions set to default
3.2.2 Properties
Production tubing properties can be found in Table 27. The corresponding Connection Data Sheet can be found in Appendices A, page 10.
Table 27 - Properties of the 4 1/2" Production Tubing
Size Interval Weight Grade Connection Collapse Strength
Burst Strength
Tension Strength
Compr. Strength
Inches mAHRD Lbs/ft Bar Bar MT MT 4 1/2 20.6 L80 13Cr VAM TOP
Tubing 217 581 130 -130
3.2.3 Minimum Safety Factors
Table 28 shows the minimum Safety Factors (SF) per failure mechanism. These have been listed for the CTDM load cases. At this stage only the pipe is considered, not the connections. Table 29 shows the minimum SF’s for additional load cases where the SF is lower than the CTDM load cases.
Table 28 - Minimum Safety Factors for 4 1/2" Tubing
Minimum Safety Factor
Load Case Safety Factor Depth (mTVD)
Triaxial Tubing Overpull D1.419 797.40 Axial Tubing Overpull 1.442 702.20 Collapse Ambient Collapse – Tubing leak 1.769 9967.12 Burst Pressure Test Inside Tubing 2.711 9500 Compression See Axial (Axial governed by compr.)
Table 29 - Minimum Safety Factors where the Safety Factor is lower than the CTDM load cases
Minimum Safety Factor
Load Case Safety Factor Depth (mTVD)
Triaxial n/a Axial n/a Collapse n/a Burst n/a

Completion Design and Execution Strategy for Increasing Maui Reserve – Appendix IV
Confidential Page 38 1/12/2013
3.2.4 Non-Compliance with Standards
For the 4 ½” Tubing, there are no CTDM or UIA/UIZ/BSP wells standard non-compliant load cases. I.e. Cases where the Safety Factor is below the Shell Design Factor. Therefore, there are no deviations in this instance.
3.2.5 Graphical Representation
3.2.5.1 Design Limits Plot
Figure 14 - Design Limits Plot for CTDM load cases

Completion Design and Execution Strategy for Increasing Maui Reserve – Appendix IV
Confidential Page 39 1/12/2013
3.2.5.2 CTDM Safety Factor Plots
Figure 15 - Triaxial Safety Factor Plot for CTDM load cases
Figure 16 - Axial Safety Factor Plot for CTDM load cases
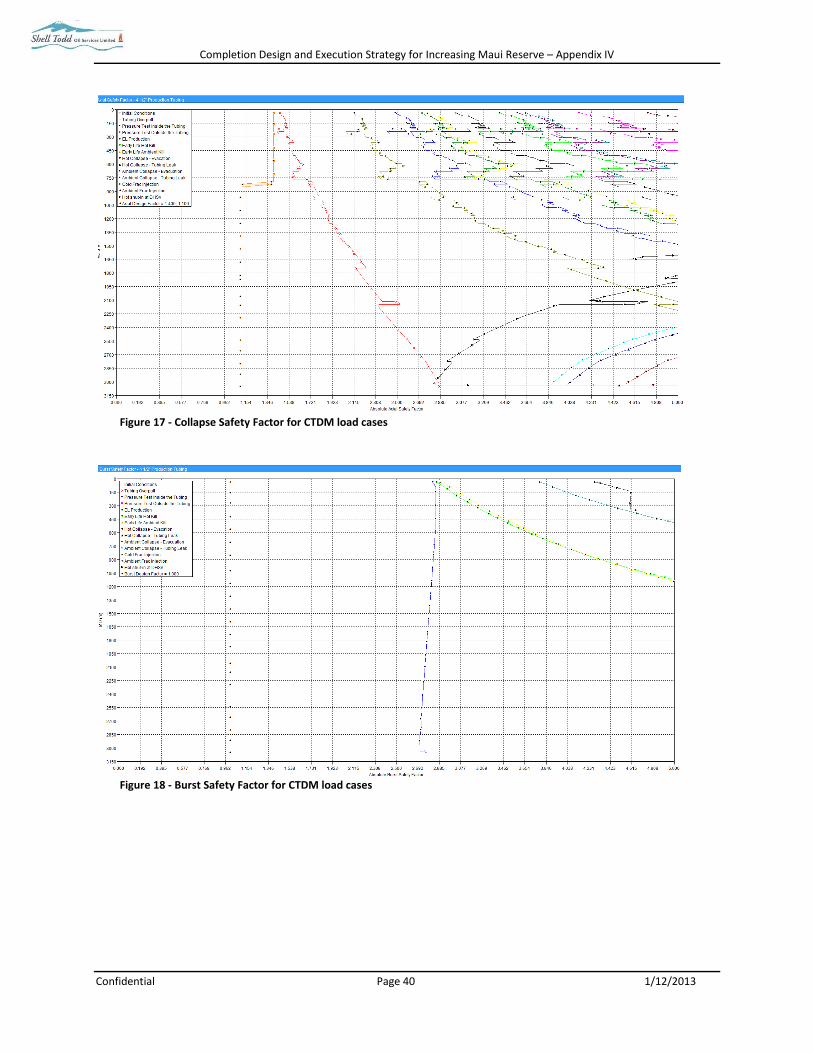
Completion Design and Execution Strategy for Increasing Maui Reserve – Appendix IV
Confidential Page 40 1/12/2013
Figure 17 - Collapse Safety Factor for CTDM load cases
Figure 18 - Burst Safety Factor for CTDM load cases

Completion Design and Execution Strategy for Increasing Maui Reserve – Appendix IV
Confidential Page 41 1/12/2013
Appendix VI - Down Dip Well
MB09 Sidetrack Offshore Tubing Design
Author: Amy Hardy
Completion and Well Intervention Engineering Graduate With supervision from Nicole Hughes
December 2013

Completion Design and Execution Strategy for Increasing Maui Reserve – Appendix IV
Confidential Page 42 1/12/2013
Contents
1.0 Introduction ................................................................................................................................ 43
1.1 Design Factors ......................................................................................................................... 43
1.2 Trajectory ................................................................................................................................ 43
1.3 Sand Composition ................................................................................................................... 44
2.0 Basis for Design ........................................................................................................................... 45
2.1 Reference Documents ......................................................................................................... 45
2.2 Design Software ...................................................................................................................... 45
2.3 Well Trajectory ........................................................................................................................ 45
2.4 Design Pressures ..................................................................................................................... 46
3.0 Casing & Tubing Design Load Cases ............................................................................................ 47
3.1 4-1/2” Production Liner .......................................................................................................... 47
3.2 4-1/2” Production Tubing ....................................................................................................... 47
3.2.1 Design Objective ............................................................................................................. 47
3.2.2 Operations and Loads ..................................................................................................... 47
3.2.2 Properties ........................................................................................................................ 48
3.2.3 Minimum Safety Factors ................................................................................................. 48
3.2.4 Non-Compliance with Standards .................................................................................... 49
3.2.5 Graphical Representation ............................................................................................... 49

Completion Design and Execution Strategy for Increasing Maui Reserve – Appendix IV
Confidential Page 43 1/12/2013
1.0 Introduction
1.1 Design Factors
Note that the Minimum Allowable Design Safety Factors (Table 22) used in this document are taken
directly from the Shell Casing and Tubing Design Manual.
Table 30 - Minimum Design Safety Factors (DSFmin) for Use in the Design Check Equations
1.2 Trajectory
The well trajectory version that has been used for the tubing design for MB-09 A (sidetrack) well.
This is subject to change, but this should not have significant impact on the resulting load cases. Figure 11 gives a graphical representation of the current well trajectory. This was taken from Compass file MB-09 Sidetrack (IRF Ph3).

Completion Design and Execution Strategy for Increasing Maui Reserve – Appendix IV
Confidential Page 44 1/12/2013
Figure 19 - Proposed Well Trajectory for MB-09A
1.3 Sand Composition
The rock composition for the proposed MB-09 Sidetrack well was modeled from the more generic
Maui B Upper C-Sands compositions.
Table 31 - Maui B Upper C-Sands compositions.
Component Mol Mol wt Liquid Density
% g/cm³
N2 2.024 28.014
CO2 2.042 44.01
C1 78.445 16.043
C2 6.649 30.07
C3 3.199 44.097
iC4 0.804 58.124
nC4 1.090 58.124
iC5 0.518 72.151
nC5 0.438 72.151
C6 0.659 86.178 0.664
C7 0.921 92 0.7466
C8 1.022 102 0.7688
C9 0.612 114 0.7887
C10 0.408 129 0.7915
C11 0.249 144 0.7953
C12 0.189 156 0.808
C13 0.231 175 0.8217
C14 0.157 190 0.8345
C15 0.107 206 0.8463

Completion Design and Execution Strategy for Increasing Maui Reserve – Appendix IV
Confidential Page 45 1/12/2013
C16 0.074 222 0.8574
C17-C18 0.086 242.693 0.8719
C19-C42 0.076 292.704 0.9063
2.0 Basis for Design
2.1 Reference Documents
For the Tubing design, the following documents were utilized for guidance and design specifications.
Shell Casing and Tubing Design Manual Issued 1st June 2013
WellCat Training Workbook Issued 2013 by Altus Well Experts
2.2 Design Software
Modeling has been completed using the Halliburton’s WellCat Software (version 5000.1.10.0).
2.3 Well Trajectory
Figure 20 - Plan View of the MB-09A Well Trajectory

Completion Design and Execution Strategy for Increasing Maui Reserve – Appendix IV
Confidential Page 46 1/12/2013
Figure 21 - Section View of the MB-04 Well Trajectory
2.4 Design Pressures
The maximum anticipated wellhead pressure is based on an expected reservoir pressure of Table 32 - MB-09A Well Life Parameters
Condition Units Start of Life Normal Op. End of Life
CITHP bar 170 160 140
CITHT ºC 15 to 17 15 to 17 15 to 17
FTHP bar 150 110 90
FTHT ºC 60 to 65 60 to 65 60 to 65
WGR m3 water/ mln m3 gas 8 8 2500
IRF Well Gas Flow STDm3/s 7 5 2

Completion Design and Execution Strategy for Increasing Maui Reserve – Appendix IV
Confidential Page 47 1/12/2013
3.0 Casing & Tubing Design Load Cases
The Shell Casing and Tubing Design Manual – released June 1
st 2013 – was followed throughout the design as the
design as the minimum standard. A summary of these values can be seen in
.
3.1 4-1/2” Production Liner
The 4 ½” cemented production liner will be set in the Maui B C sands. The casing and tubing design it has been verified whether the casing can withstand all the load cases as per the latest revision of the casing and tubing design manual, based on the normal pipe body properties of the 4 ½” slotted liner.
This production liner has a Shell qualified connection.
3.2 4-1/2” Production Tubing
3.2.1 Design Objective
The 4 ½” production tubing, together with the 4 ½” production liner and including the completion components for the completion conduit through which the hydrocarbons are brought to the surface.
The tubing design (Completed using WellCat) has verified that this tubing can withstand all the load cases in compliance with the Shell Wells Standards.
The tubing used has a Shell qualified connection.
3.2.2 Operations and Loads
Table 25 shows the thermal operations modeled in WellCat for the MB-09A Well. Table 26 shows the load cases applied on the tubing in WellCat, and what parameters were used.
Table 33 - Thermal Operations for Producing Wells
Operation Pressure (bar) Position Comment
Early-life Production 150 Wellhead Late-life Production 90 Wellhead Early-life Hot Shut In 170 Wellhead
Table 34 - Load Cases for Tubing
Operation Summary
Tubing Overpull Run with seawater with force of 100,000 lbf Pressure Test Inside Pump pressure in tubing of 20,000kPa, anchor at 3048mMD Pressure Test Outside Pump pressure in tubing 0kPa, in annulus 20,000kPa Early Life Production Steady state 150barTHP, 65°C, 5 STDm3/s, 0bbl/min water Late Life Production Steady state 90barTHP, 65°C, 2 STDm3/s gas, 2bbl/min water Early Life Shut In Shut in at 170bar, 1min Early Life Hot Kill 2883psiTHP, 1 min Early Life Ambient Kill 2883psiTHP, 20 yr Hot Collapse-Evacuation Tubing evacuation at “Early Life Production” conditions Hot Collapse Tubing Leak “Early Life Production” tubing conditions, annulus pressure 2883psi

Completion Design and Execution Strategy for Increasing Maui Reserve – Appendix IV
Confidential Page 48 1/12/2013
(SIWHP + 500psi) Ambient Collapse Evacuation Tubing evacuation at “Early Life Ambient Shut In,” pressure in tubing
170psi, 20yrs Ambient Collapse Tubing Leak “Early Life Shut In” tubing condition, annulus pressure 2883psi Cold Frac Injection Undisturbed prior, 100bar, 17°C , 1200m3/day, 1 min Ambient Frac Injection Undisturbed prior, 100bar, 17°C , 1200m3/day, 6 mths Side Pocket Mandrill Kick-off SPMD set at 2130m, “Early Life Production” tubing conditions Hot Shut in at DHSV DHSV set at 350m, “Early Life Production” tubing conditions
*Assume annulus pressure is 0psi unless otherwise stated **Initial Conditions set to default
3.2.2 Properties
Production tubing properties can be found in Table 27. The corresponding Connection Data Sheet can be found in Appendices A, page 12.
Table 35 - Properties of the 4 1/2" Production Tubing
Size Interval Weight Grade Connection Collapse Strength
Burst Strength
Tension Strength
Compr. Strength
Inches mAHRD Lbs/ft Bar Bar MT MT 4 1/2 20.6 L80 13Cr VAM TOP
Tubing 217 581 130 -130
3.2.3 Minimum Safety Factors
Table 28 shows the minimum Safety Factors (SF) per failure mechanism. These have been listed for the CTDM load cases. At this stage only the pipe is considered, not the connections. Table 29 shows the minimum SF’s for additional load cases where the SF is lower than the CTDM load cases.
Table 36 - Minimum Safety Factors for 4 1/2" Tubing
Minimum Safety Factor
Load Case Safety Factor Depth (mTVD)
Triaxial Tubing Overpull 1.322 704.60 Axial Tubing Overpull 1.329 704.60 Collapse Hot Collapse – Tubing leak 1.751 12303-12330 Burst Early Life Ambient Kill 2.834 122.60 Compression See Axial (Axial governed by
Compression)
Table 37 - Minimum Safety Factors where the Safety Factor is lower than the CTDM load cases
Minimum Safety Factor
Load Case Safety Factor Depth (mTVD)
Triaxial n/a Axial Tubing Overpull 1.329 704.60 Collapse n/a Burst n/a

Completion Design and Execution Strategy for Increasing Maui Reserve – Appendix IV
Confidential Page 49 1/12/2013
3.2.4 Non-Compliance with Standards
For the 4 ½” Tubing, there is one CTDM or UIA/UIZ/BSP wells standard non-compliant load cases. I.e. Case where the Safety Factor is below the Shell Design Factor.
This will need to be investigated in more detail.
3.2.5 Graphical Representation
3.2.5.1 Design Limits Plot
Figure 22 - Design Limits Plot for CTDM load cases

Completion Design and Execution Strategy for Increasing Maui Reserve – Appendix IV
Confidential Page 50 1/12/2013
The tubing fails at an overpull of 100kips, as shown in
Figure 22.

Completion Design and Execution Strategy for Increasing Maui Reserve – Appendix IV
Confidential Page 51 1/12/2013
3.2.5.2 CTDM Safety Factor Plots
Figure 23 - Triaxial Safety Factor Plot for CTDM load cases
Figure 24 - Axial Safety Factor Plot for CTDM load cases

Completion Design and Execution Strategy for Increasing Maui Reserve – Appendix IV
Confidential Page 52 1/12/2013
Figure 25 - Collapse Safety Factor for CTDM load cases
Figure 26 - Burst Safety Factor for CTDM load cases

Completion Design and Execution Strategy for Increasing Maui Reserve – Appendix IV
Confidential Page 53 1/12/2013
Appendix VII - Extended Reach Well
MB North (MB01 Sidetrack)
Offshore Tubing Design
Author: Amy Hardy
Completion and Well Intervention Engineering Graduate
With supervision from:
Nicole Hughes Completion and Well Intervention Team Lead
December 2013

Completion Design and Execution Strategy for Increasing Maui Reserve – Appendix IV
Confidential Page 54 1/12/2013
Contents
1.0 Introduction ................................................................................................................................ 54
1.1 Design Factors ......................................................................................................................... 54
1.2 Trajectory ................................................................................................................................ 54
1.3 Sand Composition ................................................................................................................... 55
2.0 Basis for Design ........................................................................................................................... 56
2.1 Reference Documents ......................................................................................................... 56
2.2 Design Software ...................................................................................................................... 56
2.3 Well Trajectory ........................................................................................................................ 56
2.4 Design Pressures ..................................................................................................................... 57
3.0 Casing & Tubing Design Load Cases ............................................................................................ 58
3.1 4-1/2” Production Liner .......................................................................................................... 58
3.2 4-1/2” Production Tubing ....................................................................................................... 58
3.2.1 Design Objective ............................................................................................................. 58
3.2.2 Operations and Loads ..................................................................................................... 58
3.2.2 Properties ........................................................................................................................ 59
3.2.3 Minimum Safety Factors ................................................................................................. 59
3.2.4 Non-Compliance with Standards .................................................................................... 60
3.2.5 Graphical Representation ............................................................................................... 60
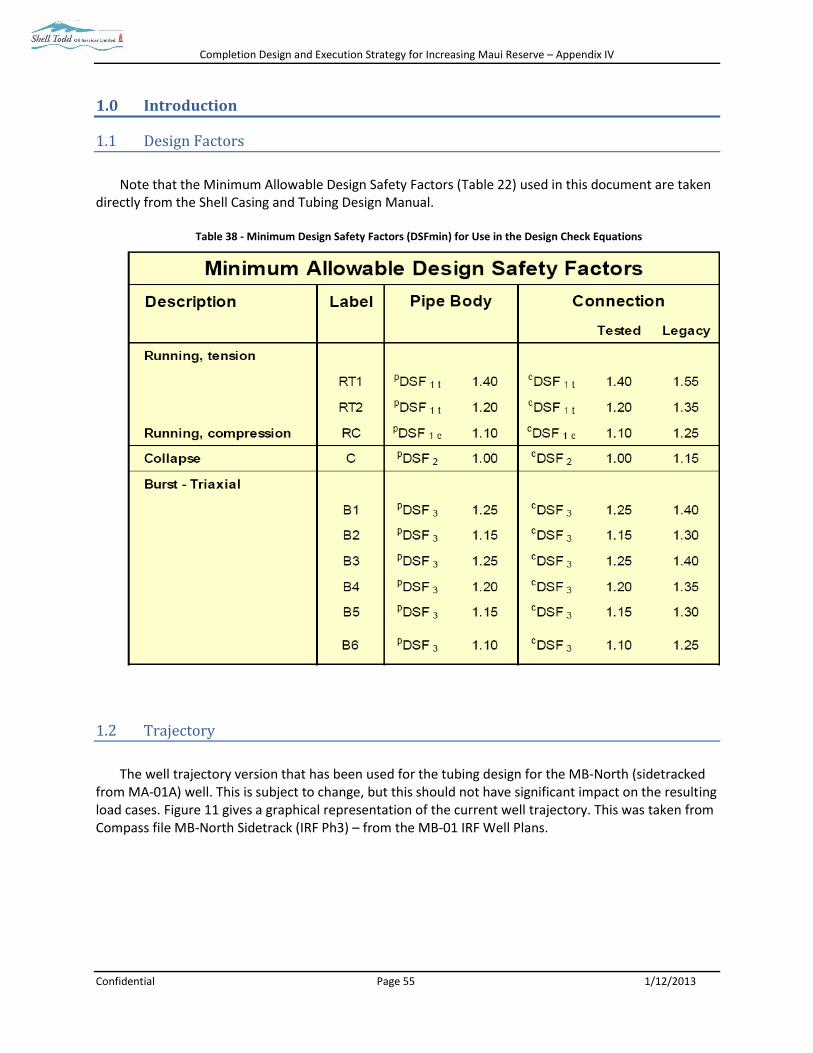
Completion Design and Execution Strategy for Increasing Maui Reserve – Appendix IV
Confidential Page 55 1/12/2013
1.0 Introduction
1.1 Design Factors
Note that the Minimum Allowable Design Safety Factors (Table 22) used in this document are taken
directly from the Shell Casing and Tubing Design Manual.
Table 38 - Minimum Design Safety Factors (DSFmin) for Use in the Design Check Equations
1.2 Trajectory
The well trajectory version that has been used for the tubing design for the MB-North (sidetracked
from MA-01A) well. This is subject to change, but this should not have significant impact on the resulting load cases. Figure 11 gives a graphical representation of the current well trajectory. This was taken from Compass file MB-North Sidetrack (IRF Ph3) – from the MB-01 IRF Well Plans.
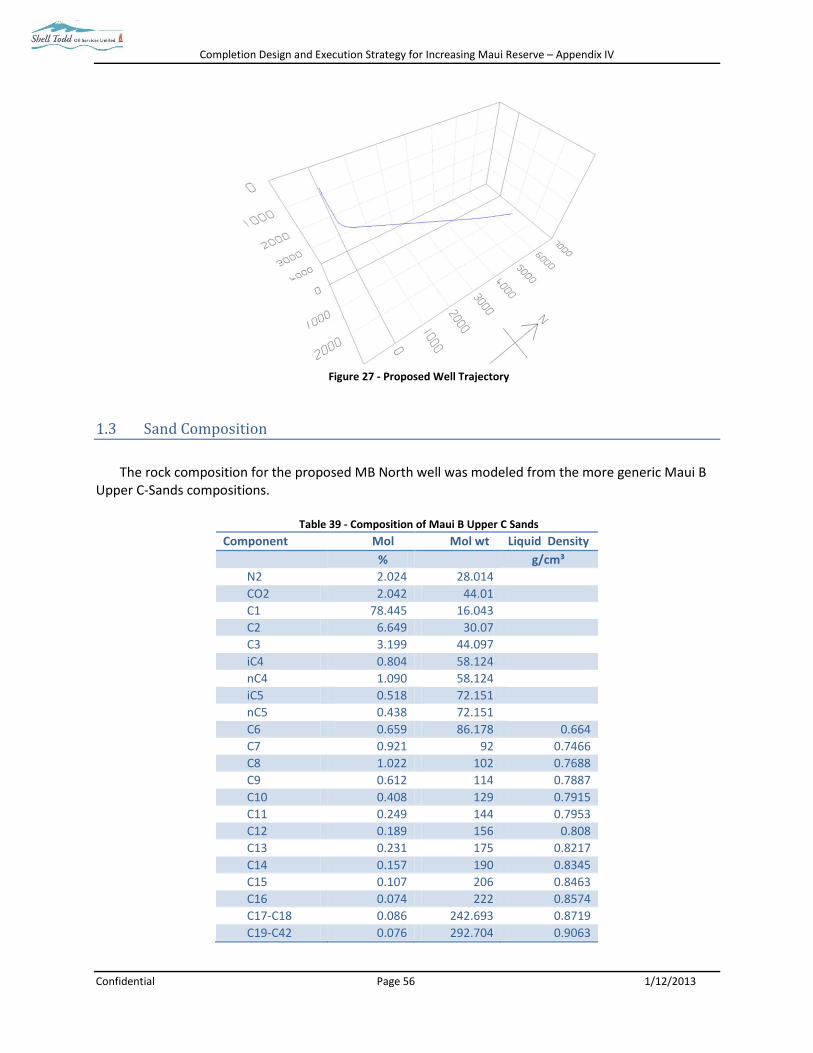
Completion Design and Execution Strategy for Increasing Maui Reserve – Appendix IV
Confidential Page 56 1/12/2013
Figure 27 - Proposed Well Trajectory
1.3 Sand Composition
The rock composition for the proposed MB North well was modeled from the more generic Maui B
Upper C-Sands compositions.
Table 39 - Composition of Maui B Upper C Sands
Component Mol Mol wt Liquid Density
% g/cm³
N2 2.024 28.014
CO2 2.042 44.01
C1 78.445 16.043
C2 6.649 30.07
C3 3.199 44.097
iC4 0.804 58.124
nC4 1.090 58.124
iC5 0.518 72.151
nC5 0.438 72.151
C6 0.659 86.178 0.664
C7 0.921 92 0.7466
C8 1.022 102 0.7688
C9 0.612 114 0.7887
C10 0.408 129 0.7915
C11 0.249 144 0.7953
C12 0.189 156 0.808
C13 0.231 175 0.8217
C14 0.157 190 0.8345
C15 0.107 206 0.8463
C16 0.074 222 0.8574
C17-C18 0.086 242.693 0.8719
C19-C42 0.076 292.704 0.9063

Completion Design and Execution Strategy for Increasing Maui Reserve – Appendix IV
Confidential Page 57 1/12/2013
1.0 Basis for Design
2.1 Reference Documents
For the Tubing design, the following documents were utilized for guidance and design specifications.
Shell Casing and Tubing Design Manual Issued 1st June 2013
WellCat Training Workbook Issued 2013 by Altus Well Experts
2.2 Design Software
Modeling has been completed using the Halliburton’s WellCat Software (version 5000.1.10.0).
2.3 Well Trajectory
Figure 28 - Plan View of the MB-04 Well Trajectory
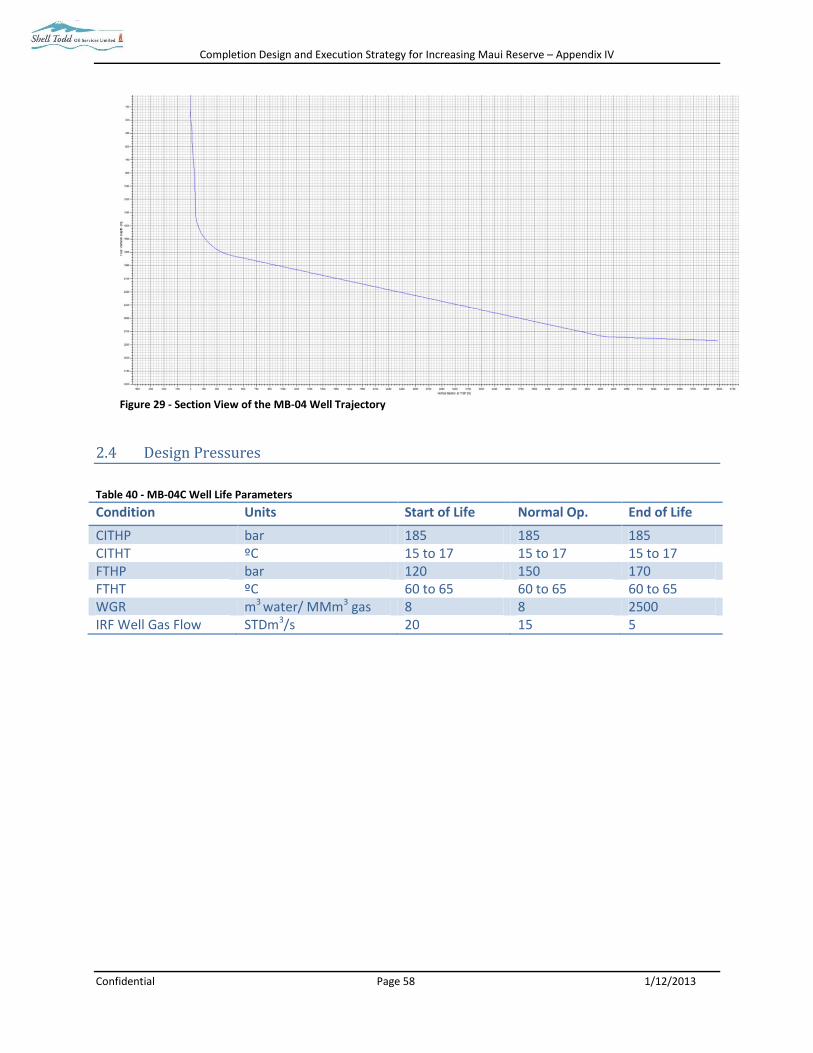
Completion Design and Execution Strategy for Increasing Maui Reserve – Appendix IV
Confidential Page 58 1/12/2013
Figure 29 - Section View of the MB-04 Well Trajectory
2.4 Design Pressures
Table 40 - MB-04C Well Life Parameters
Condition Units Start of Life Normal Op. End of Life
CITHP bar 185 185 185 CITHT ºC 15 to 17 15 to 17 15 to 17 FTHP bar 120 150 170 FTHT ºC 60 to 65 60 to 65 60 to 65 WGR m3 water/ MMm3 gas 8 8 2500 IRF Well Gas Flow STDm3/s 20 15 5

Completion Design and Execution Strategy for Increasing Maui Reserve – Appendix IV
Confidential Page 59 1/12/2013
2.0 Casing & Tubing Design Load Cases
The Shell Casing and Tubing Design Manual – released June 1st 2013 – was followed throughout the
design as the minimum standard.
3.1 4-1/2” Production Liner
The 4 ½” cemented production liner will be set in the Maui B C sands. The casing and tubing design it has been verified whether the casing can withstand all the load cases as per the latest revision of the casing and tubing design manual, based on the normal pipe body properties of the 4 ½” slotted liner.
This production liner has a Shell qualified connection.
3.2 4-1/2” Production Tubing
3.2.1 Design Objective
The 4 ½” production tubing, together with the 4 ½” production liner and including the completion components for the completion conduit through which the hydrocarbons are brought to the surface.
The tubing design (Completed using WellCat) has verified that this tubing can withstand all the load cases in compliance with the Shell Wells Standards.
The tubing used has a Shell qualified connection.
3.2.2 Operations and Loads
Table 41 shows the thermal operations modeled in WellCat for the Maui B North Well. Table 42 shows the load cases applied on the tubing in WellCat, and what parameters were used.
Table 41 - Thermal Operations for Producing Wells
Operation Pressure (bar) Position Comment
Early-life Production 120 Wellhead Late-life Production 170 Wellhead Early-life Hot Shut In 185 Wellhead
Table 42 - Load Cases for Tubing
Operation Summary
Tubing Overpull Run with seawater with force of 100,000 lbf Pressure Test Inside Pump pressure in tubing of 20,000kPa, anchor at 6279m Pressure Test Outside Pump pressure in tubing 0kPa, in annulus 20,000kPa Early Life Production Steady state 120barTHP, 65°C, 20 STDm3/s, 0bbl/min water Late Life Production Steady state 170barTHP, 65°C, 5 STDm3/s gas, 4bbl/min water Early Life Shut In 185barTHP, 1 min Early Life Hot Kill 2240psiTHP, 1 min Early Life Ambient Kill 2240psiTHP, 20 yr Hot Collapse-Evacuation Tubing evacuation at “Early Life Production” conditions Hot Collapse Tubing Leak “Early Life Production” tubing conditions, annulus pressure 2240psi
(SIWHP + 500psi) Ambient Collapse Evacuation Tubing evacuation at “Early Life Ambient Shut In” for 20 yrs
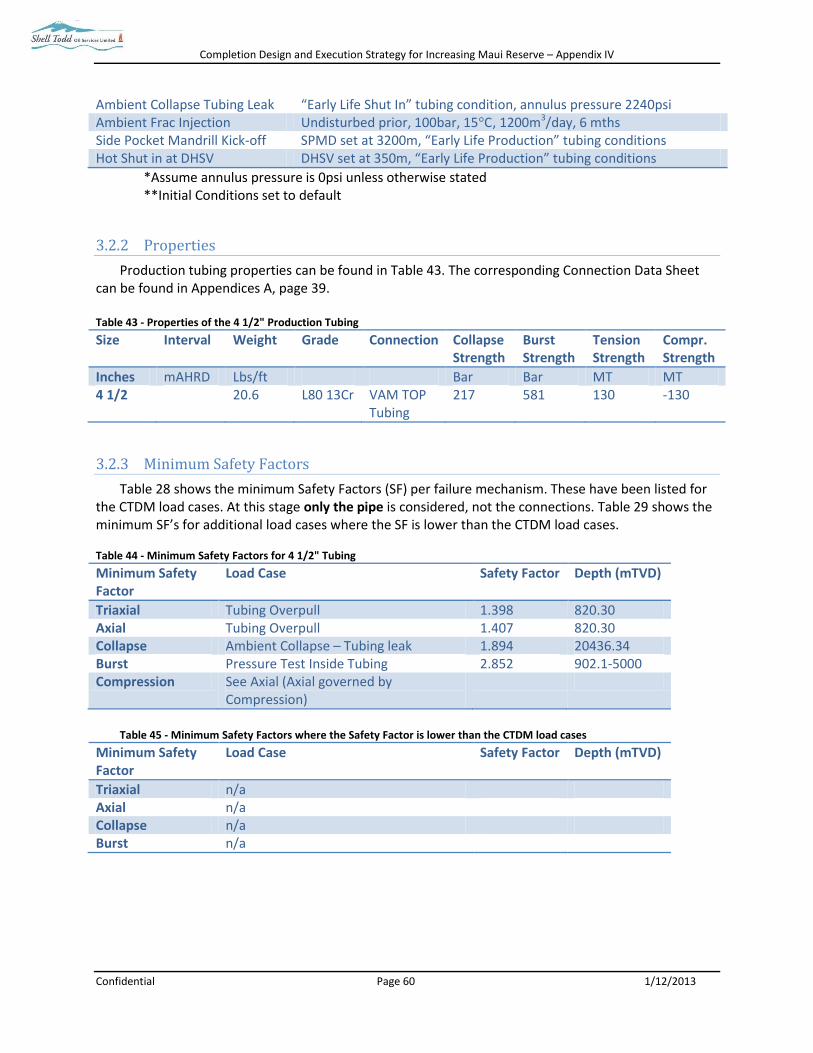
Completion Design and Execution Strategy for Increasing Maui Reserve – Appendix IV
Confidential Page 60 1/12/2013
Ambient Collapse Tubing Leak “Early Life Shut In” tubing condition, annulus pressure 2240psi Ambient Frac Injection Undisturbed prior, 100bar, 15°C , 1200m3/day, 6 mths Side Pocket Mandrill Kick-off SPMD set at 3200m, “Early Life Production” tubing conditions Hot Shut in at DHSV DHSV set at 350m, “Early Life Production” tubing conditions
*Assume annulus pressure is 0psi unless otherwise stated **Initial Conditions set to default
3.2.2 Properties
Production tubing properties can be found in Table 43. The corresponding Connection Data Sheet can be found in Appendices A, page 39.
Table 43 - Properties of the 4 1/2" Production Tubing
Size Interval Weight Grade Connection Collapse Strength
Burst Strength
Tension Strength
Compr. Strength
Inches mAHRD Lbs/ft Bar Bar MT MT 4 1/2 20.6 L80 13Cr VAM TOP
Tubing 217 581 130 -130
3.2.3 Minimum Safety Factors
Table 28 shows the minimum Safety Factors (SF) per failure mechanism. These have been listed for the CTDM load cases. At this stage only the pipe is considered, not the connections. Table 29 shows the minimum SF’s for additional load cases where the SF is lower than the CTDM load cases. Table 44 - Minimum Safety Factors for 4 1/2" Tubing
Minimum Safety Factor
Load Case Safety Factor Depth (mTVD)
Triaxial Tubing Overpull 1.398 820.30 Axial Tubing Overpull 1.407 820.30 Collapse Ambient Collapse – Tubing leak 1.894 20436.34 Burst Pressure Test Inside Tubing 2.852 902.1-5000 Compression See Axial (Axial governed by
Compression)
Table 45 - Minimum Safety Factors where the Safety Factor is lower than the CTDM load cases
Minimum Safety Factor
Load Case Safety Factor Depth (mTVD)
Triaxial n/a Axial n/a Collapse n/a Burst n/a
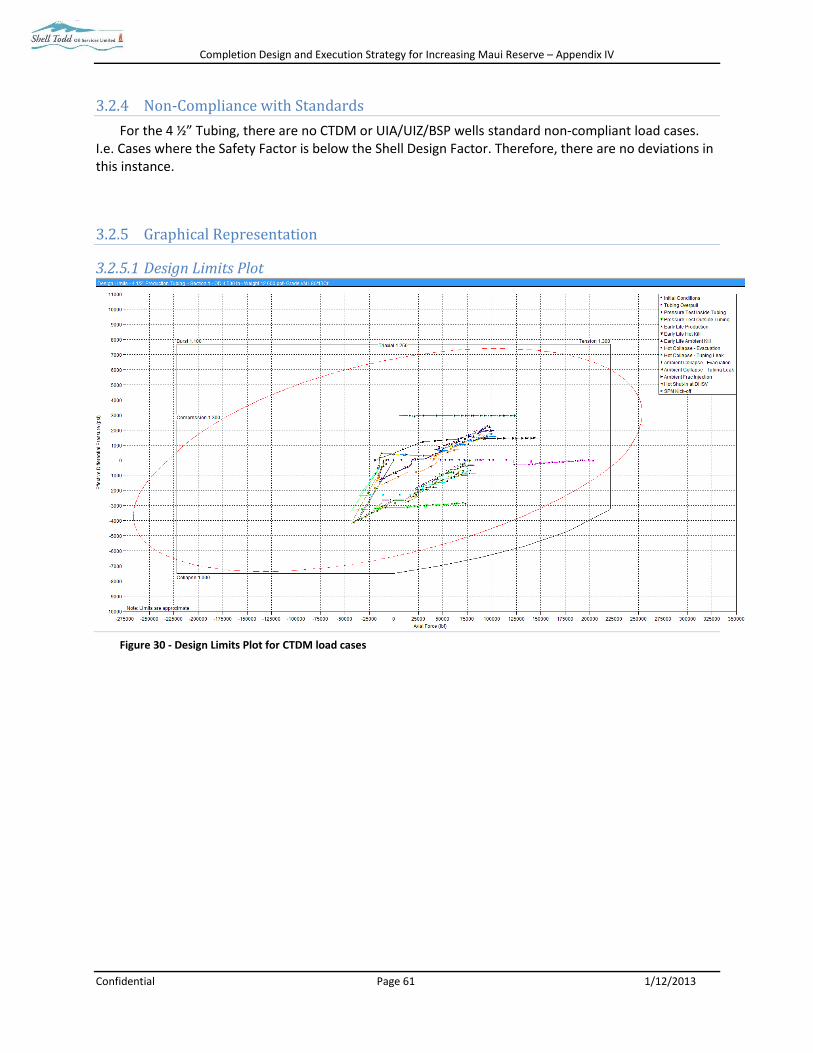
Completion Design and Execution Strategy for Increasing Maui Reserve – Appendix IV
Confidential Page 61 1/12/2013
3.2.4 Non-Compliance with Standards
For the 4 ½” Tubing, there are no CTDM or UIA/UIZ/BSP wells standard non-compliant load cases. I.e. Cases where the Safety Factor is below the Shell Design Factor. Therefore, there are no deviations in this instance.
3.2.5 Graphical Representation
3.2.5.1 Design Limits Plot
Figure 30 - Design Limits Plot for CTDM load cases

Completion Design and Execution Strategy for Increasing Maui Reserve – Appendix IV
Confidential Page 62 1/12/2013
3.2.5.2 CTDM Safety Factor Plots
Figure 31 - Triaxial Safety Factor Plot for CTDM load cases
Figure 32 - Axial Safety Factor Plot for CTDM load cases

Completion Design and Execution Strategy for Increasing Maui Reserve – Appendix IV
Confidential Page 63 1/12/2013
Figure 33 - Collapse Safety Factor for CTDM load cases
Figure 34 - Burst Safety Factor for CTDM load cases