Complete College Tennessee Act of ... - AGA Nashville Chapter
51
Complete College Tennessee Act of 2010 An Update Association of Government Accountants 2013 Southeast Region Professional Development Conference
Transcript of Complete College Tennessee Act of ... - AGA Nashville Chapter

Complete College Tennessee Act of 2010An Update
Association of Government Accountants2013 Southeast Region Professional
Development Conference

STATE FISCAL CONDITION &IMPACT ON HIGHER EDUCATION
2

3
Revenues and Expenditures in Tennessee, 1978 Base
$0
$1,000
$2,000
$3,000
$4,000
$5,000
$6,000
$7,000
$8,000
$9,000
$10,000
$11,000
$12,000
$13,000
$14,000
78 79 80 81 82 83 84 85 86 87 88 89 90 91 92 93 94 95 96 97 98 99 00 01 02 03 04 05 06 07 08 09 10
Reven
ues a
nd
Exp
en
dit
ure
s (
mil
lio
ns)
$0
$17,000
$34,000
$51,000
$68,000
$85,000
$102,000
$119,000
$136,000
$153,000
$170,000
$187,000
$204,000
$221,000
Pers
on
al In
co
me (m
illion
s)
Tax Financed Expenditures Adjusted Revenues Personal Income

10,621
9,075
7,010 7,178 6,090
4,852 4,373
-
-
- -
563
1,441 1,669
3,350
3,917
5,175 5,104 4,970
4,696 4,864
804
917 2,536 2,844 2,999
3,559 3,860
-
2,000
4,000
6,000
8,000
10,000
12,000
14,000
16,000
1986-87 1996-97 2006-07 2007-08 2008-09 2009-10 2010-11
State Appropriations ARRA/MOE Student Fees Less Grant Aid (TSAA, TELS, Pell) Grant Aid
Total Revenue per FTE – UniversitiesInflation Adjusted - 2011 Dollars
4
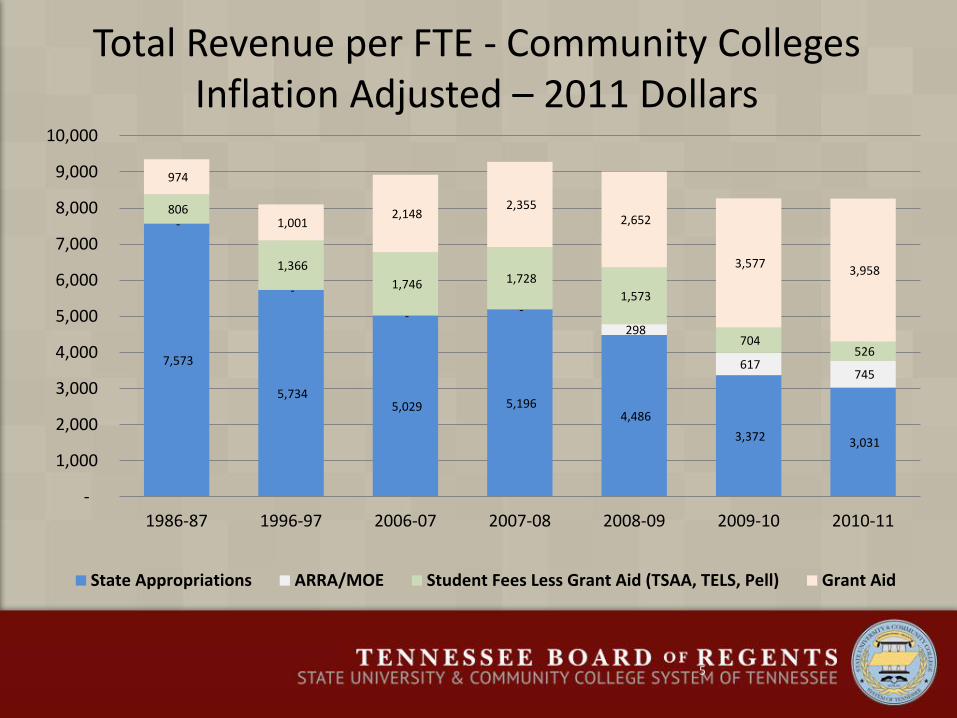
7,573
5,734 5,029 5,196
4,486
3,372 3,031
-
-
- -
298
617 745
806
1,366
1,746 1,728
1,573
704 526
974
1,001 2,148
2,355 2,652
3,577 3,958
-
1,000
2,000
3,000
4,000
5,000
6,000
7,000
8,000
9,000
10,000
1986-87 1996-97 2006-07 2007-08 2008-09 2009-10 2010-11
State Appropriations ARRA/MOE Student Fees Less Grant Aid (TSAA, TELS, Pell) Grant Aid
Total Revenue per FTE - Community CollegesInflation Adjusted – 2011 Dollars
5

State, Local, Tuition and Fee Revenues per FTE Student Public Research, 2009-10
Percent of National Average1
90
%1
78
%1
61
%1
49
%1
41
%1
31
%1
27
%1
25
%1
20
%1
19
%1
12
%1
12
%1
12
%1
11
%1
10
%1
06
%1
06
%1
06
%1
05
%1
03
%1
02
%1
01
%1
01
%1
01
%1
00
%1
00
%9
8%
97
%9
6%
95
%9
3%
93
%9
2%
92
%9
2%
91
%8
9%
88
%8
6%
86
%8
5%
84
%8
4%
82
%8
0%
79
%7
2%
72
%7
1%
67
%6
2%
0%
20%
40%
60%
80%
100%
120%
140%
160%
180%
200%
Co
nn
ecti
cut
Ala
ska
Ne
w J
erse
yN
ew
Yo
rkP
enn
sylv
ania
Ver
mo
nt
Wyo
min
gM
inn
eso
taC
alif
orn
iaM
aryl
and
Okl
aho
ma
Del
awar
eH
awai
iK
en
tuck
yIo
wa
Was
hin
gto
nN
eb
rask
aM
ain
eN
ort
h C
aro
lina
Sou
th C
aro
lina
Ind
ian
aM
ich
igan
Mas
sach
use
tts
Wes
t V
irgi
nia
Un
ited
Sta
tes
Texa
sA
lab
ama
Wis
con
sin
Illin
ois
Ark
ansa
sM
isso
uri
Kan
sas
Uta
hA
rizo
na
Geo
rgia
Ne
w M
exic
oM
issi
ssip
pi
Rh
od
e Is
lan
dV
irgi
nia
Oh
ioN
ort
h D
ako
taN
ew
Ham
psh
ire
Lou
isia
na
Idah
oTe
nn
ess
eeO
rego
nN
eva
da
Flo
rid
aM
on
tan
aSo
uth
Dak
ota
Co
lora
do
Sources: NCES, IPEDS Completions and Enrollment Surveys
6

State, Local, Tuition and Fee Revenues per FTE Student Public Bachelor’s and Masters, 2009-10
Percent of National Average1
56
%1
52
%1
41
%1
34
%1
34
%1
32
%1
29
%1
29
%1
26
%1
25
%1
23
%1
15
%1
13
%1
12
%1
11
%1
11
%1
10
%1
09
%1
08
%1
06
%1
05
%1
04
%1
04
%1
03
%1
03
%1
01
%1
00
%1
00
%9
6%
95
%9
5%
94
%9
3%
93
%9
2%
91
%9
1%
89
%8
5%
84
%8
0%
80
%7
5%
75
%7
5%
75
%7
0%
42
%4
1%
0%
20%
40%
60%
80%
100%
120%
140%
160%
180%
Del
awar
eA
lask
aV
erm
on
tC
on
nec
ticu
tN
ew
Mex
ico
Haw
aii
No
rth
Car
olin
aIll
ino
isIo
wa
Ne
w J
erse
yM
ain
eM
ich
igan
Mo
nta
na
Ala
bam
aM
assa
chu
sett
sM
isso
uri
Vir
gin
iaN
ew
Yo
rkM
aryl
and
Ke
ntu
cky
Cal
ifo
rnia
Rh
od
e Is
lan
dTe
xas
Ne
w H
amp
shir
eN
ort
h D
ako
taM
issi
ssip
pi
Sou
th C
aro
lina
Un
ited
Sta
tes
Ind
ian
aId
aho
Oh
ioK
ansa
sN
eb
rask
aO
rego
nSo
uth
Dak
ota
Wis
con
sin
Min
nes
ota
Was
hin
gto
nA
rkan
sas
Okl
aho
ma
Pen
nsy
lvan
iaTe
nn
ess
eeW
est
Vir
gin
iaFl
ori
da
Geo
rgia
Lou
isia
na
Uta
hN
eva
da
Co
lora
do
Sources: NCES, IPEDS Completions and Enrollment Surveys
7

State, Local, Tuition and Fee Revenues per FTE Student Public Two-Year, 2009-10
Percent of National Average5
25
%2
19
%1
63
%1
60
%1
55
%1
53
%1
41
%1
35
%1
32
%1
28
%1
28
%1
21
%1
21
%1
20
%1
20
%1
14
%1
13
%1
12
%1
08
%1
07
%1
07
%1
04
%1
04
%1
03
%1
01
%1
00
%1
00
%1
00
%9
9%
97
%9
4%
93
%9
3%
92
%9
2%
91
%9
1%
88
%8
3%
82
%8
0%
78
%7
7%
76
%7
3%
71
%7
1%
70
%7
0%
65
%6
4%
0%
100%
200%
300%
400%
500%
600%
Ala
ska
Wis
con
sin
Wyo
min
gO
rego
nM
aryl
and
Ne
w H
amp
shir
eD
elaw
are
Co
nn
ecti
cut
No
rth
Dak
ota
Haw
aii
Kan
sas
Ari
zon
aN
eb
rask
aN
ew
Yo
rkId
aho
Mic
hig
anR
ho
de
Isla
nd
Ne
w M
exic
oP
enn
sylv
ania
Ver
mo
nt
Min
nes
ota
Mas
sach
use
tts
Uta
hTe
xas
Oh
ioW
ash
ingt
on
Un
ited
Sta
tes
Illin
ois
Cal
ifo
rnia
Sou
th D
ako
taN
ew
Jer
sey
Iow
aA
rkan
sas
Mo
nta
na
No
rth
Car
olin
aO
klah
om
aM
ain
eTe
nn
ess
eeA
lab
ama
Vir
gin
iaM
issi
ssip
pi
Sou
th C
aro
lina
Co
lora
do
Mis
sou
riW
est
Vir
gin
iaK
en
tuck
yN
eva
da
Geo
rgia
Flo
rid
aLo
uis
ian
aIn
dia
na
Sources: NCES, IPEDS Completions and Enrollment Surveys
8

WHY WAS IT NECESSARY?Complete College Tennessee Act of 2010
9

10
Matthew N. Murray, UT Center for Business & Economic Research
Our human capital flow: the Tennessee student pipeline, 2008
86.0
59.6
41.7
30.2
69.5
44.0
29.8
20.5
71.1
43.8
28.9
19.3
Source: National Center for Higher Education Management Systems. March 2011

Percent of 25-64 Year Olds with College Degrees – Associate and Higher, 2011
50
.84
74
6.6
46
.44
6.2
45
.84
5.4
45
.14
54
4.7
44
.64
3.3
43
.24
1.7
41
.64
1.5
41
.14
0.7
40
.34
03
9.6
39
.43
9.2
39
38
.93
8.7
38
.63
8.2
37
.63
73
6.8
36
.53
6.4
36
.43
6.2
35
.83
5.5
34
.53
4.4
34
.23
3.9
33
.83
33
2.1
31
.93
0.8
30
.33
02
8.2
27
.92
7.8
0
10
20
30
40
50
60
Mas
sach
use
tts
Co
lora
do
Min
nes
ota
Co
nn
ecti
cut
Ver
mo
nt
New
Ham
psh
ire
Mar
ylan
dN
ew J
erse
yV
irgi
nia
No
rth
Dak
ota
New
Yo
rkW
ash
ingt
on
Rh
od
e Is
lan
dIll
ino
isH
awai
iN
ebra
ska
Iow
aK
ansa
sU
tah
Mai
ne
Wis
con
sin
Sou
th D
ako
taM
on
tan
aO
rego
nC
alif
orn
iaN
atio
nP
enn
sylv
ania
No
rth
Car
olin
aD
elaw
are
Flo
rid
aM
ich
igan
Idah
oG
eorg
iaM
isso
uri
Wyo
min
gA
rizo
na
Oh
ioTe
xas
Ala
ska
Sou
th C
aro
lina
New
Mex
ico
Ind
ian
aO
klah
om
aTe
nn
esse
eA
lab
ama
Ken
tuck
yM
issi
ssip
pi
Nev
ada
Ark
ansa
sLo
uis
ian
aW
est
Vir
gin
ia
11
Source: U.S. Census Bureau, 2011 American Community Survey

Comparing Tennessee with
Nations and Other States in the Percentage of Young Adult
Degree Attainment
(Ages 25-34)
U.S. States % OECD CountryKorea (65.0)
60
56 Japan, Canada
Massachusetts 54
North Dakota 52
Minnesota New York 50
New Jersey 48 IrelandNew Hampshire Norway
Connecticut Iowa 46 New Zealand, United KingdomVirginia Illinois Maryland South Dakota
Pennsylvania Nebraska Colorado Vermont 44 Australia, Luxembourg, Israel, BelgiumRhode Island Kansas FranceMontana Wisconsin 42 UNITED STATES, Sweden
Washington Netherlands, SwitzerlandMissouri Hawaii 40
Wyoming Maine Delaware Utah Finland, Spain, ChileOhio California Oregon 38 Estonia, DenmarkMichigan North Carolina Poland
Indiana Florida South Carolina 36 IcelandGeorgia
Alaska Kentucky Tennessee 34Arizona Mississippi Texas
Alabama Idaho 32Louisiana Slovenia, Greece
Oklahoma Arkansas West Virginia 30
Nevada 28New Mexico
26 Germany, HungaryPortugal
24 Slovak RepCzech Rep
22 MexicoAustria, Italy
20Source: 2012 OECD Education at a Glance; 2010 American Community Survey
Turkey (17.4)
12

Educational Attainment of Working Aged Adults, Ages 25-64 –Tennessee, U.S., and Most Educated State, 2011
Source: US Census Bureau, ACS
12.5
33.2
22.1
6.9
16.6
8.7
12.3
27.0
22.0
8.6
19.3
10.8
8.7
23.5
17
8.3
24.8
17.6
0
5
10
15
20
25
30
35
Less than HighSchool
High School Some College, NoDegree
Associates Degree Bachelor's Degree Graduate,Professional Degree
Tennessee United States Massachusetts
13
AL
AKAZ
AR
CA
COCT
DE
FLGA
HI
ID
IL
IN
IA KS
KY
LA
ME
MD
MA
MI
MN
MS
MO
MT
NE
NV
NH NJ
NM
NY
NC
ND
OH
OK
OR
PA
RI
SC
SD
TNTX
UT
VTVAWA
WV
WI
WY
US
20
27
34
41
48
55
25,000 30,000 35,000 40,000 45,000 50,000 55,000 60,000
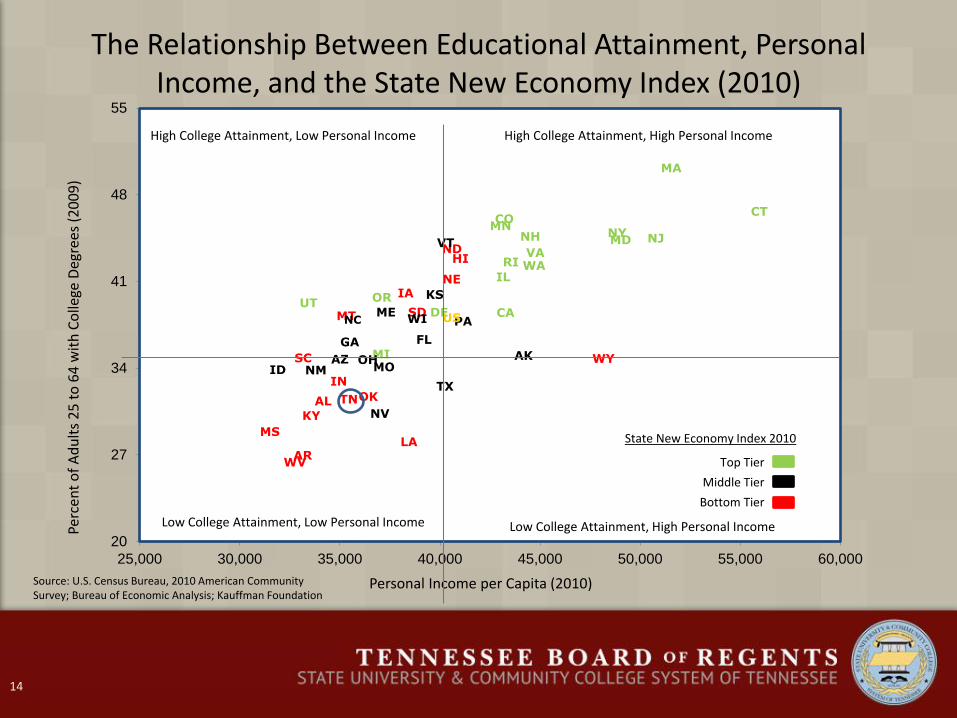
The Relationship Between Educational Attainment, Personal Income, and the State New Economy Index (2010)
Perc
en
t o
f A
du
lts
25
to
64
wit
h C
olle
ge D
egre
es
(20
09
)
Personal Income per Capita (2010)
High College Attainment, Low Personal Income High College Attainment, High Personal Income
Low College Attainment, Low Personal Income Low College Attainment, High Personal Income
Source: U.S. Census Bureau, 2010 American Community Survey; Bureau of Economic Analysis; Kauffman Foundation
State New Economy Index 2010
Top Tier
Middle Tier
Bottom Tier
14

Fraction happy about life by years of completed schooling before and after conditioning on income
0.95
0.90
0.85
0.800–11 13–15 16+12
Years of schooling
Fra
ctio
n h
ap
py
No income controls Conditional on income
Source: Oreopoulos, P. & Salvanes,
K.G., “Priceless: The Nonpecuniary
Benefits of Schooling,” Journal of
Economic Perspectives, Vol. 25,
No.1.
15

Job satisfaction and years of completed schooling before and after conditioning on income
Source: Oreopoulos, P. &
Salvanes, K.G., “Priceless:
The Nonpecuniary Benefits
of Schooling,” Journal of
Economic Perspectives,
Vol. 25, No.1.
0.88
0.86
0.84
0.80
0–11 13–15 16+12
Years of schooling
Fra
ction o
f re
spondents
Before conditioning on income After conditioning on income
0.82
Are you satisfied
with your job?
16

Self-assessed health status and years of completed schooling before and after conditioning on income
Source: Oreopoulos, P. &
Salvanes, K.G., “Priceless: The
Nonpecuniary Benefits of
Schooling,” Journal of
Economic Perspectives, Vol. 25,
No.1.
0.50
0.40
0.30
0.20
0–11 13–15 16+12
Years of schooling
Fra
ction o
f re
spondents
Before conditioning on income After conditioning on income
Fraction reporting
Very Good Health
17

Do you believe people can be trusted?
Source: Oreopoulos, P. &
Salvanes, K.G., “Priceless:
The Nonpecuniary Benefits of
Schooling,” Journal of
Economic Perspectives, Vol.
25, No.1.
0.60
0.50
0.30
0–11 13–15 16+12
Years of schooling
Fra
ction o
f re
spondents
Before conditioning on income After conditioning on income
0.40
18

Likelihood of divorce or separation
Source: Oreopoulos, P. &
Salvanes, K.G., “Priceless: The
Nonpecuniary Benefits of
Schooling,” Journal of
Economic Perspectives, Vol.
25, No.1.
0.15
0.10
0
0–11 13–15 16+12
Years of schooling
Fra
ction o
f re
spondents
Before conditioning on income After conditioning on income
0.05
19

Time preferences for today or the future: Do you live for today?
Source: Oreopoulos, P. & Salvanes,
K.G., “Priceless: The Nonpecuniary
Benefits of Schooling,” Journal of
Economic Perspectives, Vol. 25,
No.1.
0.55
0.50
0.45
0.30
0–11 13–15 16+12
Years of schooling
Fra
ction o
f re
spondents
Before conditioning on income After conditioning on income
0.35
0.40
20

HOW THE COMPLETE COLLEGE TENNESSEE ACT COME ABOUT
An Insider’s Story
21

Discussion Points• Why Interested?
– Governor Bredesen: Higher Ed represented “unfinished business”– Legislature: What do we get for our investment in higher ed?
• What was the Environment?– Great Recession’s impact on higher education funding– Race to Top competition– Status of TBR & UT System Heads– All members of TBR/UT/THEC boards were appointed by Governor Bredesen
• External Expertise & Resources Made Available• Process• Direction
– Initial Thoughts: “It about organizational structure”– Final thoughts: “Its about aligning higher educations goals and funding
structure to those of the State”
• Result: Complete College Tennessee Act
22
WHAT DID IT DO?Complete College Tennessee Act of 2010
23

Master Plan With a Purpose
• Establishes Master Planning with a Purpose– Address the state's economic development, workforce
development and research needs;
– Ensure increased degree production within the state's capacity to support higher education; and
– Use institutional mission differentiation to realize statewide efficiencies through institutional collaboration and minimized redundancy in degree offerings, instructional locations and competitive research
24

Common Core & Transfer Pathways• Requires 60 Hour University Track Program
– 41 Hours of General Education
– 19 Hours of Pre-Major
• Requires creations of Transfer Pathways
– Guarantees Transfer of A.A. or A.S. degrees to Public Universities as a Junior
– Guarantees Transfer of Completed Blocks of University Track
– Non-transfer Courses Will be Clearly Identified
25

Establishes a Comprehensive Community College System
• System Elements
– Coordinated Programs Statewide
– Consolidate Services and Standardize Processes
– Utilize Cohort Programs and Block Scheduling
– Develop More Cooperative Programs Between Technology Centers and Community Colleges
– Single Budget Line Item
26

Outcome Based Funding Formula• Directs New Funding Formula be Implemented
– Must be consistent with and further the goals of the statewide master plan – Funding recommendations shall reflect the priorities of the approved master
plan
• New Funding Formula:– shall emphasize outcomes across a range of variables;– be weighted to reinforce each institution's mission;– provide incentives for productivity improvements.
• Outcomes shall include:– end of term enrollment, – student retention, – timely progress toward degree completion, and – degree production
• Outcomes may include:– student transfer activity, – research;– student success, and– compliance with transfer and articulation principles.
27

Other Provisions
• Prohibits Remedial or Developmental Courses at Universities
• Mandates Dual Admission Policies
• Research Initiatives
• Various Reporting and Implementation Provisions
28

SummaryWhen Taken Together…
– Complete College Act of 2010
– First to the Top Act of 2010
– Tennessee Diploma Project and Achieve
…Will be Transformative for Tennessee
29

RESULTS SO FARComplete College Tennessee Act of 2010
30

Common Core &Tennessee Transfer Pathways
• Common Core Requirement – Completed
• Transfer Pathways – Completed
• Pathway example
http://www.tntransferpathway.org/
31

Community College System
• System Approach
– Creation of Vice Chancellor’s Office
– Marketing Plan
– Single Line Item Appropriation
– Program Coordination Among and Between Colleges and TTC’s
• Consolidate Services and Standardized Processes
– ERP Hosting Initiative – a consolidation activity
– Business Process Modeling – a standardization activity
32

Dual Admission
• THEC – established policy governing dual admission agreements
– Every university & community college has agreements in place with institutions within their geographic proximity
• Cohort / Block Scheduling Programs
33

Outcome Formula
• Developed by THEC with involvement of Systems and state leadership
• First used to make funding recommendation for FY 2011-12
• Transition Provisions
– Formula phased in over 3 years (FY 2013-14)
– Hold Harmless provision phased out over 3 years (FY 2013-14)
34
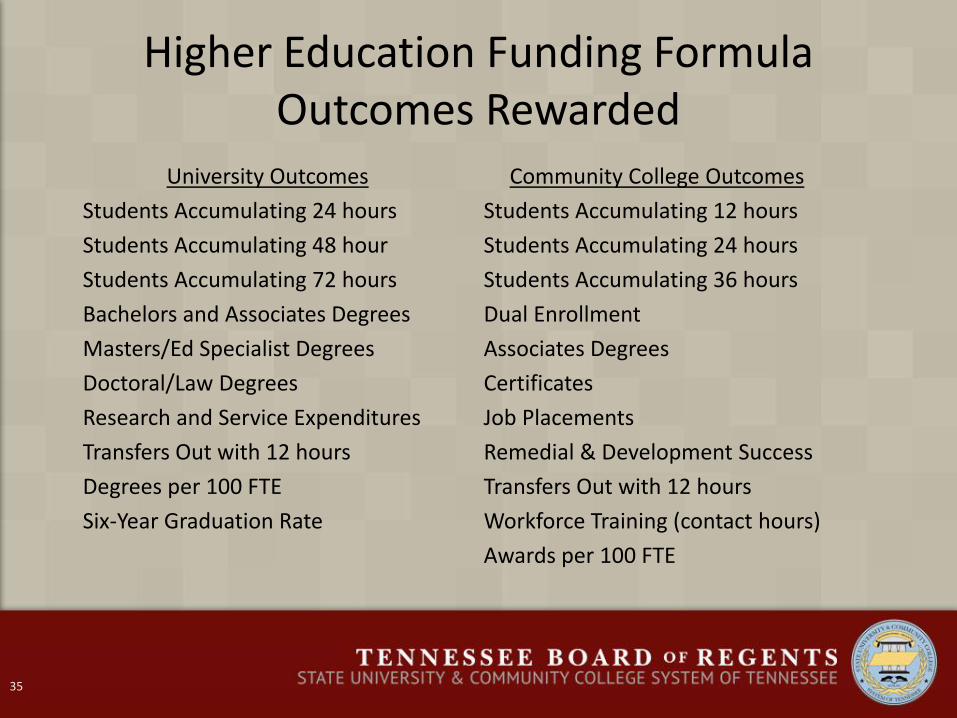
Higher Education Funding FormulaOutcomes Rewarded
35
University Outcomes Community College Outcomes
Students Accumulating 24 hours Students Accumulating 12 hours
Students Accumulating 48 hour Students Accumulating 24 hours
Students Accumulating 72 hours Students Accumulating 36 hours
Bachelors and Associates Degrees Dual Enrollment
Masters/Ed Specialist Degrees Associates Degrees
Doctoral/Law Degrees Certificates
Research and Service Expenditures Job Placements
Transfers Out with 12 hours Remedial & Development Success
Degrees per 100 FTE Transfers Out with 12 hours
Six-Year Graduation Rate Workforce Training (contact hours)
Awards per 100 FTE

“Premium” Outcomes
For Each
Low Income Student (Pell eligible); orAdult Student (age 24+)
Earning One of the Following Outcomes
University Outcomes Community College OutcomesStudents Accumulating 24 hours Students Accumulating 12 hoursStudents Accumulating 48 hour Students Accumulating 24 hoursStudents Accumulating 72 hours Students Accumulating 36 hoursBachelors and Associates Degrees Associates Degrees
Certificates
The Institution Earns a Premium of 40%(each outcome counts as 1.4 outcomes)
36

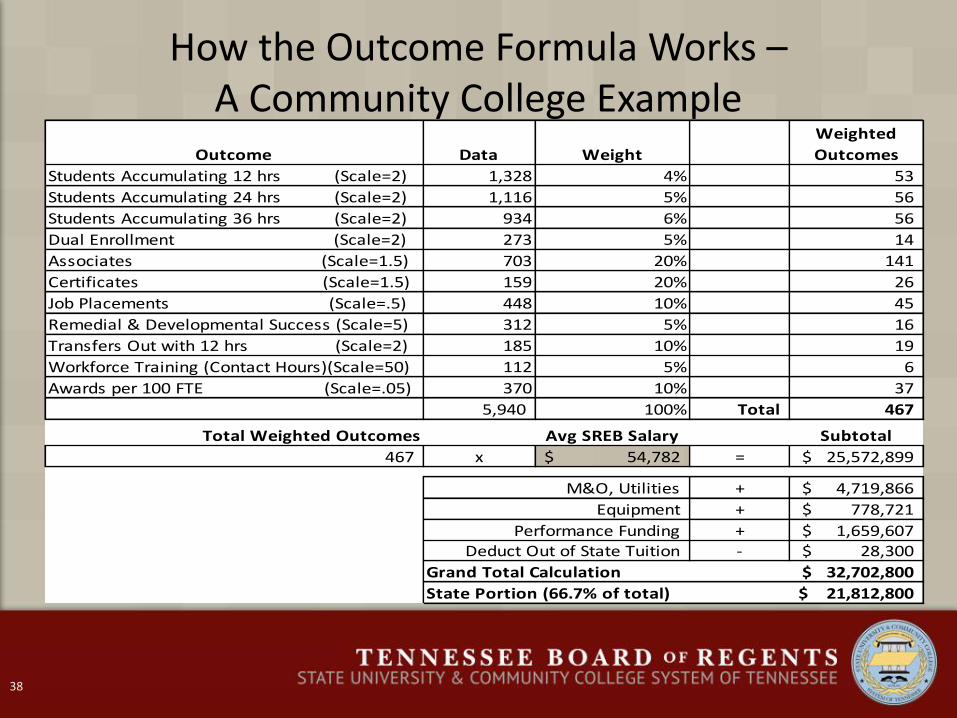
How the Outcome Formula Works –A Community College Example
37
Outcome
Raw
Data
Scaled
Data
Raw
Data
Scaled @
Premium
Total Scaled
Outcomes
Students Accumulating 12 hrs (Scale=2) 1,885 943 1,926 385.2 1,328
Students Accumulating 24 hrs (Scale=2) 1,557 779 1,685 337.0 1,116
Students Accumulating 36 hrs (Scale=2) 1,293 647 1,439 287.8 934
Dual Enrollment (Scale=2) 546 273 273
Associates (Scale=1.5) 716 477 847 225.9 703
Certificates (Scale=1.5) 159 106 198 52.8 159
Job Placements (Scale=.5) 224 448 448
Remedial & Developmental Success (Scale=5) 1,561 312 312
Transfers Out with 12 hrs (Scale=2) 370 185 185
Workforce Training (Contact Hours)(Scale=50) 5,610 112 112
Awards per 100 FTE (Scale=.05) 18.50 370 370
5,940
Outcomes Subpopulations
How the Outcome Formula Works –A Community College Example
38
Outcome Data Weight
Weighted
Outcomes
Students Accumulating 12 hrs (Scale=2) 1,328 4% 53
Students Accumulating 24 hrs (Scale=2) 1,116 5% 56
Students Accumulating 36 hrs (Scale=2) 934 6% 56
Dual Enrollment (Scale=2) 273 5% 14
Associates (Scale=1.5) 703 20% 141
Certificates (Scale=1.5) 159 20% 26
Job Placements (Scale=.5) 448 10% 45
Remedial & Developmental Success (Scale=5) 312 5% 16
Transfers Out with 12 hrs (Scale=2) 185 10% 19
Workforce Training (Contact Hours)(Scale=50) 112 5% 6
Awards per 100 FTE (Scale=.05) 370 10% 37
5,940 100% Total 467
Total Weighted Outcomes Avg SREB Salary Subtotal
467 x 54,782$ = 25,572,899$
M&O, Utilities + 4,719,866$
Equipment + 778,721$
Performance Funding + 1,659,607$ Deduct Out of State Tuition - 28,300$
Grand Total Calculation 32,702,800$
State Portion (66.7% of total) 21,812,800$

OUTCOME PERFORMANCE Outcome Funding Formula
39

Wei
ghte
d O
utc
om
es H
isto
ry
1,155
1,788
2,794
1,289 1,478
2,799
1,201
1,817
2,895
1,275
1,502
2,874
1,231
1,844
2,884
1,261
1,447
2,896
1,000
1,200
1,400
1,600
1,800
2,000
2,200
2,400
2,600
2,800
3,000
APSU ETSU MTSU TSU TTU UoM
2012 2013 2014
40

75.5
56.3
89.2
(28.3) (30.9)
97.3
(60.0)
(40.0)
(20.0)
-
20.0
40.0
60.0
80.0
100.0
120.0
APSU ETSU MTSU TSU TTU UoM
Cumulative Change in Weighted OutcomesFY 2012 to FY 2014
41

Enrollment Trend – Universities(FTE)
60,000
62,000
64,000
66,000
68,000
70,000
72,000
74,000
76,000
78,000
80,000
2001 2002 2003 2004 2005 2006 2007 2008 2009 2010 2011 2012
42

Un
iver
sity
Ou
tco
me
Perf
orm
ance
FY
20
10
–2
01
2 (e
nro
llmen
t ad
just
ed)
(6)
(5)
(3)
(3)
(2)
(3)
(2)
(1)
1
3
3
3
3
4
5
2
6
6
(7) (5) (3) (1) 1 3 5 7
24 CH
48 CH
Grad Rate
72 CH
Doc & Law
Research & Serv.
Degrees Per FTE
Ed Spec & Masters
Assoc
Transfers Out
Bach
Number of Institutions
POSITIVE GROWTH RATENEGATIVE GROWTH RATE
43

Un
iver
sity
Ou
tco
me
Sum
mar
y(E
nro
llmen
t A
dju
sted
)Outcomes with Performance Increases at all Institutions
Average Low High
Bachelor and
Associates6.5% 0.9% 12.7%
Transfers Out with
12 hours19.0% 8.2% 33.4%
Annual Change
Outcomes with Performance Decreases at all Institutions
Average Low High
Students Accumulating
24 hrs.-6.9% -13.4% -3.1%
Annual Change
Outcomes with Mixed Performance Across Institutions
Average Low High
Students Accumulating 48 hrs. -1.7% -3.1% 0.9%
Students Accumulating 72 hrs. 0.3% -4.5% 6.9%
Masters / Ed Specialist
Degrees4.1% -17.2% 11.9%
Doctoral / Law Degrees 6.5% -3.8% 27.0%
Research and Service -0.9% -7.8% 9.4%
Degrees per 100 FTE 1.3% -1.4% 3.9%
Six-Year Graduation Rate 0.9% -2.0% 4.3%
Annual Change
+ -
+/-
44

Wei
ghte
d O
utc
om
es H
isto
ry
100.0
200.0
300.0
400.0
500.0
600.0
700.0
800.0
900.0
1,000.0 2012 2013 2014
45

172.6
104.0 90.0
59.7
14.3 9.7 2.2 0.6 (3.7) (8.3)
(15.8)(50.4)
(87.9) (100.0)
(50.0)
-
50.0
100.0
150.0
200.0
Cumulative Change in Weighted Outcomes2012 to 2014
46

Enrollment Trend – Community Colleges (FTE)
45,000
47,000
49,000
51,000
53,000
55,000
57,000
59,000
61,000
63,000
65,000
2001 2002 2003 2004 2005 2006 2007 2008 2009 2010 2011 2012
47

Co
mm
un
ity
Co
llege
Ou
tco
me
Perf
orm
ance
FY
20
10
–2
01
2 (e
nro
llmen
t ad
just
ed)
(13)
(13)
(11)
(5)
(2)
(1)
2
8
11
12
13
13
13
(15) (10) (5) - 5 10 15
12 CH
24 CH
36 CH
Contact Hrs
Certificates
Awards Per FTE
Assoc
Job Place
Transfers Out
Number of Institutions
POSITIVE GROWTH RATENEGATIVE GROWTH RATE
48

Co
mm
un
ity
Co
llege
Ou
tco
me
Sum
mar
y (E
nro
llmen
t A
dju
sted
)
Outcomes with Performance Increases at all Institutions
Outcomes with Performance Decreases at all Institutions:
Outcomes with Mixed Performance Across the Institutions
Average Low High
Dual Enrollment 15.0% 3.3% 34.9%
Remedial and
Developmental Success20.8% 14.2% 34.3%
Associate Degrees 14.6% 9.0% 21.6%
Job Placement 17.6% 6.5% 62.7%
Transfers Out 15.4% 3.4% 23.6%
Annual Change
Average Low High
12 Credit Hours -16.9% -22.1% -10.5%
24 Credit Hours -10.1% -13.3% -5.2%
Annual Change
Average Low High
36 Credit Hours -2.9% -6.7% 3.9%
Certificates 25.7% -23.5% 345.8%
Awards per FTE 8.9% -3.6% 20.3%
Contact Hours (1,000) 20.5% -23.5% 57.7%
Annual Change
+
-
+/-
49

How Are We Responding?
• Completion Academies
• Redesign of “Gateway” Courses
• Dashboards for Staff
• Staff connection of their work to outcome generation
50

Q & A