Complete Anonymity Compromises the Accuracy of - PPRG website
38
Complete Anonymity Compromises the Accuracy of Self-Reports Yphtach Lelkes and Jon A. Krosnick Stanford University David M. Marx San Diego State University Charles M. Judd and Bernadette Park University of Colorado–Boulder September, 2011 Word Count: 5,705 Jon Krosnick is University Fellow at Resources for the Future. Correspondence should be addressed to Yphtach Lelkes, Department of Communication, Stanford University, 120 McClatchy Hall, 450 Serra Mall, Stanford, CA 94305 (email: [email protected]), or Jon Krosnick, 434 McClatchy Hall, 450 Serra Mall, Stanford, CA 94305 (email: [email protected]).
Transcript of Complete Anonymity Compromises the Accuracy of - PPRG website
Complete Anonymity Compromises the Accuracy of Self-Reports
Yphtach Lelkes and Jon A. Krosnick
Stanford University
David M. Marx
San Diego State University
Charles M. Judd and Bernadette Park
University of Colorado–Boulder
September, 2011
Word Count: 5,705
Jon Krosnick is University Fellow at Resources for the Future. Correspondence should be
addressed to Yphtach Lelkes, Department of Communication, Stanford University, 120
McClatchy Hall, 450 Serra Mall, Stanford, CA 94305 (email: [email protected]), or Jon
Krosnick, 434 McClatchy Hall, 450 Serra Mall, Stanford, CA 94305 (email:
Abstract
Studies have shown that allowing people to answer questionnaires completely anonymously
yields more reports of socially inappropriate attitudes, beliefs, and behaviors, and researchers
have often assumed that this is evidence of increased honesty. But such evidence does not
demonstrate that reports gathered under completely anonymous conditions are more accurate.
Although complete anonymity may decrease a person’s motivation to distort reports in socially
desirable directions, complete anonymity may also decrease accountability, thereby decreasing
motivation to answer thoughtfully and precisely. Three studies reported in this paper demonstrate
that allowing college student participants to answer questions completely anonymously
sometimes increased reports of socially undesirable attributes, but consistently reduced reporting
accuracy and increased survey satisficing. These studies suggest that complete anonymity may
compromise measurement accuracy rather than improve it.
Keywords: Anonymity, Social Desirability, Satisficing, Accountability, Response Bias
Complete Anonymity Compromises the Accuracy of Self-Reports
A great deal of social science research collects data via questionnaires. In many such
studies, participants are told not to provide identifying information, so that the participants know
that their answers will be completely anonymous. Many textbooks on social science research
advocate this method of collecting data (e.g., Colton & Covert, 2007; Evans & Rooney, 2008;
Mitchell & Jolley, 2010). The provision of complete anonymity is presumed to facilitate
collection of more accurate data by minimizing social desirability pressures. However, although
a series of studies have yielded results consistent with increased reporting of socially undesirable
responses under conditions of complete anonymity, the vast majority of these studies provide no
direct evidence of improved accuracy, leaving their interpretation open to question.
In this paper, we propose a different interpretation of these results and a different view of
complete anonymity. To be sure, complete anonymity allows research participants to know that
their answers cannot be traced back to them. But complete anonymity may also do more: it may
remove any sense of accountability for one’s answers, thus reducing participant motivation to
provide accurate reports. Consequently, participants may provide different answers because
participants take cognitive shortcuts when responding, think less carefully in generating self-
reports, and as a result, provide less accurate data.
Social Desirability Response Bias
For decades, researchers have been concerned about participants’ honesty when
completing a questionnaire if honest responses would be embarrassing. Understandably,
participants might feel more than a little sheepish if they were to report having abused alcohol to
an interviewer who looks like she might disapprove, or to report not voting to a researcher who
2
seems very interested in politics, or to report harboring prejudicial feelings toward members of a
particular racial group. Therefore, researchers have suspected that participants might
intentionally lie under such circumstances and provide self-reports they know are inaccurate.
Some studies that explored this possibility failed to turn up supportive evidence. For
example, despite the fact that cigarette smoking appears to be considered socially undesirable,
studies comparing reports of tobacco use with blood tests of serum cotinine have turned up no
evidence of under-reporting (Caraballo, Giovino, Pechacek, & Mowery, 2001; Patrick et al.,
1994; Yeager & Krosnick, 2010). But other studies using a variety of methods have uncovered
evidence suggesting that reports may have been intentionally distorted in socially desirable
directions. For example, some studies found that the proportion of participants who told
interviewers that they voted in a recent election was larger than the proportion of the population
who voted according to official government records (e.g., Clausen, 1968; Traugott & Katosh,
1979).
Findings such as these have inspired researchers to develop personality inventories, such
as Crowne and Marlow’s (1960) battery, to identify people who are generally inclined to
misrepresent themselves in socially desirable ways. A different approach adopts a situational
perspective: whether misrepresentation occurs depends on the interaction of the content of a
question and attributes of the situation in which the report is made. Tools such as the item count
technique (Droitcour et al., 1991; Holbrook & Krosnick, 2010), the bogus pipeline (Jones &
Sigall, 1971), the randomized response technique (Fox & Tracy, 1986; Himmelfarb & Lickteig,
1982; Lensvelt-Mulders, Hox, van der Heijden, & Maas, 2005; Warner, 1965), or simply telling
people to be honest (Olson, Fazio, & Herman, 2007) were developed based on these principles.
But perhaps the most frequently advocated and utilized method for minimizing social
3
desirability pressures involves having participants complete written questionnaires while not
identifying themselves on those questionnaires (e.g., Gaydos et al., 1998; Meier et al. 1998;
Perkins & Berkowitz, 1986; Turnley & Feldman, 2000). This approach presumes that if a person
answers a questionnaire completely anonymously, then the incentives to misrepresent himself or
herself in socially desirable ways disappear, so honest and accurate self-reports can be expected.
A variety of studies have shown that people randomly assigned to answer questionnaires
completely anonymously reported more socially undesirable attributes than did people who
answered the questionnaires while identifying themselves (e.g., Booth-Kewley, Edwards, &
Rosenfeld, 1992; Gordon, 1987; Lautenschlager & Flaherty, 1990; Paulhaus, 1984). For example,
Gordon (1987) found that complete anonymity when completing paper questionnaires led to
reports of fewer dental checkups, less teeth brushing, and less flossing. Likewise, Paulhus
(1984) found that complete anonymity led people to provide reports that conveyed less flattering
images of themselves.
This sort of evidence is consistent with the assumptions that (a) complete anonymity
begets honesty, and (b) higher reports of undesirable behavior are more accurate (e.g., Bradburn,
Sudman, Blair, & Stocking, 1978). However, these assumptions are just that—assumptions. The
vast majority of studies in this literature have not attempted to validate the reports gathered under
conditions of complete anonymity to corroborate the assumption of greater honesty. Rather,
researchers have routinely adopted the “more is better” assumption: that more reports of socially
undesirable attributes must be evidence of more accuracy. Although this may be the case, the
absence of direct corroboration leaves this sort of evidence ambiguous in the end.
An Alternative Perspective on Complete Anonymity
In this paper, we explore an alternative view of this evidence: that complete anonymity
4
may not be the effective fix that past studies suggest. Specifically, although complete anonymity
certainly eliminates the possibility of undesirable consequences resulting from providing
embarrassing self-reports, complete anonymity also eliminates a participant’s sense of
accountability, which may compromise reporting accuracy. Defined by Lerner and Tetlock
(1999), accountability “refers to the implicit or explicit expectation that one may be called on to
justify one’s beliefs, feelings, and actions to others” (p. 255).
A host of studies indicate that increasing the identifiability of a participant’s responses
increases that person’s sense of accountability, and, consequently, the level of cognitive
engagement he or she manifests in the task (e.g., Price 1987; Reicher & Levine, 1994a, 1994b;
Schopler et al., 1995; Williams, Harkins, & Latane 1981; Zimbardo, 1969). That is, a participant
who is identifiable is apparently more motivated to complete assigned tasks thoughtfully. Price
(1987), for example, demonstrated that participants writing their names on an instruction sheet at
the beginning of an experiment led to better recall of material that participants read during the
experiment. And Gordon and Stuecher (1992) found that when asked to complete teacher
evaluations, identifiable participants gave more linguistically complex responses to open-ended
questions than did completely anonymous participants.
The theory of survey satisficing (Krosnick, 1991, 1999) posits that the level of effort a
participant devotes to completing a questionnaire depends on his or her level of motivation.
Answering a question optimally requires that a participant interpret its intended meaning, search
memory for relevant information with which to construct an answer, integrate the retrieved
information into a summary judgment, and express that judgment by selecting one of the
response options offered by the question. When participant motivation declines, people are
thought to shortcut this process by implementing a process called “satisficing.” This can
5
manifest itself as a bias toward selecting the first response alternative offered, agreeing with
assertions, evaluating a set of objects identically instead of differentiating among them, selecting
an offered “don’t know” response option, and more (see Krosnick, 1991, 1999).
If accountability increases participant motivation to optimize when answering questions,
then eliminating accountability may invite satisficing. Although complete anonymity appears to
have increased reporting of socially undesirable attributes in past studies, the people who
provided those responses may not, in fact, have been the people who genuinely possessed the
undesirable attributes in question. Indeed, complete anonymity may have sometimes caused
over-reporting rather than simply eliminating under-reporting, an outcome that past studies were
not designed to detect.
The Present Investigation
The three studies described here examined the effects of complete anonymity on
satisficing, as well as on honesty and accuracy in reporting attributes with social desirability
connotations. Based on theory and past research findings, we expected that:
1. Participants reporting completely anonymously will report more socially undesirable
attributes.
2. Participants reporting completely anonymously might manifest more satisficing.
3. Participants reporting completely anonymously might provide less accurate reports of
factual matters.
The studies entailed recording actual behavior (with which to assess reporting accuracy) without
participants knowing that such recording was being done.
In the three studies, participants completed a questionnaire either completely
anonymously or in an identified manner. We examined the frequency with which socially
6
desirable self-descriptions were provided, the accuracy of factual reports, and the extent of
survey satisficing as manifested by non-differentiation. We examined accuracy in two ways: the
mean level of attributes reported, and the comparability of rank orders of and spacing among
participants.
Non-differentiation occurs when a participant is asked to answer a series of questions
using the same set of closed-ended answer choices (e.g., a rating scale from “strongly agree” to
“strongly disagree”) and provides highly similar responses across items without putting much
thought into answering, rather than thinking carefully and answering the different questions
differently. The theory of satisficing predicts that reduced participant motivation should be
especially likely to yield increased satisficing as participant fatigue grows toward the end of a
long questionnaire, as evidenced by numerous studies (Backor, Golde, & Nie, 2007; Herzog and
Bachman, 1981; Johnson, Sieveking, & Clanton, 1974; Kraut et al., 1975). Therefore, if
complete anonymity reduces participant motivation to provide accurate reports, then complete
anonymity may yield more evidence of satisficing at the end of a questionnaire than at the
beginning.
Study 1
Method
Participants. At the University of Colorado, 73 undergraduates participated in this study
in exchange for partial course credit in Introductory Psychology courses.
Procedure. Participants were told that the study was about how people search for
information on the Internet and that each participant would be asked to gather information on
one of eight topics, such as the film career of Brad Pitt and the mountain pygmy-possum. All
participants were, in fact, asked to collect facts about the mountain pygmy-possum.
7
Participants were seated in front of a computer in a small room and were shown a
bookmarked menu in Internet Explorer that listed 40 websites. Participants were told that while
investigating their assigned topic, they could visit the five listed websites relevant to that topic
and any other Internet sites relevant to their topic as well. The participants were told that after
their investigation was completed, they would report their reactions to the experience on a paper
questionnaire.
Participants were given 45 minutes to research their topic and were left completely alone
during that time. After the 45 minutes, the researcher returned and overtly erased the history file
from the computer’s memory cache. He told the participants that he cleaned the computer so
future participants would not visit the same sites that the present participant had visited.
After the history file was erased, the complete anonymity manipulation was delivered.
Approximately half (37) of the participants were randomly assigned to write their name, student
I.D. number, and email address on the first page of the paper questionnaire. The remaining 36
participants were instead told not to write any identifying marks on the questionnaire, “since it is
very important that your responses be completely anonymous.” Each participant was told to put
his or her completed questionnaire in an envelope, seal it, and put the sealed envelope in a box
filled with other envelopes.1
Measures.
Socially desirable answers. We computed the number of times a participant gave
socially desirable responses to seven questions that, prima facie, had socially desirable
implications (e.g., “I have sometimes explored pornographic sites on the Internet.”).
Accuracy. A spyware program installed on the computer covertly took a screen shot
1 In the three experiments described here, identifiable participants were told that the researchers needed their
identifying information in case they want to ask follow-up questions later. All identifying information was destroyed
during debriefing.
8
every few seconds, thereby keeping a record of all websites visited by each participant, and the
questionnaire asked participants to report which sites they had visited. We constructed two
measures of accuracy in reports of the websites visited relevant to the mountain pygmy-possum.
First, we subtracted the number of sites reportedly visited from the number of sites actually
visited. We also computed the absolute value of this discrepancy.
Non-differentiation. Four batteries of questions each asked participants to answer
questions on a single rating scale on topics disparate enough that differentiation would be
expected. For example, one battery asked participants to report how much they would have
enjoyed researching various topics, and another battery asked for ratings of the extent to which
participants felt a variety of emotions. Batteries contained 8, 13, 12, and 6 items, respectively
(see the Appendix). Non-differentiation for each battery was assessed by computing the average
of the absolute difference between all possible pairs of responses in the battery. Each non-
differentiation measure was then scaled to range from 0 to 1, such that higher values indicated
more non-differentiation. We averaged the scores for the first two batteries administered to the
respondents, to yield an index of non-differentiation when respondent fatigue was minimal. And
we averaged the scores for the last two batteries administered to the respondents, to yield an
index of non-differentiation when respondent fatigue was maximized. Non-differentiation was
also measured by calculating each within-subject standard deviation2 for each battery and then
computing the average standard deviations for the first two batteries and the last two batteries.3
Results and Discussion
Socially desirable responses. The proportion of identifiable participants who gave a
2 This was calculated by transposing the matrix of items and taking the standard deviation of each column (which
corresponds to each subject). 3 Because the order of questions was not rotated across respondents, we cannot separate the impact of later
presentation of a battery from the content of that battery.
9
socially desirable answer to all seven of the questions on the social desirability battery was
marginally significantly greater than the proportion of completely anonymous participants who
did so (14 percent vs. 3 percent, respectively, χ2
(1, N= 73)=2.79, p<.10, Cohen’s D=.39).
Similarly, identifiable participants gave socially desirable responses to an average of 3.76 of the
7 questions, whereas completely anonymous participants gave socially desirable responses to
3.25 questions, a difference that was not significant (Mann-Whitney U=574.5, ns, Cohen’s
D=.24). Thus, the data hint that identifiable participants may have given more socially desirable
responses than did completely anonymous participants.4
Accuracy. Identifiable participants reported the number of relevant websites visited more
accurately than did the completely anonymous participants. The absolute difference between the
number of relevant sites reportedly visited and relevant sites actually visited was smaller for
identifiable participants than for completely anonymous participants (M=0.70 vs. M=1.67,
respectively, negative binomial b=-.86, p<.05, Cohen’s D=.47). Identifiable and completely
anonymous participants did not differ significantly from each other in terms of signed error (M=-
0.16 vs. M=0.22, respectively, F(1, 70)=0.70, ns, Cohen’s D=.19).5 Because absolute differences
were significant, but signed differences were not, inaccuracy seems not to be driven by an
increase in socially desirable responses among the identifiable participants.
In addition, actual behavior was a better predictor of reported behavior among
identifiable participants than among anonymous participants. When reported behavior was
regressed on actual behavior, the unstandardized regression coefficient representing the simple
4 The mean response to the items tinged with social desirability implications was 2.86 among identifiable
respondents and 3.14 among completely anonymous respondents, a difference that was not statistically significant
(t(71)=.87,ns). 5 This analysis did not control for actual number of relevant sites visited—doing so would be equivalent to
conducting an ANCOVA where the dependent variable is the number of relevant sites reported, and the actual
number of sites visited is the covariate.
10
effect was stronger among identifiable participants (b=.18, p<.001, Cohen’s D=.94) than among
anonymous participants (b=.11, p<.001, Cohen’s D=.53) In a regression in which reported
behavior was regressed on actual behavior (mean deviated), a contrast coded variable indicating
whether the participant was completely anonymous or identified (coded -1 and +1, respectively),
and the interaction between the two, the simple effect of actual behavior was positive and
significant, indicating that reported behavior was significantly related to actual behavior when
combing across the conditions (b=.62, p<.001, Cohen’s D=2.58). The interaction was positive
but not significant (b=.04, p=.12, Cohen’s D=.18), thus hinting at the possibility that the
association between actual and reported behavior was stronger in identifiable conditions.
Non-differentiation. As expected, identifiable and completely anonymous participants
did not differ from one another in terms of the extent of non-differentiation in responses to the
first two batteries in the questionnaire (M=.62 vs. M=.63, respectively, t(71)= .75, ns, Cohen’s
D=-.17). However, consistent with a pattern of greater fatigue-induced satisficing, completely
anonymous participants were significantly more likely to engage in non-differentiation when
answering the last two batteries in the questionnaire than were identifiable participants (M=0.69
vs. M=0.65, respectively, t(71)=1.97, p=.05, Cohen’s D=.46).6
Similarly, the average within-subject standard deviation in responses to the first two
batteries did not differ between identifiable and completely anonymous participants (M=2.13 vs.
2.20, respectively, t(71)=.99, ns, Cohen’s D=-.11). In the last two batteries, however,
identifiable participants manifested a marginally significantly larger within-subject standard
deviation than did completely anonymous participants (M=1.85 vs. M=1.68, respectively,
6 The interaction of anonymity by question placement was not significant (b=.15, ns), but this test may not be
informative, because the metrics used to assess non-differentiation in the different batteries were not identical.
11
t(71)=1.65, p=.10, Cohen’s D=.37).7
Summary
Although complete anonymity increased reports of socially undesirable attributes, it also
increased non-differentiation, an indicator of satisficing. Most importantly, anonymity did not
increase the accuracy of factual reports. In fact, anonymity decreased accuracy.
Study 2
Our second study was designed to test the social desirability and accuracy hypotheses in a
different context. Specifically, participants were given the opportunity to eat candy while
performing a task and were later asked how much candy they had eaten. Assuming that eating a
lot of candy appears to be gluttonous, participants who provided their reports completely
anonymously were expected to admit to eating more candy than people who reported their candy
consumption identifiably.
Method
Participants. Participants were 89 students from the University of Colorado who
participated in exchange for partial course credit in Introductory Psychology courses.
Procedure. Groups of 2 to 5 participants were led to a small room and seated at separate
desks where they completed a paper questionnaire. They were each given a bowl of M&Ms and
were told they could eat as many as they liked while they worked. Groups were randomly
assigned to be either identifiable (by writing their names and social security numbers on the top
of the questionnaires) or completely anonymous.
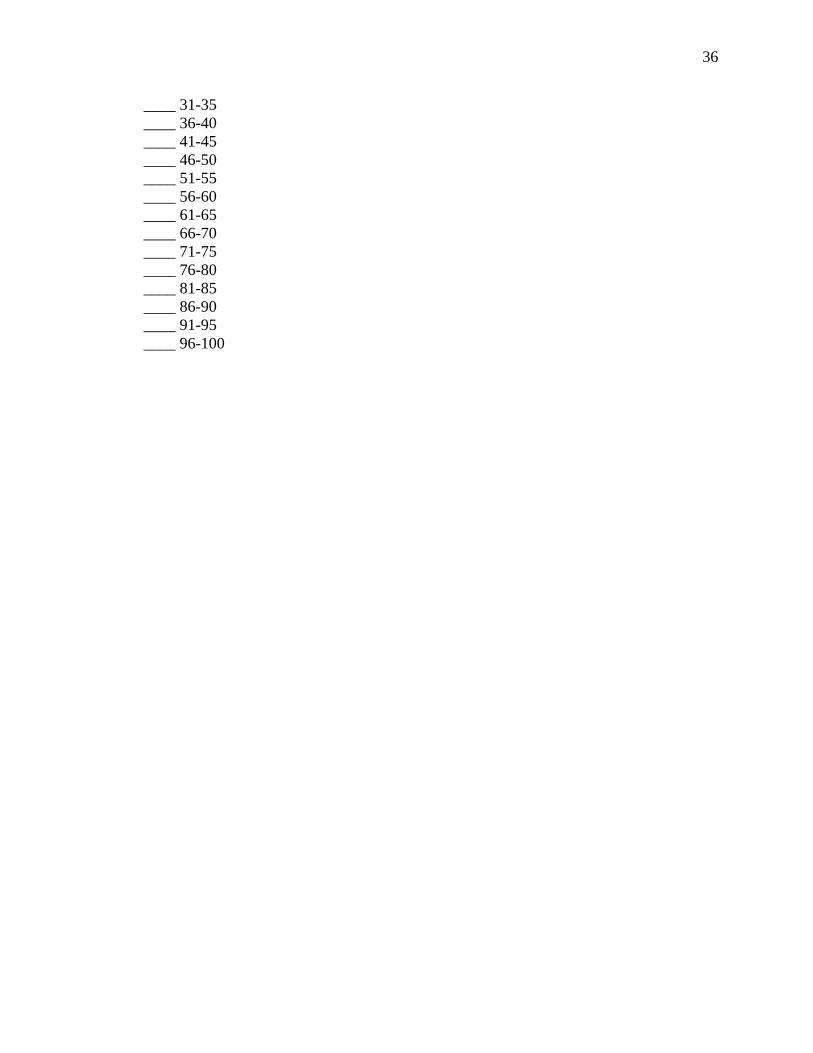
Measures. The last page of the questionnaire asked participants to report the number of
M&Ms they had eaten by selecting one of a series of offered numeric ranges: “none,” “one or
7 The interaction of anonymity by question placement was not significant (b=.13, ns), but this test may not be
informative, because the metrics used to assess non-differentiation in the different batteries were not identical.
12
two,” “three to five” … “96-100”. Responses were converted to numbers by assigning each
respondent to the point in the range they selected that was closest to their actual consumption.8
We also counted the number of M&Ms actually eaten by each participant to assess
accuracy.
Results and Discussion
Actual Behavior. Identifiable participants ate marginally significantly fewer M&Ms
(M=19.00) than did completely anonymous participants (M=31.33; negative binomial b=.50,
p=.06, Cohen’s D=.40). 9
Reported Behavior. Consistent with past findings that complete anonymity yields
responses that appear to be more socially undesirable, identifiable participants reported eating
marginally significantly fewer M&Ms (M=14.59) than did completely anonymous participants
(M=23.35; negative binomial b=.47, p=.06, Cohen’s D=.40). However, when controlling for
actual consumption, the difference was no longer significant (Madj=20.84 vs. Madj=26.45,
negative binomial b=.24, ns, Cohen’s D=.30).
Accuracy. The identifiable participants reported their M&M consumption more
accurately than did the completely anonymous participants. Average absolute error among
identifiable participants was 5.28 M&Ms, whereas average absolute error among completely
anonymous participants was 10.44 M&Ms (negative binomial b=.68, p<.05, Cohen’s D=.47). As
in Study 1, identifiable and completely anonymous participants did not differ significantly from
each other in terms of signed error (M=4.41 vs. M=7.98, respectively, F(1, 87)=2.02, ns, Cohen’s
8 This approach minimizes the error we attributed to respondents by giving them the benefit of the doubt within the
range they selected. Similar results were obtained when we assigned each respondent to the midpoint of the range
he or she selected instead. 9 Negative binomial regression models were run in Studies 2 and 3 due to the overdispersed nature of the count data.
13
D=.30).10
To test the robustness of this finding, we took into account another factor that seemed
likely to influence accuracy of reporting. A person who ate one or two M&Ms would
presumably have an easy time remembering the number correctly. And because participants
knew from the questionnaire that the total number of M&Ms in the bowl was 100 (the highest
response option to the M&Ms question was “96-100 M&Ms”), people who nearly emptied the
bowl would have had an easy time remembering accurately. Therefore, people who ate about 50
would have had the hardest time remembering accurately.
We therefore controlled for the proximity to 50 of the number of M&Ms each participant
ate when predicting accuracy. Participants who ate half the candy were given the highest score
(50). As consumption neared the end points, the scores decreased linearly. That is, for
participants who ate 50 or fewer, the score was their actual consumption. For participants who
ate more than 50, the score was 100 minus their actual consumption. Even when controlling for
this variable, identifiable participants were marginally significantly more accurate than
anonymous participants (average error: 6.14 versus 10.29, respectively; negative binomial b=.52,
p=.08, Cohen’s D=.38).
In addition, actual behavior was a better predictor of reported behavior among
identifiable participants than among anonymous participants. When actual behavior was
regressed on reported behavior, the unstandardized regression coefficient representing the simple
effect was stronger among identifiable participants (b=.05, p<.001, Cohen’s D=2.73) than among
anonymous participants (b=.03, p<.001, Cohen’s D=2.16). In a regression in which reported
behavior was regressed on actual behavior (mean deviated), a contrast coded variable indicating
10
A one-way ANOVA was used here, rather than a negative binomial model, because negative values of the
dependent variable cannot be analyzed in count models.
14
whether the participant was completely anonymous or identified (coded -1 and +1, respectively),
and the interaction between the two, the simple effect of actual behavior was positive and
significant, indicating that reported behavior was significantly related to actual behavior when
combing across the conditions (b=.04, p<.001, Cohen’s D=2.57). Furthermore, the interaction
was positive and significant (b=.01, p<.001, Cohen’s D=.73), indicating that predictive power
was significantly stronger among participants who were identifiable than among those who were
completely anonymous.
Thus, complete anonymity resulted in both increased performance of socially undesirable
behavior, even further increased reporting of performance of socially undesirable behavior, and
decreased reporting accuracy.
Study 3
As in Study 2, participants in this study were asked to report how much candy they ate
while completing a questionnaire, so we could later assess the accuracy of these reports. Unlike
Study 2, the candy consumption occurred before identifiability was manipulated, so the
manipulation could not have altered the consumption behavior. Additionally, the consumption
question elicited open-ended answers, rather than using the closed-ended approach employed in
Study 2.
We also included a measure of impression management inclination in this study’s
questionnaire, implemented before the complete anonymity manipulation. Because higher levels
of impression management inclination are thought to be associated with greater motivation to
give the most socially desirable self-descriptions (Paulhus, 1984), we expected participants
higher in impression management orientation to provide more desirable and less accurate reports
of their behavior.
15
Method
Participants. Participants were 86 volunteers, ages 16 to 18, who were enrolled in a
summer program at Stanford University.
Procedure. Participants were asked to sit at a table in a private room. Already on the
table was a questionnaire titled “Media Use Survey,” a bowl of 75 M&Ms, and a bowl of 75
Jelly Beans. The experimenter asked the participant to complete the questionnaire and notify her
when he or she was done. She then told the participant that he or she was welcome to eat some
candy while working on the questionnaire. The participant was then left to work on the
questionnaire in complete privacy.
After finishing that questionnaire, the participant was asked to complete a second
questionnaire. Before the experimenter left the room, she took the bowls of candy and told the
participant that she was going to ready them for the next participant. The second questionnaire
contained the complete anonymity instructions for a random half of the participants, wherein
identifiable participants were asked to write their name, phone number, and email address on the
first page of the second questionnaire, while anonymous participants were asked not to write any
identifying information on the questionnaire.
The experimenters were blind to experimental condition, meaning that they did not know
whether each participant completed the second questionnaire completely anonymously or
identifiably.
Measures. The second questionnaire asked participants to report how many M&Ms they
had eaten and how many Jelly Beans they had eaten. Responses to these open-ended questions
were added together to yield a single consumption report.
At the beginning of the first questionnaire, participants completed the 20-item Impression
16
Management subscale of the Paulhaus Deception Scales (Paulhus 1984). Appropriate items were
reverse scored, and each participant’s total score was the average of responses to the items in this
battery. This score was rescaled to range from 0 (meaning least inclined to engage in impression
management) and 1 (meaning most inclined to engage in impression management).
Results
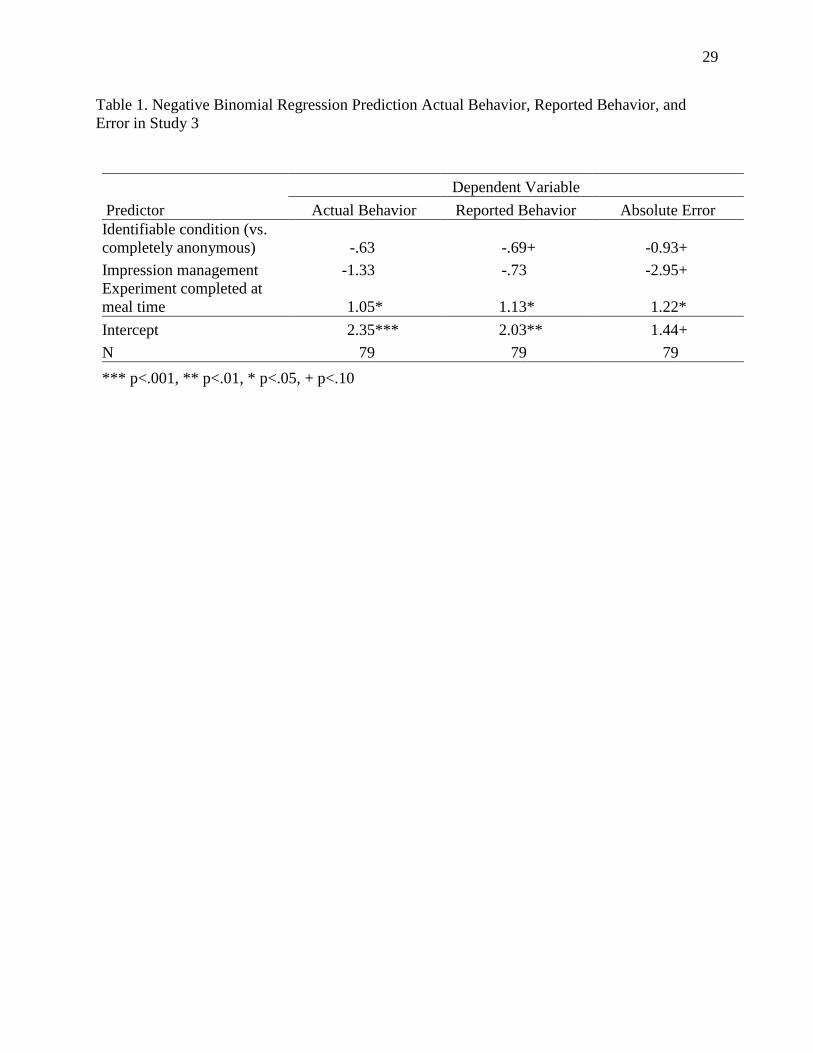
Actual Behavior. Identifiable and anonymous participants did not differ significantly in
how much candy they ate (see Table 1, column 1, row 1).11
Likewise, impression management
scores were not associated with actual consumption (see Table 1, column 1, row 2, Cohen’s
D=.23). As expected, the time of day when the participant completed the experiment had a
significant effect: people who participated during lunch time and dinner time (11:30 am-1:30 pm
and 5:00 pm-6:30 pm) ate significantly more candy (about 7 pieces on average) than people who
participated at other times (negative binomial b=1.05, p<.05, Cohen’s D=.53).
Reported Behavior. Consistent with past studies, identifiable participants reported
eating marginally significantly less candy than did completely anonymous participants (Madjusted
= 4.31 vs. Madjusted = 8.62; negative binomial b= -.69, p<.10, Cohen’s D=.38). Surprisingly,
however, impression management scores were not associated with reported consumption (see
Table 1, Column 2, Row 2, Cohen’s D=.12).
Accuracy. Consistent with Studies 1 and 2, average absolute error was marginally
significantly smaller among identifiable participants than among completely anonymous
participants (Error: Madjusted=.71 vs. Madjusted=1.80, negative binomial b=-.93, p=.06; see Table 1,
Column 3, Row 1, Cohen’s D=.43). Furthermore, people with higher impression management
11
Seven participants (six in the identifiable condition, 1 in the anonymous condition) were removed from all
analyses because an analysis of studentized residuals and Cook’s Statistics indicated that these cases were
inordinately influential of the results of the accuracy analysis - studentized residuals were greater than 3, and Cook’s
Statistics were greater than 1.
17
scores manifested less error in their reports of candy consumption (negative binomial b=-2.95,
p<.05; see Table 1, Column 3, Row 2, Cohen’s D=.44).12
Participants who completed the
procedure during meal times provided less accurate reports than did participants who completed
the procedure at other times (negative binomial b=1.22, p<.05). As in Studies 1 and 2,
anonymity was not associated with signed error (Madjusted=.85 vs. Madjusted=1.92, F(1, 82)=.36, ns,
Cohen’s D=.05).
Actual behavior was a better predictor of reported behavior among identifiable
participants than among anonymous participants. When reported behavior was regressed on
actual behavior, the unstandardized regression coefficient representing the simple effect was
stronger among identifiable participants (b=.18, p<.001, Cohen’s D=1.60) than among
anonymous participants (b=.12, p<.001, Cohen’s D=1.36). In a regression in which reported
behavior was regressed on reported behavior (mean deviated), a contrast coded variable
indicating whether the participant was completely anonymous or identified (coded -1 and +1,
respectively), and the interaction between the two, the simple effect of actual behavior was
positive and significant, indicating that reported behavior was significantly related to actual
behavior on average across the conditions (b=.16, p<.001, Cohen’s D=2.61). Furthermore, the
interaction was positive and significant (b=.04, p<.01, Cohen’s D=.33), indicating that predictive
power was significantly stronger among participants who were identifiable than among those
who were completely anonymous.
Summary
As in Studies 1 and 2, identifiability led to increased accuracy of behavioral reports. In
addition, higher levels of impression management orientation were associated with less accuracy,
12
The interaction between condition (identifiable versus completely anonymous) and impression management score
was not statistically significant (negative binomial b=1.98, ns).
18
though not more socially desirable self-descriptions.
General Discussion
Many researchers have believed that when “the anonymity of an interview situation is
increased, people tend to give more honest answers or disclose more embarrassing information
about themselves than in a less anonymous setting” (Muhlenfeld, 2005, p. 994). The present
studies challenged this claim. In only one of our three studies did complete anonymity lead
participants to describe themselves in more embarrassing ways according to one analysis, though
not according to another analysis of the same data. And in none of the three studies did complete
anonymity lead participants to give more honest answers. In fact, complete anonymity always
yielded less accurate self-reports.
Additional evidence suggests a possible cognitive mechanism of the reduced accuracy.
Complete anonymity promoted non-differentiation late in a long questionnaire. And the
observed interaction between factors thought to encourage satisficing (question placement and
complete anonymity) in yielding non-differentiation is consistent with the original formulation of
satisficing theory (see Krosnick, 1991) and with empirical evidence testing for such interactions
(e.g., Holbrook, Krosnick, Moore, & Tourangeau, 2007). Thus, perhaps because of a reduced
sense of accountability, completely anonymous participants executed the cognitive response
process more superficially and generated less accurate self-reports as a result.
Taken together, this evidence suggests that researchers seeking to maximize honesty and
accuracy in questionnaire responses and to understand the effects of complete anonymity should
perhaps reconsider the default approach that has been taken in so much past research. We have
seen that complete anonymity can sometimes change the distributions of answers in directions
that appear to signal greater validity and less withholding of embarrassing facts. But when
19
subjected to careful scrutiny, this interpretation of a traditional empirical finding turns out to be
incorrect. In future studies, it might be wisest for investigators to build in comparisons with
validity criteria instead of simply assuming that more reporting of embarrassing attributes signals
greater accuracy and honesty.
It is important not to over-generalize the evidence reported here. Our findings apply to
student participants and paper questionnaires and one particular type of anonymity. Future
research is needed to see whether the same principles apply to other modes of data collection
from other populations. In particular, we should hesitate before assuming that the current
findings apply to situations in which human interviewers administer questionnaires orally. In
those situations, complete anonymity is impossible, even when using techniques such as ACASI
(audio computer-assisted self-interviewing; see, e.g., Harmon et al., 2009). In such situations, an
interviewer can promise a participant that his or her responses will be kept confidential. Such a
promise of confidentiality may have different effects than the complete anonymity assured by the
paper questionnaires in our studies. In particular, a human interviewer asking questions orally
may create the sense of accountability needed to motivate participants to provide accurate
answers in a way that a paper questionnaire cannot. The use of ACASI in such situations may
further contribute to a sense of confidentiality while not creating the sense of complete
anonymity that appears to have been deleterious in the present studies.
In light of our findings, it is interesting to revisit evidence reported by Ong and Weiss
(2000). Their college student participants were given the opportunity to cheat while taking a test
in a private room (a helpful book was on a shelf, and participants were told not to consult it).
Weeks later, participants filled out a questionnaire asking whether they had “ever, even once,
used unapproved material on an exam, quiz, or any other form of test.” Half of the participants
20
wrote their names on the questionnaires, whereas the other half did not. Among the people who
did not consult the book during the text, none reported that they cheated on the questionnaire.
But among the people who had consulted the book, 25% of the people who were identifiable
reported having cheated, whereas 74% of the people who answered anonymously said that they
cheated. Thus, anonymity appears to have improved reporting accuracy.
Of course, this evidence is a bit ambiguous, because the questionnaire did not ask
specifically about whether the participant had cheated when taking the test in the earlier phase of
the experiment. It is possible that the increased reports of cheating occurred because the people
who cheated on the experiment’s test were in the habit of cheating regularly (for supportive
evidence, see Hessing, Elffers, & Wiegel, 1988), had forgotten the particular incident of cheating
in the experiment, and were reporting their cheating behavior in other contexts.
Furthermore, it may be important to note that Ong and Weiss’s (2000) question
measuring cheating offered two answer choices: yes and no. This is one of the response formats
that past research suggests is susceptible to acquiescence response bias, which appears to be the
result of weak satisficing (see, e.g., Krosnick, 1999). Specifically, satisficing is thought to
increase the likelihood of an affirmative response to a yes/no question when the participant can
easily generate a reason to answer affirmatively. If complete anonymity decreases accountability,
decreases motivation to optimize, and thereby increases the likelihood of weak satisficing, then
the increase in affirmative answers to the cheating question could have been the result of weak
satisficing rather than of greater honesty. It would therefore be interesting to repeat the Ong and
Weiss (2000) study employing a question format that is not susceptible to acquiescence, to see if
the same increase in accuracy due to anonymity is observed.
Many open questions remain in this arena, and other possibilities for future studies are
21
numerous. For one, research should look at other tests of accuracy and measures of survey
satisficing. For example, given the present results, we would expect identifiable participants to
select fewer offered “don’t know” responses and to be less susceptible than completely
anonymous participants to acquiescence, primacy, and recency effects. Furthermore, the effects
of complete anonymity on reporting accuracy should be tested in various modes of survey
administration, including face-to-face interviewing, telephone interviewing, and computer self-
administration.
The present studies suggest that researchers should not automatically assume that
promising participants complete anonymity will increase the quality of the collected responses.
Particularly among college students who often complete questionnaires to fulfill course
requirements, such a guarantee may serve to sanction half-hearted survey completion rather than
freeing students up to respond with greater honesty.
22
Acknowledgements
The authors thank members of the Political Psychology Research Group for helpful comments
and suggestions. The authors also thank Sarah De La Garza. Dora Duru, Elizabeth Quinlan, and
Tracy Quynh Nhu Vu for their work in collecting the data for Study 3.
23
References
Backor, K., Golde, S., & Nie, N. (2007). Estimating Survey Fatigue in Time Use Study.
Paper presented at the 2007 International Association for Time Use Research
Conference, Washington, D.C.
Booth-Kewley, S., Edwards, J. E., & Rosenfeld, P. (1992). Impression management, social
desirability, and computer administration of attitude questionnaires: Does the computer
make a difference? Journal of Applied Psychology, 77, 562-566.
Bradburn, N. M., Sudman, S., Blair, E., & Stocking, C. (1978). Question threat and response bias.
Public Opinion Quarterly, 42, 221-234.
Hurvich, C. M., & Tsai, C. L. (1995). Model selection for extended quasi-likelihood models in
small samples. Biometrics, 51, 1077–1084.
Caraballo, R. S., Giovino, G. A., Pechacek, T. F., & Mowery, P. D. (2001). Factors associated
with discrepancies between self-reports on cigarette smoking and measured serum
cotinene levels among persons aged 17 or older. American Journal of Epidemiology, 153,
807-814.
Clausen, A. R. (1968). Response validity: Vote report. Public Opinion Quarterly, 32, 588-606.
Colton, D., & Covert, R. W. (2007). Designing and constructing instruments for social research
and evaluation. San Francisco: Jossey-Bass.
Crowne, D. P., & Marlowe, D. (1960). A new scale of social desirability independent of
psychopathology. Journal of Consulting Psychology, 24, 359-354.
Droitcour, J., Caspar, R. A., Hubbard, M. L., Parsley, T. L., Visscher, W., & Ezzati, T. M. (1991).
The item count technique as a method of indirect questioning: A review of its
development and a case study application. In P. P. Biemer, R. M. Groves, L. E. Lyberg,
24
N. A. Mathiowetz, & S. Sudman (Eds.), Measurement Errors in Surveys (pp. 185-210).
New York, NY: John Wiley & Sons.
Evans, A.N., & Rooney, B. (2008). Methods in psychological research. Thousand Oaks: Sage
Publications.
Fazio, R. H., & Williams, C. J. (1986). Attitude accessibility as a moderator of the attitude–
perception and attitude–behavior relations: An investigation of the 1984 presidential
election. Journal of Personality and Social Psychology, 51(3), 505.
Fox, J. A., & Tracy, P. E. (1986). Randomized response: A method for sensitive surveys. Beverly
Hills: Sage Publications.
Gaydos, C. A., Howell, M. R., Pare, B., Clark, K. L., Ellis, D. A., Hendrix, R. M., ... Quinn, T.C.
(1998). Chlamydia trachomatis infections in female military recruits. The New England
Journal of Medicine, 339, 739-744.
Gordon, R. A. (1987). Social desirability bias: A demonstration and technique for its reduction.
Teaching of Psychology, 14(1), 40–42.
Gordon, R. A., & Stuecher, U. (1992). The effect of anonymity and increased accountability on
the linguistic complexity of teaching evaluations. Journal of Psychology, 126, 639-649.
Harmon, T., Turner, C. F., Rogers, S. M., Eggleston, E., Roman, A. M., Villarroel, M. A.,
Chromy, J.R., Ganapathi, L., & Li, S. (2009). Impact of T-ACASI on survey
measurements of subjective phenomena. Public Opinion Quarterly, 73, 255-280.
Herzog, A. R., & Bachman, J. G. (1981). Effects of questionnaire length on response quality.
Public Opinion Quarterly, 45, 549-559.
Hessing, D. J., Elffers, H., & Weigel, R. H. (1988). Exploring the limits of self-reports and
reasoned action: An investigation of the psychology of tax evasion behavior. Journal of
25
Personality and Social Psychology, 54, 405–413.
Himmelfarb, S., & Lickteig, C. (1982). Social desirability and the randomized response
technique. Journal of Personality and Social Psychology, 43, 710-717.
Holbrook, A. L., Green, M. C., & Krosnick, J. A. (2003). Telephone vs. face-to-face
interviewing of national probability samples with long questionnaires: Comparisons of
respondent satisficing and social desirability response bias. Public Opinion Quarterly, 67,
79-125.
Holbrook, A. L., & Krosnick, J. A. (2010). Social desirability bias in voter turnout reports:
Tests using the item count technique. Public Opinion Quarterly, 74, 37-67.
Holbrook, A. L., Krosnick, J. A., Moore, D., & Tourangeau, R. (2007). Response order effects in
dichotomous categorical questions presented orally. Public Opinion Quarterly, 71, 325-
348.
Johnson, W. R., Sieveking, N. A., & Clanton, E. S. (1974). Effects of alternative positioning of
open-ended questions in multiple-choice questionnaires. Journal of Applied Psychology,
6, 776-778.
Jones, E., & Sigall, H. (1971). "The Bogus Pipeline: A new paradigm for measuring affect and
attitude". Psychological Bulletin, 76, 349–364.
Jordan, C. H., Whitfield, M., & Zeigler-Hill, V. (2007). Intuition and the correspondence
between implicit and explicit self-esteem. Journal of Personality and Social Psychology,
93, 1067–1079.
Kraut, A. I., Wolfson, A. D., & Rothenberg, A. (1975). Some effects of position on opinion
survey items. Journal of Applied Psychology, 60, 774-776.
Krosnick, J. A. (1991). Response strategies for coping with the cognitive demands of attitude
26
measures in surveys. Applied Cognitive Psychology, 5, 213-236.
Krosnick, J. A. (1999). Survey research. Annual Review of Psychology, 50, 537-567.
Lautenschlager, G. J., & Flaherty, F. L. (1990). Computer administration of questions: More
desirable or more social desirability? Journal of Applied Psychology, 75, 310-314.
Lensvelt-Mulders, G. J., Hox, J. J., Van Der Heijden, P. G., & Maas, C. J. (2005). Meta-analysis
of randomized response research: Thirty-five years of validation. Sociological Methods &
Research, 33, 319-348.
Lerner, J. S., & Tetlock, P. E. (1999). Accounting for the effects of accountability. Psychological
Bulletin, 125, 255-275.
Meier, D. E., Emmons, C. A., Wallenstein, S., Quill, T., Morrison, R. S., & Cassel, C. K. (1998).
A national survey of physician-assisted suicide and euthanasia in the United States. The
New England Journal of Medicine, 338, 1193-1201.
Mitchell, M., & Jolley, J. (2010). Research design explained. Belmont: Wadsworth Cengage
Learning.
Muhlenfeld, H. U. (2005). Differences between “talking about” and “admitting” sensitive
behaviour in anonymous and non-anonymous web-based interviews. Computers in
Human Behavior, 21, 993-1003.
Olson, M. A., Fazio, R. H., & Hermann, A. D. (2007). Reporting Tendencies Underlie
Discrepancies Between Implicit and Explicit Measures of Self-Esteem. Psychological
Science, 18, 287–291.
Ong, A. D., & Weiss, D. J. (2000). The impact of anonymity on responses to sensitive questions.
Journal of Applied Social Psychology, 30, 1691-1708.
Patrick, D. L., Cheadle, A., Thompson, D. C., Diehr, P., Koepsell, T., & Kinne, S. (1994). The
27
validity of self-reported smoking: A review and meta-analysis. American Journal of
Public Health, 84, 1086-1093.
Paulhus, D. L. (1984). Two-component models of socially desirable responding. Journal of
Personality and Social Psychology, 46, 598-609.
Perkins, H. W., & Berkowitz, A. D. (1986). Perceiving the community norms of alcohol use
among students: Some research implications for campus alcohol education programming.
Substance Use & Misuse, 21, 961–976.
Price, K. H. (1987). Decision responsibility, task responsibility, identifiability, and social loafing.
Organizational Behavior and Human Decision Processes, 40, 330–345.
Reicher, S. D., & Levine, M. (1994a). On the consequences of deindividuation manipulations for
the strategic communication of self: Identifiability and the presentation of social identity.
European Journal of Social Psychology, 24, 511-524.
Reicher, S. D., & Levine, M. (1994b). Deindividuation, power relations between groups and the
expression of social identity: The effects of visibility to the out-group. British Journal of
Social Psychology, 33, 145-163.
Schopler, J., Insko, C. A., Drigotas, S. M., Wieselquist, J., Pemberton, M. B., & Cox, C. (1995).
The role of identifiability in the reduction of interindividual-intergroup discontinuity.
Journal of Experimental Social Psychology, 31, 553–574.
Traugott, M. W. & Katosh, J. P. (1979). Response validity in surveys of voting behavior. Public
Opinion Quarterly, 43, 359-377.
Turnley, W. H., & Feldman D. C. (2000). Re-examining the effects of psychological contract
violations: Unmet expectations and job dissatisfaction as mediators. Journal of
Organizational Behavior, 21, 25-42.
28
Warner, R. M. (2008). Applied statistics: From bivariate through multivariate techniques. Sage
Publications, Inc.
Warner, S. L. (1965). Randomized response: A survey technique for eliminating evasive answer
bias. Journal of American Statistical Association, 60, 63-69.
Williams, K., Harkins, S., & Latane, B. (1981). Identifiability as a deterrent to social loafing: two
cheering experiments. Journal of Personality and Social Psychology, 40, 303-311.
Wilson, T. D., Dunn, D. S., Bybee, J. A., Hyman, D. B., & Rotondo, J. A. (1984). Effects of
analyzing reasons on attitude–behavior consistency. Journal of Personality and Social
Psychology, 47(1), 5.
Yeager, D. S., & Krosnick, J. A. (2010). The validity of self-reported nicotine product use in
the 2001-2008 National Health and Nutrition Examination Survey. Medical Care, 48,
1128-1132.
Zimbardo, P. G. (1969). The human choice: Individuation, reason, and order versus
deindividuation, impulse, and chaos. In W. J. Arnold and D. Levine (eds.) Nebraska
Symposium on Motivation (pp. 237-307). Lincoln: University of Nebraska Press.
29
Table 1. Negative Binomial Regression Prediction Actual Behavior, Reported Behavior, and
Error in Study 3
Dependent Variable
Predictor Actual Behavior Reported Behavior Absolute Error
Identifiable condition (vs.
completely anonymous) -.63 -.69 + -0.93 +
Impression management -1.33 -.73 -2.95 +
Experiment completed at
meal time 1.05 * 1.13 * 1.22 *
Intercept 2.35 *** 2.03 ** 1.44 +
N 79 79 79
*** p<.001, ** p<.01, * p<.05, + p<.10
30
Appendix
Study 1
Measures of Socially Desirable Responses
1. “I have sometimes explored pornographic sites on the Internet.” To what extent do you
agree with the above statement? (Answers were given on a 7-point rating scale ranging
from disagree (1) to agree (7); Answers of 1, 2, or 3 were treated as socially desirable.)
2. “I have sometimes downloaded music from sites without paying the copyright fees.” To
what extent do you agree with the above statement? (Answers were given on a 7-point
rating scale ranging from disagree (1) to agree (7); Answers of 1, 2, and 3 were treated as
socially desirable.)
3. “Sometimes I visit sites on the Internet that I would be ashamed to admit to others that I
visited.” To what extent do you agree with the above statement? (Answers were given on
a 7-point rating scale ranging from disagree (1) to agree (7); Answers of 1, 2, and 3 were
treated as socially desirable.)
4. “I never visit sites on the Internet that I would be ashamed to admit to others that I
visited.” To what extent do you agree with the above statement? (Answers were given on
a 7-point rating scale ranging from disagree (1) to agree (7); Answers of 5, 6, and 7 were
treated as socially desirable.)
5. “I have never explored pornographic sites on the Internet.” To what extent do you agree
with the above statement? (Answers were given on a 7-point rating scale ranging from
disagree (1) to agree (7); Answers of 5, 6, and 7 were treated as socially desirable.)
6. “For this set of questions we would like you to indicate how often, if ever, you have
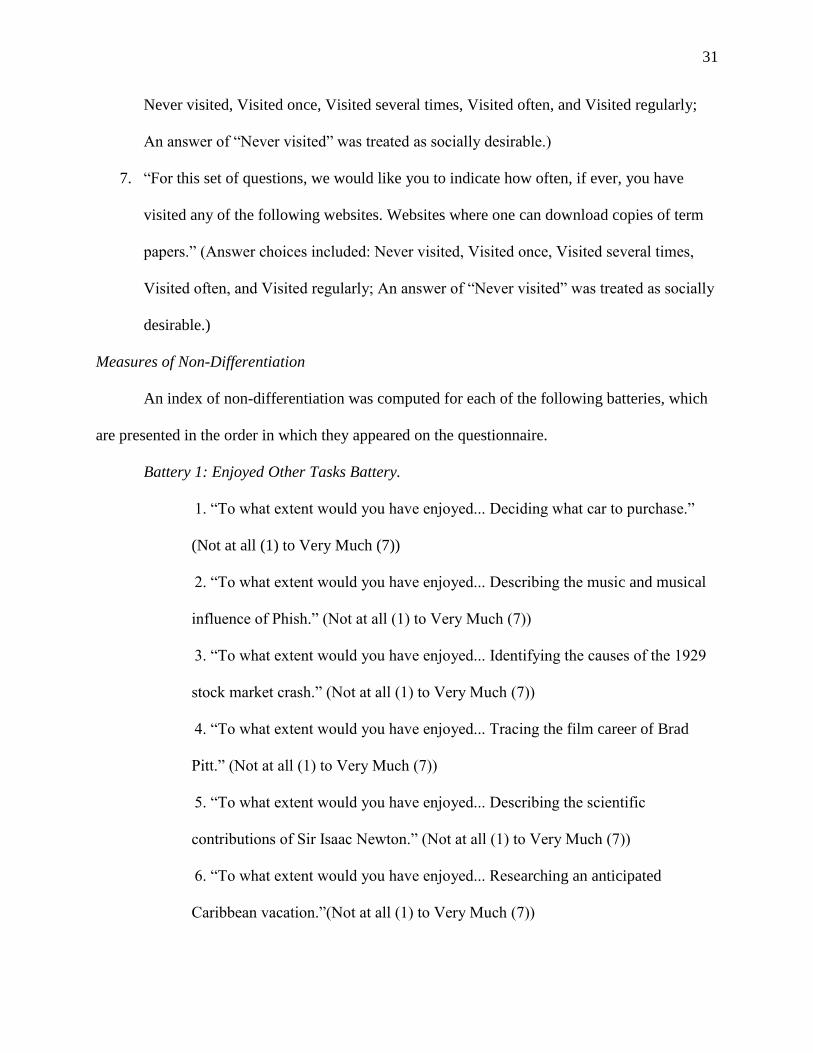
visited any of the following websites. Pornographic websites.” (Answer choices included:
31
Never visited, Visited once, Visited several times, Visited often, and Visited regularly;
An answer of “Never visited” was treated as socially desirable.)
7. “For this set of questions, we would like you to indicate how often, if ever, you have
visited any of the following websites. Websites where one can download copies of term
papers.” (Answer choices included: Never visited, Visited once, Visited several times,
Visited often, and Visited regularly; An answer of “Never visited” was treated as socially
desirable.)
Measures of Non-Differentiation
An index of non-differentiation was computed for each of the following batteries, which
are presented in the order in which they appeared on the questionnaire.
Battery 1: Enjoyed Other Tasks Battery.
1. “To what extent would you have enjoyed... Deciding what car to purchase.”
(Not at all (1) to Very Much (7))
2. “To what extent would you have enjoyed... Describing the music and musical
influence of Phish.” (Not at all (1) to Very Much (7))
3. “To what extent would you have enjoyed... Identifying the causes of the 1929
stock market crash.” (Not at all (1) to Very Much (7))
4. “To what extent would you have enjoyed... Tracing the film career of Brad
Pitt.” (Not at all (1) to Very Much (7))
5. “To what extent would you have enjoyed... Describing the scientific
contributions of Sir Isaac Newton.” (Not at all (1) to Very Much (7))
6. “To what extent would you have enjoyed... Researching an anticipated
Caribbean vacation.”(Not at all (1) to Very Much (7))
32
7. “To what extent would you have enjoyed... Researching the artistic career of
Michelangelo.” (Not at all (1) to Very Much (7))
Battery 2: Attitudes towards the Internet I.
1. “For researching most any topic, the university library is a more valuable
resource than is the Internet. To what extent do you agree with the above
statement?” (Disagree (1) to Agree (7))
2. “Public access to the Internet in libraries, for instance, should be controlled so
that pornographic and other offensive sites cannot be viewed. To what extent do
you agree with the above statement?” (Disagree (1) to Agree (7))
3. “Parents should not monitor and/or restrict their children’s Internet usage. To
what extent do you agree with the above statement?” (Disagree (1) to Agree (7))
4. “The press has exaggerated the danger posed to young Internet surfers by
potential sexual predators. To what extent do you agree with the above
statement?” (Disagree (1) to Agree (7))
5. “The Internet is a valuable research tool. To what extent do you agree with the
above statement?” (Disagree (1) to Agree (7))
6. “I spend less time surfing the Internet than I used to. To what extent do you
agree with the above statement?” (Disagree (1) to Agree (7))
7. “Our society suffers from information overload. To what extent do you agree
with the above statement?” (Disagree (1) to Agree (7))
8. “Computers intimidate me more than they should. To what extent do you agree
with the above statement?” (Disagree (1) to Agree (7))
9. “Our society as a whole is much more efficient because of recent
33
developments in computer technology. To what extent do you agree with the
above statement?” (Disagree (1) to Agree (7))
10. “It is extremely important these days to be computer-savvy. To what extent do
you agree with the above statement?” (Disagree (1) to Agree (7))
11. “The world wide web represents one of the most dramatic changes in history.
To what extent do you agree with the above statement?” (Disagree (1) to Agree
(7))
12. “Because of email, I think I use the telephone to keep in touch with my family
and friends less than I used to. To what extent do you agree with the above
statement?” (Disagree (1) to Agree (7))
13. “Anyone who doesn’t use the Internet is missing a lot. To what extent do you
agree with the above statement?” (Disagree (1) to Agree (7))
Battery 3: Attitudes towards the Internet II.
1. “I sometimes have trouble getting computer programs to do what I want them
to do. To what extent do you agree with the above statement?” (Disagree (1) to
Agree (7))
2. “I would love to be a professional computer programmer. To what extent do
you agree with the above statement?” (Disagree (1) to Agree (7))
3. “For researching most any topic, the Internet is a more valuable resource than is
the university library. To what extent do you agree with the above statement?”
(Disagree (1) to Agree (7))
4. “I have downloaded a lot of music over the Internet. To what extent do you
agree with the above statement?” (Disagree (1) to Agree (7))
34
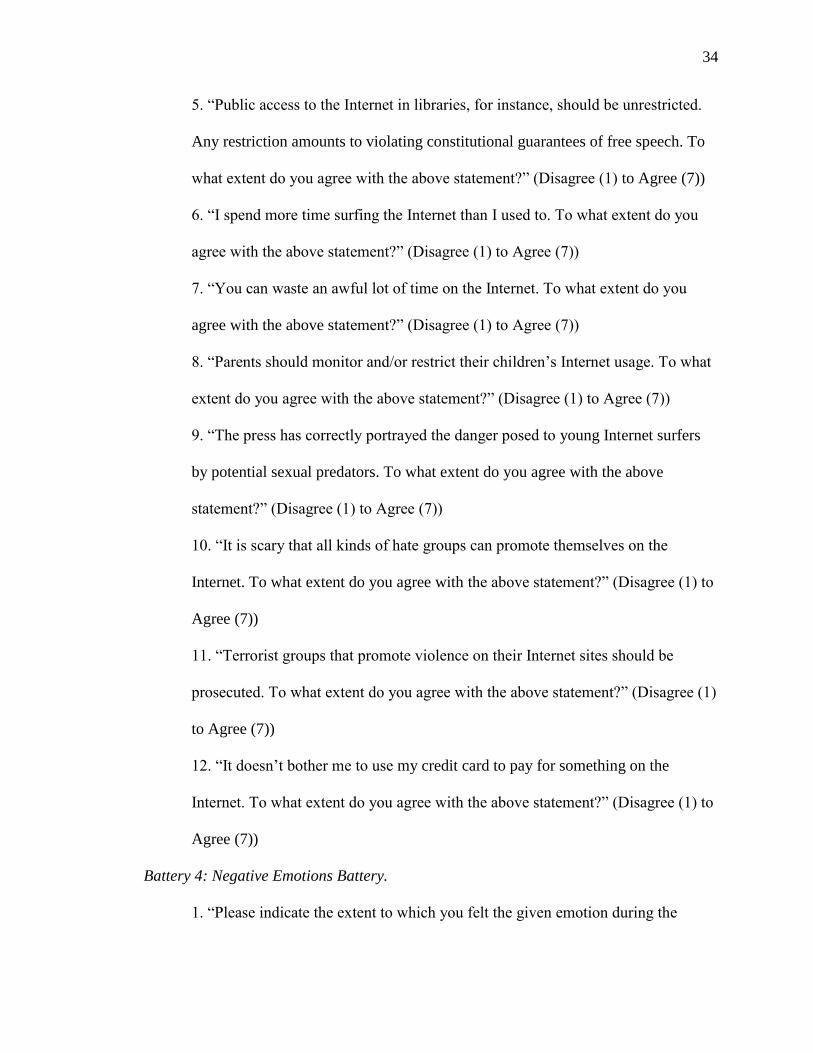
5. “Public access to the Internet in libraries, for instance, should be unrestricted.
Any restriction amounts to violating constitutional guarantees of free speech. To
what extent do you agree with the above statement?” (Disagree (1) to Agree (7))
6. “I spend more time surfing the Internet than I used to. To what extent do you
agree with the above statement?” (Disagree (1) to Agree (7))
7. “You can waste an awful lot of time on the Internet. To what extent do you
agree with the above statement?” (Disagree (1) to Agree (7))
8. “Parents should monitor and/or restrict their children’s Internet usage. To what
extent do you agree with the above statement?” (Disagree (1) to Agree (7))
9. “The press has correctly portrayed the danger posed to young Internet surfers
by potential sexual predators. To what extent do you agree with the above
statement?” (Disagree (1) to Agree (7))
10. “It is scary that all kinds of hate groups can promote themselves on the
Internet. To what extent do you agree with the above statement?” (Disagree (1) to
Agree (7))
11. “Terrorist groups that promote violence on their Internet sites should be
prosecuted. To what extent do you agree with the above statement?” (Disagree (1)
to Agree (7))
12. “It doesn’t bother me to use my credit card to pay for something on the
Internet. To what extent do you agree with the above statement?” (Disagree (1) to
Agree (7))
Battery 4: Negative Emotions Battery.
1. “Please indicate the extent to which you felt the given emotion during the

35
period when you were doing your research. Bored” (Not at all (1) to Very Much
(7)
2. “Please indicate the extent to which you felt the given emotion during the
period when you were doing your research. Sad” (Not at all (1) to Very Much (7))
3. “Please indicate the extent to which you felt the given emotion during the
period when you were doing your research. Anxious” (Not at all (1) to Very
Much (7))
4. “Please indicate the extent to which you felt the given emotion during the
period when you were doing your research. Frustrated” (Not at all (1) to Very
Much (7))
5. “Please indicate the extent to which you felt the given emotion during the
period when you were doing your research. Sleepy” (Not at all (1) to Very Much
(7))
6. “Please indicate the extent to which you felt the given emotion during the
period when you were doing your research. Uncertain” (Not at all (1) to Very
Much (7))
Study 2
Measurement of M&M Consumption
About how many M&Ms did you eat while you completed the survey?
____ None
____ One or Two
____ Three to Five
____ 6-10
____ 11-15
____ 16-20
____ 21-25
____ 26-30
36
____ 31-35
____ 36-40
____ 41-45
____ 46-50
____ 51-55
____ 56-60
____ 61-65
____ 66-70
____ 71-75
____ 76-80
____ 81-85
____ 86-90
____ 91-95
____ 96-100