Complementary Analysis for DGA Based on Duval Methods and ...
22
energies Article Complementary Analysis for DGA Based on Duval Methods and Furan Compounds Using Artificial Neural Networks Ancut , a-Mihaela Aciu 1 , Claudiu-Ionel Nicola 1,2, * , Marcel Nicola 1, * and Maria-Cristina Nit , u 1,3 Citation: Aciu, A.-M.; Nicola, C.-I.; Nicola, M.; Nit , u, M.-C. Complementary Analysis for DGA Based on Duval Methods and Furan Compounds Using Artificial Neural Networks. Energies 2021, 14, 588. https://doi.org/10.3390/en14030588 Academic Editors: Michel Duval and Sérgio Cruz Received: 23 November 2020 Accepted: 20 January 2021 Published: 24 January 2021 Publisher’s Note: MDPI stays neutral with regard to jurisdictional claims in published maps and institutional affil- iations. Copyright: © 2021 by the authors. Licensee MDPI, Basel, Switzerland. This article is an open access article distributed under the terms and conditions of the Creative Commons Attribution (CC BY) license (https:// creativecommons.org/licenses/by/ 4.0/). 1 Research and Development Department, National Institute for Research, Development and Testing in Electrical Engineering-ICMET Craiova, 200746 Craiova, Romania; [email protected] (A.-M.A.); [email protected] (M.-C.N.) 2 Department of Automatic Control and Electronics, University of Craiova, 200585 Craiova, Romania 3 Department Electrical Engineering, Energetic and Aeronautics, University of Craiova, 200585 Craiova, Romania * Correspondence: [email protected] (C.-I.N.); [email protected] (M.N.) Abstract: Power transformers play an important role in electrical systems; being considered the core of electric power transmissions and distribution networks, the owners and users of these assets are increasingly concerned with adopting reliable, automated, and non-invasive techniques to monitor and diagnose their operating conditions. Thus, monitoring the conditions of power transformers has evolved, in the sense that a complete characterization of the conditions of oil–paper insulation can be achieved through dissolved gas analysis (DGA) and furan compounds analysis, since these analyses provide a lot of information about the phenomena that occur in power transformers. The Duval triangles and pentagons methods can be used with a high percentage of correct predictions compared to the known classical methods (key gases, International Electrotechnical Commission (IEC), Rogers, Doernenburg ratios), because, in addition to the six types of basic faults, they also identify four sub-types of thermal faults that provide important additional information for the appropriate corrective actions to be applied to the transformers. A new approach is presented based on the complementarity between the analysis of the gases dissolved in the transformer oil and the analysis of furan compounds, for the identification of the different faults, especially when there are multiple faults, by extending the diagnosis of the operating conditions of the power transformers, in terms of paper degradation. The implemented software system based on artificial neural networks was tested and validated in practice, with good results. Keywords: power transformer; insulation; dissolved gas analysis; furan compounds; radial basis function neural network; feed forward neural network 1. Introduction Power transformers are key pieces of equipment in the electric power transmission and distribution systems, and their reliability influences the safety of electric power supply networks. Although they are reliable pieces of equipment, it is difficult to avoid damaging them. In addition to catastrophic damage to the power supply system, the faults in trans- formers can also cause substantial financial losses for both the owner and the consumers served by it. For this reason, it is important to identify, at an early stage, the possible faults in transformers so that, based on an appropriate diagnostic procedure, an efficient and rational decision is taken in advance on the appropriate corrective actions to be applied to the transformer [1–4]. An important and effective tool for the early-stage fault diagnosis in oil-immersed power transformers is dissolved gas analysis (DGA), which can identify the degradation of the solid insulation and oil [5–10]. The diagnosis of the involvement of solid insulation and its possible carbonization, resulting from a method of dissolved gas analysis, can be Energies 2021, 14, 588. https://doi.org/10.3390/en14030588 https://www.mdpi.com/journal/energies
Transcript of Complementary Analysis for DGA Based on Duval Methods and ...
energies
Article
Complementary Analysis for DGA Based on Duval Methodsand Furan Compounds Using Artificial Neural Networks
Ancut,a-Mihaela Aciu 1 , Claudiu-Ionel Nicola 1,2,* , Marcel Nicola 1,* and Maria-Cristina Nit,u 1,3
Citation: Aciu, A.-M.; Nicola, C.-I.;
Nicola, M.; Nit,u, M.-C.
Complementary Analysis for DGA
Based on Duval Methods and Furan
Compounds Using Artificial Neural
Networks. Energies 2021, 14, 588.
https://doi.org/10.3390/en14030588
Academic Editors: Michel Duval and
Sérgio Cruz
Received: 23 November 2020
Accepted: 20 January 2021
Published: 24 January 2021
Publisher’s Note: MDPI stays neutral
with regard to jurisdictional claims in
published maps and institutional affil-
iations.
Copyright: © 2021 by the authors.
Licensee MDPI, Basel, Switzerland.
This article is an open access article
distributed under the terms and
conditions of the Creative Commons
Attribution (CC BY) license (https://
creativecommons.org/licenses/by/
4.0/).
1 Research and Development Department, National Institute for Research, Development and Testing inElectrical Engineering-ICMET Craiova, 200746 Craiova, Romania; [email protected] (A.-M.A.);[email protected] (M.-C.N.)
2 Department of Automatic Control and Electronics, University of Craiova, 200585 Craiova, Romania3 Department Electrical Engineering, Energetic and Aeronautics, University of Craiova,
200585 Craiova, Romania* Correspondence: [email protected] (C.-I.N.); [email protected] (M.N.)
Abstract: Power transformers play an important role in electrical systems; being considered the coreof electric power transmissions and distribution networks, the owners and users of these assets areincreasingly concerned with adopting reliable, automated, and non-invasive techniques to monitorand diagnose their operating conditions. Thus, monitoring the conditions of power transformershas evolved, in the sense that a complete characterization of the conditions of oil–paper insulationcan be achieved through dissolved gas analysis (DGA) and furan compounds analysis, since theseanalyses provide a lot of information about the phenomena that occur in power transformers. TheDuval triangles and pentagons methods can be used with a high percentage of correct predictionscompared to the known classical methods (key gases, International Electrotechnical Commission(IEC), Rogers, Doernenburg ratios), because, in addition to the six types of basic faults, they alsoidentify four sub-types of thermal faults that provide important additional information for theappropriate corrective actions to be applied to the transformers. A new approach is presented basedon the complementarity between the analysis of the gases dissolved in the transformer oil and theanalysis of furan compounds, for the identification of the different faults, especially when there aremultiple faults, by extending the diagnosis of the operating conditions of the power transformers, interms of paper degradation. The implemented software system based on artificial neural networkswas tested and validated in practice, with good results.
Keywords: power transformer; insulation; dissolved gas analysis; furan compounds; radial basisfunction neural network; feed forward neural network
1. Introduction
Power transformers are key pieces of equipment in the electric power transmissionand distribution systems, and their reliability influences the safety of electric power supplynetworks. Although they are reliable pieces of equipment, it is difficult to avoid damagingthem. In addition to catastrophic damage to the power supply system, the faults in trans-formers can also cause substantial financial losses for both the owner and the consumersserved by it. For this reason, it is important to identify, at an early stage, the possible faultsin transformers so that, based on an appropriate diagnostic procedure, an efficient andrational decision is taken in advance on the appropriate corrective actions to be applied tothe transformer [1–4].
An important and effective tool for the early-stage fault diagnosis in oil-immersedpower transformers is dissolved gas analysis (DGA), which can identify the degradationof the solid insulation and oil [5–10]. The diagnosis of the involvement of solid insulationand its possible carbonization, resulting from a method of dissolved gas analysis, can be
Energies 2021, 14, 588. https://doi.org/10.3390/en14030588 https://www.mdpi.com/journal/energies

Energies 2021, 14, 588 2 of 22
confirmed by careful use of carbon oxides, the CO2/CO ratio, and the analysis of furancompounds [11–15].
Lately, in order to correct and render, more effectively, the methods used for identifyingfaults in oil-immersed power transformers that rely on the DGA, researchers aroundthe world have tried to apply, to these methods, various techniques based on artificialintelligence, such as the fuzzy logic-based method proposed in [16], as a new solution fordetermining the fault condition using the combination of gas level, gas rate, and DGAinterpretation through the Duval pentagon method.
One approach carrying out the classification of power transformer faults, based onthe combination of intelligent methods, such as the hypersphere multi-class support vectormachine (HMSVM), the hybrid immune a logarithm (HIA), and the kernel extreme learningmachine (KELM), is shown in [17]. The optimization of the parameters of the HMSVM-type method, starting from the training stage, is achieved by means of particle swarmoptimization (PSO). The fusion of these methods is achieved by the Dempster–Shafer (DS)evidence theory in order to increase the accuracy of the results.
Starting from the problem of insufficient and imbalanced datasets, one method thatcarries out the diagnosis of power transformers and overcomes these issues is the twinsupport vector machines (TWSVMs) method, proposed in [18]. The parameters of thisintelligent classification method are optimized by using the chemical reaction optimization(CRO) type algorithm, and the efficiency and accuracy are increased by means of restrictedBoltzmann machines (RBMs) from the moment of data preprocessing.
Moreover, to avoid a series of drawbacks regarding the traditional methods of DGA,an approach based on an improved algorithm of the grey wolf type, in order to get betterresults in case of fault classification by the least square support vector machine (LSSVM), isproposed in [19].
Based on the DGA and the construction of a global health index of power transformers,intelligent algorithms based on the improved differential evolution optimization algorithm,which substantially improve the precision and accuracy in determining the faults, are usedin [20,21].
A complementarity for DGA, which is carried out through the partial discharge studyby using the correlation analysis and extraction of the main characteristic parameters isshown in [22].
Moreover, a complex image of the fault condition of power transformer is presentedin [23] and consists of determining the winding hot spot temperature combined with theDGA.
Although the intelligent methods and theories presented above have yielded goodresults on the accuracy of the power transformer fault diagnosing methods based on theDGA, there are also some shortcomings in the parameter optimization, the selection ofthe set of characteristics and the data preprocessing methods, which narrow the practicalapplication of the intelligent systems [1,17,18].
The novelty presented in this article consists in the complementarity between theanalysis of the gases dissolved in the oil of power transformers and the analysis of furancompounds, for the identification of the different faults, especially when there are multiplefaults, by extending the diagnosis of the operating condition of power transformers interms of paper degradation. This automatic and non-invasive diagnostic is based on theDuval triangles and pentagons analysis methods. The software implementation of thediagnosis is based on using artificial neural networks, such as Radial Basis Function NeuralNetwork (RBFNN) and Feed Forward Neural Network (FFNN), due to their facilities, suchas: learning, robustness of the algorithms used, and good results on accuracy and precision.
This paper is a continuation of the previous research [24–26] related to the determina-tion of power transformer faults based on the fuzzy logic implementation of the DGA andthe analysis of furan compounds.
The rest of the paper is organized as follows: Section 2 presents the methods for theanalysis of dissolved gases and furan compounds. Section 3 presents the system developed

Energies 2021, 14, 588 3 of 22
to determine the faults in oil-immersed power transformers, based on neural networks.Section 4 presents the validation of the proposed system, and the conclusions and futureapproaches are presented in Section 5.
2. Materials and Methods for Faults Detection of the Power Transformers
The interpretation of the DGA in oil-filled transformers is one of the most importantprocedures for the determination of the types of faults. IEC 60599-2015 09 [5] and Institute ofElectrical and Electronics Engineers IEEE C57.104-2019 [6] standards provide several DGAinterpretation methods achieved on the calculation of certain oil-dissolved flammable gasratios. Between the methods proposed by these standards and the evolution of the effectivefaults in transformers, there is a correlation validated by large datasets collected fromoperating transformers and compared with those collected from out-of-service transformers.We briefly present the most common DGA interpretation methods proposed in [5] (IECratio and Duval 1 triangle (DTr-1)) and in [6] (key gas analysis, Doernenburg ratio, andRogers ratio).
2.1. Key Gas Method
To determine the faults in the transformer, the key gas method uses the combinationof individual gases (H2; CH4; C2H6; C2H4; C2H2; CO; CO2) and the total concentrationof flammable gases (TDCG = H2 + CH4 + C2H6 + C2H4 + C2H2 + CO), and the resultof the diagnosis is based on the determination of the relative maximum values of thekey gases in relation to the rest of the gases dissolved in the transformer oil [6]. Thismethod can only forecast the following general types of errors: partial discharges (PD)in oil, overheated oil, cellulose overheating, and arcing in oil. Researchers consider thismethod as very conservative because, according to it, a transformer can operate safely,even if this interpretation method shows an imminent risk, provided that the speed of gasgeneration is not increasing steadily [1–3]. Due to these things, this method is not widelyused as a tool for the efficient interpretation of the transformer faults based on the DGAresults.
2.2. Doernenburg Reporting Method
This method is one of the oldest methods used to identify the initial faults in transform-ers. To apply this method, the first condition to be fulfilled is that at least one of the key gasconcentrations (H2; CH4; C2H6; C2H4; C2H2) exceeds twice the concentration limits (L1),as shown in Table 1, and that one of the other two gases exceeds the limit value L1. Afterthis condition is fulfilled, the four typical gas ratios (CH4/H2; C2H2/C2H4; C2H2/CH4;C2H6/C2H2) will be used to examine the types of faults as shown in Table 2 [1–3,6].
Table 1. Concentration limits L1 of dissolved gases.
Dissolved Gases H2 CH4 CO C2H2 C2H4 C2H6
Concentration limits L1 100 120 350 1 50 65
Table 2. Fault analysis based on Doernenburg ratio.
Case of Error CH4/H2 C2H2/C2H4 C2H2/CH4 C2H6/C2H2
Thermal decomposition >1 <0.75 <0.3 >0.4
Corona(Low intensity partial discharge) <0.1 Insignificant <0.3 >0.4
Arcing(High-intensity partial discharge) >0.1–<1 <0.75 >0.3 <0.4
Energies 2021, 14, 588 4 of 22
2.3. Rogers Ratio and IEC Ratio Methods
One of the two DGA interpretation techniques recommended in [5] is the method ofIEC ratios using the same gas ratios (C2H2/C2H4; CH4/H2; C2H4/C2H6), as in the caseof the Rogers ratio method. Tables 3 and 4 show the values of the ratios and the types offaults related to them for the methods of the Rogers and IEC ratios [4–6].
Table 3. Analysis based on Rogers ratios.
Type of Fault C2H2/C2H4 CH4/H2 C2H4/C2H6
Normal unit <0.1 >0.1 to <1 <1Partial discharge <0.1 <0.1 <1
Arcing 0.1 to 3.0 >0.1 to <1 >3Low thermal temperature <0.1 >0.1 to <1 >0.1 to <3
Thermal: <700 C <0.1 >1 >0.1 to <3Thermal: >700 C <0.1 >1 >3
Table 4. Analysis based on IEC ratios.
Case Characteristic Fault C2H2/C2H4 CH4/H2 C2H4/C2H6
PD Partial discharge Insignificant <0.1 <0.2D1 Discharge of low energy >1 0.1–0.5 >1D2 Discharge of high energy 0.6–2.5 0.1–1 >2T1 Thermal: T < 300 C Insignificant >1 but insignificant <1T2 Thermal: 300 C < T < 700 C <0.1 >1 1–4T3 Thermal: T > 700 C <0.2 >1 >4
In the IEC 60599-2015 09 [5] standard, it is recommended that, when the values ofthe ratios are not within the threshold ranges and do not match any fault, the graphicalrepresentation in two or three dimensions of the gas concentrations should be used, sothe type of fault may be the area in the vicinity of the undiagnosed case. Moreover,some identified faults are not precisely for the overlapping fault areas of cases D1 andD2. Therefore, one of the serious drawbacks of these methods is that part of the gas ratioobtained is not included in the specific range of values and, thus, the fault diagnostic failsto be assessed.
In conclusion, ratio-based methods, such as Doernenburg, Rogers, and IEC can onlybe used if there is a substantial amount of gas used with the ratio, otherwise the methodslead to ratio values outside the specific range and it will not be possible for the type of faultto be identified [1–4]. Therefore, these methods can be used to identify faults, rather thandetect them.
2.4. Duval Triangle Methods
The DTr-1, also presented in [5,6] was proposed by Michel Duval in the early 1970sand is widely used for the analysis of dissolved gases in mineral oil-filled transformers.This method is based on the values of gases CH4, C2H4, and C2H2, which also correspondto the increasing level of gassing in transformers. The seven areas presented in the DTr-1correspond to the faults, which may be found in the transformers in service, and arepresented in Table 5 [7].
The DTr-1 method proved to be quite efficient in obtaining the main type of faultoccurring in the mineral oil-filled transformers in service. When the DGA results areat the boundary between two fault areas, it is difficult to distinguish which of the twofaults is the real one. It has also been found that some oils tend to unpredictably generatelow-temperature gases (between 80 C and up to 200 C) [3,5,9,11], and, thus, may interferewith the correct identification of faults in transformers. The use of the DTr-1 method forthe analysis of the dissolved gases in a transformer with normal insulation aging leads toan error, because the result of the DGA will show a fault in the said transformer.

Energies 2021, 14, 588 5 of 22
Table 5. Faults identified using the DTr-1.
Code Fault or Stress
PD Corona-type partial dischargesD1 Low-energy dischargesD2 High-energy dischargeT1 Thermal faults not exceeding temperature 300 CT2 Thermal faults temperature at 300 C to 700 CT3 Thermal faults exceeding 700 CDT Combinations of electrical and thermal faults
To eliminate these uncertainties, Michel Duval developed triangles 4 (DTr-4) andtriangles 5 (DTr-5), also called “low-temperature fault triangles” [7]. They should onlybe considered as an addition to the information for DTr-1 and should not be used forfaults D1 and D2, which have been identified using the DTr-1. The DTr-4 presented inFigure 1 is used to obtain more information about the faults identified using the DTr-1 aslow-temperature faults such as: PD, T1, or T2 and uses “low-energy gases” [6,7,12]: H2,CH4, and C2H6.
Energies 2021, 14, 588 5 of 22
The DTr-1 method proved to be quite efficient in obtaining the main type of fault occurring in the mineral oil-filled transformers in service. When the DGA results are at the boundary between two fault areas, it is difficult to distinguish which of the two faults is the real one. It has also been found that some oils tend to unpredictably generate low-temperature gases (between 80 °C and up to 200 °C) [3,5,9,11], and, thus, may inter-fere with the correct identification of faults in transformers. The use of the DTr-1 method for the analysis of the dissolved gases in a transformer with normal insulation aging leads to an error, because the result of the DGA will show a fault in the said transformer.
To eliminate these uncertainties, Michel Duval developed triangles 4 (DTr-4) and triangles 5 (DTr-5), also called “low-temperature fault triangles” [7]. They should only be considered as an addition to the information for DTr-1 and should not be used for faults D1 and D2, which have been identified using the DTr-1. The DTr-4 presented in Figure 1 is used to obtain more information about the faults identified using the DTr-1 as low-temperature faults such as: PD, T1, or T2 and uses “low-energy gases” [6,7,12]: H2, CH4, and C2H6.
The defining of the fault areas in this triangle is shown in Table 6.
(a)
(b)
Figure 1. DTr-4 and DTr-5: (a) DTr-4 for low-temperature faults; (b) DTr-5 for thermal faults.
The DTr-5 for thermal faults is used to obtain more information about the faults identified using the Duval Triangle 1 as T2 or T3 type thermal faults and to confirm the faults accompanied by uncertainties after using the DTr-4.
This triangle uses “temperature gases” [6,7,12]: C2H4, CH4, and C2H6 and is repre-sented graphically in Figure 1. The defining of the fault areas in the DTr-5 is shown in Table 6.
Table 6. Defining the fault areas in the DTr-5.
Code Fault or Stress PD Corona-type partial discharges S Stray gassing of mineral oil C Paper carbonization caused by hot spots (T > 300 °C) O Overheating (T < 250 °C) T2 Thermal faults caused by temperature at 300 °C to 700 °C T3 Thermal faults occurring at very high temperatures (T > 700 °C)
2.5. The Duval Pentagons Method A new method of interpreting the DGA is represented by the Duval Pentagons 1 and
2 (DPg-1 and DPg-2), using the five key gases (H2; CH4; C2H6; C2H4; C2H2) arranged at the
Figure 1. DTr-4 and DTr-5: (a) DTr-4 for low-temperature faults; (b) DTr-5 for thermal faults.
The defining of the fault areas in this triangle is shown in Table 6.
Table 6. Defining the fault areas in the DTr-5.
Code Fault or Stress
PD Corona-type partial dischargesS Stray gassing of mineral oilC Paper carbonization caused by hot spots (T > 300 C)O Overheating (T < 250 C)T2 Thermal faults caused by temperature at 300 C to 700 CT3 Thermal faults occurring at very high temperatures (T > 700 C)
The DTr-5 for thermal faults is used to obtain more information about the faultsidentified using the Duval Triangle 1 as T2 or T3 type thermal faults and to confirm thefaults accompanied by uncertainties after using the DTr-4.
This triangle uses “temperature gases” [6,7,12]: C2H4, CH4, and C2H6 and is repre-sented graphically in Figure 1. The defining of the fault areas in the DTr-5 is shown inTable 6.

Energies 2021, 14, 588 6 of 22
2.5. The Duval Pentagons Method
A new method of interpreting the DGA is represented by the Duval Pentagons 1 and2 (DPg-1 and DPg-2), using the five key gases (H2; CH4; C2H6; C2H4; C2H2) arranged atthe apices of the pentagon. This method was created to solve problems which cannot besolved using the Duval Triangles method [3,6,8,9,12].
The DPg-1 and DPg-2 are shown in Figure 2, and the order of the gases at the apicesof the pentagons corresponds to the increase in energy required for the generation of thesegases (H2 → C2H6 → CH4 → C2H4 → C2H2) in the oil of a transformer in service, i.e.,counterclockwise. This gas layout proved to be the most suitable in identifying the faultsin transformers in the pentagon representation [10].
Energies 2021, 14, 588 6 of 22
apices of the pentagon. This method was created to solve problems which cannot be solved using the Duval Triangles method [3,6,8,9,12].
The DPg-1 and DPg-2 are shown in Figure 2, and the order of the gases at the apices of the pentagons corresponds to the increase in energy required for the generation of these gases (H2 → C2H6 → CH4 → C2H4 → C2H2) in the oil of a transformer in service, i.e., counterclockwise. This gas layout proved to be the most suitable in identifying the faults in transformers in the pentagon representation [10].
Figure 2a shows the DPg-1 with six main areas usually associated with the “basic” electrical or thermal faults used by the IEC standard, the IEEE standard and the DTr-1 (see Table 5) and area “S” of stray gas correlated with the generation of gases during the normal aging process of the complex insulation system of transformers.
When a thermal fault, such as T1, T2 or T3 occurs in DPg-1 after an analysis, it is important to know to what extent paper carbonization is involved in the occurrence of the fault, as this is an important factor in making an appropriate decision to avoid cata-strophic damage [6,8,10]. So this problem can be solved by using the DPg-2, which is represented in Figure 2b, where the areas for the thermal faults are defined as follows: • O: overheating < 250 °C; • C: thermal faults with paper carbonization; • T3-H: faults at high temperatures occurring only in oil.
It was found that the results of the DGAs, which are shown in the “C” zone of Pen-tagon 2 revealed the possible paper carbonization with a certainty of 100%, and, there-fore, additional analyses with carbon oxides and furan compounds are needed for those transformers, to determine the level of degradation of the solid insulation [10].
(a)
(b)
Figure 2. Representation of fault areas in the Duval Pentagon: (a) DPg-1; (b) DPg-2.
When, for the same set of DGA results, DPg-1, DPg-2 and DTr-1, DTr-4, DTr-5 for mineral oils reveal different types of faults, this indicates that there is a combination of faults in the said transformer. Thus, DPg-1 and DPg-2 are not intended to replace DTr-1, DTr-4 and DTr-5, but to provide additional information that can help identify various faults, especially in the case of the combinations of faults [4,7,12].
The Combined Duval Pentagon method, obtained by overlapping DPg-1 and DPg-2 is described in [10]. The purpose of this combination is to make full use of both original pentagons and to make it easier for the faults in mineral oil-filled transformers to be au-tomatically identified by using computer programs.
The proposed combined method presented in Figure 3 results in a number of 10 fault areas (areas S, PD, D1 and D2, which represent thermal problems are identical in both original pentagons) instead of 14 areas if both pentagons are used separately. The six areas with thermal problems presented in the Combined Duval Pentagon are defined in Table 7.
Figure 2. Representation of fault areas in the Duval Pentagon: (a) DPg-1; (b) DPg-2.
Figure 2a shows the DPg-1 with six main areas usually associated with the “basic”electrical or thermal faults used by the IEC standard, the IEEE standard and the DTr-1 (seeTable 5) and area “S” of stray gas correlated with the generation of gases during the normalaging process of the complex insulation system of transformers.
When a thermal fault, such as T1, T2 or T3 occurs in DPg-1 after an analysis, it isimportant to know to what extent paper carbonization is involved in the occurrence of thefault, as this is an important factor in making an appropriate decision to avoid catastrophicdamage [6,8,10]. So this problem can be solved by using the DPg-2, which is represented inFigure 2b, where the areas for the thermal faults are defined as follows:
• O: overheating < 250 C;• C: thermal faults with paper carbonization;• T3-H: faults at high temperatures occurring only in oil.
It was found that the results of the DGAs, which are shown in the “C” zone ofPentagon 2 revealed the possible paper carbonization with a certainty of 100%, and, there-fore, additional analyses with carbon oxides and furan compounds are needed for thosetransformers, to determine the level of degradation of the solid insulation [10].
When, for the same set of DGA results, DPg-1, DPg-2 and DTr-1, DTr-4, DTr-5 formineral oils reveal different types of faults, this indicates that there is a combination offaults in the said transformer. Thus, DPg-1 and DPg-2 are not intended to replace DTr-1,DTr-4 and DTr-5, but to provide additional information that can help identify various faults,especially in the case of the combinations of faults [4,7,12].
The Combined Duval Pentagon method, obtained by overlapping DPg-1 and DPg-2is described in [10]. The purpose of this combination is to make full use of both originalpentagons and to make it easier for the faults in mineral oil-filled transformers to beautomatically identified by using computer programs.
Energies 2021, 14, 588 7 of 22
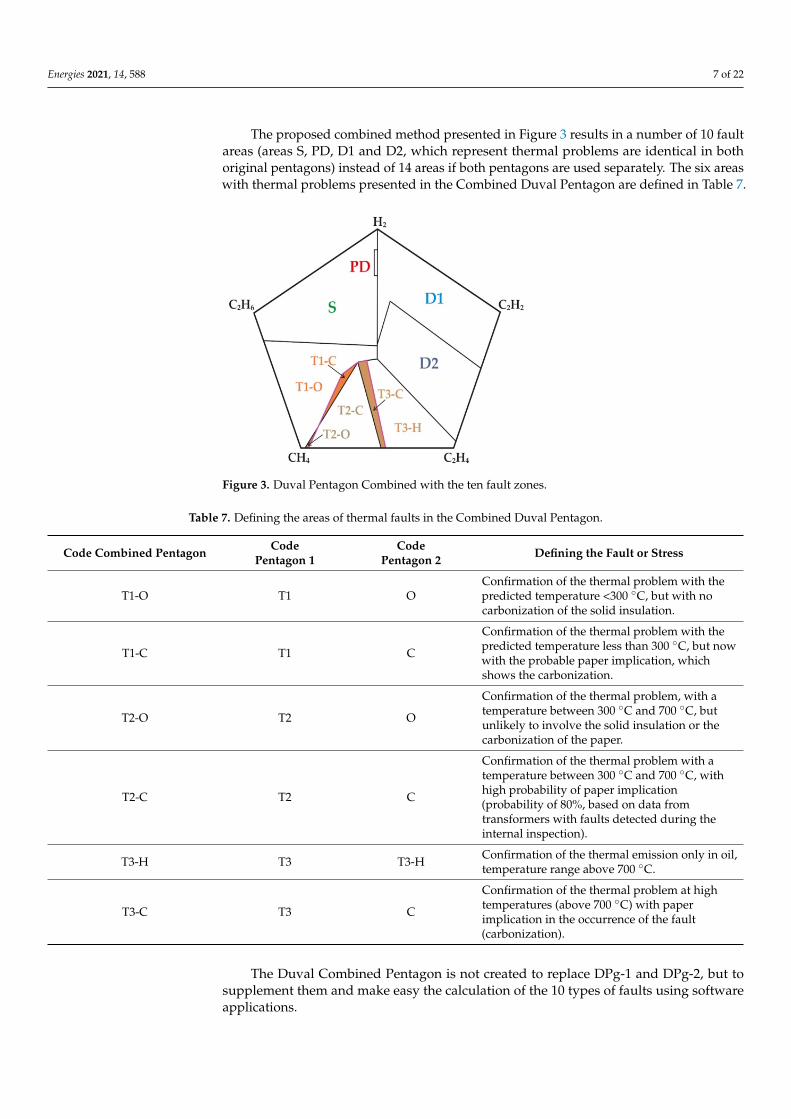
The proposed combined method presented in Figure 3 results in a number of 10 faultareas (areas S, PD, D1 and D2, which represent thermal problems are identical in bothoriginal pentagons) instead of 14 areas if both pentagons are used separately. The six areaswith thermal problems presented in the Combined Duval Pentagon are defined in Table 7.
Energies 2021, 14, 588 7 of 22
Figure 3. Duval Pentagon Combined with the ten fault zones.
The Duval Combined Pentagon is not created to replace DPg-1 and DPg-2, but to supplement them and make easy the calculation of the 10 types of faults using software applications.
Table 7. Defining the areas of thermal faults in the Combined Duval Pentagon.
Code Combined Pentagon Code Pentagon 1
Code Pentagon 2
Defining the Fault or Stress
T1-O T1 O Confirmation of the thermal problem with the predicted temperature <300 °C, but with no carbonization of the solid insulation.
T1-C T1 C Confirmation of the thermal problem with the predicted temperature less than 300 °C, but now with the probable paper implication, which shows the carbonization.
T2-O T2 O Confirmation of the thermal problem, with a temperature between 300 °C and 700 °C, but unlikely to involve the solid insulation or the carboniza-tion of the paper.
T2-C T2 C
Confirmation of the thermal problem with a temperature between 300 °C and 700 °C, with high probability of paper implication (probability of 80%, based on data from transformers with faults detected during the internal inspection).
T3-H T3 T3-H Confirmation of the thermal emission only in oil, temperature range above 700 °C.
T3-C T3 C Confirmation of the thermal problem at high temperatures (above 700 °C) with paper implication in the occurrence of the fault (carbonization).
2.6. Single Gas Ratio Method For the methods described above, References [5,6] have added three single gas ratios
(CO2/CO, O2/N2 and C2H2/H2), which can be used as complementary methods for diag-nosing transformer faults.
2.6.1. CO2/CO Ratio In case of cellulose degradation, atmospheric air ingress or transformer oil oxida-
tion, carbon monoxide (CO) and carbon dioxide (CO2) are generated. Until recently, these carbon oxides were considered good indicators for the determination of paper involve-ment in the occurrence of a fault diagnosed in the transformer, but recent research con-ducted by specialists in the International Council on Large Electric Systems (CIGRE), IEC and IEEE working groups has shown that this is not always the case [5,6,12]. Therefore, the new viewpoints on the interpretation of carbon oxides and the CO2/CO ratio are:
Figure 3. Duval Pentagon Combined with the ten fault zones.
Table 7. Defining the areas of thermal faults in the Combined Duval Pentagon.
Code Combined Pentagon CodePentagon 1
CodePentagon 2 Defining the Fault or Stress
T1-O T1 OConfirmation of the thermal problem with thepredicted temperature <300 C, but with nocarbonization of the solid insulation.
T1-C T1 C
Confirmation of the thermal problem with thepredicted temperature less than 300 C, but nowwith the probable paper implication, whichshows the carbonization.
T2-O T2 O
Confirmation of the thermal problem, with atemperature between 300 C and 700 C, butunlikely to involve the solid insulation or thecarbonization of the paper.
T2-C T2 C
Confirmation of the thermal problem with atemperature between 300 C and 700 C, withhigh probability of paper implication(probability of 80%, based on data fromtransformers with faults detected during theinternal inspection).
T3-H T3 T3-H Confirmation of the thermal emission only in oil,temperature range above 700 C.
T3-C T3 C
Confirmation of the thermal problem at hightemperatures (above 700 C) with paperimplication in the occurrence of the fault(carbonization).
The Duval Combined Pentagon is not created to replace DPg-1 and DPg-2, but tosupplement them and make easy the calculation of the 10 types of faults using softwareapplications.

Energies 2021, 14, 588 8 of 22
2.6. Single Gas Ratio Method
For the methods described above, References [5,6] have added three single gas ratios(CO2/CO, O2/N2 and C2H2/H2), which can be used as complementary methods fordiagnosing transformer faults.
2.6.1. CO2/CO Ratio
In case of cellulose degradation, atmospheric air ingress or transformer oil oxidation,carbon monoxide (CO) and carbon dioxide (CO2) are generated. Until recently, thesecarbon oxides were considered good indicators for the determination of paper involvementin the occurrence of a fault diagnosed in the transformer, but recent research conducted byspecialists in the International Council on Large Electric Systems (CIGRE), IEC and IEEEworking groups has shown that this is not always the case [5,6,12]. Therefore, the newviewpoints on the interpretation of carbon oxides and the CO2/CO ratio are:
• High values of CO (>1000 ppm) and/or ratios CO2/CO < 3, with no significantamounts of other fault gases are not an indication of a C-type fault, i.e., paper car-bonization, but it is due to the oxidation of the mineral oil under conditions thatcorrespond to low oxygen content in oil;
• High values of CO (>1000 ppm) and ratios CO2/CO < 3 in the presence of significantamounts of other fault gases and furans are considered as a confirmation of paperinvolvement in the occurrence of a fault, with possible carbonization;
• High values of CO2 (>10,000 ppm) and ratios CO2/CO > 20 and high values of furans(>5 ppm) show the slight overheating (<160 C) with slow paper degradation untillow values of the degree of polymerization (DP) of paper are reached. This does notprevent the transformer from operating normally, but there is concern that, due to thelow DP of paper, the cellulose insulation will not withstand stresses, such as shortcircuits or transient overcurrent;
• In some cases, the faults located in small volumes of paper do not generate significantamounts of CO and CO2 compared to the high amounts of the said gases in operation,but these faults generate significant amounts of other hydrocarbon gases, allowing thedetection of faults in the paper using the Duval Pentagon 2 and the Duval Triangles 4or 5.
Therefore, the implication of faults in the paper will not only be supported by COand CO2, but will also be verified by the generation of other gases or the analysis of furancompounds [4,10,12,13].
2.6.2. O2/N2 Ratio
Oxygen (O2) and nitrogen (N2) dissolved in oil are detected due to contact withatmospheric air in the tank of free-breathing transformers or air ingress through leakagesin the sealed equipment. At equilibrium with air, the concentrations of O2 and N2 in oil areapproximately 32,000 and respectively 64,000 ppm, and the O2/N2 ratio is approximately0.5 [5,6].
The decrease in the oxygen concentration or the O2/N2 ratio during the functioningof the transformer shows the oxidation of the oil due to its overheating and, thus, this ratiocan be used to confirm the thermal faults. An increase in the oxygen content or the O2/N2ratio in the sealed transformers shows a leakage to the air conservation system (nitrogenblanket or membrane).
The normal value of the O2/N2 ratio is influenced by factors, such as: the type oftransformer, the loading and conservation system used. Thus, the specialists of the CIGREworking group concluded that: the O2/N2 ratio is <0.2 for all of the nitrogen blanketedtransformers, and approximately 60% of the membrane-sealed transformers, and O2/N2ratio is >0.2 for all air breathing transformers, and the rest of the 40% of the membrane-sealed ones [12].
Energies 2021, 14, 588 9 of 22
2.6.3. C2H2/H2 Ratio
In the power transformers equipped with on load tap changers (OLTC), oil contami-nation may occur in the main tank, which leads to misdiagnosis, if there is a possibilityof communication with the oil or gas in the OLTC tank and the transformer main tank orbetween the respective conservators.
Thus, the values between 2 and 3 of the C2H2/H2 ratio are considered an indicationof the contamination of the oil in the transformer main tank with the oil or gas from theOLTC [5,6]. In this case, the evaluation of the DGA results from the transformer maintank must be performed by decreasing the contamination in the OLTC or consideredinconclusive [7,11,12].
Modern OLTCs are designed so that they can no longer lead to the contamination ofthe oil in the main tank of the power transformer.
2.7. C3 Hydrocarbon Method
The methods for the interpretation of the DGA presented above only consider C1and C2 hydrocarbons. Some newer practical methods also use C3 hydrocarbon concen-trations, and their authors consider them useful in making a more accurate diagnosis. C3hydrocarbons are very soluble in oil and are not affected by the possible diffusion into theambient air, and, because of this, the result of the analysis largely depends on the methodof extraction used [4–6].
CIGRE specialists in [12] presented in detail methods for identifying faults using C3hydrocarbons. Thus we can say that the additional ratios C3H6/C3H8 and C2H4/C3H8 areused to confirm the temperature range for the thermal faults as is presented in Table 8.
Table 8. Confirmation of the temperature range for the thermal faults.
Gas RatiosTemperature Range
150–300 300–700 >700
C3H6/C3H8 <2 2–6 <6C2H4/C3H8 <3 3–15 <15
2.8. Method of Furan Compounds
As mentioned above, to determine the faults in the power transformers, in view ofestablishing paper implication and the possible carbonization of the solid insulation, furanscan also be used, in addition to carbon oxides, thus allowing the determination of thedegree of degradation of the cellulose insulation [10,15,24–26].
Furans are a family of chemical compounds, which are detected as dissolved in thepower transformer oil; they are not generated by it, but occur exclusively as a result of thedegradation of the solid insulation and have an important significance in assessing thecondition of the solid insulation of the power transformer in operation and implicitly inassessing its lifespan. Therefore, we can say that the furan compounds occur as a resultof specific conditions, which develop inside the transformer, hence their occurrence andconcentration may suggest a certain operating fault. The names of these furan compoundsand the most common causes of their occurrence are presented in Table 9 [13].
Table 9. Possible causes of the specific presence of the furan compound.
Furan Compound Causes of Occurrence
5-HMF (5-hydroxymethyl-2-furfuraldehyde) Paper oxidation (aging and heating)2-FOL (2-furfuryl alcohol) High paper moisture2-FAL (2-furfuraldehyde) General overheating or normal aging
2-ACF (2-acetyl furan) Caused by lightning (rarely detected by tests)5-MEF (5-methyl-2-furfuraldehyde) Severe local overheating (hot-spot)
Energies 2021, 14, 588 10 of 22
A detailed review of the state-of-the-art application in terms of the furan compounds,as well as the difficulties associated with the correlation between them and the actual DPof the paper, are presented in [13–15]. According to these considerations, we can concludethat 2-FAL (see Table 10) is the most important and most widely used furan compound indetermining the DP of the solid insulation and, based on its concentration, the followinginterpretation was proposed for the condition of insulation depending on the DP [15,23–26]:
Table 10. Transformer condition according to the 2-FAL content.
2-FAL Content (ppm) Degree of Polymerization (DP) of Paper
0–0.1 1200–7000.1–1 700–4501–10 450–250>10 <250
3. Description of the Intelligent System for Determining the Faults of PowerTransformers Based on Neural Networks
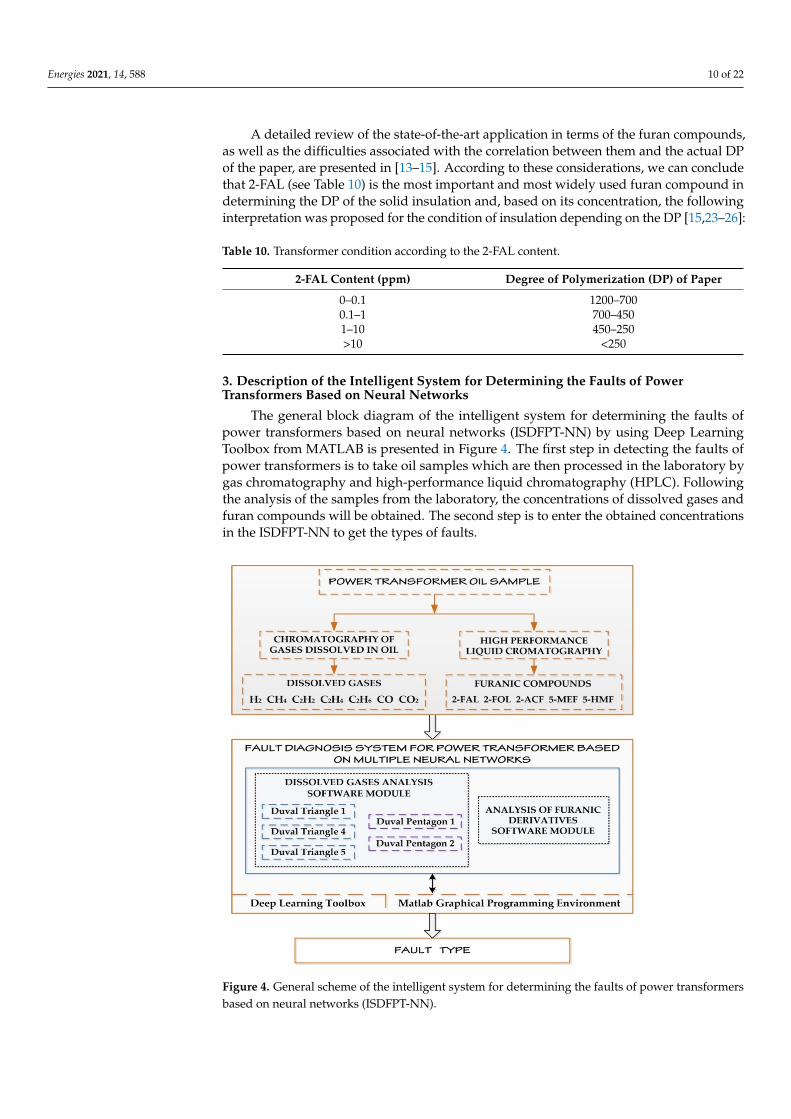
The general block diagram of the intelligent system for determining the faults ofpower transformers based on neural networks (ISDFPT-NN) by using Deep LearningToolbox from MATLAB is presented in Figure 4. The first step in detecting the faults ofpower transformers is to take oil samples which are then processed in the laboratory bygas chromatography and high-performance liquid chromatography (HPLC). Followingthe analysis of the samples from the laboratory, the concentrations of dissolved gases andfuran compounds will be obtained. The second step is to enter the obtained concentrationsin the ISDFPT-NN to get the types of faults.
Energies 2021, 14, 588 10 of 22
Table 10. Transformer condition according to the 2-FAL content.
2-FAL Content (ppm) Degree of Polymerization (DP) of Paper 0–0.1 1200–700 0.1–1 700–450 1–10 450–250 >10 <250
3. Description of the Intelligent System for Determining the Faults of Power Trans-formers Based on Neural Networks
The general block diagram of the intelligent system for determining the faults of power transformers based on neural networks (ISDFPT-NN) by using Deep Learning Toolbox from MATLAB is presented in Figure 4. The first step in detecting the faults of power transformers is to take oil samples which are then processed in the laboratory by gas chromatography and high-performance liquid chromatography (HPLC). Following the analysis of the samples from the laboratory, the concentrations of dissolved gases and furan compounds will be obtained. The second step is to enter the obtained concentra-tions in the ISDFPT-NN to get the types of faults.
The ISDFPT-NN implements the flow chart of the diagnosis according to the methods described in Section 2 and is presented in Figure 5. RBFNNs were used for concentrations of H2, CH4, C2H6, C2H4 and C2H2, to implement the triangles and pentagons of the Duval method, and FFNNs were used for CO, CO2 and furan compounds to implement the CO2/CO ratio method and the determination of DP, as is presented in Figure 5.
The 210 data samples were used in the implementation of ISDFPT-NN, which were taken from 94 power transformer units (step-up transformer, step-down transformer, distribution transformer, auto-transformers) with operating life between 20 and 35 years, from the laboratory database. These data samples were used to create, train, vali-date, and test the RBFNNs and FFNNs.
Figure 4. General scheme of the intelligent system for determining the faults of power transformers based on neural networks (ISDFPT-NN).
Figure 4. General scheme of the intelligent system for determining the faults of power transformersbased on neural networks (ISDFPT-NN).

Energies 2021, 14, 588 11 of 22
The ISDFPT-NN implements the flow chart of the diagnosis according to the methodsdescribed in Section 2 and is presented in Figure 5. RBFNNs were used for concentrationsof H2, CH4, C2H6, C2H4 and C2H2, to implement the triangles and pentagons of the Duvalmethod, and FFNNs were used for CO, CO2 and furan compounds to implement theCO2/CO ratio method and the determination of DP, as is presented in Figure 5.
Energies 2021, 14, 588 11 of 22
Figure 5. General flow chart of the ISDFPT-NN.
Based on the good results that can be achieved with the help of RBFNN with classi-fication issues [27–29], for each method of detecting faults by means of triangles and pentagons, the Duval method has properly trained an RBFNN.
An RBFNN consists of three layers: the input layer (sensory layer), the hidden layer consisting of radial functions, which constitutes a basis for the input vectors, and the output layer. The transformation of the input space into intermediate layers is nonlinear and the transformation of the intermediate layer into the output layer is linear. A justifi-cation for these transformations is given by Cover’s theorem on the classification of pat-terns [29]. Among the usual methods for training the RBFNN, the method of fixed and random centers is also chosen. The general form of a radial function that represents the output of a neuron from the hidden layer is expressed in the following form:
( ) MitxdMtxG i ,...,2,1,exp 22
2 =
−−=− (1)
where M—number of centers, d–maximum distance between the centers, X = (x1, x2, ..., xn)T, xi inputs, Ω = (t1, t2, ..., tn)T, ti input-associated weights.
Based on these, the neurons exit from the output layer based on its linearity in the following form:
( )=
Ω−==N
kkk XGwXFY
1)( (2)
where wk—output-associated weights.
Figure 5. General flow chart of the ISDFPT-NN.
The 210 data samples were used in the implementation of ISDFPT-NN, which weretaken from 94 power transformer units (step-up transformer, step-down transformer,distribution transformer, auto-transformers) with operating life between 20 and 35 years,from the laboratory database. These data samples were used to create, train, validate, andtest the RBFNNs and FFNNs.
Based on the good results that can be achieved with the help of RBFNN with clas-sification issues [27–29], for each method of detecting faults by means of triangles andpentagons, the Duval method has properly trained an RBFNN.
An RBFNN consists of three layers: the input layer (sensory layer), the hidden layerconsisting of radial functions, which constitutes a basis for the input vectors, and the outputlayer. The transformation of the input space into intermediate layers is nonlinear and thetransformation of the intermediate layer into the output layer is linear. A justification forthese transformations is given by Cover’s theorem on the classification of patterns [29].Among the usual methods for training the RBFNN, the method of fixed and random centersis also chosen. The general form of a radial function that represents the output of a neuronfrom the hidden layer is expressed in the following form:
G(‖x− t‖2
)= exp
(−M
d2 ‖x− ti‖2)
, i = 1, 2, . . . , M (1)
Energies 2021, 14, 588 12 of 22
where M—number of centers, d–maximum distance between the centers, X = (x1, x2, . . . ,xn)T, xi inputs, Ω = (t1, t2, . . . , tn)T, ti input-associated weights.
Based on these, the neurons exit from the output layer based on its linearity in thefollowing form:
Y = F(X) =N
∑k=1
wkGk(‖X−Ω‖) (2)
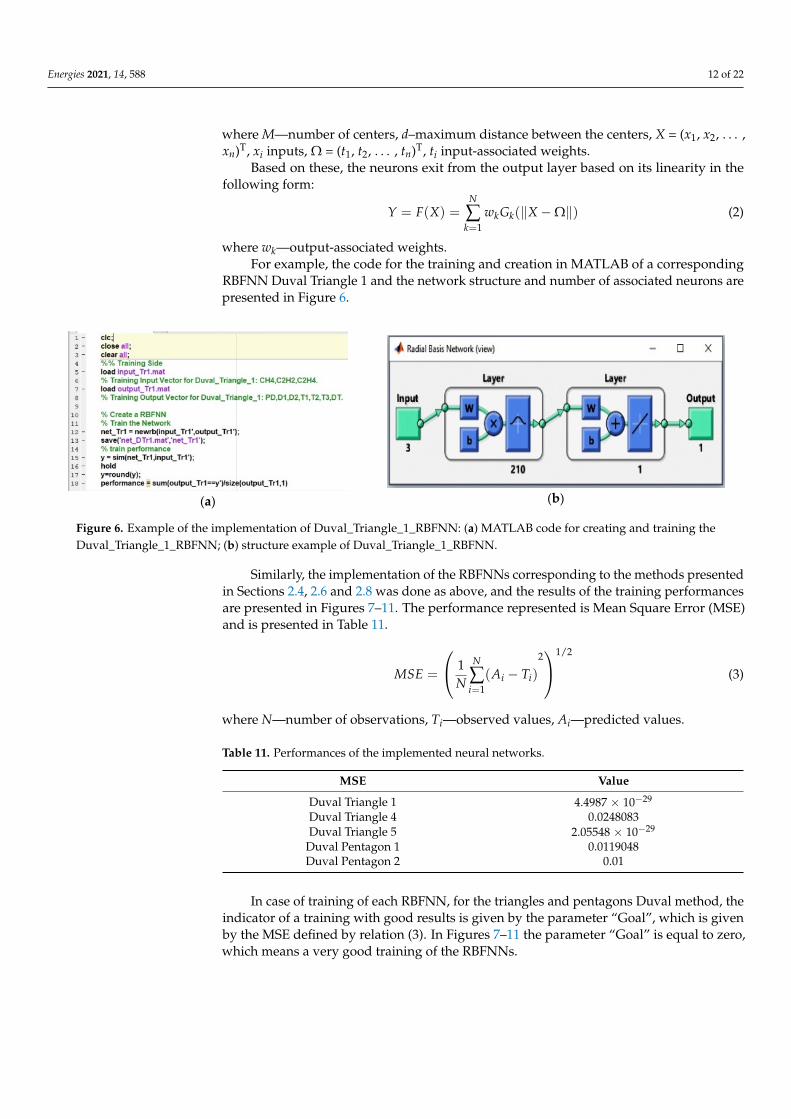
where wk—output-associated weights.For example, the code for the training and creation in MATLAB of a corresponding
RBFNN Duval Triangle 1 and the network structure and number of associated neurons arepresented in Figure 6.
Energies 2021, 14, 588 12 of 22
For example, the code for the training and creation in MATLAB of a corresponding RBFNN Duval Triangle 1 and the network structure and number of associated neurons are presented in Figure 6.
(a)
(b)
Figure 6. Example of the implementation of Duval_Triangle_1_RBFNN: (a) MATLAB code for creating and training the Duval_Triangle_1_RBFNN; (b) structure example of Duval_Triangle_1_RBFNN.
Similarly, the implementation of the RBFNNs corresponding to the methods pre-sented in Sections 2.4, 2.6 and 2.8 was done as above, and the results of the training per-formances are presented in Figures 7–11. The performance represented is Mean Square Error (MSE) and is presented in Table 11.
( )2/12
1
1
−=
=
N
iii TA
NMSE (3)
where N—number of observations, Ti—observed values, Ai—predicted values.
Table 11. Performances of the implemented neural networks.
MSE Value Duval Triangle 1 4.4987 × 10⁻²⁹ Duval Triangle 4 0.0248083 Duval Triangle 5 2.05548 × 10⁻²⁹ Duval Pentagon 1 0.0119048 Duval Pentagon 2 0.01
In case of training of each RBFNN, for the triangles and pentagons Duval method, the indicator of a training with good results is given by the parameter “Goal”, which is given by the MSE defined by relation (3). In Figures 7–11 the parameter “Goal” is equal to zero, which means a very good training of the RBFNNs.
Figure 6. Example of the implementation of Duval_Triangle_1_RBFNN: (a) MATLAB code for creating and training theDuval_Triangle_1_RBFNN; (b) structure example of Duval_Triangle_1_RBFNN.
Similarly, the implementation of the RBFNNs corresponding to the methods presentedin Sections 2.4, 2.6 and 2.8 was done as above, and the results of the training performancesare presented in Figures 7–11. The performance represented is Mean Square Error (MSE)and is presented in Table 11.
MSE =
1N
N
∑i=1
(Ai − Ti)
21/2
(3)
where N—number of observations, Ti—observed values, Ai—predicted values.
Table 11. Performances of the implemented neural networks.
MSE Value
Duval Triangle 1 4.4987 × 10⁻²⁹
Duval Triangle 4 0.0248083Duval Triangle 5 2.05548 × 10⁻²⁹
Duval Pentagon 1 0.0119048Duval Pentagon 2 0.01
In case of training of each RBFNN, for the triangles and pentagons Duval method, theindicator of a training with good results is given by the parameter “Goal”, which is givenby the MSE defined by relation (3). In Figures 7–11 the parameter “Goal” is equal to zero,which means a very good training of the RBFNNs.

Energies 2021, 14, 588 13 of 22Energies 2021, 14, 588 13 of 22
Figure 7. Performance of training for Duval_Triangle_1_RBFNN.
Figure 8. Performance of training for Duval_Triangle_4_RBFNN.
Figure 7. Performance of training for Duval_Triangle_1_RBFNN.
Energies 2021, 14, 588 13 of 22
Figure 7. Performance of training for Duval_Triangle_1_RBFNN.
Figure 8. Performance of training for Duval_Triangle_4_RBFNN.
Figure 8. Performance of training for Duval_Triangle_4_RBFNN.

Energies 2021, 14, 588 14 of 22Energies 2021, 14, 588 14 of 22
Figure 9. Performance of training for Duval_Triangle_5_RBFNN.
Figure 10. Performance of training for Duval_Pentagon_1_RBFNN.
Figure 9. Performance of training for Duval_Triangle_5_RBFNN.
Energies 2021, 14, 588 14 of 22
Figure 9. Performance of training for Duval_Triangle_5_RBFNN.
Figure 10. Performance of training for Duval_Pentagon_1_RBFNN. Figure 10. Performance of training for Duval_Pentagon_1_RBFNN.

Energies 2021, 14, 588 15 of 22Energies 2021, 14, 588 15 of 22
Figure 11. Performance of training for Duval_Pentagon_2_RBFNN.
The FFNN was used to determine cellulose degradation based on CO and CO2 val-ues. The special interest in this type of neural networks is due to their ability to operate with data different from those presented in the training stage and to learn from a random distribution of the synaptic weights of the network. The algorithm chosen for the neural network training is Levenberg–Marquardt, which is a method with a rapid convergence of the network, and is recommended for not very high input and output datasets [27,28,30].
For implementation, the Neural Network Fitting toolbox from the MATLAB pro-gramming environment is used [27,28]. CO and CO2 input data and transformer state output data in terms of cellulose degradation are used as follows: 70% are used for training, 15% for validation, and 15% for testing. The neural network consists of two layers, one that represents the input layer and the other the output layer. For the input layer, 210 neurons similar to the RBNN type networks implemented for triangles and pentagons were set. The network’s performances are shown in Figures 12 and 13. Re-gression factor R has a value close to 1, which denotes good training.
Figure 11. Performance of training for Duval_Pentagon_2_RBFNN.
The FFNN was used to determine cellulose degradation based on CO and CO2 values.The special interest in this type of neural networks is due to their ability to operate withdata different from those presented in the training stage and to learn from a randomdistribution of the synaptic weights of the network. The algorithm chosen for the neuralnetwork training is Levenberg–Marquardt, which is a method with a rapid convergence ofthe network, and is recommended for not very high input and output datasets [27,28,30].
For implementation, the Neural Network Fitting toolbox from the MATLAB program-ming environment is used [27,28]. CO and CO2 input data and transformer state outputdata in terms of cellulose degradation are used as follows: 70% are used for training, 15%for validation, and 15% for testing. The neural network consists of two layers, one thatrepresents the input layer and the other the output layer. For the input layer, 210 neuronssimilar to the RBNN type networks implemented for triangles and pentagons were set.The network’s performances are shown in Figures 12 and 13. Regression factor R has avalue close to 1, which denotes good training.

Energies 2021, 14, 588 16 of 22Energies 2021, 14, 588 16 of 22
Figure 12. Regression parameter R for CO and CO2 Analysis Feed Forward Neural Network (FFNN).
Figure 13. Performances of training for CO and CO2 Analysis FFNN.
Similarly, the same type of neural network was chosen for the interpretation of the insulation state according to the degree of polymerization. The 2-FAL input and the transformer state output data in terms of the polymerization degree are used as follows: 70% are used for training, 15% for validation, and 15% for testing. The network’s per-formances are presented in Figures 14 and 15.
Figure 12. Regression parameter R for CO and CO2 Analysis Feed Forward Neural Network (FFNN).
Energies 2021, 14, 588 16 of 22
Figure 12. Regression parameter R for CO and CO2 Analysis Feed Forward Neural Network (FFNN).
Figure 13. Performances of training for CO and CO2 Analysis FFNN.
Similarly, the same type of neural network was chosen for the interpretation of the insulation state according to the degree of polymerization. The 2-FAL input and the transformer state output data in terms of the polymerization degree are used as follows: 70% are used for training, 15% for validation, and 15% for testing. The network’s per-formances are presented in Figures 14 and 15.
Figure 13. Performances of training for CO and CO2 Analysis FFNN.
Similarly, the same type of neural network was chosen for the interpretation of theinsulation state according to the degree of polymerization. The 2-FAL input and the trans-former state output data in terms of the polymerization degree are used as follows: 70% areused for training, 15% for validation, and 15% for testing. The network’s performances arepresented in Figures 14 and 15.

Energies 2021, 14, 588 17 of 22Energies 2021, 14, 588 17 of 22
Figure 14. Regression parameter R for 2-FAL Analysis FFNN.
Figure 15. Performances of training for 2-FAL Analysis FFNN.
The block diagram of the implementation in MATLAB/Simulink of the main soft-ware module of ISDFPT-NN is shown in Figure 16. Each RBFNN and FFNN was created, trained, tested, and validated to implement the general flowchart in Figure 5.
Figure 14. Regression parameter R for 2-FAL Analysis FFNN.
Energies 2021, 14, 588 17 of 22
Figure 14. Regression parameter R for 2-FAL Analysis FFNN.
Figure 15. Performances of training for 2-FAL Analysis FFNN.
The block diagram of the implementation in MATLAB/Simulink of the main soft-ware module of ISDFPT-NN is shown in Figure 16. Each RBFNN and FFNN was created, trained, tested, and validated to implement the general flowchart in Figure 5.
Figure 15. Performances of training for 2-FAL Analysis FFNN.
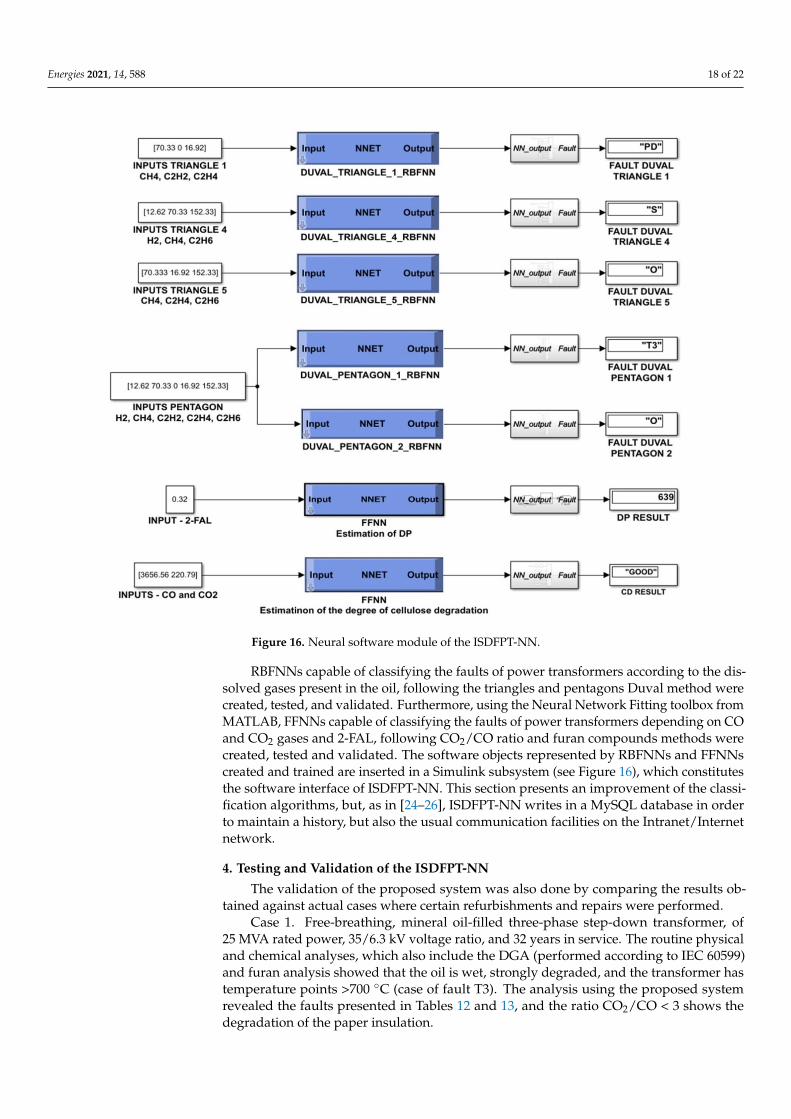
The block diagram of the implementation in MATLAB/Simulink of the main softwaremodule of ISDFPT-NN is shown in Figure 16. Each RBFNN and FFNN was created, trained,tested, and validated to implement the general flowchart in Figure 5.
Energies 2021, 14, 588 18 of 22Energies 2021, 14, 588 18 of 22
Figure 16. Neural software module of the ISDFPT-NN.
RBFNNs capable of classifying the faults of power transformers according to the dissolved gases present in the oil, following the triangles and pentagons Duval method were created, tested, and validated. Furthermore, using the Neural Network Fitting toolbox from MATLAB, FFNNs capable of classifying the faults of power transformers depending on CO and CO2 gases and 2-FAL, following CO2/CO ratio and furan com-pounds methods were created, tested and validated. The software objects represented by RBFNNs and FFNNs created and trained are inserted in a Simulink subsystem (see Fig-ure 16), which constitutes the software interface of ISDFPT-NN. This section presents an improvement of the classification algorithms, but, as in [24–26], ISDFPT-NN writes in a MySQL database in order to maintain a history, but also the usual communication facili-ties on the Intranet/Internet network.
4. Testing and Validation of the ISDFPT-NN The validation of the proposed system was also done by comparing the results ob-
tained against actual cases where certain refurbishments and repairs were performed. Case 1. Free-breathing, mineral oil-filled three-phase step-down transformer, of 25
MVA rated power, 35/6.3 kV voltage ratio, and 32 years in service. The routine physical and chemical analyses, which also include the DGA (performed according to IEC 60599) and furan analysis showed that the oil is wet, strongly degraded, and the transformer has temperature points >700 °C (case of fault T3). The analysis using the proposed system revealed the faults presented in Tables 12 and 13, and the ratio CO2/CO < 3 shows the degradation of the paper insulation.
Figure 16. Neural software module of the ISDFPT-NN.
RBFNNs capable of classifying the faults of power transformers according to the dis-solved gases present in the oil, following the triangles and pentagons Duval method werecreated, tested, and validated. Furthermore, using the Neural Network Fitting toolbox fromMATLAB, FFNNs capable of classifying the faults of power transformers depending on COand CO2 gases and 2-FAL, following CO2/CO ratio and furan compounds methods werecreated, tested and validated. The software objects represented by RBFNNs and FFNNscreated and trained are inserted in a Simulink subsystem (see Figure 16), which constitutesthe software interface of ISDFPT-NN. This section presents an improvement of the classi-fication algorithms, but, as in [24–26], ISDFPT-NN writes in a MySQL database in orderto maintain a history, but also the usual communication facilities on the Intranet/Internetnetwork.
4. Testing and Validation of the ISDFPT-NN
The validation of the proposed system was also done by comparing the results ob-tained against actual cases where certain refurbishments and repairs were performed.
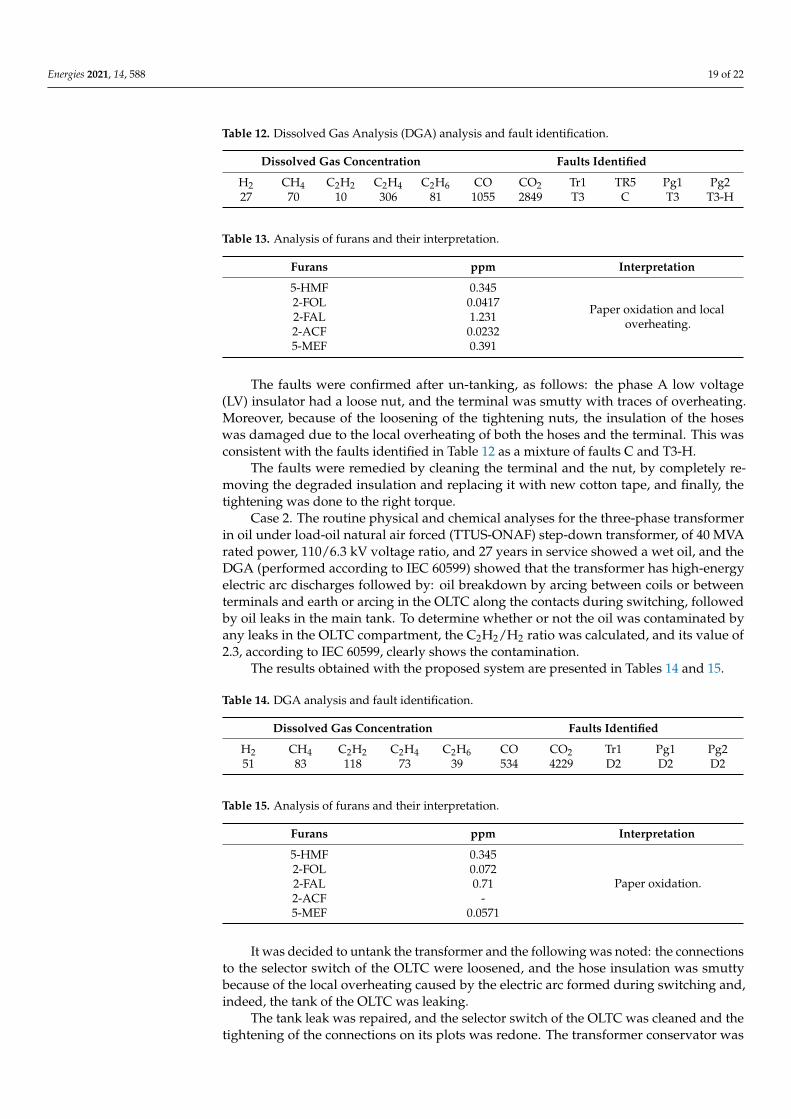
Case 1. Free-breathing, mineral oil-filled three-phase step-down transformer, of25 MVA rated power, 35/6.3 kV voltage ratio, and 32 years in service. The routine physicaland chemical analyses, which also include the DGA (performed according to IEC 60599)and furan analysis showed that the oil is wet, strongly degraded, and the transformer hastemperature points >700 C (case of fault T3). The analysis using the proposed systemrevealed the faults presented in Tables 12 and 13, and the ratio CO2/CO < 3 shows thedegradation of the paper insulation.
Energies 2021, 14, 588 19 of 22
Table 12. Dissolved Gas Analysis (DGA) analysis and fault identification.
Dissolved Gas Concentration Faults Identified
H2 CH4 C2H2 C2H4 C2H6 CO CO2 Tr1 TR5 Pg1 Pg227 70 10 306 81 1055 2849 T3 C T3 T3-H
Table 13. Analysis of furans and their interpretation.
Furans ppm Interpretation
5-HMF 0.345
Paper oxidation and localoverheating.
2-FOL 0.04172-FAL 1.2312-ACF 0.02325-MEF 0.391
The faults were confirmed after un-tanking, as follows: the phase A low voltage(LV) insulator had a loose nut, and the terminal was smutty with traces of overheating.Moreover, because of the loosening of the tightening nuts, the insulation of the hoseswas damaged due to the local overheating of both the hoses and the terminal. This wasconsistent with the faults identified in Table 12 as a mixture of faults C and T3-H.
The faults were remedied by cleaning the terminal and the nut, by completely re-moving the degraded insulation and replacing it with new cotton tape, and finally, thetightening was done to the right torque.
Case 2. The routine physical and chemical analyses for the three-phase transformerin oil under load-oil natural air forced (TTUS-ONAF) step-down transformer, of 40 MVArated power, 110/6.3 kV voltage ratio, and 27 years in service showed a wet oil, and theDGA (performed according to IEC 60599) showed that the transformer has high-energyelectric arc discharges followed by: oil breakdown by arcing between coils or betweenterminals and earth or arcing in the OLTC along the contacts during switching, followedby oil leaks in the main tank. To determine whether or not the oil was contaminated byany leaks in the OLTC compartment, the C2H2/H2 ratio was calculated, and its value of2.3, according to IEC 60599, clearly shows the contamination.
The results obtained with the proposed system are presented in Tables 14 and 15.
Table 14. DGA analysis and fault identification.
Dissolved Gas Concentration Faults Identified
H2 CH4 C2H2 C2H4 C2H6 CO CO2 Tr1 Pg1 Pg251 83 118 73 39 534 4229 D2 D2 D2
Table 15. Analysis of furans and their interpretation.
Furans ppm Interpretation
5-HMF 0.345
Paper oxidation.2-FOL 0.0722-FAL 0.712-ACF -5-MEF 0.0571
It was decided to untank the transformer and the following was noted: the connectionsto the selector switch of the OLTC were loosened, and the hose insulation was smuttybecause of the local overheating caused by the electric arc formed during switching and,indeed, the tank of the OLTC was leaking.
The tank leak was repaired, and the selector switch of the OLTC was cleaned and thetightening of the connections on its plots was redone. The transformer conservator was

Energies 2021, 14, 588 20 of 22
also replaced with an atmoseal conservator with two chambers, one for the transformertank, and the other for the tank of the OLTC, each equipped with silica gel filters.
Case 3. For the step-up transformer of 63 MVA rated power, 10.5/121 kV voltageratio, and 25 years in service, the routine measurements showed that the DGA analysis,according to the IEC 60599 standard indicates the thermal fault with temperatures of150–300 C (fault case T1). The analysis using the proposed system revealed the faultspresented in Tables 16 and 17, and the ratio CO2/CO > 3 and the furan analysis show amoderate degradation of the paper insulation.
Table 16. DGA analysis and fault identification.
Dissolved Gas Concentration Faults Identified
H2 CH4 C2H2 C2H4 C2H6 CO CO2 Tr1 Tr4 TR5 Pg1 Pg212.62 70.33 0 16.92 152.33 220.79 3656.56 T1 O O T1 O
Table 17. Analysis of furans and their interpretation.
Furans ppm Interpretation
5-HMF 0.05
Paper oxidation.2-FOL 0.0212-FAL 0.322-ACF -5-MEF -
This case is presented as the results of using the neural software module of theISDFPT-NN, which are shown in Figure 16.
Because it was intended to make some improvements to the transformer, namely:mounting a Qualitrol-type pressure relief valve and replacing the free-breathing conserva-tor with an atmoseal bag conservator, equipped with a separate compartment for the oil ofthe on-load tap-changer, the transformer was untanked. After the untanking, it was foundthat the insulation of the transformer is not smutty and shows no traces of degradation orcarbonization, so it has a color specific to moderate aging; thus, confirming that the faultsdetected using the proposed system correspond to reality.
The ISDFPT-NN was tested on more than 80 power transformer units and comparedto the results obtained in [24–26]. It was noted that there is an increase in accuracy from95% to 95.7% and precision from 93% to 93.5%.
5. Conclusions
Since power transformers are key pieces of equipment in the electricity transmissionand distribution systems, it is very important to diagnose their operating conditions andidentify as accurately and early as possible the transformer failures. Ratio-based methods,such as Doernenburg, Rogers, and IEC can only be used if there is a substantial amount ofgas used in the ratios, otherwise these methods lead to ratio values outside of the specificrange, and the type of malfunction cannot be identified. Therefore, these methods canbe used to identify faults rather than detect them. The methods of Duval triangles andpentagons can be used with a high percentage of accurate predictions compared to classicalknown methods (key gases, IEC reports, Rogers, Doernenburg), because, in addition tothe six types of basic faults, they also identify four subtypes of thermal faults that providecomplementary information, which is very important for the appropriate corrective actionsto be applied to the transformer.
In this article, a new approach was proposed consisting of the complementaritybetween the analysis of dissolved gases in the oil of power transformers and the analysis offuran compounds, in order to identify the operating conditions of the power transformers,according to the paper degradation condition using artificial neural networks of the RBFN

Energies 2021, 14, 588 21 of 22
and FFNN type. Moreover, 210 data samples were used in the implementation of theISDFPT-NN, which were taken from 94 power transformer units (step-up transformer,step-down transformer, distribution transformer, auto-transformers) with operating livesbetween 20 and 35 years, from the laboratory database, and have been tested on more than80 power transformer units, and compared to the results obtained in previous researches.It has been noted that there is an increase in accuracy, from 95% to 95.7%, and precisionfrom 93% to 93.5%.
Proposals for future work consist of the development of a diagnostic system that alsoincludes: the influence of oxygen, nitrogen, and their ratios, methods of interpreting faultsusing C3 hydrocarbon gases, and interfering with methods of diagnosing the conditionsof the adjustment switch under loads, since it was found that transformer faults couldoccur mainly in = transformer insulation systems, transformer windings, bushings, andthe OLTC.
Author Contributions: Conceptualization, A.-M.A., C.-I.N., M.N. and M.-C.N.; data curation, C.-I.N.,M.N. and M.-C.N.; formal analysis, A.-M.A., C.-I.N., M.N. and M.-C.N.; funding acquisition, M.N.;investigation, A.-M.A., C.-I.N., M.N. and M.-C.N.; methodology, A.-M.A., C.-I.N., M.N. and M.-C.N.;project administration, M.N.; resources, A.-M.A. and M.N.; software, C.-I.N. and M.N.; supervision,A.-M.A., C.-I.N., M.N. and M.-C.N.; validation, A.-M.A., C.-I.N., M.N. and M.-C.N.; visualization,A.-M.A., C.-I.N., M.N. and M.-C.N.; writing–original draft, A.-M.A., C.-I.N., M.N. and M.-C.N.;writing—review and editing, C.-I.N., M.N. and M.-C.N. All authors have read and agreed to thepublished version of the manuscript.
Funding: The paper was developed with funds from the Ministry of Education and ScientificResearch-Romania as part of the NUCLEU Program: PN 19 38 01 03 and grant POCU380/6/13/123990,co-financed by the European Social Fund within the Sectorial Operational Program Human Capital2014–2020.
Institutional Review Board Statement: Not applicable.
Informed Consent Statement: Not applicable.
Data Availability Statement: Data sharing is not applicable.
Conflicts of Interest: The authors declare no conflict of interest.
References1. Abu-Siada, A. Improved Consistent Interpretation Approach of Fault Type within Power Transformers Using Dissolved Gas
Analysis and Gene Expression Programming. Energies 2019, 12, 730. [CrossRef]2. Ashkezari, A.D.; Saha, T.K.; Ekanayake, C.; Ma, H. Evaluating the accuracy of different DGA techniques for improving the
transformer oil quality interpretation. In Proceedings of the Australasian Universities Power Engineering Conference (AUPEC),Brisbane, QLD, Australia, 25–28 September 2011; pp. 1–6.
3. Pattanadech, N.; Wattakapaiboon, W. Application of Duval Pentagon Compared with Other DGA Interpretation Techniques:Case Studies for Actual Transformer Inspections Including Experience from Power Plants in Thailand. In Proceedings of the5th International Conference on Engineering, Applied Sciences and Technology (ICEAST), Luang Prabang, Laos, 2–5 July 2019;pp. 1–4.
4. Piotrowski, T.; Rozga, P.; Kozak, R. Comparative Analysis of the Results of Diagnostic Measurements with an Internal Inspectionof Oil-Filled Power Transformers. Energies 2019, 12, 2155. [CrossRef]
5. IEC. IEC 60599—Mineral Oil-Impregnated Electrical Equipment in Service–Guide to the Interpretation of Dissolved and Free Gases Analysis;International Electrotechnical Commission: Geneva, Switzerland, 2015.
6. IEEE. IEEE C57.104-2019—Guide for the Interpretation of Gases Generated in Mineral Oil-Immersed Transformers; Institute of Electricaland Electronics Engineers: Piscataway, NJ, USA, 2019.
7. Duval, M. The Duval Triangle for Load Tap Changers, Non-Mineral Oils and Low Temperature Faults in Transformers. IEEEElectr. Insul. Mag. 2008, 24, 22–29. [CrossRef]
8. Duval, M.; Lamarre, L. The Duval Pentagon—A new complementary tool for the interpretation of dissolved gas analysis inTransformers. IEEE Electr. Insul. Mag. 2014, 30, 9–12.
9. Duval, M.; Heizmann, T. Identification of Stray Gassing of Inhibited and Uninhibited Mineral Oils in Transformers. Energies 2020,13, 3886. [CrossRef]
10. Cheim, L.; Duval, M.; Haider, S. Combined Duval Pentagons: A Simplified Approach. Energies 2020, 13, 2859. [CrossRef]
Energies 2021, 14, 588 22 of 22
11. CIGRE. DGA in Non-Mineral Oils and Load Tap Changers and Improved DGA Diagnosis Criteria; WG D1.32; Technical Brochure no.443; CIGRE: Paris, France, 2010.
12. CIGRE. Advances in DGA Interpretation; JWG D1/A2.47; Technical Brochure no. 771; CIGRE: Paris, France, 2019.13. CIGRE. CIGRE Brochure 494—Furanic Compounds for Diagnosis; CIGRE: Paris, France, 2012.14. Li, S.; Ge, Z.; Abu-Siada, A.; Yang, L.; Li, S.; Wakimoto, K. A New Technique to Estimate the Degree of Polymerization of
Insulation Paper Using Multiple Aging Parameters of Transformer Oil. IEEE Access 2019, 7, 157471–157479. [CrossRef]15. Duval, M.; De Pablo, A.; Atanasova-Hoehlein, I.; Grisaru, M. Significance and detection of very low degree of polymerization of
paper in transformers. IEEE Electr. Insul. Mag. 2017, 33, 31–38. [CrossRef]16. Prasojo, R.A.; Gumilang, H.; Suwarno; Maulidevi, N.U.; Soedjarno, B.A. A Fuzzy Logic Model for Power Transformer Faults’
Severity Determination Based on Gas Level, Gas Rate, and Dissolved Gas Analysis Interpretation. Energies 2020, 13, 1009.[CrossRef]
17. Shang, H.; Xu, J.; Zheng, Z.; Qi, B.; Zhang, L. A Novel Fault Diagnosis Method for Power Transformer Based on Dissolved GasAnalysis Using Hypersphere Multiclass Support Vector Machine and Improved D–S Evidence Theory. Energies 2019, 12, 4017.[CrossRef]
18. Yuan, F.; Guo, J.; Xiao, Z.; Zeng, B.; Zhu, W.; Huang, S. A Transformer Fault Diagnosis Model Based on Chemical ReactionOptimization and Twin Support Vector Machine. Energies 2019, 12, 960. [CrossRef]
19. Zeng, B.; Guo, J.; Zhu, W.; Xiao, Z.; Yuan, F.; Huang, S. A Transformer Fault Diagnosis Model Based On Hybrid Grey WolfOptimizer and LS-SVM. Energies 2019, 12, 4170. [CrossRef]
20. Zhang, W.; Yang, X.; Deng, Y.; Li, A. An Inspired Machine-Learning Algorithm with a Hybrid Whale Optimization for PowerTransformer PHM. Energies 2020, 13, 3143. [CrossRef]
21. Bohatyrewicz, P.; Płowucha, J.; Subocz, J. Condition Assessment of Power Transformers Based on Health Index Value. Appl. Sci.2019, 9, 4877. [CrossRef]
22. Chen, W.; Chen, X.; Peng, S.; Li, J. Canonical Correlation between Partial Discharges and Gas Formation in Transformer Oil PaperInsulation. Energies 2012, 5, 1081–1097. [CrossRef]
23. Cheng, L.; Yu, T.; Wang, G.; Yang, B.; Zhou, L. Hot Spot Temperature and Grey Target Theory-Based Dynamic Modelling forReliability Assessment of Transformer Oil-Paper Insulation Systems: A Practical Case Study. Energies 2018, 11, 249. [CrossRef]
24. Nicola, C.I.; Nicola, M.; Nit,u, M.C.; Aciu, A.M. Fuzzy logic system based on DGA and furan analysis for power transformer faultdiagnosis. UPB Sci. Bull. Ser. C Electr. Eng. Comput. Sci. 2019, 81, 183–196.
25. Nitu, M.C.; Aciu, A.M.; Nicola, C.I.; Nicola, M. Power transformer fault diagnosis using fuzzy logic technique based on dissolvedgas analysis and furan analysis. In Proceedings of the International Conference on Optimization of Electrical and ElectronicEquipment (OPTIM) & Intl Aegean Conference on Electrical Machines and Power Electronics (ACEMP), Brasov, Romania,25–27 May 2017; pp. 184–189.
26. Nitu, M.C.; Aciu, A.; Nicola, C.I.; Nicola, M. Fuzzy Controller vs. Classical Methods for Determining the Degree of Polymerization.In Proceedings of the International Conference on Electromechanical and Energy Systems (SIELMEN), Craiova, Romania,9–11 October 2019; pp. 1–6.
27. Demuth, H.; Beale, M. Neural Network Toolbox-For Use with MATLAB, 4th ed.; The MathWorks, Inc.: Natick, MA, USA, 2004.28. Beale, M.; Hagan, M.; Demuth, H. Deep Learning Toolbox™ Getting Started Guide, 14th ed.; The MathWorks, Inc.: Natick, MA,
USA, 2020.29. Ng, W.W.; Xu, S.; Wang, T.; Zhang, S.; Nugent, C. Radial Basis Function Neural Network with Localized Stochastic-Sensitive
Autoencoder for Home-Based Activity Recognition. Sensors 2020, 20, 1479. [CrossRef] [PubMed]30. Shaik, N.B.; Pedapati, S.R.; Taqvi, S.A.A.; Othman, A.R.; Dzubir, F.A.A. A Feed-Forward Back Propagation Neural Network
Approach to Predict the Life Condition of Crude Oil Pipeline. Processes 2020, 8, 661. [CrossRef]