
Complaints Data Analysis: 2017 H1 - FCA · 3 Financial Conduct Authority Complaints Data Analysis:...
26
October 2017 Complaints Data Analysis: 2017 H1
Transcript of Complaints Data Analysis: 2017 H1 - FCA · 3 Financial Conduct Authority Complaints Data Analysis:...
October 2017
Complaints Data Analysis: 2017 H1

2
Financial Conduct AuthorityComplaints Data Analysis: 2017 H1
What is in the aggregate complaints data?
Executive summary 3
Summary of complaints return changes 6
Highlights for the first half of 2017 7
Complaints over time 8
Putting complaints into context 9
Most complained about products 10
Main reasons for complaints 11
Complaints by product groups – highlights for 2017 H1 13
Outcomes for consumers 20
Annex: Changes to the data to note for 2017 H1 23
Aggregate complaints data tables 2017 H1 (XLSX).
returns you to the contents list
How to navigate this document onscreen
FCA RESTRICTED

3
Financial Conduct AuthorityComplaints Data Analysis: 2017 H1
Executive summary
The FCA monitors complaints data to understand how well firms treat their customers and how this changes over time. We track what products and services consumers are complaining about and identify the level of complaints that firms receive, relative to the products they provide.
We launched a new complaints return in the second half of 2016, enabling us to:
• capture all the complaints reported to firms, and
• understand the trends in product complaints better.
More than three million financial services complaints received in six months
Between January and June 2017 a total of 3.32 million complaints were received by 3,160 firms. The majority, 97%, of these were received by 226 firms, which received 500 or more complaints each.
The recent changes to our complaints return have led to an increase in the number of complaints reported to us. We now capture all the complaints received by firms, whereas the previous return did not include those which were resolved by the end of the next business day. In the first half of 2016 a total of 2.06 million complaints were reported by 2,796 firms, compared with 3.32 million complaints being reported by 3,160 firms in the same period of 2017. This increase is significantly influenced by the changes to the return, specifically the inclusion of complaints resolved by the end of the next business day.
A third of all complaints relate to PPI
A third of all complaints (1.11 million) received by firms in 2017 H1 related to payment protection insurance (PPI). Our analysis suggests this is a real increase since the first half of 2016, when 934,965 were received. Because few PPI complaints are resolved by the end of the next business day, the volume of PPI complaints is unlikely to be impacted by the changes in the new return.
The next most complained about products are current accounts, with 518,579 complaints, and credit cards, with 309,875 complaints. These have increased since 2016 H1, but it is not a meaningful comparison as the new reporting changes are likely to have affected these products in particular.
FCA RESTRICTED

4
Financial Conduct AuthorityComplaints Data Analysis: 2017 H1
£2 billion in redress paid in the first half of 2017
In total just under £2 billion (£1.99 billion) has been paid out in redress in 2017 H1, compared to £1.97 billion in 2016 H1. The majority of redress payments, over 80%, are for PPI complaints. £220 million (or 11%) has been paid out in redress for banking and credit card products.
Four in ten (43%) complaints are closed within three days
Most complaints are closed within 8 weeks (96%). We would expect this figure to have increased slightly as a result of the changes to the return, which is evident as 93% of complaints were closed within 8 weeks in 2016 H1.
43% of all complaints received in the first half of 2017 were closed within 3 days. PPI complaints tend to take longer to resolve and so, excluding PPI, 60% of all complaints have been resolved within 3 days. Because these data are new, we do not yet have a year-on-year comparison.
Six in ten (59%) complaints are upheld by firms
59% of the complaints received by firms were upheld, that is, the firm agreed with a consumer’s complaint. This is broadly unchanged in the last year – with a 57% uphold rate in 2016 H1 and 60% in 2016 H2.
Advising, selling and arranging issues are the top reason for complaints
We classify the reasons for consumers’ complaints into five broad categories as follows:
• advising, selling and arranging,
• general administration and customer service,
• information, charges or product performance,
• arrears related, and
• other reasons
Advising, selling and arranging issues have generated most complaints over the last few years. Since the new complaints return, which includes complaints closed within one business day, the proportion of complaints in this category has reduced while the proportion of administration complaints has increased.
FCA RESTRICTED

5
Financial Conduct AuthorityComplaints Data Analysis: 2017 H1
In 2017 H1, 43% of all complaints related to advising, selling and arranging, compared with 59% in 2016 H1. While general administration and customer service reasons accounted for 27% of all complaints in 2016 H1, they now account for 38% of all complaints. This suggests that administration and customer service complaints are likely to be resolved more quickly, and so fewer were captured in the previous return, whereas issues at the point of sale or advice typically take longer to resolve.
Putting complaints into context
A significant addition to our analysis following the new return is being able to put complaints numbers into context. That is, we record complaints per 1,000 sales or accounts. Home finance products (for example, mortgages) are the most complained about product category with approximately 8 complaints received for every 1,000 accounts with outstanding balances. Insurance and banking complaints account for approximately 3 complaints for every 1,000 accounts.
A few individual products stand out as having a disproportionately high number of complaints per 1,000 sales or accounts:
• Packaged bank accounts receive an average of 23 complaints for every 1,000 accounts, compared to 6 per 1,000 for current accounts.
• Second and subsequent charge mortgages receive 42 complaints per 1,000 balances outstanding and impaired credit mortgages received 31 complaints per 1,000 balances outstanding. This compares to an average of 8 complaints per 1,000 balances outstanding across all home finance products.
• We estimate PPI has received 40 complaints per 1,000 policies in force. This figure may also include complaints now being made against past policies that were taken out some years ago. Some firms may not know the exact number of policies they sold over time as, for example, policies may transfer from one organisation to another without keeping all the data.
FCA work in progress
We are working to understand these findings further. In July 2017 we published the findings from a review of how firms handle complaints about packaged bank accounts. It found that standards of complaint handling had improved since our previous review, while firms could do more to ensure consistency in how they deliver fair outcomes.
On second and subsequent charge mortgages, we brought the regulation of firms’ second and subsequent charge mortgage activity into our mortgage regime in March 2016. Much of the data around these loans are being reported to us for the first time. The FCA is monitoring firms and markets that provide or sell these products, along with impaired credit products, as part of its ongoing supervision work.
The following commentary provides detailed analysis of the latest data, including the latest trends and analysis by product type and reason for complaints. Full data tables are also published alongside the report.
FCA RESTRICTED

6
Financial Conduct AuthorityComplaints Data Analysis: 2017 H1
Summary of complaints return changes
Following changes in complaints reporting in 2016, outlined in PS15/191, all firms now report their complaints data from 2017 H1 onwards in the new complaints return. The changes to our data and new reporting are detailed in the annex. As a result of the changes, we are not providing detailed trend analysis in this publication. We will aim to do so in future publications.
In summary, our data now include complaints closed before the end of the next business day, which were previously not included under the old reporting rules, and data for new product categories. Overall, this means the total number of complaints in 2017 H1 has increased and the number and categories of complaints are not directly comparable to previous data in 2016 H1. Where product complaints are largely unaffected by rule changes we provide comparisons in our commentary.
1 www.fca.org.uk/publications/policy-statements/ps15-19-improving-complaints-handling-feedback-cp14-30-and-final
FCA RESTRICTED

7
Financial Conduct AuthorityComplaints Data Analysis: 2017 H1
Highlights for the first half of 2017
3,160 firms from a population of 15,538 firms reported one or more complaints during 2017 H1. This represents 20% of the total population of firms which submit the complaints returns. Excluding consumer credit firms (please refer to the Annex for further explanation) and firms submitting on a yearly basis, 226 out of the 3,160 firms report 500 or more complaints. These complaints account for 97% of all complaints reported.
The total number of opened complaints reported in 2017 H1 was 3.32 million compared with 3.04 million in 2016 H2. Some of this increase is likely to be due to firms now reporting via the new return and therefore reporting a higher number of complaints overall. For comparison, the total number of opened complaints reported in 2016 H1, before the new complaints rules came into effect, was 2.06 million. Some highlights from the data are shown below.
Table 1 – Highlights for 2017 H1
All complaints Excluding PPI*
Total number of firms reporting one or more complaint 3,160 compared with 2,977 in 2016 H2 and 2,796 in 2016 H1
–
Total number of opened complaints reported by firms 3.32 million compared with 3.04 million in 2016 H2 and 2.06 million in 2016 H1
2.21 million
PPI remains the most complained about product 1.11m 33.4% of all reported complaints, inthis period, compared with 30%^ (899,051) of allcomplaints in 2016 H2.
–
Percentage of complaints closed within three days(this is a brand new metric in the new return)
43% unchanged since 2016 H2
60%* compared with 63% in 2016 H2
Percentage of complaints closed within eight weeks 96% compared with 97% in 2016 H2
96%* compared with 97% in 2016 H2
Percentage of complaints upheld(where the firm agreed with the complainant)
59% compared with 60% in 2016 H2
57%* compared with 59% in 2016 H2
Total redress paid to consumers £1.99 bn compared with £1.90bn in 2016 H2
£0.33 bn* compared with £0.29bn in 2016 H2
Notes: ^ updated due to firm resubmissions* Data only available from firms reporting 500 or more complaints within their half year reporting period, making
up 97% of opened complaints reported to us in 2017 H1.
FCA RESTRICTED

8
Financial Conduct AuthorityComplaints Data Analysis: 2017 H1
Complaints over timeFigure 1 below summarises how the overall number of complaints has changed over time. Since 2012 we saw an overall decrease in the number of complaints, after the peak caused by PPI complaints. The most recent increase, in the second half of 2016, has resulted from the change to our complaints return.
Figure 1 – Total number of complaints over time
0
500,000
1,000,000
1,500,000
2,000,000
2,500,000
Increase mainlydue to banking
complaints
Increase mainly dueto bank charges
complaints
Increase mainly dueto PPI complaints
New complaintsreturn introduced
3,000,000
3,500,000
4,000,000
2006
-H1
2006
-H2
2007
-H1
2007
-H2
2008
-H1
2008
-H2
2009
-H1
2009
-H2
2010
-H1
2010
-H2
2011
-H1
2011
-H2
2012
-H1
2012
-H2
2013
-H1
2013
-H2
2014
-H1
2014
-H2
2015
-H1
2015
-H2
2016
-H1
2016
-H2
2017
-H1
Num
ber o
f com
plai
nts
Half Year
FCA RESTRICTED
9
Financial Conduct AuthorityComplaints Data Analysis: 2017 H1
Putting complaints into context
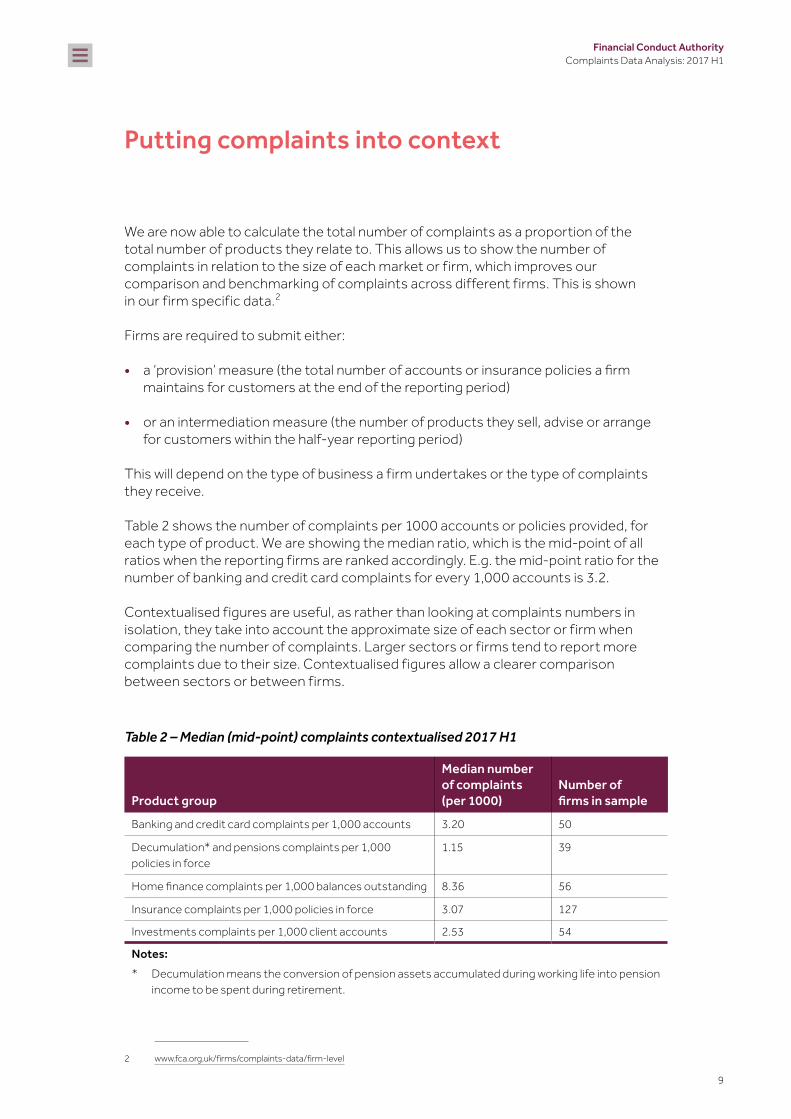
We are now able to calculate the total number of complaints as a proportion of the total number of products they relate to. This allows us to show the number of complaints in relation to the size of each market or firm, which improves our comparison and benchmarking of complaints across different firms. This is shown in our firm specific data.2
Firms are required to submit either:
• a ‘provision’ measure (the total number of accounts or insurance policies a firm maintains for customers at the end of the reporting period)
• or an intermediation measure (the number of products they sell, advise or arrange for customers within the half-year reporting period)
This will depend on the type of business a firm undertakes or the type of complaints they receive.
Table 2 shows the number of complaints per 1000 accounts or policies provided, for each type of product. We are showing the median ratio, which is the mid-point of all ratios when the reporting firms are ranked accordingly. E.g. the mid-point ratio for the number of banking and credit card complaints for every 1,000 accounts is 3.2.
Contextualised figures are useful, as rather than looking at complaints numbers in isolation, they take into account the approximate size of each sector or firm when comparing the number of complaints. Larger sectors or firms tend to report more complaints due to their size. Contextualised figures allow a clearer comparison between sectors or between firms.
Table 2 – Median (mid-point) complaints contextualised 2017 H1
Product group
Median number of complaints (per 1000)
Number of firms in sample
Banking and credit card complaints per 1,000 accounts 3.20 50
Decumulation* and pensions complaints per 1,000 policies in force
1.15 39
Home finance complaints per 1,000 balances outstanding 8.36 56
Insurance complaints per 1,000 policies in force 3.07 127
Investments complaints per 1,000 client accounts 2.53 54
Notes: * Decumulation means the conversion of pension assets accumulated during working life into pension
income to be spent during retirement.
2 www.fca.org.uk/firms/complaints-data/firm-level
FCA RESTRICTED

10
Financial Conduct AuthorityComplaints Data Analysis: 2017 H1
Most complained about products
Table 3 shows the top five most complained about products and the comparison with the previous period in 2016 H2. PPI still dominates the number of complaints making up a third of all complaints in 2017 H1. The number of PPI complaints increased by 24% from 899,000 to 1.11m. This change is largely unaffected by the reporting changes.
The figures for current accounts and credit cards shown in Table 3 may be affected by the reporting changes. This is because we expect these products to have a higher proportion of complaints closed by the next business day now being included in the data for the first time.
Motor and transport insurance and packaged bank account complaints also increased by 9% and 18% respectively when compared with 2016 H2. Much of this change is also the result of the reporting changes – these products were new to reporting in 2016 H2 and some firms will be reporting for the first time in 2017 H1.
Table 3 – Five most complained about products in 2017 H1
Product Product group 2016 H2 2017 H1 % change
Payment protection insurance
Insurance and pure protection
899,051 1,111,835 24%
Current accounts Banking and credit cards
514,317 518,579 1%
Credit cards Banking and credit cards
313,235 309,875 -1%
Motor and transport
Insurance and pure protection
219,815 240,497 9%
Packaged accounts
Banking and credit cards
172,240 203,510 18%
In Table 4, we can see the effect of the new reporting when we exclude the firms reporting for the first time in 2017 H1 from the data. This shows a more like-for-like comparison for these products, comparing data for those firms which reported in 2016 H2, with the same firms’ data reported in 2017 H1:
Table 4 – Two most complained about new product categories for 2016 H2 and 2017 H1 reporting firms only
Product Product group 2016 H2 2017 H1 % change
Motor and transport
Insurance and pure protection
219,815 220,277 0.21%
Packaged bank accounts
Banking and credit cards
172,240 195,746 13.6%
FCA RESTRICTED

11
Financial Conduct AuthorityComplaints Data Analysis: 2017 H1
Main reasons for complaints
In our new return, we classify the reasons for a complaint into five broad cause groups. Figure 2, below, shows the causes of complaints since 2016 H1.
‘Advising, selling and arranging’ is the top reason for complaints during 2017 H1, accounting for 43% of complaints. This compares with 59% of complaints in 2016 H1. ‘General administration and customer service’ accounted for 27% of all complaints in 2016 H1, these now account for 38% of all complaints. This suggests that administration and customer service complaints are resolved more quickly, whereas issues at the point of sale or advice typically take longer to resolve.
Figure 2 – Reasons or causes of complaints 2016 H1 to 2017 H1
2% 2%
1% 2%
43%
38%
16%
40%
17%
2%
2%
2016 H1
Advising, selling and arranging
General admin/customer service
Information, sums/charges or product performance
Arrears related
2016 H2 2017 H1
Other
39%27%
11%
59%
FCA RESTRICTED

12
Financial Conduct AuthorityComplaints Data Analysis: 2017 H1
For those firms submitting on a half yearly basis and for firms submitting 500 or more complaints within a half-year period, representing 97% of opened complaints reported to the FCA, these categories are then broken down further into ten cause categories.
Figure 3 provides this breakdown for 2017 H1. The top reasons for complaints were: unsuitable advice, accounting for 29% of all complaints in 2017 H1, then general administration and customer service, for 19% of all complaints.
Figure 3 – Reasons for causes of complaints 2017 H1
Other 50,713
54,574
58,990
175,195
267,557
274,081
337,483
453,599
616,463
951,171
0 200,000 400,000 600,000 800,000 1,000,000
Arrears related
Product disclosure information
Product performance/features
Delays/timescales
Disputes over sums/charges
Errors/not following instructions
Unclear guidance/arrangement
Other general admin/customer services
Unsuitable advice
FCA RESTRICTED

13
Financial Conduct AuthorityComplaints Data Analysis: 2017 H1
Complaints by product groups – highlights for 2017 H1
Figure 4 shows how complaints are split into the five product groups together with PPI, shown separately in 2017 H1.
Figure 4 – Complaints by product group 2017 H1
We provide more detailed analysis of each product group in the following tables, including contextualised data to compare the number of complaints per 1000 accounts, or similar.
Decumulation and pensions
Investments
Home �nance
Insurance and pure protection excluding PPI
PPI
Banking and credit cards
51,412
65,643
116,715
688,527
1,111,835
1,290,728
0 400,000 800,000 1,200,000
FCA RESTRICTED
14
Financial Conduct AuthorityComplaints Data Analysis: 2017 H1
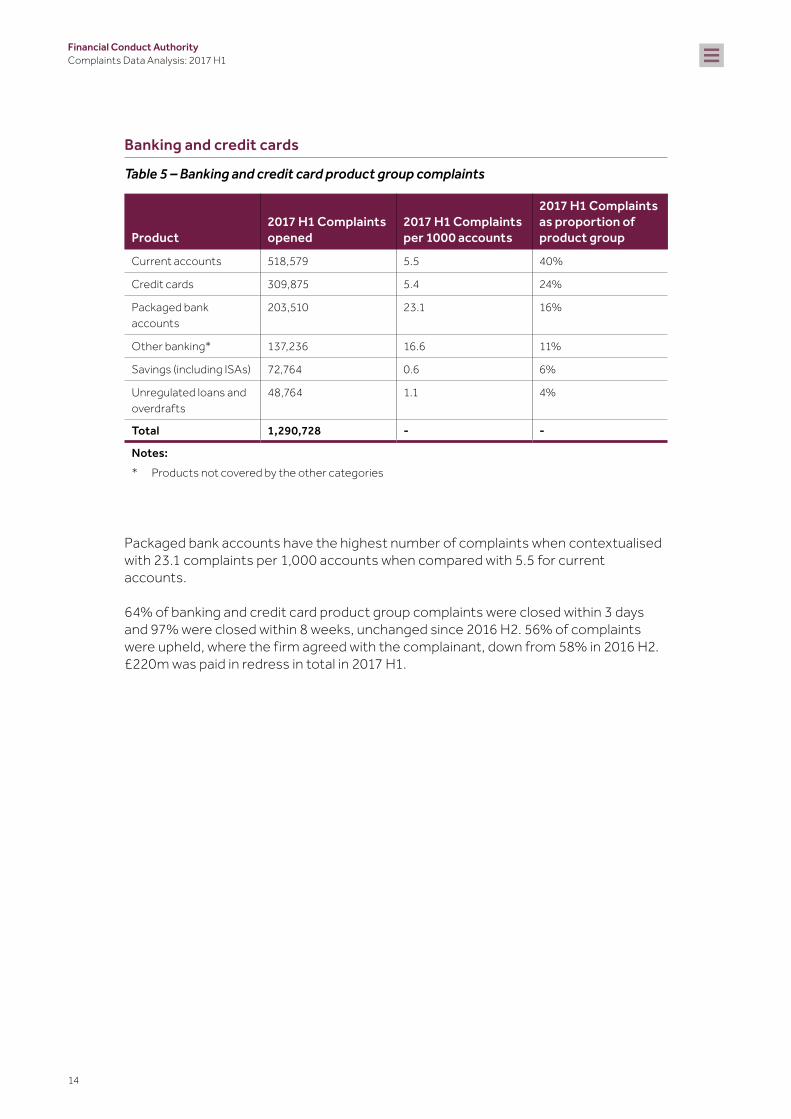
Banking and credit cards
Table 5 – Banking and credit card product group complaints
Product2017 H1 Complaints opened
2017 H1 Complaints per 1000 accounts
2017 H1 Complaints as proportion of product group
Current accounts 518,579 5.5 40%
Credit cards 309,875 5.4 24%
Packaged bank accounts
203,510 23.1 16%
Other banking* 137,236 16.6 11%
Savings (including ISAs) 72,764 0.6 6%
Unregulated loans and overdrafts
48,764 1.1 4%
Total 1,290,728 - -
Notes: * Products not covered by the other categories
Packaged bank accounts have the highest number of complaints when contextualised with 23.1 complaints per 1,000 accounts when compared with 5.5 for current accounts.
64% of banking and credit card product group complaints were closed within 3 days and 97% were closed within 8 weeks, unchanged since 2016 H2. 56% of complaints were upheld, where the firm agreed with the complainant, down from 58% in 2016 H2. £220m was paid in redress in total in 2017 H1.
FCA RESTRICTED
15
Financial Conduct AuthorityComplaints Data Analysis: 2017 H1
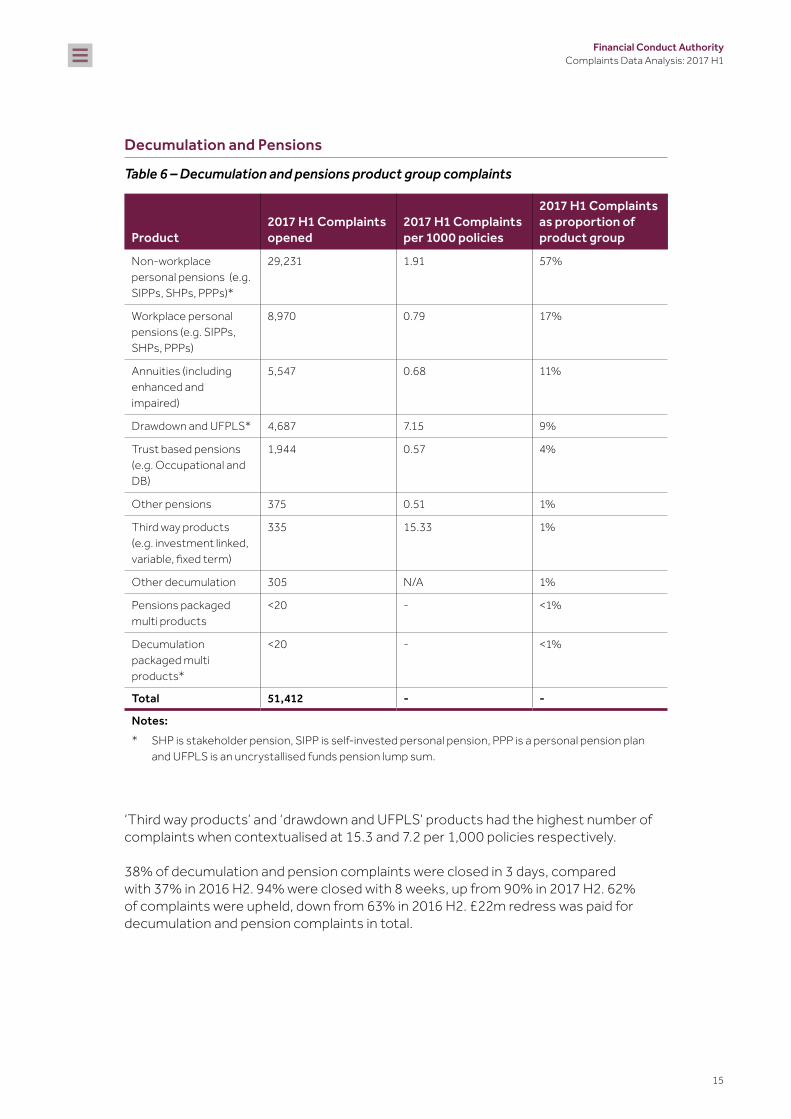
Decumulation and Pensions
Table 6 – Decumulation and pensions product group complaints
Product2017 H1 Complaints opened
2017 H1 Complaints per 1000 policies
2017 H1 Complaints as proportion of product group
Non-workplace personal pensions (e.g. SIPPs, SHPs, PPPs)*
29,231 1.91 57%
Workplace personal pensions (e.g. SIPPs, SHPs, PPPs)
8,970 0.79 17%
Annuities (including enhanced and impaired)
5,547 0.68 11%
Drawdown and UFPLS* 4,687 7.15 9%
Trust based pensions (e.g. Occupational and DB)
1,944 0.57 4%
Other pensions 375 0.51 1%
Third way products (e.g. investment linked, variable, fixed term)
335 15.33 1%
Other decumulation 305 N/A 1%
Pensions packaged multi products
<20 - <1%
Decumulation packaged multi products*
<20 - <1%
Total 51,412 - -
Notes: * SHP is stakeholder pension, SIPP is self-invested personal pension, PPP is a personal pension plan
and UFPLS is an uncrystallised funds pension lump sum.
‘Third way products’ and ‘drawdown and UFPLS’ products had the highest number of complaints when contextualised at 15.3 and 7.2 per 1,000 policies respectively.
38% of decumulation and pension complaints were closed in 3 days, compared with 37% in 2016 H2. 94% were closed with 8 weeks, up from 90% in 2017 H2. 62% of complaints were upheld, down from 63% in 2016 H2. £22m redress was paid for decumulation and pension complaints in total.
FCA RESTRICTED

16
Financial Conduct AuthorityComplaints Data Analysis: 2017 H1
Home finance, including mortgages
Table 7 – Home finance product group complaints
Product2017 H1 Complaints opened
2017 H1 Complaints per 1000 balances outstanding
2017 H1 Complaints as proportion of product group
Other regulated home finance products
94,203 10.19 81%
Other unregulated home finance products
15,614 5.70 13%
Second and subsequent charge
3,244 42.40 3%
Impaired credit 2,531 30.65 2%
Equity Release 1,123 5.73 1%
Total 116,715 - -
Second and subsequent charge mortgages had the highest number of complaints when contextualised with 42.4 complaints per 1,000 balances outstanding. Impaired credit had the second highest with 30.7.
51% of home finance complaints were closed within 3 days, up from 45% in 2016 H2. 96% were closed within 8 weeks, compared with 95% in 2016 H2. 58% of complaints were upheld, down from 60% in 2016 H2. £20m in redress was paid out in total, the lowest amount of all the product groups.
FCA RESTRICTED

17
Financial Conduct AuthorityComplaints Data Analysis: 2017 H1
Insurance and pure protection
Table 8 – Insurance and pure protection product group complaints
Product2017 H1 Complaints opened
2017 H1 Complaints per 1000 policies
2017 H1 Complaints as proportion of product group
Payment protection insurance
1,111,835 39.55 62%
Motor and transport 240,497 6.47 13%
Other general insurance
185,975 3.46 10%
Property 81,145 2.53 5%
Assistance 41,229 2.37 2%
Medical/health 38,547 4.35 2%
Whole of life/term assurance/critical illness
27,536 0.93 2%
Travel 24,658 2.07 1%
Warranty 19,755 2.17 1%
Pet 15,292 3.74 1%
Income protection and other accident, sickness and unemployment
6,260 0.63 <1%
General insurance packaged multi products
4,620 0.38 <1%
Other pure protection 2,217 0.52 <1%
Protection packaged multi products
796 2.66 <1%
Total 1,800,362 - -
PPI had the highest number of complaints when contextualised at 39.6 per 1,000 policies in force. This figure may also include past polices. This was followed by motor and transport insurance with 6.5 per 1,000 policies in force and medical or health insurance with 4.4.
Including PPI, 28% of insurance and pure protection complaints were closed in 3 days, compared with 27% in 2016 H2. 95% were closed within 8 weeks, down from 97% in 2016 H2. 61% of complaints were upheld, compared with 63% in 2016 H2. £1.68bn was paid out in redress, 84% of all redress, the same percentage as 2016 H2.
FCA RESTRICTED

18
Financial Conduct AuthorityComplaints Data Analysis: 2017 H1
Excluding PPI, 56% of insurance and pure protection complaints were closed in 3 days compared with 59% in 2016 H1. 95% were closed within 8 weeks compared with 97% in 2016 H2. 58% of complaints were upheld compared with 59% in 2016 H2. £41m was paid out in redress in total in 2017 H1. The data are available only for firms reporting more than 500 complaints within the period, representing 97% of all opened complaints reported to the FCA (excluding consumer credit complaints).
Investments
Table 9 – Investments product group complaints
Product2017 H1 Complaints opened
2017 H1 Complaints per 1000 client accounts
2017 H1 Complaints as proportion of product group
Endowments 15,946 3.72 24%
ISAs (where investment held)
15,496 2.65 24%
Platforms 7,729 5.60 12%
Investment bonds 7,527 2.29 11%
Unit trusts/OEICs 5,306 1.34 8%
Other investment products/funds
4,960 0.57 8%
FX/CFD/Spreadbetting 3,471 N/A 5%
Non-discretionary management services
1,661 0.88 3%
Structured products 1,355 7.74 2%
Discretionary management services
1,271 6.63 2%
Investment trusts 543 22.25 1%
Crowdfunding / Peer to Peer
191 <1%
UCITS 139 3.28 <1%
Investment packaged multi products
<100 0.90 <1%
ETPs <50 N/A <1%
Total 65,643 - -
Notes: ISA is individual savings account, OEICs is open ended investment company, FX is foreign exchange, CFD is contract for difference, UCITS is undertakings in collective investments in transferable securities, ETP is exchange traded products
FCA RESTRICTED

19
Financial Conduct AuthorityComplaints Data Analysis: 2017 H1
Investment trusts had the highest number of complaints when contextualised with 22.25 complaints per 1,000 client accounts. Despite the relatively low numbers of complaints for this product, the context figures indicate that consumers are more likely to raise complaints when compared with other investment products. The majority of complaints regarding investment trusts, 85%, were regarding administration and customer service in 2017 H1. This compares with 59% for investment complaints overall.
38% of investments complaints were closed within 3 days, compared with 35% in 2016 H2. 93% were closed within 8 weeks compared with 92% in 2016 H2. 49% of complaints were upheld, the lowest of all the product groups. £47m was paid out in total redress, the third highest amount after PPI and all banking and credit card products.
FCA RESTRICTED

20
Financial Conduct AuthorityComplaints Data Analysis: 2017 H1
Outcomes for consumers
Below we show how complaints were handled in 2017 H1, comparing the different product groups as discussed above. We can see the proportion of complaints that were upheld, how quickly they were closed by firms and how much redress was paid.
Percentage of complaints upheld by product group
The percentage of complaints upheld has fallen for all product groups when compared with 2016 H2. Figure 5 shows that complaints about decumulation and pension products continue to have the highest uphold rate at 62%. Complaints about investment products continue to have the lowest uphold rate in 2017 H1, with 49% upheld, compared with 51% in 2016 H2.
Figure 5 – Percentage of complaints upheld by product group 2016 H2 and 2017 H1
The Financial Ombudsman Service3 also publishes data on complaints4 which are referred to them by consumers. Out of the total number of complaints reported to the FCA, approximately 5% are then referred to the Ombudsman, though this may vary between products. According to their latest Annual Review5, they upheld 43% of complaints overall in 2016/2017, varying from 52% for PPI to 19% for packaged bank accounts.
3 www.financial-ombudsman.org/default.htm4 www.financial-ombudsman.org/publications/complaints-data.html5 www.financial-ombudsman.org/publications/annual-review-2017/index.html
0%Banking andcredit cards
58% 56%
63%62% 60%
58%
63%61%
51%49%
Decumulation andpensions
Home �nance Insurance andpure protection
Investments
10%
20%
30%
40%
40%
60%
70%
2016 H2 2017 H1
FCA RESTRICTED

21
Financial Conduct AuthorityComplaints Data Analysis: 2017 H1
Percentage of complaints closed within 3 days and 8 weeks, by product group
The percentage of complaints closed within 3 days has increased since 2016 H1 across all product groups. The percentage of complaints closed within 8 weeks has also increased when compared with 2016 H2, with the exception of insurance and pure protection products which includes PPI.
We can see in Figure 6 that there is quite a wide variation in the percentage of complaints closed within 3 days between product groups. If you exclude PPI products from insurance and pure protection products, 56% of complaints were closed within 3 days. This is down from 59% when compared with 2016 H2.
Nearly two-thirds of banking or credit card products were closed within 3 days, unchanged when compared with 2016 H2. Over a third of decumulation and pension product complaints and investment product complaints were closed within 3 days.
Figure 6 – Percentage of complaints closed within three days and eight weeks by product group 2017 H1
0%
10%
20%
30%
40%
50%
60%
70%
80%
90%
100%
Banking andcredit cards
Decumulation andpensions
Home �nance Insurance andpure protection
Investments
64%
97%
38%
94%
51%
96%
ExcludingPPI 56%
28%
95%
38%
93%
Closed within three days Closed within eight weeks
FCA RESTRICTED

22
Financial Conduct AuthorityComplaints Data Analysis: 2017 H1
Redress paid by product group
In total just under £1.99 billion has been paid out in redress in 2017 H1 – this has been broken down in Figure 7. Over 95% of redress paid for insurance and pure protection products was for PPI.
Figure 7 – Total redress paid by product group 2017 H1
* Data breakdown for PPI redress is only available for firms reporting 500 or more complaints within 2017 H1 representing 97% of opened complaints in 2017 H2.
Millions
£200.0
£400.0
£600.0
£800.0
£1,000.0
£1,200.0
£1,400.0
£1,600.0
£1,800.0
PPI* Banking andcredit cards
Investments Insurance andpure protectionexcluding PPI*
Decumulationand pensions
Home �nance
£1,629.0m
£219.9m
£47.4m £41.1m £22.1m £20.1m
FCA RESTRICTED

23
Financial Conduct AuthorityComplaints Data Analysis: 2017 H1
Annex: Changes to the data to note for 2017 H1
H1 means first half of the year (1 January to 30 June). H2 means second half of the year (1 July to 31 December).
Following changes to our rules in December 2015, as outlined in PS15/19, the data firms now report to us, on their complaints, have changed. Although not fully comparable to historic data that we’ve published, we believe the new data set is more informative:
• it provides an increased product breakdown
• it puts the number of complaints into context in relation to the size of each business
• and as a result gives us a better understanding of what is happening within the sectors we regulate
These changes came into effect in 2016 H2 and applied to the majority of the data (90% of the complaints) submitted to us during the reporting period.
The changes now affect the total number of complaints published
These rule changes also increase the overall number of complaints reported to us, as all complaints are now covered. Previously complaints closed before the end of the next business day were not included in the data.
The total number of opened complaints reported in 2016 H2 was 3.04 million. Complaints numbers reported have since increased to 3.32 million in 2017 H1. Some of this increase could be due to firms now reporting via the new return and therefore reporting a higher number of complaints. More explanation and breakdown is provided below.
Firms’ reporting periods have affected the data
In 2017 H1, all firms are submitting the new return. As a result, this increases the overall number of complaints when compared to the previous half year. It caused increases in some product categories as they are reported by some firms for the first time.
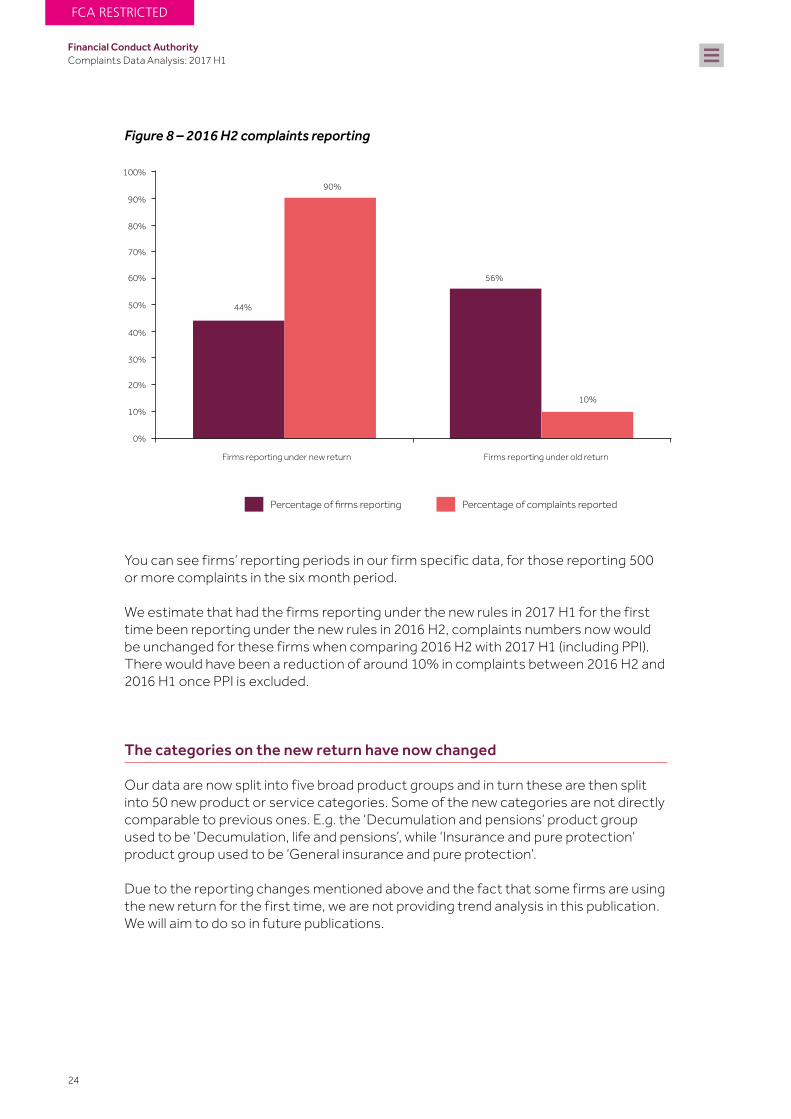
In 2016 H2, only 44% of firms submitted data using the new return. Firms submit their data to us in line with their own financial year-end date with different reporting periods. As a result, not all firms submitted the new return in 2016 H2 as they reported their return before the changes were applied. Firms using the new return accounted for approximately 90% of complaints.
FCA RESTRICTED
24
Financial Conduct AuthorityComplaints Data Analysis: 2017 H1
Figure 8 – 2016 H2 complaints reporting
You can see firms’ reporting periods in our firm specific data, for those reporting 500 or more complaints in the six month period.
We estimate that had the firms reporting under the new rules in 2017 H1 for the first time been reporting under the new rules in 2016 H2, complaints numbers now would be unchanged for these firms when comparing 2016 H2 with 2017 H1 (including PPI). There would have been a reduction of around 10% in complaints between 2016 H2 and 2016 H1 once PPI is excluded.
The categories on the new return have now changed
Our data are now split into five broad product groups and in turn these are then split into 50 new product or service categories. Some of the new categories are not directly comparable to previous ones. E.g. the ‘Decumulation and pensions’ product group used to be ‘Decumulation, life and pensions’, while ‘Insurance and pure protection’ product group used to be ‘General insurance and pure protection’.
Due to the reporting changes mentioned above and the fact that some firms are using the new return for the first time, we are not providing trend analysis in this publication. We will aim to do so in future publications.
0%
10%
20%
30%
40%
50%
60%
70%
80%
90%
100%
Firms reporting under new return
44%
90%
56%
10%
Firms reporting under old return
Percentage of �rms reporting Percentage of complaints reported
FCA RESTRICTED

25
Financial Conduct AuthorityComplaints Data Analysis: 2017 H1
Other aspects to consider when looking at our new complaints data
Our analysis is based on the data given to us by firms in the new return. This means that our analysis may be subject to possible reporting errors as firms get used to submitting the new data to us. We have carried out checks to identify and correct errors where we can.
Consumer credit complaints data
The aggregate data do not include complaints against firms that are only authorised to carry out consumer credit related activities. This is because not all firms have been authorised yet. We expect to be able to report for the majority of consumer credit firms in Autumn 2018.
FCA RESTRICTED

© Financial Conduct Authority 201725 The North Colonnade Canary Wharf London E14 5HSTelephone: +44 (0)20 7066 1000Website: www.fca.org.ukAll rights reserved
Pub ref: 001150