Compiler-assisted Performance Analysis - LLVM · Compiler-assisted Performance Analysis Adam Nemet...
90
Transcript of Compiler-assisted Performance Analysis - LLVM · Compiler-assisted Performance Analysis Adam Nemet...

Compiler Optimization
X, Y
2
User
Hotspot
Bottleneck
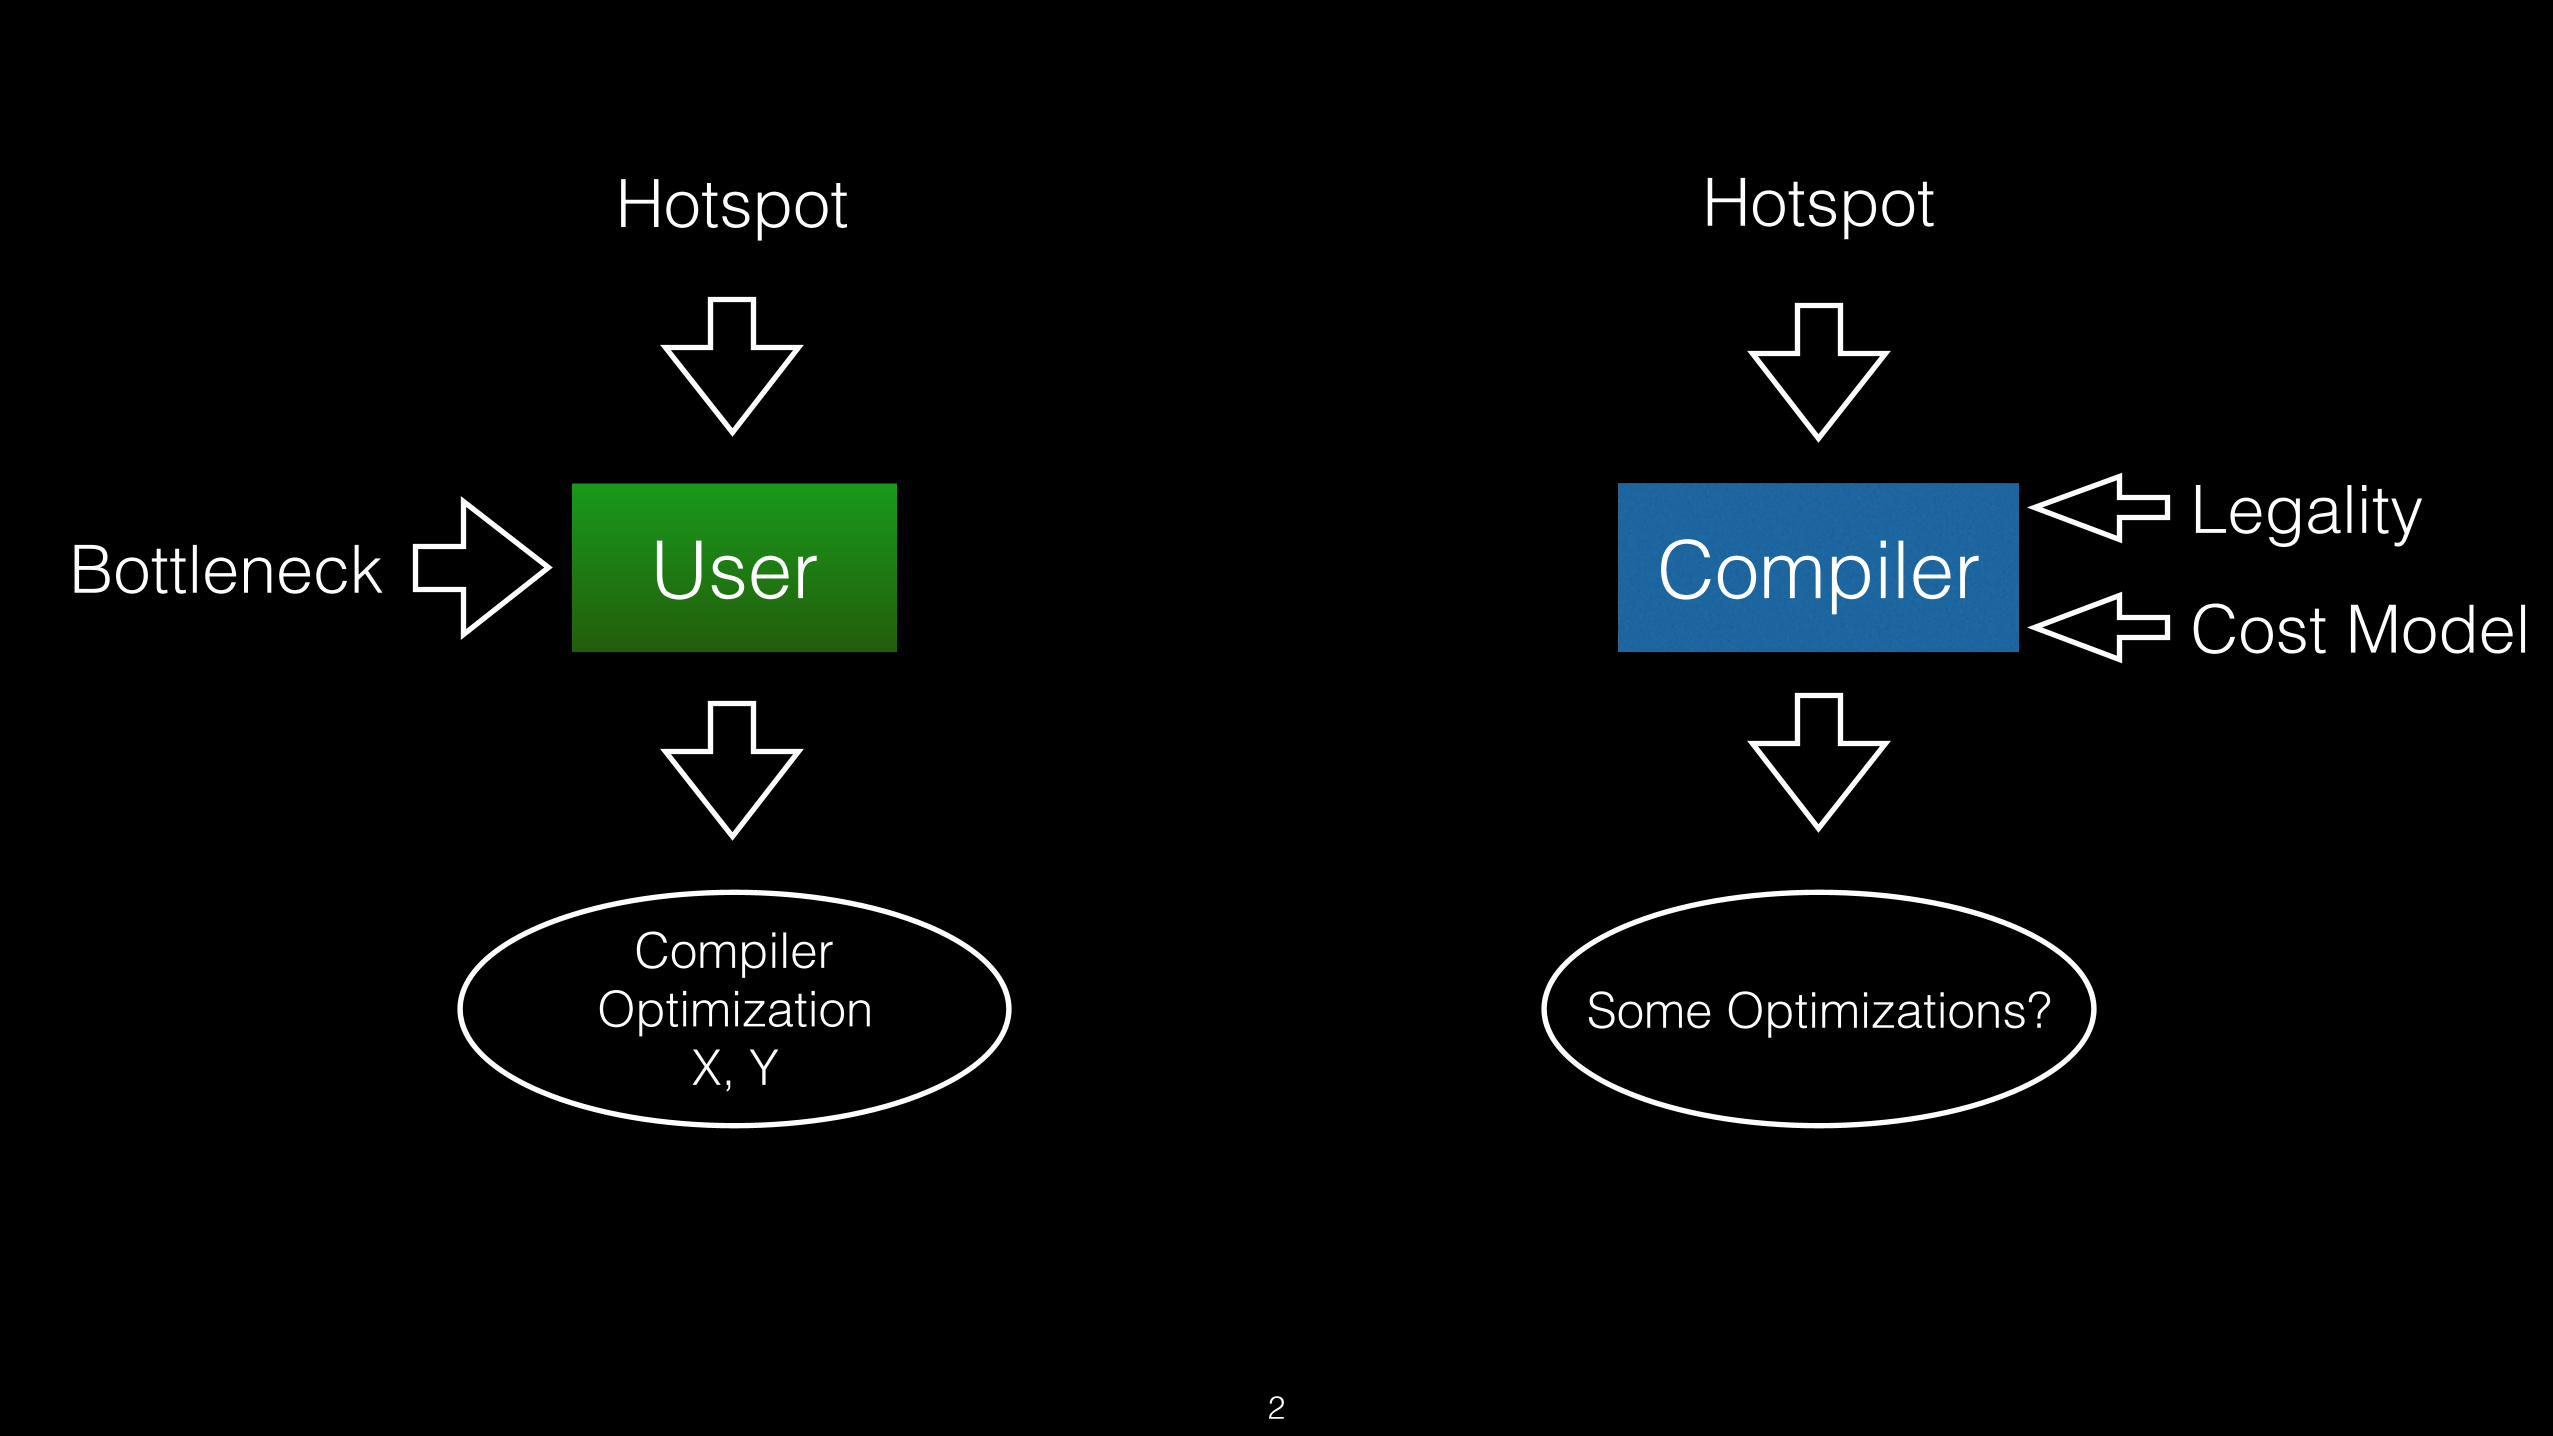
Some Optimizations?Compiler
Optimization X, Y
2
User
Hotspot
Bottleneck Compiler
Hotspot
LegalityCost Model
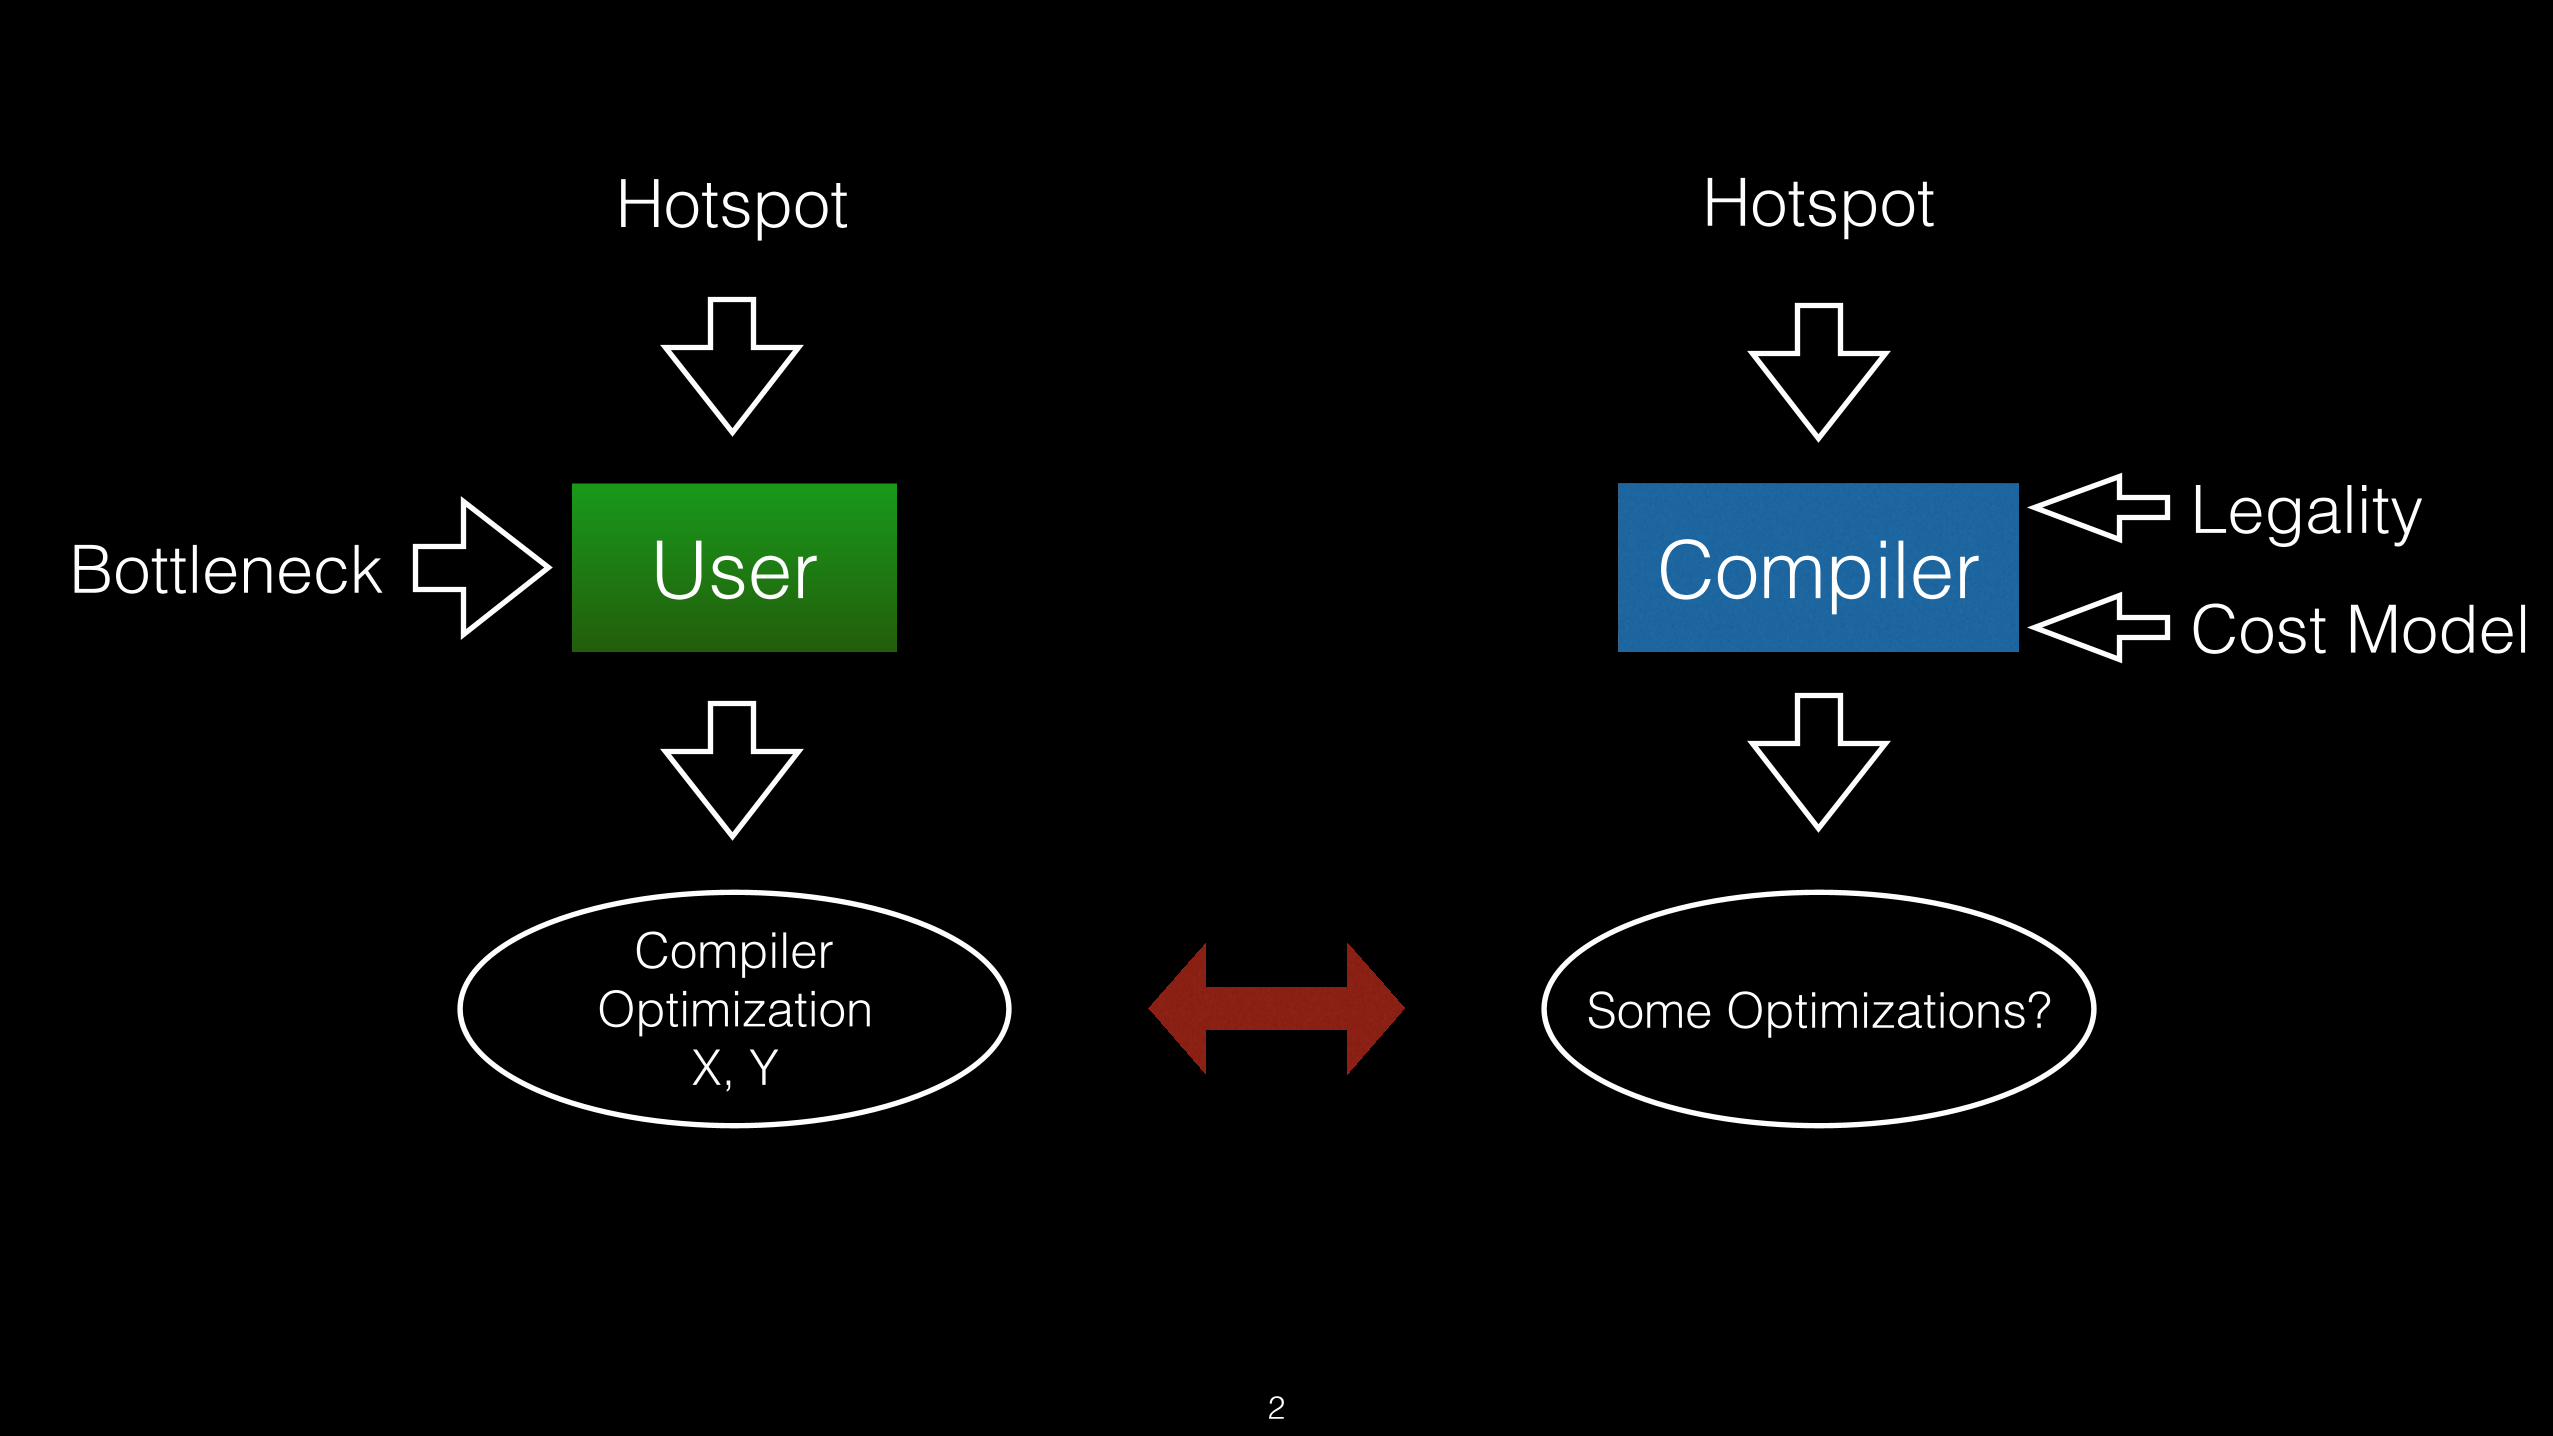
Some Optimizations?Compiler
Optimization X, Y
2
User
Hotspot
Bottleneck Compiler
Hotspot
LegalityCost Model

Some Optimizations?Compiler
Optimization X, Y
Disassemble
2
User
Hotspot
Bottleneck Compiler
Hotspot
LegalityCost Model

-debug-only
Some Optimizations?Compiler
Optimization X, Y
2
User
Hotspot
Bottleneck Compiler
Hotspot
LegalityCost Model

Optimization Diagnostics
Some Optimizations?Compiler
Optimization X, Y
2
User
Hotspot
Bottleneck Compiler
Hotspot
LegalityCost Model

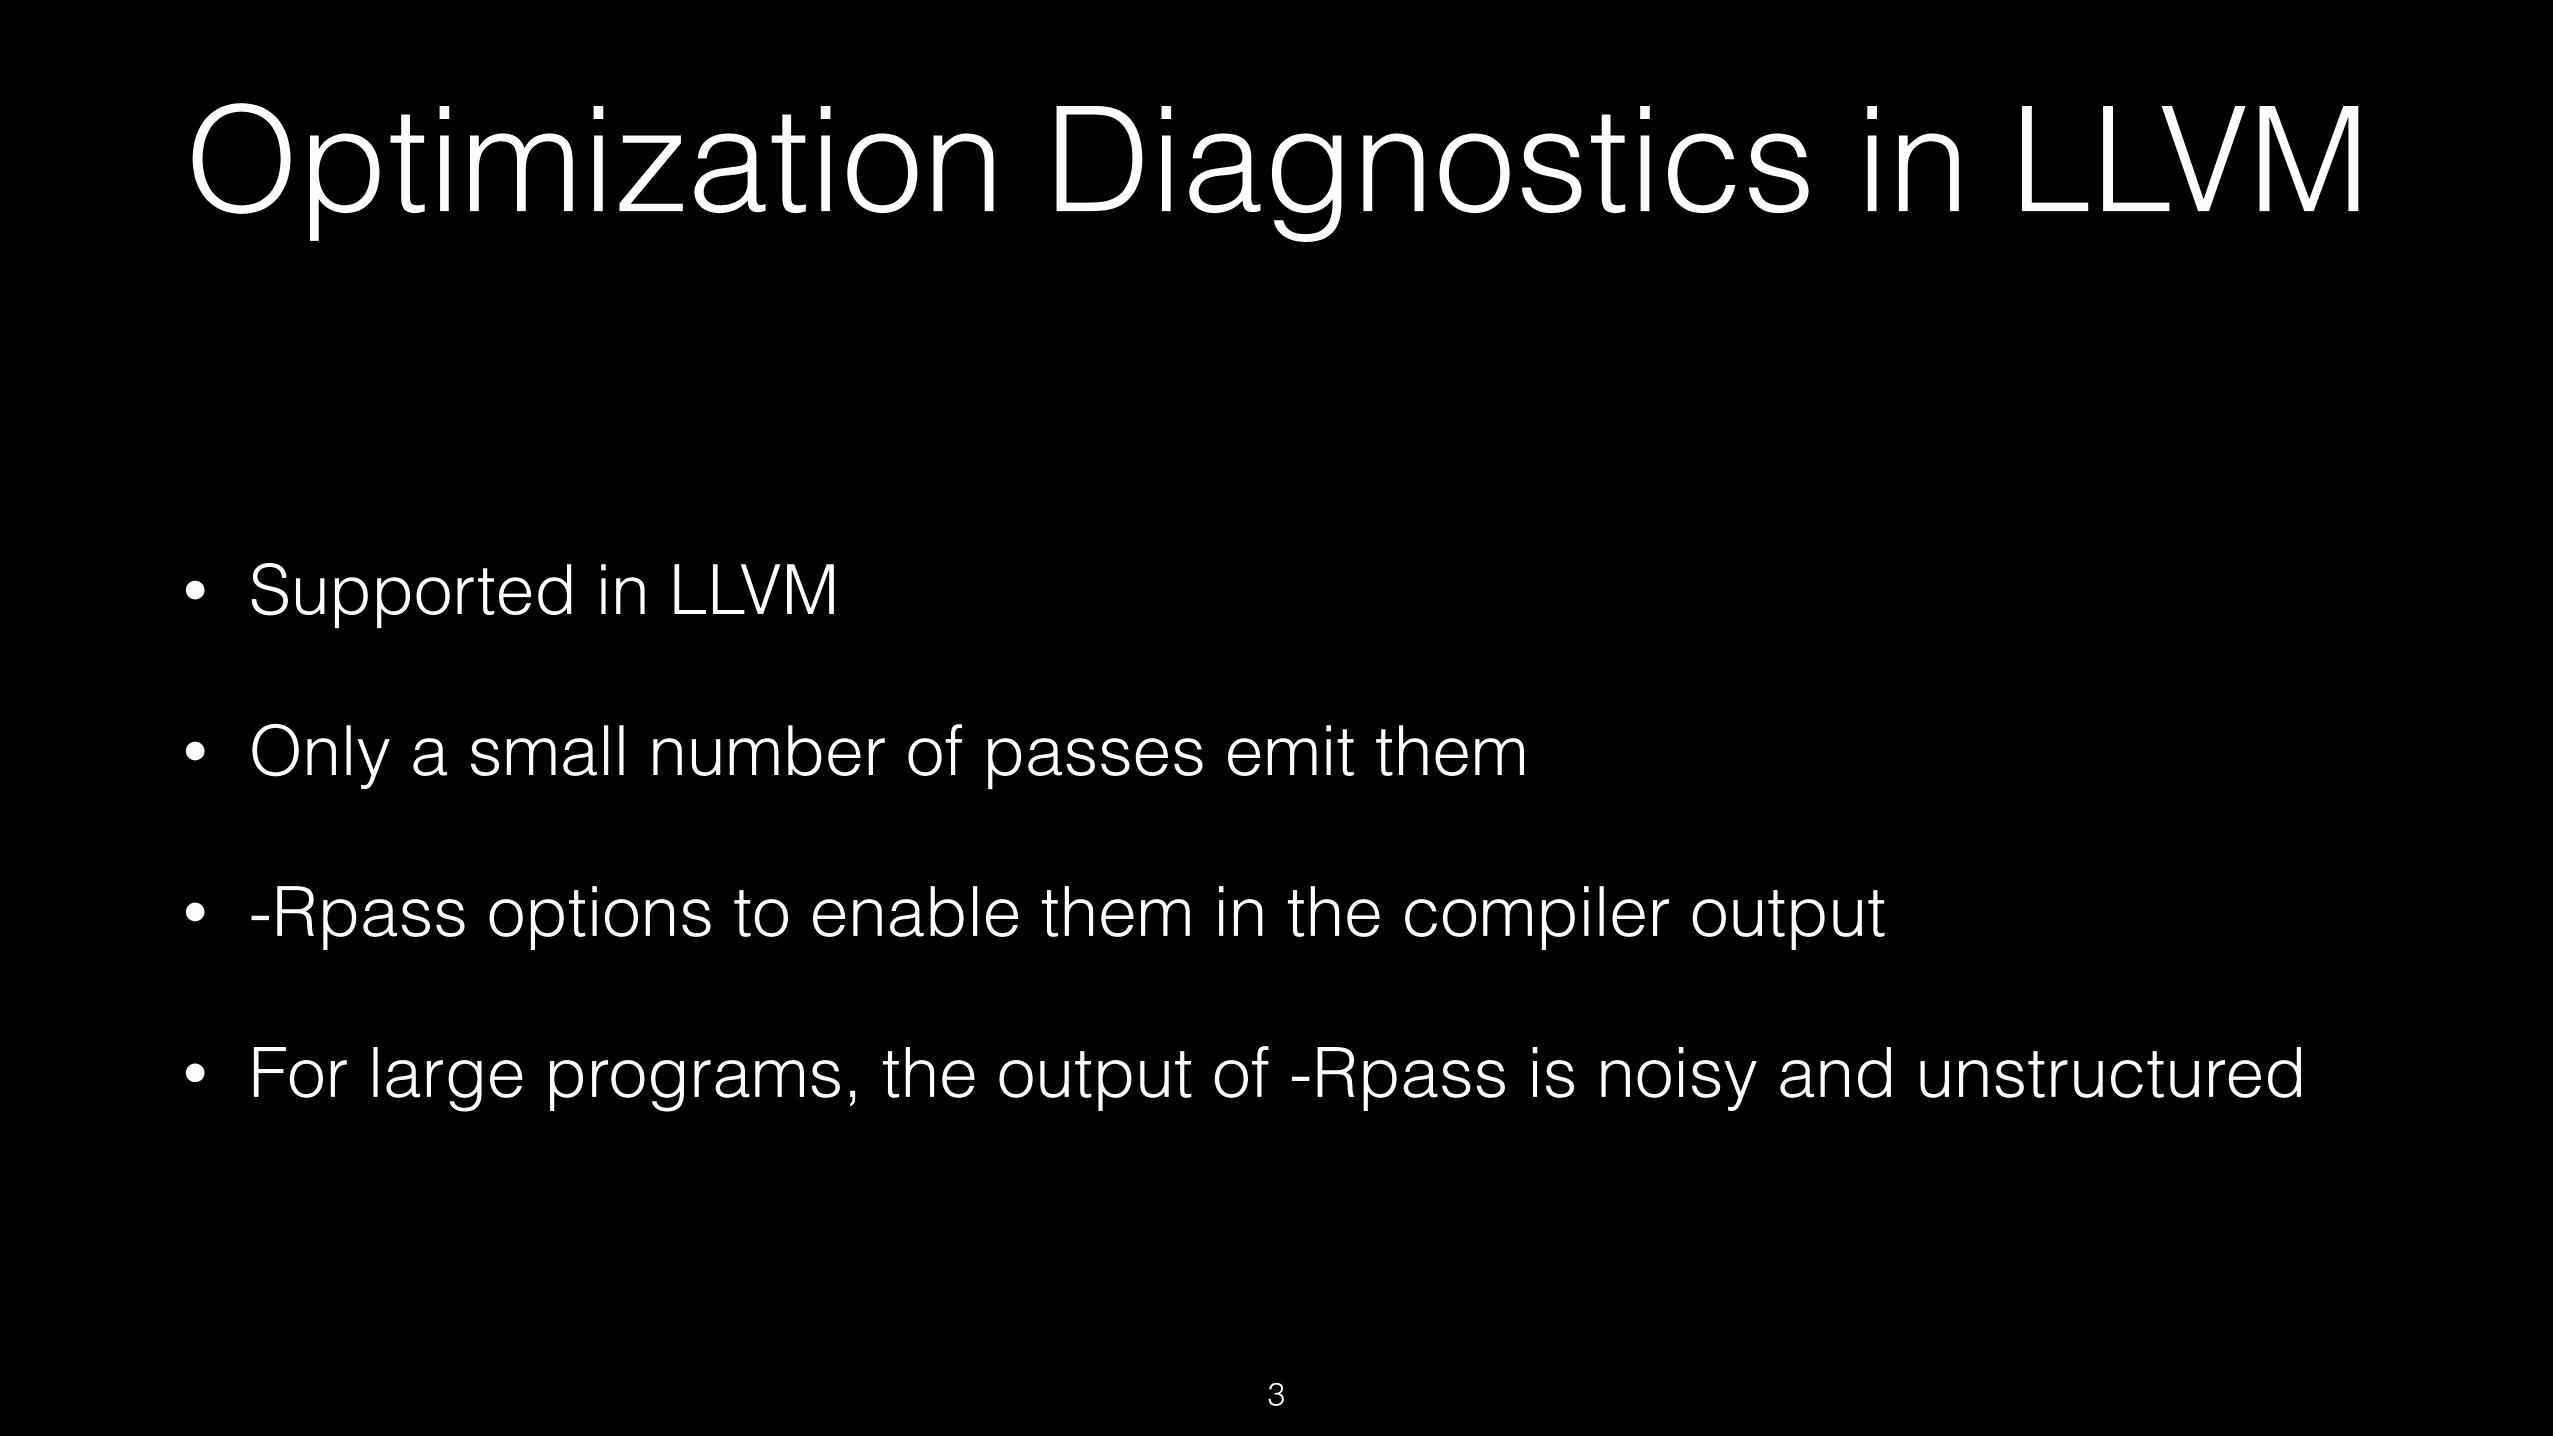
Optimization Diagnostics in LLVM
• Supported in LLVM
• Only a small number of passes emit them
• -Rpass options to enable them in the compiler output
3
foo.c:8:5: remark: accumulate inlined into compute_sum[-Rpass=inline] accumulate(arr[i], sum); ^
Optimization Diagnostics in LLVM
• Supported in LLVM
• Only a small number of passes emit them
• -Rpass options to enable them in the compiler output
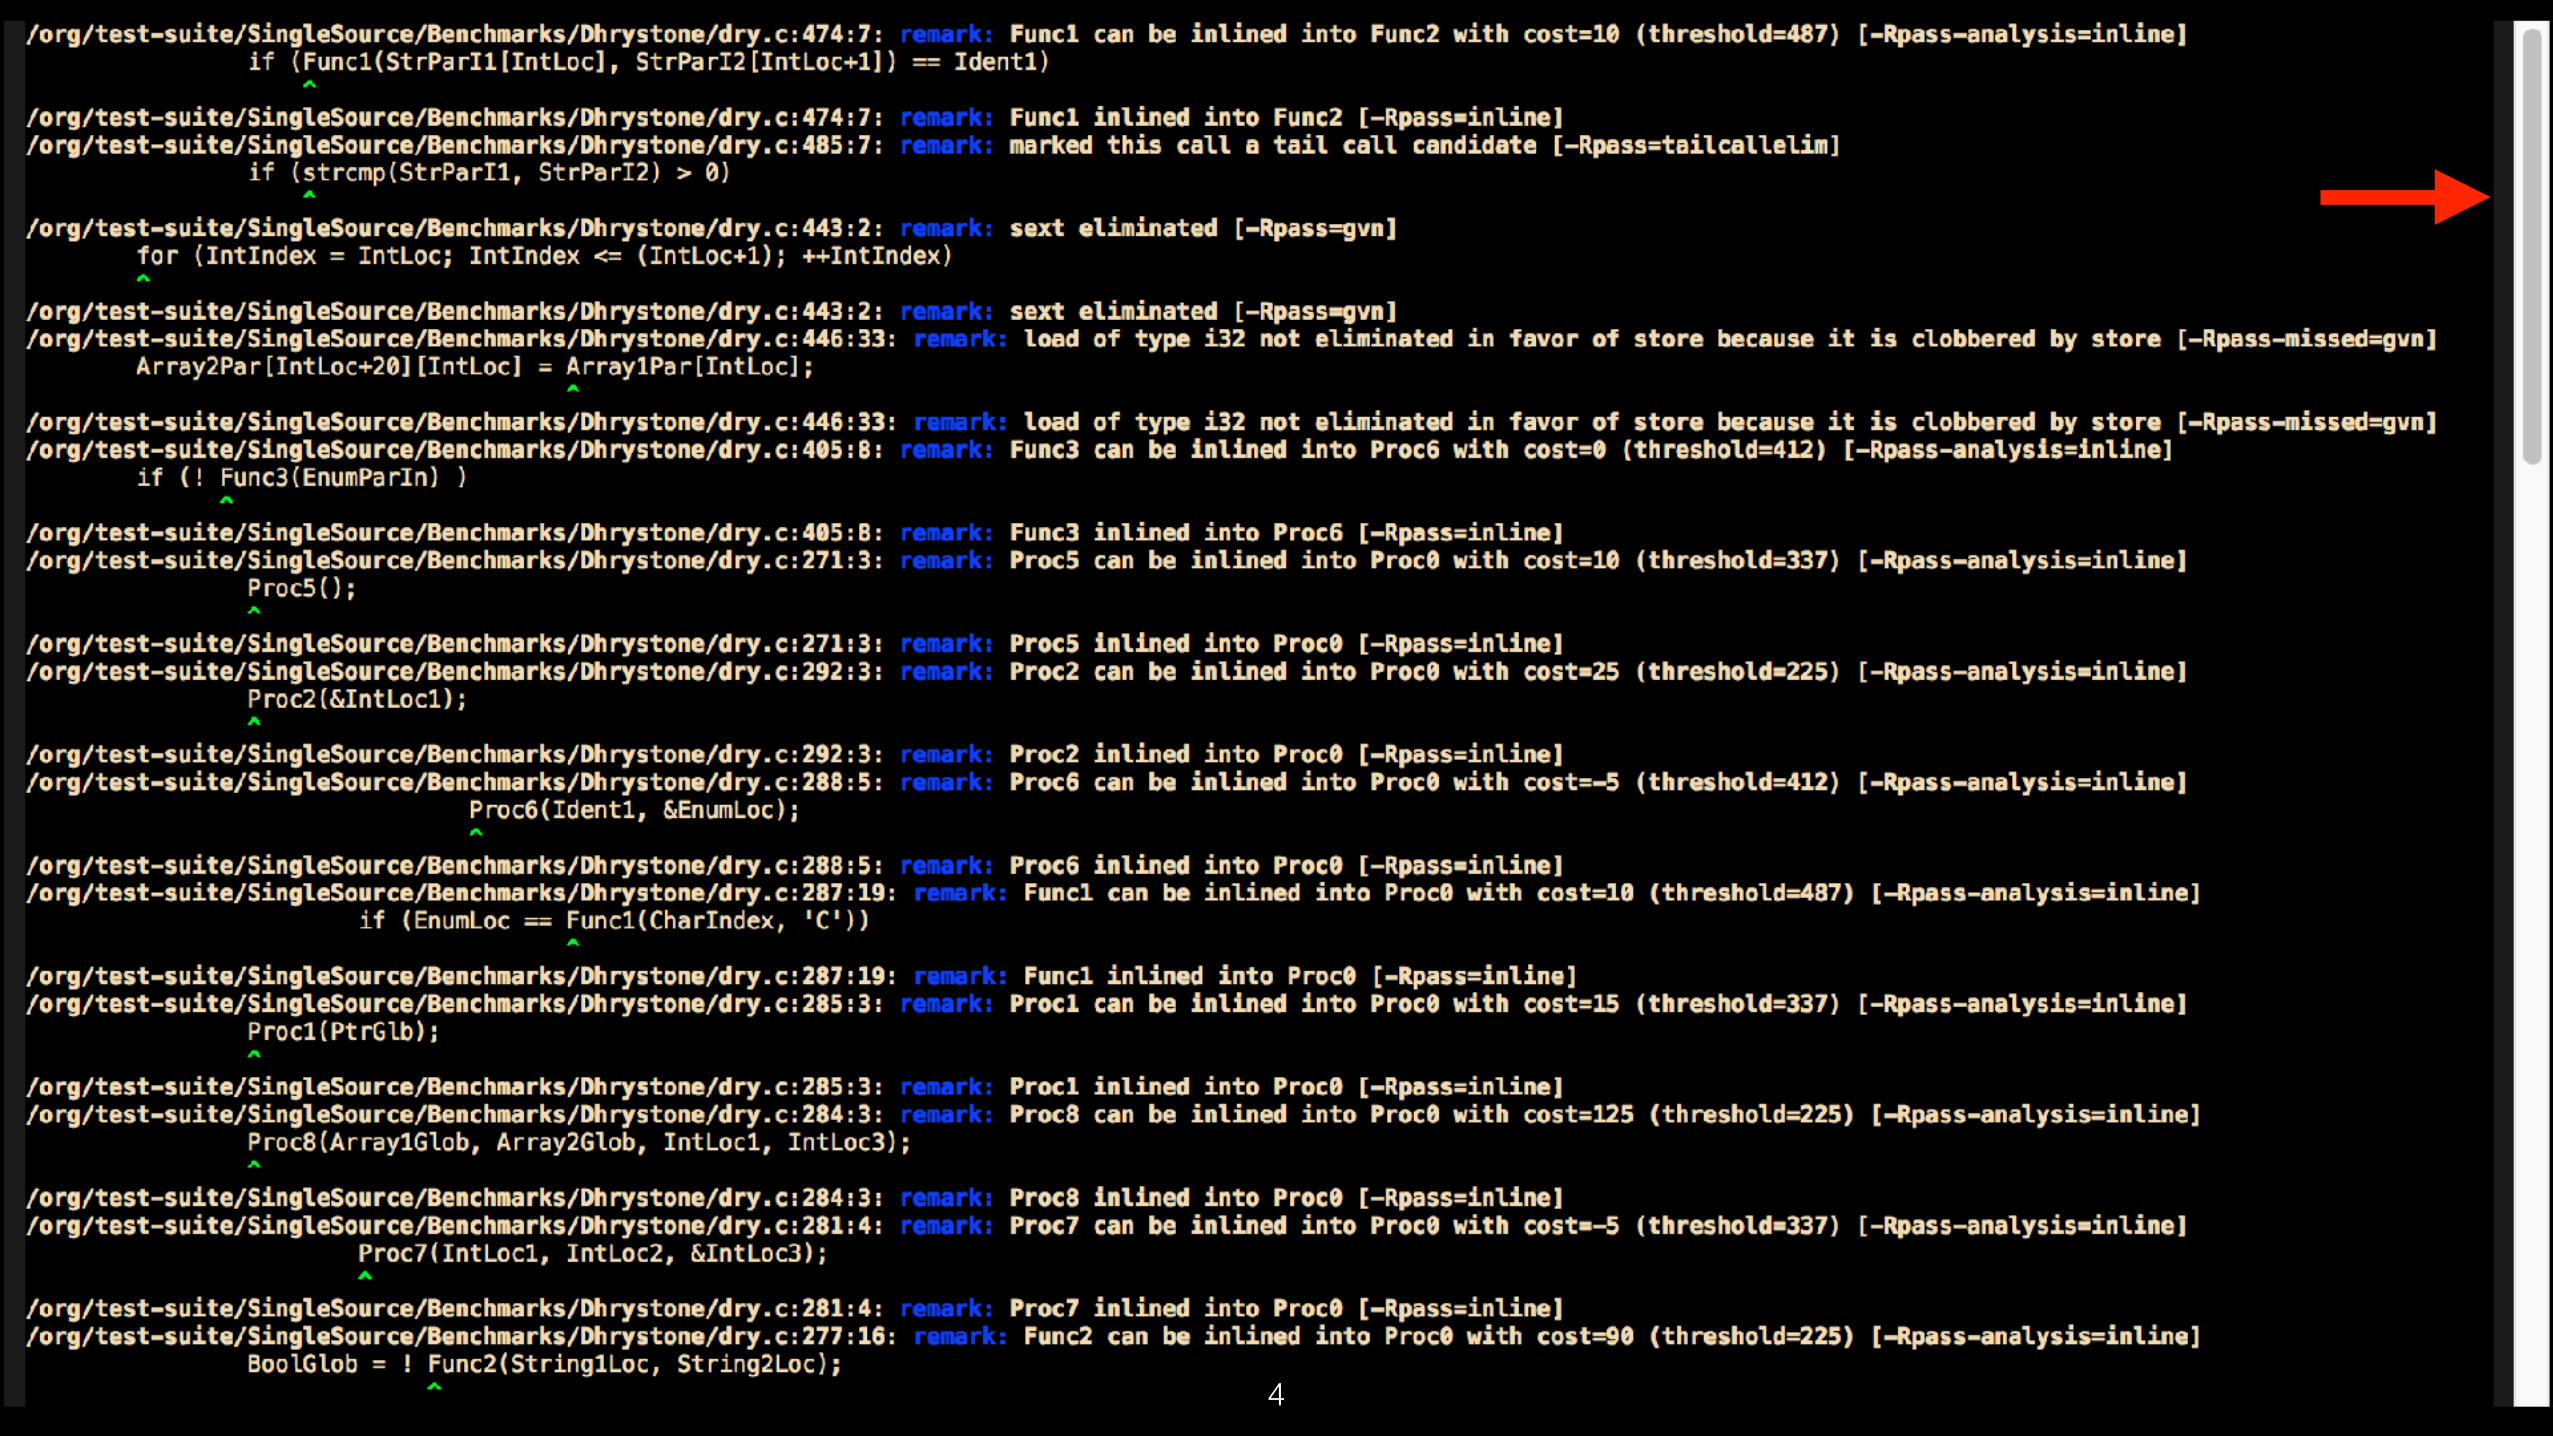
• For large programs, the output of -Rpass is noisy and unstructured
3
4

4
Remarks for hot and coldcode are intermixed
Messages appearin no particular order
Messages from successful and failedoptimizations are dumped together
How can we make this information
accessible and actionable?

Wish List
• All in one place: Optimizations Dashboard
• At a glance: See high-level interaction between optimizations for targeted low-level debugging
• Filtering: Noise-level should be minimized by focusing on the hot code
• Integration: Display hot code and the optimizations side-by-side
5

opt-viewer
6

Approach
• Extend existing optimization remark infrastructure
• Add the new optimizations
• Add ability to output remarks to a data file
• Visualize data in HTML
• Targeting compiler developers initially
7

Example
9
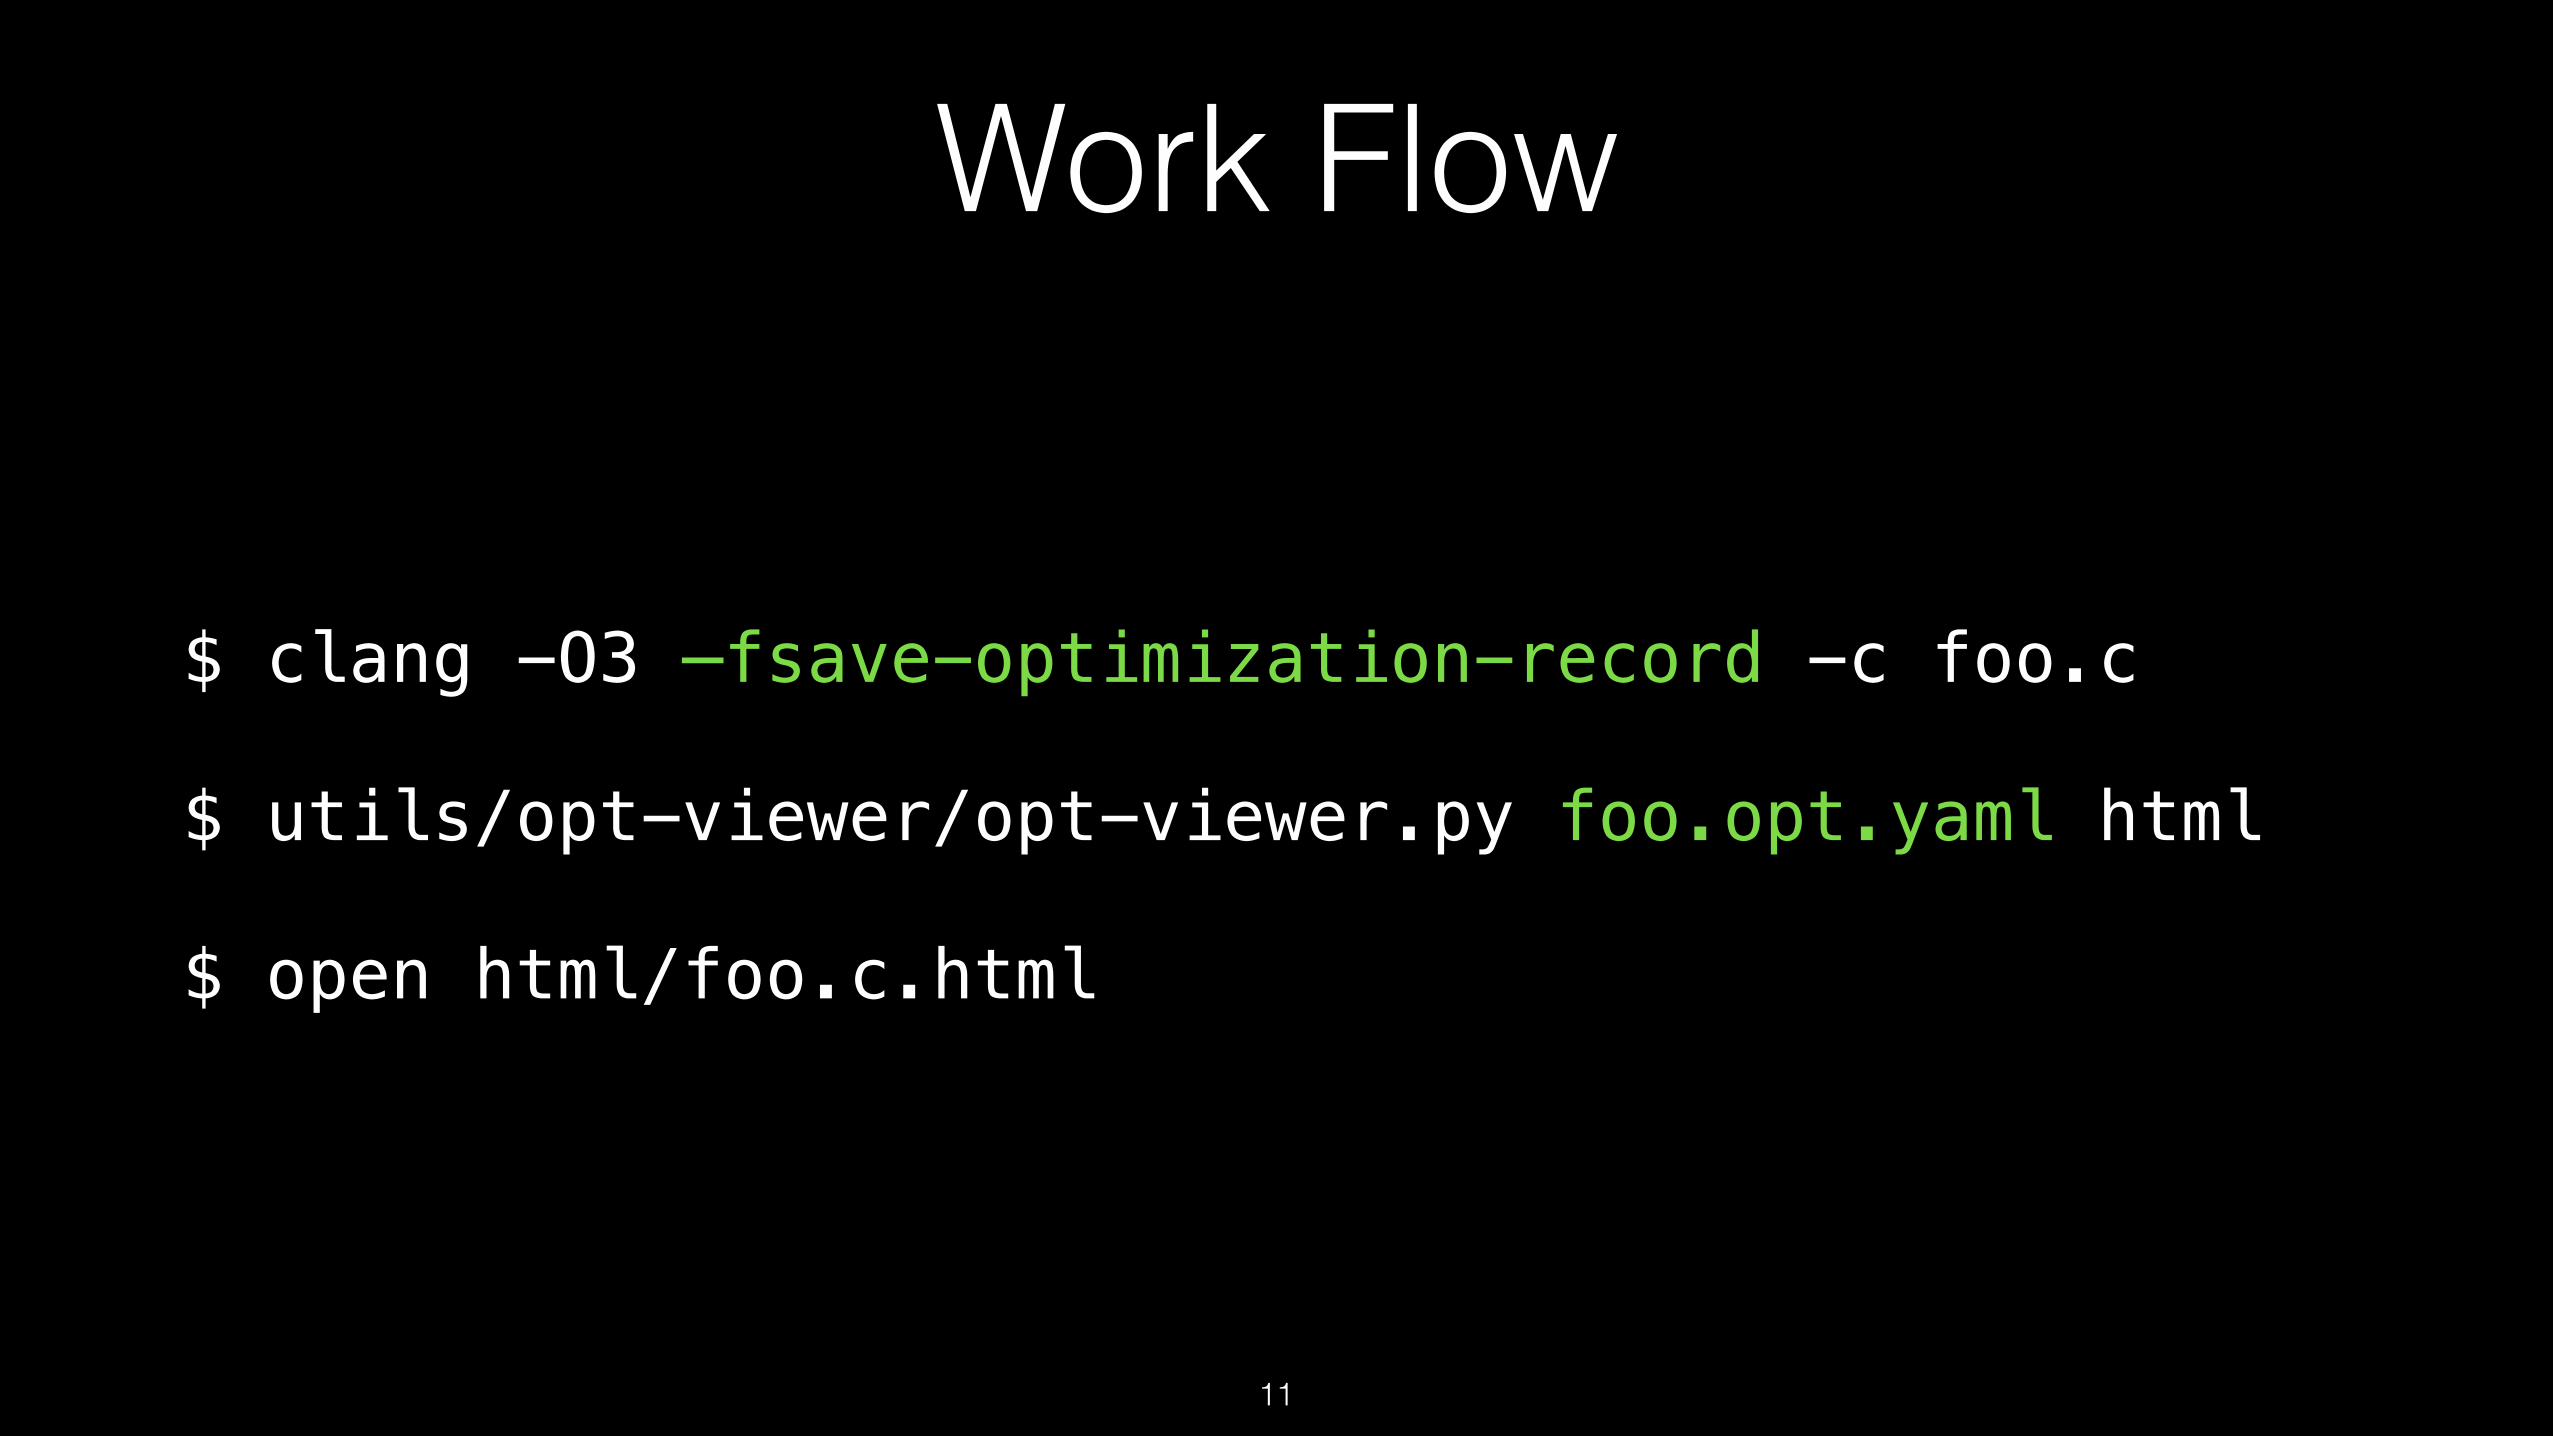
Work Flow
$ clang -O3 —fsave-optimization-record -c foo.c
$ utils/opt-viewer/opt-viewer.py foo.opt.yaml html
$ open html/foo.c.html
11
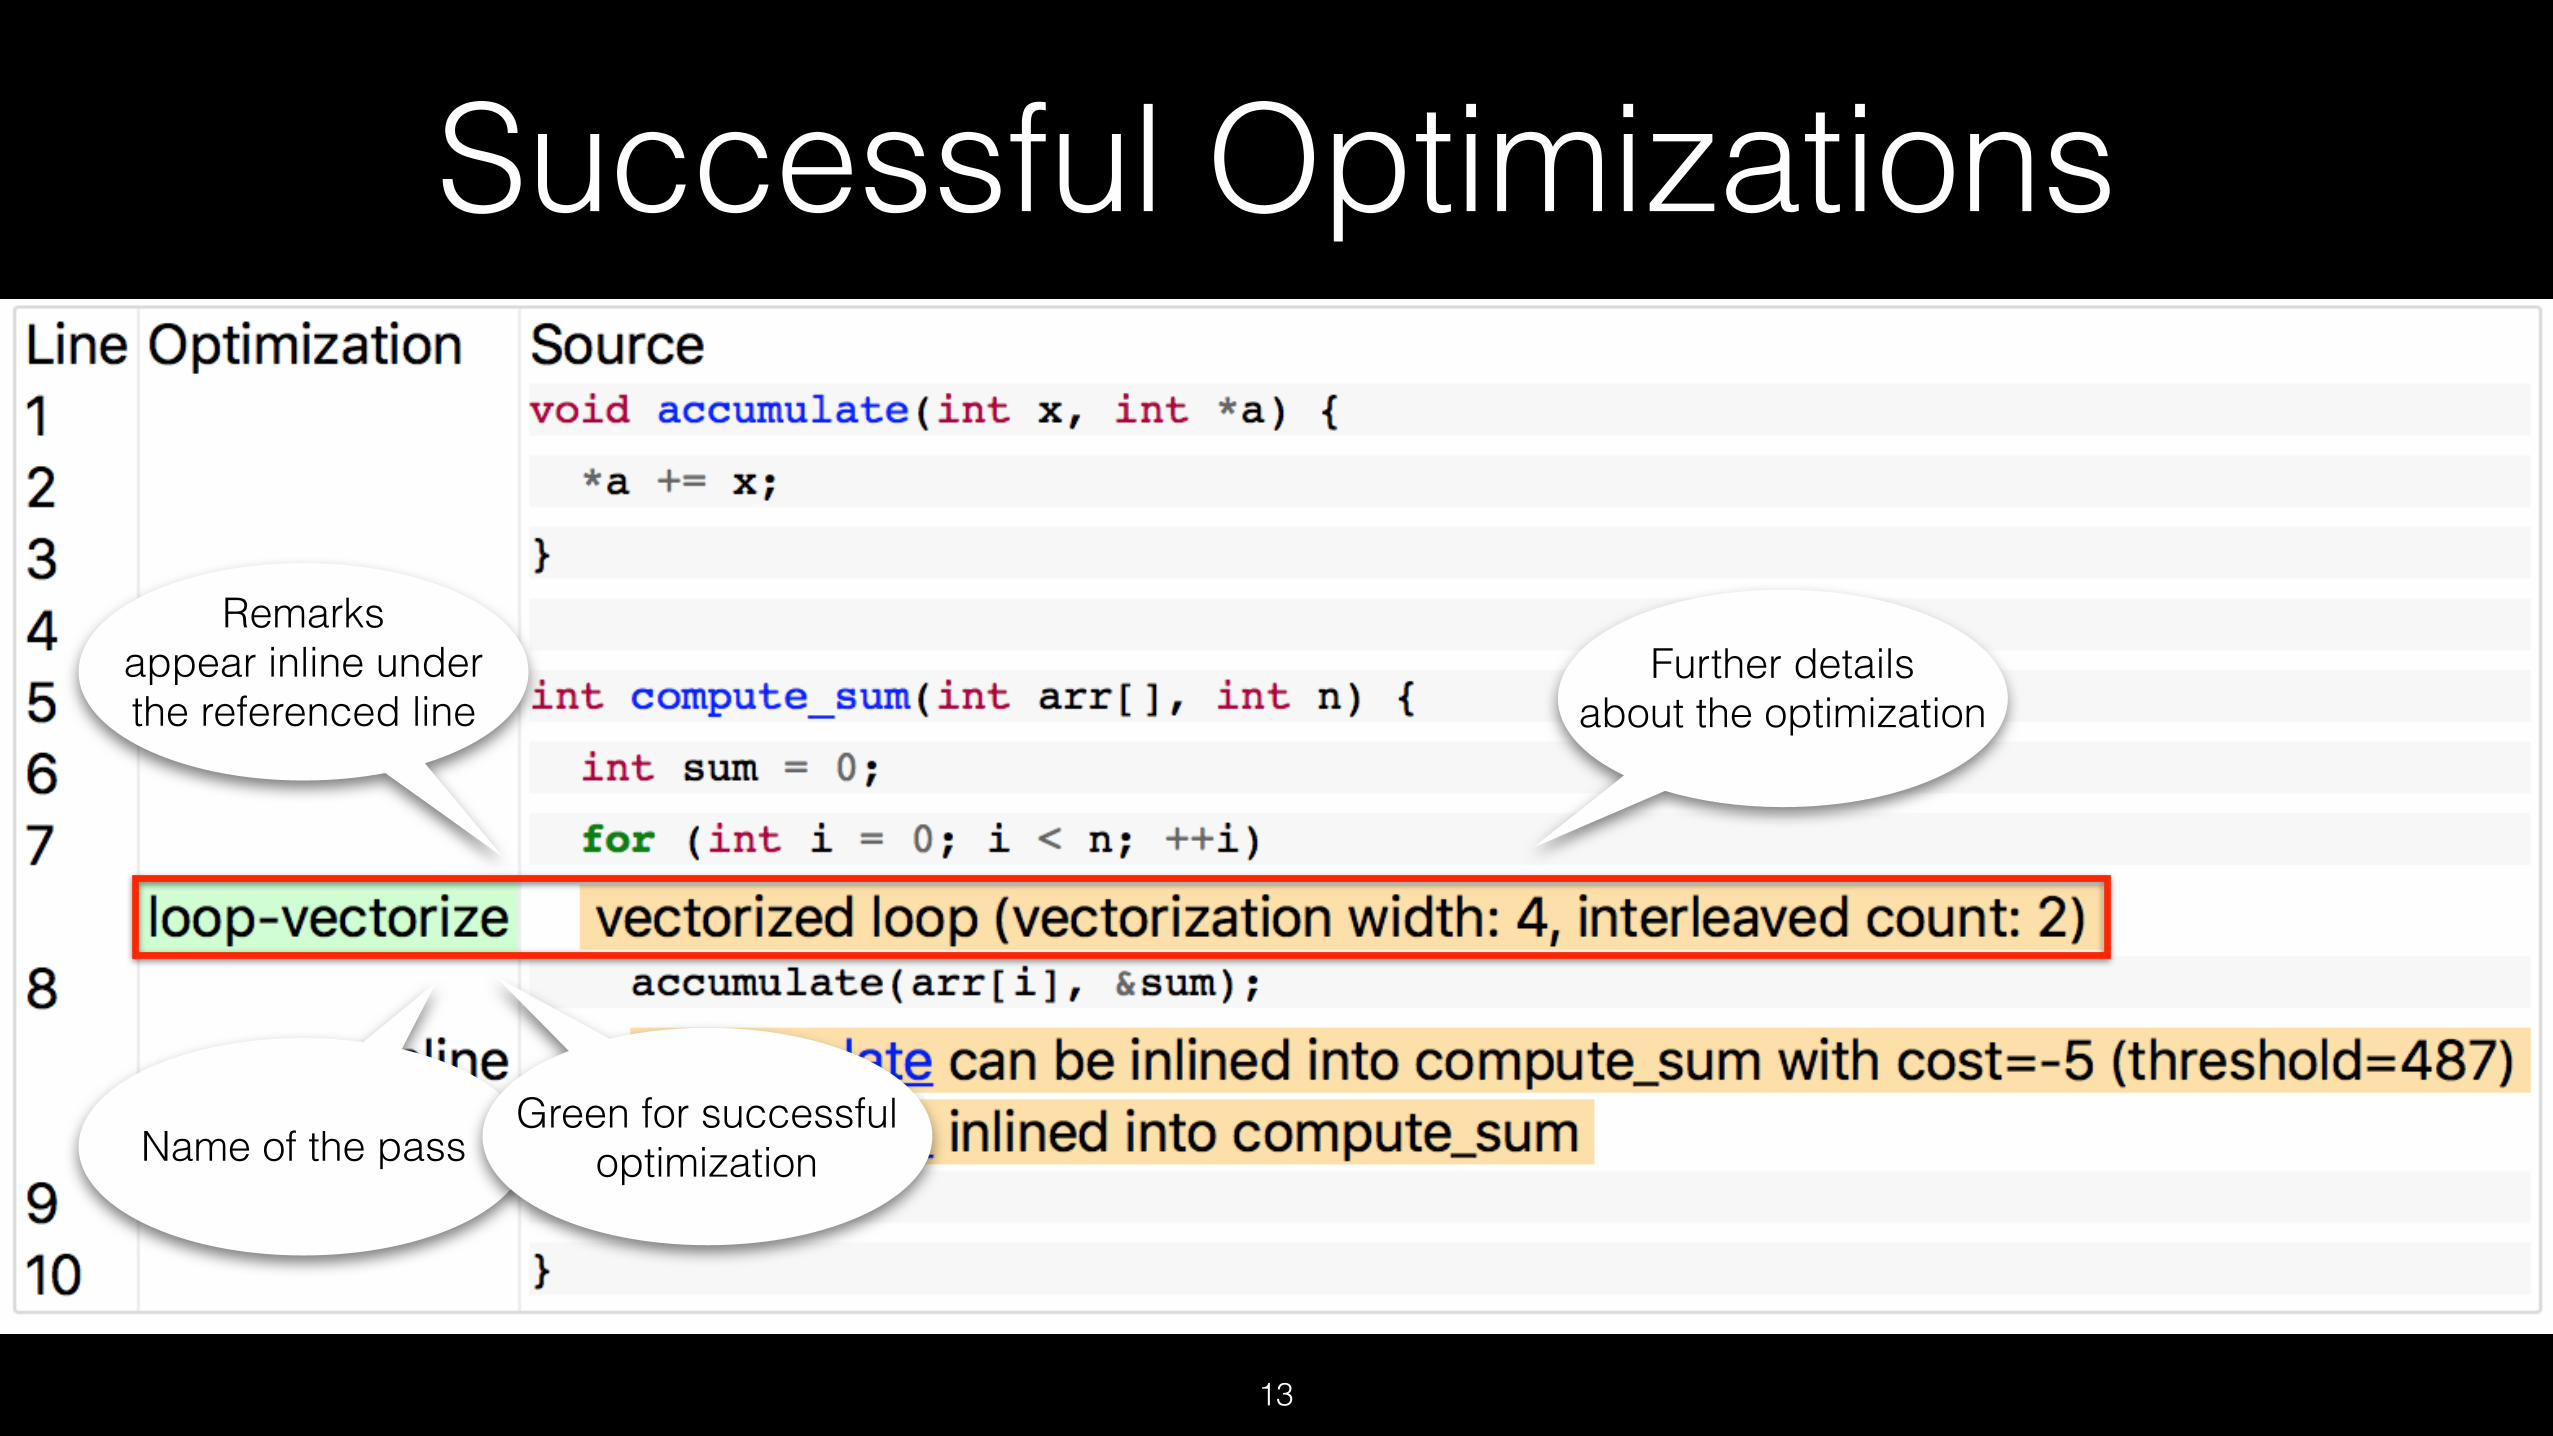
Successful Optimizations
13
Remarks appear inline under the referenced line
Name of the passGreen for successful
optimization
Further details about the optimization
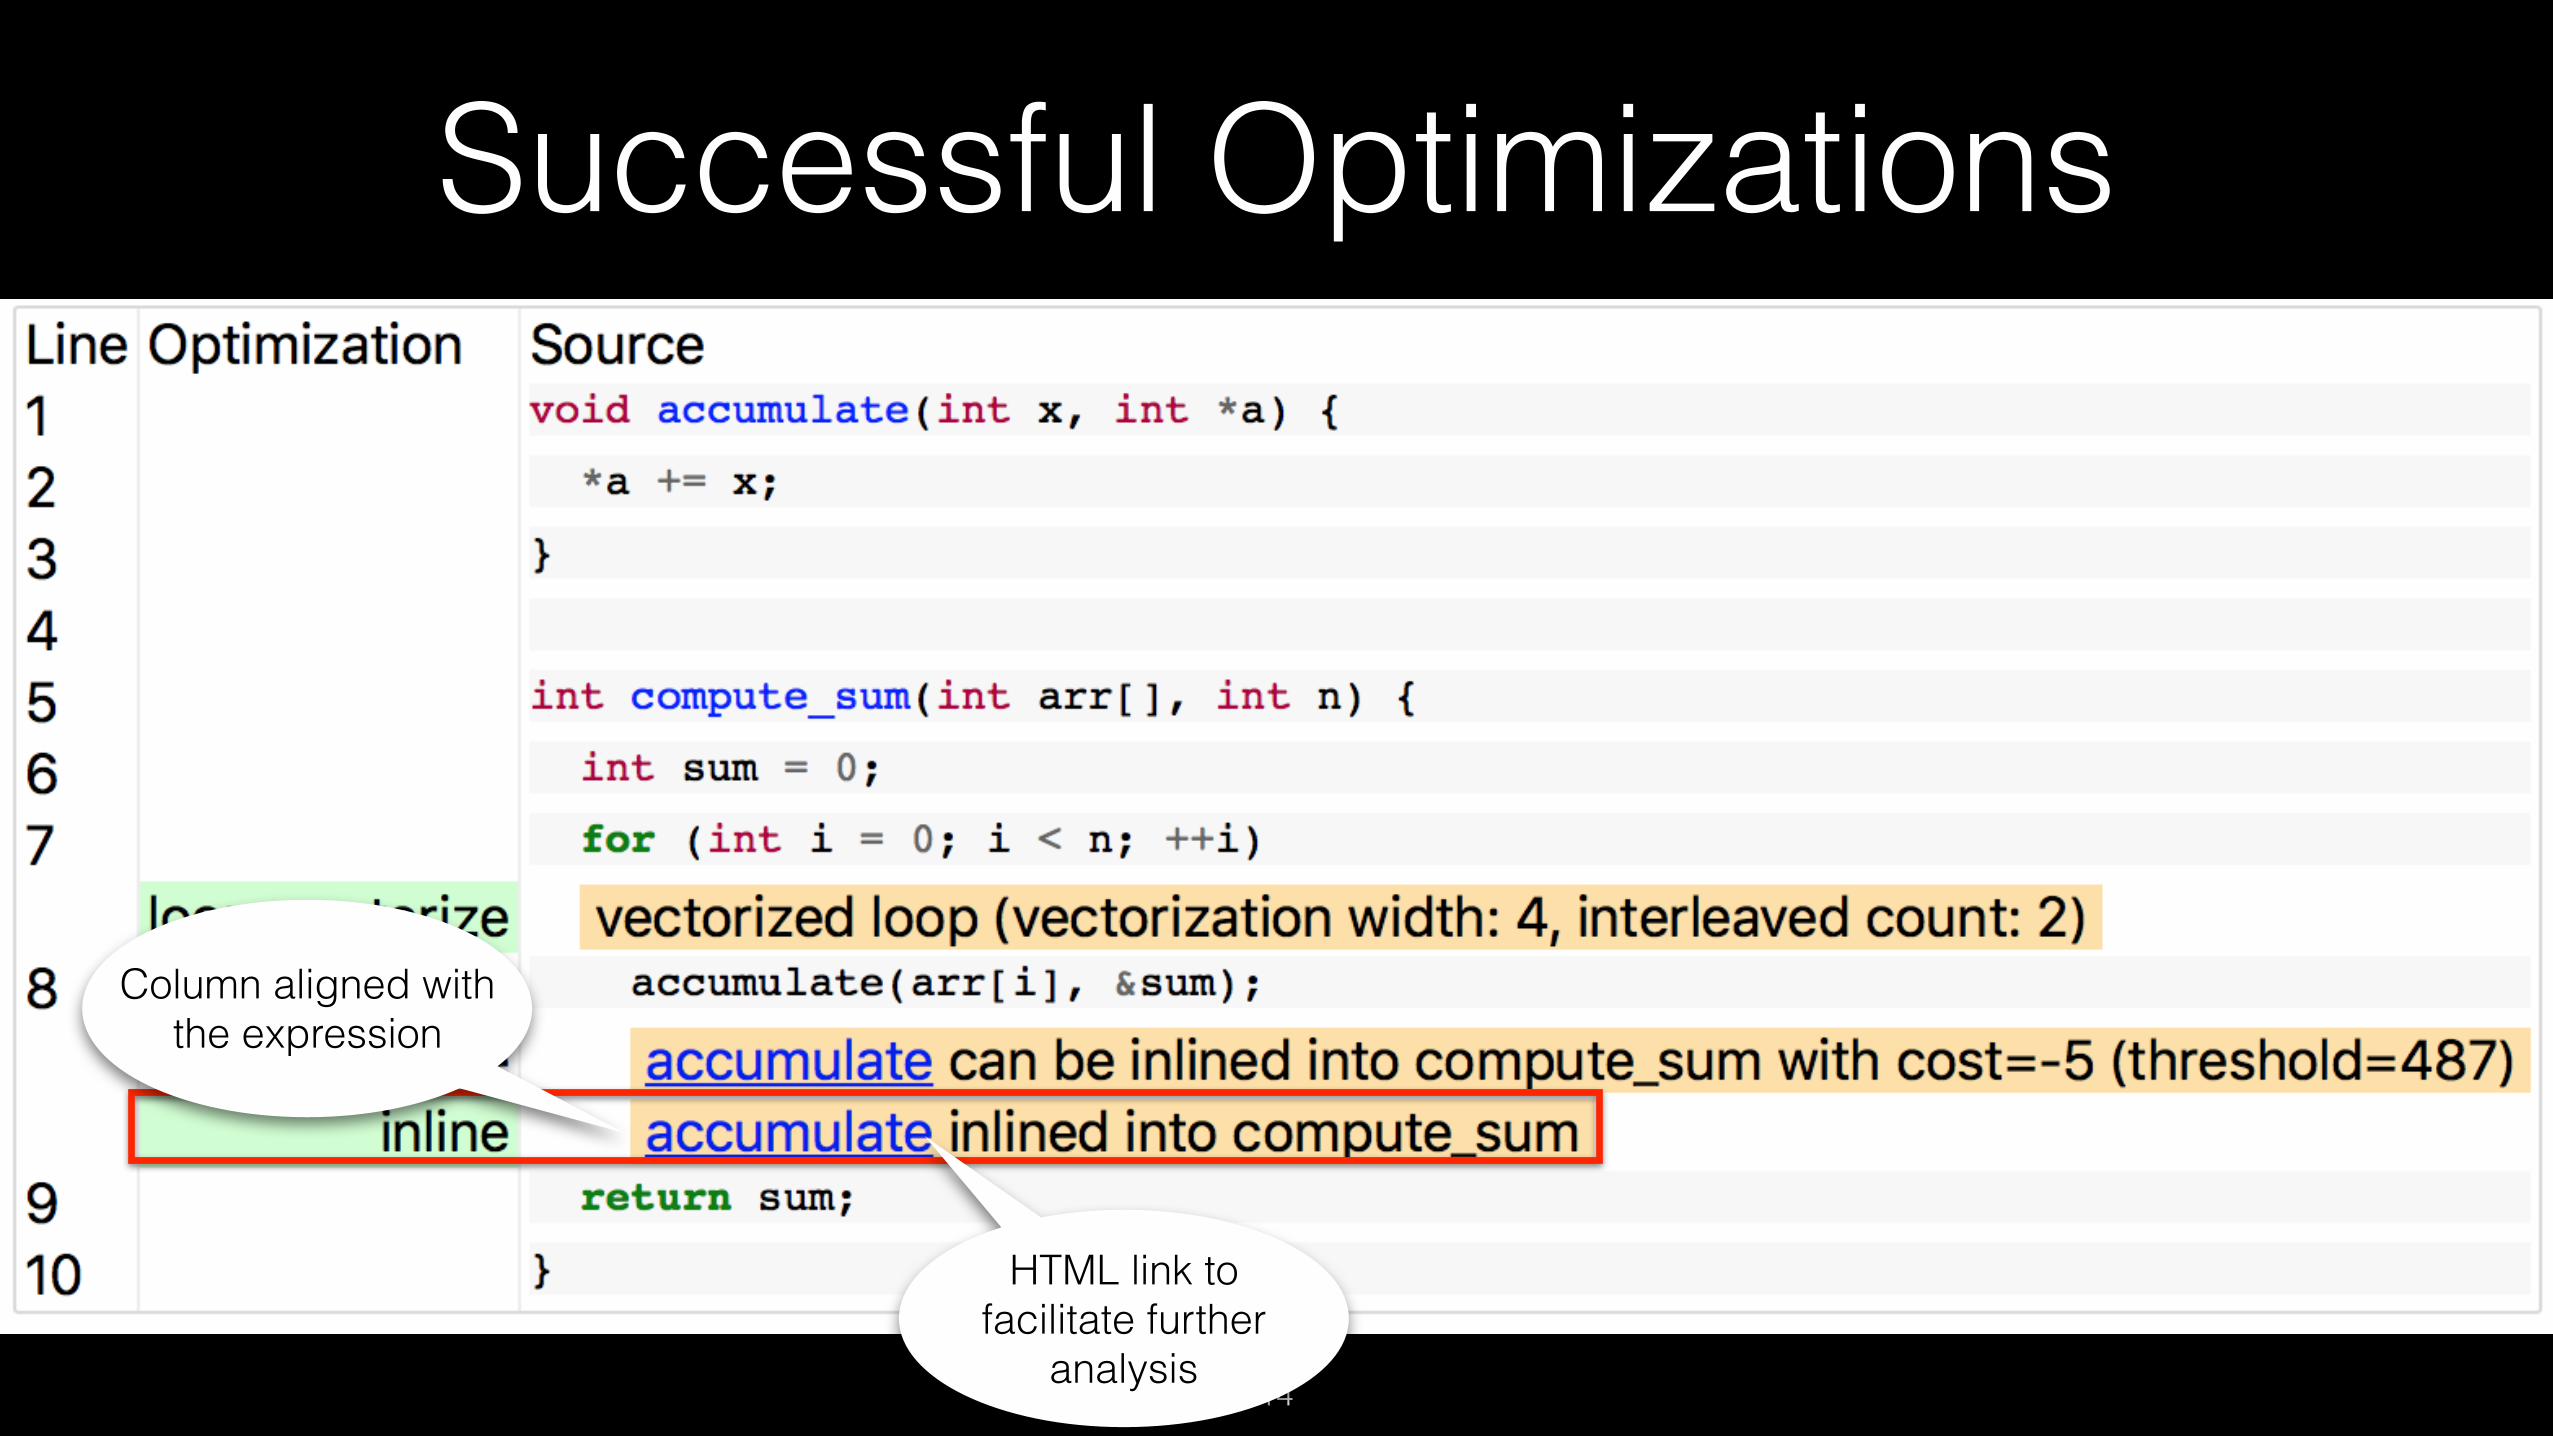
Successful Optimizations
14
Column aligned with the expression
HTML link to facilitate further
analysis

Successful Optimizations
15
Remarks in white are Analysis remarks
Optimizations can expose interesting
analyses

Missed Optimizations
15
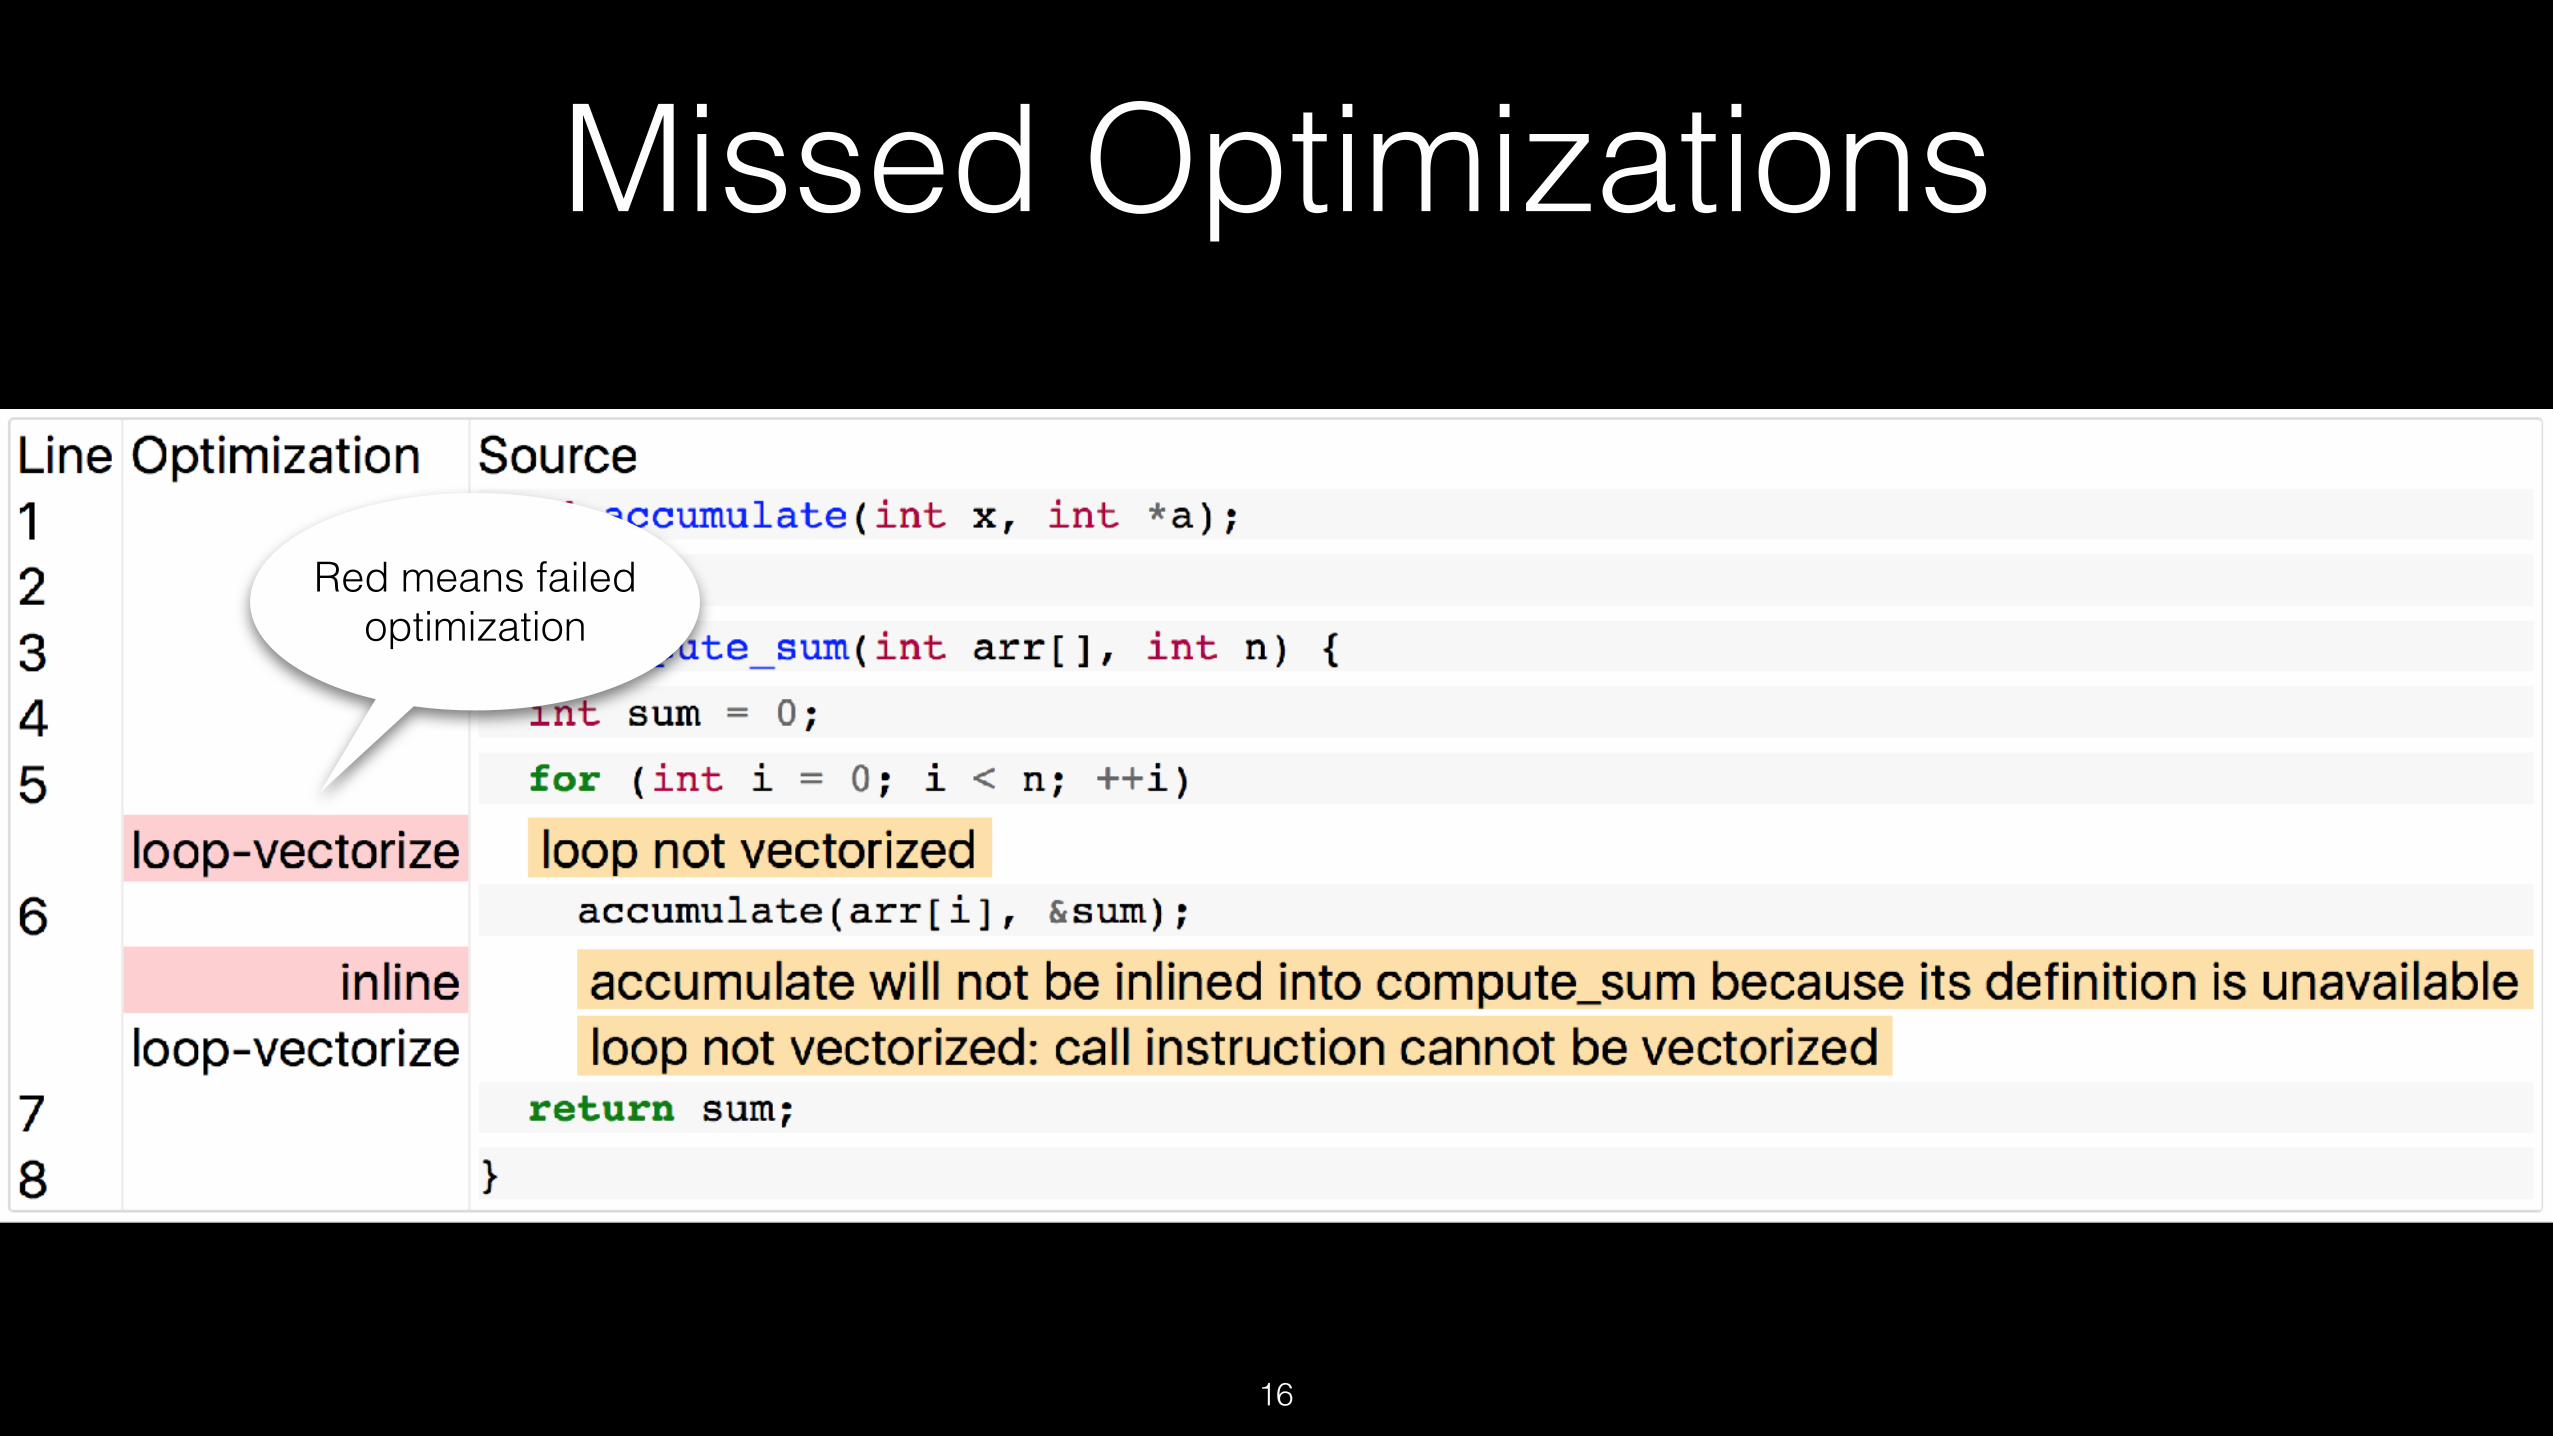
Missed Optimizations
16
Red means failed optimization
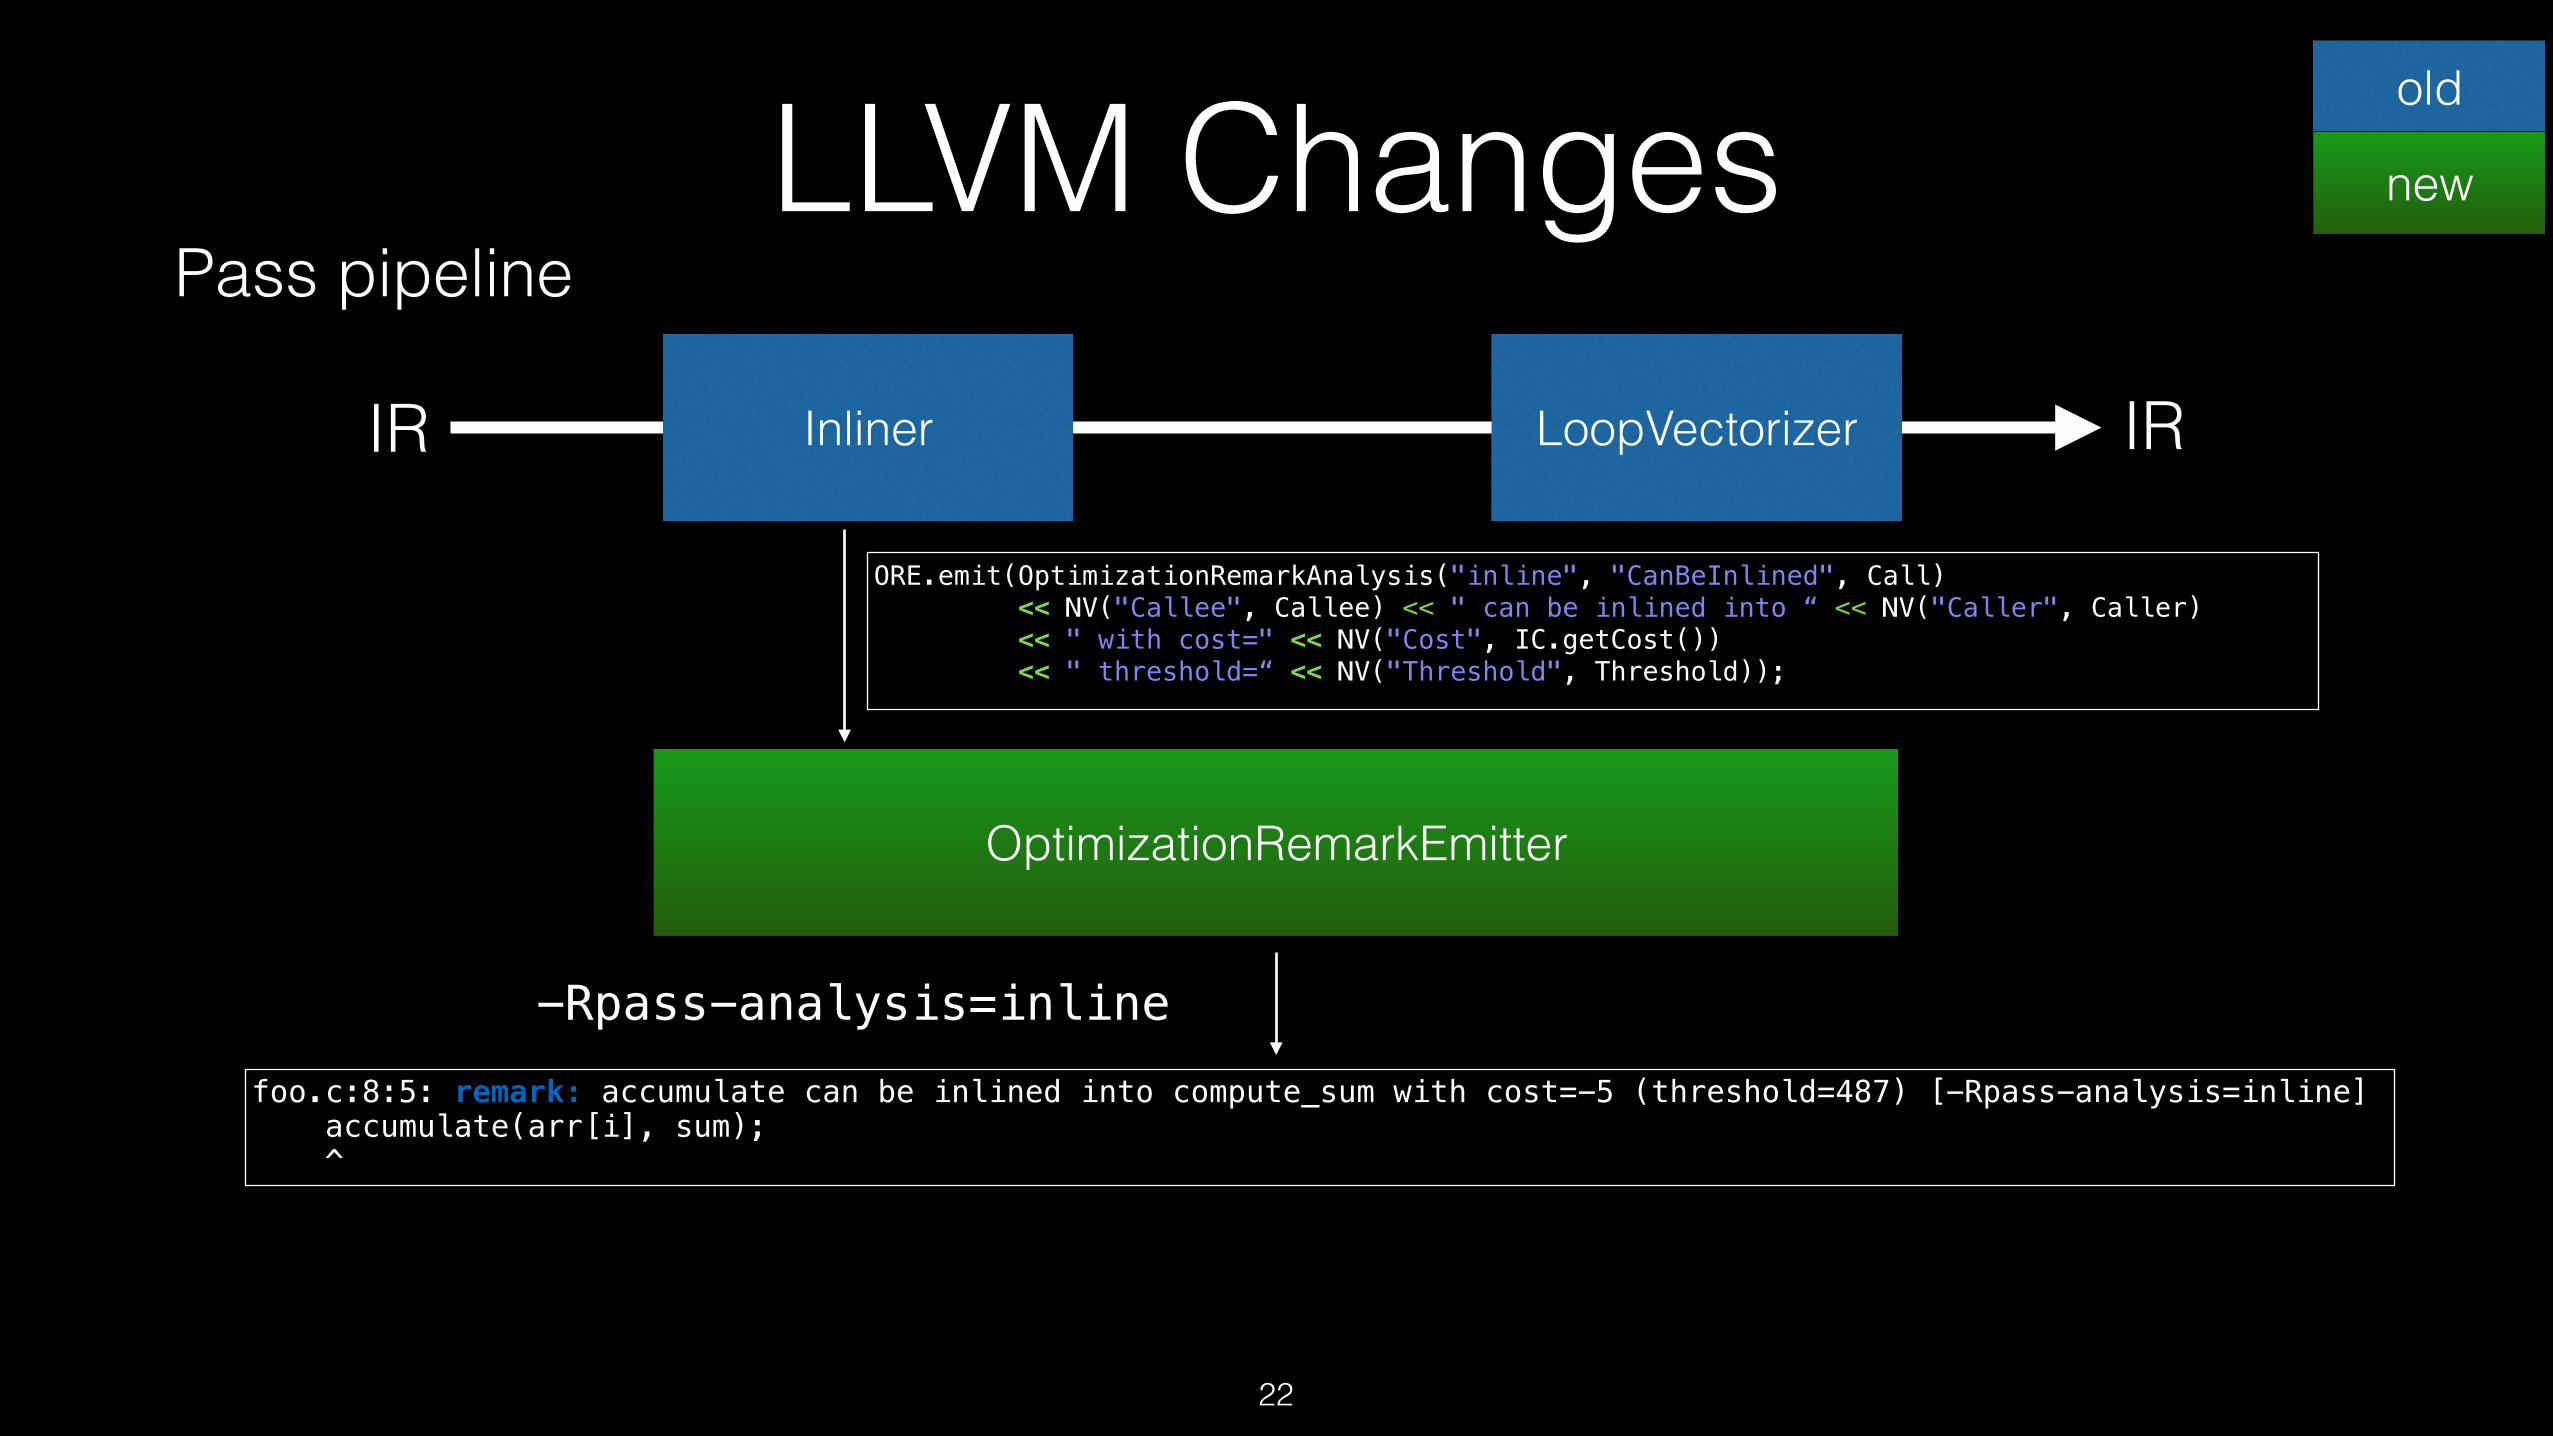
22
ORE.emit(OptimizationRemarkAnalysis("inline", "CanBeInlined", Call) << NV("Callee", Callee) << " can be inlined into “ << NV("Caller", Caller) << " with cost=" << NV("Cost", IC.getCost()) << " threshold=“ << NV("Threshold", Threshold));
OptimizationRemarkEmitter
foo.c:8:5: remark: accumulate can be inlined into compute_sum with cost=-5 (threshold=487) [-Rpass-analysis=inline] accumulate(arr[i], sum); ^
LLVM ChangesInliner LoopVectorizer
Pass pipeline
-Rpass-analysis=inline
old
new
IR IR
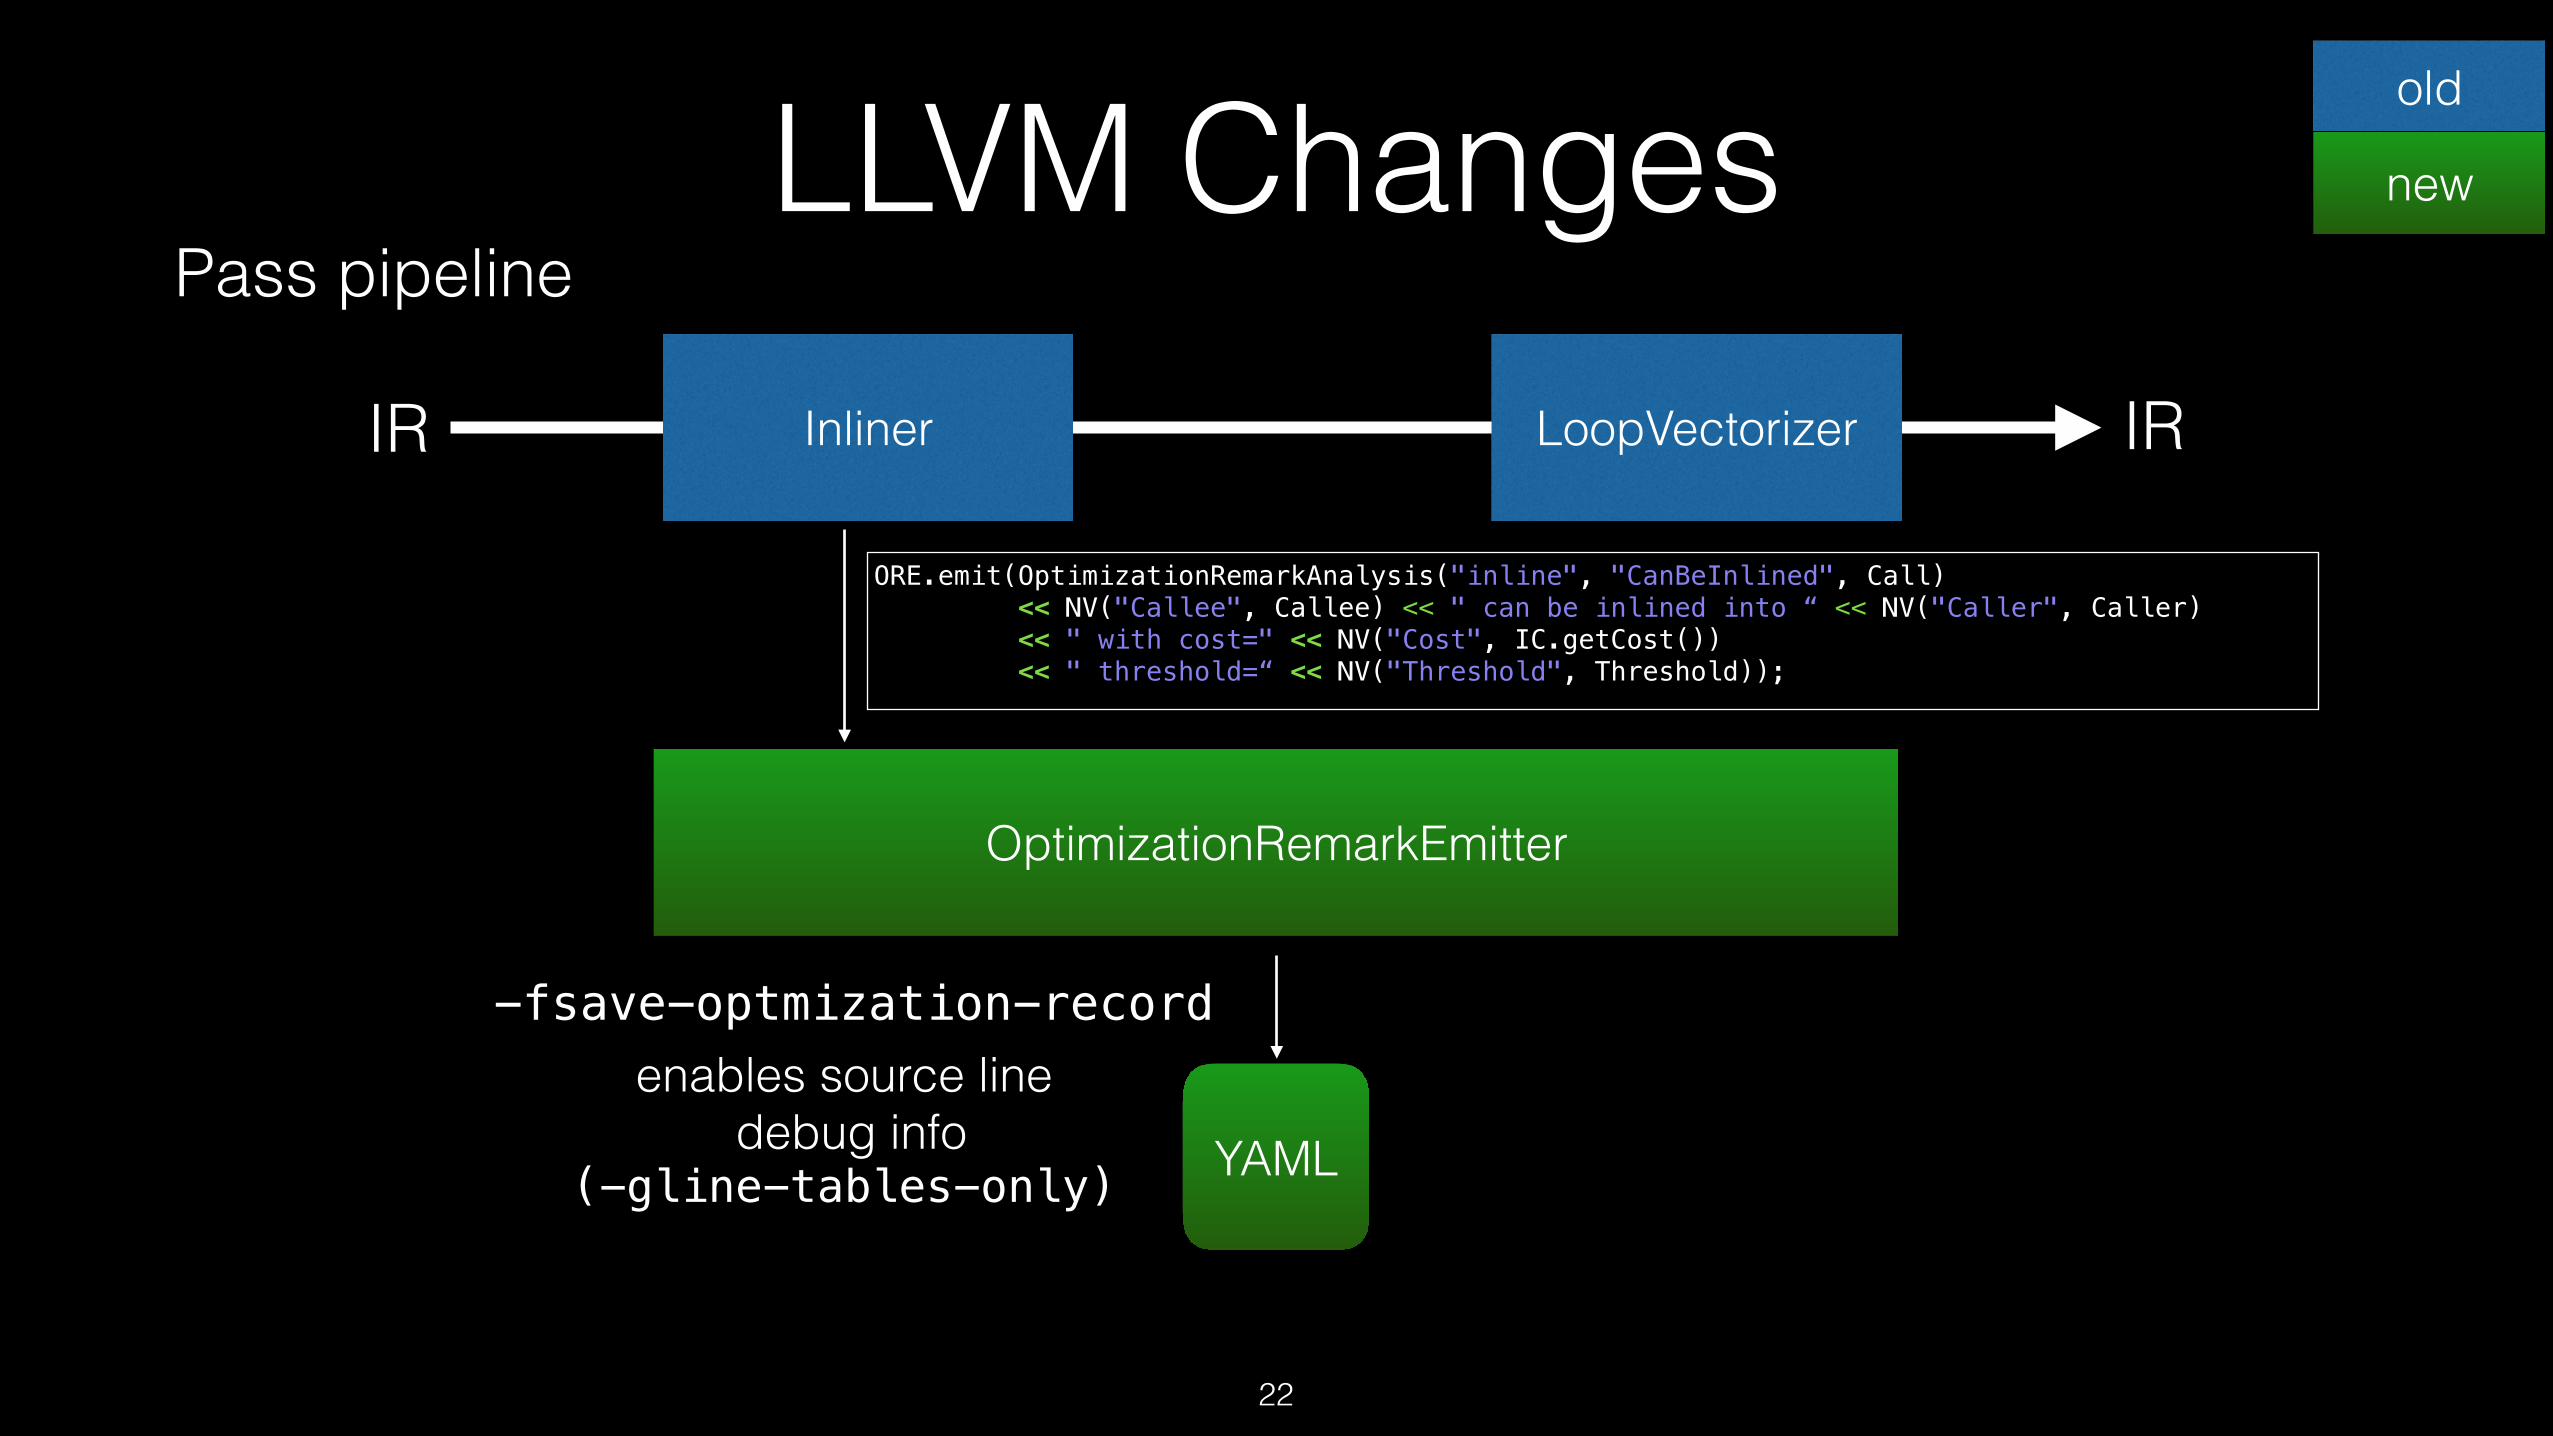
22
ORE.emit(OptimizationRemarkAnalysis("inline", "CanBeInlined", Call) << NV("Callee", Callee) << " can be inlined into “ << NV("Caller", Caller) << " with cost=" << NV("Cost", IC.getCost()) << " threshold=“ << NV("Threshold", Threshold));
OptimizationRemarkEmitter
YAML
LLVM ChangesInliner LoopVectorizer
-fsave-optmization-record
Pass pipeline
enables source line debug info
(-gline-tables-only)
old
new
IR IR
--- !Analysis Pass: inline Name: CanBeInlined DebugLoc: { File: s.cc, Line: 8, Column: 5 } Function: compute_sum Args: - Callee: accumulate DebugLoc: { File: s.cc, Line: 1, Column: 0 } - String: ' can be inlined into ' - Caller: compute_sum DebugLoc: { File: s.cc, Line: 5, Column: 0 } - String: ' with cost=' - Cost: '-5' - String: ' (threshold=' - Threshold: '487' - String: ')' ...

opt-viewerYAML
utils/opt-viewer/opt-viewer.py
index.htmlfoo.o.html
23
old
new
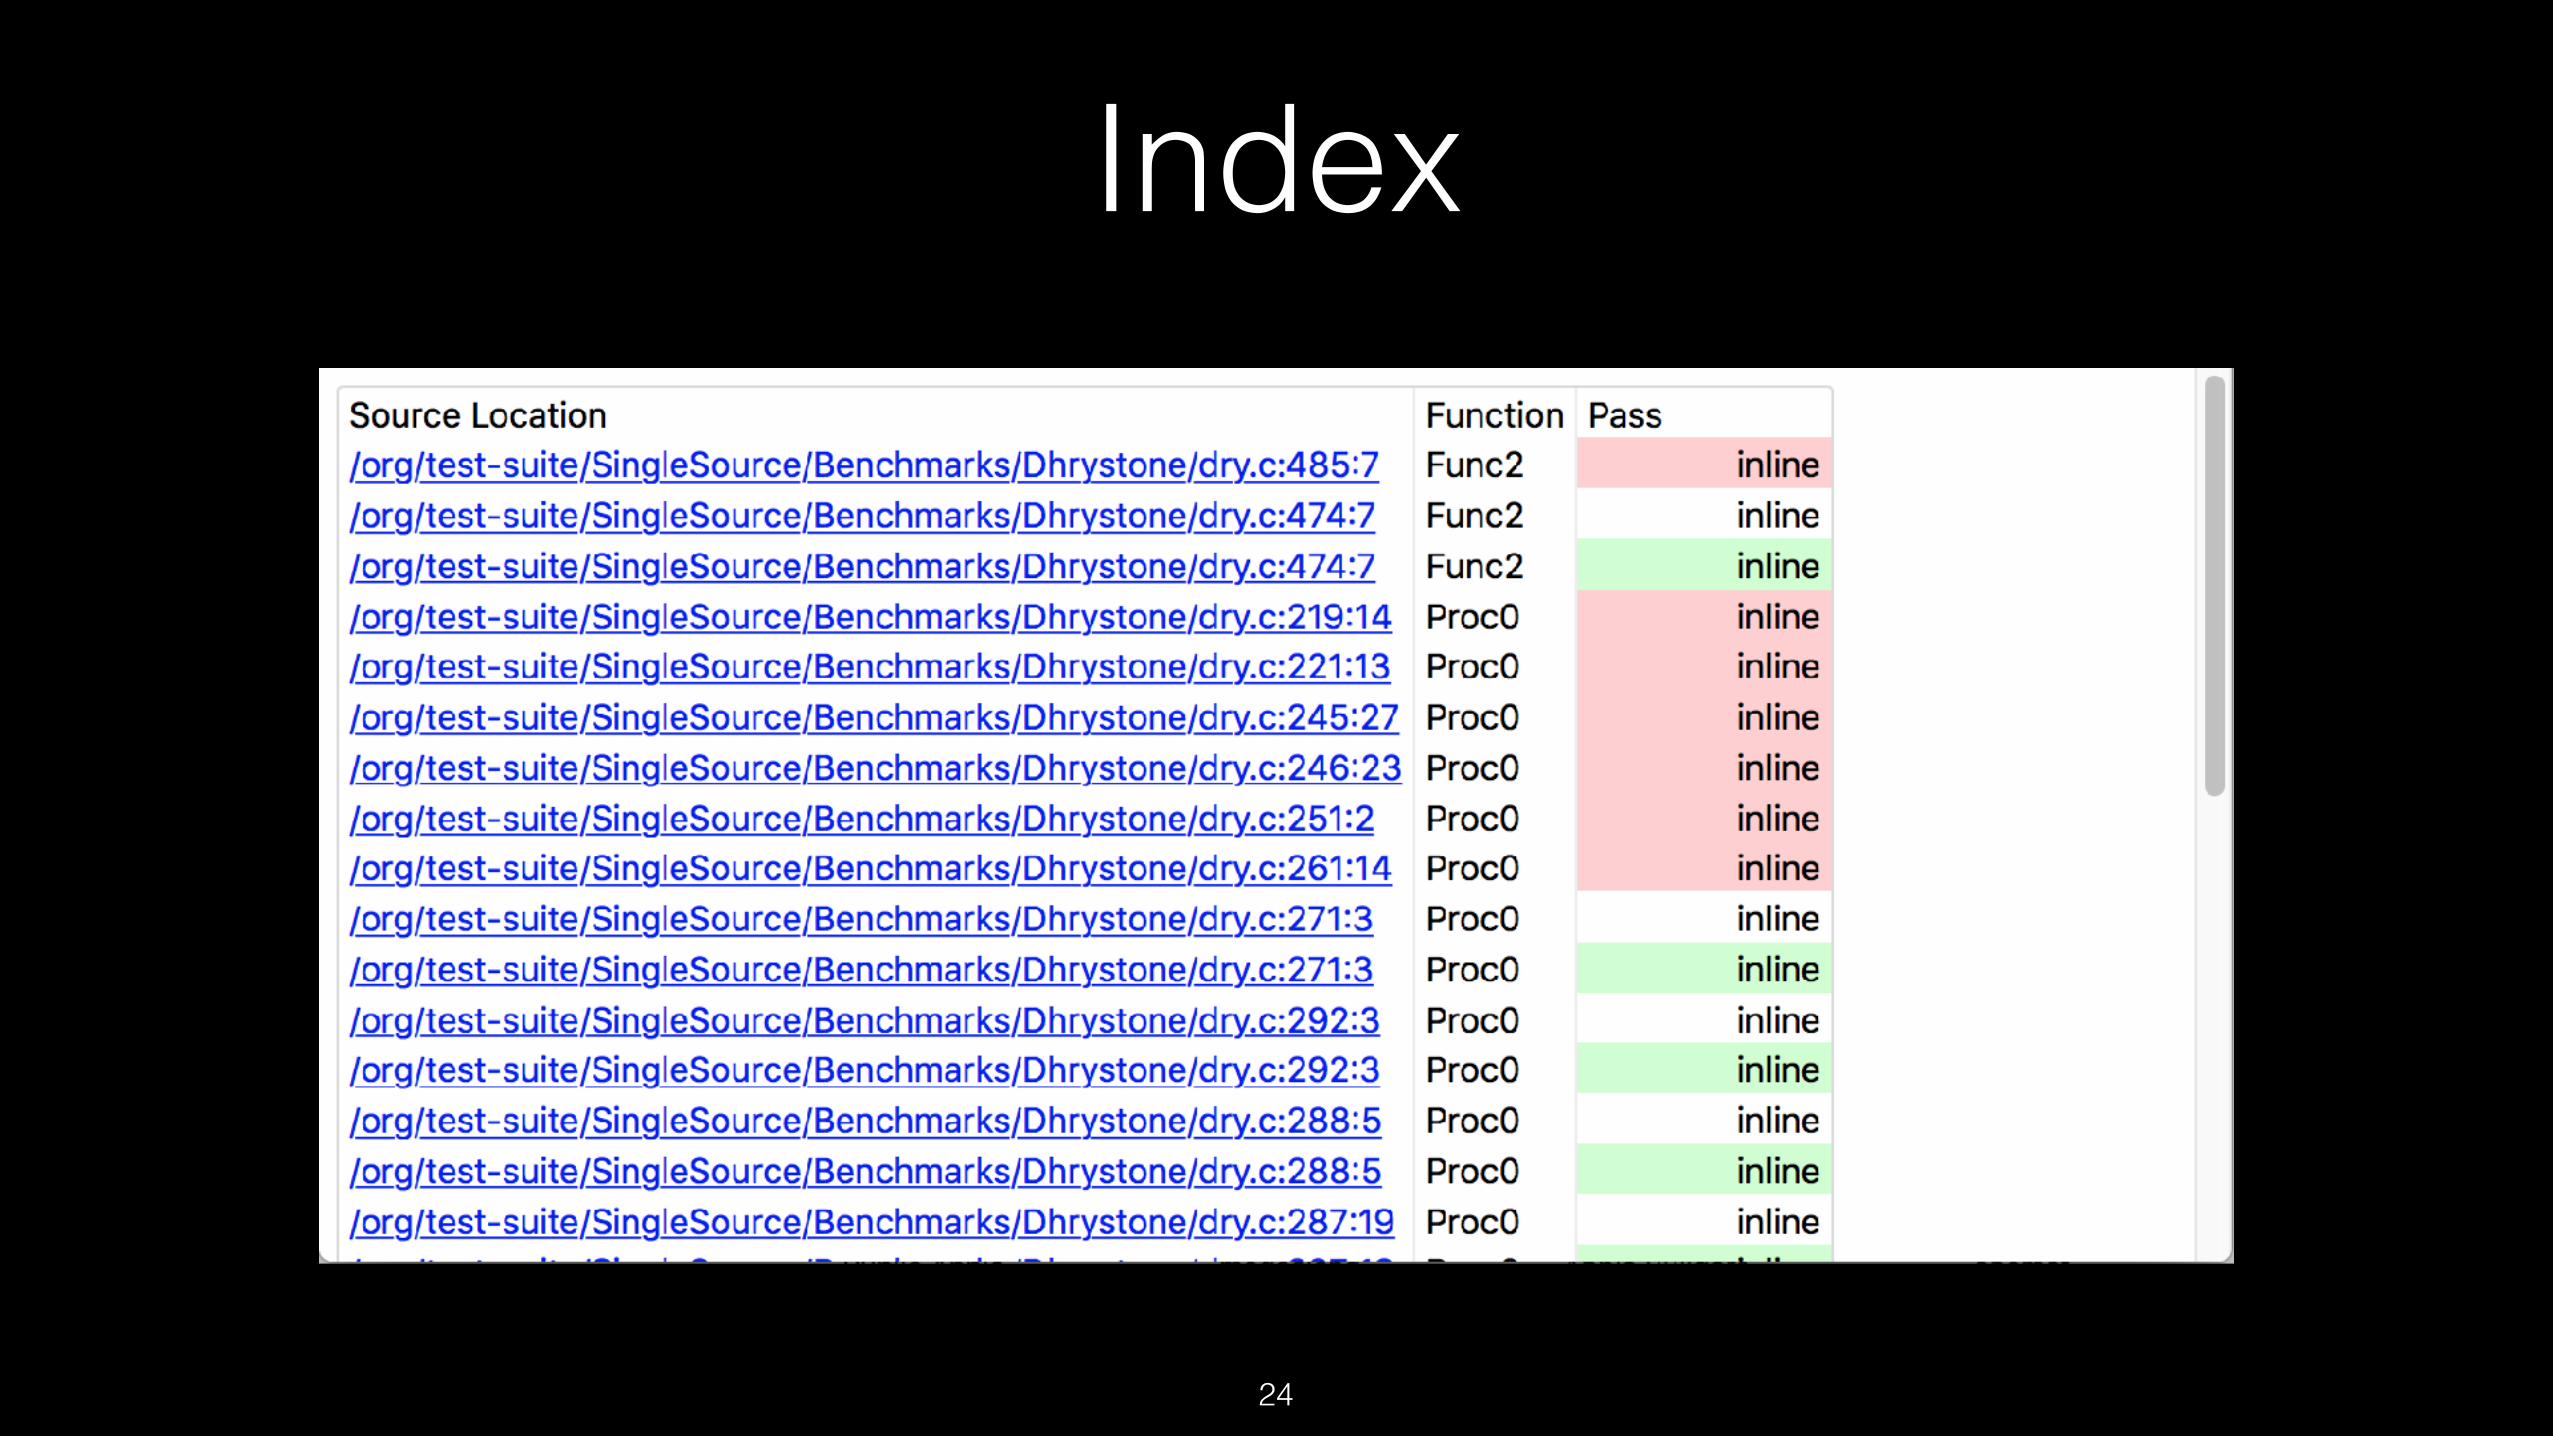
Index
24
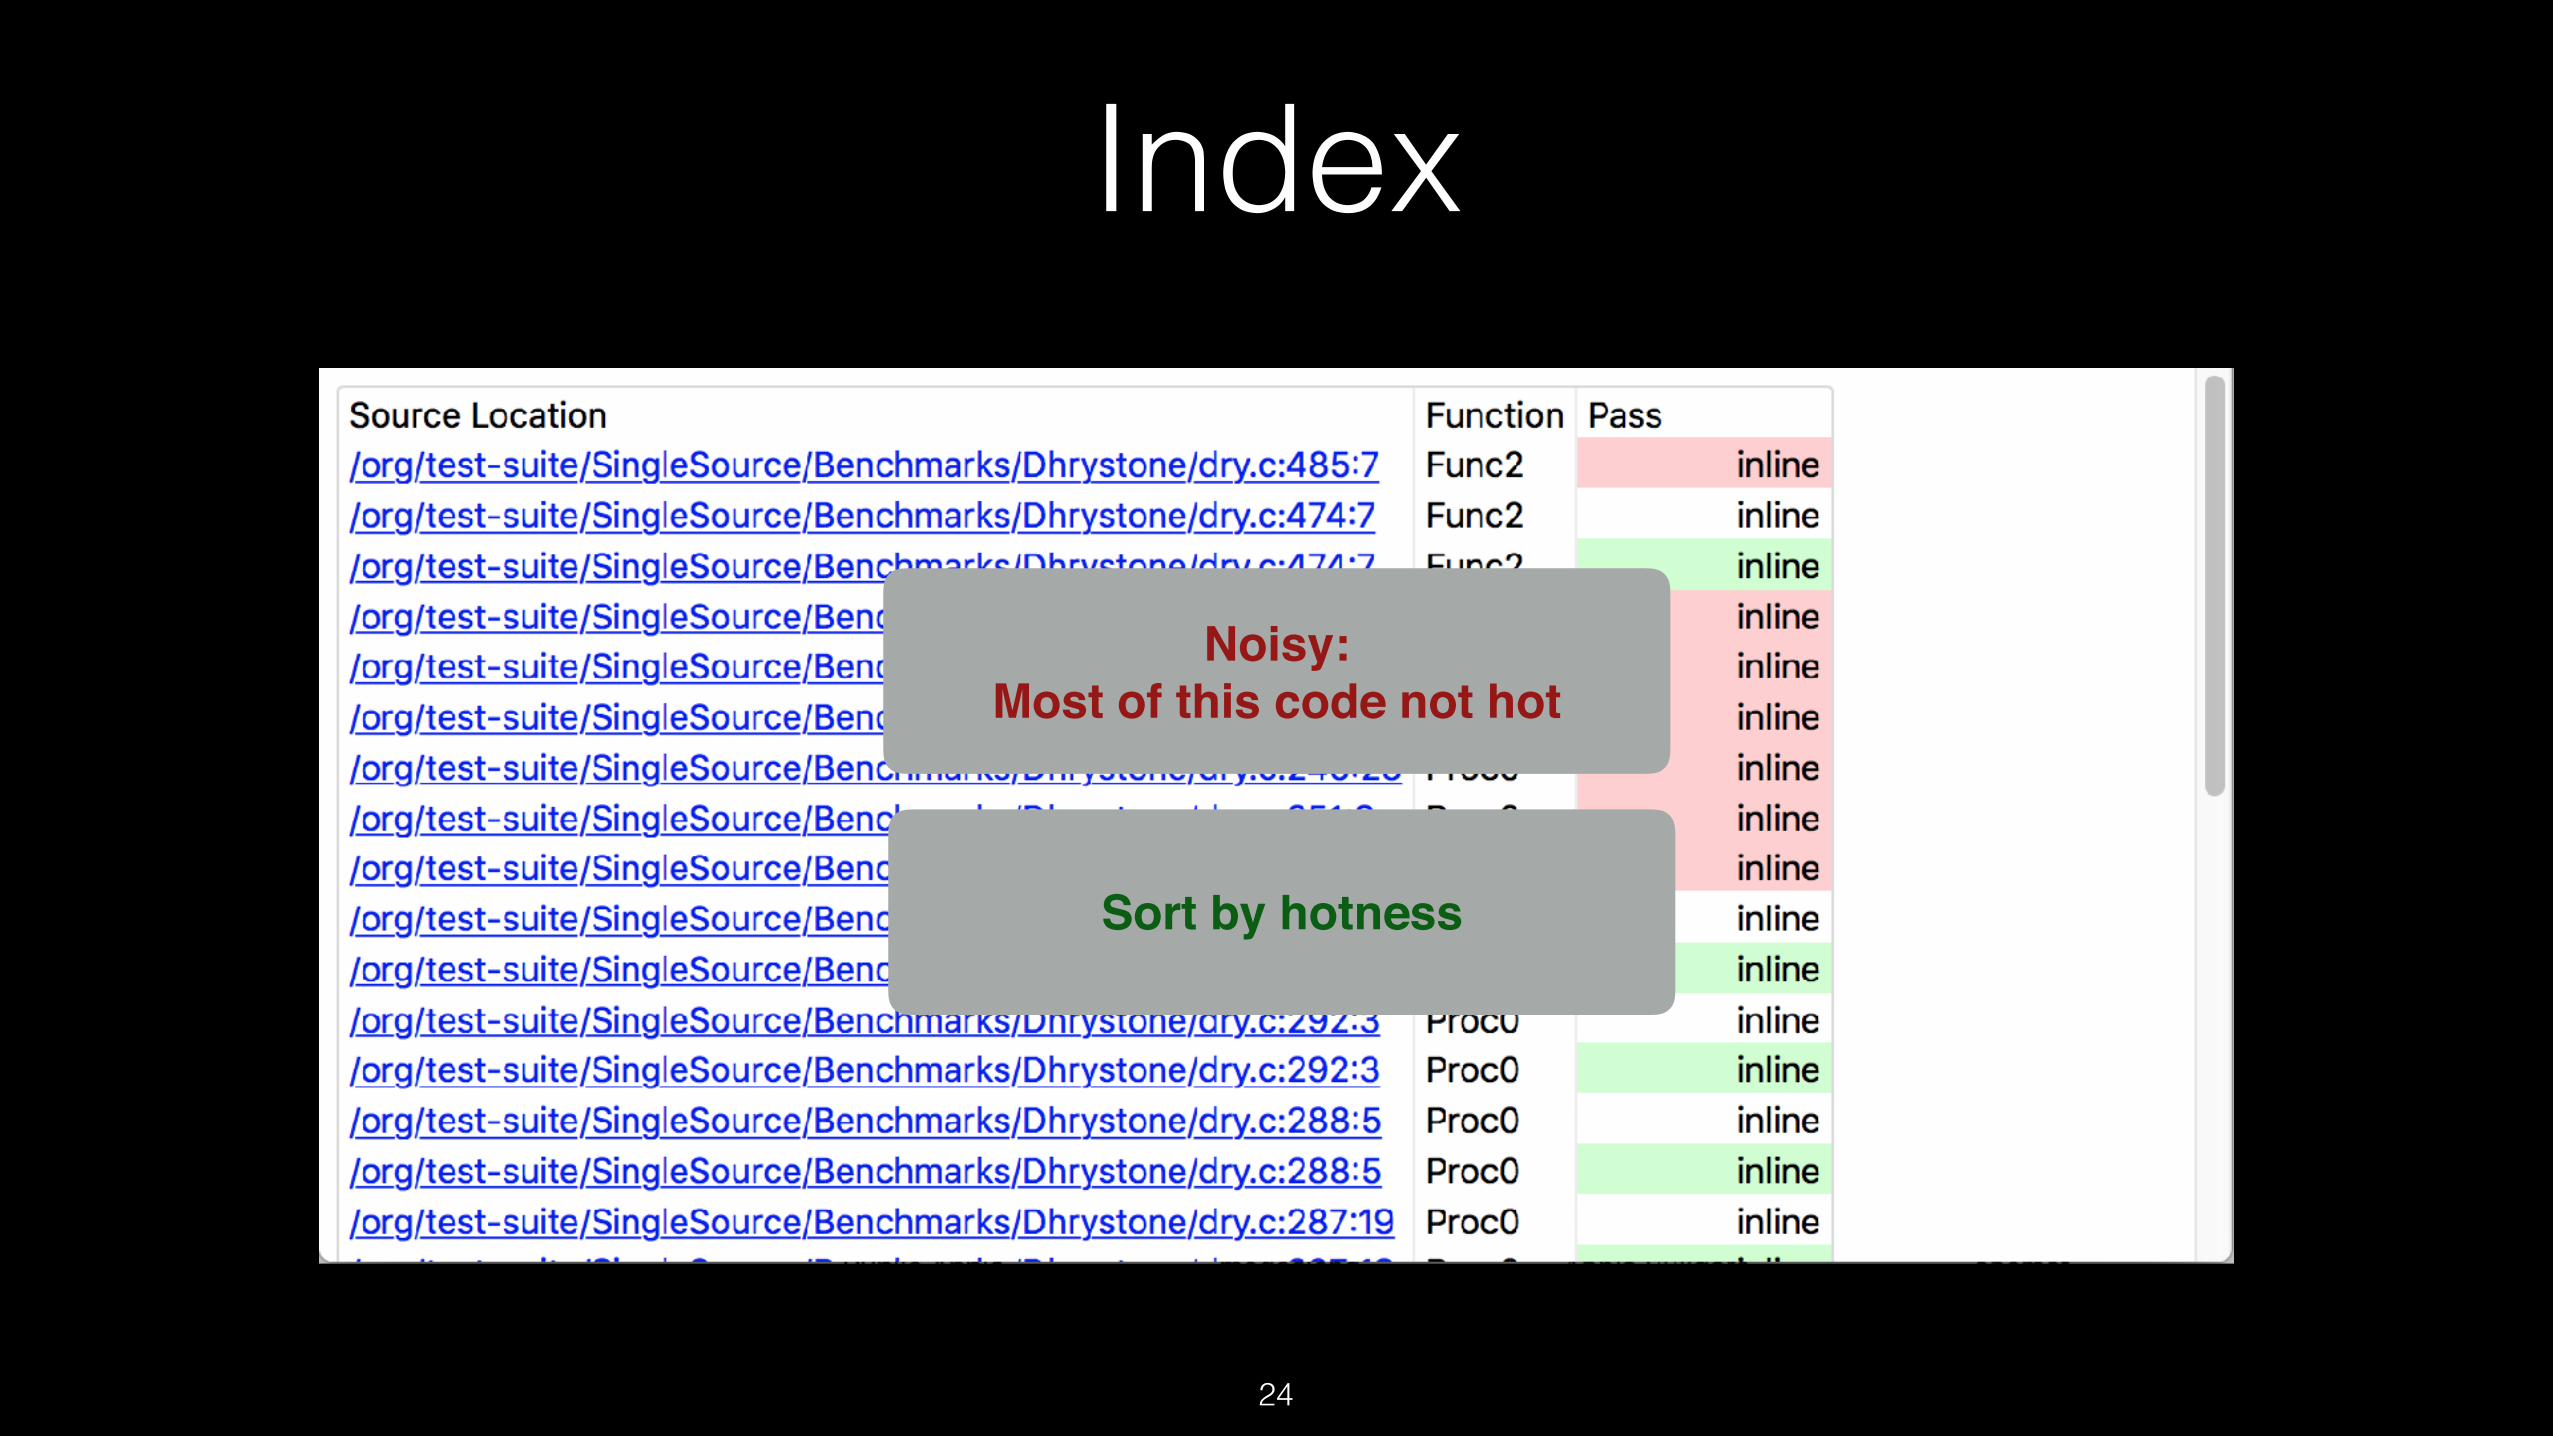
Index
24
Noisy:Most of this code not hot
Sort by hotness
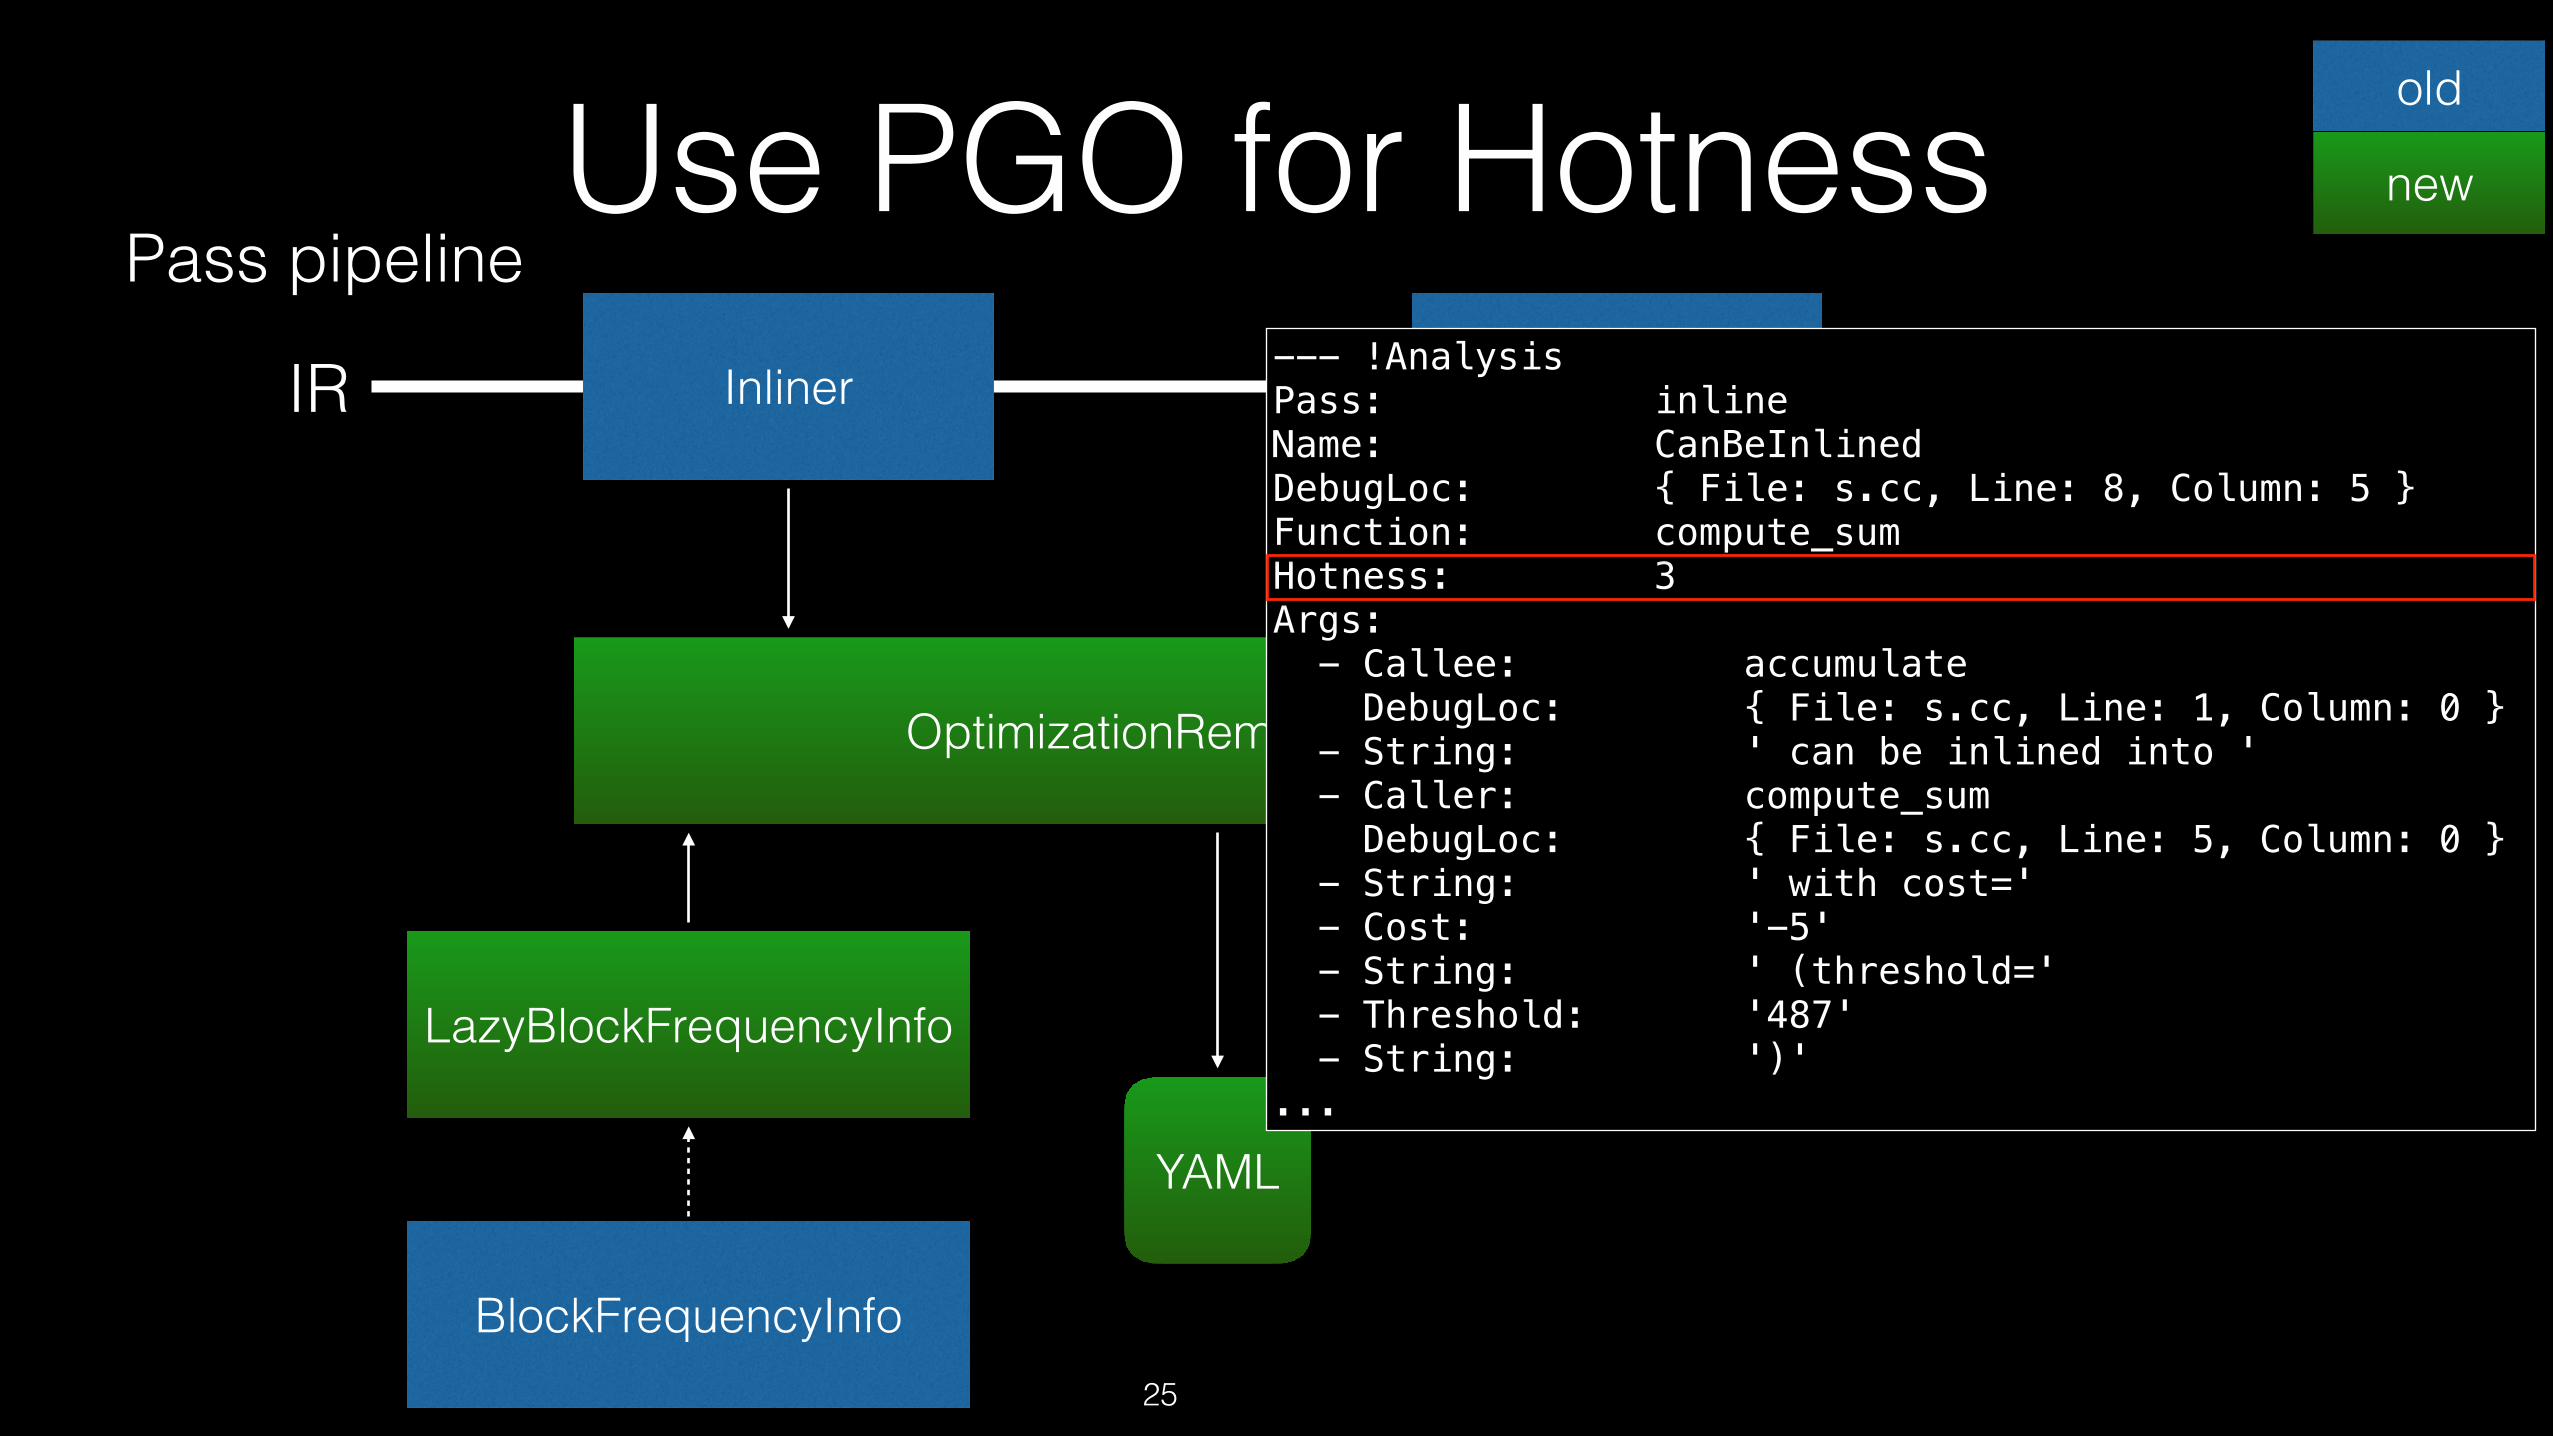
IR
Use PGO for HotnessInliner LoopVectorizer
OptimizationRemarkEmitter
YAML
LazyBlockFrequencyInfo
--- !Analysis Pass: inline Name: CanBeInlined DebugLoc: { File: s.cc, Line: 8, Column: 5 } Function: compute_sum Hotness: 3 Args: - Callee: accumulate DebugLoc: { File: s.cc, Line: 1, Column: 0 } - String: ' can be inlined into ' - Caller: compute_sum DebugLoc: { File: s.cc, Line: 5, Column: 0 } - String: ' with cost=' - Cost: '-5' - String: ' (threshold=' - Threshold: '487' - String: ')' ...
BlockFrequencyInfo25
old
newPass pipeline
IR

Hotness
Relative tomaximum hotness,NOT total time %
27
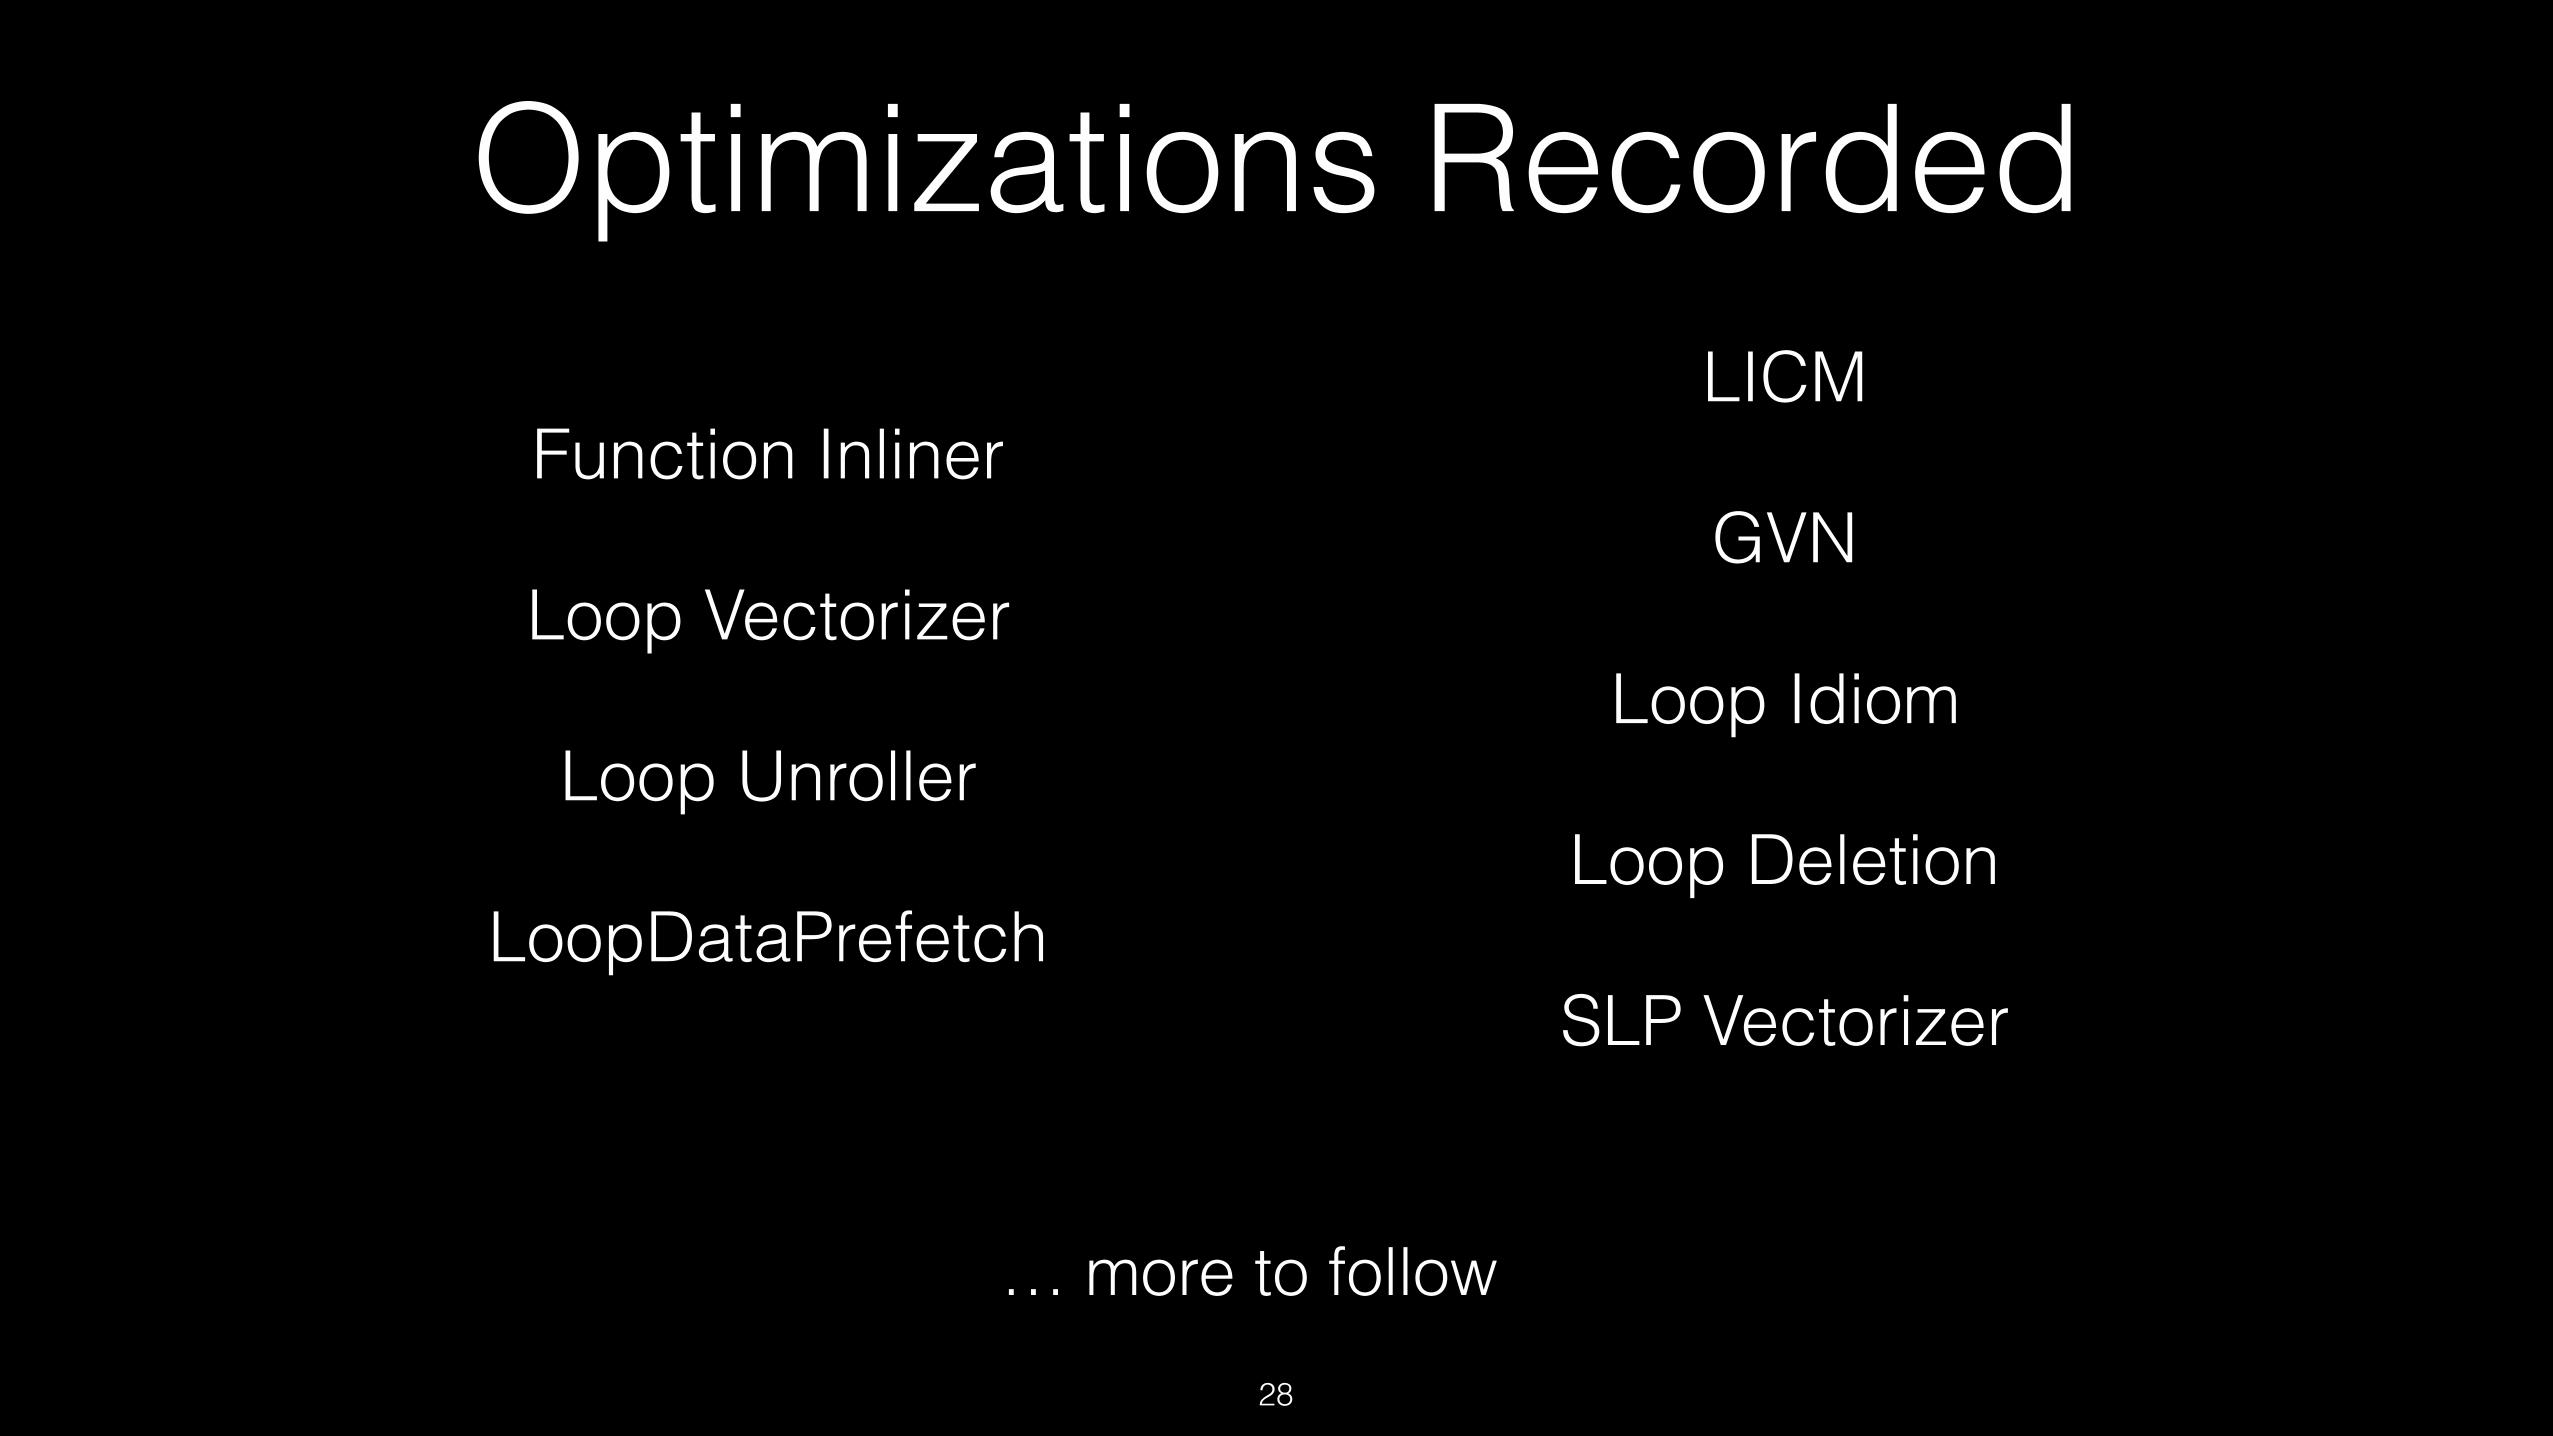
Optimizations RecordedFunction Inliner
Loop Vectorizer
Loop Unroller
LoopDataPrefetch
28
LICM
GVN
Loop Idiom
Loop Deletion
SLP Vectorizer
… more to follow

Test Drive on
LLVM test suite
29
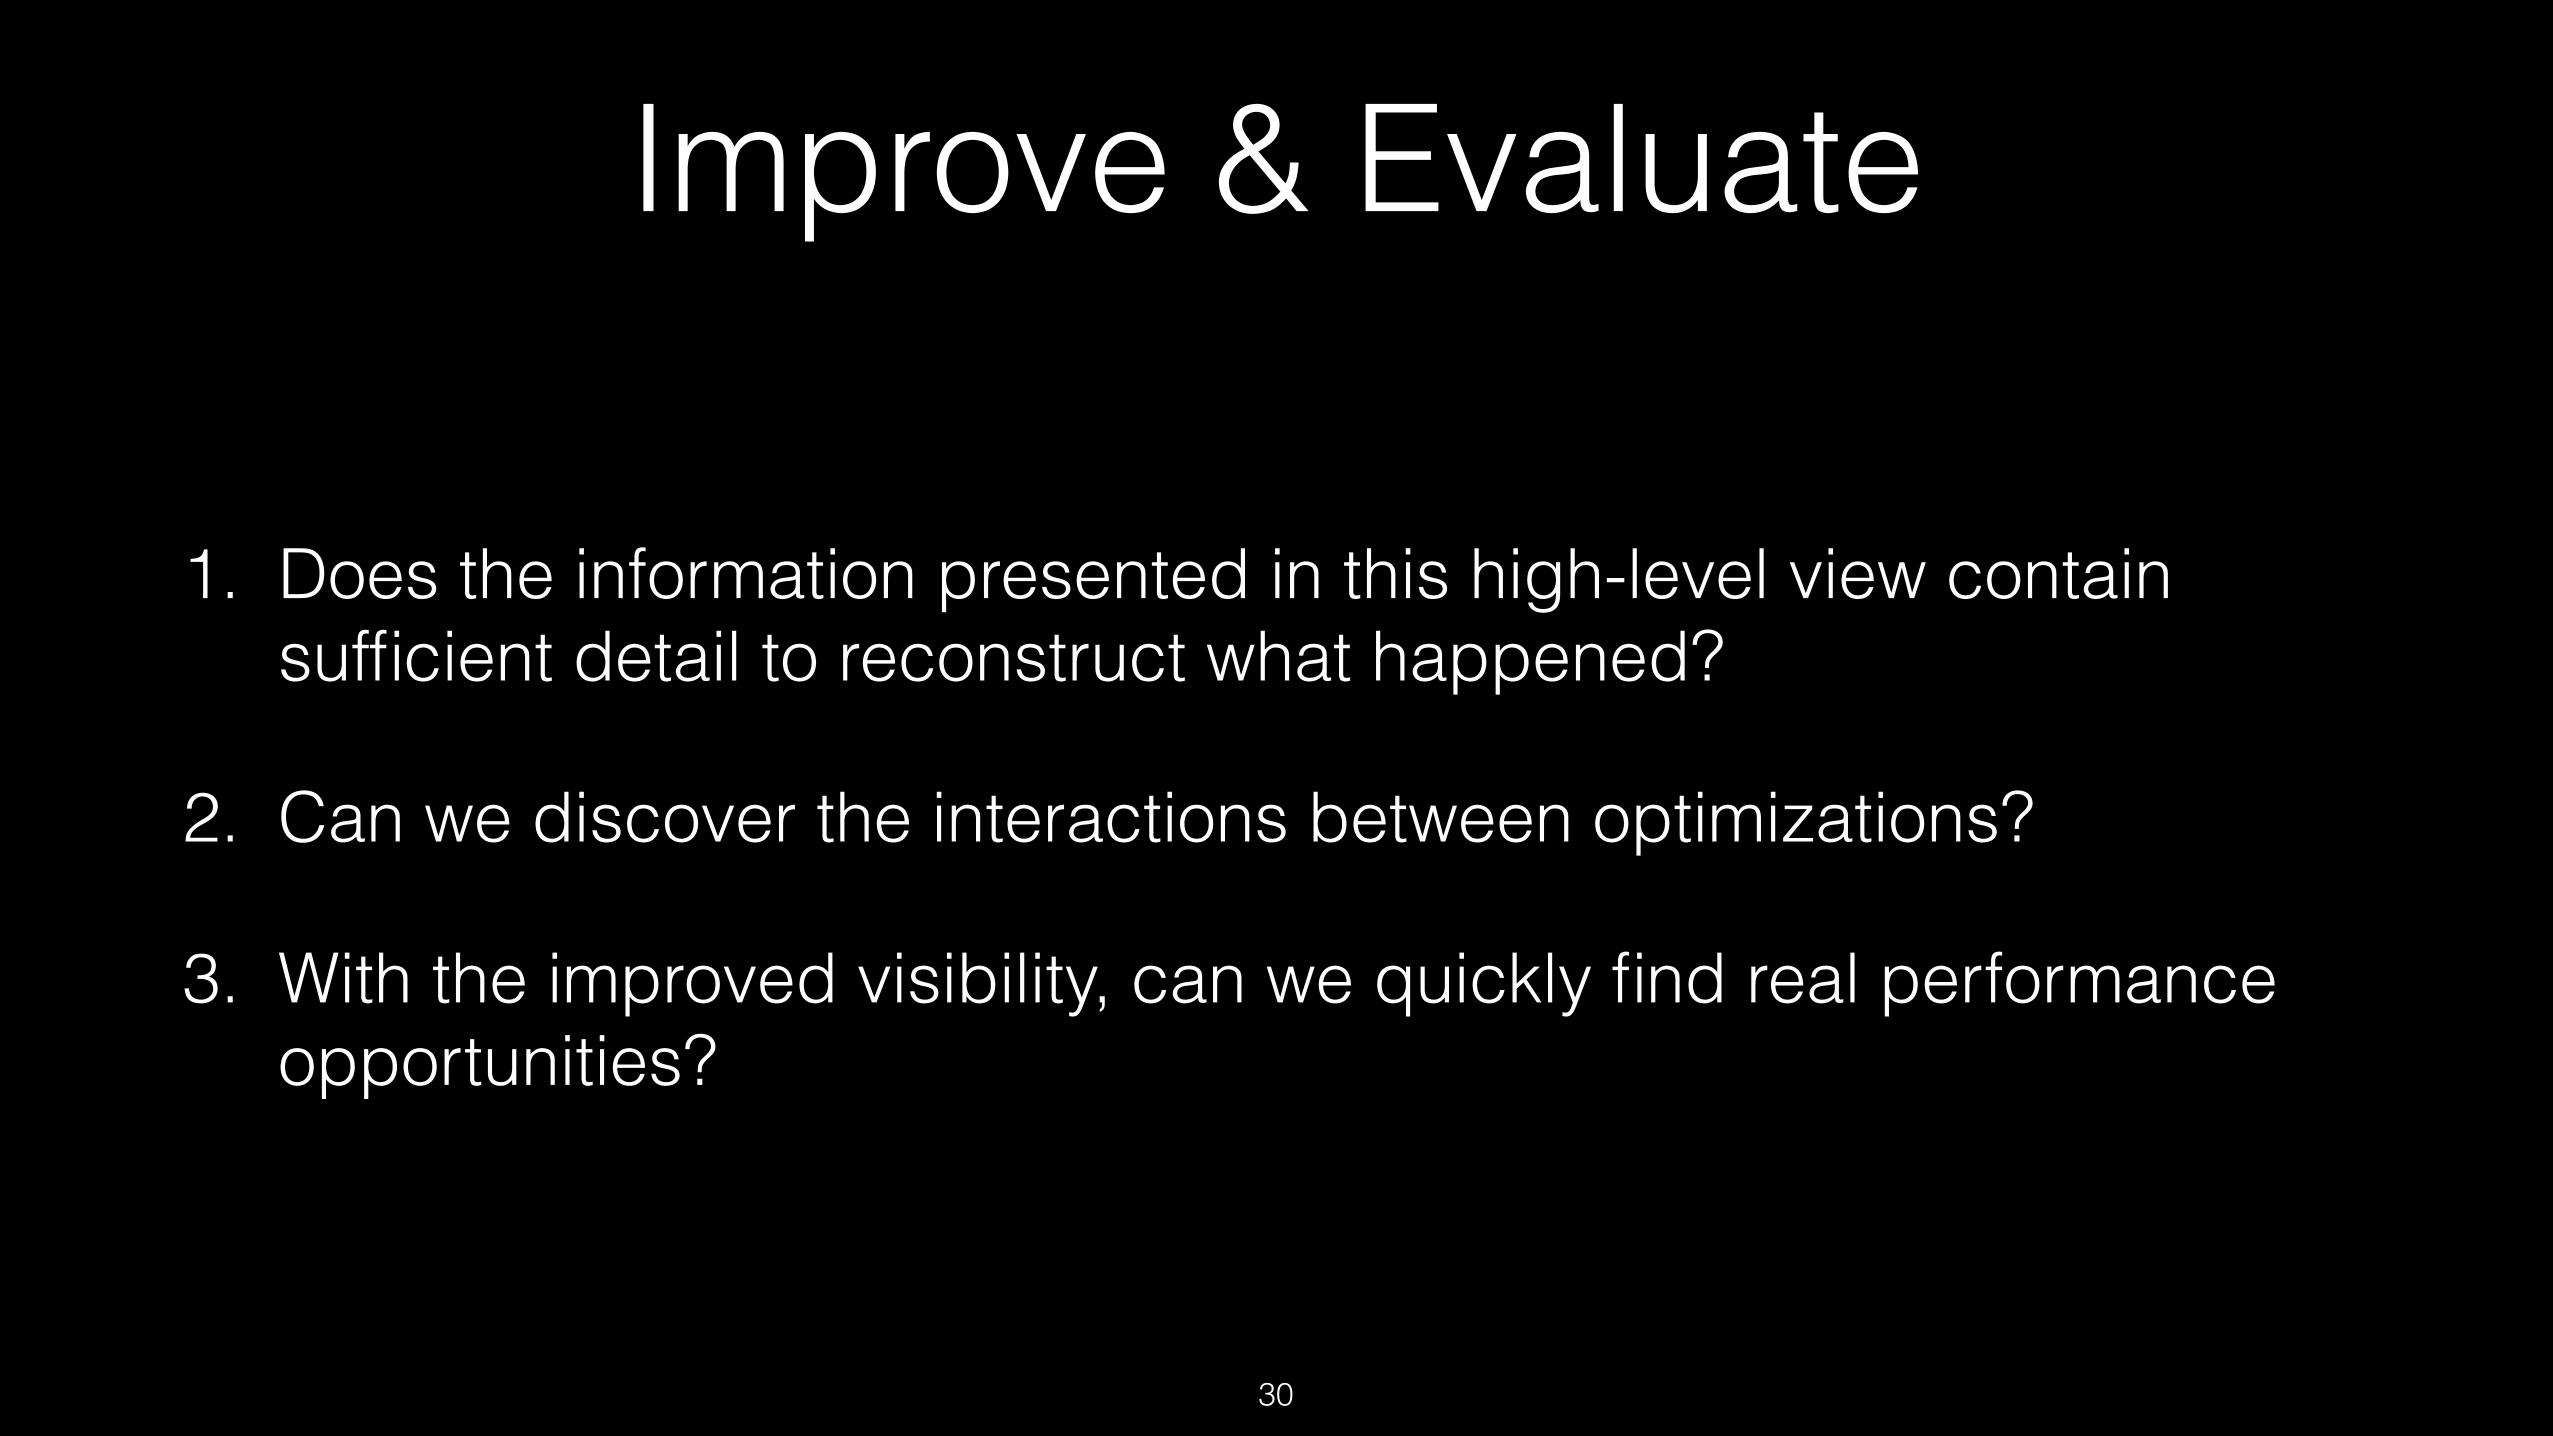
Improve & Evaluate
1. Does the information presented in this high-level view contain sufficient detail to reconstruct what happened?
2. Can we discover the interactions between optimizations?
3. With the improved visibility, can we quickly find real performance opportunities?
30

DhryStone (SingleSource/Benchmark)
Interaction of Optimizations
31
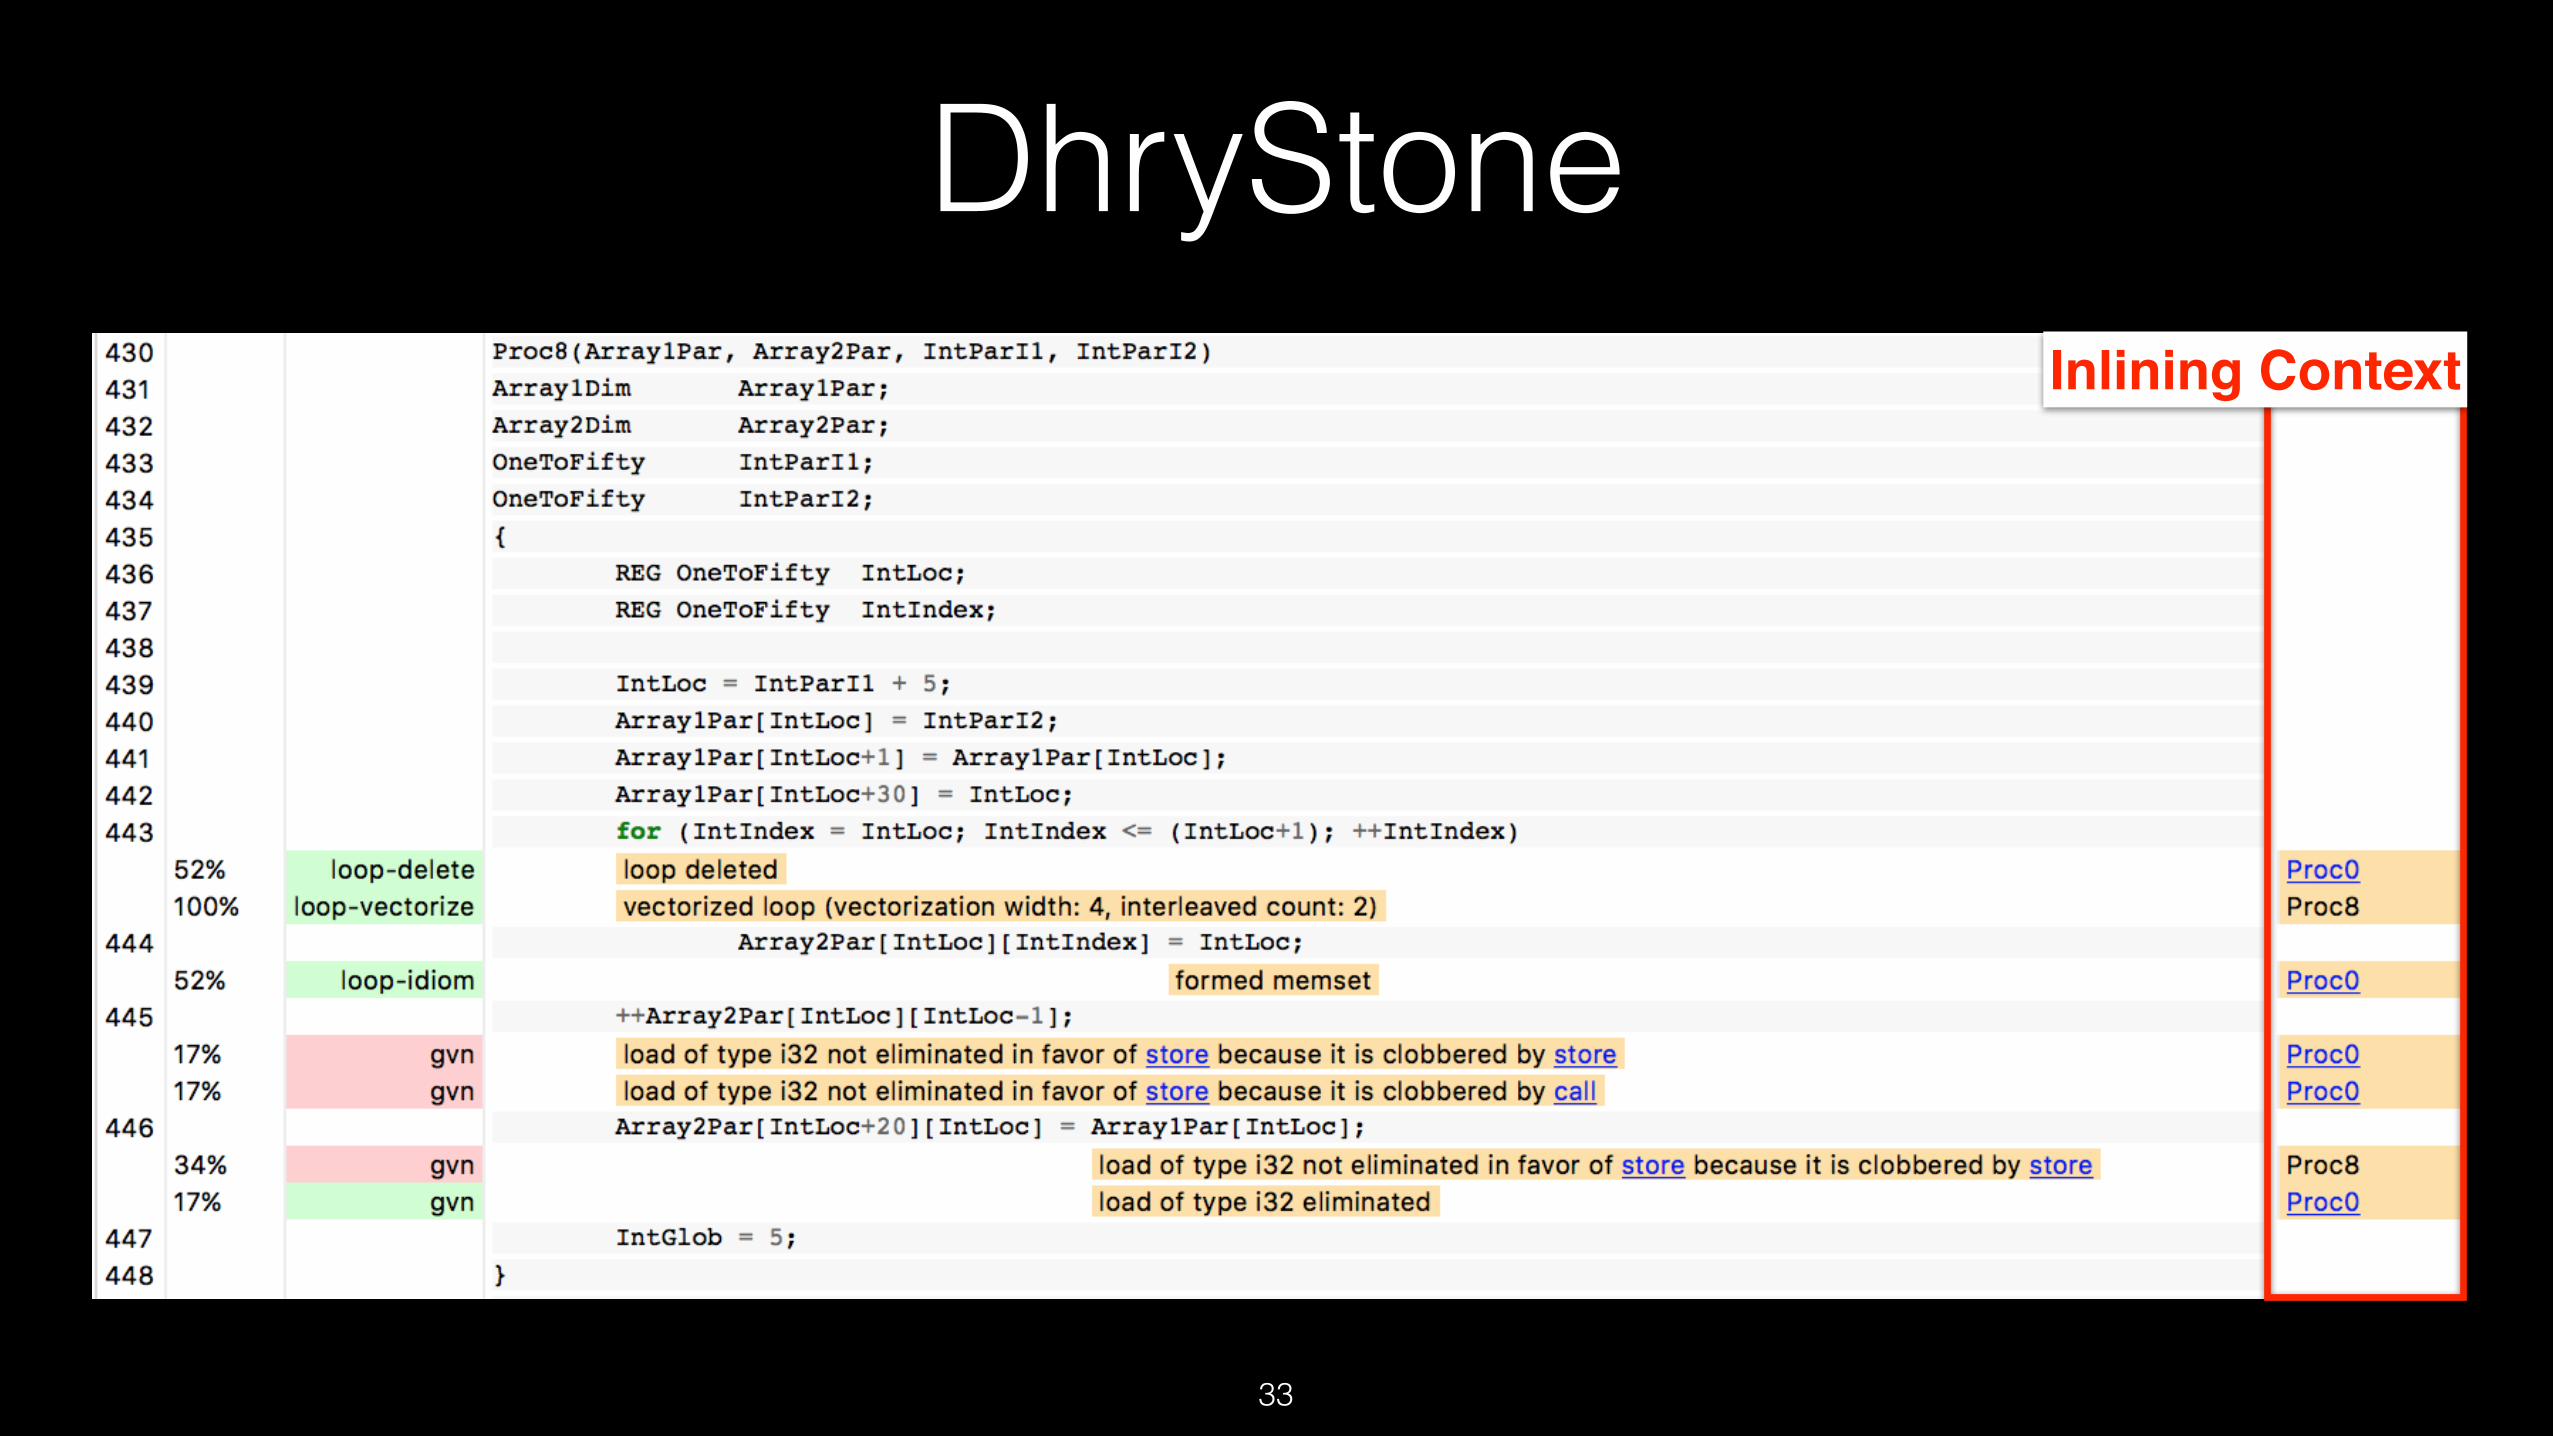
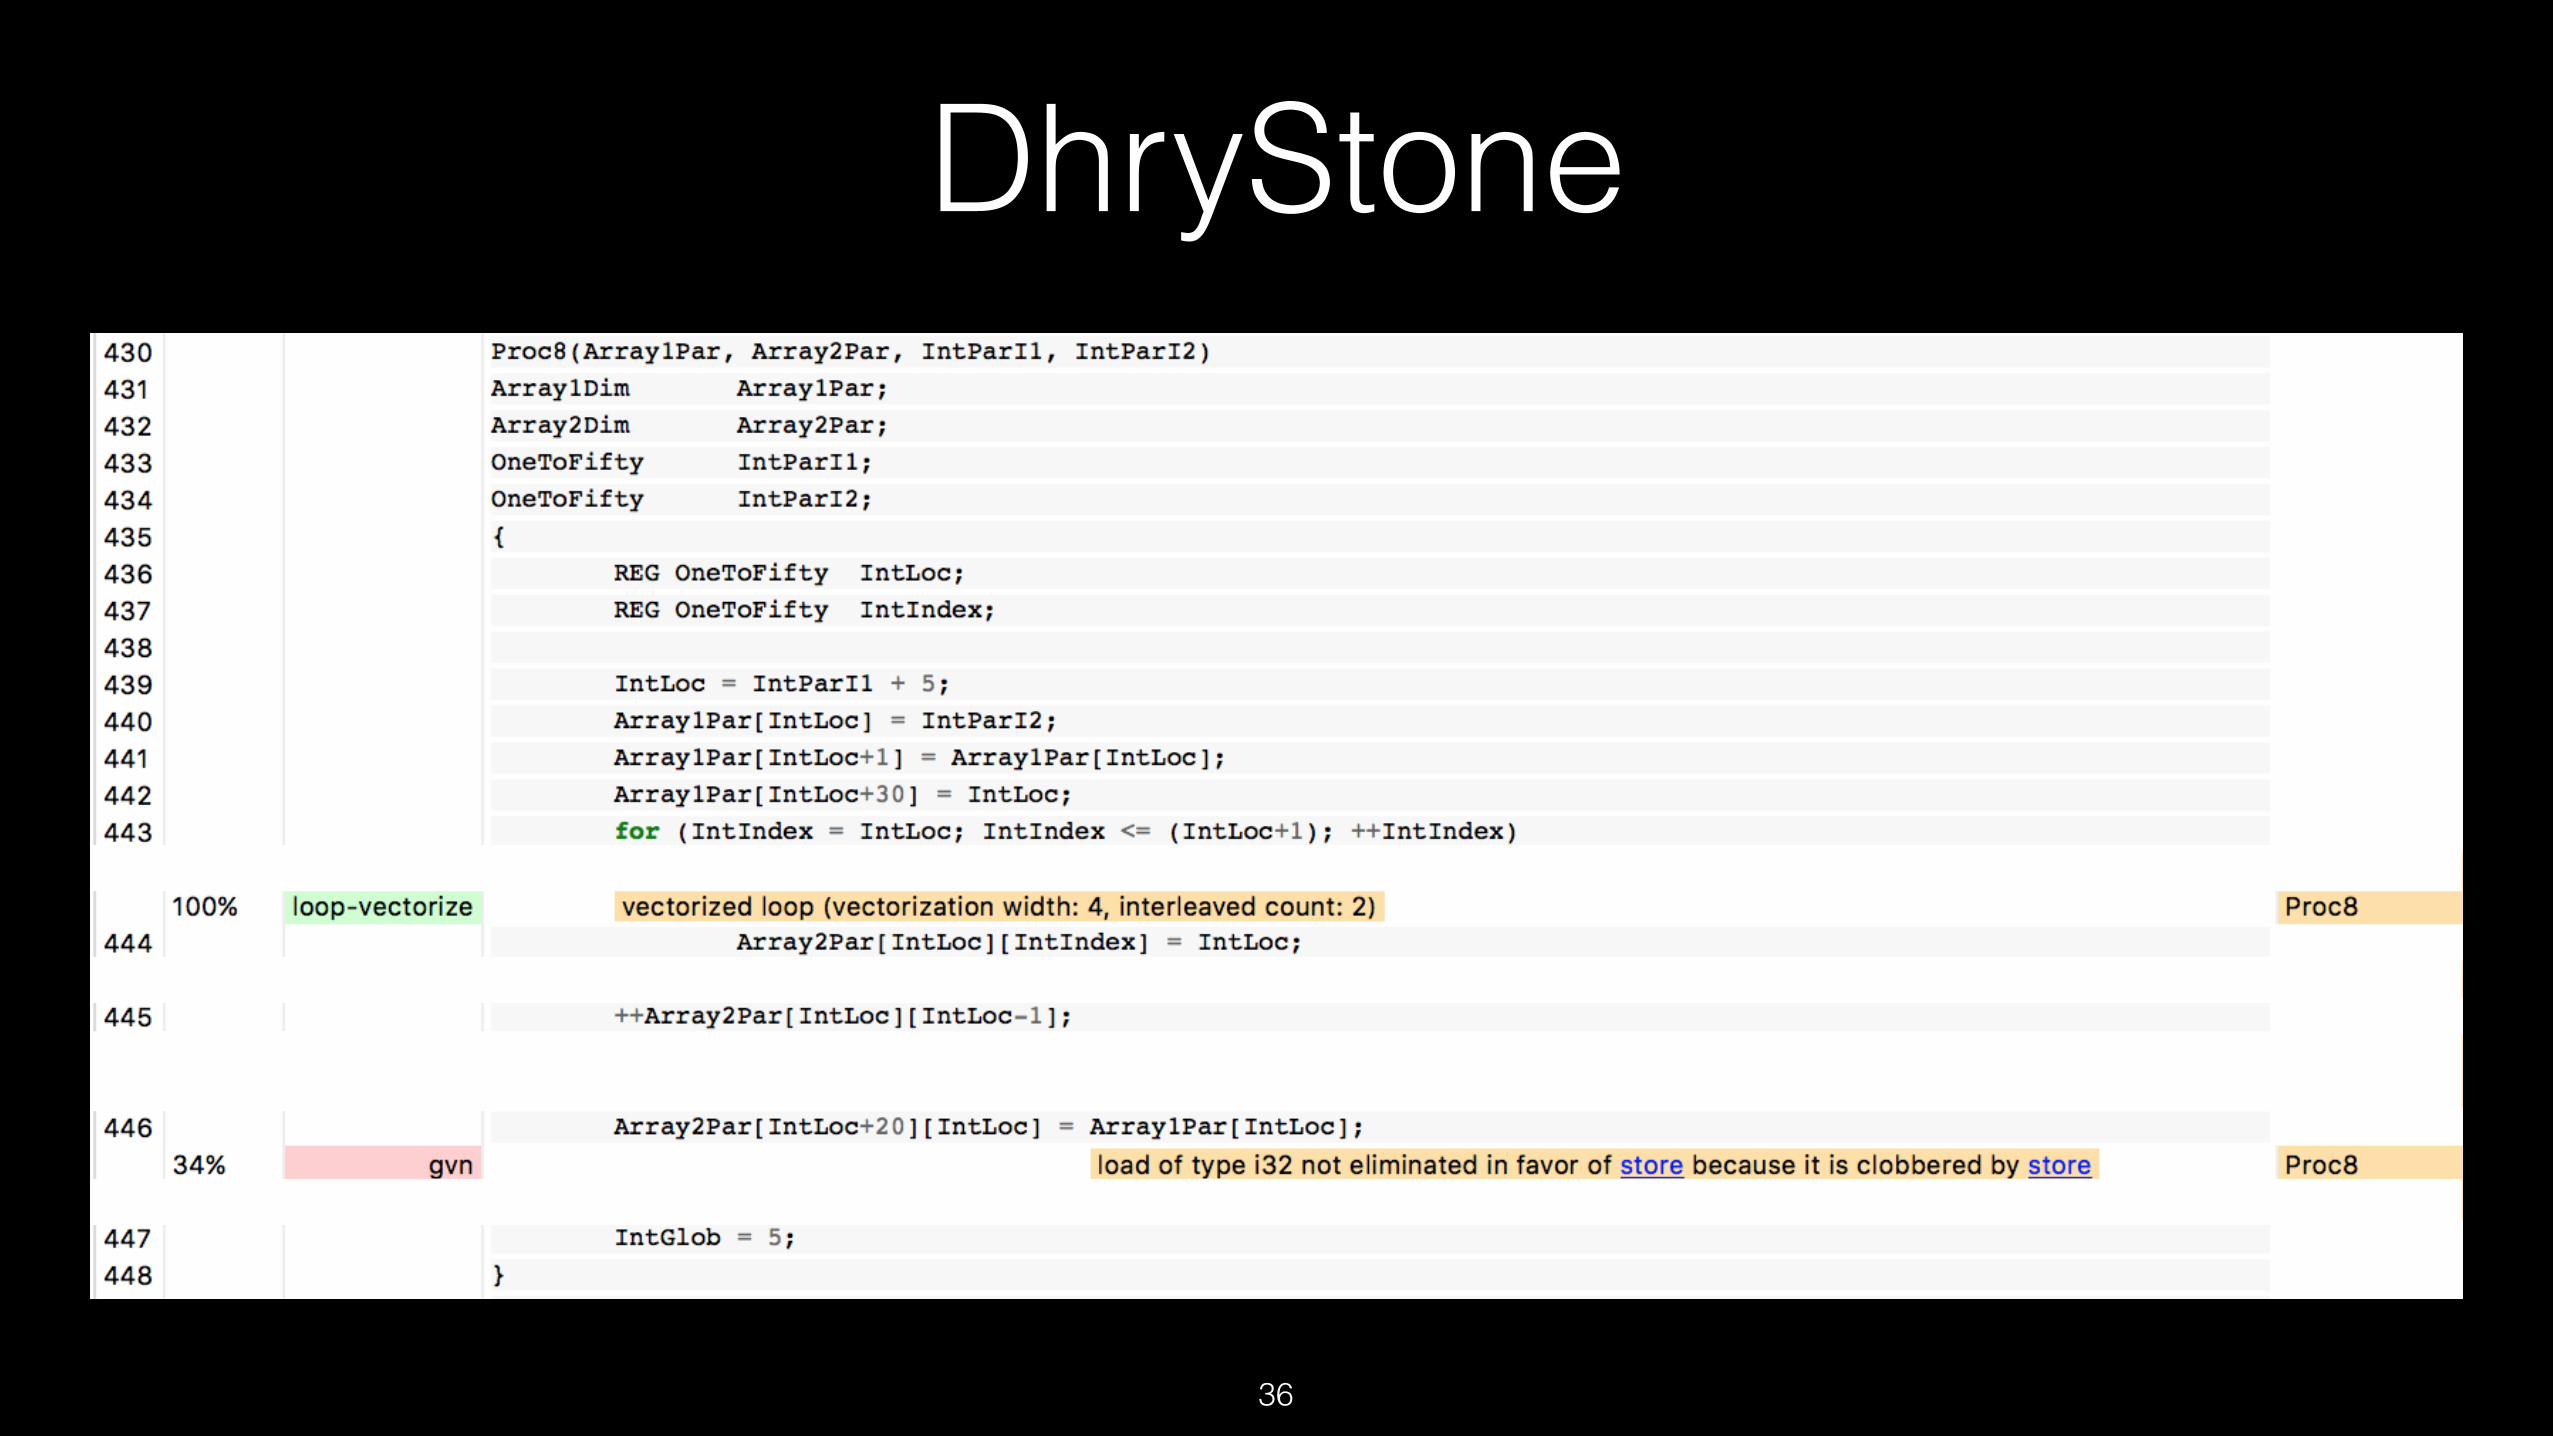
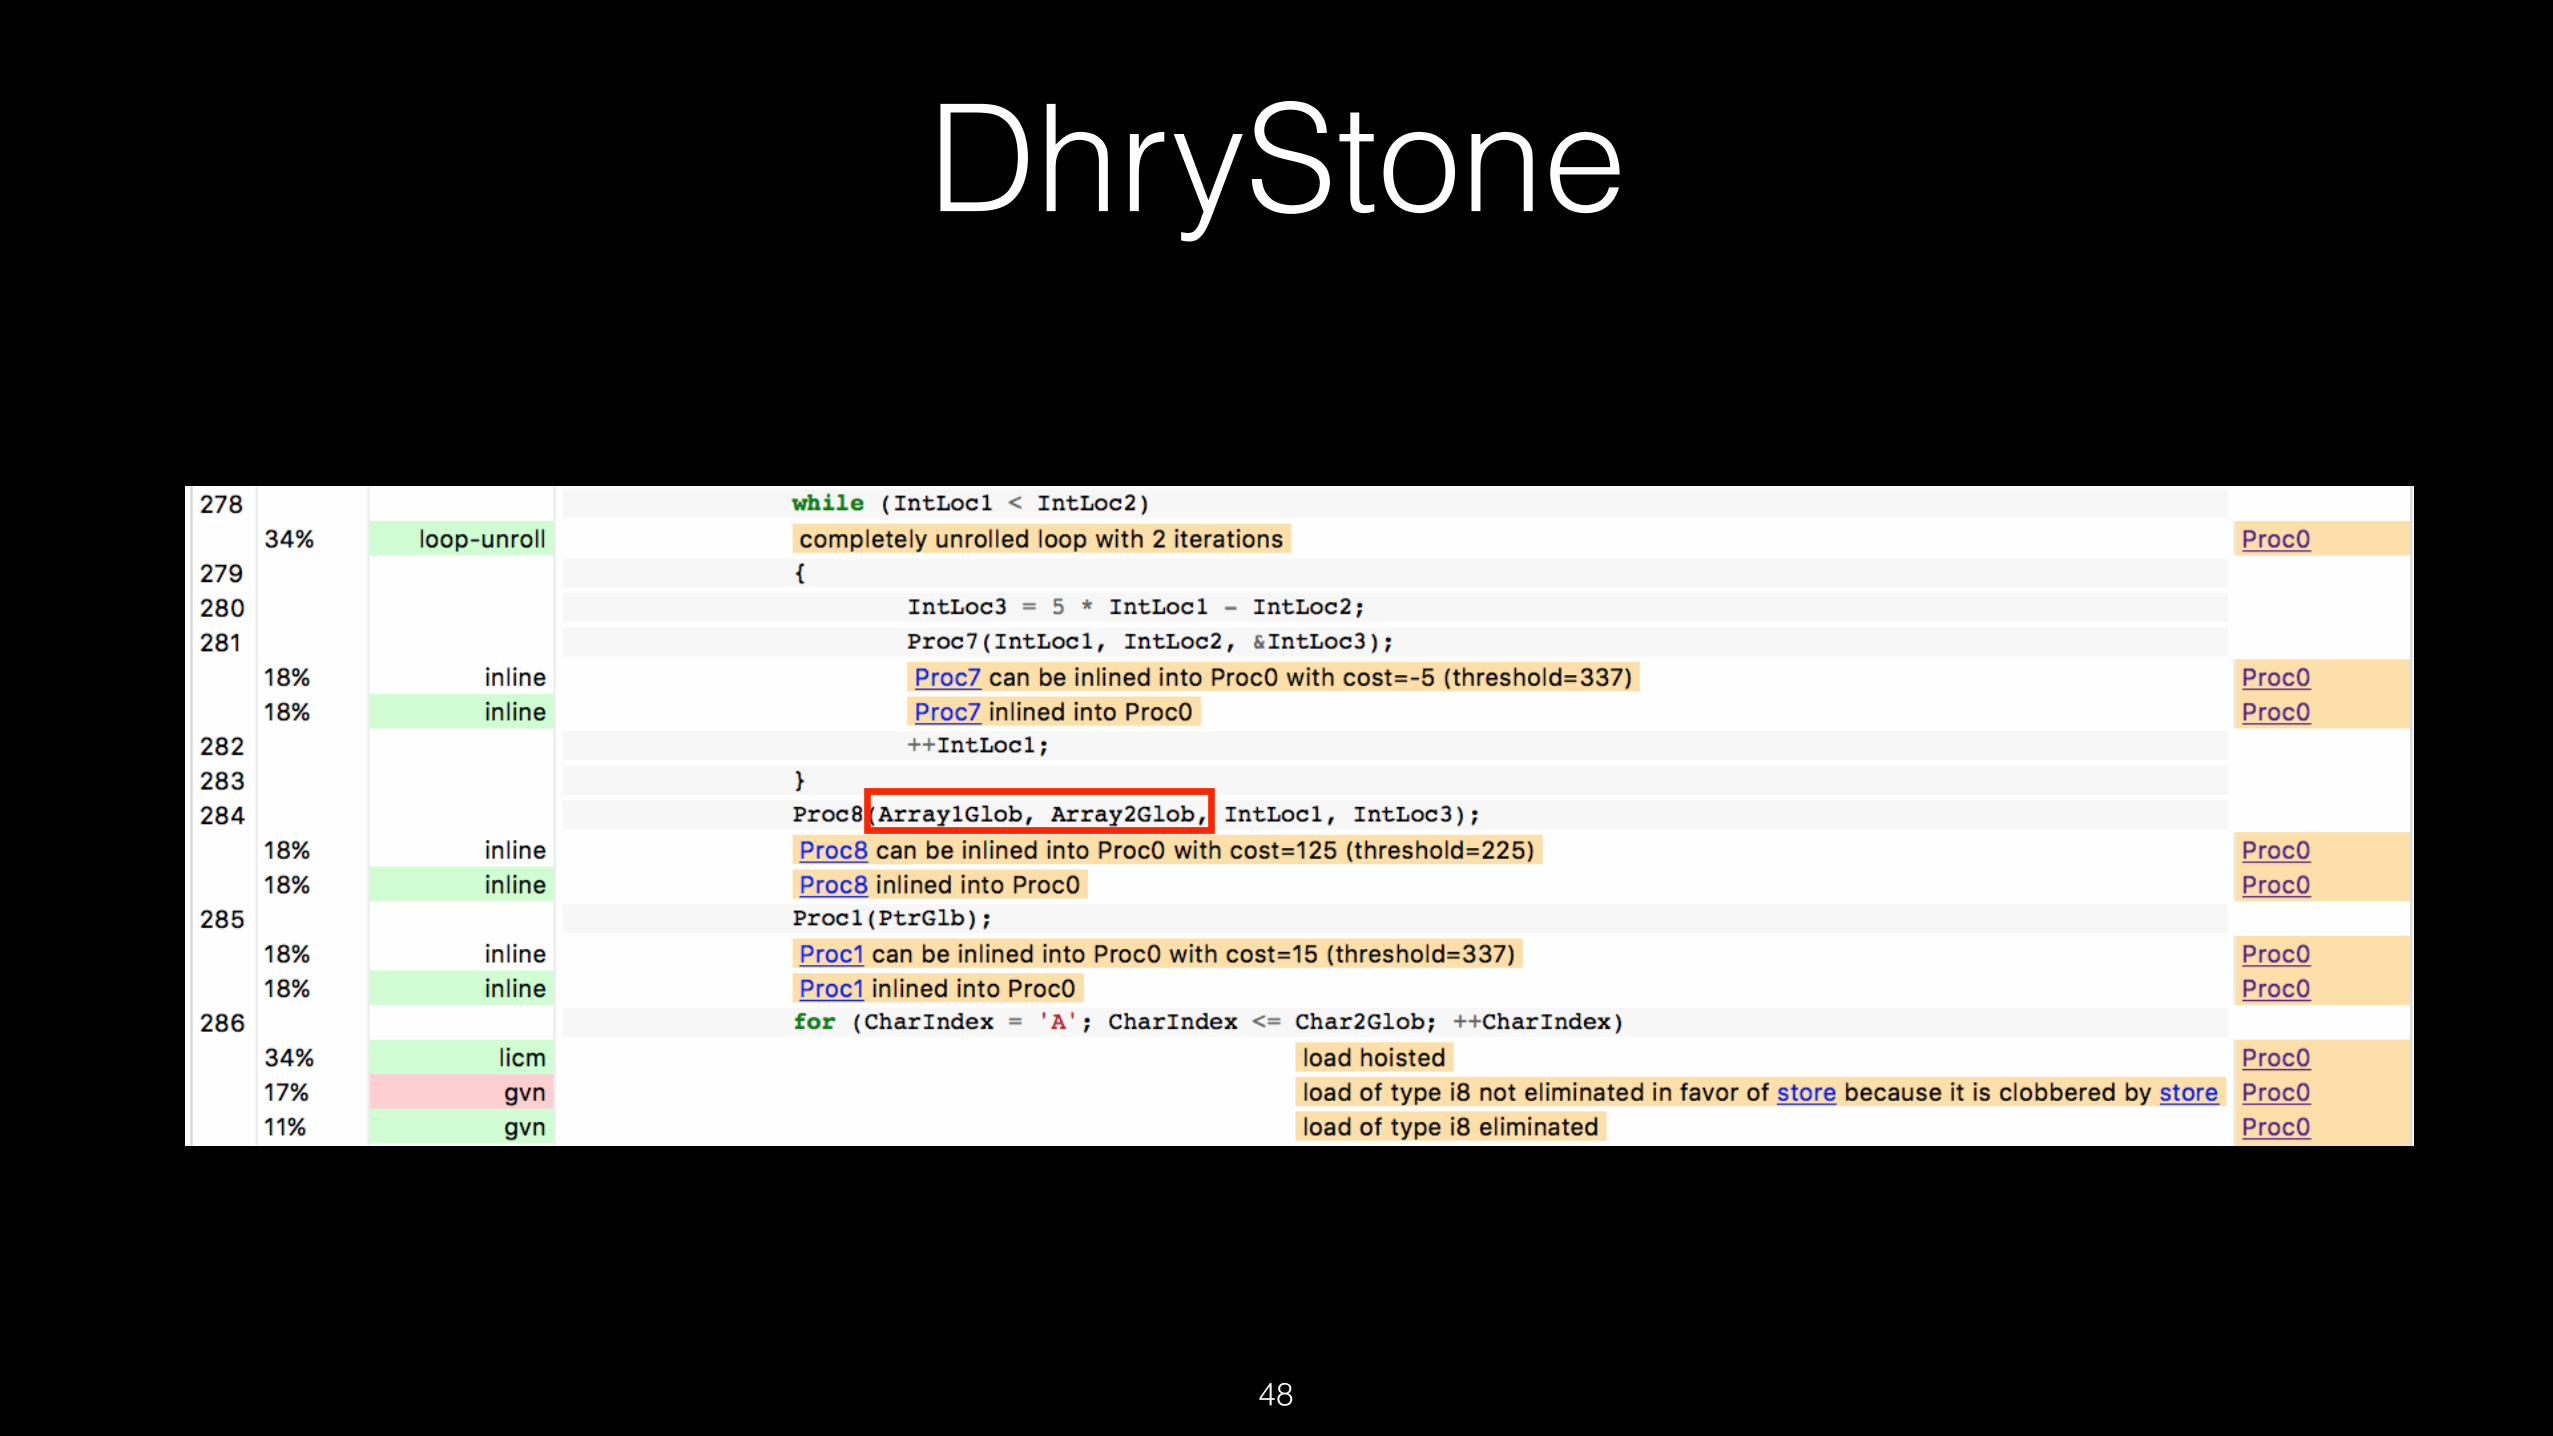
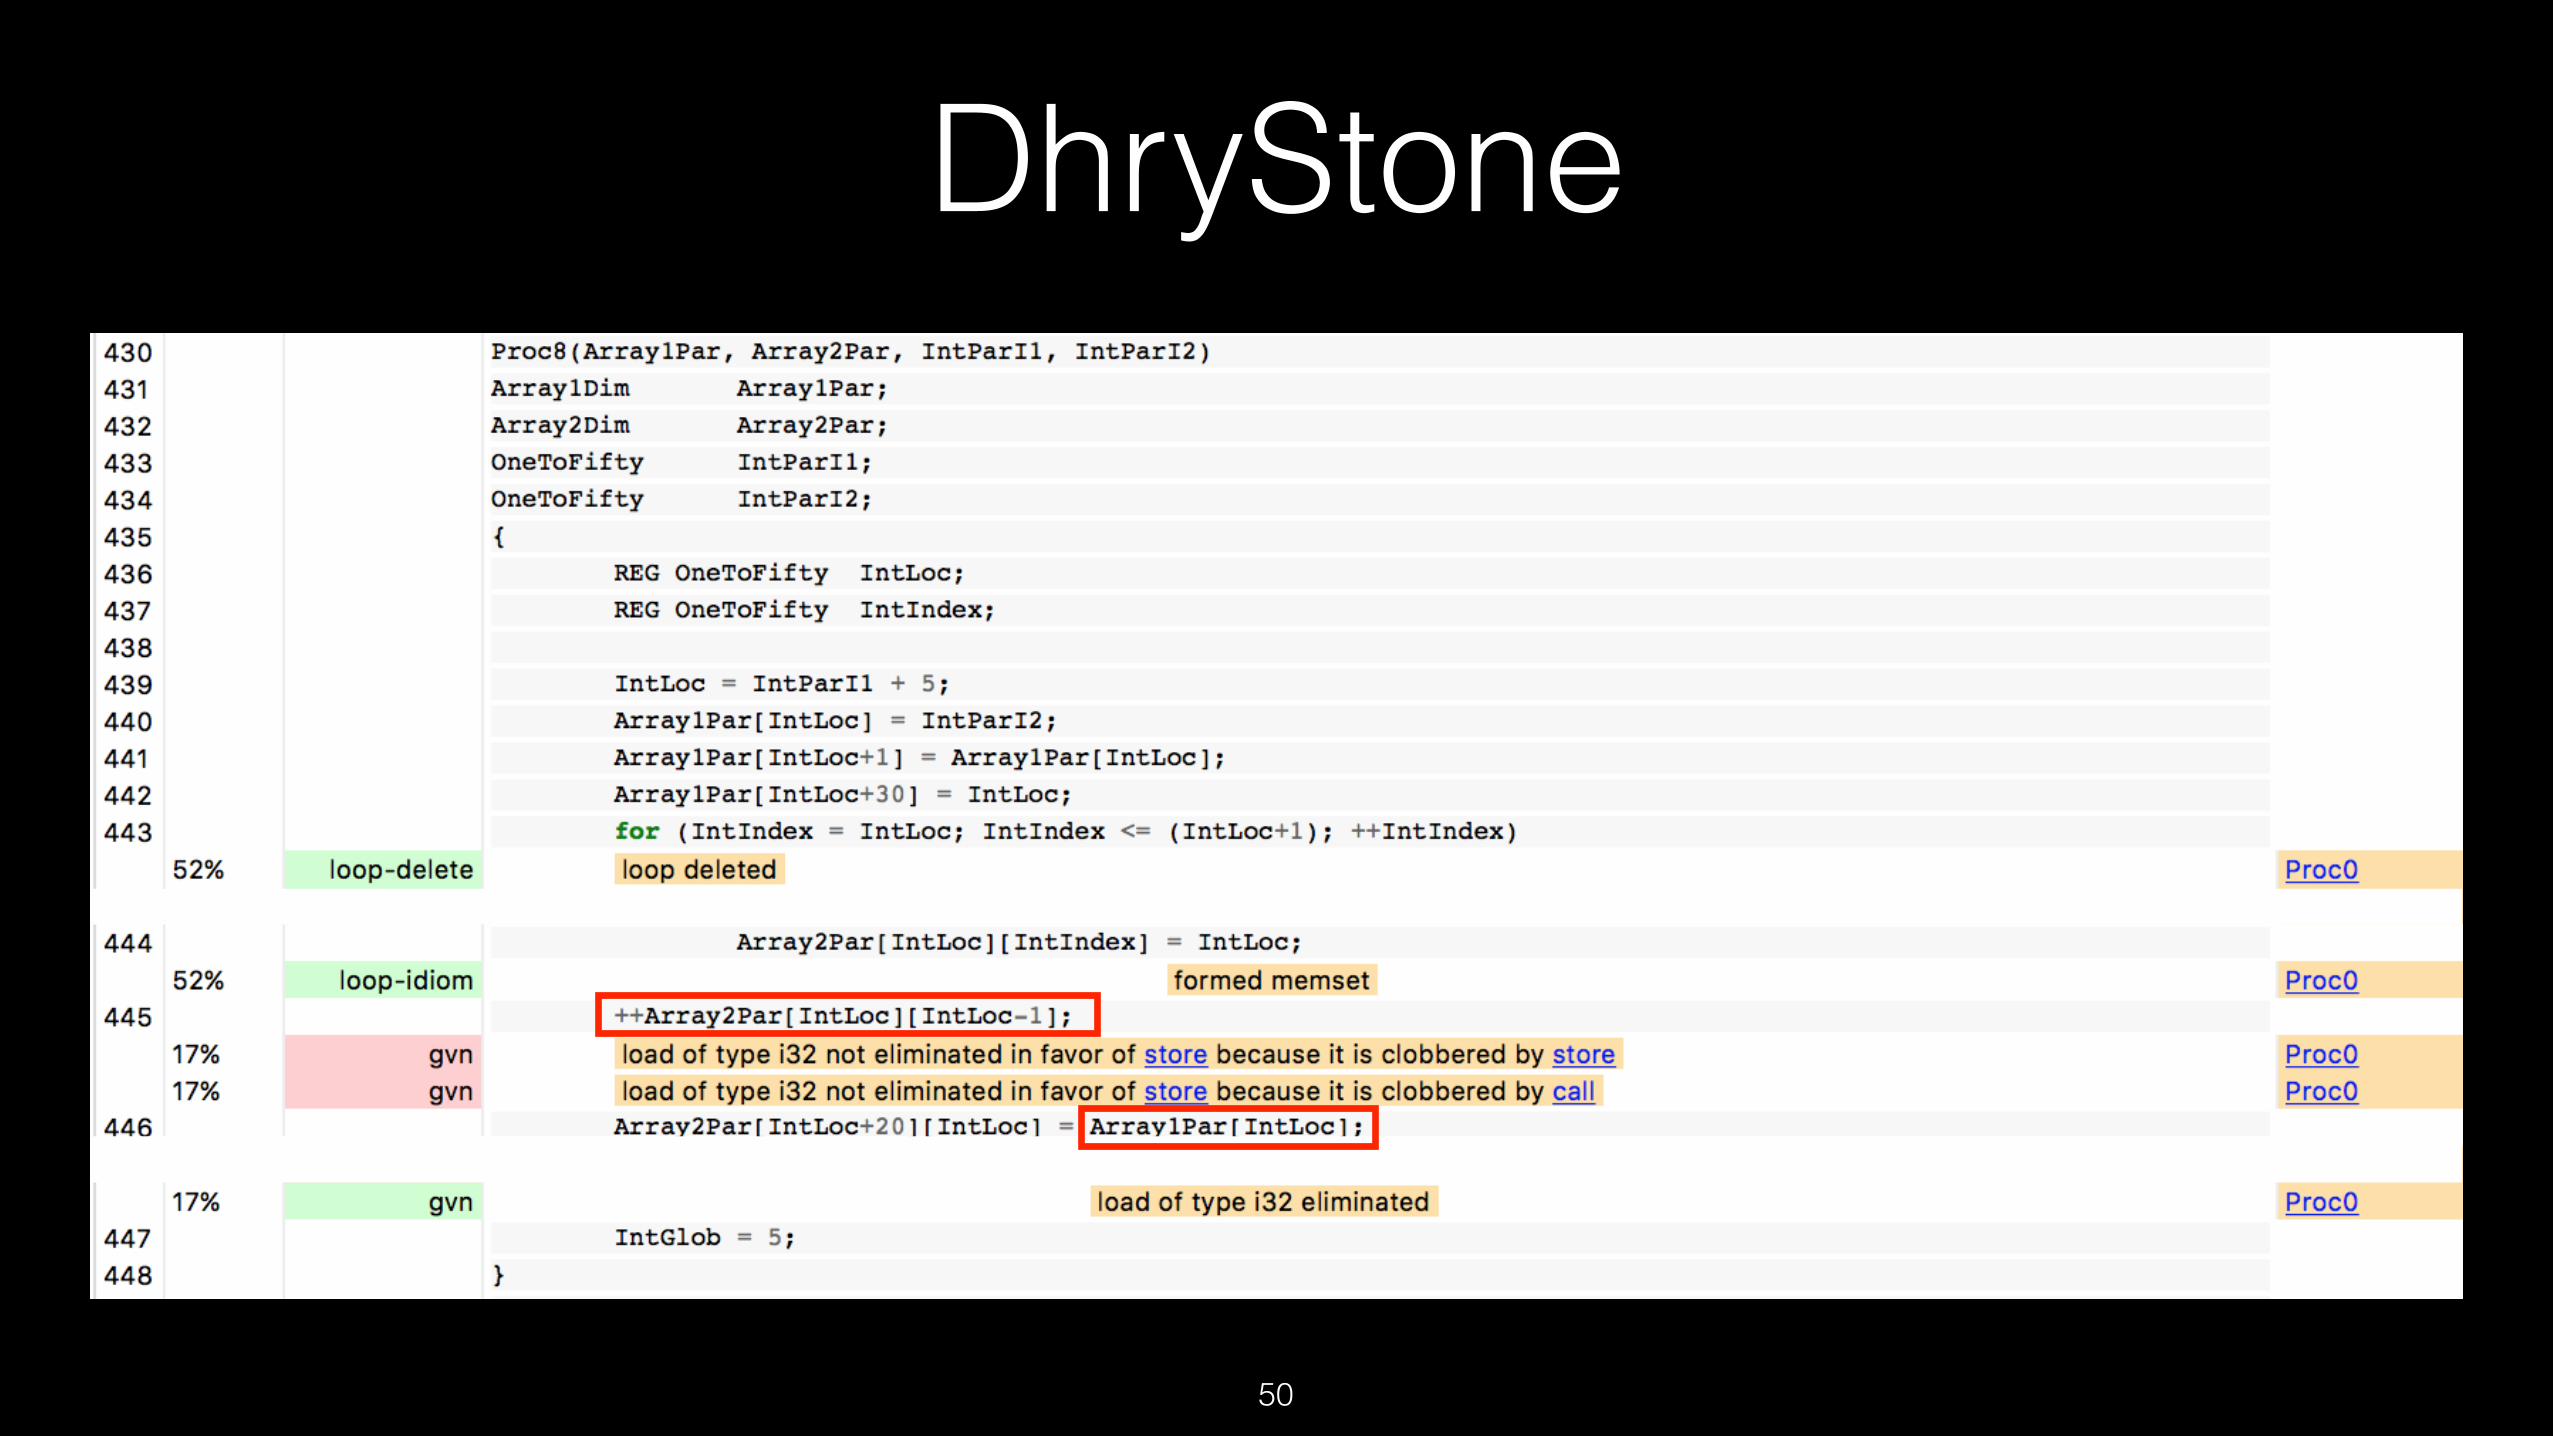
DhryStone
33
Inlining Context
DhryStone
36
DhryStone
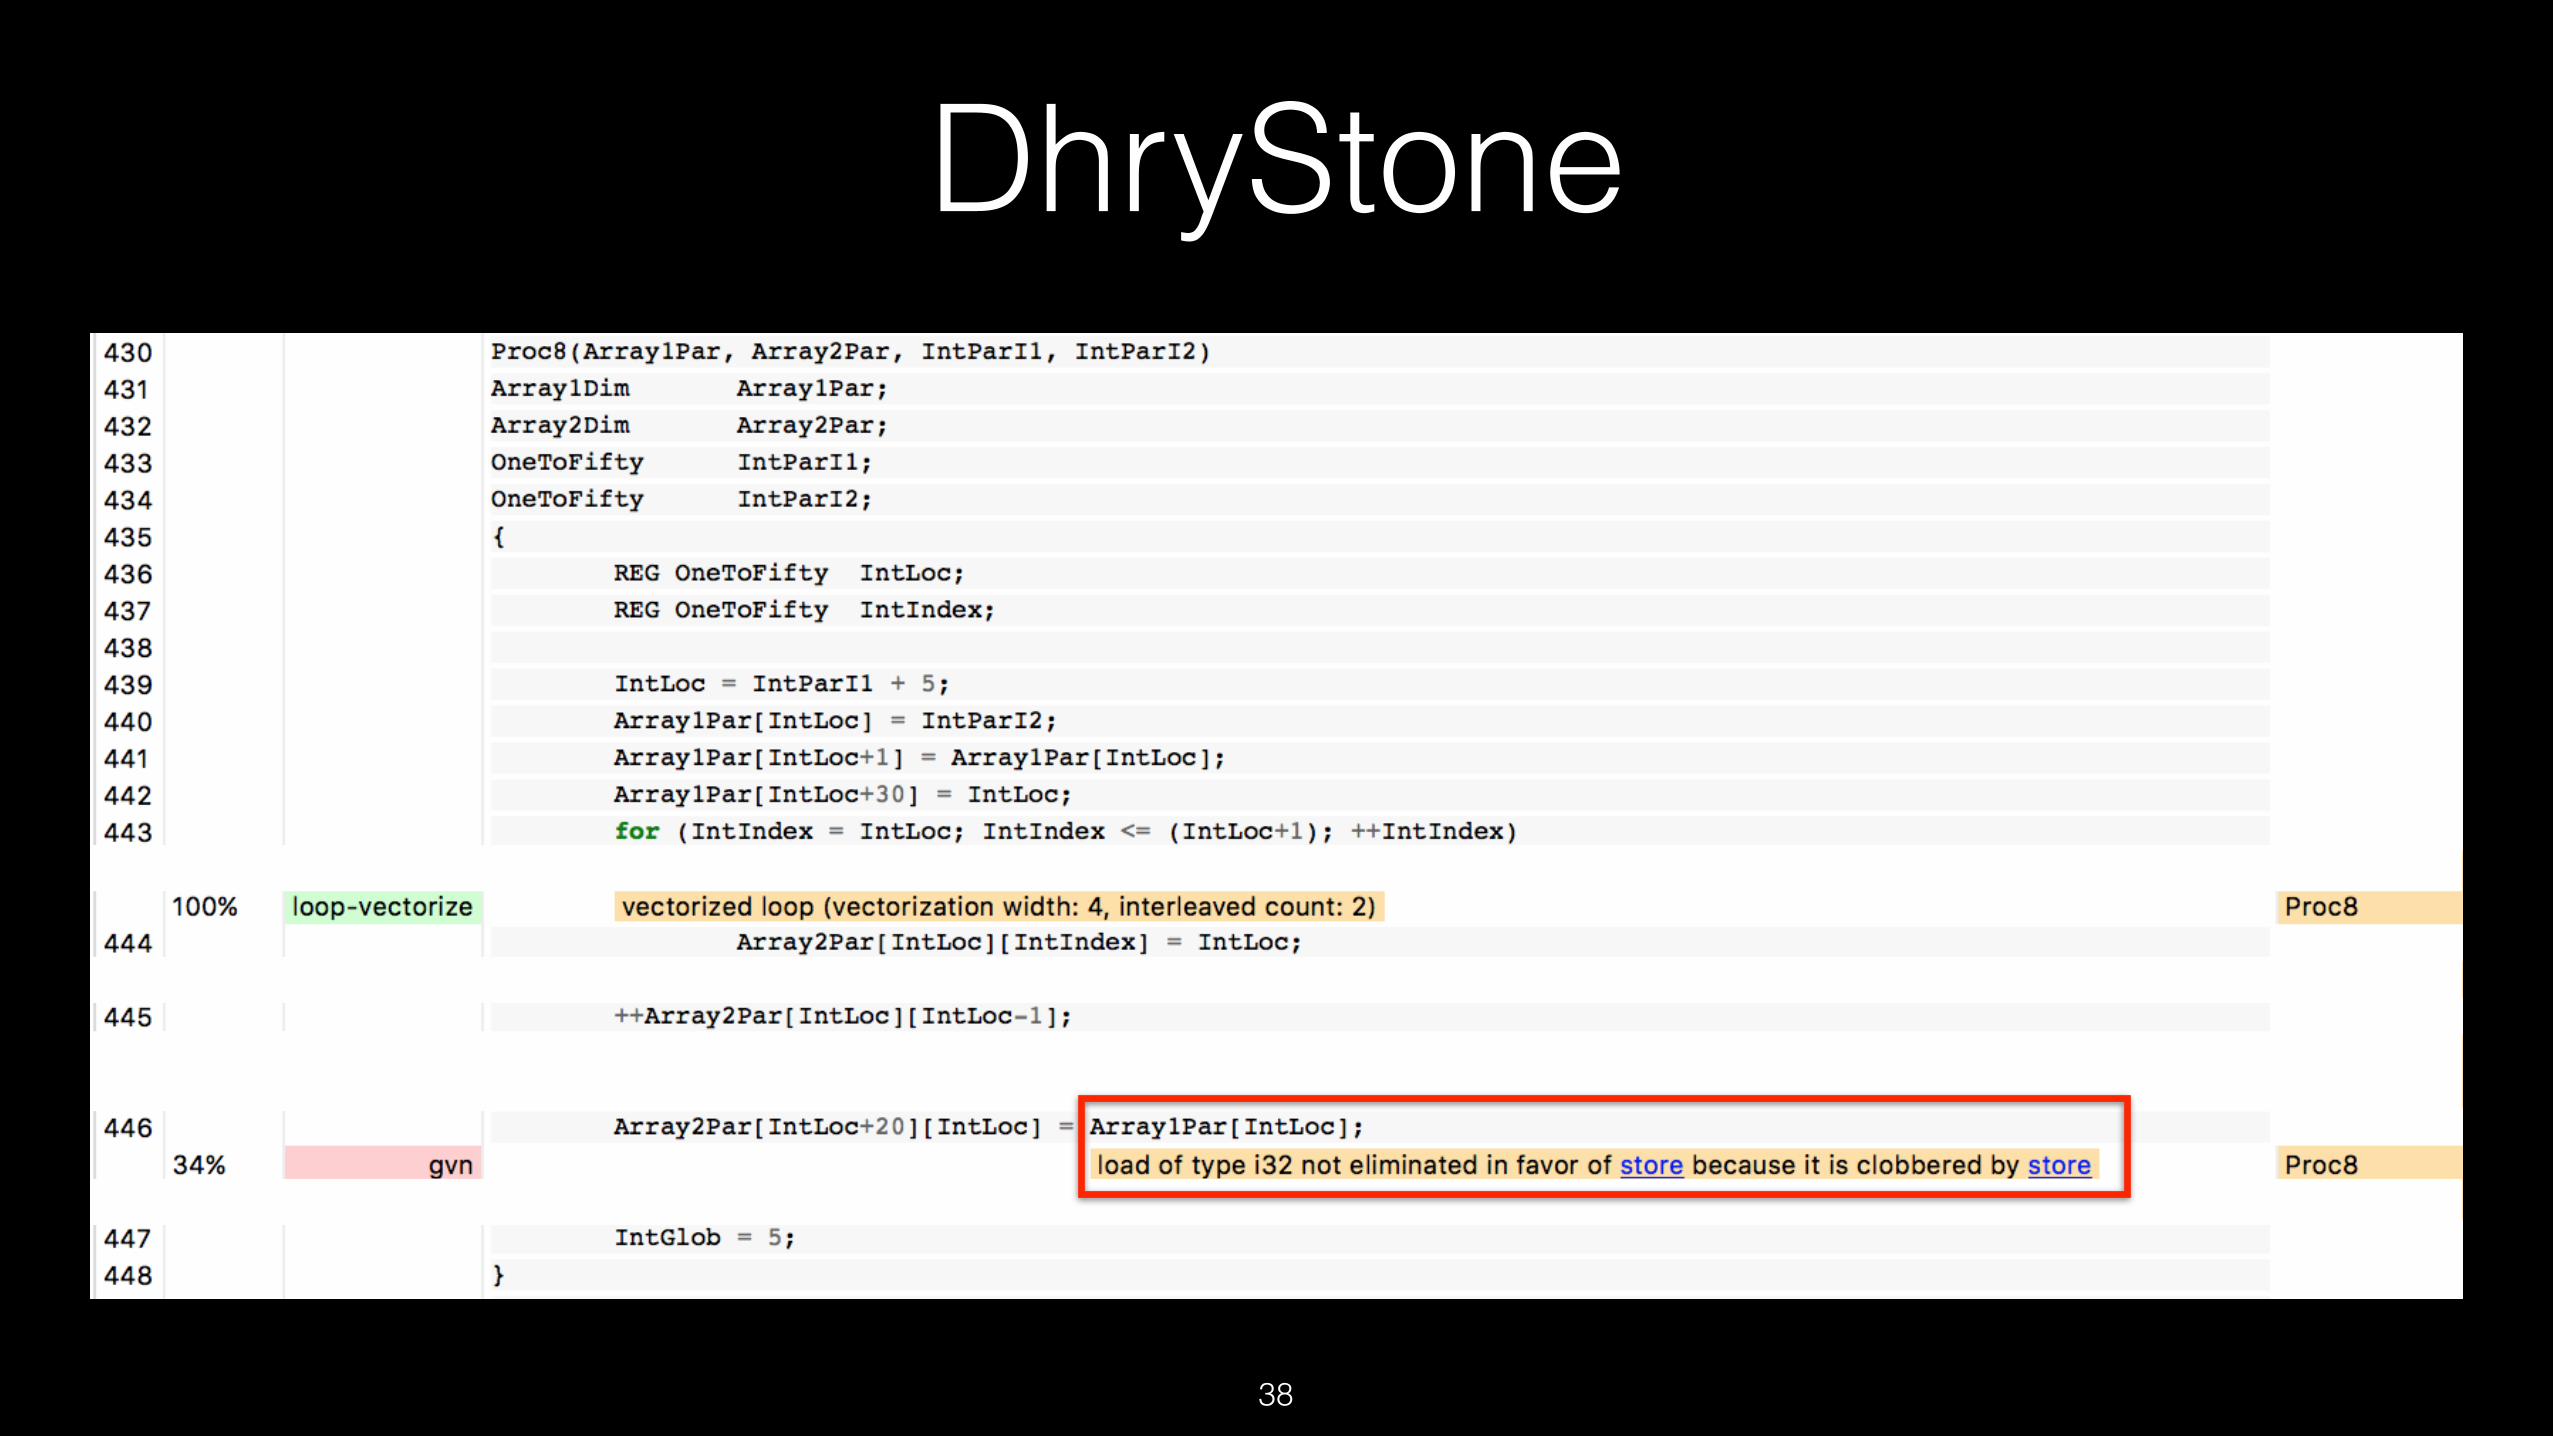
38

DhryStone
40
DhryStone
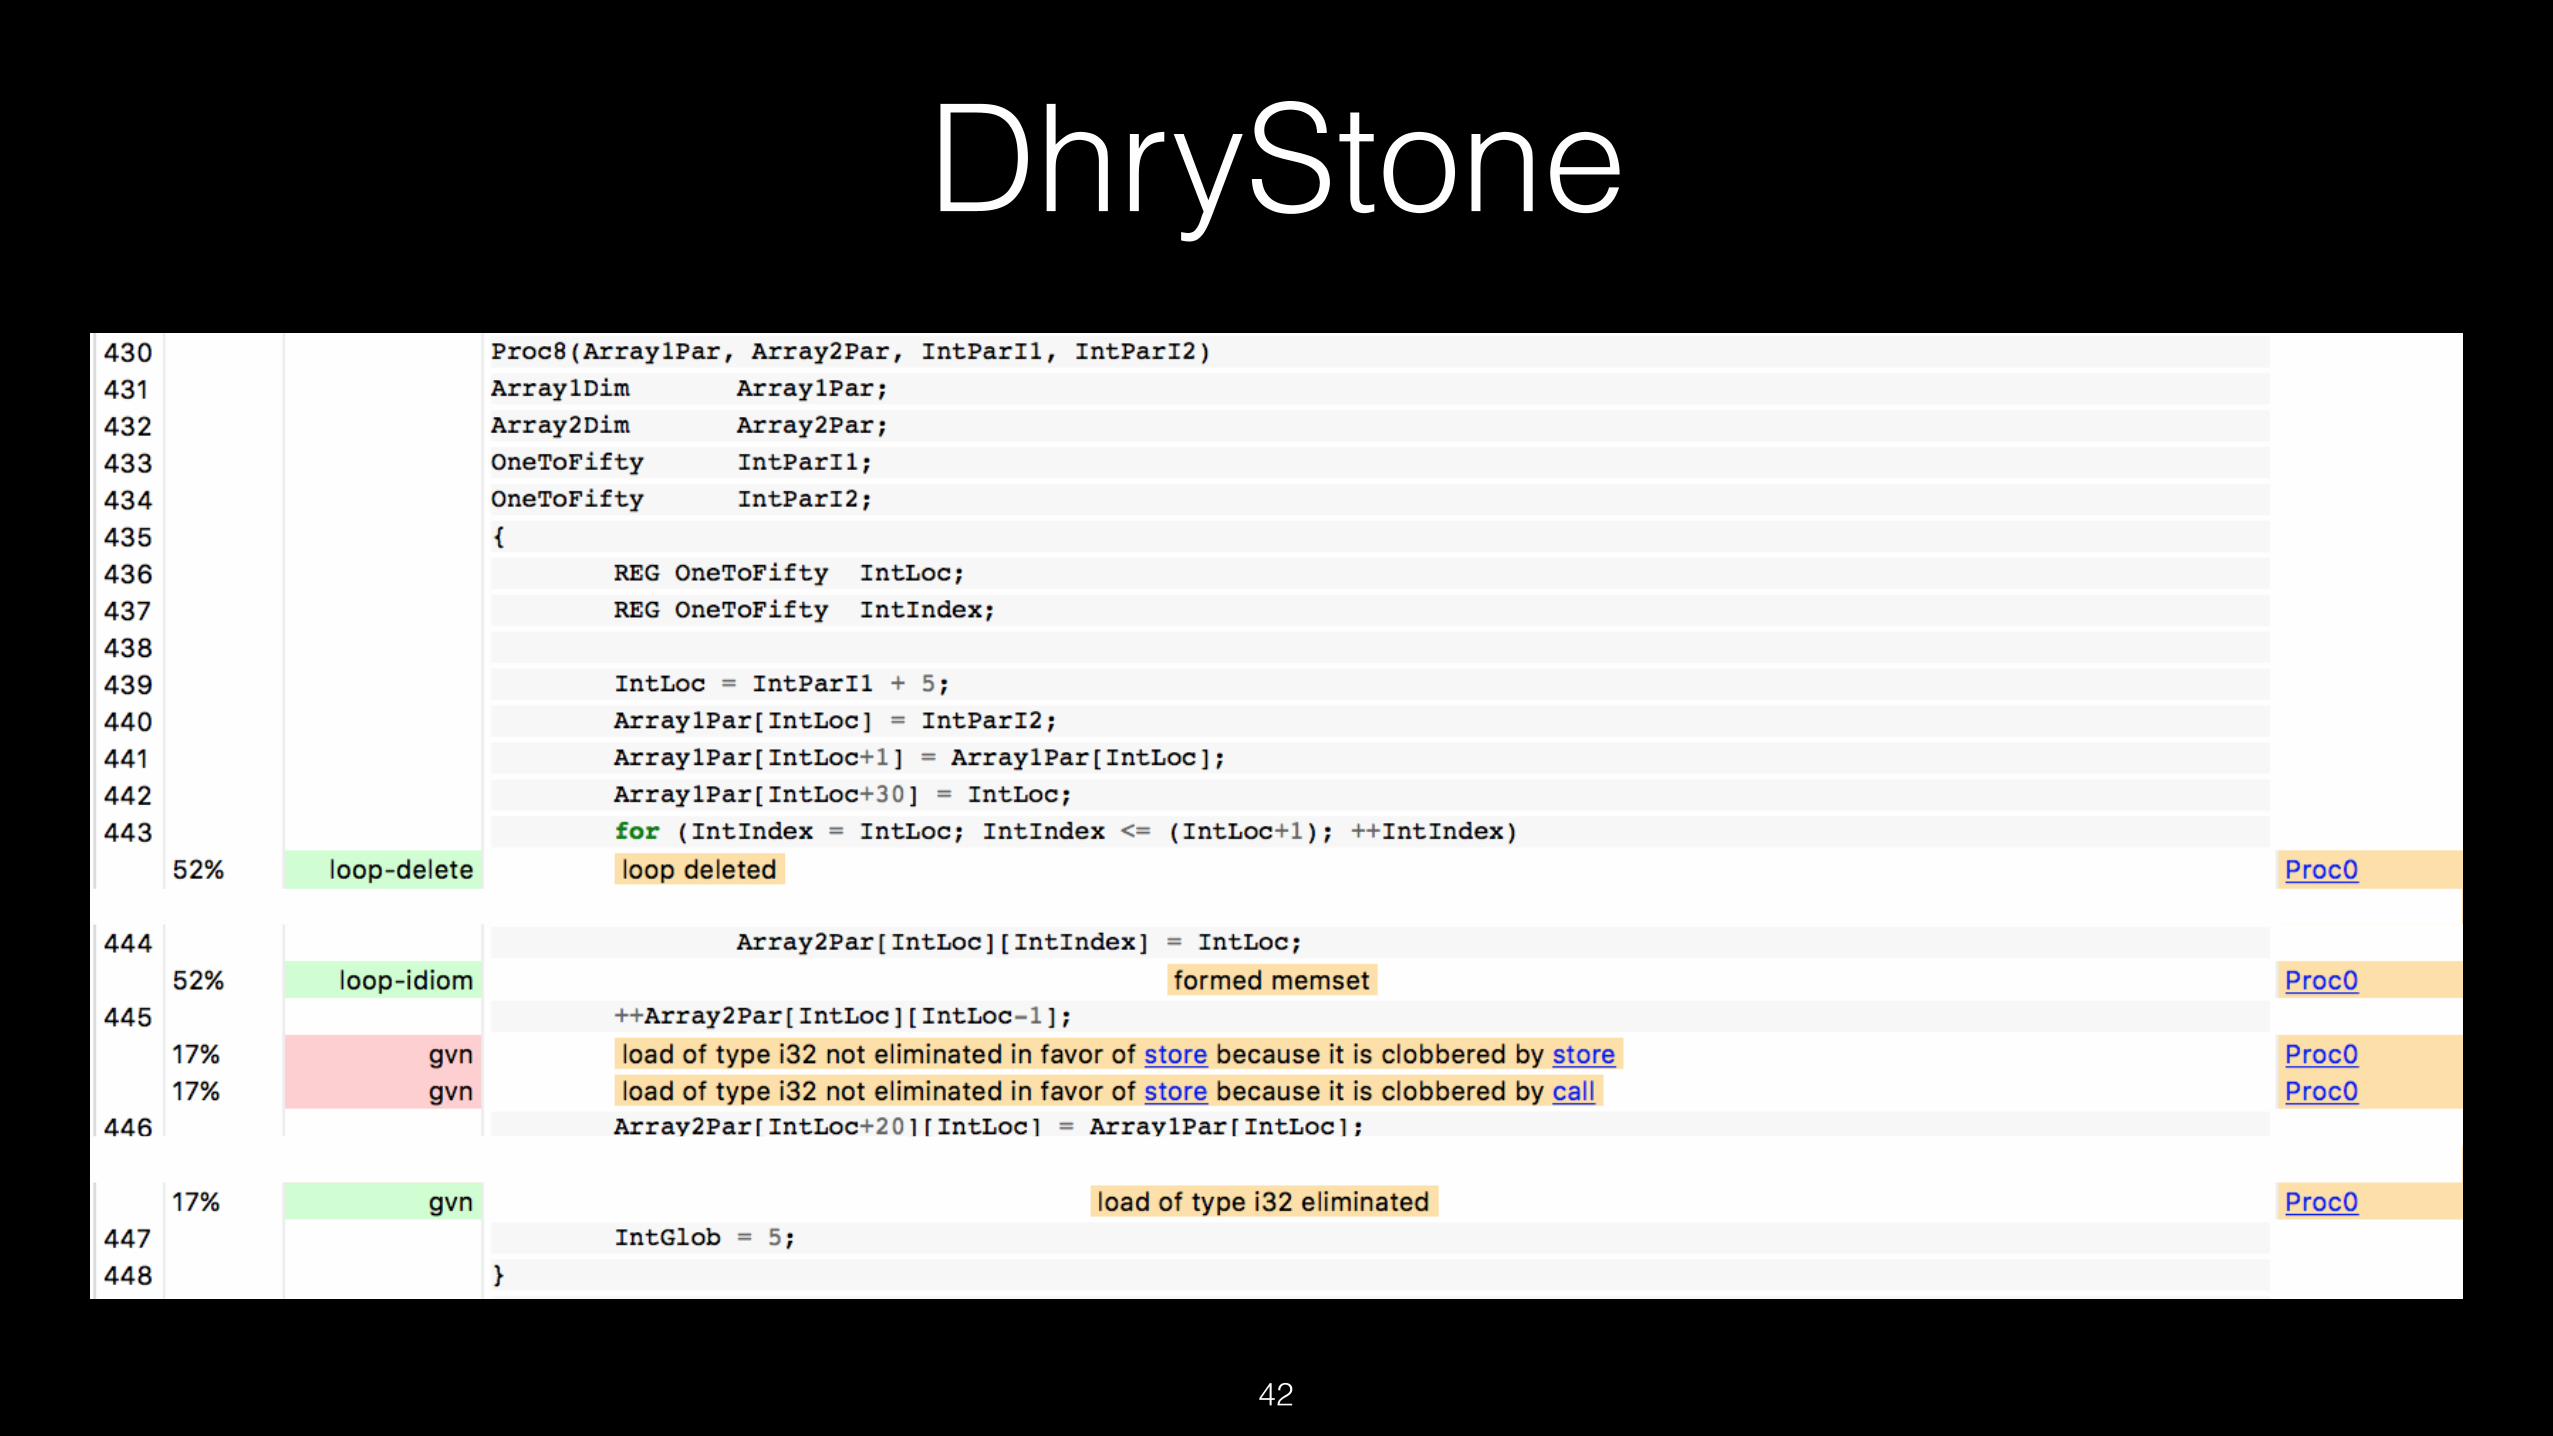
42

DhryStone
45
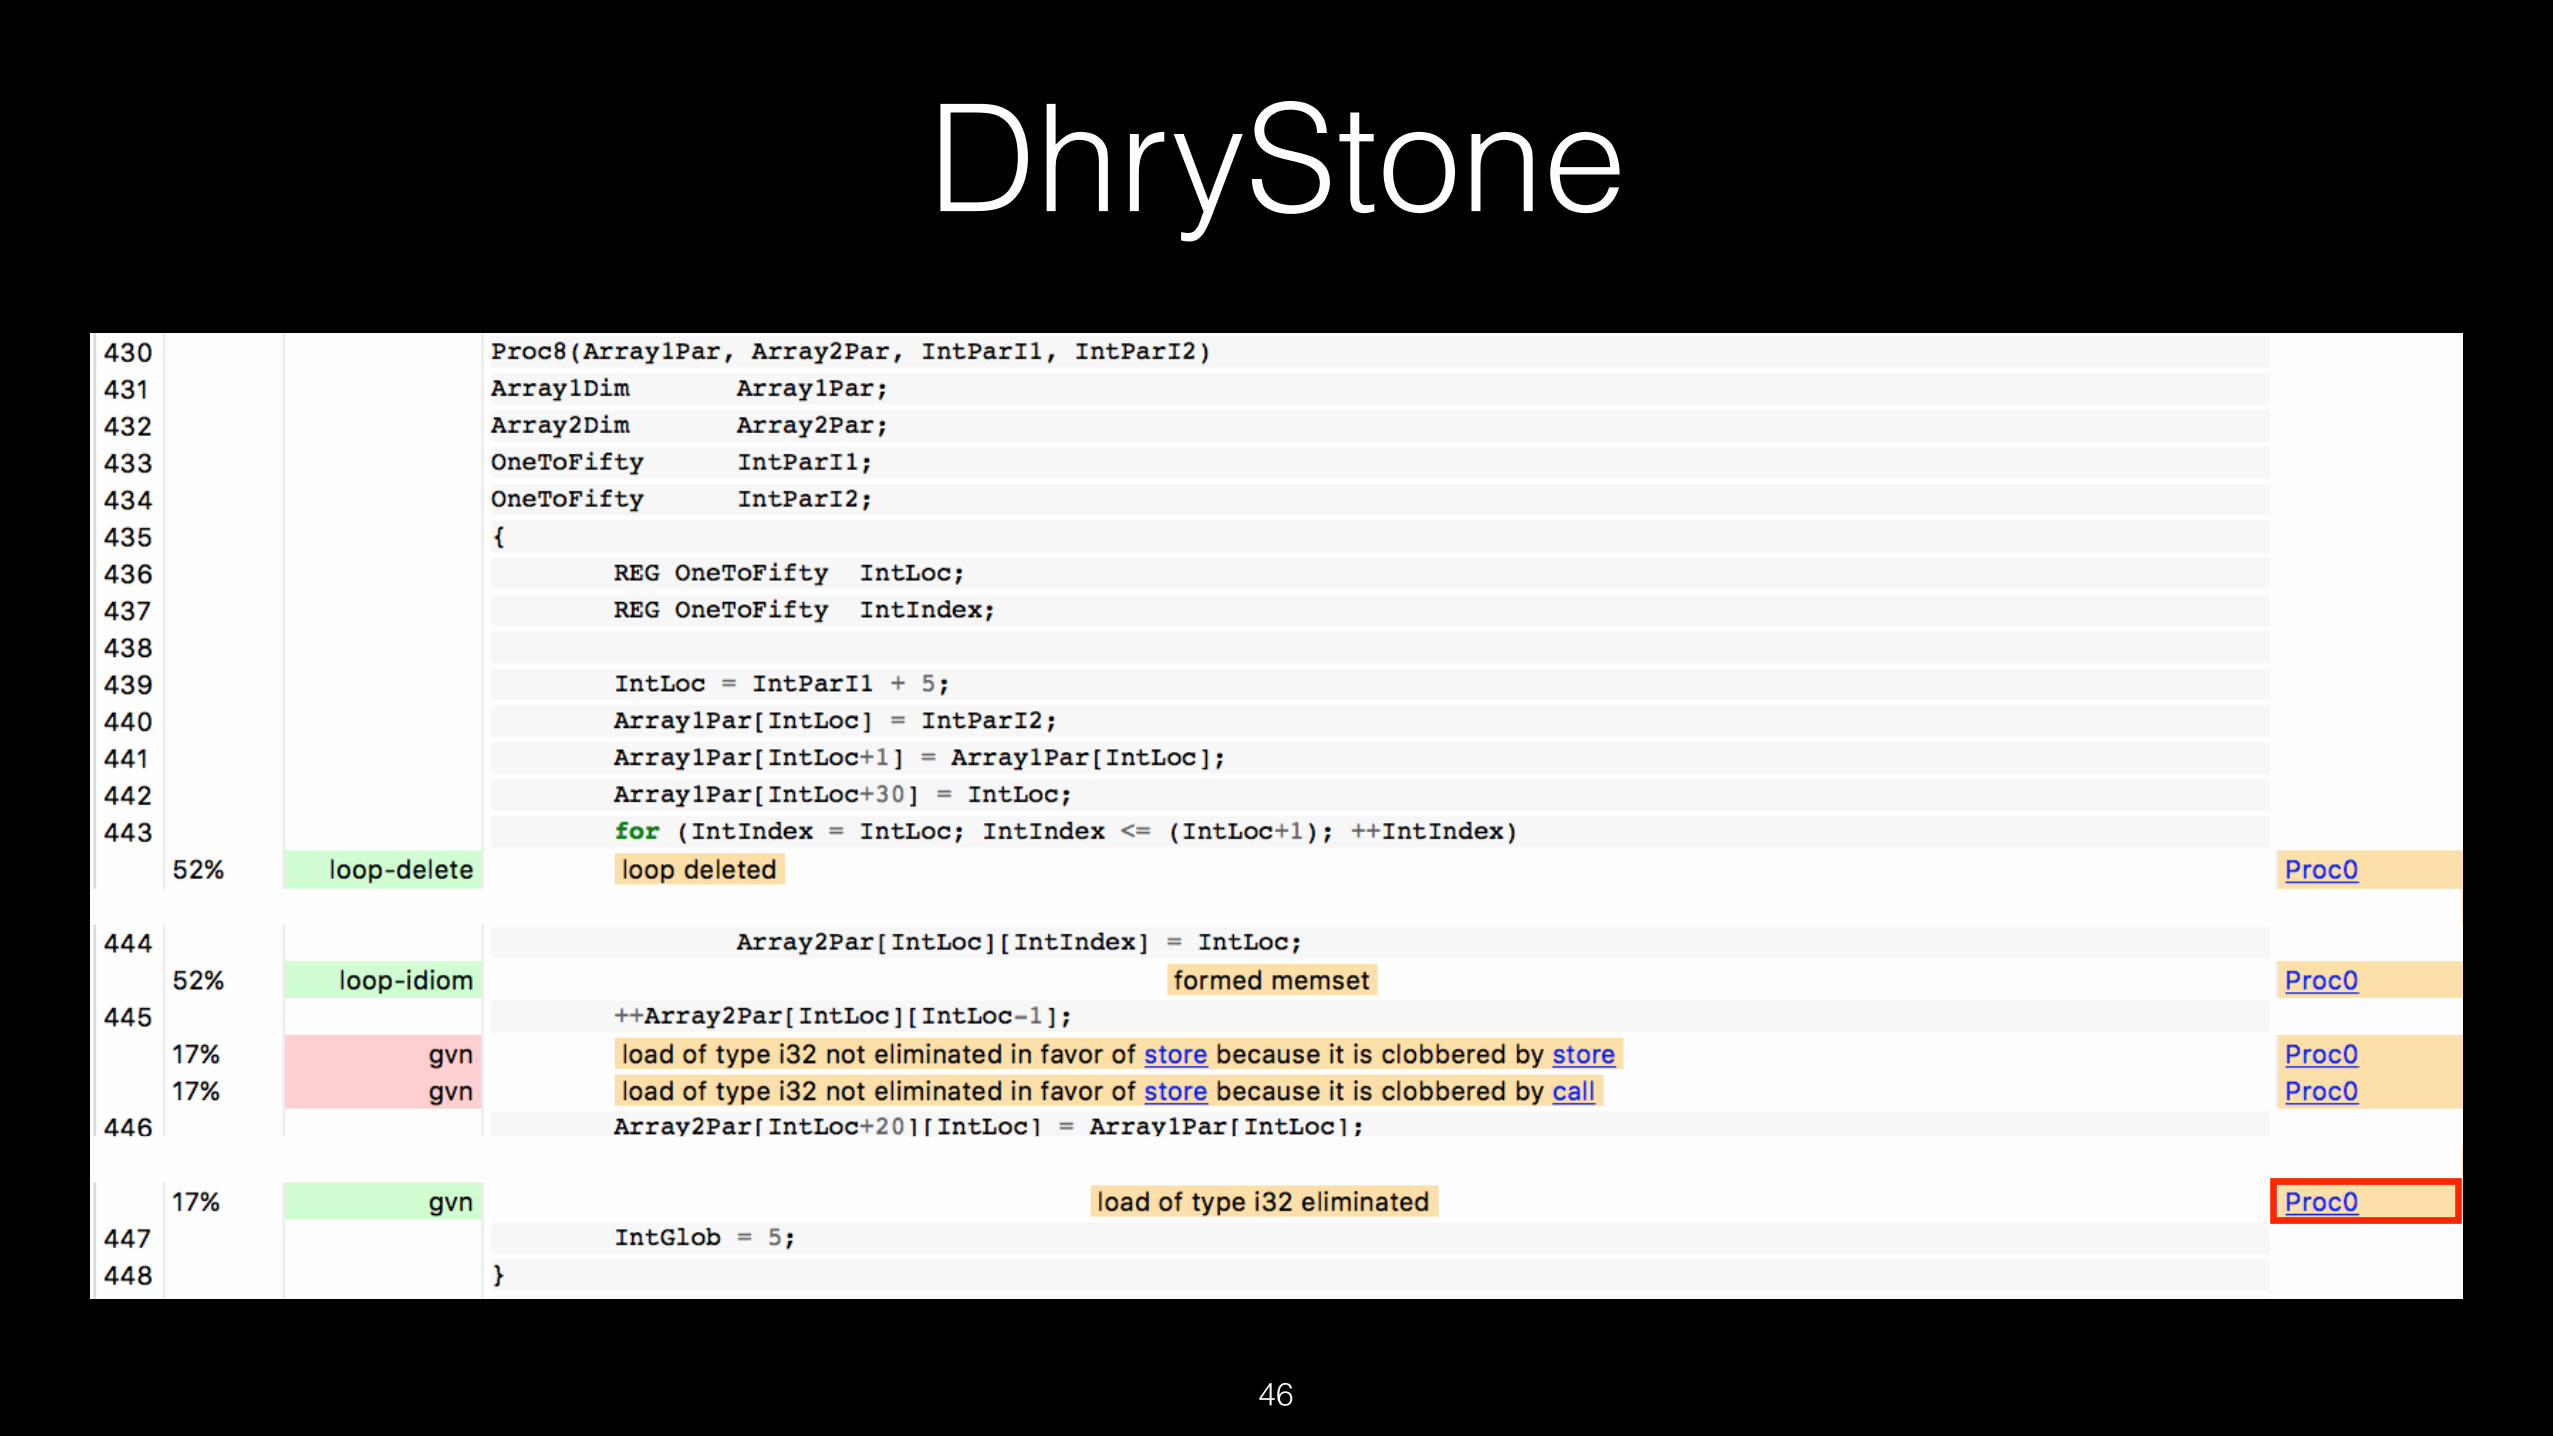
DhryStone
46
DhryStone
48
DhryStone
50

DhryStone: Summary• Without low-level debugging, quickly reconstructed what happened
• Even though it involved interaction between multiple optimizations
• Inlining and Alias Analysis/GVN
• Missed optimizations: Extra analysis to manage with false positives
1. Filter trivially false positives
2. Expose enough information for quick detection by user
51
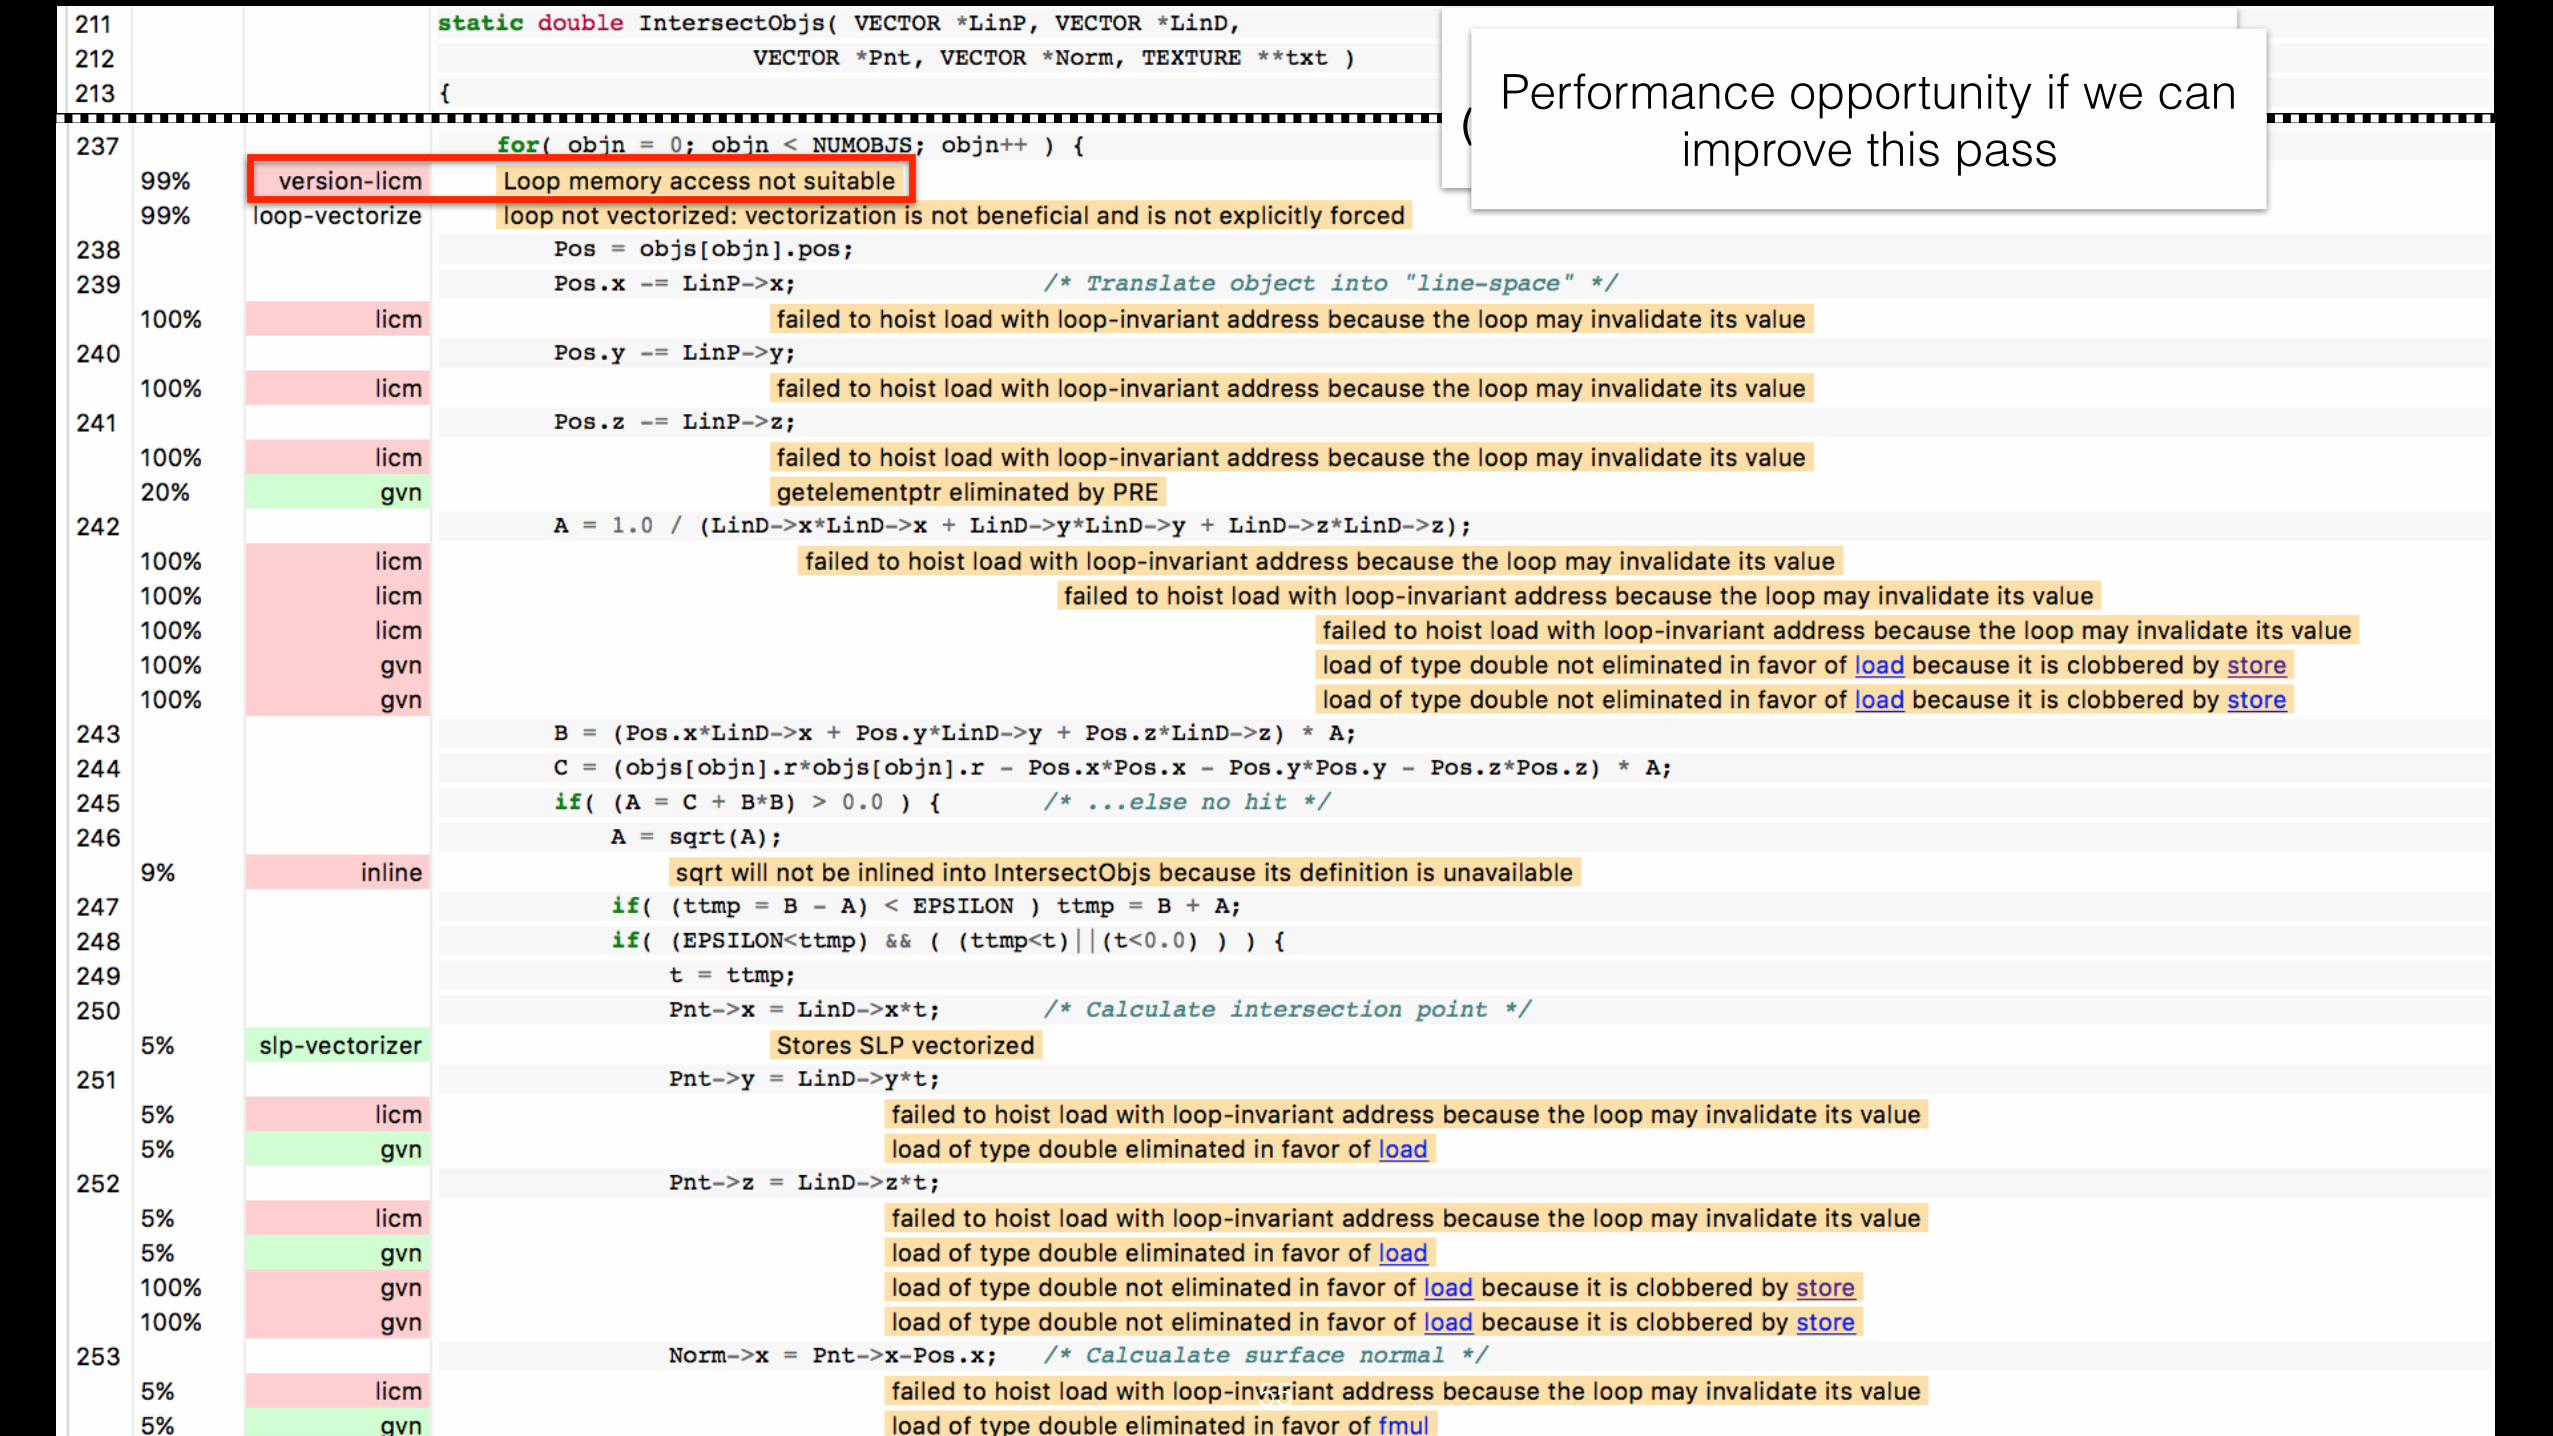
Freebench/distray (MultiSource/Benchmarks)
Finding Performance Opportunity
52

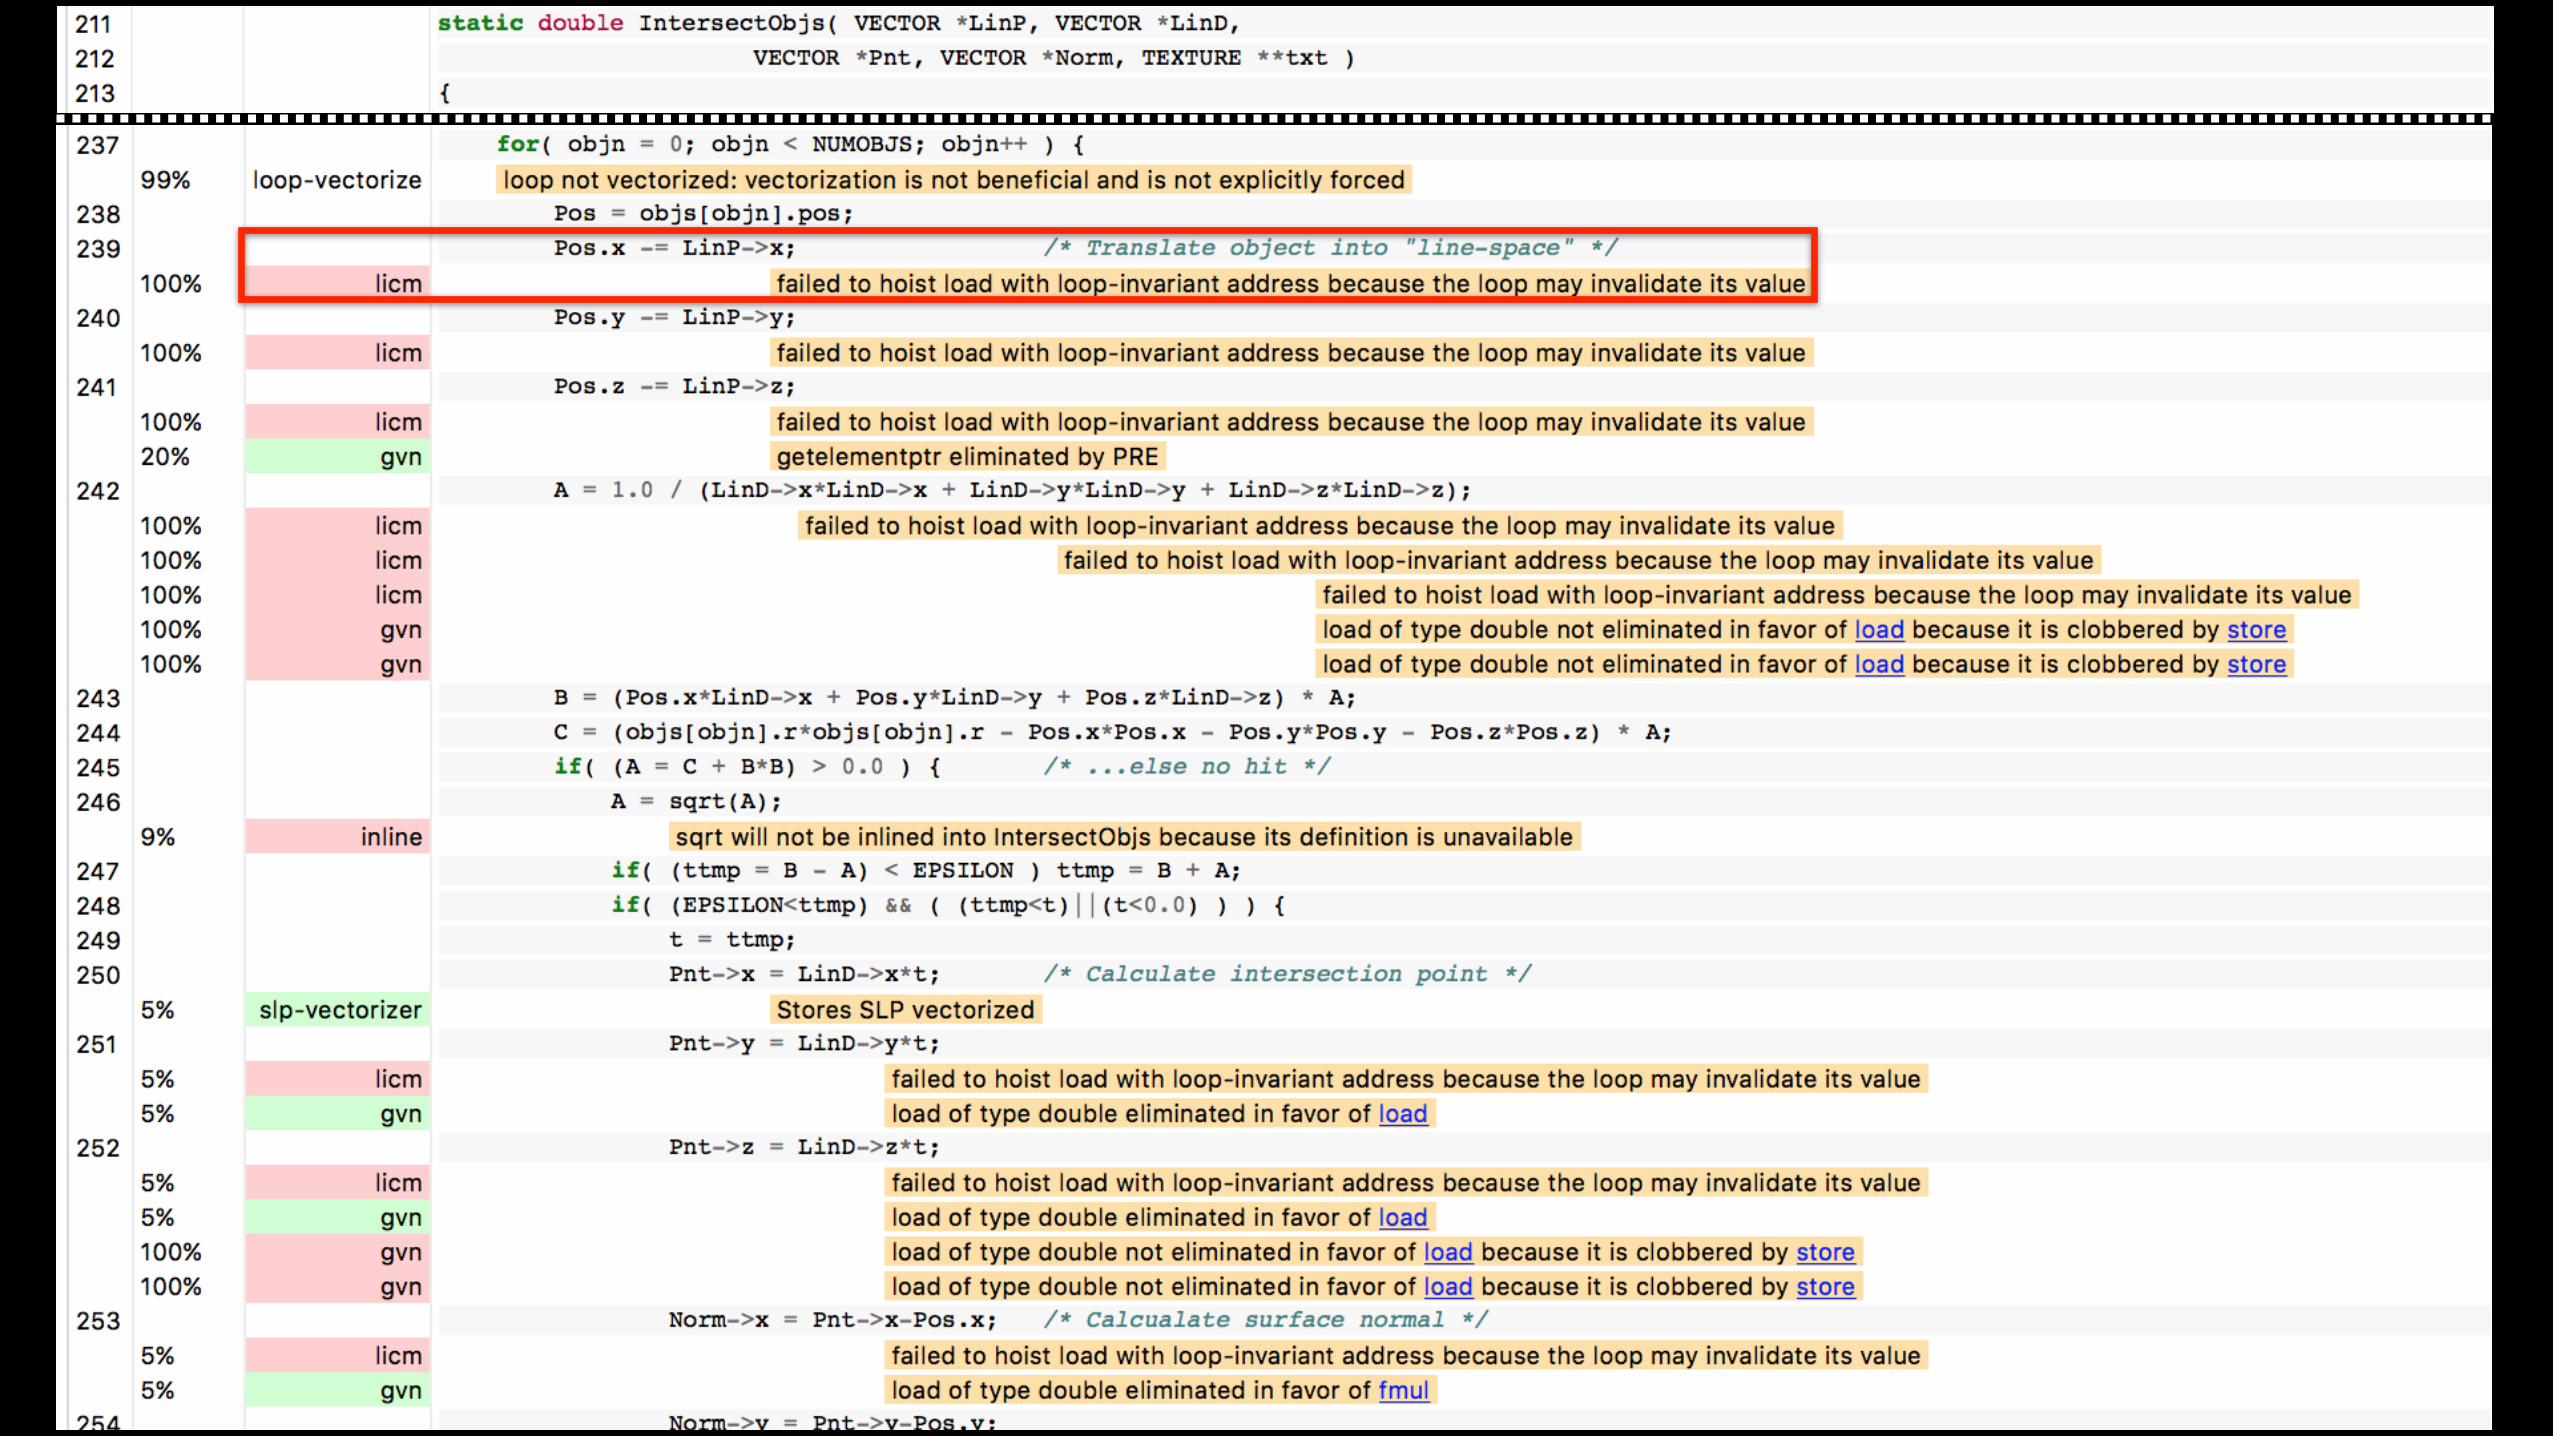
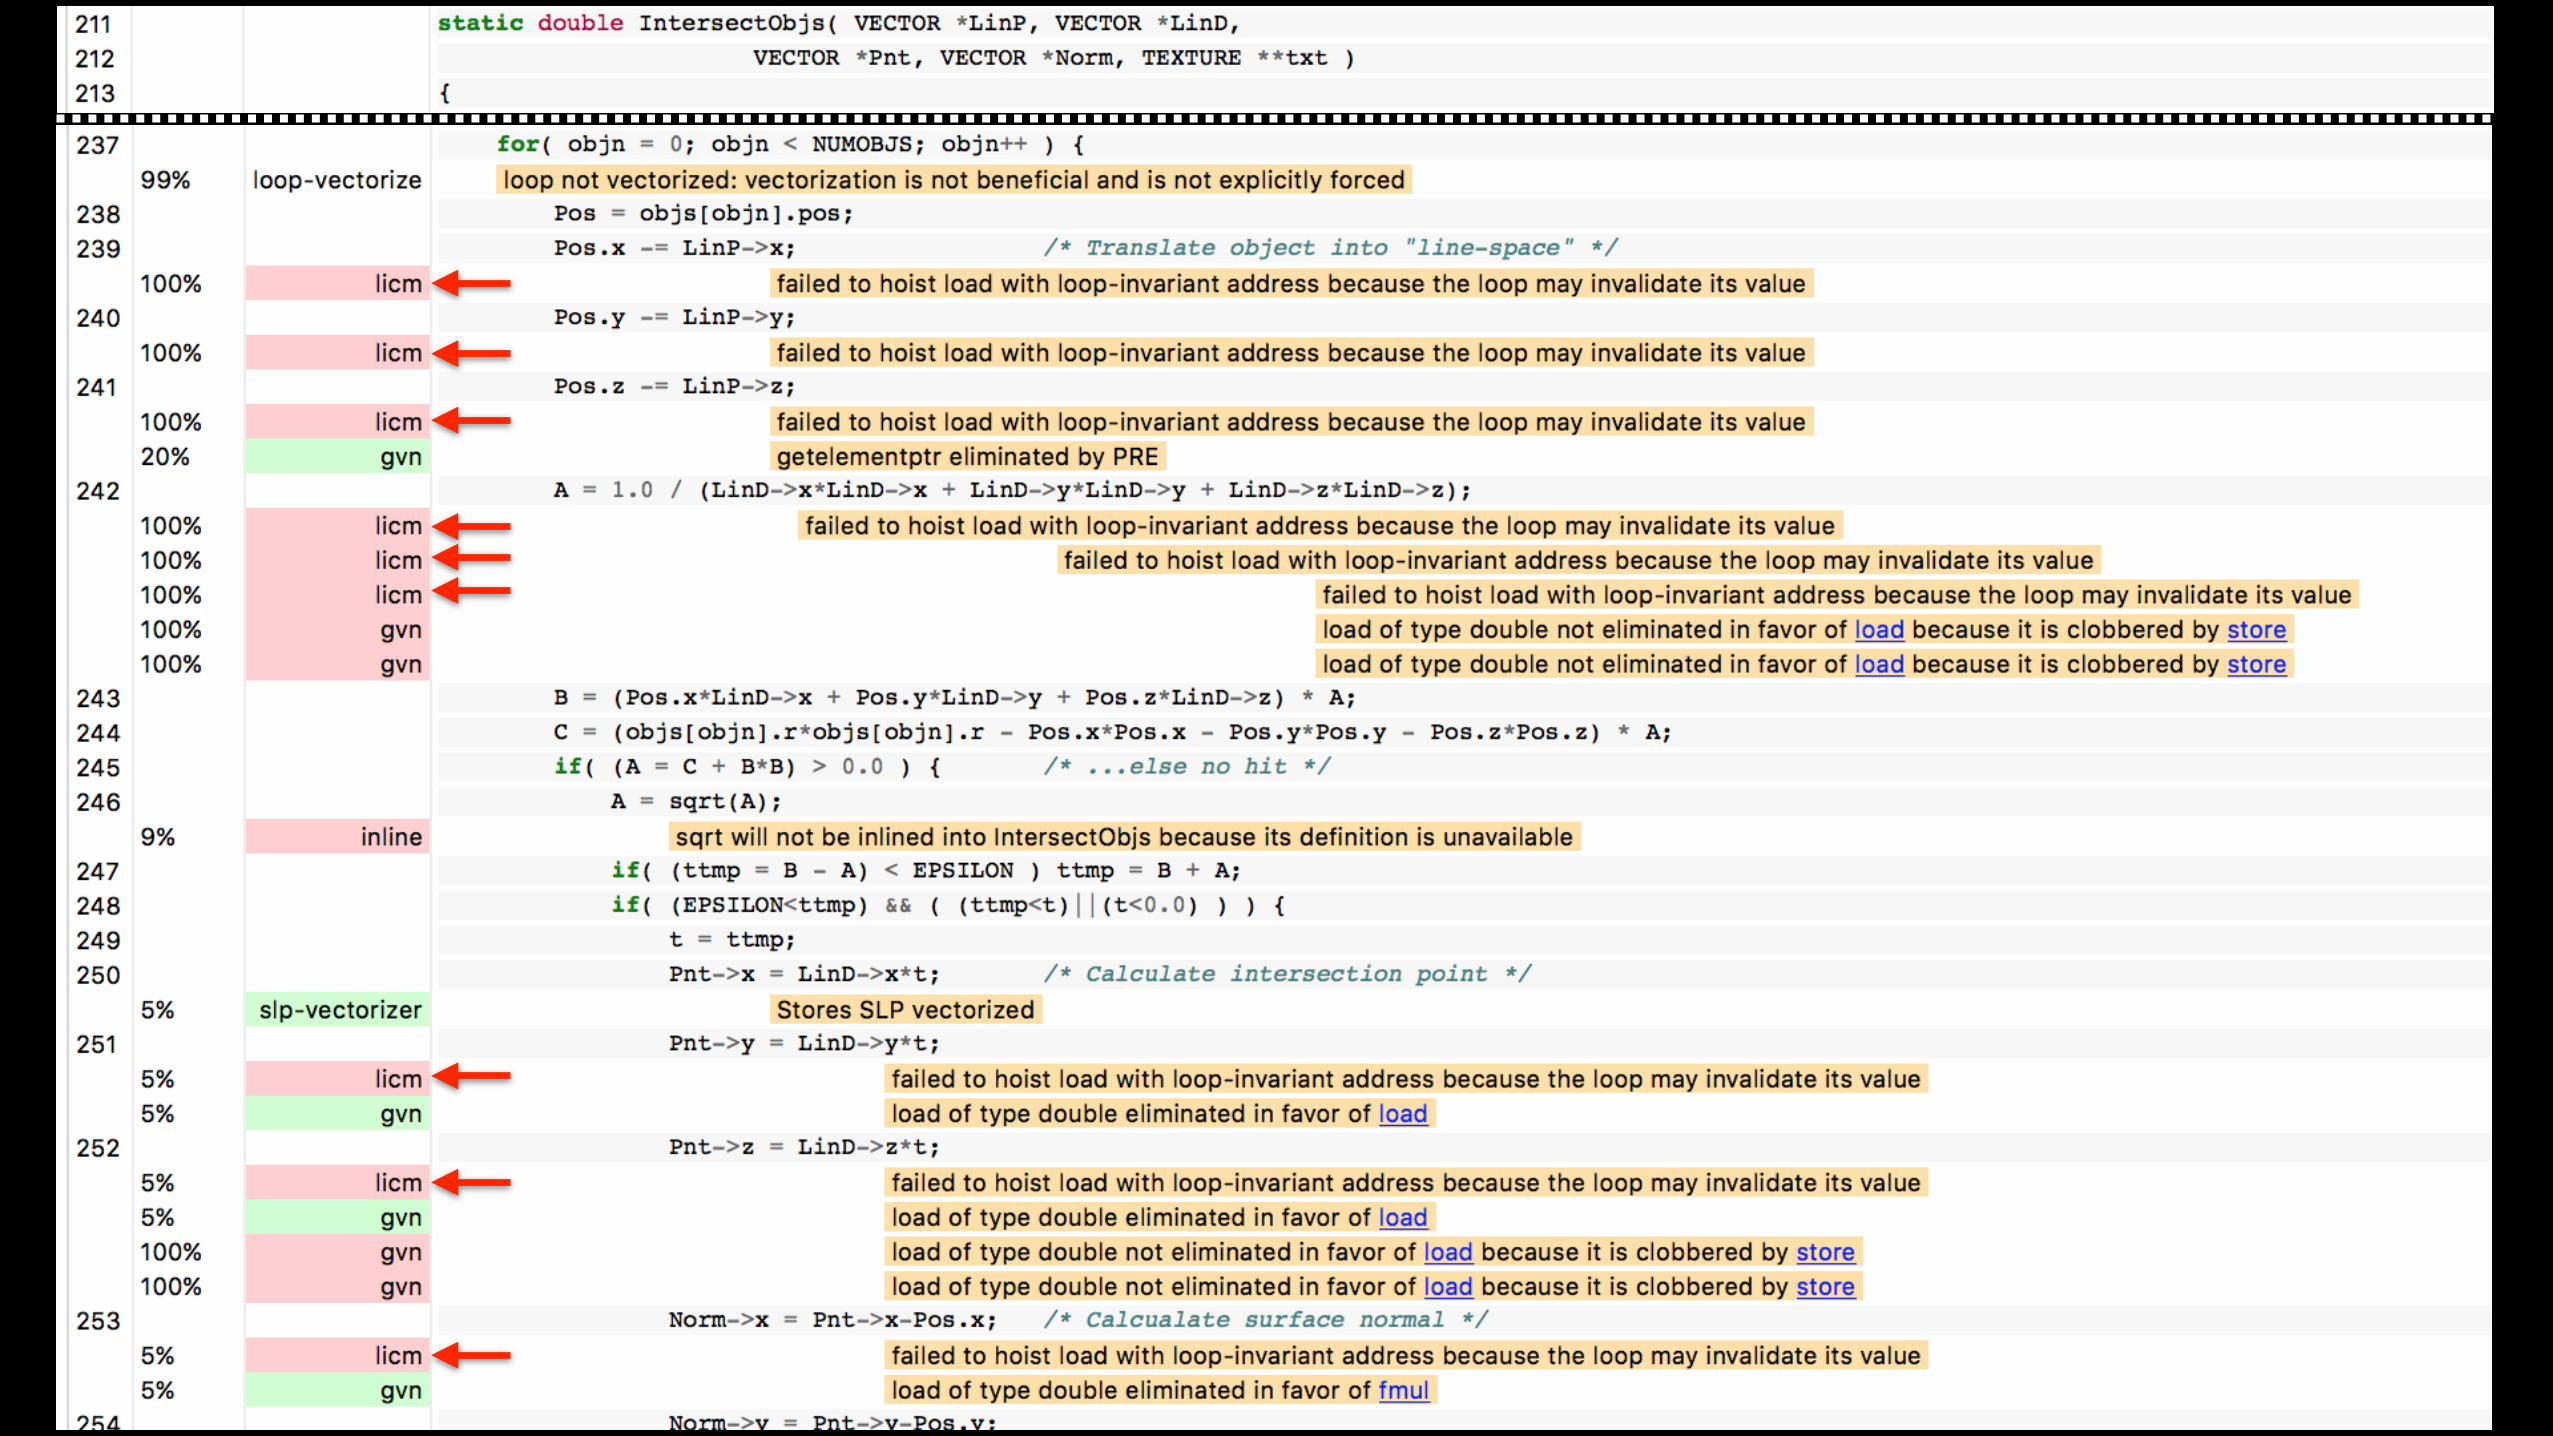
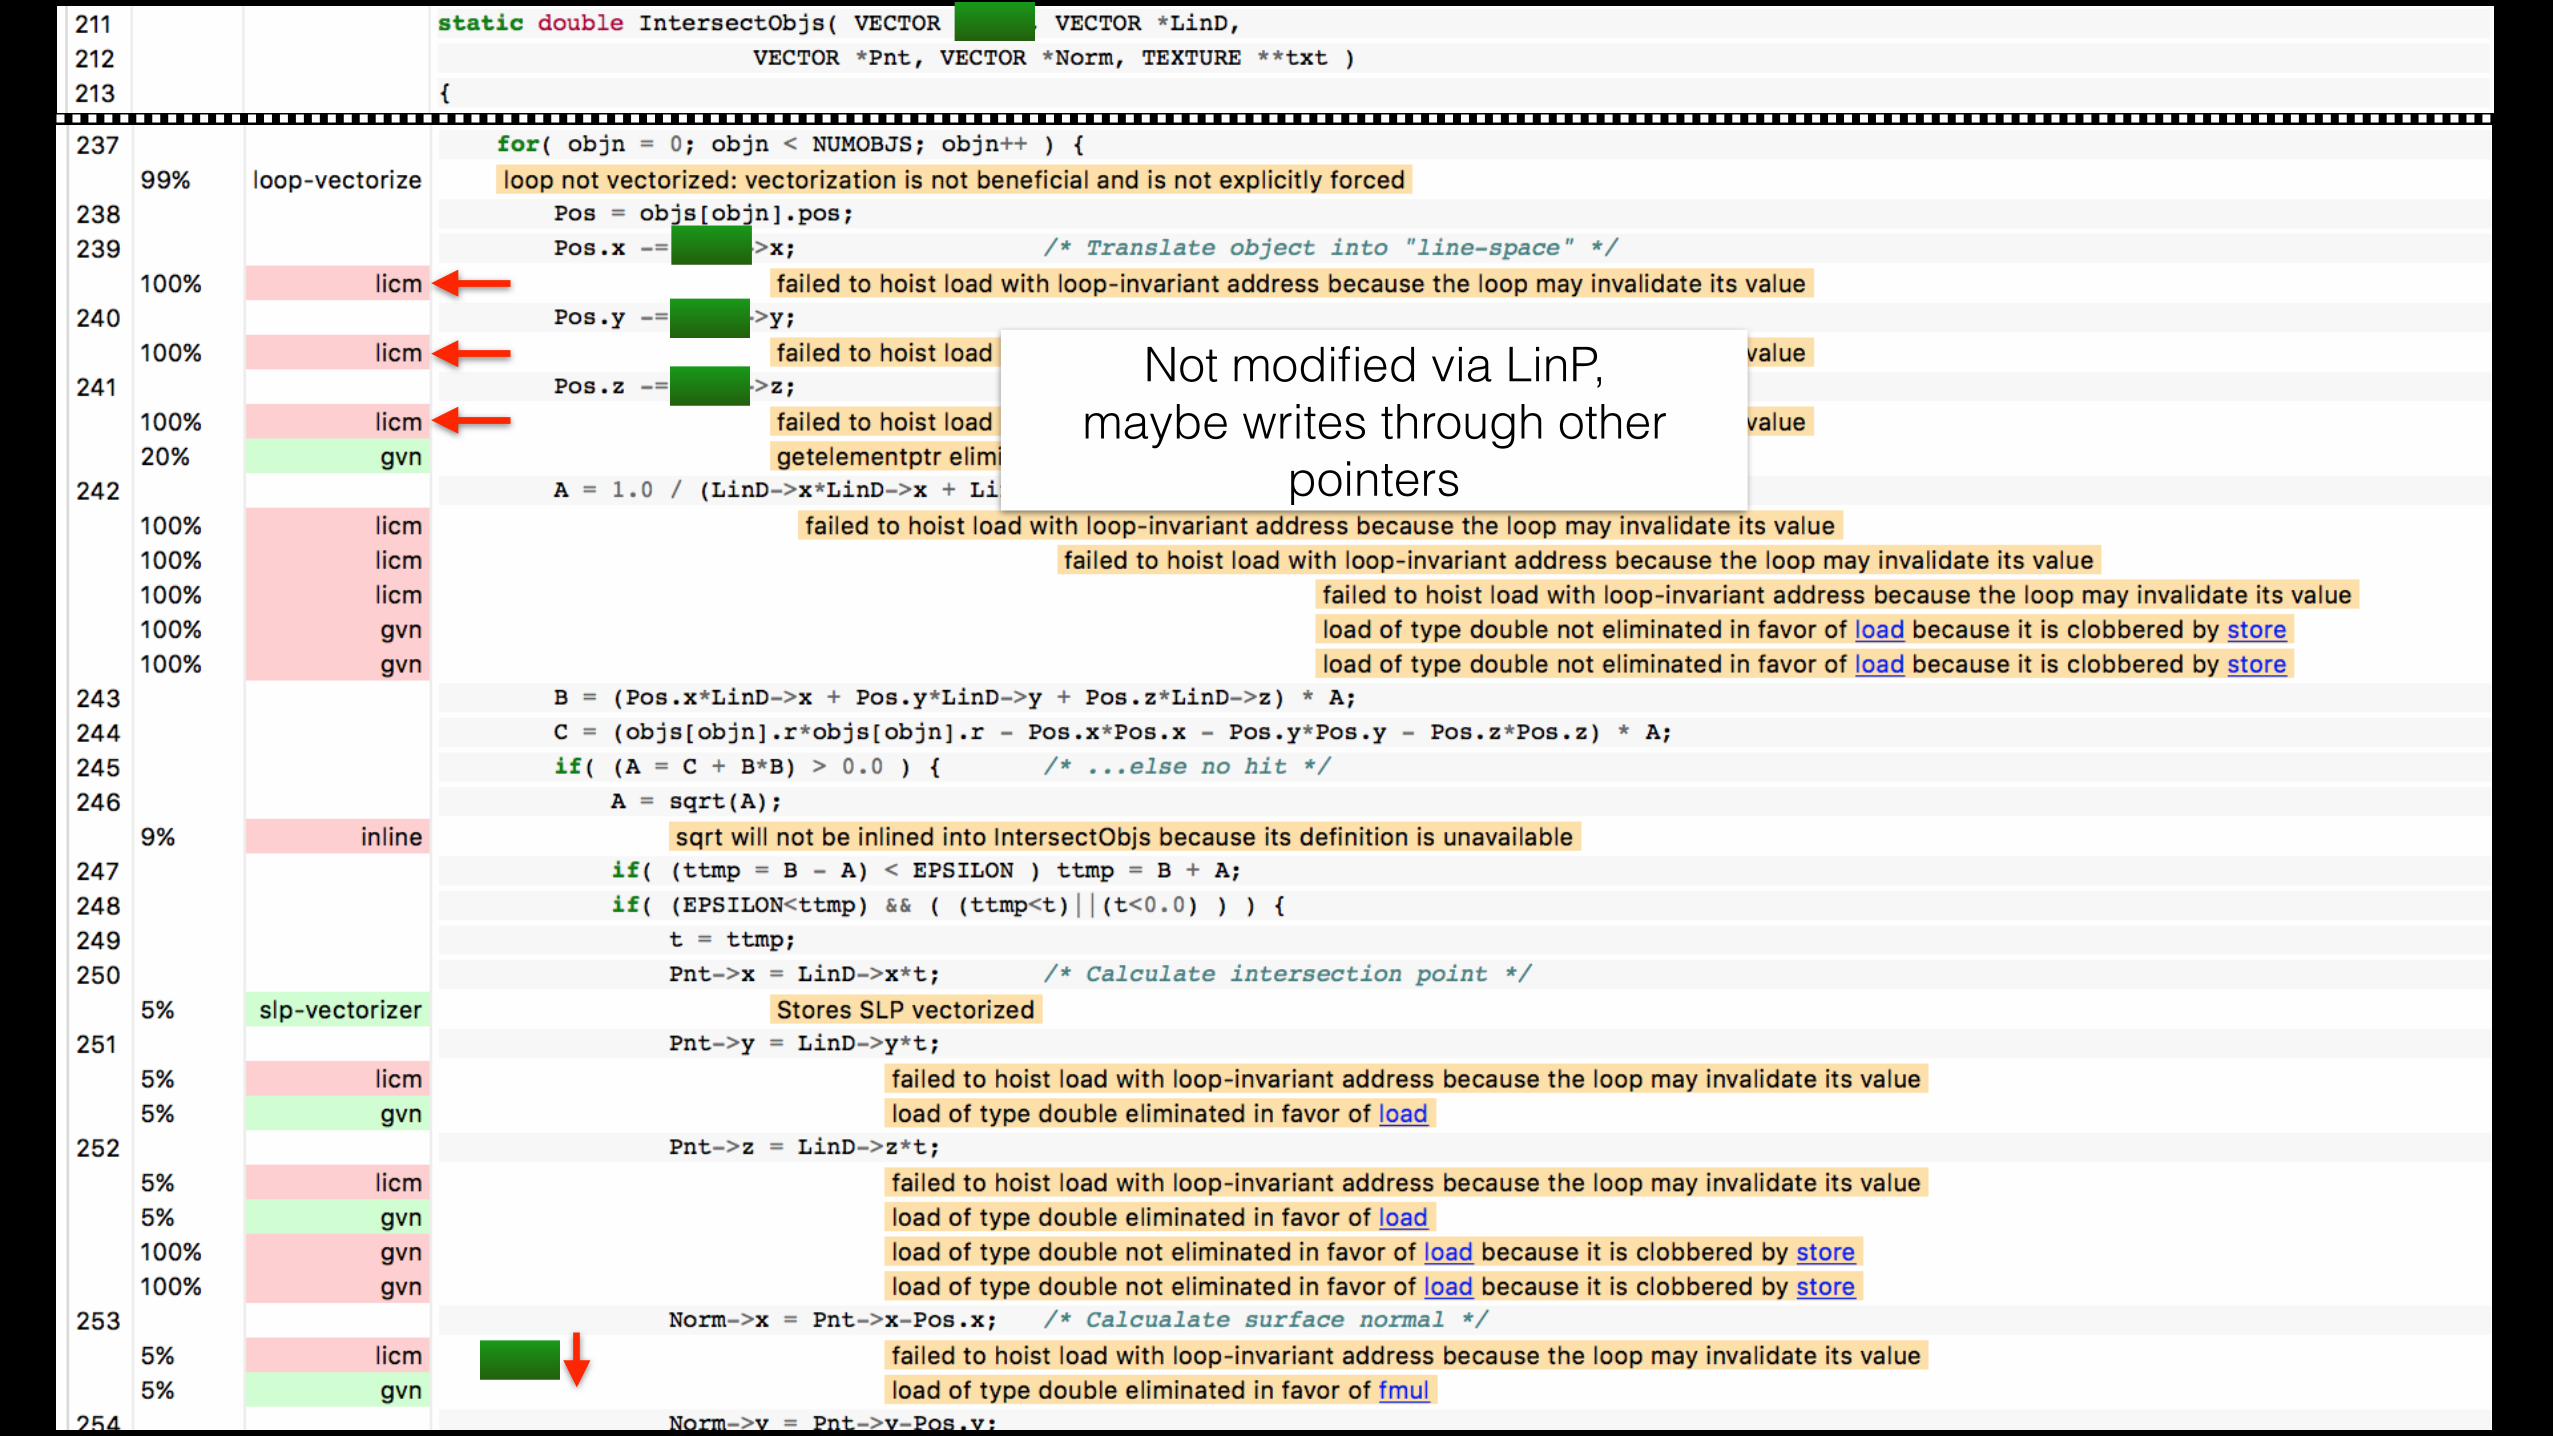
Not modified via LinP, maybe writes through other
pointers
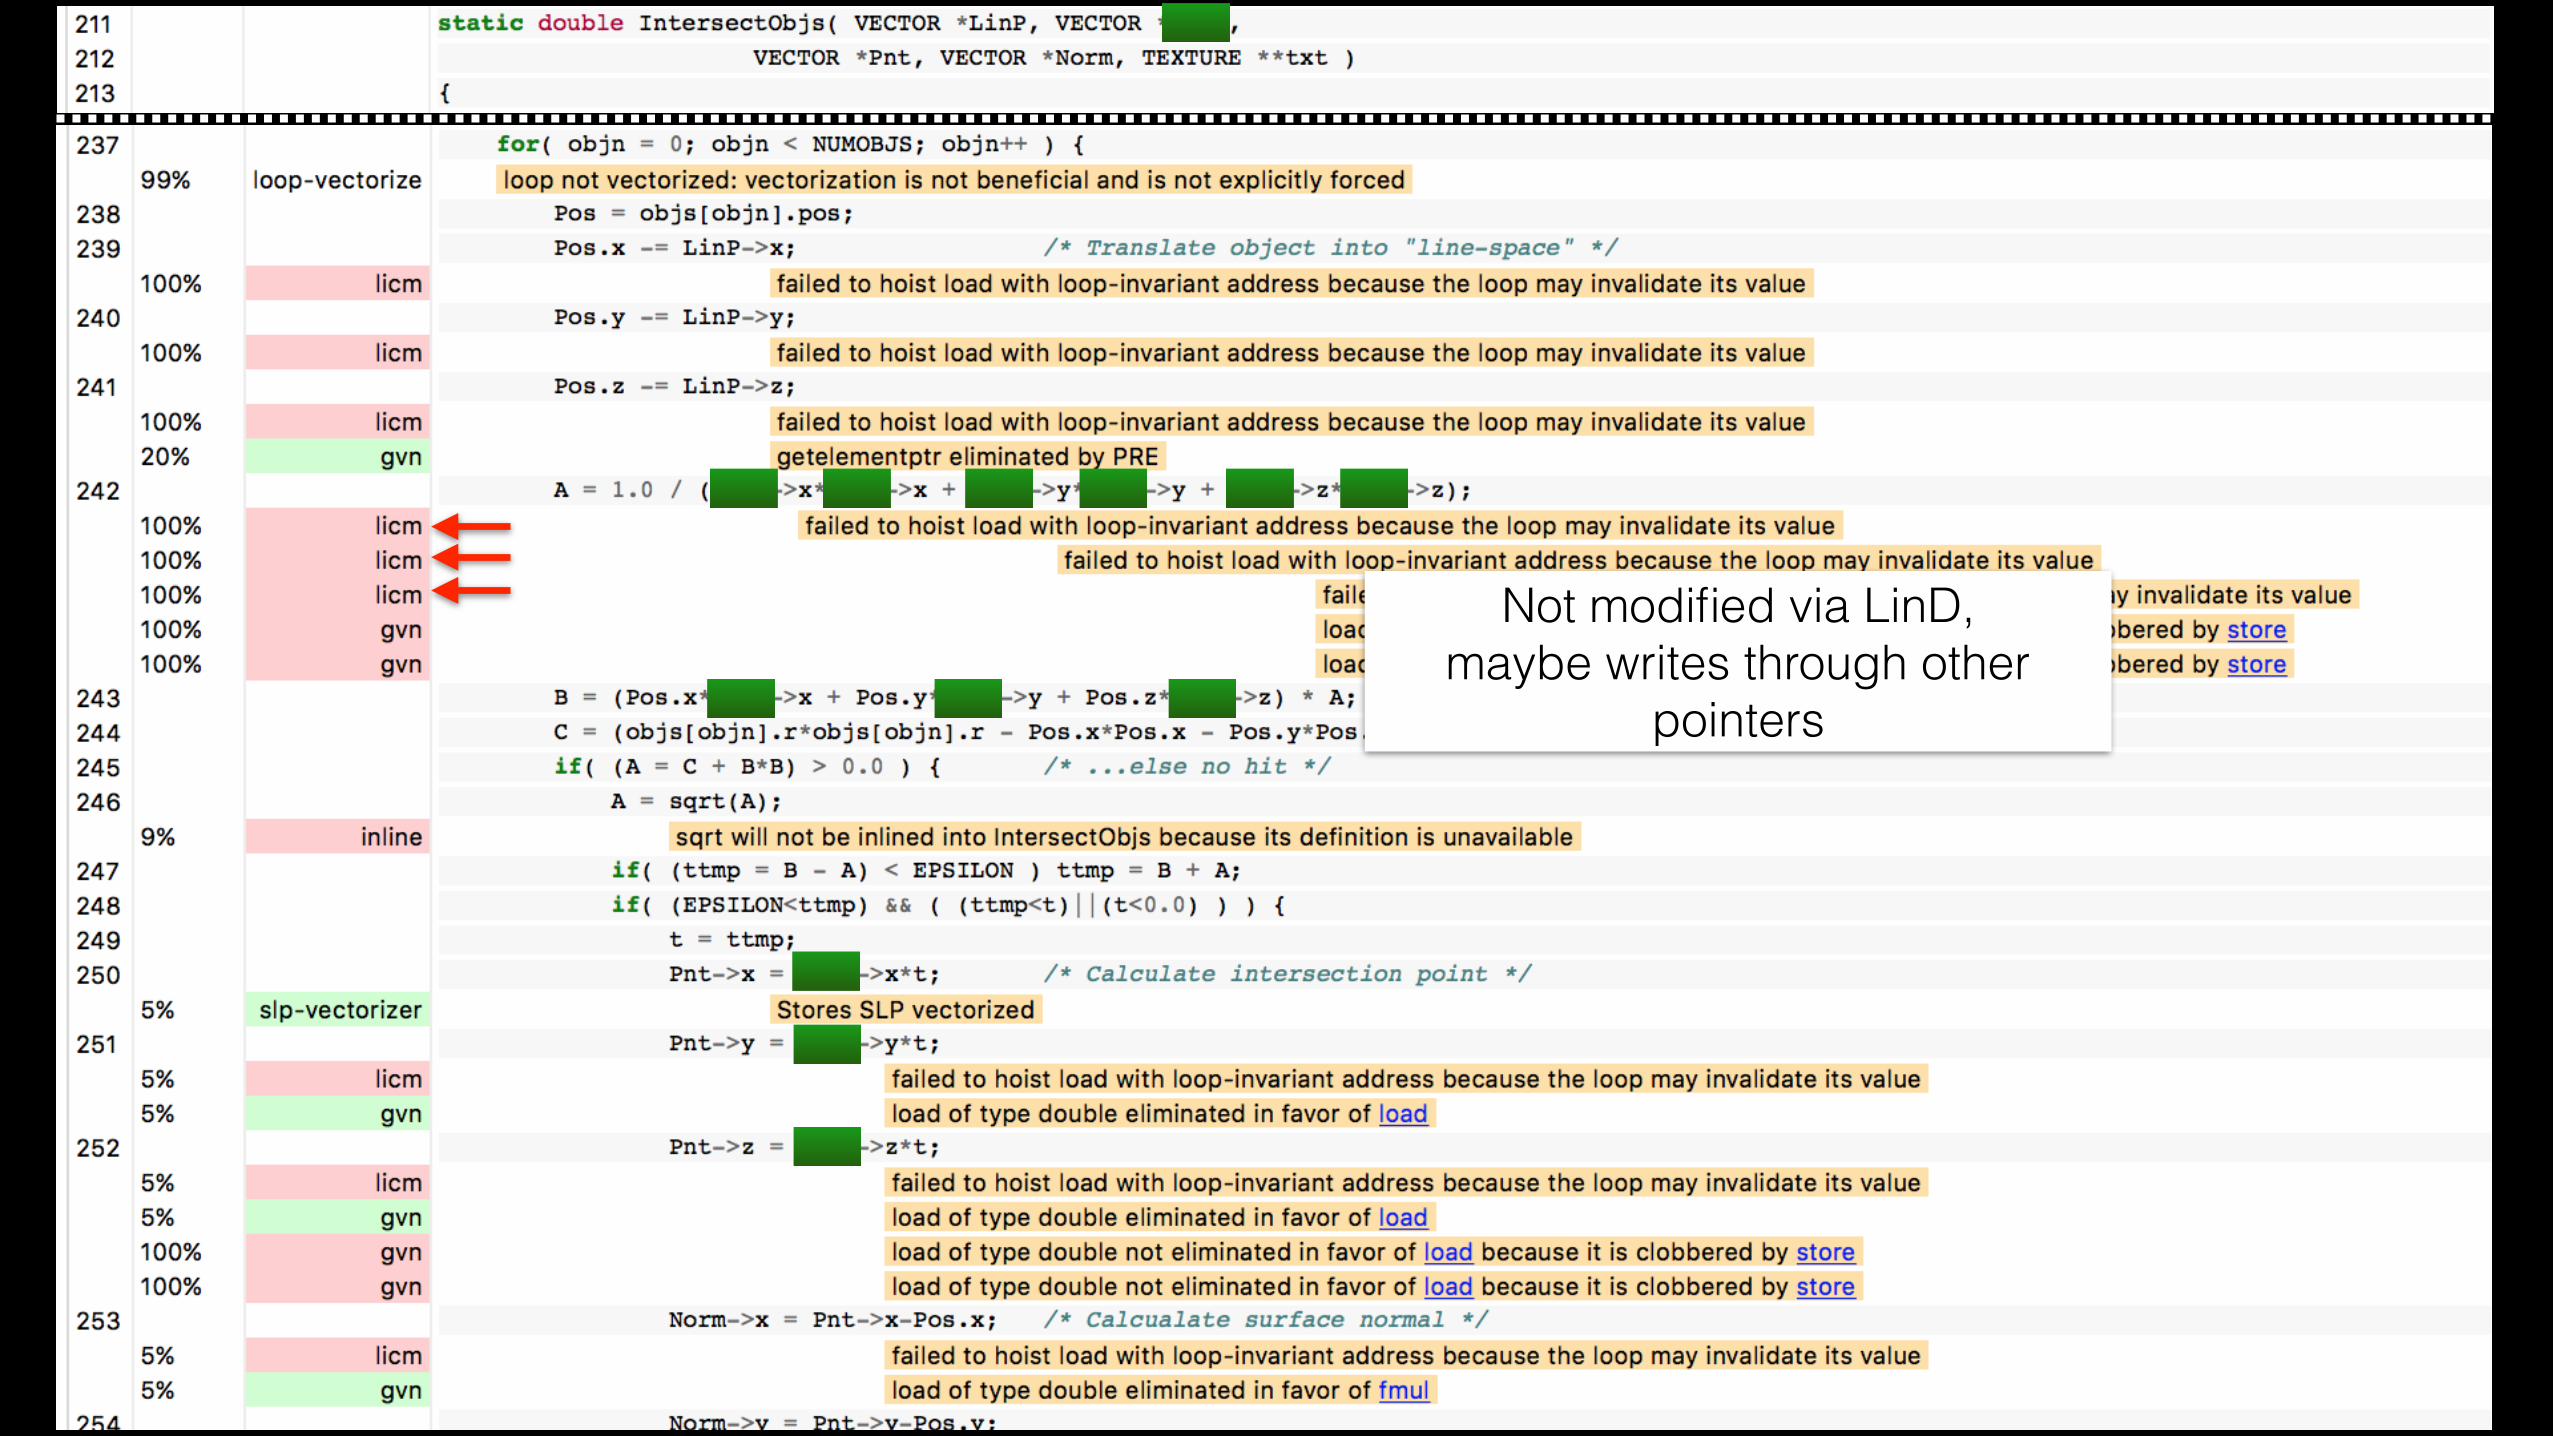
Not modified via LinD, maybe writes through other
pointers


Reads and writes don’t alias

Reads and writes don’t aliasLoop versioning
with array overlap checks?
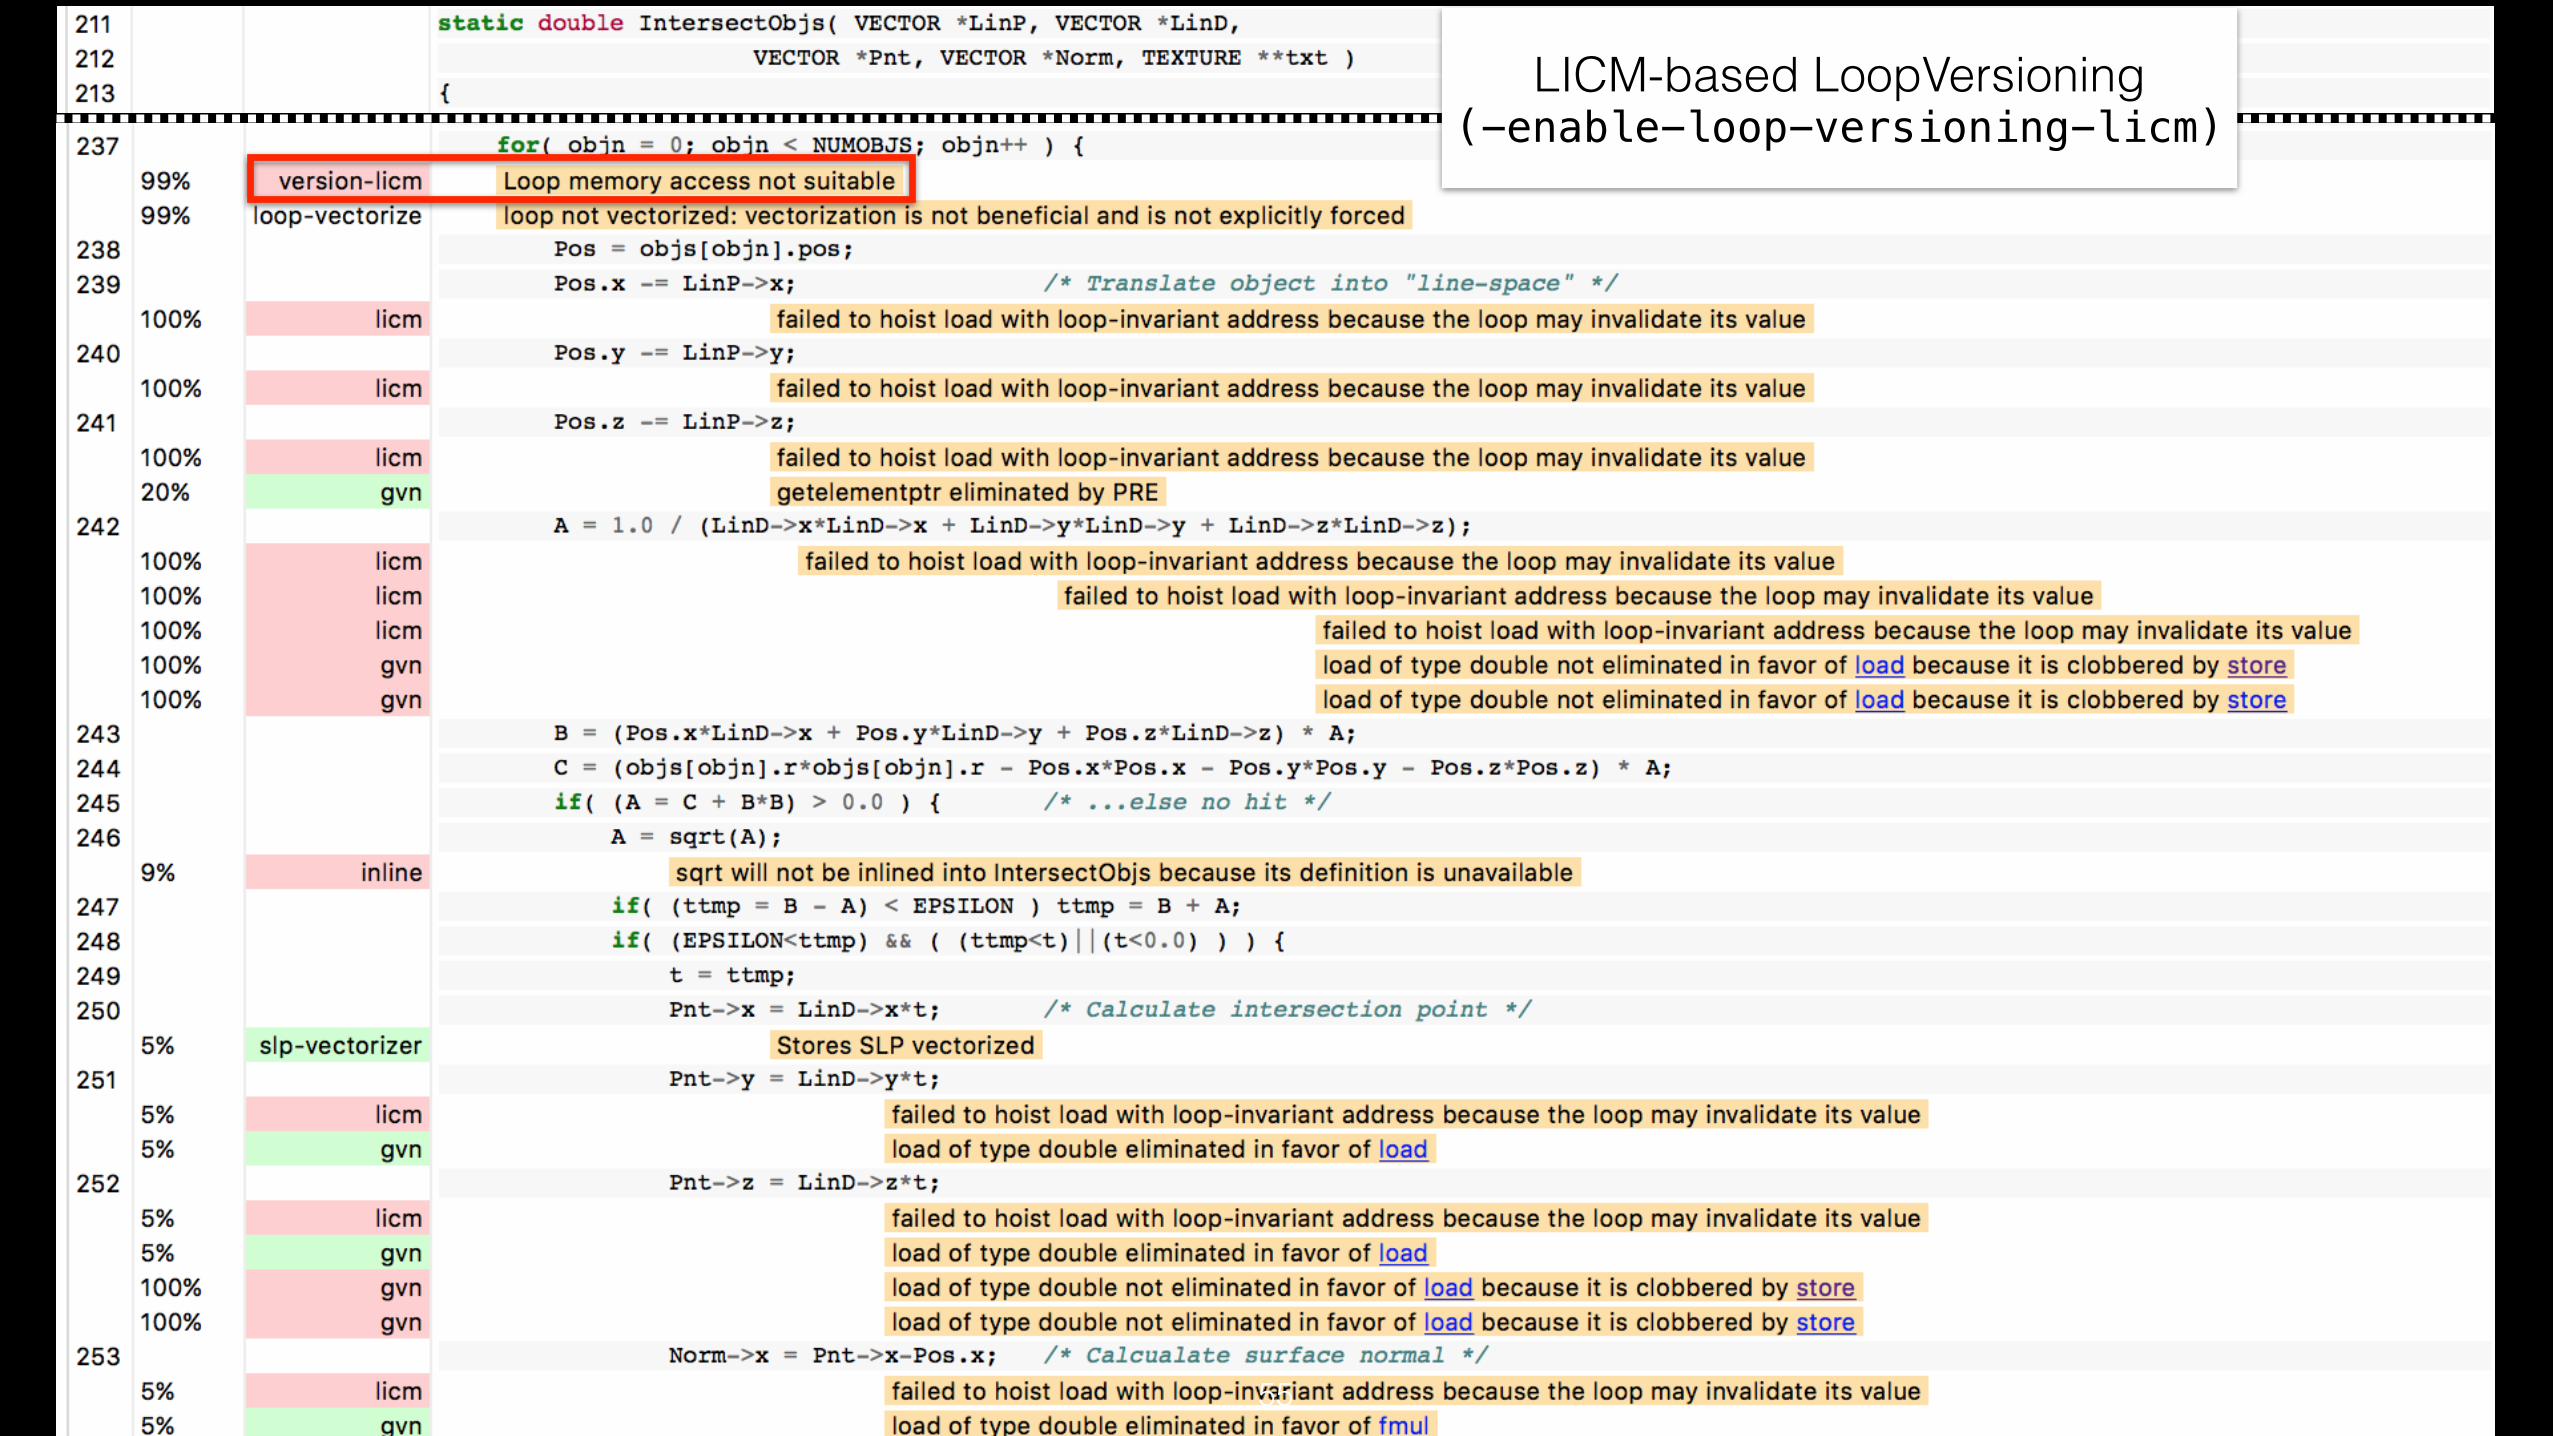
55
LICM-based LoopVersioning (-enable-loop-versioning-licm)
55
LICM-based LoopVersioning (-enable-loop-versioning-licm)
Performance opportunity if we can improve this pass

55
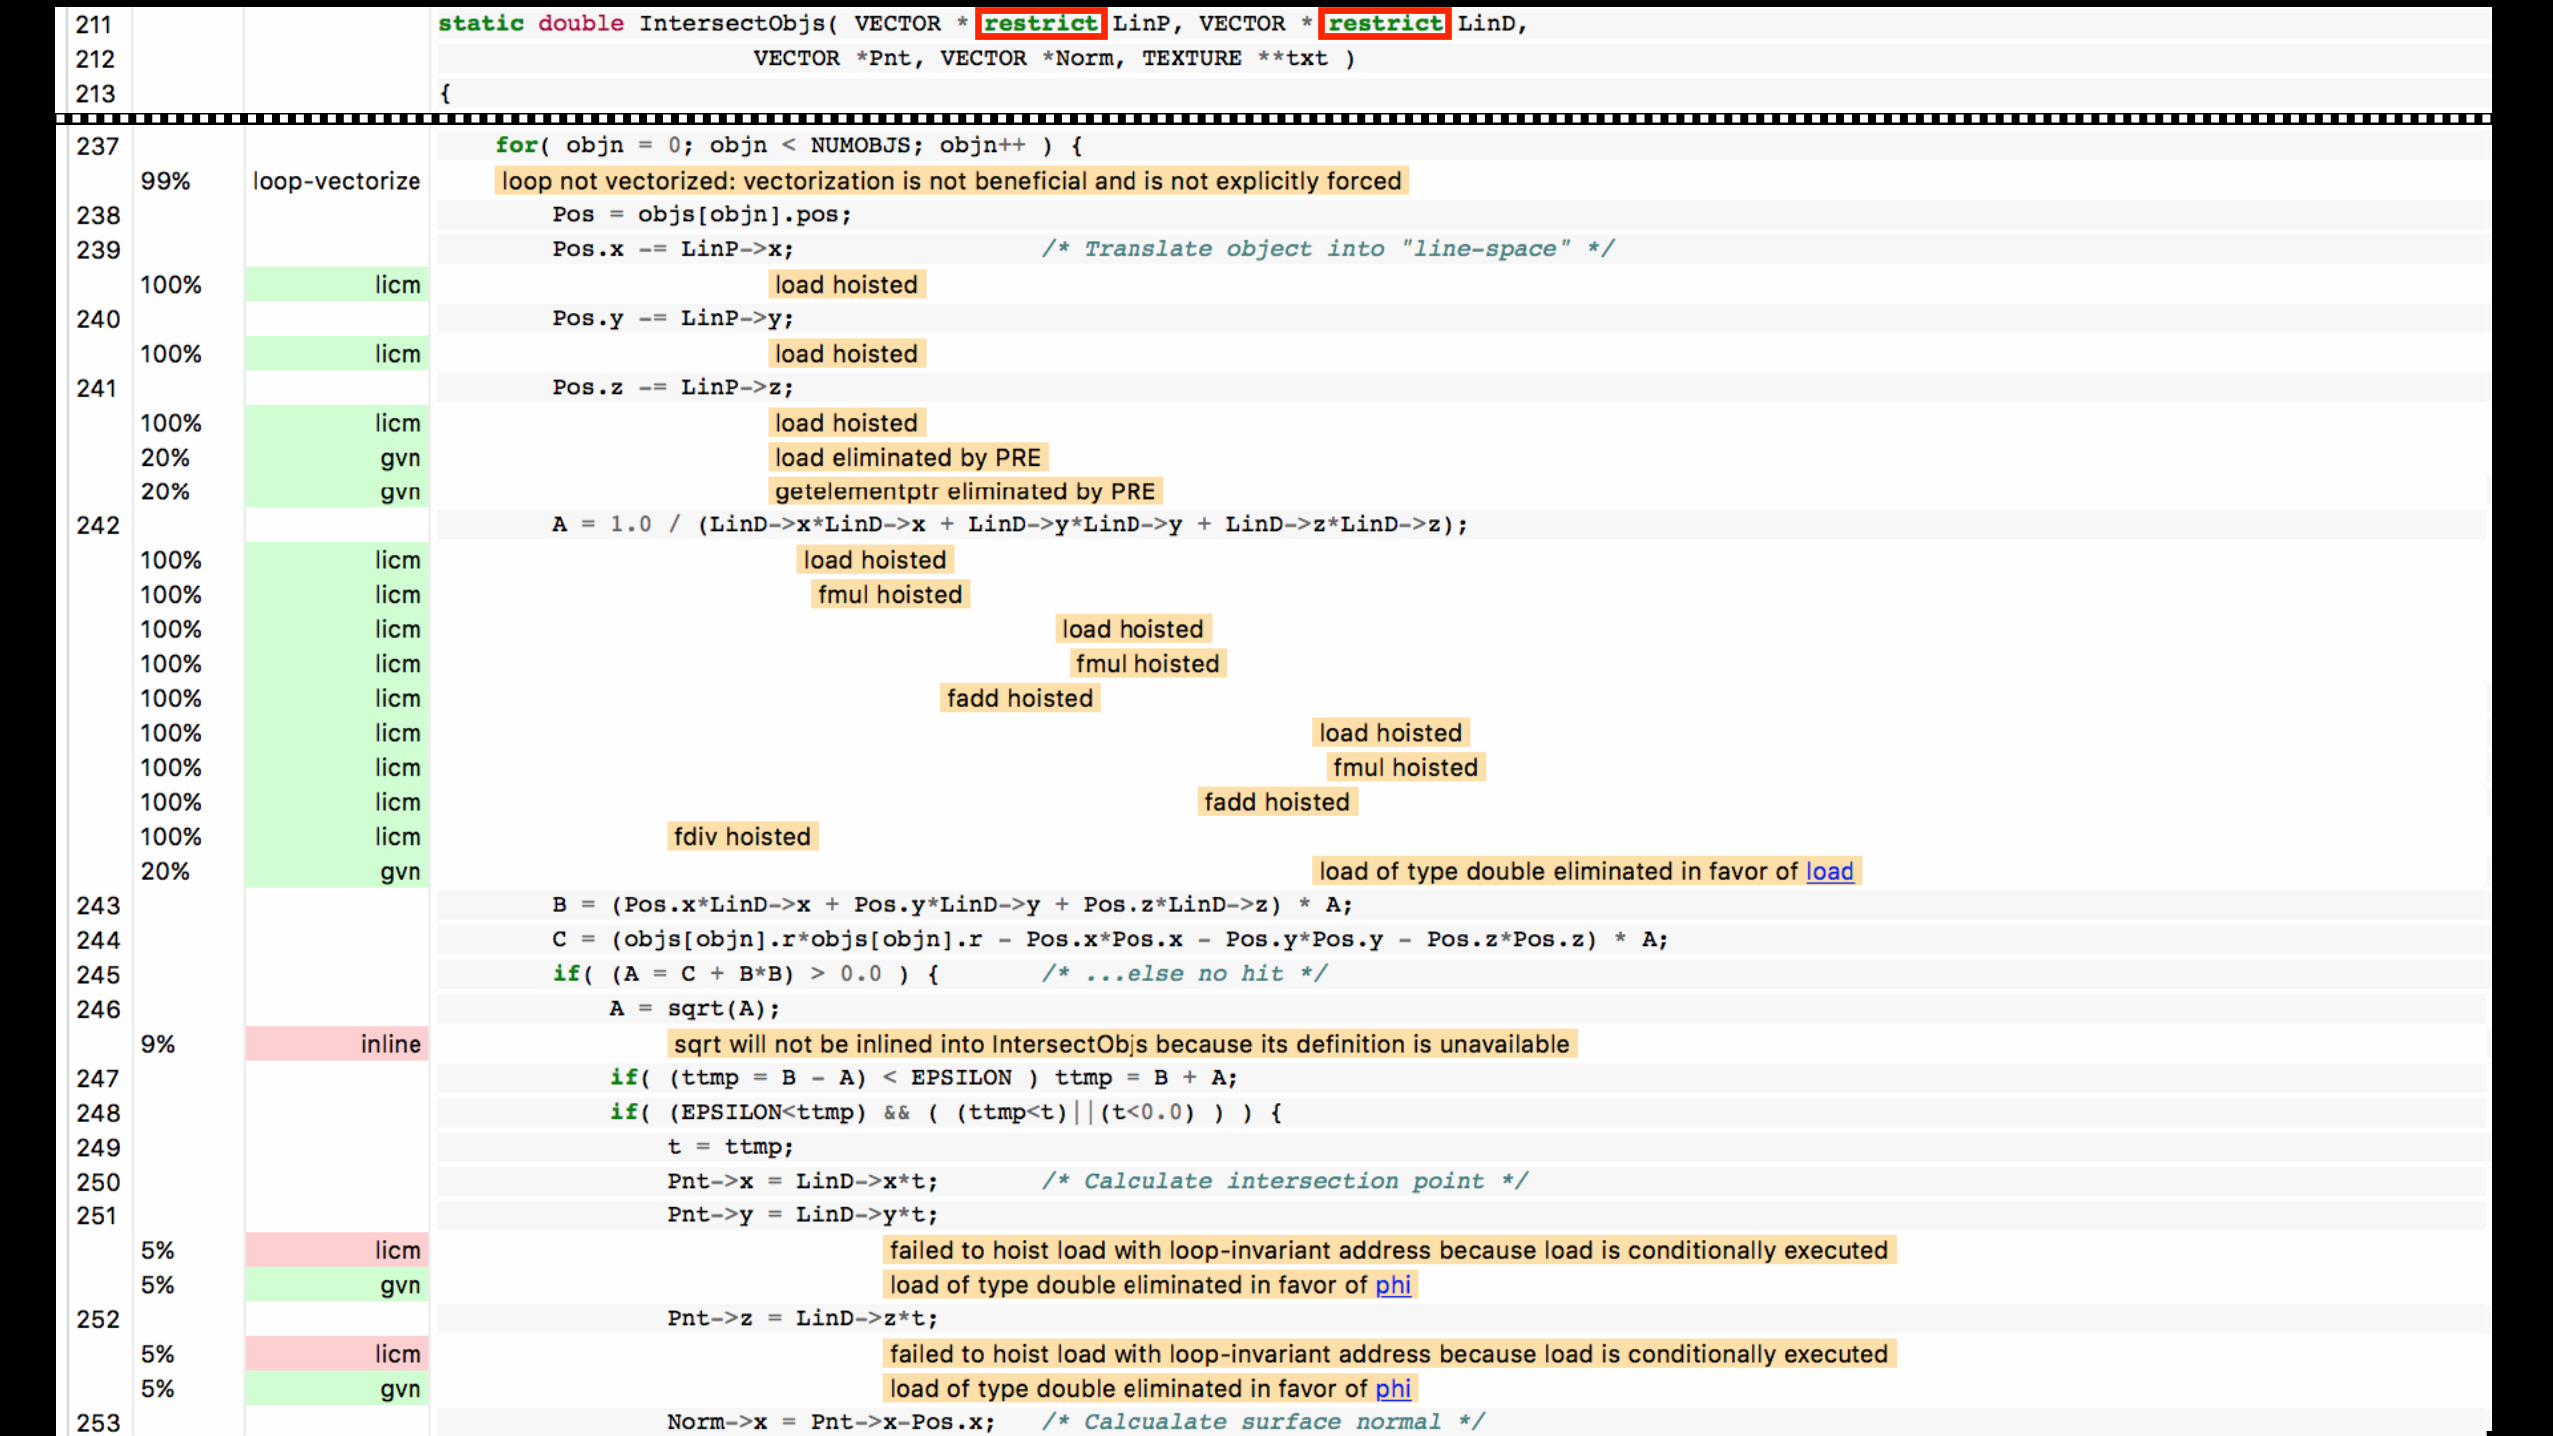
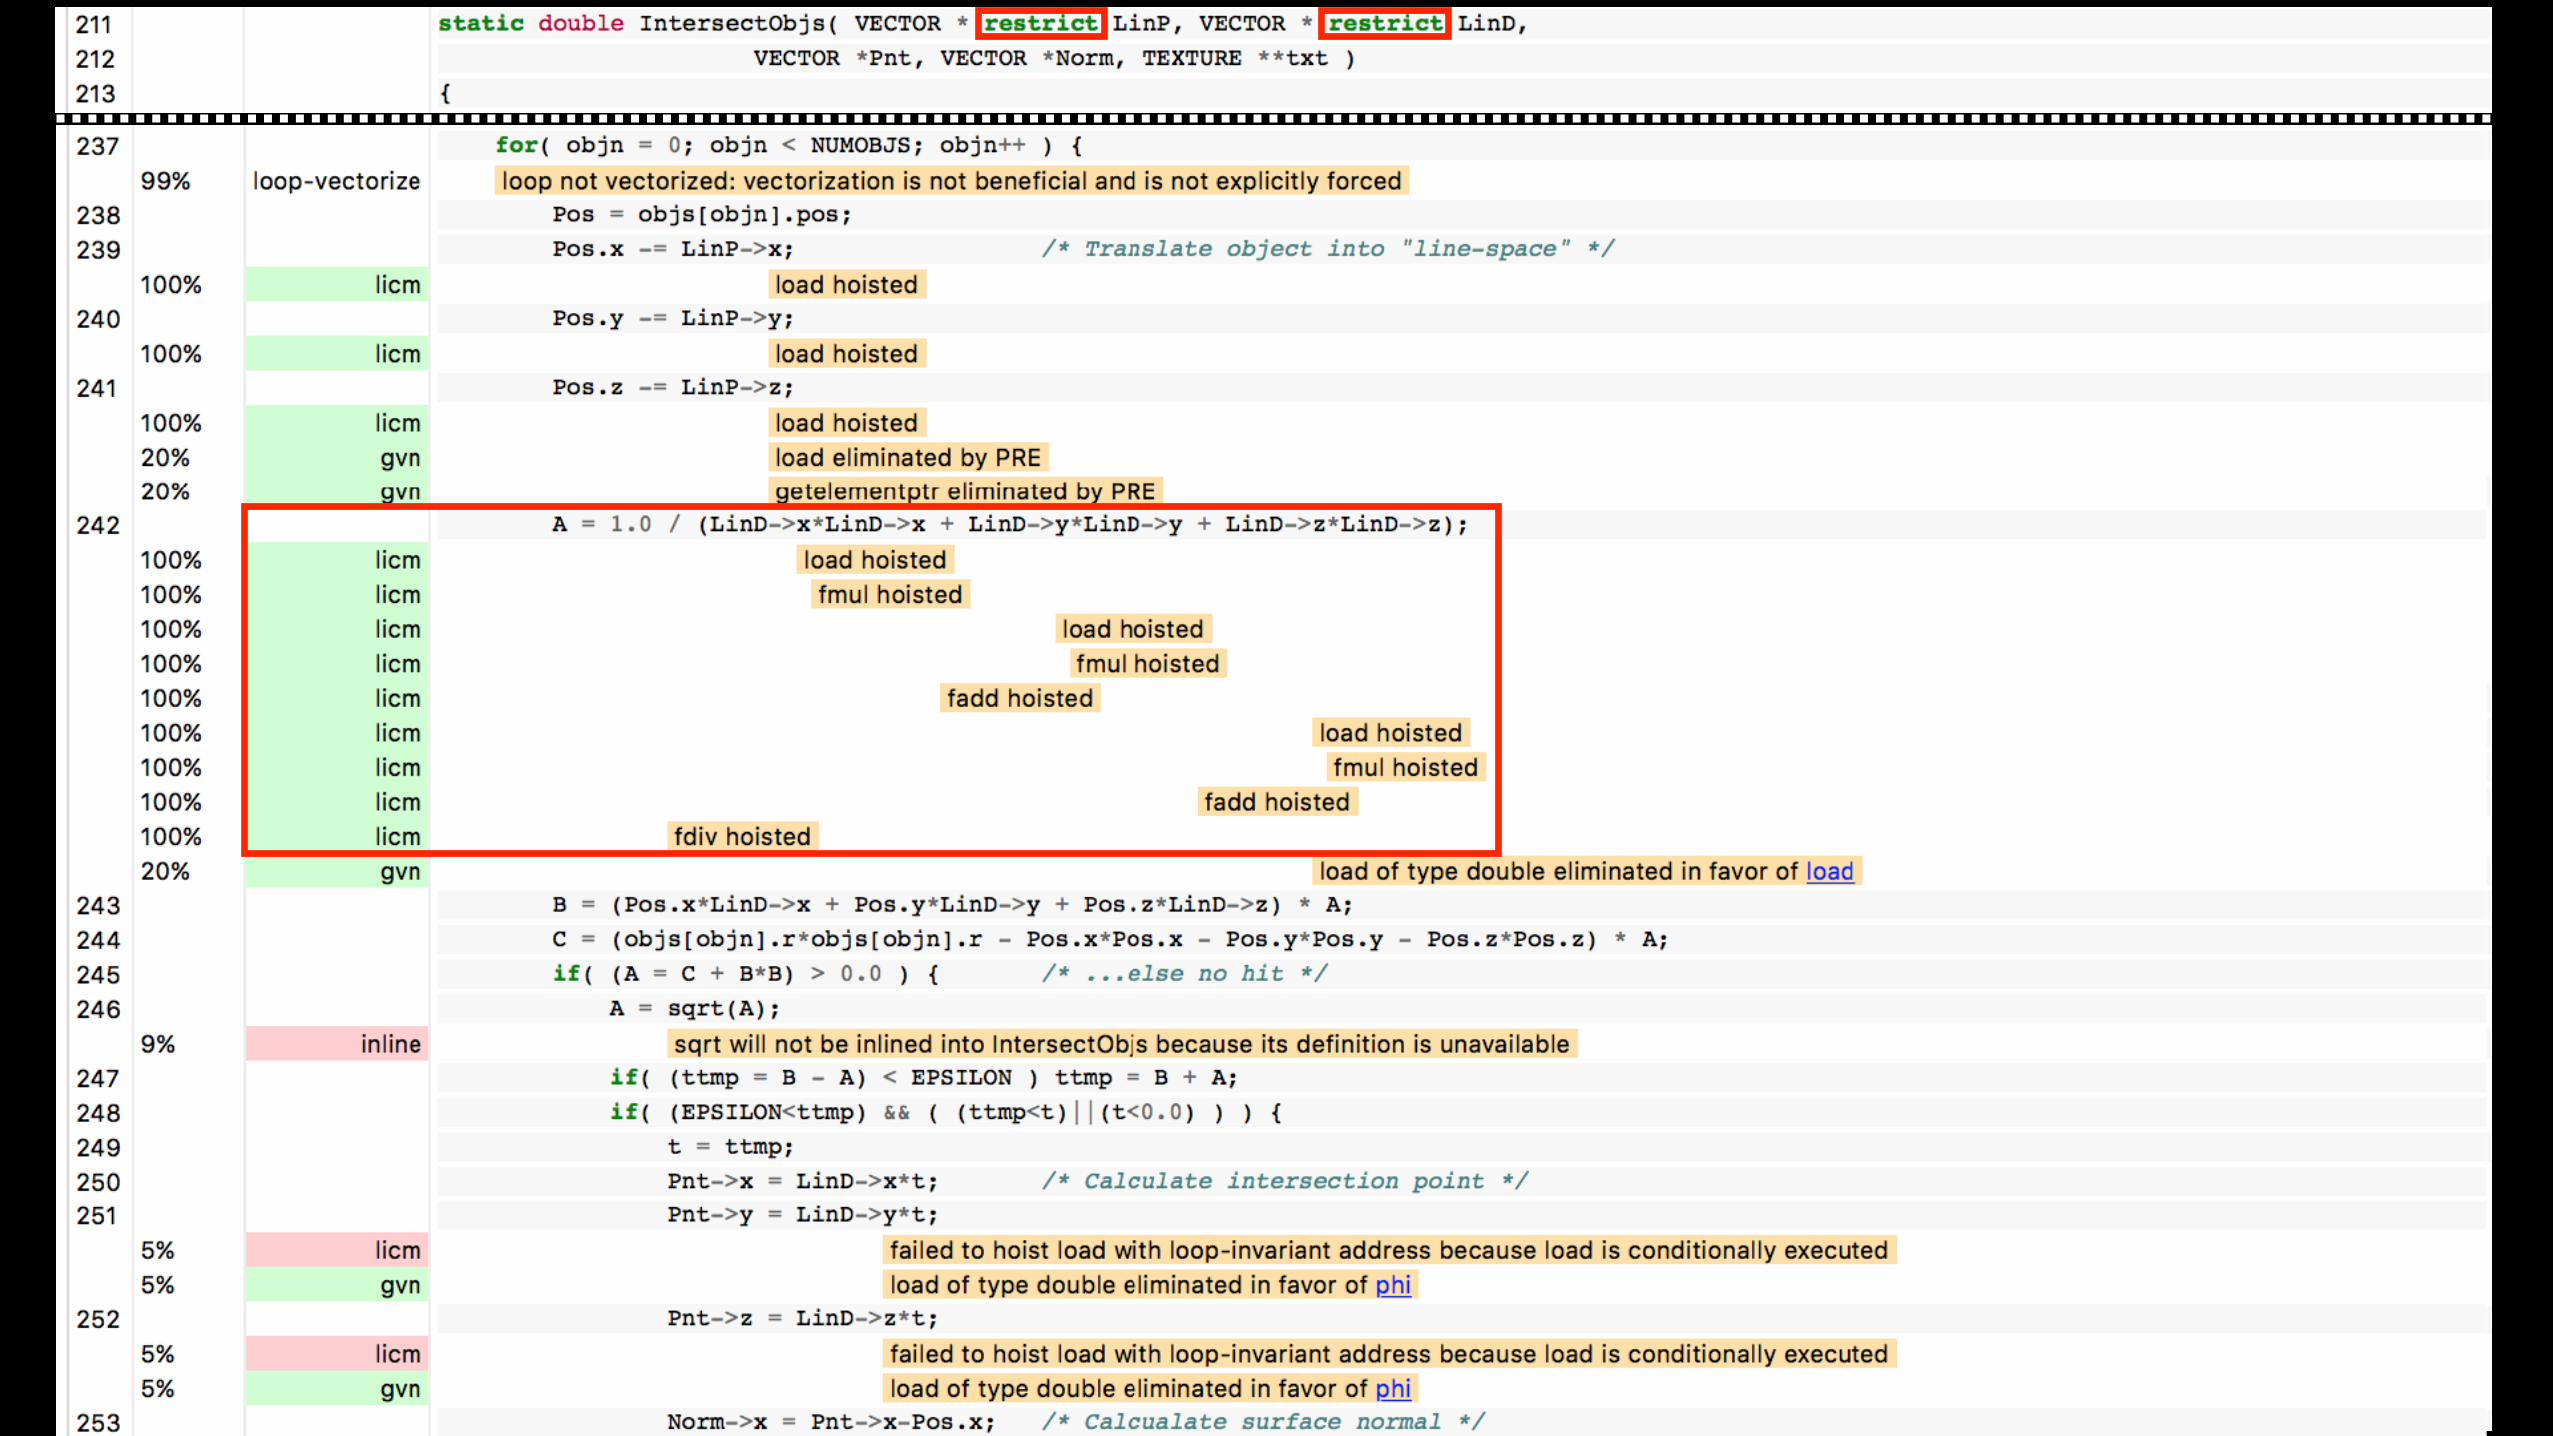
LICM-based LoopVersioning (-enable-loop-versioning-licm)
Performance opportunity if we can improve this passApproximate the opportunity by
manually modifying the source
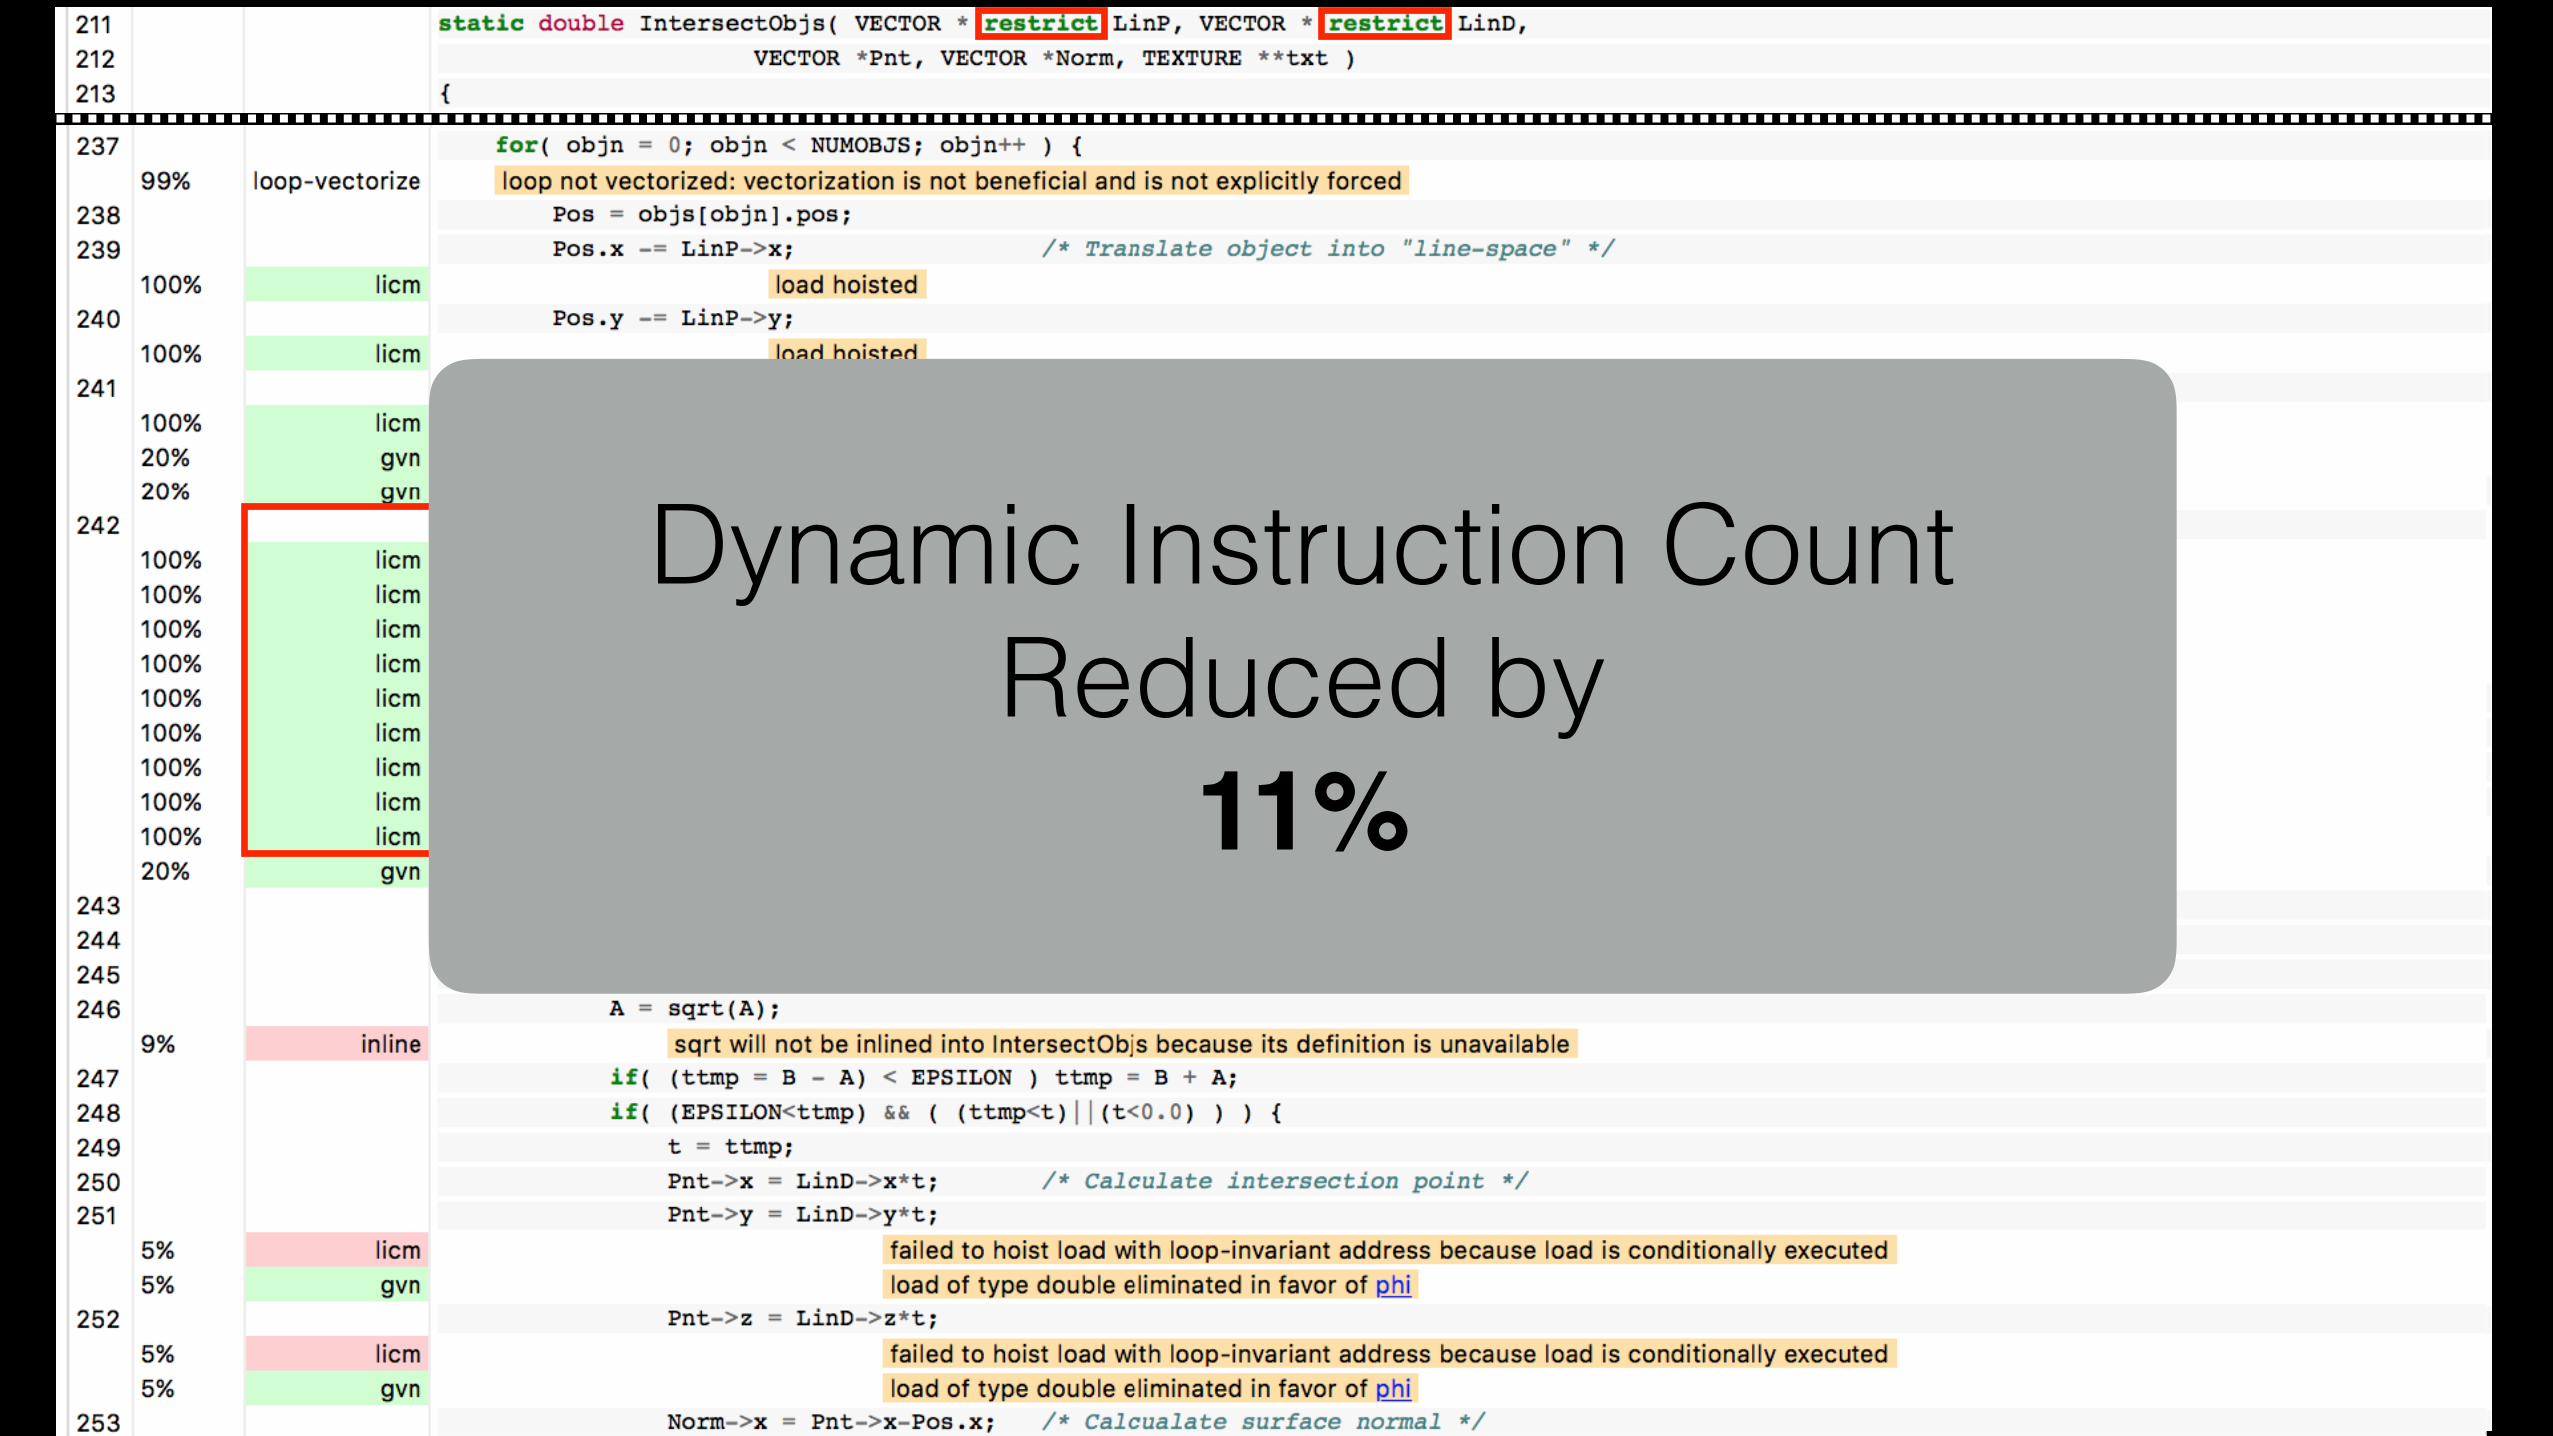
Dynamic Instruction Count Reduced by
11%

Dynamic Instruction Count Reduced by
11%Performance headroom
11%

Freebench/distray: Summary
• Found optimization opportunity while staying in the high-level view
• Reconstructed the reason for missed optimization
• High-level view exposed that the gain may be substantial
• Got immediate feedback of the desired effect on the prototype
• Identified the pass for low-level debugging
58

Check Out More Examples
http://lab.llvm.org:8080/artifacts/opt-view_test-suite
59

Development Timeline
60
Code Author Tool
Compiler Developer Tool
Initial version on LLVM trunk
NowNew tools
using Optimization
Records
Compiler Developer Tool: Status
• Written in Python
• Hook up new passes
• Improve diagnostics quality for existing passes
• Perform extra analysis for insightful messages
• Improve UI
61

Compiler Developer Tool: Status
• Written in Python
• Hook up new passes
• Improve diagnostics quality for existing passes
• Perform extra analysis for insightful messages
• Improve UI
61
Request for H
elp
Code Author Tool: Wishlist• Suggest specific actions
• E.g. for the LICM case: if the two pointers can never point to the same object consider using ‘restrict’
• Add new “recommendation” analysis passes to detect opportunity and suggest:
• Source annotation to enable off-by-default passes (aggressive loop transformations, non-temporal stores)
• Refactoring: data transformations62
Request for H
elp
Optimization Records: New Tools• llvm-opt-report
• Performance regression analysis
• Optimization statistics with the ability to zoom into the particular optimization
• Bottom-up search for performance opportunities
• See all the LICM opportunities like in Freebench/distray
63

Optimization Records: New Tools• llvm-opt-report
• Performance regression analysis
• Optimization statistics with the ability to zoom into the particular optimization
• Bottom-up search for performance opportunities
• See all the LICM opportunities like in Freebench/distray
63
SELECT benchmark, hotspot, hotnessFROM optimizationsWHERE pass = ‘licm’ AND type = ‘missed’ AND name = ‘LoadWithLoopInvariantAddressInvalidated’ORDER BY hotness

Optimization Records: New Tools• llvm-opt-report
• Performance regression analysis
• Optimization statistics with the ability to zoom into the particular optimization
• Bottom-up search for performance opportunities
• See all the LICM opportunities like in Freebench/distray
• Allows finding opportunities that occur with high frequency but not in the hottest code
63

Acknowledgement
• Tyler Nowicki
• John McCall
• Hal Finkel
64

Q&A
65
SIBsim4 (MultiSource/Applications)
Finding Performance Opportunity
66

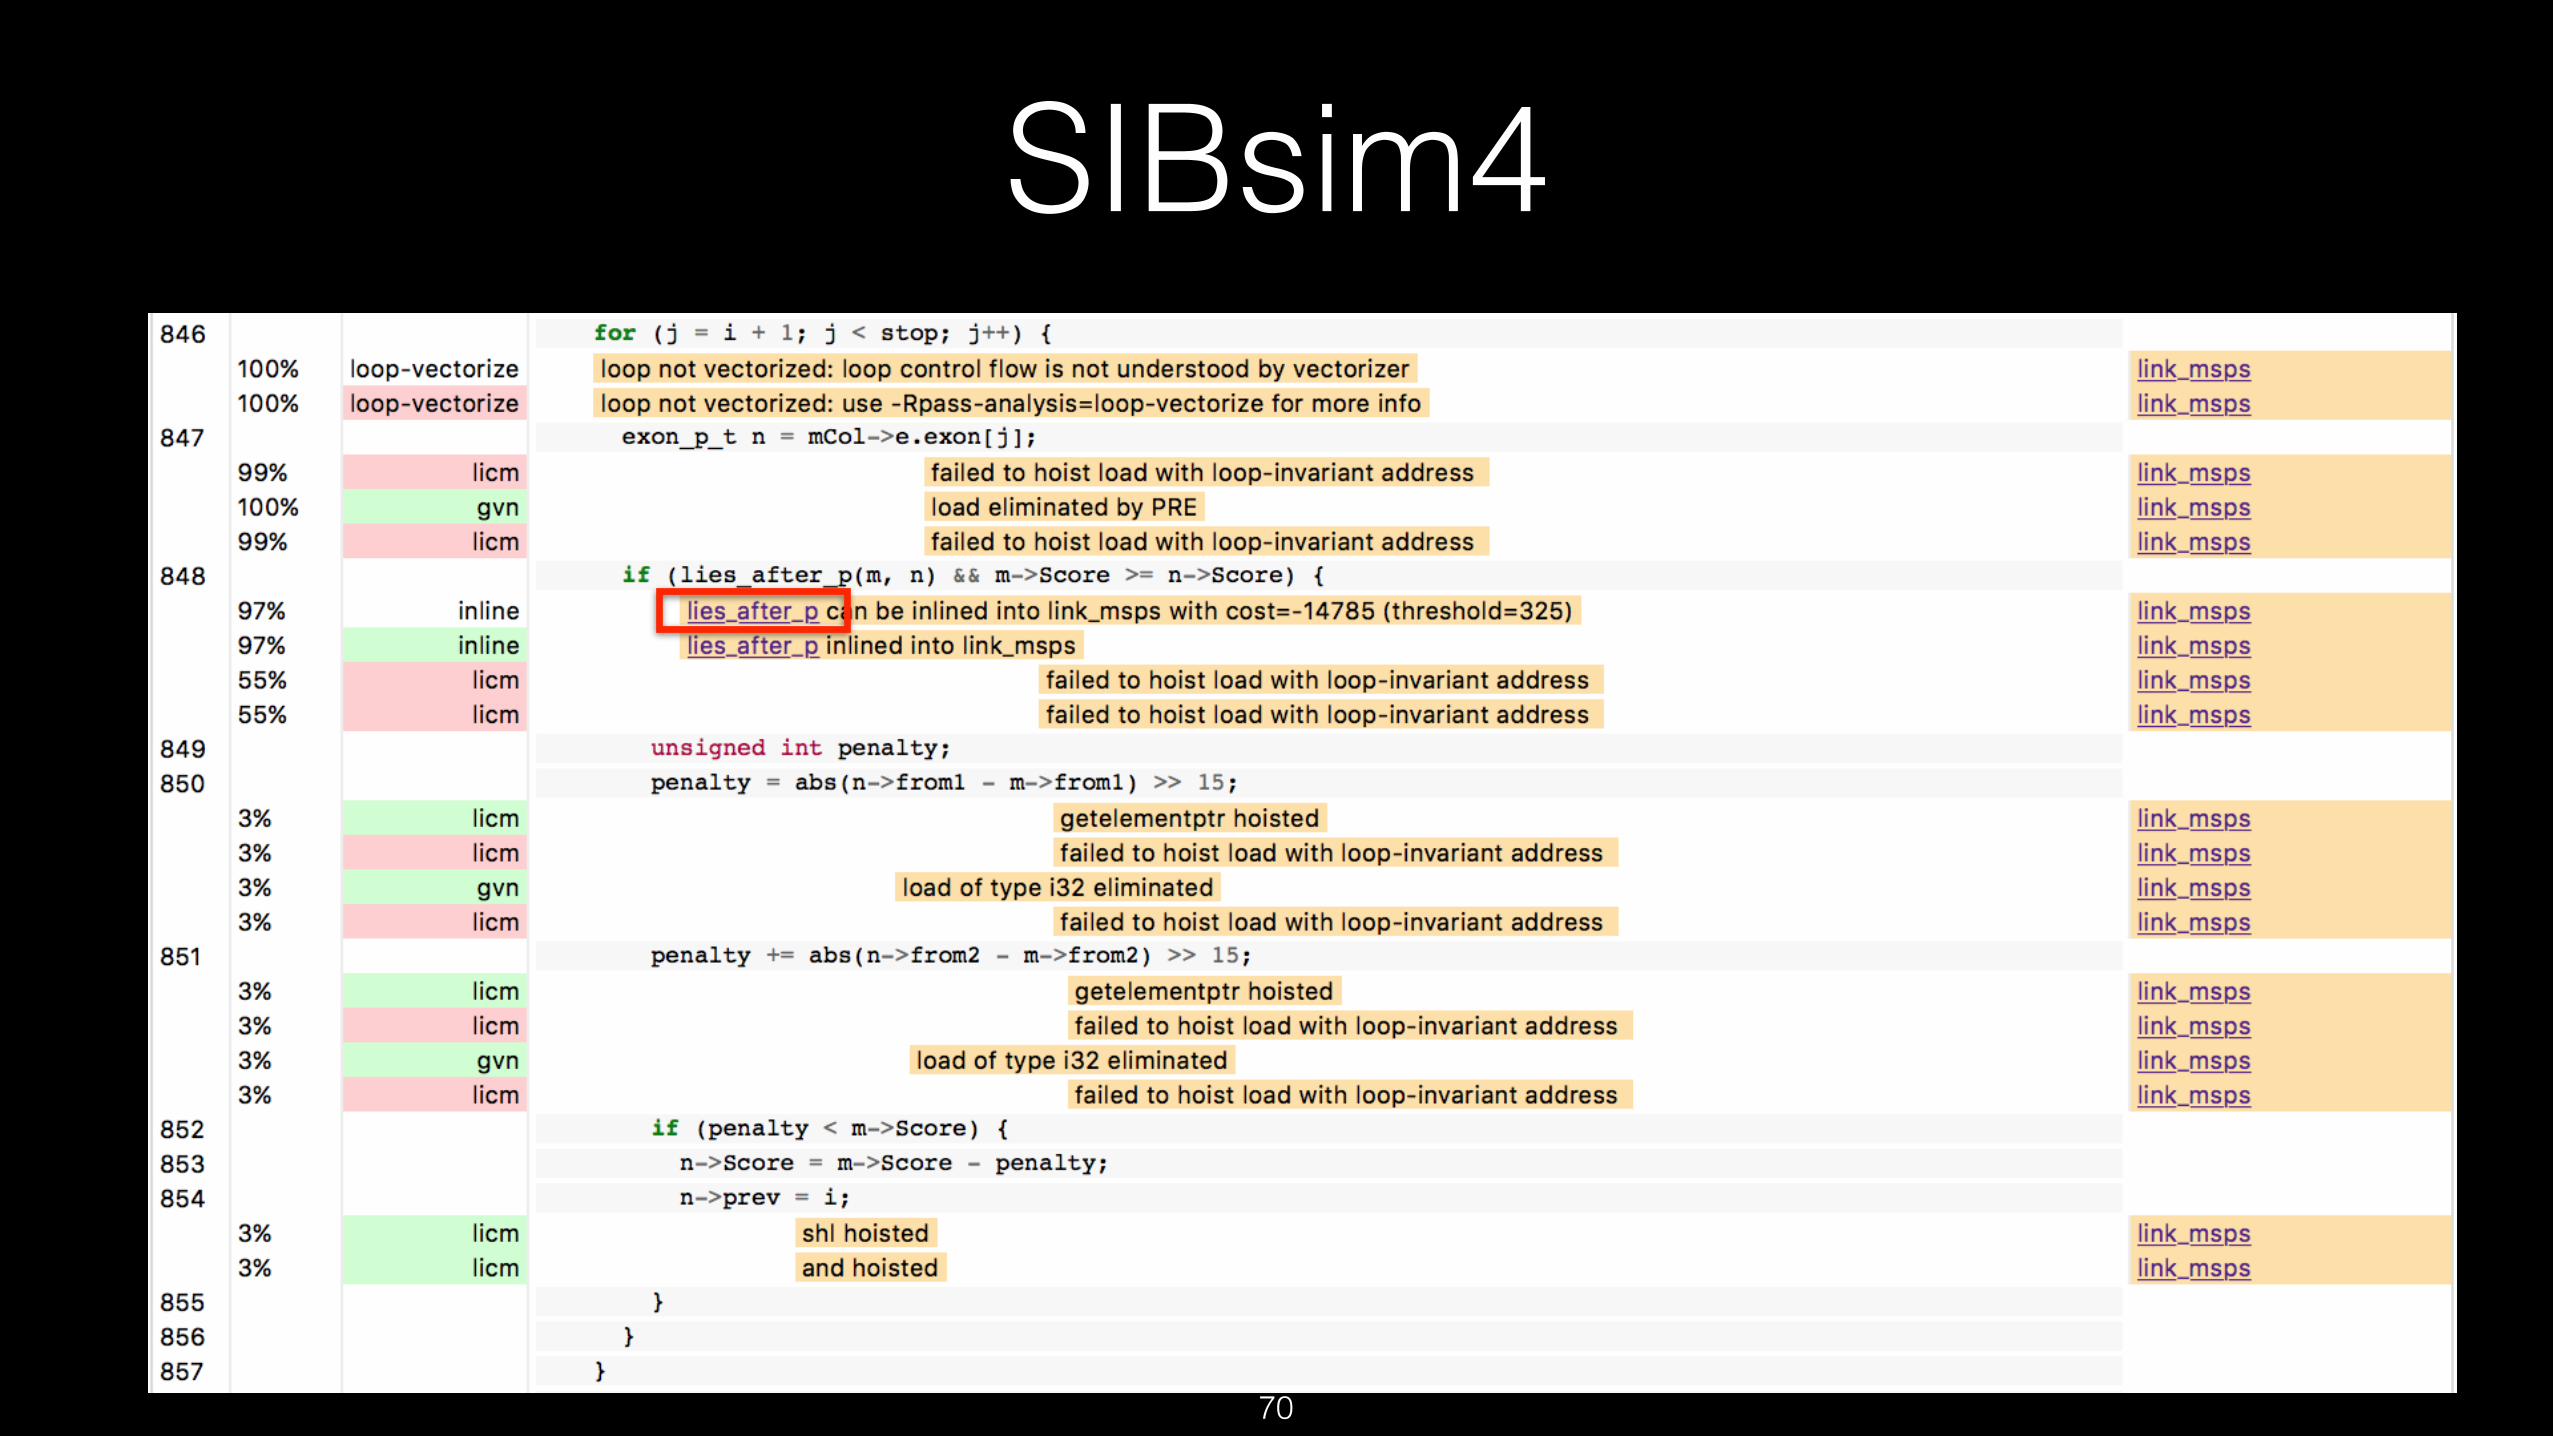
SIBsim4
67

SIBsim4
68

SIBsim4
69
SIBsim4
70

SIBsim4
71

SIBsim4
72
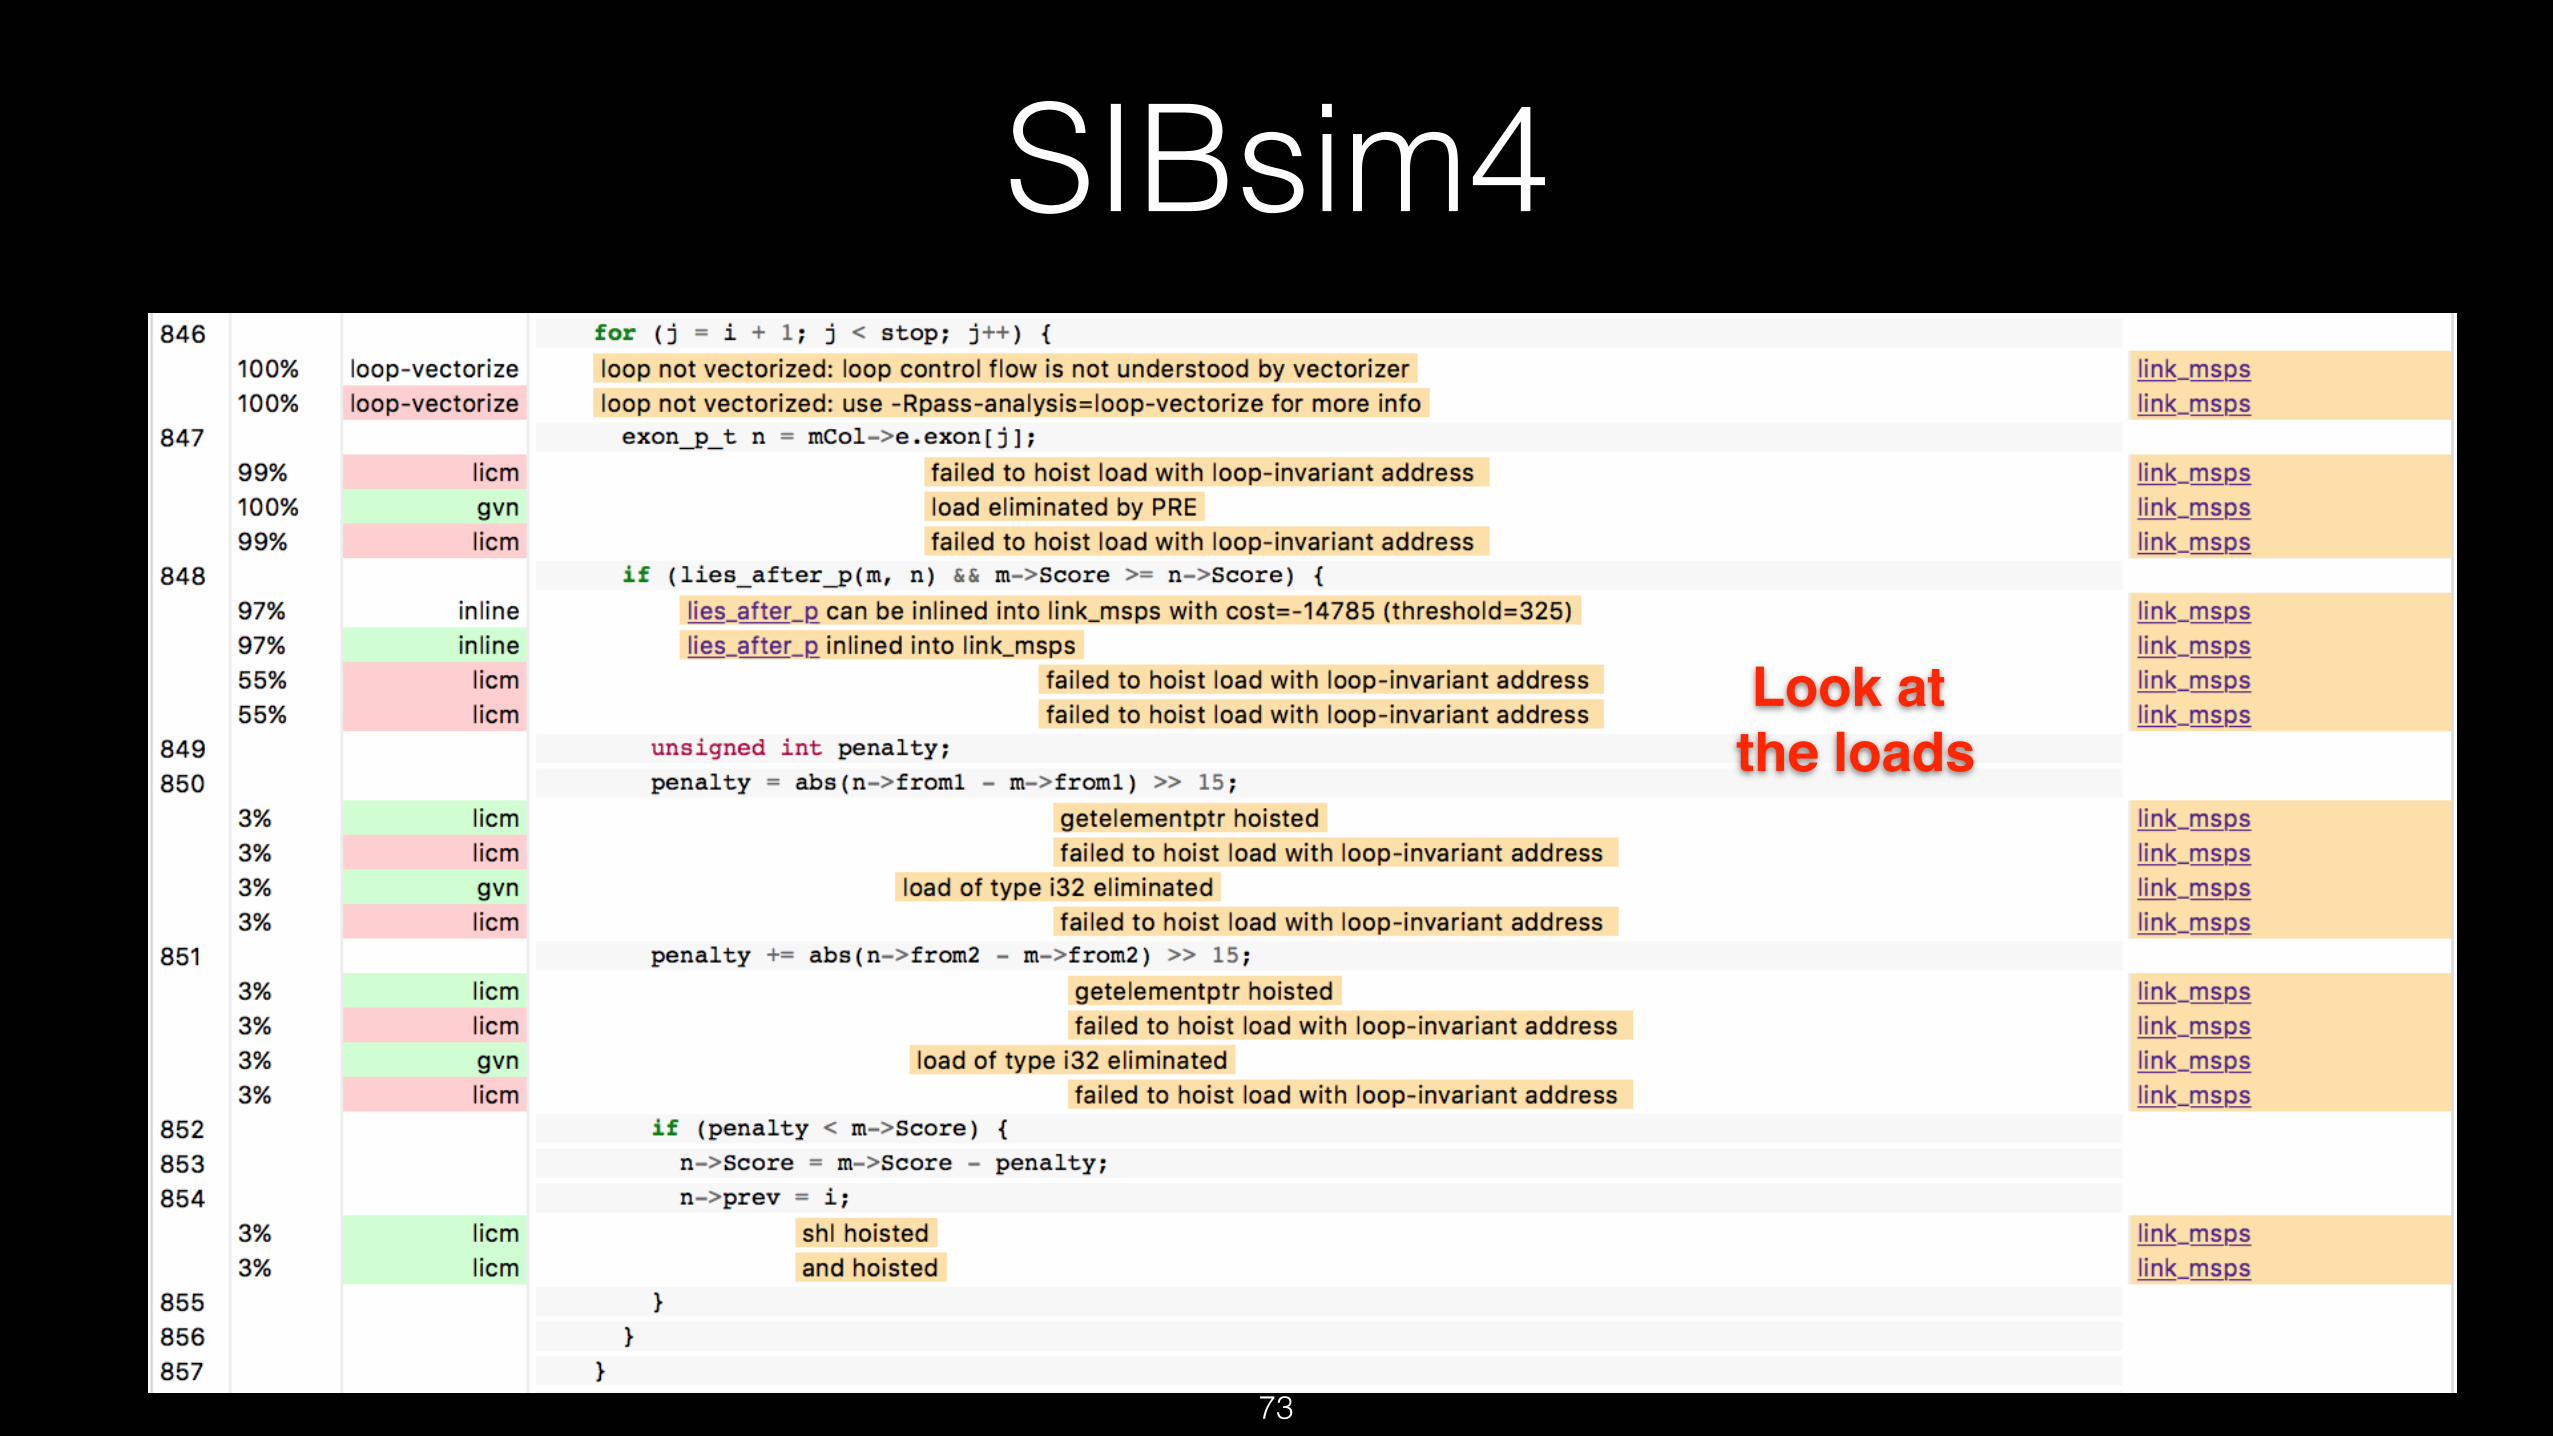
SIBsim4
Look at the loads
73

SIBsim4
Look at the loads
74
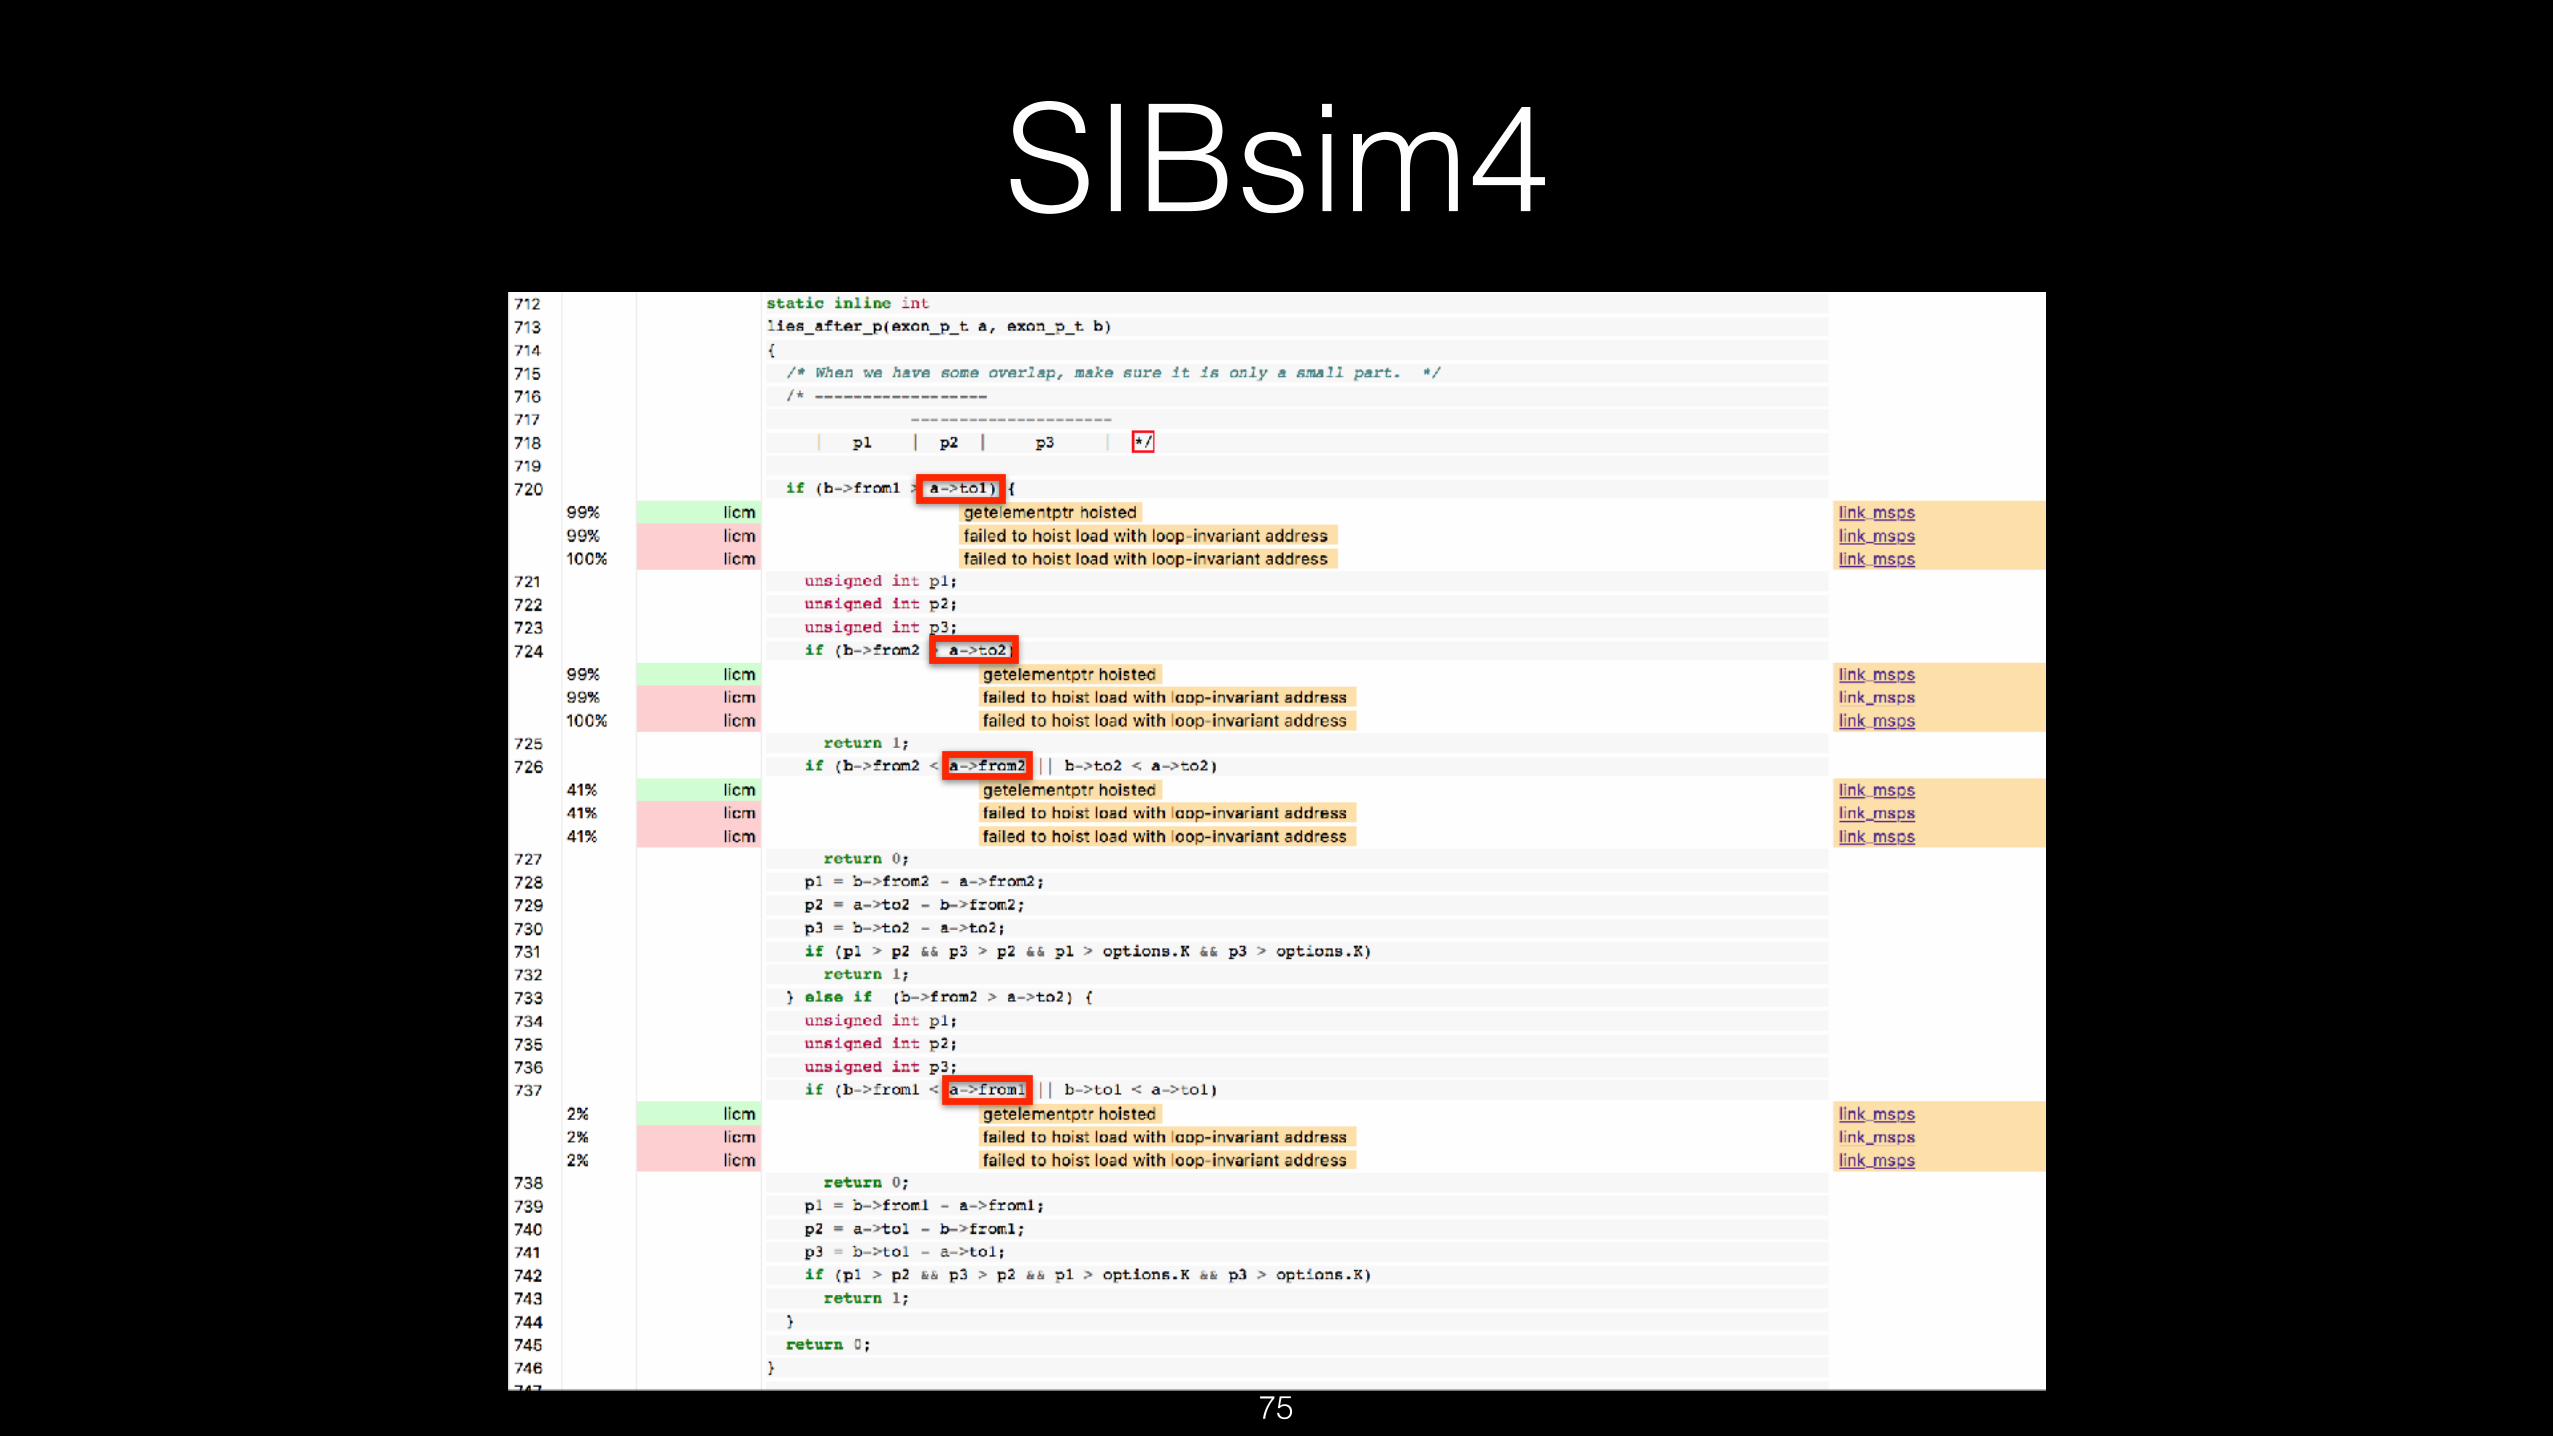
SIBsim4
75
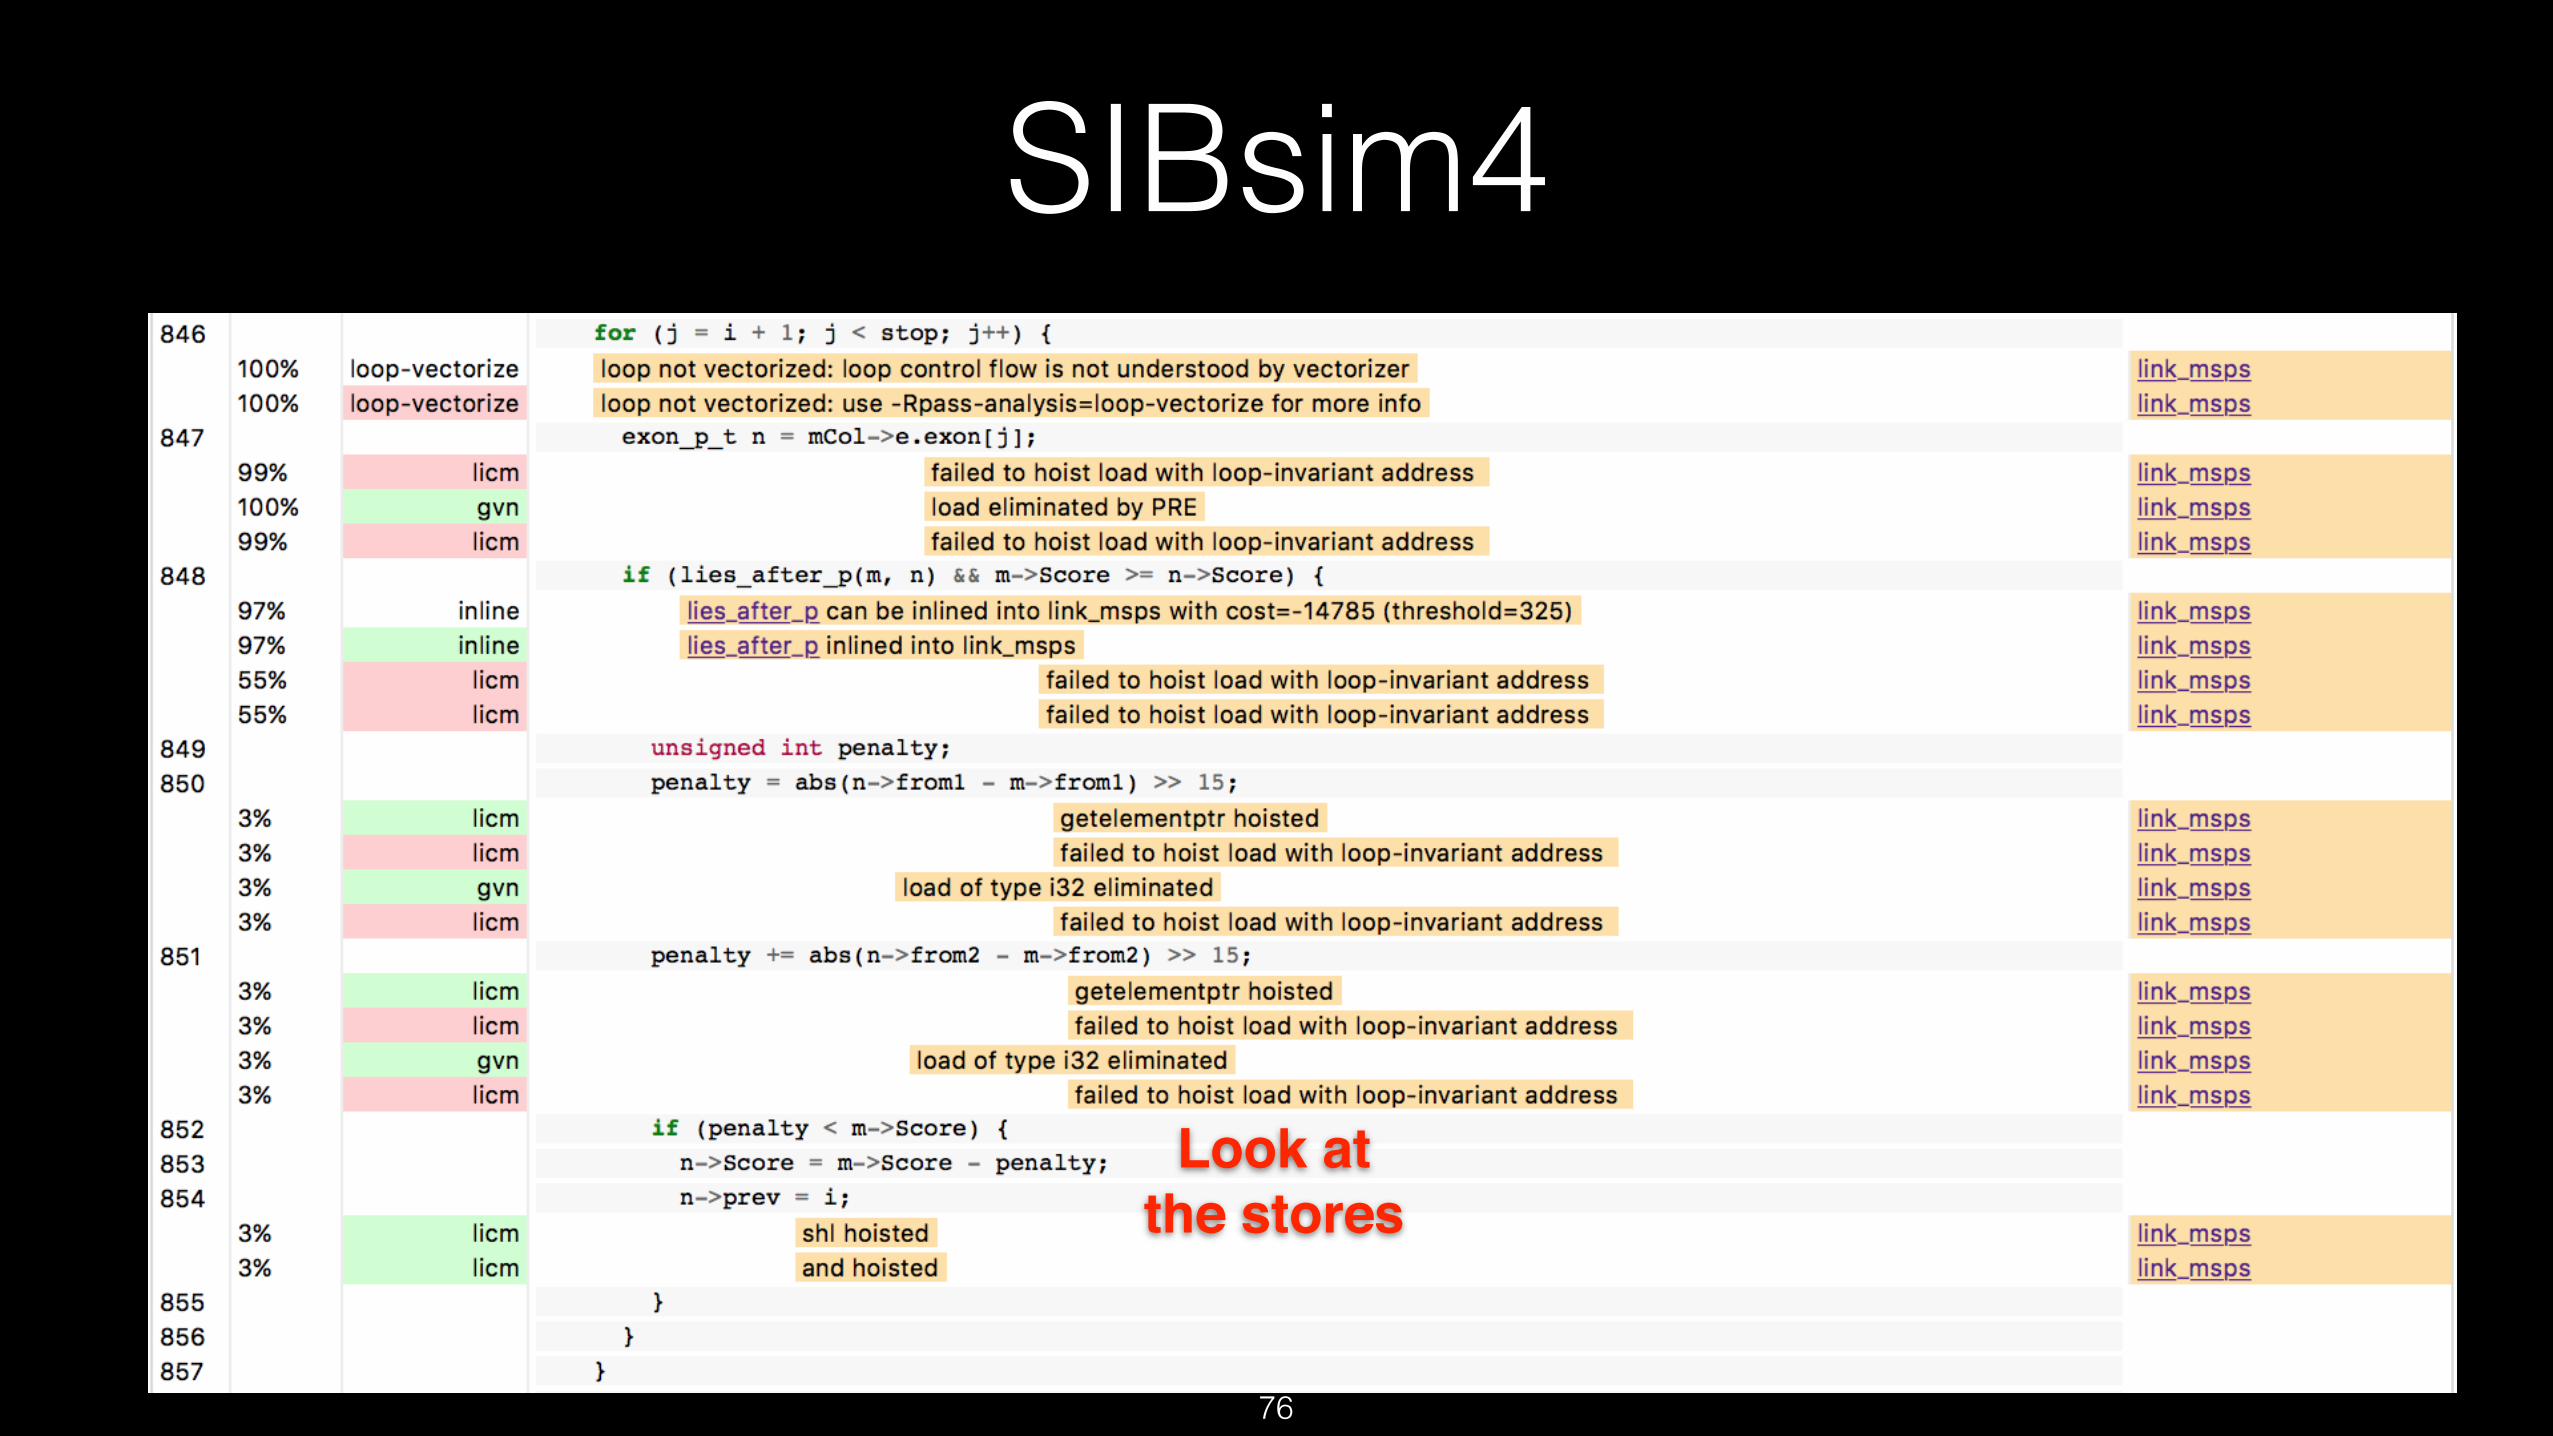
SIBsim4
Look atthe stores
76

SIBsim4
Look atthe stores
77

SIBsim4
Can ‘m’ and ’n’ really alias?
78

SIBsim4Probably not!
exon_p_t m = mCol->e.exon[i];
79

SIBsim4We need to use ‘restrict’
or hoist manually
exon_p_t m = mCol->e.exon[i];
80
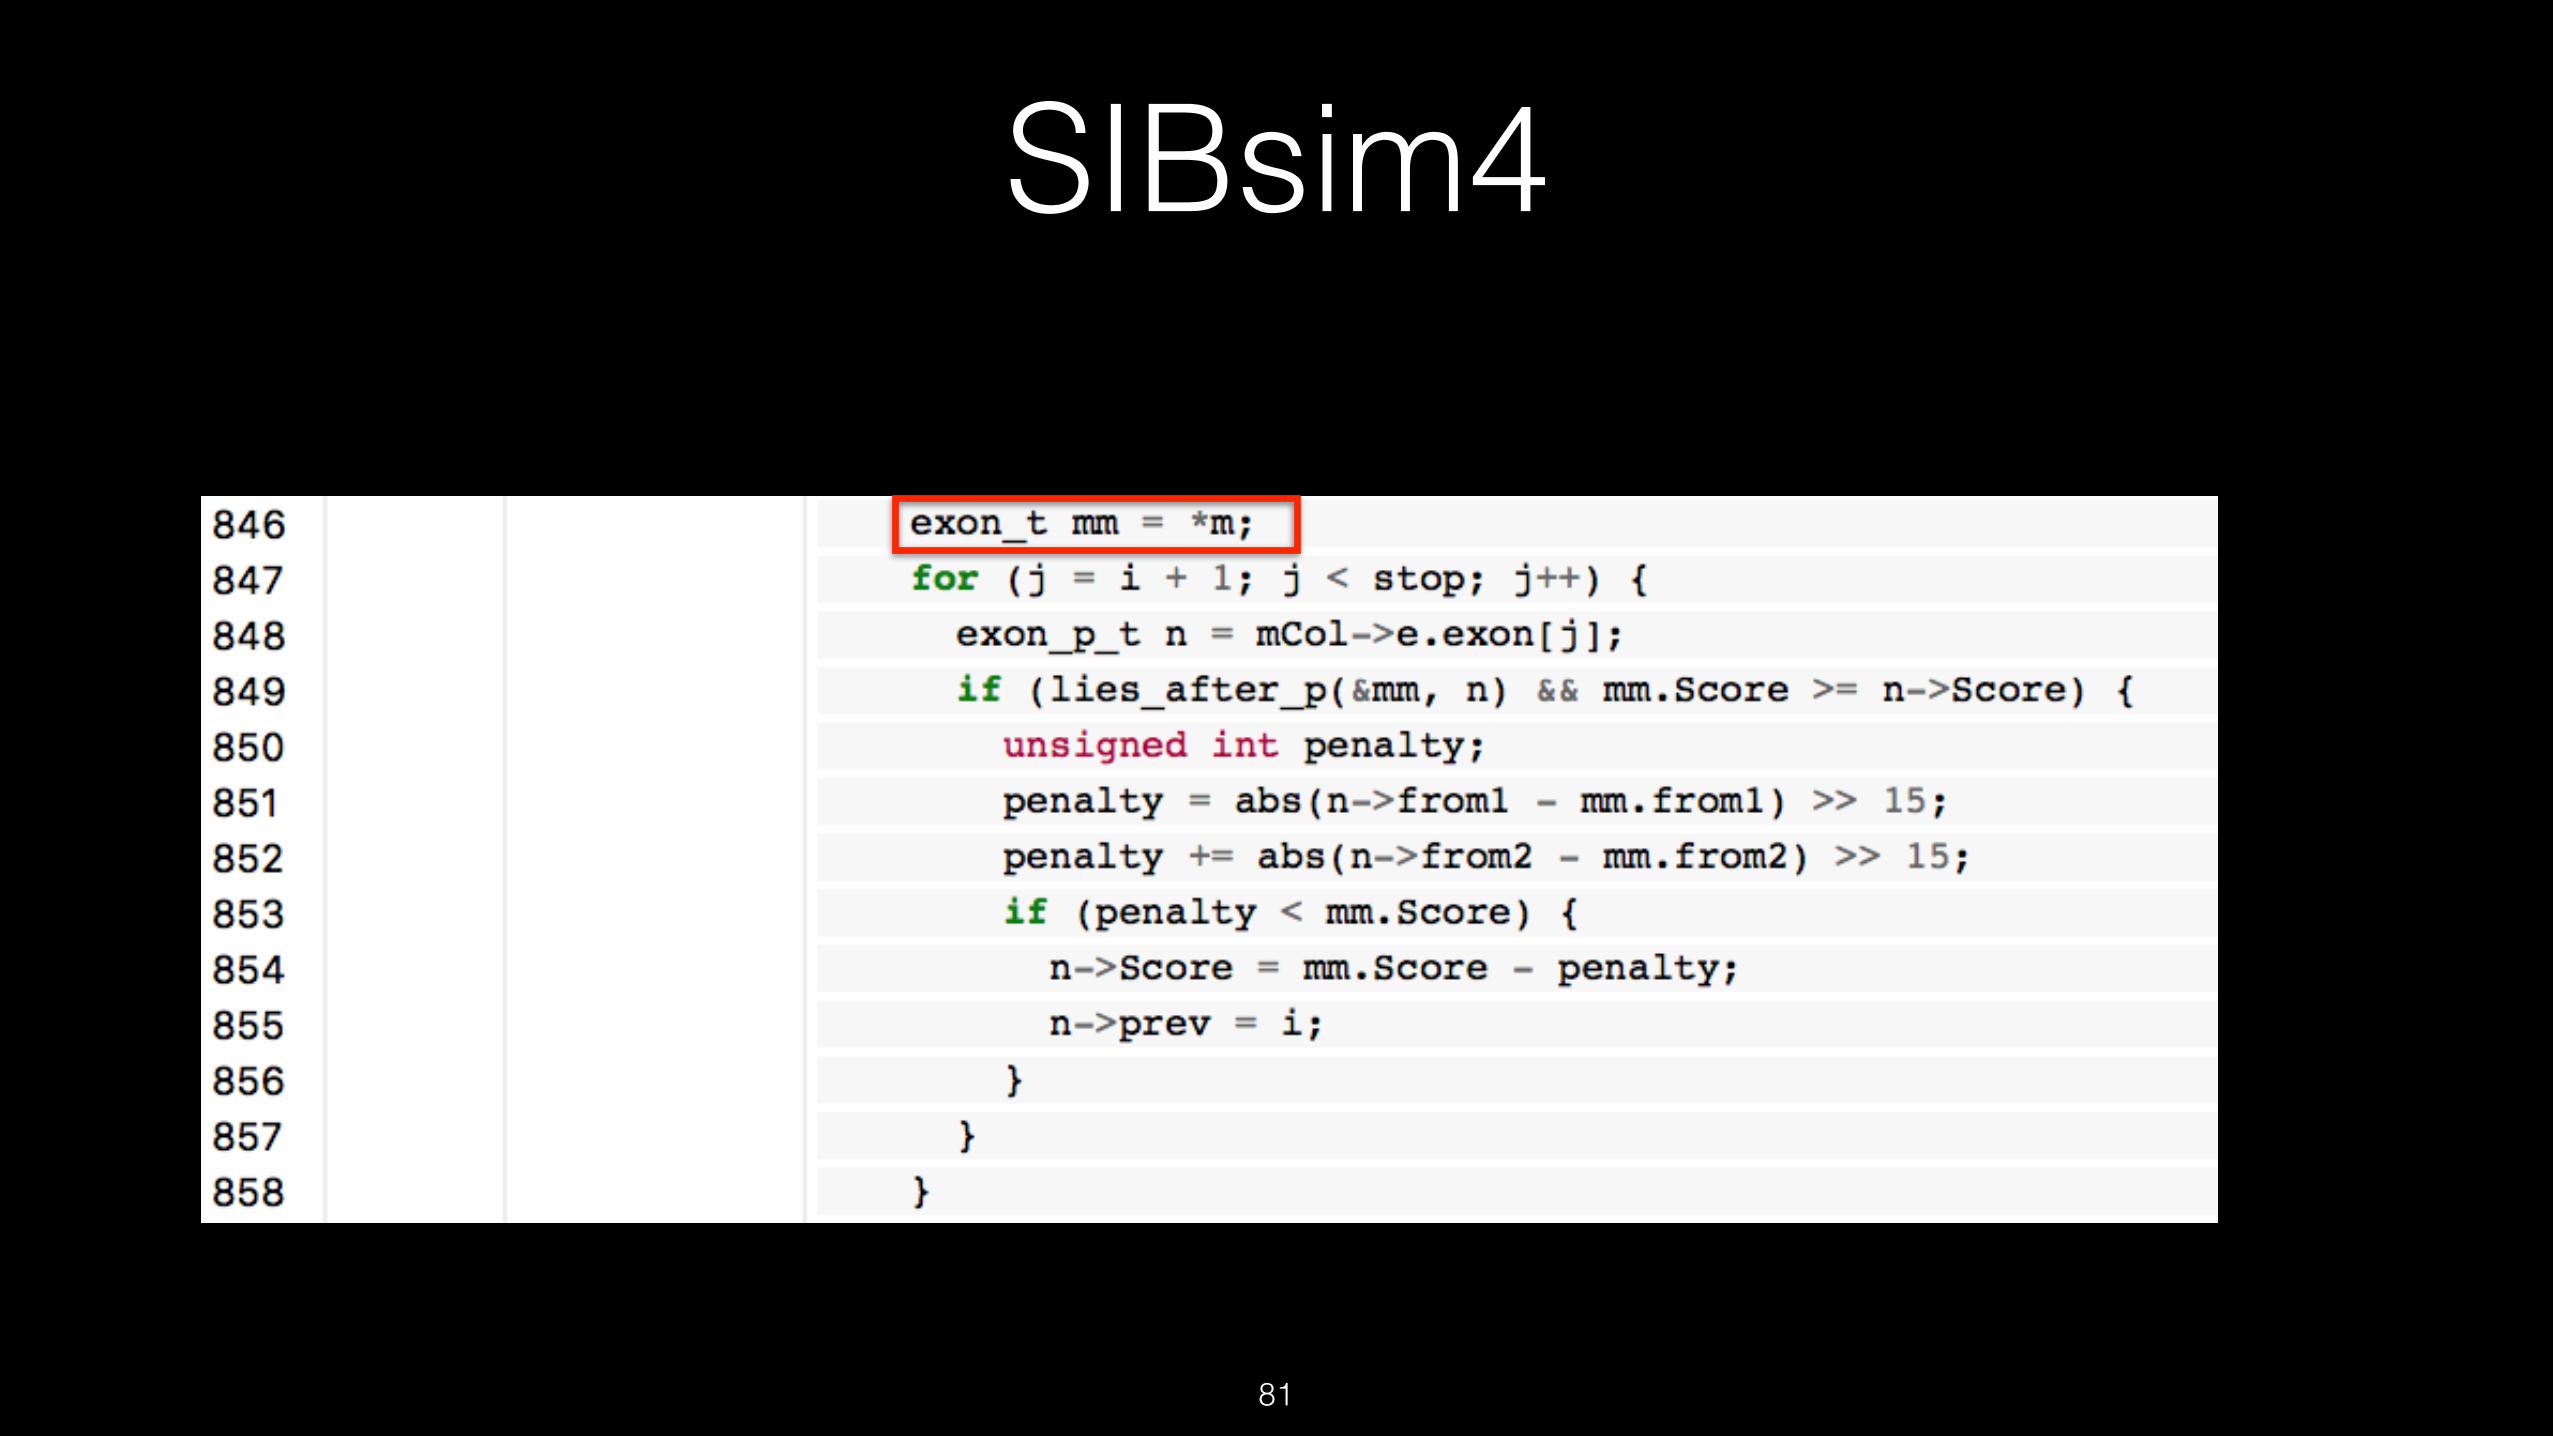
SIBsim4
81
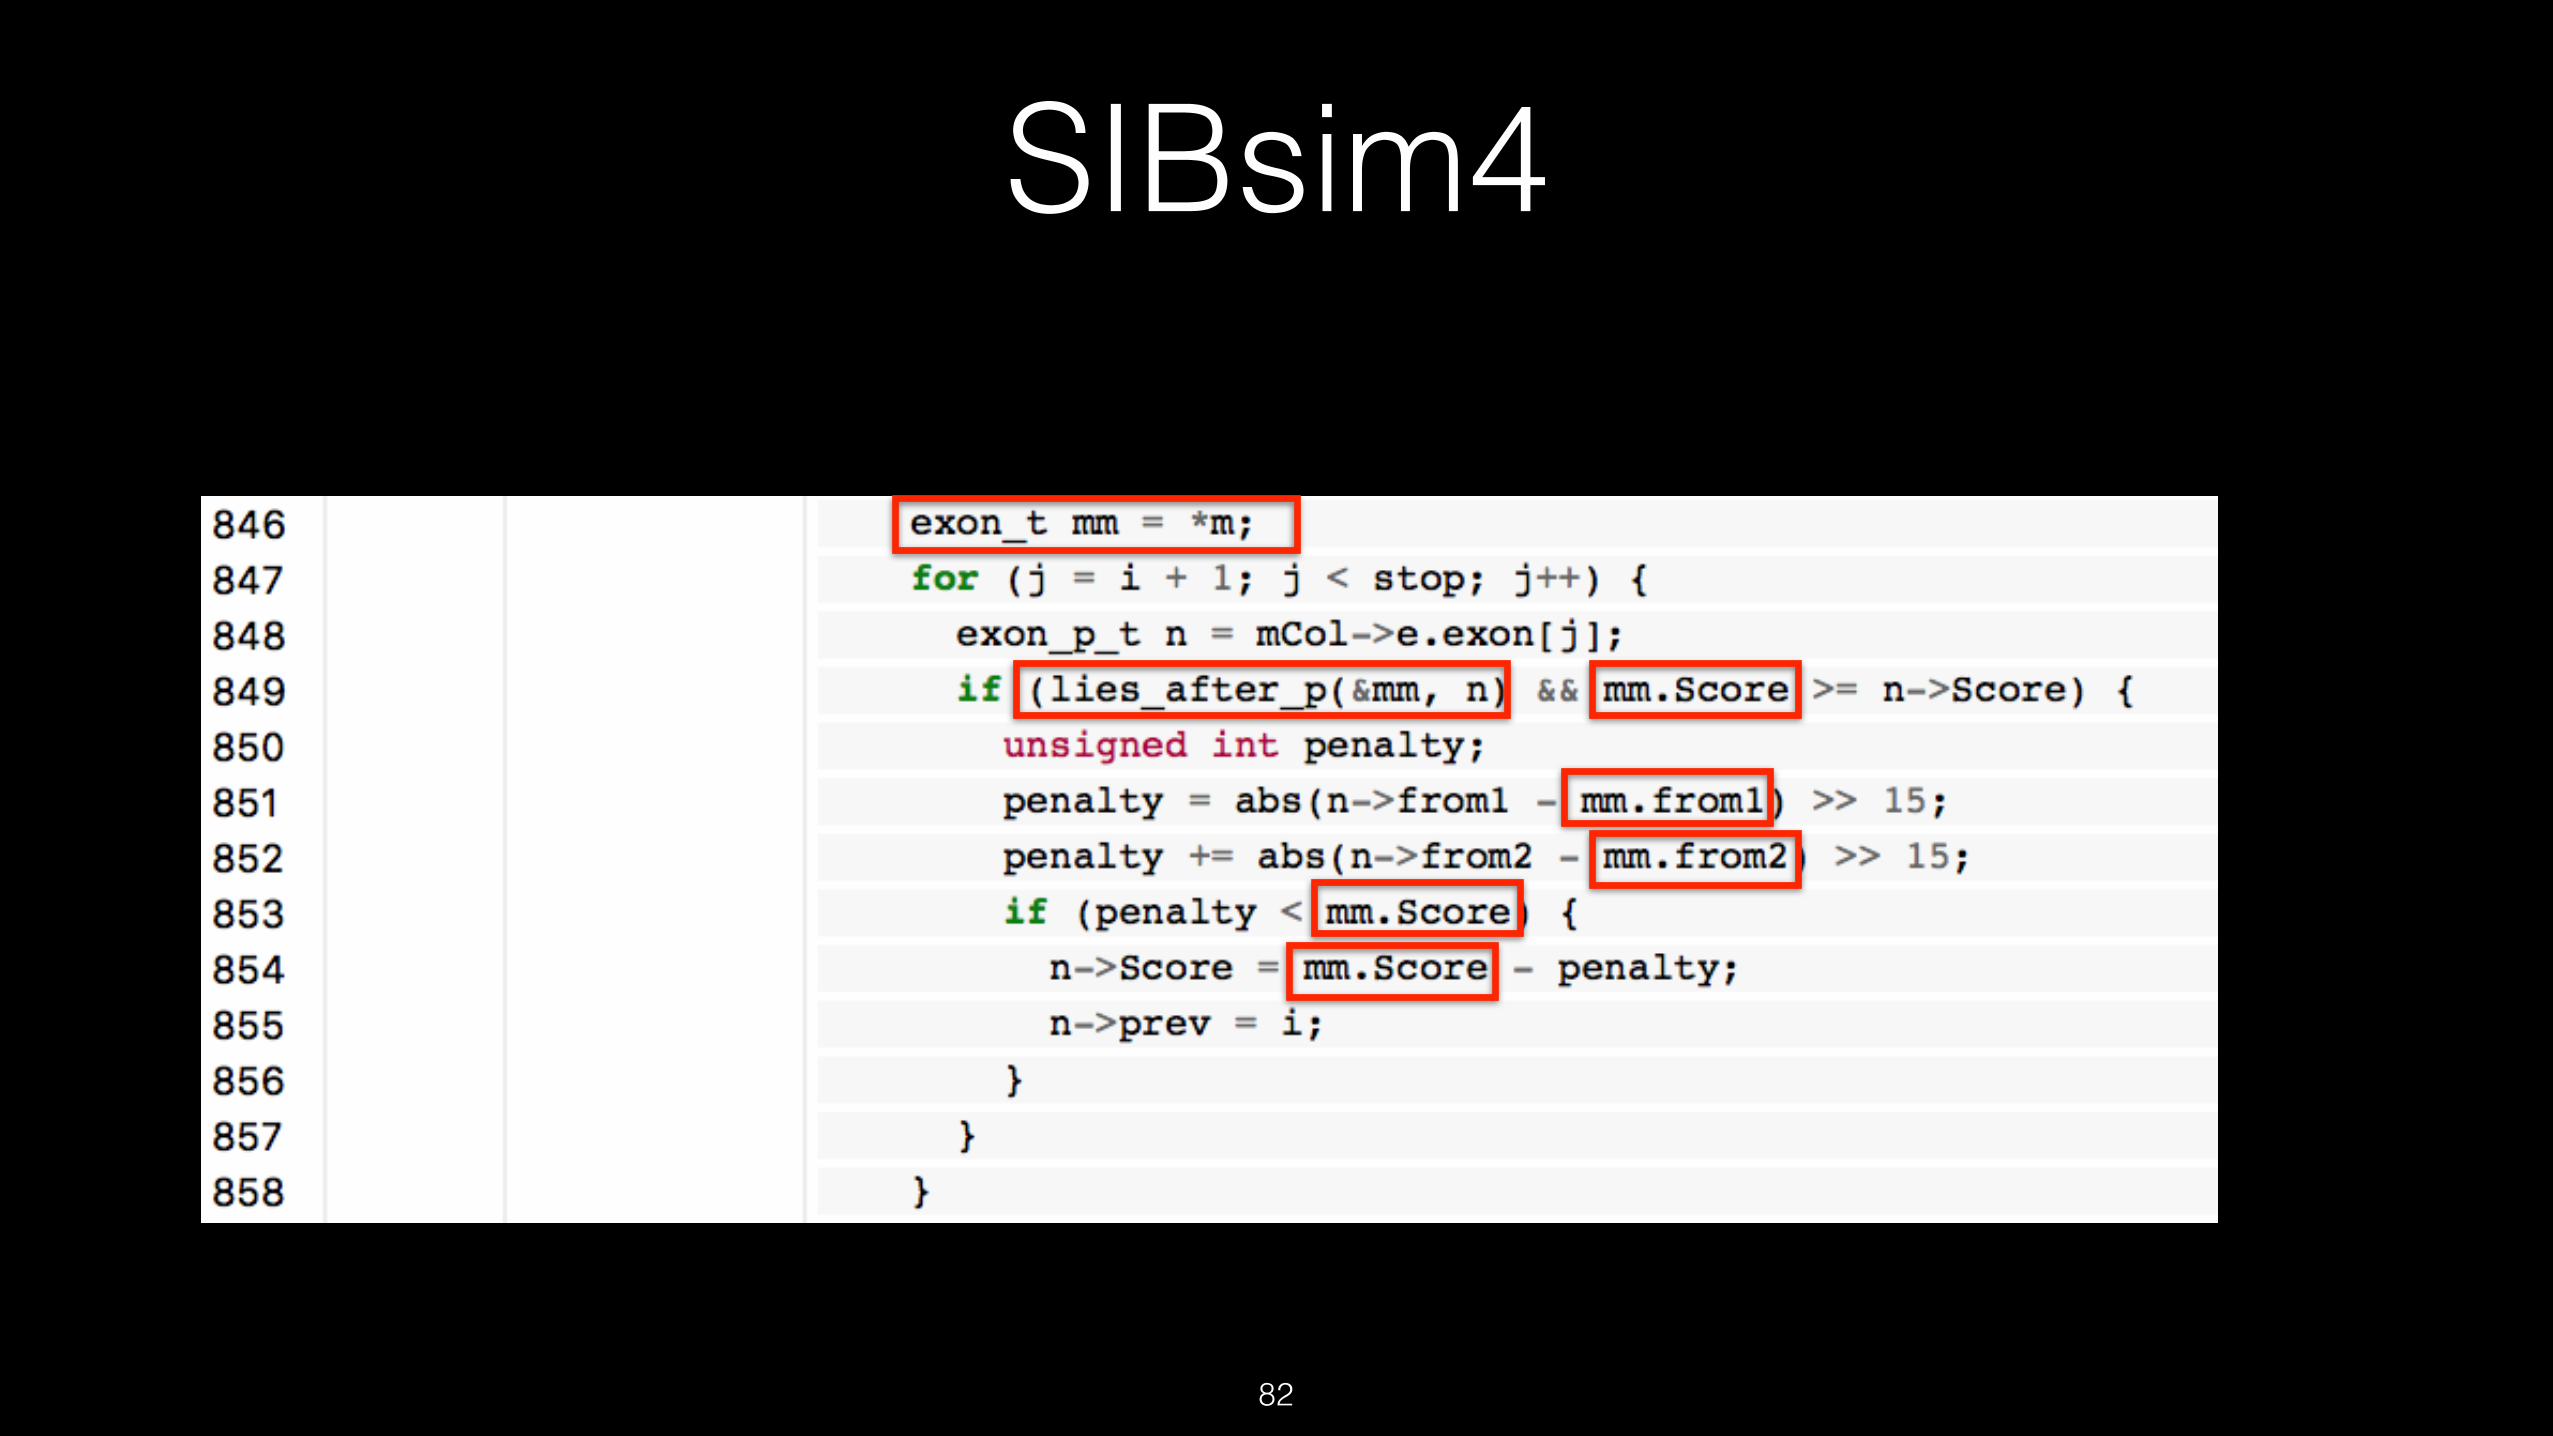
SIBsim4
82

SIBsim4
83

SIBsim4
84