Competitiveness and Innovation in Africa’s Business Climate Abdul B. Kamara Manager, Research...
29
Competitiveness and Innovation in Competitiveness and Innovation in Africa’s Business Climate Africa’s Business Climate Abdul B. Kamara Manager, Research Division, Development Research Department African Development Bank Presentation at the Conference on AFRICA’S NEW FRONTIER: Innovation, Technology, Prosperity Organized by IDRC Ottawa, 4-5 February, 2010
-
date post
18-Dec-2015 -
Category
Documents
-
view
215 -
download
0
Transcript of Competitiveness and Innovation in Africa’s Business Climate Abdul B. Kamara Manager, Research...

Competitiveness and Innovation in Competitiveness and Innovation in Africa’s Business ClimateAfrica’s Business Climate
Abdul B. Kamara
Manager, Research Division,Development Research Department
African Development Bank
Presentation at the Conference on AFRICA’S NEW FRONTIER: Innovation, Technology, Prosperity
Organized by IDRC Ottawa, 4-5 February, 2010

Outline
Investment Climate and Competitiveness of African Countries: vis-à-vis peers & elsewhere (The African Competitiveness Report)
Case Studies - Botswana, Mauritius, Namibia, and Tunisia
Some Concluding Remarks on Improving Africa’s Competitiveness

How we Define Competitiveness
Competitiveness is “the state of the set of institutions, policies, and factors that determine the level of productivity of an economy.”
The level of productivity, in turn determines rates of return to investment, and thus sets the sustainable level of wealth creation in an economy (returns to investment is a critical driver of economic growth);
A more competitive economy is likely to be more productive and grow faster over the medium term.
How we do not define competitiveness: “an economy’s share of the world market for its products”

Why Assess Competitiveness
Examine the drivers of competitiveness and growth of the countries in a global context;
To establish a quantitative tool to help policymakers benchmark and measure the competitiveness of a given country;
Prioritize those areas requiring urgent policy attention;
Monitor progress over time (this is the 3rd ACR; 1st in 2004, 2nd in 2007)
Collaborators: AfDB, WB, WEF – with the objective of generating a better understanding on the ingredients of Africa’s economic growth (assessing the investment climate & competitiveness landscape);

Methodology and Data
The ACR adapts the methodology Global Competitiveness Index;
Data Sources: AfDB, WB, WEF– Executive Opinion Surveys (WEF)
– Enterprise Surveys (WEF) – Doing Business Indicators (WB) – Country Private Sector Profiles (AfDB) – Country Governance Profiles (AfDB)

The Global Competitiveness Index (GCI)
The GCI is developed using both “hard” data from public sources (such as inflation, forex regulatn., internet penetration, life expectancy, school enrollment rates, etc), as well as data from the other sources indicated above;
The surveys provide crucial data on a number of qualitative issues (e.g. corruption, confidence in the public sector, quality of schools, etc) for which no hard data exist; as well as on SMEs (starting up business, permits, taxes, forex, labor laws (on firing/hiring), wages, property rights, etc).
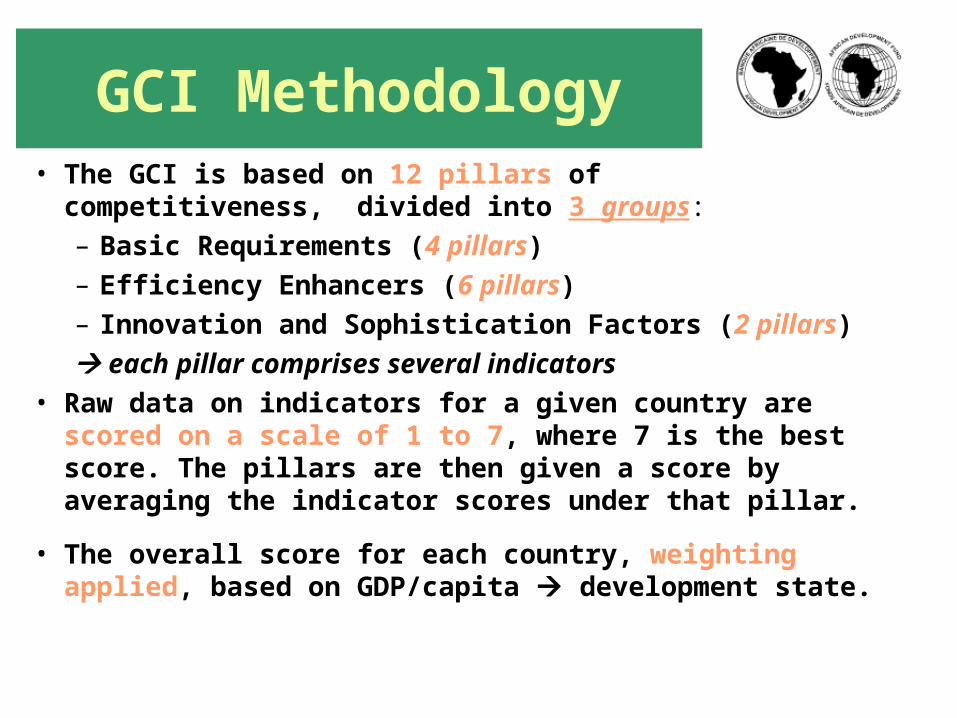
GCI Methodology• The GCI is based on 12 pillars of competitiveness,
divided into 3 groups:– Basic Requirements (4 pillars)– Efficiency Enhancers (6 pillars)– Innovation and Sophistication Factors (2 pillars)
each pillar comprises several indicators• Raw data on indicators for a given country are
scored on a scale of 1 to 7, where 7 is the best score. The pillars are then given a score by averaging the indicator scores under that pillar.
• The overall score for each country, weighting applied, based on GDP/capita development state.

Methodology (continued)
• Countries are grouped into three Stages of Development based on their GDP per capita:
Stage of Development GDP per capita
Stage 1: Factor Driven <$2,000
Transition from 1 to 2 $2,000-$3,000
Stage 2: Efficiency Driven $3,000-$9,000
Transition from 2 to 3 $9,000-$17,000
Stage 3: Innovation Driven >$17,000

Pillars of Competitiveness Key for
Basic Requirements (institutions; infrastructure; macro stability; health and primary education)
Factor Driven Economies (Benin, B. Faso, Mali, Niger, S. Leone, Liberia, Chad, Gambia, Kenya, etc – the vast majority falls here).
Efficiency Enhancers (higher education and training; goods market efficiency; labor market efficiency; financial sector efficiency; Technological Readiness; Market Size)
Efficiency Driven Economies (Algeria, Mauritius, Namibia S. Africa and Tunisia, with Botswana, Libya and Morocco in transition)
Innovation and Sophistication Factors (business sophistication; innovation)
Innovation Driven Economies(Highly industrialized countries, whose competitiveness is derived from innovation and sophistication: None)
Methodology (continued)

Methodology (continued)• Weight of different pillar groups (in %) changes depending on the stage of
development:
Pillar Group/Stage Factor
Driven (%)
Efficiency
Driven (%)
Innovation
Driven (%)
Basic Requirements 60 40 20
Efficiency Enhancers 35 50 50
Innovation and sophistication factors
5 10 30

Some Results – GCI 2008/09: Ranks for Africa’s 3 best & 3 worst
Ranking in 2008 - 09 (out of 134 countries)
134
133
132
56
45
36
0 50 100 150 200 250
Chad (2.8)
Zimbabwe (2.9)
Burundi (3.0)
Botswana (4.2)
South Africa(4.4)
Tunisia (4.6)
Best performers
Worst performers
e.g. Burundi: Strengths: macro-stability and health/primary education. Weaknesses: institutions, technological readiness, market size.

GCI Scores -- Africa in International Comparison
Score in 2008/09 (1-7)
0.0 0.5 1.0 1.5 2.0 2.5 3.0 3.5 4.0 4.5 5.0
Chad (134)Zimbabwe (133)
Burundi (132)Mozambique (130)
Mauritania (131)Uganda (128)
Mali (117)Malawi (119)
Ethiopia (121)Lesotho (123)
Madagascar (125)Burkina Faso (127)
Sub-Saharan Africa averageIvory Coast (110)
Zambia (112)Tanzania (113)
Cameroon (114)Ghana (102)Benin (106)
Senegal (96)Algeria (99)Kenya (93)
Nigeria (94)Latin America, Car. average
The Gambia (87)Libya (91)
North Africa averageNamibia (80)
Egypt (81)Brazil (64)
Morocco (73)Botswana (56)
Mauritus (57)India (50)
Russian Federation (51)South Africa (45)
South East Asia averageTunisia (36)
China (30)

In 2004-2008 Period – Improvements on GCI (Scale of 1 to 7)
The scores for most African countries remained stable or improved, on average from 3.5 - 3.7
Northern Africa: Algeria and Egypt (no change); Morocco (from 4.0 - 4.1) and Tunisia (from 4.3 - 4.6)
The SSA countries had more striking improvement in line with the improving economic climate in recent years: Botswana, Ethiopia, and Kenya (0.5-pt); Gambia and Mauritius (0.4pt); Mali, Nigeria, S. Africa, and Tanzania (0.3pt); and the rest remained stable except Uganda (- 0.2 pt)

5 Areas of Improvements in GCI 2004-2008
African average performance in improvement areas
2.5
2.7
2.9
3.1
3.3
3.5
3.7
3.9
4.1
4.3
4.5
2004 2005 2006 2007 2008
Scor
e
Institutions
Higher education and training
Goods market efficiency
Labor market efficiency
Business sophistication
General improvements over the years (all indicators/pillars)
Higher education and training lagging behind, though improving
Institutions and market efficiency significantly improved

Short and Long-term Policy Reforms for Improving the Competitiveness of
African Economies Short-term reforms:
Keeping markets open to trade Increasing access to finance through market-enabling policies
Long-term reforms: Infrastructure remains one of the top constraints to businesses in Africa
– especially energy and transport (key for value addition; for eff. reg.integ)
Education and Health: higher education and training; improved healthcare systems key for Africa’s productive potential
More examples of effective institutions; good governance and strong and visionary leadership may still be improved.

Botswana, Mauritius, Namibia, and Tunisia
Competitiveness - Case Studies

Botswana, Mauritius, Namibia, and Tunisia in International Comparison
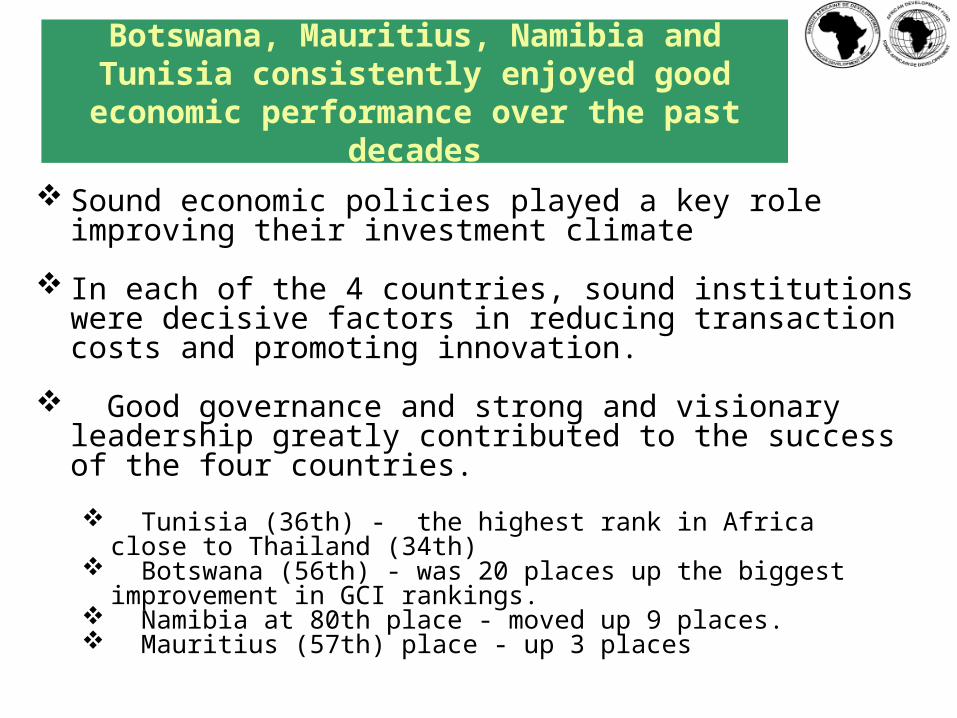
Sound economic policies played a key role improving their investment climate
In each of the 4 countries, sound institutions were decisive factors in reducing transaction costs and promoting innovation.
Good governance and strong and visionary leadership greatly contributed to the success of the four countries.
Tunisia (36th) - the highest rank in Africa close to Thailand (34th) Botswana (56th) - was 20 places up the biggest improvement in GCI
rankings. Namibia at 80th place - moved up 9 places. Mauritius (57th) place - up 3 places
Botswana, Mauritius, Namibia and Tunisia consistently enjoyed good economic performance over the past decades

The four countries all grappled with challenge related to global economic crisis
in the short- and medium-terms
Their growth outlooks deteriorated and macroeconomic balances worsened.
The crisis also underscored the relative vulnerability of
small open economies.
Need for diversification in reinforcing the resilience of economies to external shocks.
Need to improve the investment climate and deepen policy reforms.

The relatively more diversified Tunisia and Mauritius were hit less than the more resource-dependent Botswana and Namibia

Tunisia tops at 36th position
Strengths: Institutions - operate on fairly transparent basis High public trust of politicians (16th) Relatively good infrastructure A well-functioning health and educational system Sound levels of domestic competition (34th) Strong innovative capacity (27th)
Weaknesses: Rigid labor market (ranked 103rd) Macroeconomic management
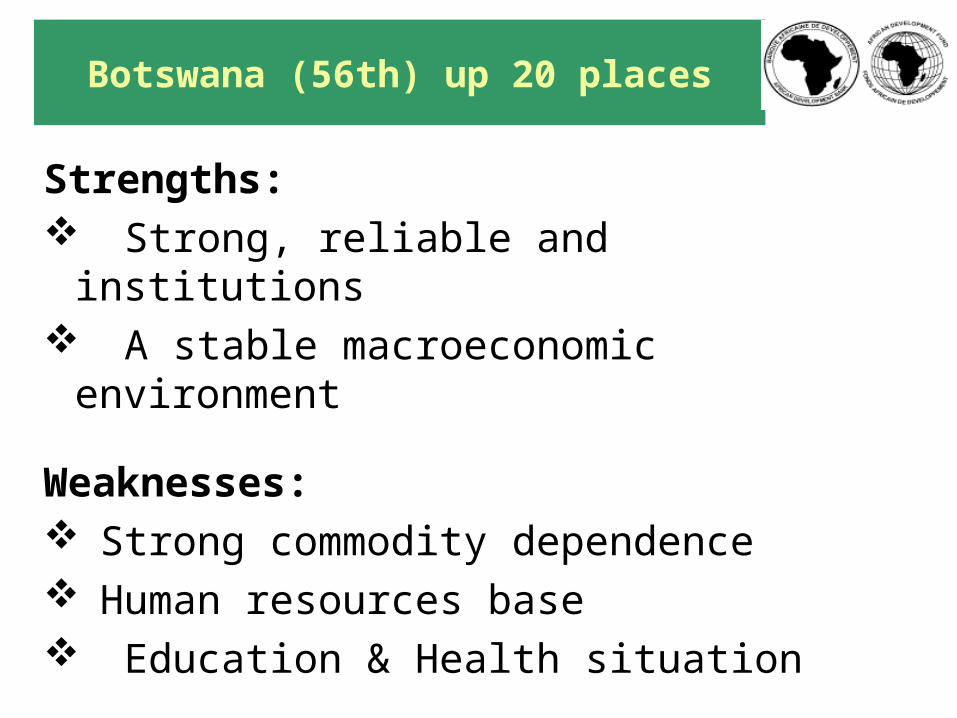
Botswana (56th) up 20 places
Strengths: Strong, reliable and institutions A stable macroeconomic environment
Weaknesses: Strong commodity dependence Human resources base Education & Health situation

Mauritius up 3 places to 57th
Strengths: Strong and transparent public institutions Private institutions are rated as accountable and improving Infrastructure is well developed Goods and financial markets function well - an efficient
allocation of resources
Weaknesses: Labor markets could be made more flexible Some health concerns—particularly the high prevalence of
HIV Improve the macroeconomic environment stability (117th)

Namibia up nine ranks to 80th
Strengths: Quality of the institutional environment (ranked 42nd) Private institutions function well Predictable and stable macroeconomic management Infrastructure, especially the transport, is also excellent (33rd).
Weaknesses: Health and education can still be improved Goods markets suffer from a number of distortions Need to do more to harness new technologies to improve its
productivity levels. Low penetration rates of new technologies - mobile phones
and the Internet.

The Way Forward
Address the diversification of the economies:
New efforts to develop the productive base in a context of a global economic recovery and acute competition from other emerging economies.
Improve their competitiveness position in a number of areas:
The market size in a regional context Improve the employability of the labor factor Deregulate the labor market Facilitate access to bank financing

Source: World Bank Group 2008, www.manypossibilities.net (Steven Song).
SAT3
THE MISSING
LINK
As of March 2009MULTIPLE
SOLUTIONS
AT LEAST ONE LINK
• As of 2009, the East African Coast characterized by a missing link in connectivity;• Connect Africa initiative: goals of connecting Africa capital through broadband links by 2012
(Kigali); and to promote adequate regulatory and policy environment to encourage investment in ICT infrastructure.
• By 2010 the East coast to be connected through fibre optic submarine cables, TEAMS and SEACOM; the West coast by at least 3 fibre optic submarine cables on open access; User prices to decrease by 2010.
Role of the Bank: Some Examples – ICT

Role of the Bank in ICT: Some Examples
• The Bank is playing an important role in encouraging ICT development and adoption in Africa, through lending, technical assistance, policy advice, and knowledge products (research and training on ICT usefulness).
• Examples: – AfDB supports Submarine Fiber Optic Cable for Western Africa (up
to 66 mln USD)
– AfDB supports Science and Technology Skills Development in Rwanda
– AfDB and Microsoft strengthen partnership to increase ICT access in Africa in the fileds of health, education, public administration and governance. Countries targeted include Nigeria, Senegal, Angola and Kenya.
– African Economic Outlook and the African Competitiveness Report (2007) include sections on ICT
– AfDB assessing the potential of concentrated solar power (workshop done)

Role of the Bank in ICT: Some Examples
• Between 1995 and 2005, the Bank invested US$440 million in telecom infrastructure in Africa, and US$120 million in e-applications in the education, health and agriculture sectors.
• Supporting “Connect Africa” goals of connecting Africa capital through broadband links by 2012
• Promoting adequate regulatory and policy environment to encourage investment in ICT infrastructure
• ICT operational strategy developed in 2008 • Short-run – 2 pillars: (i) direct finance of broadband
infrastructure, and (ii) regulatory frameworks• Medium term – stimulating demand for ICT services by
promoting e-government and connectivity to educational facilities