COMPETITIVENESS AND COMPARATIVE ADVANTAGE OF...
14
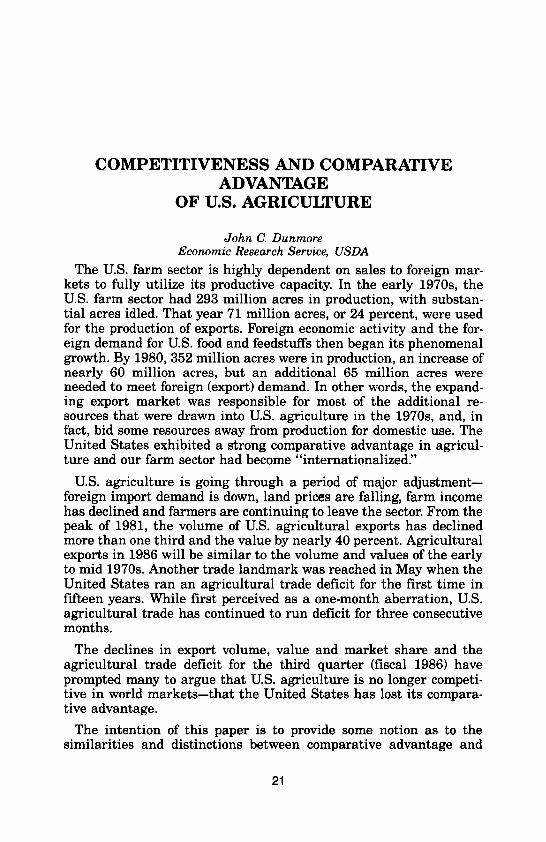
COMPETITIVENESS AND COMPARATIVE ADVANTAGE OF U.S. AGRICULTURE John C. Dunmore Economic Research Service, USDA The U.S. farm sector is highly dependent on sales to foreign mar- kets to fully utilize its productive capacity. In the early 1970s, the U.S. farm sector had 293 million acres in production, with substan- tial acres idled. That year 71 million acres, or 24 percent, were used for the production of exports. Foreign economic activity and the for- eign demand for U.S. food and feedstuffs then began its phenomenal growth. By 1980, 352 million acres were in production, an increase of nearly 60 million acres, but an additional 65 million acres were needed to meet foreign (export) demand. In other words, the expand- ing export market was responsible for most of the additional re- sources that were drawn into U.S. agriculture in the 1970s, and, in fact, bid some resources away from production for domestic use. The United States exhibited a strong comparative advantage in agricul- ture and our farm sector had become "internationalized." U.S. agriculture is going through a period of major adjustment- foreign import demand is down, land prices are falling, farm income has declined and farmers are continuing to leave the sector. From the peak of 1981, the volume of U.S. agricultural exports has declined more than one third and the value by nearly 40 percent. Agricultural exports in 1986 will be similar to the volume and values of the early to mid 1970s. Another trade landmark was reached in May when the United States ran an agricultural trade deficit for the first time in fifteen years. While first perceived as a one-month aberration, U.S. agricultural trade has continued to run deficit for three consecutive months. The declines in export volume, value and market share and the agricultural trade deficit for the third quarter (fiscal 1986) have prompted many to argue that U.S. agriculture is no longer competi- tive in world markets-that the United States has lost its compara- tive advantage. The intention of this paper is to provide some notion as to the similarities and distinctions between comparative advantage and 21
-
Upload
phamkhuong -
Category
Documents
-
view
227 -
download
0
Transcript of COMPETITIVENESS AND COMPARATIVE ADVANTAGE OF...
COMPETITIVENESS AND COMPARATIVEADVANTAGE
OF U.S. AGRICULTURE
John C. DunmoreEconomic Research Service, USDA
The U.S. farm sector is highly dependent on sales to foreign mar-kets to fully utilize its productive capacity. In the early 1970s, theU.S. farm sector had 293 million acres in production, with substan-tial acres idled. That year 71 million acres, or 24 percent, were usedfor the production of exports. Foreign economic activity and the for-eign demand for U.S. food and feedstuffs then began its phenomenalgrowth. By 1980, 352 million acres were in production, an increase ofnearly 60 million acres, but an additional 65 million acres wereneeded to meet foreign (export) demand. In other words, the expand-ing export market was responsible for most of the additional re-sources that were drawn into U.S. agriculture in the 1970s, and, infact, bid some resources away from production for domestic use. TheUnited States exhibited a strong comparative advantage in agricul-ture and our farm sector had become "internationalized."
U.S. agriculture is going through a period of major adjustment-foreign import demand is down, land prices are falling, farm incomehas declined and farmers are continuing to leave the sector. From thepeak of 1981, the volume of U.S. agricultural exports has declinedmore than one third and the value by nearly 40 percent. Agriculturalexports in 1986 will be similar to the volume and values of the earlyto mid 1970s. Another trade landmark was reached in May when theUnited States ran an agricultural trade deficit for the first time infifteen years. While first perceived as a one-month aberration, U.S.agricultural trade has continued to run deficit for three consecutivemonths.
The declines in export volume, value and market share and theagricultural trade deficit for the third quarter (fiscal 1986) haveprompted many to argue that U.S. agriculture is no longer competi-tive in world markets-that the United States has lost its compara-tive advantage.
The intention of this paper is to provide some notion as to thesimilarities and distinctions between comparative advantage and
21
competitiveness; a discussion of measurements of the two concepts;an assessment of the factors most important in determining competi-tive and comparative advantage; and finally, a practical lesson we aspublic policy economists might heed.
Competitiveness and Comparative Advantage-A Definition
Before we can answer the questions concerning the status of ourcompetitive position or our comparative advantage, it is first neces-sary to understand the distinction and similarities of comparativeadvantage and competitiveness. The distinctions between competi-tiveness and comparative advantage may seem trivial on the surfacebut the two concepts are fundamentally different. A country can ex-perience a loss in competitiveness while maintaining its comparativeadvantage. Further, a country can be competitive without having acomparative advantage. However, despite fundamental conceptualdifferences, competitiveness and comparative advantage are inex-tricably linked in the real world conduct of international trade.
The principle of comparative advantage is at the heart of trade the-ory. It is an economic theory soundly based on the concepts of oppor-tunity costs and relative efficiencies with respect to resource use. Theconcept of comparative advantage, as put forward by Ricardo, dealswith whether an economic unit (person, region or nation) has anadvantage in producing a particular good compared to the othergoods that can be produced and compared to the trading opportuni-ties that may be available. Tb illustrate this notion of comparative orrelative efficiencies I borrowed an example from Paarlberg, et al.Consider the simple case of job specialization for two people perform-ing two tasks-gardening and surgery. Assume that the first personis a doctor and an award winning gardener. The second person is amediocre gardener and has no medical training. In this example, thefirst person has an absolute advantage in both tasks since that per-son is a better doctor and a better gardener.
It may be useful here to also emphasize that Ricardo's major contri-bution to trade theory was that comparative advantage and not abso-lute advantage was the basis for trade. Absolute advantage is simplythe concept of being the low cost producer. Debate on U.S. competi-tiveness and comparative advantage in world markets is oftenphrased in terms of whether the United States has lost its position aslow cost producer. While absolute advantage can be an importantcomponent of trade pattern determination, being the low-cost pro-ducer, by itself, is not the necessary nor sufficient condition for deter-mination of the pattern of trade. I'll come back to the cost ofproduction issue later in the paper.
The contribution of the theory of comparative advantage is that itshows that there is a benefit for each person to specialize in one taskand then trade their services, despite the fact that the first person is
22
better at both tasks. Because of the medical training, the first personis relatively more efficient at being a doctor than a gardener. Theopportunity cost (social welfare foregone) of the first person utilizinghis or her time as a gardener rather than a doctor would be quitehigh. Consequently, the first person specializes in being a doctor. Thesecond person, despite a deficiency (absolute disadvantage) in bothtasks, is relatively more efficient at gardening and specializes in thattask. Since the doctor needs a gardener and the gardener needs adoctor they trade services to the benefit of both individuals. Suchexamples of comparative advantage and job specialization aboundand are the basis for much of the economic activity of modern society.People tend to specialize in jobs in which they have a relative orcomparative advantage and hire the services of other people.
This example can be expanded to regions within a country suchthat, given a set of factor (resource) endowments, a region may proveto have a comparative advantage (lower opportunity costs or highercomparative factor productivity) in the production of a certain goodrelative to other goods. The region then specializes in producingthose goods in which it has a comparative advantage and tradingwith other regions for goods in which it has a comparative disadvan-tage.
Extending this notion to the national level, comparative advantageis a statement about international specialization and the trade pat-terns which would arise in an undistorted world based on differencesin relative efficiencies (opportunity costs) between countries in theabsence of trade. Two points are relevant here. First, the concept ofcomparative advantage refers to the comparative cost situation be-fore any trade has occurred. Having determined relative or compara-tive resource costs to produce a mix of goods, a country, when open totrade, will produce and export those goods which it produces rela-tively efficiently and import those goods in which it has a compara-tive disadvantage. Secondly, and perhaps most importantly,comparative advantage must always be defined using prices that arenot distorted by government policies and thus reflect "true" socialopportunity costs. Comparative advantage, then, is a statementabout what trade patterns "ought to be" in an undistorted world.Unfortunately, the world is not free of distortions. Governments'policies-both domestic and trade-tend to alter relative prices. Mar-kets do not always operate efficiently and there are rigidities thatinhibit adjustments to world market conditions.
The concept of competitiveness is still evolving and there is littleprofessional consensus on a precise definition. Competitiveness is dif-ficult to define because it is a less theoretically pure concept thancomparative advantage.
Webster defines competition as, "the effort of two or more partiesacting independently to secure the business of a third party by offer-
23
ing the most favorable terms." Competitiveness, in this sense, is astatement about differences in market prices. While relative pricesamong competitors determine the level of exports and market share,it is what makes goods cheaper in one country versus another that isat the crux of the competitiveness issue.
The types of products produced and the patterns of exchange onworld markets are determined by the joint effects of policies (marketdistortions) and economic efficiency-economic efficiency beingstrongly related to the endowment of factors such as land, labor andcapital, the basis for comparative advantage.
In the short-term, relative prices and competitiveness are influ-enced by policies, exchange rates, and stochastic events such asweather and production levels. Factors which determine comparativeadvantage or economic efficiency-technology, infrastructure, and ba-sic resource endowments-are relatively fixed.
Short-run movements in a country's competitiveness is highly de-pendent on the dynamic factors related to policy changes. In a sense,competitiveness is a policy strategy chosen by a country to achieve aparticular goal. Policies become the crucial determinant of the"terms offered" to a third party in competing for markets in theshort term. For example, an export subsidy can turn a country, whichaccording to comparative advantage should be an importer, into anexporter. On the other hand, domestic policies can affect thedomestic/world price relationship thereby reducing exports of rela-tively efficient countries. Thus, concepts of comparative advantageand competitiveness differ because of the distortions in marketsbrought about by government policies. While comparative advantageis a statement about what trade patterns "ought to be," competitive-ness is a statement about what trade patterns "are."
A different set of effects come into play over the longer run. Domes-tic policies (distortions) can lead to shifts in input/output price rela-tionships. Also, production and marketing techniques can be alteredby investment in the sector, such as land-clearing and irrigation.Relative economic efficiencies and the comparative advantage of thecountry can be altered. Competitiveness becomes a function of tradepolicies plus the development strategies (policies) that influence thedynamics of comparative advantage.
Over the longer term, the distortions introduced by a particularnation influence the rate of technological adoption, investment andrates of growth in productivity and productive capacity. A statementby Krueger is particularly relevant here: "Trade policy affects thecourse of economic development far more profoundly than our naiveinterpretation of the theory of comparative advantage would sug-gest." Thus, while the theoretical concepts of competitiveness andcomparative advantage are not linked because of distortions, it is in
24
understanding how and why countries implement distorting policiesas well as the ability to measure their dynamic effects on productionand trade, that links competitiveness and comparative advantage inthe dynamic "real world" of international trade.
In summary, comparative advantage is an economically pure con-cept that must assume the world is free of distortions. That economi-cally pure concept relates factor endowments and factor prices to theoutput mix and trade patterns of a particular country on a basis ofopportunity costs and relative efficiencies. Competitiveness, however,is the "real world" or the relaxation of the assumption that "theworld is free of distortion" which is associated with comparative ad-vantage. Competitiveness is, in a sense, a strategy initiated by anation to achieve some particular goal-a strategy or distortion em-ployed to offset some natural or pure comparative disadvantage. Overtime the use of certain domestic policies or strategies may serve toalter factor endowments and factor prices and, therefore, the compar-ative advantage of a particular country. Thus, the longer run dy-namic aspects of comparative advantage and competitiveness arehighly similar.
Measuring Competitiveness and Comparative Advantage
Comparative Advantage
The recent declines in export value, volume and market share aresometimes cited as evidence of a loss of U.S. agriculture's compara-tive advantage. While those measures may serve as indicators ofcompetitiveness-trade patterns "as they are"-they provide little in-sight into comparative advantage.
A theoretically pure definition of comparative advantage is readilyprovided in any economic text. But, perhaps because it is so theoreti-cally pure, comparative advantage is difficult to measure in a realworld context.
Relative Cost of Production. One reason given for the loss in U.S.agricultural comparative advantage is that costs of production foragricultural commodities in the United States are higher than costsoverseas. Chenery indicates that a country has a comparative advan-tage in exporting a commodity if the value of all factors used-intheir best alternative employment-in producing the commodity isless than the commodity's export price. The Domestic Resource Cost(DRC) approach allows measures of comparative advantage (relativeeconomic efficiency) among economic activities within a country andbetween different countries. International domestic resource cost-of-production data comparisons are especially difficult, however. Formany countries, data are generally unavailable, and what data do
25
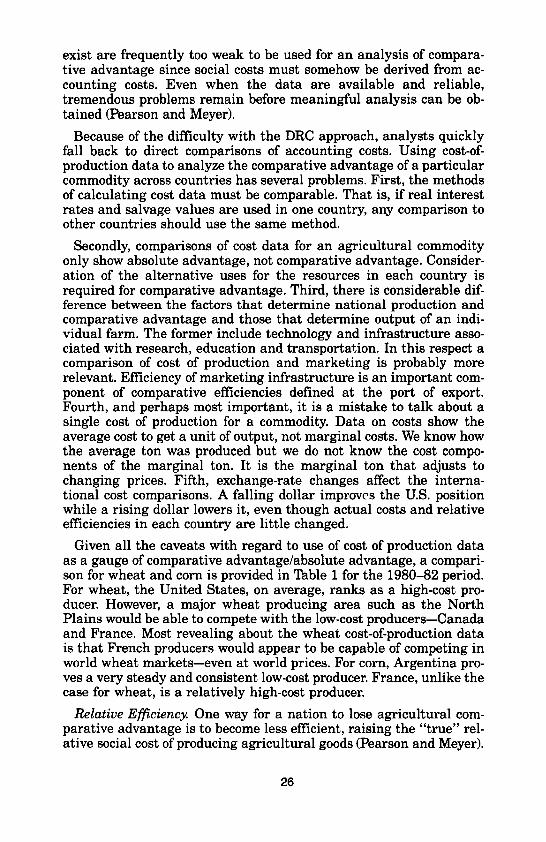
exist are frequently too weak to be used for an analysis of compara-tive advantage since social costs must somehow be derived from ac-counting costs. Even when the data are available and reliable,tremendous problems remain before meaningful analysis can be ob-tained (Pearson and Meyer).
Because of the difficulty with the DRC approach, analysts quicklyfall back to direct comparisons of accounting costs. Using cost-of-production data to analyze the comparative advantage of a particularcommodity across countries has several problems. First, the methodsof calculating cost data must be comparable. That is, if real interestrates and salvage values are used in one country, any comparison toother countries should use the same method.
Secondly, comparisons of cost data for an agricultural commodityonly show absolute advantage, not comparative advantage. Consider-ation of the alternative uses for the resources in each country isrequired for comparative advantage. Third, there is considerable dif-ference between the factors that determine national production andcomparative advantage and those that determine output of an indi-vidual farm. The former include technology and infrastructure asso-ciated with research, education and transportation. In this respect acomparison of cost of production and marketing is probably morerelevant. Efficiency of marketing infrastructure is an important com-ponent of comparative efficiencies defined at the port of export.Fourth, and perhaps most important, it is a mistake to talk about asingle cost of production for a commodity. Data on costs show theaverage cost to get a unit of output, not marginal costs. We know howthe average ton was produced but we do not know the cost compo-nents of the marginal ton. It is the marginal ton that adjusts tochanging prices. Fifth, exchange-rate changes affect the interna-tional cost comparisons. A falling dollar improves the U.S. positionwhile a rising dollar lowers it, even though actual costs and relativeefficiencies in each country are little changed.
Given all the caveats with regard to use of cost of production dataas a gauge of comparative advantage/absolute advantage, a compari-son for wheat and corn is provided in Table 1 for the 1980-82 period.For wheat, the United States, on average, ranks as a high-cost pro-ducer. However, a major wheat producing area such as the NorthPlains would be able to compete with the low-cost producers-Canadaand France. Most revealing about the wheat cost-of-production datais that French producers would appear to be capable of competing inworld wheat markets-even at world prices. For corn, Argentina pro-ves a very steady and consistent low-cost producer. France, unlike thecase for wheat, is a relatively high-cost producer.
Relative Efficiency. One way for a nation to lose agricultural com-parative advantage is to become less efficient, raising the "true" rel-ative social cost of producing agricultural goods (Pearson and Meyer).
26
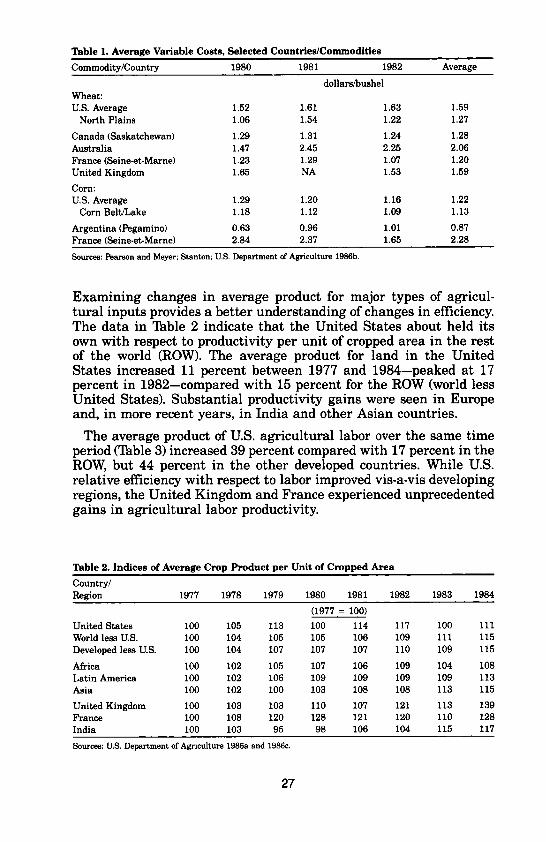
Table 1. Average Variable Costs, Selected Countries/Commodities
Commodity/Country 1980 1981 1982 Average
dollars/bushelWheat:U.S. Average 1.52 1.61 1.63 1.59
North Plains 1.06 1.54 1.22 1.27
Canada (Saskatchewan) 1.29 1.31 1.24 1.28Australia 1.47 2.45 2.25 2.06France (Seine-et-Marne) 1.23 1.29 1.07 1.20United Kingdom 1.65 NA 1.53 1.59
Corn:U.S. Average 1.29 1.20 1.16 1.22
Corn Belt/Lake 1.18 1.12 1.09 1.13
Argentina (Pegamino) 0.63 0.96 1.01 0.87France (Seine-et-Marne) 2.84 2.37 1.65 2.28
Sources: Pearson and Meyer; Stanton; U.S. Department of Agriculture 1986b.
Examining changes in average product for major types of agricul-tural inputs provides a better understanding of changes in efficiency.The data in Table 2 indicate that the United States about held itsown with respect to productivity per unit of cropped area in the restof the world (ROW). The average product for land in the UnitedStates increased 11 percent between 1977 and 1984-peaked at 17percent in 1982-compared with 15 percent for the ROW (world lessUnited States). Substantial productivity gains were seen in Europeand, in more recent years, in India and other Asian countries.
The average product of U.S. agricultural labor over the same timeperiod (Table 3) increased 39 percent compared with 17 percent in theROW, but 44 percent in the other developed countries. While U.S.relative efficiency with respect to labor improved vis-a-vis developingregions, the United Kingdom and France experienced unprecedentedgains in agricultural labor productivity.
Table 2. Indices of Average Crop Product per Unit of Cropped Area
Country/Region 1977 1978 1979 1980 1981 1982 1983 1984
(1977 = 100)United States 100 105 113 100 114 117 100 111World less U.S. 100 104 105 105 106 109 111 115Developed less U.S. 100 104 107 107 107 110 109 115
Africa 100 102 105 107 106 109 104 108Latin America 100 102 106 109 109 109 109 113Asia 100 102 100 103 108 108 113 115
United Kingdom 100 103 103 110 107 121 113 139France 100 108 120 128 121 120 110 128India 100 103 95 98 106 104 115 117
Sources: U.S. Department of Agriculture 1986a and 1986c.
27
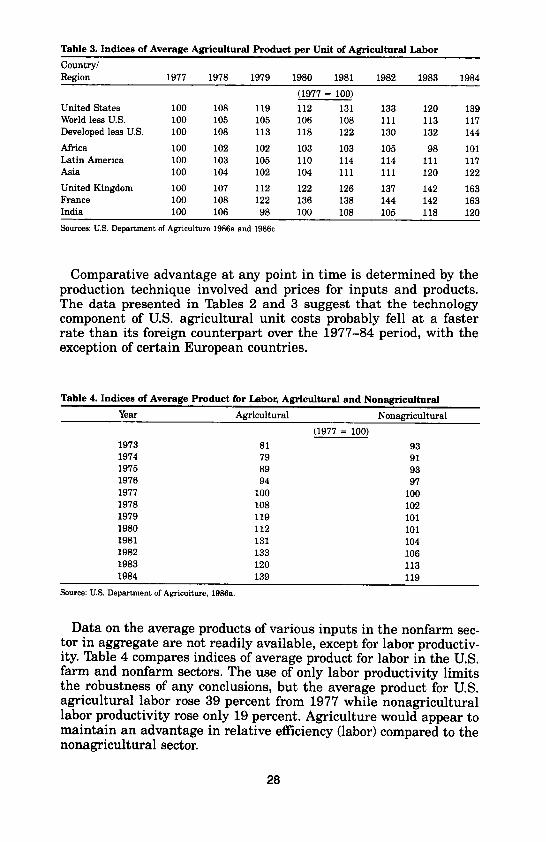
Table 3. Indices of Average Agricultural Product per Unit of Agricultural LaborCountry/Region 1977 1978 1979 1980 1981 1982 1983 1984
(1977 = 100)United States 100 108 119 112 131 133 120 139World less U.S. 100 105 105 106 108 111 113 117Developed less U.S. 100 108 113 118 122 130 132 144
Africa 100 102 102 103 103 105 98 101Latin America 100 103 105 110 114 114 111 117Asia 100 104 102 104 111 111 120 122United Kingdom 100 107 112 122 126 137 142 163France 100 108 122 136 138 144 142 163India 100 106 98 100 108 105 118 120Sources: U.S. Department of Agriculture 1986a and 1986c.
Comparative advantage at any point in time is determined by theproduction technique involved and prices for inputs and products.The data presented in Tables 2 and 3 suggest that the technologycomponent of U.S. agricultural unit costs probably fell at a fasterrate than its foreign counterpart over the 1977-84 period, with theexception of certain European countries.
Table 4. Indices of Average Product for Labor, Agricultural and Nonagricultural
Year Agricultural Nonagricultural
(1977 = 100)1973 81 931974 79 911975 89 931976 94 971977 100 1001978 108 1021979 119 1011980 112 1011981 131 1041982 133 1061983 120 1131984 139 119
Source: U.S. Department of Agriculture, 1986a.
Data on the average products of various inputs in the nonfarm sec-tor in aggregate are not readily available, except for labor productiv-ity. Table 4 compares indices of average product for labor in the U.S.farm and nonfarm sectors. The use of only labor productivity limitsthe robustness of any conclusions, but the average product for U.S.agricultural labor rose 39 percent from 1977 while nonagriculturallabor productivity rose only 19 percent. Agriculture would appear tomaintain an advantage in relative efficiency (labor) compared to thenonagricultural sector.
28
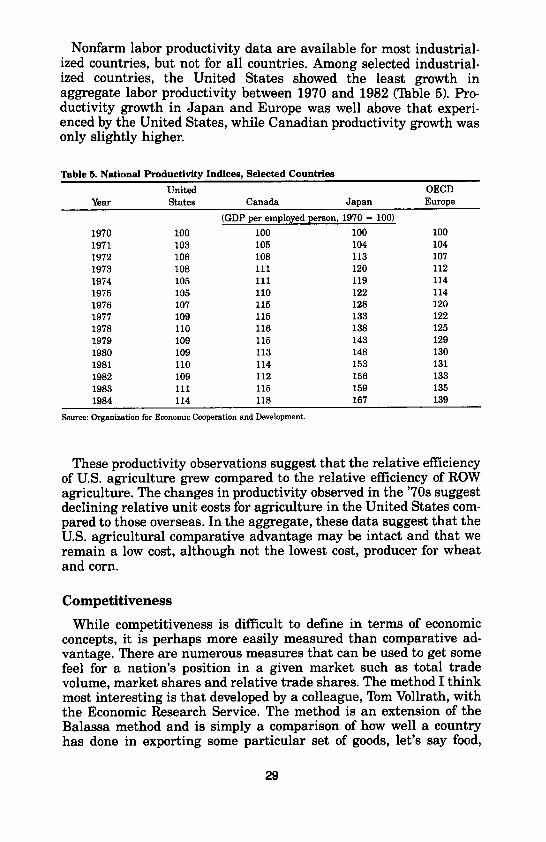
Nonfarm labor productivity data are available for most industrial-ized countries, but not for all countries. Among selected industrial-ized countries, the United States showed the least growth inaggregate labor productivity between 1970 and 1982 (Table 5). Pro-ductivity growth in Japan and Europe was well above that experi-enced by the United States, while Canadian productivity growth wasonly slightly higher.
Table 5. National Productivity Indices, Selected Countries
United OECDYear States Canada Japan Europe
(GDP per employed person, 1970 = 100)
1970 100 100 100 1001971 103 105 104 1041972 106 108 113 1071973 108 111 120 1121974 105 111 119 1141975 105 110 122 1141976 107 115 128 1201977 109 115 133 1221978 110 116 138 1251979 109 115 143 1291980 109 113 148 1301981 110 114 153 1311982 109 112 156 1331983 111 115 159 1351984 114 118 167 139
Source: Organization for Economic Cooperation and Development.
These productivity observations suggest that the relative efficiencyof U.S. agriculture grew compared to the relative efficiency of ROWagriculture. The changes in productivity observed in the '70s suggestdeclining relative unit costs for agriculture in the United States com-pared to those overseas. In the aggregate, these data suggest that theU.S. agricultural comparative advantage may be intact and that weremain a low cost, although not the lowest cost, producer for wheatand corn.
Competitiveness
While competitiveness is difficult to define in terms of economicconcepts, it is perhaps more easily measured than comparative ad-vantage. There are numerous measures that can be used to get somefeel for a nation's position in a given market such as total tradevolume, market shares and relative trade shares. The method I thinkmost interesting is that developed by a colleague, Tom Vollrath, withthe Economic Research Service. The method is an extension of theBalassa method and is simply a comparison of how well a countryhas done in exporting some particular set of goods, let's say food,
29
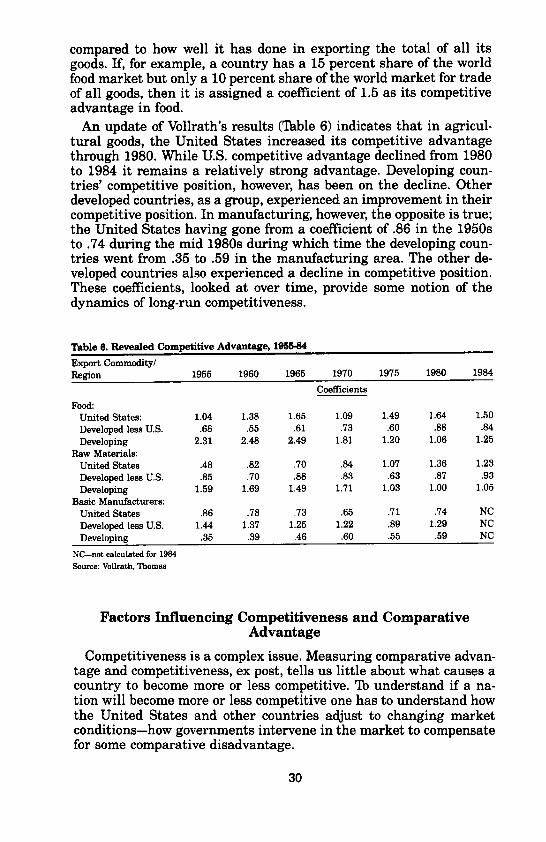
compared to how well it has done in exporting the total of all itsgoods. If, for example, a country has a 15 percent share of the worldfood market but only a 10 percent share of the world market for tradeof all goods, then it is assigned a coefficient of 1.5 as its competitiveadvantage in food.
An update of Vollrath's results (Table 6) indicates that in agricul-tural goods, the United States increased its competitive advantagethrough 1980. While U.S. competitive advantage declined from 1980to 1984 it remains a relatively strong advantage. Developing coun-tries' competitive position, however, has been on the decline. Otherdeveloped countries, as a group, experienced an improvement in theircompetitive position. In manufacturing, however, the opposite is true;the United States having gone from a coefficient of .86 in the 1950sto .74 during the mid 1980s during which time the developing coun-tries went from .35 to .59 in the manufacturing area. The other de-veloped countries also experienced a decline in competitive position.These coefficients, looked at over time, provide some notion of thedynamics of long-run competitiveness.
Table 6. Revealed Competitive Advantage, 1955-84
Export Commodity/Region 1955 1960 1965 1970 1975 1980 1984
Coefficients
Food:United States: 1.04 1.38 1.65 1.09 1.49 1.64 1.50Developed less U.S. .68 .55 .61 .73 .60 .88 .84Developing 2.31 2.48 2.49 1.81 1.20 1.06 1.25
Raw Materials:United States .48 .82 .70 .84 1.07 1.36 1.23Developed less U.S. .85 .70 .88 .83 .63 .87 .93Developing 1.59 1.69 1.49 1.71 1.03 1.00 1.05
Basic Manufacturers:United States .86 .78 .73 .65 .71 .74 NCDeveloped less U.S. 1.44 1.37 1.25 1.22 .89 1.29 NCDeveloping .35 .39 .46 .60 .55 .59 NC
NC-not calculated for 1984Source: Vollrath, Thomas
Factors Influencing Competitiveness and ComparativeAdvantage
Competitiveness is a complex issue. Measuring comparative advan-tage and competitiveness, ex post, tells us little about what causes acountry to become more or less competitive. To understand if a na-tion will become more or less competitive one has to understand howthe United States and other countries adjust to changing marketconditions-how governments intervene in the market to compensatefor some comparative disadvantage.
30
Government policies are more important and pervasive than natu-ral endowments in determining competitiveness and comparative ad-vantage. The critical component in the short run is the policy factorswhich often completely outweigh any comparative disadvantage onthe basis of relative economic efficiencies. Policy factors are impor-tant in the longer term as well. They become the source of the "dy-namics" of comparative advantage.
There are a number of policy factors that influence competitivenessand future comparative advantage for U.S. agriculture. The threemost important policy areas are: domestic macroeconomic policies;domestic farm policies; and foreign trade and agricultural policies.
U.S. Macroeconomic Policies
Fiscal and monetary policies affect both the short-run competitiveposition of U.S. agriculture and its long-run comparative advantage.The effects of monetary and fiscal policies on the agricultural sectorare numerous. Two major macroeconomic linkage variables to thesector-interest rates and exchange rates-were chosen to highlightthe differing effects on competitiveness and comparative advantage.
Exchange Rates. Movement of the exchange rate can affect the com-petitive position of U.S. agriculture in three different dimensions(Dunmore). First, because agricultural products are generally de-nominated and traded in dollars, an appreciation of the dollar causesprices in an importer's currency to increase and therefore causes im-port demand to fall. There is a short lag time associated with thisimpact and it basically affects the U.S. competitive position vis-a-visimporting countries.
Secondly, there is a more immediate substitution effect dimensionto an exchange rate change. Again, because goods are traded in dol-lars, an appreciation of the dollar causes prices (returns) to competi-tors to increase in terms of their currencies. This "windfall" gainallows competitors to underbid U.S. dollar prices and yet increaseexport revenues in terms of their national currencies. These two di-mensions of an exchange rate change tend to affect the competitiveposition of the United States in the short term by (1) altering relativemarket prices faced by importers and (2) altering relative marketprices between the United States and competitors. But, resourcesand technology are relatively fixed so comparative advantage on thebasis of existing resource endowments has not been altered.
The third dimension of the exchange rate effect is longer term andmore dynamic in nature. Continued appreciation of the dollar in theearly 1980s, for example, provided a stimulus-either directly orthrough government programs-for competitors to alter the level andrate of investment in their agricultural sectors thus changing futuretechnology, productivity and productive capacity. Once productive ca-
31
pacity has been added and technology upgraded, it is, to some extent,a "sunk cost" and capacity will not leave the sector at the samespeed at which it was added. This third dimension effect of an ex-change rate movement has the potential to alter long-run competi-tiveness and comparative advantage of the United States vis-a-viscompetitors.
Interest Rates. Another macroeconomic policy influence stems frommovements in interest rates. While interest rates may not have avery direct short-term impact on the competitive position of U.S. ag-riculture versus the agricultural sector of other countries, they dohave a longer-term effect on competitiveness and comparative advan-tage. The interest rate effect over the longer term is similar to thethird dimension exchange rate effect. Interest rates affect the cost ofcapital for replacement or expansion. A sustained change in interestrates could influence the rate of growth in investment and productivecapacity leading to an altered factor endowment and comparativeadvantage over the longer term.
Tax Policy. Fiscal policies such as tax policy can influence theshort-term competitive position of a sector-through the budgetdeficit/exchange rate linkage. However, the tax policy can also influ-ence agricultural investment and alter the mix of resource use. Taxpolicy has caused agriculture to be more capital intensive than itwould otherwise be. Recent work in the Economic Research Serviceestimated that up to 20 percent of net investment in agriculturalequipment during the 1960s and 1970s can be attributed to tax pol-icy (Hrubovcak and Le Blanc). Tax induced investment led to expan-sion of productive capacity and productivity which altered (enhanced)the U.S. long-term comparative advantage-the comparative advan-tage we apparently still maintain vis-a-vis other countries.
U.S. Domestic (Farm) Policies
Much like macroeconomic policies, U.S. farm programs-price sup-port and deficiency payment programs-have short- and longer-runimpacts on competitiveness and comparative advantage. In the shortrun, inflexible domestic farm programs (loan and target prices) makeit impossible for U.S. prices to adjust to world market conditions andthe United States becomes less competitive. When prices cannot ad-just, quantities will. The adjustment in export quantities over the1980s led to a substantial deterioration in our market share andcompetitive position in those commodity markets.
When stocks became excessive in the early 1980s, acreage reduc-tion programs were implemented unilaterally by the United States.Thus, the United States reduced the risk of downward movement inworld prices and bore the burden of stock/production adjustment atno cost to producers or taxpayers in other countries. These high
32
world price floors provided an added incentive for other exporters andimporting countries to expand productivity and productive capacity.
Our system of deficiency payments, while seen as an income sup-plement allowing many producers to remain on the farm, may havelonger-term implications for competitiveness and comparative advan-tage of U.S. agriculture. Substantial income transfers to producersvia the deficiency payment and other farm programs-$20 to $25billion in 1986-augers to keep land values and land rents artifi-cially high. That begs the question-to what extent might our longer-term comparative advantage be eroded if the price of a major input(land) is kept from adjusting to its true economic value?
The Impact of Foreign Trade Policies
The policies of other countries and their conduct of trade has alsoaffected our competitive stance in world markets. Competitors usepricing and export marketing policies that affect their competitivepositions and to offset some comparative disadvantage relative to theUnited States. The United States, however, has implemented newexport marketing policies designed to offset a competitive disadvan-tage.
Among competitors, the policies of the European Community (EC)have had a significant impact on U.S. competitiveness and, perhaps,comparative advantage. High price supports and export subsidieshave greatly enhanced the competitive position of the EC, changingit from an importer to an exporter.
The high price supports provided strong incentives for investing inthe agricultural sector and for adoption of new, yield-enhancing tech-nologies. Some would argue that these policies have now providedFrance and perhaps the United Kingdom with a comparative advan-tage in the production and marketing of wheat. While a great deal ofour handwringing over EC policy centers on the more immediateimpact of subsidies on the competitive position of the United Statesin world markets, those same policies, over time, have altered thecomparative advantage of the EC.
There are other examples of foreign domestic and trade policiesthat distort free market conditions and alter both short-term compet-itiveness and longer-run comparative advantage in the productionand marketing of agricultural products. Saudi Arabia-this yearlikely to be the largest Middle East exporter of wheat-is a glaringexample. Government policies influence its short-run competitive-ness (Saudi Arabia is marketing wheat to other North Africa/MiddleEast countries at subsidies of up to $400 per ton) and its longer-termcomparative advantage (substantial government investment in landreclamation and irrigation has improved relative economic efficien-cies).
33
Conclusion
In closing, there are a few general observations and one practicallesson that I think are important to take away from this discussion.First, has the United States lost its comparative advantage in agri-culture? No, but it does not have as strong an advantage as it had inthe late 1970s. Second, is the United States competitive in worldagricultural markets? Yes, but not as competitive as it was in theearly 1980s. Third, policy factors are more important than basic re-source endowments in determining comparative and competitive ad-vantage.
Numerous research studies have identified the factors responsiblefor the loss of our competitive position. This list of factors includes:foreign production, global economic activity, third world debt, highvalue of the U.S. dollar, foreign agricultural policies and U.S. farmpolicies. The many studies have contributed to an increased under-standing of the importance of these factors on our short-run competi-tive position. Too few studies, however, have considered thelonger-run dynamic influences on comparative advantage and long-term competitiveness. As public policy educators we need to increasethe level of general understanding of the long-run consequences offoreign and domestic policies on the allocation of resources and thedynamics of comparative advantage.
REFERENCESChenery, H.B. "Comparative Advantage and Development Policy." Amer Econ Reu 51 (1961): 18-51.Dunmore, John C. "Economic Policy and U.S. Agriculture's Competitive Position." Paper presented at Federal
Reserve Bank of Cleveland (OH), 24 May 1985.Hrubovcak, James, and Michael Le Blanc. Tax Policy and Agricultural Investment Washington DC: USDA ERS
Tech. Bull. 1699, June 1985.Krueger, Anne O. "Trade Policy as an Input to Development: Monetary and Agricultural Implications." A paper
presented at the International Agricultural Trade Consortium, Tucson AZ, 15-17 Dec. 1980.Organization for Economic Cooperation and Development (OECD). Economic Outlook.. Paris, various issues 1983-
86.Paarlberg, Philip L., Alan J. Webb, John C. Dunmore, and J. Larry Deaton. "The U.S. Competitive Position in
World Commodity Trade." Agricultural Food Policy Review: Commodity Program Perspectives. Washington DC:USDA ERS, July 1985, pp. 93-121.
Pearson, Scott R., and Ronald K. Meyer. "Comparative Advantage Among African Coffee Producers." Amer J. AgrEcon. 53 (1974): 310-313.
Stanton, B.F. Production Costs for Cereals in the European Community: Comparisons with the United States, 1977-1984. Dept. Agr. Econ. AE Res. 86-2, Cornell University, Ithaca NY, March 1986.
U.S. Department of Agriculture. Economic Indicators of Farm Efficiency. Washington DC: ECIFS-4-4, 1984, Feb.1986a.
.Economic Indicators of the Farm Sector: Cost of Production, 1985. Washington DC, 1986b.
.World Indices of Agricultural and Food Production, 1965-1985. Washington DC: ERS, July 1986c.Vollrath, Thomas. Dynamics of Comparative Advantage and the Resistance to Free Trade. Washington DC: USDA
ERS For. Agr. Econ. Rep. 214, Aug. 1985.
34