COMPETITIVE EMPLOYMENT OUTCOMES AMONG RACIAL AND …
113
The Pennsylvania State University The Graduate School College of Education COMPETITIVE EMPLOYMENT OUTCOMES AMONG RACIAL AND ETHNIC GROUPS WITH CRIMINAL HISTORIES & MENTAL IMPAIRMENT A Dissertation in Counselor Education by Jason Elliott Gines © 2013 Jason E. Gines Submitted in Partial Fulfillment of the requirements for the Degree of Doctor of Philosophy December 2013
Transcript of COMPETITIVE EMPLOYMENT OUTCOMES AMONG RACIAL AND …
The Pennsylvania State University
The Graduate School
College of Education
COMPETITIVE EMPLOYMENT OUTCOMES AMONG RACIAL AND ETHNIC
GROUPS WITH CRIMINAL HISTORIES & MENTAL IMPAIRMENT
A Dissertation in
Counselor Education
by
Jason Elliott Gines
© 2013 Jason E. Gines
Submitted in Partial Fulfillment of the requirements for the Degree of
Doctor of Philosophy
December 2013

ii
The dissertation of Jason E. Gines was reviewed and approved* by the following: Brandon Hunt Professor of Counselor Education Dissertation Co-adviser Co-chair of Committee Spencer G. Niles Professor of Counselor Education Dissertation Co-adviser Co-chair of Committee Jerry Trusty Professor of Counselor Education Edgar P. Yoder Professor of Agricultural Education Richard Hazler Professor of Counselor Education Program Chair, Counselor Education *Signatures are on file in the Graduate School.

iii
Abstract
This study investigated vocational rehabilitation (VR) outcomes among people with criminal
histories with mental impairments who were served in a state-federal VR agency during
fiscal year 2010 as extracted from the Rehabilitation Services Administration (RSA) 911
national database. Using hierarchical logistic analysis, this study examined predictors of
successful competitive employment outcomes based on consumer demographic information
and services received. Gender, age, and race/ethnicity, diagnosis and treatment, and job
placement assistance were positive predictors of VR outcomes, while receiving job readiness
assistance was found to be a negative predictor. Chi-square tests of independence revealed
statistically significant differences between race/ethnicity and closure type, types of services,
and unsuccessful closure reasons. Implications for rehabilitation counselors and future
research are discussed.
iv
Table of Contents
List of Tables ........................................................................................................................... vi
Acknowledgments .................................................................................................................. vii
Chapter 1: Introduction ............................................................................................................. 1
Statement of the Problem ...................................................................................................... 2 Purpose of Study ................................................................................................................... 4 Current Demographics of the United States ......................................................................... 5 Theoretical Framework ......................................................................................................... 6 Limitations ............................................................................................................................ 9 Definition of Terms ............................................................................................................. 10 Summary ............................................................................................................................. 11
Chapter 2: Review of the Literature ....................................................................................... 12
Variables for Successful Outcomes .................................................................................... 13 Demographic Variables: Age, Education, Race ................................................................ 14 Outcomes and Acceptance Rates within the VR System .................................................... 19 Outcomes and the VR System ............................................................................................ 22 Summary of Outcomes and the VR System ....................................................................... 26 Acceptance Rates and the VR System ................................................................................ 28 Summary of Acceptance Rates and the VR System ........................................................... 32 Summary ............................................................................................................................. 34
Chapter 3: Methodology ........................................................................................................ 36
Research Questions ............................................................................................................. 36 Research Design .................................................................................................................. 36 Population ........................................................................................................................... 37 Power Analysis ................................................................................................................... 37 Dependent Variables ........................................................................................................... 39 Block One Variables (Logistic Regression for Employment Outcomes) ........................... 40 Block Two Variables .......................................................................................................... 42 Data Analysis ...................................................................................................................... 43
Chapter 4: Results ................................................................................................................... 44
Descriptive Statistics for the Population ............................................................................. 44 Descriptive Statistics for the Independent Variables .......................................................... 46 Research Questions ............................................................................................................. 47 Research Question One: Employment Outcome by Race/Ethnicity ................................... 47 Research Question Two: Types of Services by Race/Ethnicity .......................................... 49 Research Question Three: Reasons for Closure by Race/Ethnicity .................................... 54

v
Research Question Four: Predictors for Employment Outcomes ....................................... 58 Summary of Findings .......................................................................................................... 60
Chapter 5: Discussion ............................................................................................................ 74
Summary of Descriptive Statistics ...................................................................................... 74 Research Question One ....................................................................................................... 75 Research Question Two ...................................................................................................... 77 Research Question Three .................................................................................................... 80 Research Question Four ...................................................................................................... 81 Limitations .......................................................................................................................... 85 Implications for Rehabilitation Counselors ........................................................................ 86 Implications for Future Research ........................................................................................ 87
References ............................................................................................................................... 91

vi
List of Tables
Table 1: Top States of Application for Services ...............…………………………….........62
Table 2: Race/Ethnicity……………………………………………………………….......…63
Table 3: Highest Education Level at Application.…………………………………..……....64
Table 4: Type of Closure…………………………………....……........................................65
Table 5: Reasons for Closure……….……………………………………………………….66
Table 6: Cross-Tabulation of Race/Ethnicity by Type of Closure……….…………………67
Table 7: Selected VR Services Provided by Race/Ethnicity..………………………………68
Table 8: Cross-tabulation of Race/Ethnicity by Reason for Closure……..................………70
Table 9: Hierarchical Logistic Regression Predicting Employment Outcomes ……...........72
Table 10: Research Questions, Statistical Tests, and Outcome…………...………………...73

vii
Acknowledgments
I would like to express the deepest appreciations to my committee members, former
and present, who were so patient with me. This journey has truly been a testament to the
faithful dedication of everyone who had a hand in my entire doctoral process. In the midst of
my dissertation journey, two committee members have gone on to Dean positions at other
universities. Dr. Wilson, who embodies the of kind professor I would like to be,
provided support and instilled mental toughness in what would be required to see the
dissertation through to the end. Dr. Niles inspired me to strongly consider this dissertation
research as a precursor to future projects that would set me on a successful path in the
academy. Without his consistent admonitions to keep the faith, the journey would have been
infinitely more difficult. Dr. Hunt gave direction when it was most needed. Her expertise and
advice on editing and formatting throughout the process kept me focused on this study. Dr.
Trusty provided the technical expertise needed to answer the most important question in this
study. I truly appreciate his willingness to work with me and share his vast knowledge on
logistic regression. Dr. Yoder sacrificed his time and energy to help me understand statistics
in a relatable and relevant way. I am truly indebted to him for his straightforward and honest
communication throughout this process.
I owe much of my desire to work with offenders to Dr. Greg Gaertner, who was
integral in showing me that serving ex-offenders was worthy of dedicating the better part of
the last four years of my life. Also, I am grateful to those in my doctoral cohort, Ritz, Mike,
and Hyoyeon who provided consistent encouragement as I completed my dissertation
journey. I want to thank Chris Andrus for her unwavering support and help in the completion
of my graduate education.

viii
Dr. Bobby E. Gines and Brenda J. Gines, thanks for birthing me into this world and
setting me on a path of purpose and leadership by telling me everyday of my childhood to
“set the tone and be the example.” Your collective sacrifice for my advancement can never
be quantified, and for that I am forever grateful. Finally, I express my deepest appreciation to
my partner and best friend Dr. Kathryn Gines, whose immeasurable love and support
inspired me to finish strong. It is my sincerest desire that this dissertation is an inspiration to
my four children: Jason Elliott Gines II, Kyra Simone Gines, Jaden Justice Gines, and Kalia
Sanaa Gines. I have come to understand that anything is possible with the love and support of
family and friends. Selah!
Chapter 1: Introduction
The United States currently has over 8 million citizens under correctional supervision
in local, state, and federal institutions. The number of individuals in state institutions is
rapidly approaching 3 million with sentences ranging from 12 months to life. Further
statistics reveal the impact of the criminal justice system on mainstream America. For
example, 1 in 31 adults in the United States is under correctional supervision. In contrast, the
rate of African-American men incarcerated and under correctional supervision in the United
States is 1 in 11 (National Conference of State Legislatures [NCSL], 2009). The economic
commitment to incarcerations in the United States is $60 to $70 billion per year. The fiscal
range to house an inmate in state correctional institutions is about $27,000 to $45,000
(Western, 2007). Recent studies on recidivism statistics in the United States place inmates
released from prison, either by maxing out their sentence or on parole, at 67% (NCSL, 2009).
According to data collected by The Substance Abuse and Mental Health Services
Administration (SAMHSA), nearly 45 million people aged 18 or older, which accounts for
20% of the adult population, have experienced a mental illness in the past year (National
Survey on Drug Use and Health [NSDUH], 2012). According to the National Institute of
Mental Health (NIMH, 2013), percentages of mental illness among various races and
ethnicities in the United States are as follows: White 5%, Black 3%, Hispanic/Latino 4%,
Asian 2%, American Indian/Alaska Native 4%, and Multi-race 6%. In addition, the lifetime
prevalence statistics suggest that Non-Hispanic Blacks are 30% less likely than their Non-
Hispanic White counterparts to experience a mental illness (NIMH, 2013). In similar lifetime
prevalence statistics, men and women are equally as likely to experience a mental illness.
Mental illness in the United States is a major public health concern, ranking as one of the
2
most prevalent disabilities (NSDUH, 2012).
On an annual basis, mental illness in the United States affects nearly a quarter of the
population (NSDUH, 2012). A national trend over the past 50 years has been the closure of
mental health facilities and the subsequent incarceration of people with mental illness
(Masters, 2004). Correctional institutions have come to be known as the new asylums for
people with mental illness. According to two surveys of inmates in state and federal
correctional facilities and local jails, 56% of state prison inmates, 45% of federal prison
inmates, and 64% of local jail inmates have mental illness (NIMH, 2013). An overwhelming
number of the nation’s incarcerated has a mental illness, and this trend is reflected in the
number of applicants to state-federal vocational rehabilitation (VR) services. Nearly 85% of
applicants for VR services originating from correctional facilities have some form of mental
impairment, including mental illness. The RSA 911 codebook defines mental impairment as
cognitive impairment, psychosocial impairment, and other mental impairments, not specified.
The dual presence of mental impairment and a criminal history present unique barriers to
competitive employment.
Statement of the Problem
The unemployment and underemployment of ex-offenders returning to communities
from correctional institutions is rapidly becoming a national issue that can no longer be
ignored in the United States. Approximately 650,000 inmates are released from state and
federal prisons each year (Visher, Winterfield, & Coggeshall, 2005). Within the last decade,
it has been reported that the unemployment rate of ex-offenders is approximately 33%,
compared to roughly 8% in the general population (Petersilia, 2003). In a recent report on ex-
offenders in the labor market, Schmitt and Warner (2010) found that the presence of a prison
3
record or felony conviction substantially reduces ex-offenders’ opportunities in the labor
market. In 2008, the number of ex-offenders of working age was approximately 12 to 14
million, which when factored into the national male employment rate for the same year,
lowered the overall percentage by 1 to 2 points (Schmitt & Warner, 2010). The prospects for
ex-offenders in the national job market are bleak, and continue to be an increasing concern
for inmates being released from state and federal prisons and the professionals who work
with them.
Unemployment and underemployment rates for people with disabilities in the United
States continue to be a national concern despite years of legislative gains, disability rights
advocacy, and increased national awareness (Markel & Barclay, 2009; Sambamoorthi, 2006;
Silverstein, Julnes, & Nolan, 2005). The Office of Disability Employment Policy (ODEP)
recently reported that as of July 2012, only 21% of people with disabilities are currently
participating in the workforce compared with 70% of people without disabilities (ODEP,
Department of Labor, 2012). National trends of wide gaps in participation in the U.S. labor
force and unemployment rates for people with disabilities persist despite an increased
national awareness of the unemployment and underemployment of people with disabilities.
As previous data documents, people with disabilities typically experience greater barriers to
employment and higher rates of unemployment than the general population (Lindsay, 2011).
These national trends of unemployment and underemployment are especially pronounced
when considering people with disabilities who also have criminal histories.
The combination of offender status and disability is a powerful impediment to
competitive employment that provides a livable wage post incarceration. Additionally, the
inclusion of racial/ethnic minority status to offender and disability statuses exponentially

4
increases the barriers to employment in the U.S. (Petersilia, 2003). The ability to accurately
track disability numbers for men and women incarcerated in local, state, and federal
correctional facilities has been a challenge for people working in the fields of criminology,
sociology, and rehabilitation counseling (Russell & Stewart, 2001). While various
researchers have attempted to conduct studies to track disability in correctional facilities
(Harlow, 2003; Lamb, Weinberger, & Gross, 2004; LaVigne, Kane, & Visher, 2005; Mears,
Aron, & Bernstein, 2003; Teplin, 1990), relatively few have been able to capture national
statistics regarding people with disability in prisons and jails. One exception has been a
national study aimed at understanding the prevalence and incidence rates of mental illness
among people in state and federals prisons as well as local jails (James & Glaze, 2006).
While mental impairments, including cognitive and psychosocial impairments are the focuses
of this study, it is important to note the prevalence of other disabilities affecting people in
correctional facilities. According to wide ranging research across many different academic
disciplines, tracking exact numbers of incarcerated people in local, state, and national
correctional facilities continues to be a challenge.
Purpose of Study
Considering the national employment trends for people with disabilities and ex-
offenders, empirical research on the employment of ex-offenders with disabilities is almost
non-existent in the vocational rehabilitation counseling literature (Whitfield, 2008). At the
time of this study, Whitfield (2008) is the only person to conduct empirical research (i.e.,
descriptive study) on applicants for vocational rehabilitation services originating from
correctional institutions utilizing the RSA 911 database. While this is an important first step
towards understanding more about ex-offenders with disabilities in the state/federal VR

5
system, more rigorous research is needed to get a clearer sense of how to create best practices
for this underserved population.
While access to state-federal VR agencies is open equally to the public, rates of
eligibility, types of services provided, and becoming successfully rehabilitated are
disproportionate for people of color. Over the past 15 years there has been a consistent body
of literature indicating that a person’s phenotype and ethnicity may play a significant role in
the VR process and outcomes (Jackson & Wilson, 2001; Robinson & Klein, 2008; Rosenthal,
2004; Wilson, 2002, 2005; Wilson, Harley, & Alston, 2001; Wilson, Jackson, & Doughty,
1999; Wilson & Senices, 2005). The current study seeks to expand on this established
empirical work by investigating the experiences of people with criminal histories and mental
impairments who access services in state-federal VR agencies using the RSA 911 database.
Current Demographics of the United States
The United States Census Bureau reported a total population of 308.7 million in
2010, which is based on citizens and non-citizens counted at their residence, people
temporarily away from their permanent U.S. residence, and people without a permanent
residence (U.S. Census Bureau, 2010). In comparison to the 2000 U.S. Census Bureau
statistics, this reflects a population growth of 9.7% (27.3 million). Differences in gender
were noted at almost an even split with 50.9% identifying as female and 49.1% identifying as
male in the 2010 U.S. Census Bureau statistics (Howden & Meyer, 2011). In contrast, the
age structure of the U.S. population varies with 20.1% reported to be between the ages of 0-
14 years, 66.8% between the ages of 15-64, and 13.1% ages 65 or older (U.S. Census
Bureau, 2010).

6
Regarding the racial and ethnic composition of the U.S., the 2010 U.S. Census
provides supporting evidence of an emerging population transformation with a 10% decline
(from 75% to 65%) from the 2000 U.S. Census Bureau statistics of individuals who self
identify as White. More specifically, in 2010 the Latino population in the U.S. rose by 43%
(i.e., increase from 35.3 million to 50.5 million) from 2000. Other racial and ethnic groups
also demonstrated an increase including Asian Americans (3.6% to 4.8%), Blacks (12.3% to
12.6%), and Native Hawaiian/Other Pacific Islander (.1% to .2%). In contrast, people
identifying as White showed the slowest growth of only 1% from 2000 to 2010; however,
looking at this group from a comprehensive perspective, there was a decrease from 69% to
64% in the overall representation of White in the overall population (Humes, Jones, &
Ramirez, 2011). This also supports the assertion made in the 2000 U.S. Census Bureau
report that people of color will likely comprise at least half of the population by the year
2050 (Grieco & Cassidy, 2001).
Theoretical Framework
The current study seeks to investigate what variables predict competitive employment
outcomes for applicants to the state-federal VR system originating from correctional facilities
who have mental impairment as reported in the 2010 RSA national database. Empirically
based research specifically looking at people with disabilities with criminal histories is
limited. Whitfield (2008) conducted a descriptive study utilizing RSA 911 data that isolated
applicants originating from correctional facilities, but he gave no suggestions for theoretical
frameworks that may be useful for people with criminal histories with disabilities. Recently,
Johnson (2013) proposed the use of Self Determination Theory (Ryan & Deci, 2008) and
Social Cognitive Career Theory (Brown, Lent, & Knoll, 2013) as viable theoretical

7
frameworks to work with ex-offenders seeking competitive employment when returning to
their respective communities.
Johnson (2013), drawing on the work of Ryan and Deci (2008), describes the overall
goals of Self Determination Theory (SDT) as meeting three fundamental psychological
needs: autonomy, competence, and relatedness. Johnson proposes that meeting the basic
psychological needs addressed in SDT leads to socially acceptable functioning through the
self-modification of previously disruptive behaviors, and will be effective for ex-offenders
because it is based on increasing the self-motivation of the client, thereby increasing the
potential outcomes for job success. In addition, Johnson (2013) posits that the routinization
of offenders while incarcerated often negatively impacts ex-offenders self-motivation upon
release due to their orientation towards being controlled by others, instead of initiating action
out of self-motivation. Using SDT as a theoretical lens for this study, therefore, may address
the lack of motivation and negative internalization of self worth many offenders face after
periods of incarceration.
Although SDT addresses ex-offenders’ interiority (i.e., internal motivators), it does
not directly address external factors, including barriers. Johnson (2013) proposed that Social
Cognitive Career Theory (Brown, Lent, & Knoll, 2013) may help with external factors that
are uniquely faced by ex-offenders seeking job opportunities in the community. External
barriers (e.g., public stigma, employer bias) are often present for people with criminal
histories, disability, and racial/ethnic minority status when separately considered. The
combination or intersection of these factors may produce unique barriers that should be
accounted for when working with this population. Johnson (2013), drawing on the work of
Lent, Brown, and Hackett (1996), posits that SCCT has the ability to potentially address the

8
external realities often faced by people with disabilities and criminal history. Social
Cognitive Career Theory holds personal choice as a central tenant in the career decision-
making process. Three factors are central to SCCT: “triadic reciprocality, in which personal
attributes (internal cognitive and affective states), physical attributes (external environmental
factors), and overt behaviors or actions all function as mechanisms affecting each other in
various ways” (Johnson, 2013, p. 86). In addition, Johnson (2013) drew on the work of
(Albert & Luzzo, 1999) to note three other core concepts of SCCT: self-efficacy, outcome
expectations, and goal setting. For ex-offenders the ability to believe in the self, combined
with positive expectations for employment are critical to proactive goal setting. Johnson
(2013) proposed that the combination of SDT and SCCT would proactively address internal
and external factors that often interrupt the successful acquisition of employment for people
with disabilities and criminal history. These theories, combined with the existing literature,
have guided the development of the following research questions for this study:
1. What racial and ethnic group differences exist among people with criminal histories
and mental impairment served by the VR system?
2. For people with criminal histories and mental impairment served by the VR system,
what differences exist in the types of services received across racial and ethnic
groups?
3. What are the reasons for case closure for people with criminal histories and mental
impairment served by the VR system across racial and ethnic groups?
4. How does demographic information and types of services, for people with criminal
histories and mental impairment served by the VR system, predict employment
outcomes across racial and ethnic groups?
9
Limitations
Although this study addresses many of the methodological challenges facing
researchers investigating the intersection of mental impairment, individual demographics,
and criminal history in the RSA 911 database, some limitations must be addressed. An initial
limitation is the strictures on the types of queries that could be made of the RSA 911 data.
While the data represent the apex of information collected on people with disabilities seeking
services from the state-vocational rehabilitation program, it was limited on the collection of
specific criminal history that would have enhanced the analysis of the current study. For
example, the length of time served is often an indicator of successful employment for people
with criminal records (Petersilia, 2003).
Another key limitation was the way closures were coded in the RSA 911 database. A
large number of the data files in the RSA 911 database (i.e., applicants with criminal histories
and a mental impairment) had closures that had to be collapsed into single variables or
eliminated all together (this will be explained further in chapters three and four). Closure
status is used in the current study to determine which applicants actually can be counted as
having achieved competitive employment as a result of their VR services. For example, it
would have been unethical to include people with a closure status of “death” in the analysis
of competitive employment. As a result, the initial population thought to be available for
analysis was reduced to approximately half. While the reduction represents a significant
decrease, the remaining population was still large enough (i.e., had sufficient power) to
produce significant outcomes for the questions under investigation.

10
Definition of Terms
Competitive employment. Within the VR system, competitive employment is
defined as employment obtained by an individual with a disability in an integrated setting
that pays minimum wage or higher and is comparable to employment positions held by
people without disabilities.
Order of selection. This is a three level classification system (category one for
eligible individuals with two or more significant disabilities, category two for eligible
individuals with significant disabilities, category three for eligible individuals with non-
significant disabilities) used in some states when it anticipates that there will not be enough
funds to fully serve eligible individuals.
RSA-911 database. This is a national database managed by Rehabilitation Services
Administration. The information collected for RSA 911 pertains to demographics, VR
services, and VR outcomes for all individuals who applied for public state-federal VR
services within the U.S.
Successful VR outcome. A VR outcome is considered successful when a consumer
obtains and maintains competitive employment.
VR statuses. Below is a list of the status codes used to describe service delivery
interventions and outcomes used in the VR process as defined by RSA
Status and Definition
02 Applicant - Indicates an individual has applied for VR services
04 Eligible Waiting List – Individual is on the Order of Selection waiting list
08 Closed before Eligibility – Individual has been determined ineligible for VR
services or withdrew the application prior to an eligibility determination

11
10 Eligible (Acceptance) – The VR Counselor has certified how the individual’s
disabilities result in a substantial impediment to employment, and that the individual can
benefit from rehabilitation services in terms of an employment outcome
12 Individual Plan for Employment (IPE) – An IPE is complete, as jointly
developed by the VR Counselor and the individual to address vocational and related issues
identified as substantial impediments to employment, but no services have been provided.
26 Rehabilitation – Successful case closure
28 Closed after Rehabilitated – Closed not rehabilitated after the IPE has started
(at least one IPE service was provided)
30 Closed before Rehabilitated – Closed not rehabilitated after eligibility (status
10) and before IPE services had begun (status 12)
Summary
The intersection of criminal history, mental impairment, and racial status has not been
critically investigated to date in the vocational rehabilitation counseling literature. The
shifting national U.S. demographics, and the growing number of people with mental
impairments in correctional institutions suggests that the VR system needs to critically
examine factors for successful outcomes for this population. Using data collected from the
fiscal year (FY) 2010 RSA-911 database, this study examined vocational rehabilitation
outcomes, service delivery, and demographic variables among applicants originating from
correctional facilities. The following literature review will provide a foundation for the
research questions stated above.

12
Chapter 2: Review of the Literature
The current study examined whether differences existed in competitive employment
outcomes and service patterns for consumers with criminal histories and mental impairments
in the state-federal VR agencies across the U.S. In this chapter, I discuss variables in the VR
literature that have been linked with successful employment outcomes. Second, a systematic
review of the literature on the effects of age, education, race and ethnicity, and primary
disability on the state-federal VR system is presented in support of the study research
questions. Third, I provide a review of the literature on state-federal VR outcomes rates.
Prior to analyzing variables in the VR literature that have been linked with successful
outcomes, a brief revisiting of the theoretical framework guiding this study will be provided
to further ground how existing research informed the current study.
The analysis and review of variables that impact both internal and external factors in
accordance with SDT and SCCT fit with the theoretical framework for the current study. In
combination with SDT and SCCT as the theoretical framework, the current study sought to
establish a rationale for focusing on racial and ethnic differences. For this aspect of the study,
Wilson’s (2000, 2002) research was reviewed to show the significant gaps in acceptance to
VR programs that exist along racial and ethnic lines. The current study, guided by the
thinking provided by SDT and SCCT and the research on racial/ethnic disparities, attempted
to predict salient variables affecting the acquisition of competitive employment for people
with mental impairments and criminal history in the state-federal VR system. Wilson’s
(2000, 2002) use of nominal and categorical variables in his logistic regression model
provides a statistical blueprint for formulating the research questions posed in this study.
13
Variables for Successful Outcomes
Due to the dearth of research on variables predicting successful state-federal VR
closures (status 26) for ex-offenders, it is important to establish an empirical record for
variables that have been investigated and documented in the vocational rehabilitation
literature. Saunders, Leahy, McGlynn, and Estrada-Hernández (2006) identified 62 studies
between 1980 and 2004 that focused on a wide range of client variables that lead to
successful VR outcomes. For the purposes of this study, the author focused on studies that
addressed: (a) demographics, (b) VR services, and (c) primary disability. The present review
will focus on selected studies identified in the meta-analysis that reported significant
findings. These variables will be extrapolated to support the current research questions that
seek to predict variables leading to successful outcomes for ex-offenders with mental
impairments in the national RSA 911 database.
Saunders et al. (2006) analyzed 118 articles, but only selected variables had at least
50% significant results. As a result, the selection of articles was limited to selected variables
to get the highest rate that produced significant results when considering which variables to
extrapolate for research questions. In addition, an even smaller number of variables had
direct bearing on ex-offender status. The current study drew from studies in the meta-analysis
that focused on the following variables: (a) age, (b) education, (c) race/ethnicity (while
ethnicity was not directly addressed in the meta-analysis, it was a variable of interest in
crafting research questions), and (d) diagnosis/disability type. Each study was re-examined to
determine fit for the current the current study.
14
Demographic Variables: Age, Education, Race
Age. Saunders et al. (2006) reviewed 14 articles that specifically studied the
relationship between age and the obtainment or regaining of employment. The age variable
meets the standard of statistical significance for the present review as 11 of the 14 articles
(79%) found significant results. Studies conducted between 1983 and 2003 specifically
looking at the relationship between age and employment outcomes found that younger
individuals with disabilities had better employment outcomes than their older counterparts
(Blackwell, Leierer, Haupt, Kapitsis, & Wolfson, 2004; Lustig, Strauser, Weems, Donnell, &
Smith, 2003;Vander Kolk & Vander Kolk, 1990). For example, Lustig et al. (2003) found
age to be significant in that younger workers were more likely to be employed than their
older counterparts with a population of people with traumatic brain injury. Likewise,
Blackwell et al. (2004) also found age to be significant in that younger workers were more
likely to be employed than their older counterparts with a population of people receiving
workers compensation from back injury. Several studies found that younger individuals
tended to have better employment outcomes across different populations of people with
disabilities.
While some researchers confirmed similar findings of younger individuals having
better employment outcomes, other researchers found the opposite. For example, Saunders et
al. (2008) reported that a study conducted on people with visual impairments (Farish &
Moore, 1989) found older participants had better employment outcomes. Upon further
review of the article, Farish and Moore (1989) directly reported not to have found any
significance for age and employment outcomes. Other studies had mixed results ranging
from finding both older and younger age groups with better employment outcomes (Marshak,
15
Bostick, & Turton, 1990) to studies finding no relationship between age and obtaining or re-
gaining employment (Fitzgerald, McGowan, Kutner, & Wenger, 1982; Smith & Crisler,
1985).
In more recent studies investigating outcomes for vocational rehabilitation consumers
(Jung & Bellini, 2011; Jung, Schaller, & Bellini, 2010), age was not among demographic
variables found to be significant for this population. Jung and Bellini (2011) found that
Supplemental Security Income/Social Security Disability Income at referral and level of
education were more reliable and significant predictors of greater earnings and/or successful
outcomes for employment. These researchers used utilize logistic regression with the RSA-
911 database to find variables with significant predictability for successful outcomes. While
neither of the more recent studies found significance with age, prior research has shown age
to be a significant predictor of better employment outcomes for people with disabilities
seeking to regain or obtain employment.
Education. The studies I re-examined from the Saunders et al. (2008) meta-analysis
on education did not include college education, given that the majority of ex-offenders are
undereducated (Schmitt & Warner, 2010). According to 2008 data (Harris & Wade, 2009)
approximately 88% of ex-offenders have educational attainment of high school or less. The
adjustment for lower educational standards produced 15 of 22 studies eligible for
reexamination. Two of the studies reported on the significance of age as a significant
predictor of better employment outcomes but included education as a variable (Blackwell et
al., 2004; Vander Kolk, 1989). In both cases the authors found a significant relationship
between educational attainment and employment outcomes. The other nine studies had
education as a primary focus within the list of independent variables predicting successful

16
obtainment or regaining of employment (Belgrave & Walker, 1991; Hollingsworth & Harris,
1980; McShane & Karp, 1993; Roesler et al., 2004; Smith & Crisler, 1985). Each of these
researchers found significant relationships between educational levels of participants and
their employment outcomes. For example, Roesler et al. (2004), studying a population of
people with multiple sclerosis, found education to be a significant variable in the successful
obtainment or regaining of employment in that those with higher educational attainment were
more likely to be employed than their counterparts with less educational achievement. Other
researchers found no significant relationship between education and increased opportunities
for employment (Fitzgerald, McGowan, Kutner & Wenger, 1982; Lustig et al., 2003;
Marshak, Bostick & Turton, 1990; Saxon, Spitznagel & Shelhourn-Schutt, 1983). Saunders
et al. (2008) noted that each study suggested that greater educational attainment will most
likely lead to better employment outcomes.
Race/Ethnicity. Saunders et al. (2008) identified 6 studies between 1980-2004 that
specifically investigated the relationship between employment outcomes and race of people
with disabilities. It is important to note that many more articles examining race and VR
outcomes have been published in the same time frame studies listed in the meta-analysis
(Atkins & Wright, 1980; Feist-Price, 1995; Herbert & Martinez, 1992; Ross & Biggi, 1986).
In addition articles investigating race and VR acceptance have also informed rehabilitation
researchers and practitioners (Wilson, 2002; Wilson, Alston, Harley, & Mitchell, 2002;
Wilson, Jackson, & Doughty, 1999; Wilson, Turner, & Jackson, 2002; Wilson & Senices,
2005). The overwhelming majority of these studies found a significant relationship between
race, ethnicity, and employment outcomes utilizing various statistical methodologies, ranging
from logistic regression to Chi Squared Automatic Interaction Detection (CHAID). The

17
investigation of the relationship between race, ethnicity, and employment outcomes has a
long history in addition to the studies identified by Saunders et al. (2008).
Additional studies identified in the meta-analysis directly examine the relationship
between race of the client and the outcome for employment (Danek & Lawrence, 1982;
Dunham et al., 2000; Hill, 1989; Moore, 2002; Santiago, 1988). Each of the studies identified
evidence substantiating the significance of race in the re-gaining or obtainment of
employment. Consistent with findings in previous rehabilitation literature (Feist-Price, 1995;
Herbert & Martinez, 1992) African Americans and Latino people with disabilities were
reported to have decreased success with employment closures (status 26). Only one of the six
studies identified by Saunders et al. (2008) did not result in significant findings between race
and employment outcomes.
Race and ethnicity is a variable that has a direct correlation in both rehabilitation and
criminological literature. For example, research conducted in the United Kingdom by Boast
and Chesterman (1995) found that Blacks were disproportionately numbered in secure
facilities based in comparison to the overall population. The purpose of their study was to
examine the consistently high discrepancy between the numbers of Blacks incarcerated
versus their White counterparts. The authors attribute racist discrimination as a major causal
factor for this phenomenon. The authors provide key definitions for racism, racial prejudice,
and racial discrimination that are foundational for their research. Boast and Chesterman
(1995) define racism as, “discriminatory political, economic, and social processes, linked to
factors in history, which continue to allocate power and resources on a differential basis” (p.
219). Racial prejudice is defined as, “an attitude of hostility towards a racial group arising
from overgeneralized and erroneous beliefs” (Fernando, 1988 as cited in Boast and
18
Chesterman, 1995, p. 219). The authors conclude that structural racism found in psychiatric
institutions is a microcosm of larger societal racial prejudice and discrimination. As such,
overrepresentation and inferior treatment is unlikely to change if these larger issues are not
fundamentally changed.
Recently, research using a national sample analyzed the ethnic and racial differences
for the risk of psychiatric disorders between groups (Breslau, Aguilar-Gaxiola, Kendler, Su,
Williams, & Kessler, 2006). The authors found that racial minorities over their lifetime were
less likely than their White counterparts to develop serious or severe psychiatric illness.
These findings are incongruent with the current populations of Blacks (in particular Black
men) in secure facilities, namely prisons and jails (NCSL, 2009). Blacks with psychiatric
illness are overrepresented in prisons and jails in the United States (Prince, Akincigil, &
Bromet, 2007). Racism, racial prejudice, and racial discrimination (Boast & Chesterman,
1995) are determinants for overrepresentation of Blacks in U.S. secure systems currently
housing Blacks with psychiatric illness. Overrepresentation in secure facilities (e.g. jails and
prisons) does not mean that Blacks utilize non-forced psychiatric facilities any more than
their white counterparts. In fact, recent research finds that the exact opposite is true; Blacks
consistently under utilize voluntary psychiatric care facilities (Richman, Kohn-Wood, &
Williams, 2007).
Another recent study found that Blacks (as well as Black Latino and Asian-Indian
populations) use less psychiatric medication than their White counterparts (Han and Liu,
2005). The authors do not cite any racist discriminatory factors for the above finding, and
further suggested that no programs be created to bridge the disparity. Other research offers
findings that may serve as correctives for the omissions in Han and Liu’s research. In

19
particular, Gary (2005) conducts research that finds significant stigma in minority
populations toward psychiatric care facilities. The stigma discussed is in direct response to
the racial prejudice and less than the standard treatment given to Whites from psychiatric
care facilities. As such, the authors’ suggest that the stigma is grounded in the reality that
Blacks have consistently received a poor standard of care (Gary, 2005). As changes in
technology and medication improve the quality of services for people with psychiatric
illness, the practice of providing outdated medication to Blacks instead of newer more
effective medication is still pervasive. The further cultural mistrust this creates between
Blacks and psychiatric care institutions are pronounced.
Primary disability. Of the ten studies selected by Saunders et al. (2008), five were
chosen for re-examination (Andrews et al., 1992; Capella, 1993a; Capella, 1993b, Marshak,
Bostick, & Turton, 1990). The reason for selection by the authors is that these studies closely
examined the relationship between disability type and successful employment outcomes. In
addition, Schawb and DeNitto (1993) found that substance abuse was a greater barrier to
employment than offender status. This study is the first mention of offender status of any of
the studies reviewed thus far. Capella (2003a; 2003b) has done the recent work on disability
type primarily studying the relationship between people with hearing loss and employment
outcomes utilizing the RSA 911 dataset. The empirical evidence from these studies suggests
that diagnosis/disability type is a variable that may significantly predict better outcomes for
ex-offenders with disabilities.
Outcomes and Acceptance Rates within the VR System
Atkins and Wright (1980) produced a well-known study of disparities between Blacks
and Whites in the state-federal VR system using RSA data from FY 1976. Essentially, they

20
concluded that Black applicants experienced unequal treatment in all steps of the VR process
in comparison to White applicants. In particular, they found that acceptance rates for Black
applicants were disproportionally lower (5.5%) compared to White applicants. Moreover,
12% of Black applicants were determined ineligible, cited mostly for failure to cooperate,
compared to slightly over 8.5% for White applicants. Additionally, higher rates of Black
applicants (7%) were determined ineligible for not having a severe disability compared to 4%
of White applicants. When examining case closures, a higher percentage of Blacks (42%)
were closed after IPE without reaching a successful outcome compared to Whites (35%).
Thus, it was reported that Whites were more successfully rehabilitated than Blacks. Yet, it is
unknown if this finding was statistically significant or not as an inferential statistical test was
not conducted (Atkins & Wright, 1980).
Following the Atkins and Wright study, Ross and Biggi (1986) analyzed VR
outcomes (Statuses 08, 26, 28, and 30) in a sample of Whites, Blacks, AI/AN, and
Asians/Pacific Islanders. They, too, found that Whites were more likely to be closed in
Status 26, or successfully employed, compared to the other groups. They also found higher
rates of closures in Statuses 08, 28, and 30 among the non-White consumers. Also, Whites
were most likely determined ineligible for reasons of refusal of services (Ross & Biggi,
1986). A few years later, Herbert and Martinez (1992) explored if a relationship existed
between ethnicity and consumer outcomes in the state-federal VR process (including statuses
08, 26, 28, and 30) and were the first to include Latinos in this type of comparison. Similar
to the findings reported in the studies that preceded this one, they found that Whites were
more likely to be determined eligible for VR services. Additionally, Herbert and Martinez
reported that Latinos and Blacks in particular were more likely to be determined ineligible

21
for state-federal VR services in comparison to Whites, thus, also being less likely to
becoming successfully rehabilitated. Likewise, unlike the previous studies, they found no
significant differences in Statuses 28 and 30 between Blacks and Whites. One year later,
Dziekan and Okocha (1993) also examined state-federal VR eligibility rates by race and
ethnicity for consumers served from 1985-1989. Their findings were also comparable to
Atkins and Wright’s (1980), Ross and Biggi’s (1986), and Herbert and Martinez’s (1992)
studies with Whites with disabilities most likely determined eligible for VR services than
Blacks or Latinos with disabilities. In 1995, Feist-Price revealed comparable findings in her
study of Black and White consumers who applied for VR services in a southeastern state.
Differences were found between these groups in that Blacks were more likely to be closed in
Statuses 08 and 28 compared to Whites. Thus, this study also validated the findings in the
previous studies.
Wheaton (1995) also investigated acceptance rates between Black and White
applicants in the state-federal VR system (Latinos were excluded due to small sample sizes).
Although no statistical differences were reported between the two groups in terms of
eligibility, differences in rates were found. Whites had an acceptance rate of 53% while
Blacks had an acceptance rate of 47%. Following this study, Peterson (1996) also reported
finding no statistical differences in acceptance rates between Blacks, Whites, Native
Americans, Asians/Pacific Islanders, or Latinos. In 1999, Wilson, too, found no statistically
significant differences in acceptance rates between Blacks and Whites from the FY 1996
RSA-911 database who were served in a large Midwestern state-federal VR agency.
That same year, Wilson, Jackson II, and Doughty (1999) found in their study of Black
and White consumers who were served in a large Midwestern state-federal VR agency also
22
from the FY 1996 RSA-911 dataset that Blacks were more likely to be closed prior to
successful rehabilitation specifically for failure to cooperate or unable to locate. Contrarily,
Whites who closed before becoming successfully rehabilitated were more likely to do so due
to having a too severe disability, having no disability, or other circumstances. In the
following paragraphs, various client variables and service variables are reviewed regarding
their associations with VR outcomes and VR acceptance rates in a population of people with
diverse disabilities among literature conducted from the year 2000 to the present.
Outcomes and the VR System
Race/ethnicity. Patterson, Allen, Parnell, Crawford, and Beardall (2000) considered
the influence of race and ethnicity in their analysis of VR outcomes among a sample of VR
consumers who participated in VR services in a southeastern state. The data were taken
from the FY 1996 RSA-911 database. Statistically significant differences (p < .01) were
found between Black (n = 3,102) consumers and White (n = 10,928) consumers. Moreover,
the rate of successful employment outcomes was 60% for Whites; however, only 55% of
Blacks were able to reach the same outcome.
Using a sample Black and White (n = 17,466) consumers from the FY 1996 RSA-911
database who were served in large Midwestern state VR agency, Jackson II and Wilson
(2001) reported race a statistically significant association with VR outcomes. Further, Blacks
were more likely to be closed in Statuses 08, 28, and 30 while Whites were more likely to be
closed in Status 26.
Wilson (2005) analyzed differences in closure statuses with race/ethnicity, including
identifying as Latino, as an independent variable using FY 2001 RSA-911 data. He found
that consumers who identified as non-Latino (Black; n = 4,000) and between the ages of 51-
23
60 years were more likely to be closed unsuccessfully in comparison to non-Hispanic Whites
from the same age group. Further, consumers who identified as Latino and White as their
race were also more likely to be successfully rehabilitated than Latinos who identified as
Black. Both of these findings in Wilson’s (2005) study were statistically significant.
Dutta, Gervey, Chan, Chou, and Ditchman (2008) investigated several factors of VR
outcomes, including race and ethnicity, among a stratified sample of VR (n = 15,000)
consumers with a sensory/communicative, physical, or mental disability from FY 2005 RSA-
911 database. The variable of race and ethnicity was found to be statistically significant of
VR outcomes. In particular, Blacks with a sensory or communicative disability were found
to have a 20% lower odd (OR = 0.80; 95% MI: 0.67-0.96) of successfully obtaining
competitive employment than their White counterparts. Additionally, Native Americans with
physical impairments and mental disabilities were found to have a 51% and 50%,
respectively, lower odd of gaining employment (OR = .49; 95% MI: 0.31-0.78; OR = .50;
95% MI: 0.31-0.82) in comparison to Whites with the same types of disabilities, which was
also statistically significant.
Age. Age was also a statistically significant predictor of VR outcomes, but for only
one of the groups in the Dutta et al. (2008) study. Consumers between the ages of 35-54
years with a sensory/communicative disability were 1.4 times more likely to be successfully
rehabilitated (OR = 1.39; 95% MI: 1.19-1.63) compared to consumers between the ages of
16-34 years with a sensory/communicative disability. Likewise, those between the ages of
55-64 years had a 1.9 times greater (OR = 1.88; 95% MI: 1.47-2.39) odds of becoming
successfully employed as well as those who were 65 years and older with a
sensory/communicative impairment were over three times more likely (OR = 3.30; 95% MI:

24
2.40-4.54) of obtaining competitive employment when compared to the 16-34 age group with
the same type of disability. Additionally, it was noted that age was not a statistically
significant predictor of employment outcomes for those with physically or mentally related
disabilities.
Education. In the study conducted by Jackson II and Wilson (2001), educational
status at application also showed to be statistically significant. Hence, Whites were more
likely to have a high school diploma or higher when applying for VR services while Blacks
were more likely to apply with less than a high school diploma.
Dutta et al. (2008) also reported education to be a statistically significant predictor of
successful VR outcomes for two of the groups in their study. Consumers with a
sensory/communicative related disability who participated in a special education program
demonstrated a 58% (OR = 0.42) decreased chance of becoming successfully employed when
compared to consumers with a college degree and the same disability category. Further, high
school dropouts with a sensory/communicative impairment showed a 35% lesser chance (OR
= 0.62) of reaching a Status 26 while those with a high school diploma had a 26% lower odds
(OR = 0.74) of obtaining competitive employment. Likewise, consumers with physical
impairments who had less than a high school education had a 50% lower odds ratio (OR =
0.50) of being successfully employed compared to consumers with a college degree.
Similarly, consumers with physical disabilities who had a high school education
demonstrated a 36% lesser chance (OR = 0.64) while consumers with some postsecondary
education or an Associate’s degree had a 32% decreased odds (OR = 0.68) of closing in
Status 26 compared to consumers with college degrees. Finally, Dutta et al. (2008) noted

25
that education was not a statistically significant predictor of successful rehabilitation for
consumers with mental disabilities.
Counseling and guidance. Substantial counseling and guidance was reported to be
statistically significantly with successful employment outcomes for people with physical and
mental impairments only in the study by Dutta et al. (2008). Moreover, people with physical
impairments who received substantial counseling and guidance had a 1.2 greater chance (OR
= 1.16) of being successfully employed while those with mental impairments who also
received this service had a slightly greater odds of becoming competitively employed (OR =
1.18). No statistically significant associations were reported with receiving this service and
reaching a Status 26 for those in the sensory/communicative disability group.
Assessment. In their study of consumers with a dual diagnosis of a mental health
impairment and substance abuse, Robinson and Klein (2008) found consumers of color who
had received assessment services were assessed at a lower rate than White consumers.
Moreover, of the total sample, 25% (n = 13,874) of the consumers of color received
assessment services compared to 29% (n = 15,967) of the White consumers. This difference,
however, was not statistically significant.
Unsuccessful closure reasons. Chan, Wong, Rosenthal, Kundu, and Dutta (2005)
reviewed race and its interaction with unsuccessful closures from the FY 2001 RSA-911 data
(N = 628,248). They found that Blacks showed the highest rates of closing for failure to
cooperate (25%) while Asian Americans had the lowest rates for this reason (12%). On the
other hand, Asian Americans displayed the highest percentages (24%) of closing for unable
to locate or contact. While Whites had the highest rates of closing for refusal of services

26
(26%), Latinos showed the lowest (15%) for this closure reason. In contrast, Latinos had the
highest percentages for closing as having no disabling condition.
In 2010, Kolakowsky-Hayner also evaluated factors related to state-federal VR
acceptance rates among a sample of participants with varying types of brain injury as
collected from the FY 2001 RSA-911 database. The sample included Whites (n = 15,101;
83%), Blacks (n = 2,607; 14%), Latinos (n = 1,432; 8%), AI/AN (n = 305; 2%), and
Asian/Pacific Islander (n = 280; 2%). When comparing Whites to non-Whites, she also found
that Whites were more likely to be closed for refusing services (32%), unable to
locate/contact or moved (21%), and failure to cooperate (16%) while non-Whites were more
likely to be closed for refusing services (25%), unable to locate/contact or moved (25%), and
failure to cooperate (21%).
Summary of Outcomes and the VR System
Similar to the literature reviewed on VR outcomes, the literature reviewed in this
section of VR outcomes among consumers with other types of disabilities also reveals
evidence that race and ethnicity can have an influence on VR outcomes and the types of
services received as part of the IPE. Generally, more Whites with disabilities were reported
to reach successfully rehabilitated outcomes in comparison to people of color (Dutta et al.,
2008; Jackson II & Wilson, 2001; Patterson et al., 2000; Wilson 2005). In addition, one
study reported that White Latinos also showed a greater rate of closing in a Status 26
compared to Black Latinos (Wilson 2005). A possible explanation for this finding is that
White Latinos may have similar experiences as White non-Latinos based on their phenotype
when compared to Black Latinos (Wilson & Senices, 2005). Hence, this study found that
consumers between the ages of 16-34 years had the lowest rates of competitive employment

27
while those between the ages of 35-54 years had the highest (Dutta et al., 2008). Education
was also similar to the literature reviewed in the previous section; consumers with a high
school or more educational level, especially those with a college degree, had a greater chance
of closing successfully than those with less than a high school diploma (Dutta et al., 2008;
Jackson II & Wilson, 2001).
Comparable to the studies reviewed on consumers with mental impairment and the
VR system, job search assistance, job placement assistance, and on-the-job supports were
found to significant predictors in one study (Dutta et al., 2008); however, this was not
reviewed on the basis of race. Robinson and Klein (2008), for college/university training and
vocational training, reported that consumers of color were less likely to receive
college/university training as part of their IPE services. Likewise, another study by Dutta et
al. (2008) found that people with physical disabilities were more likely to receive
college/university training while those with mental disabilities were more likely to receive
vocational training. In addition, receiving substantial counseling and guidance was not
significantly correlated with closing in a Status 26 for consumers with a physical or mental
disability. Robinson and Klein (2008) additionally found that only one study found
assessment services provided at a higher rate to White consumers than consumers of color,
however, this finding was not statistically significant.
Similar to the literature reviewed in the first section, the literature reviewed in this
section found that White consumers with general disabilities were also more likely to have a
higher amount of funding allocated to their cases in comparison to consumers of color with
general disabilities (Mwachofi et al., 2009; Patterson et al., 2000; Robinson & Klein, 2008).
One study, however, found that more funding was spent on cases for consumers of color who
28
closed unsuccessfully, but not for those who closed successfully (Robinson & Klein, 2008).
Likewise, the studies reviewed here found that White consumers were more likely to spend
more time in the VR system than consumers of color (Mwachofi et al., 2009; Robinson &
Klein, 2008). Additionally, one study reported that White consumers had higher weekly
earnings after the completion of VR services, but for hours worked, consumers of color
showed a slightly higher increase than White consumers (Mwachofi et al., 2009). Finally,
two of the studies also found that for Blacks consumers who closed unsuccessfully, the
reason cited was most likely failure to cooperate, which validated the findings of the Atkins
and Wright (1980) case (Chan et al., 2005; Kolakowsky-Hayner, 2010).
Acceptance Rates and the VR System
Race/ethnicity. Race and ethnicity continues to be a widely studied variable for its
association with state-federal VR acceptance rates. Wilson (2002) explored whether
significant differences existed in state-federal VR acceptance rates between Blacks (n =
58,658), AI/AN (n = 3,191), Asian Americans/Pacific Islanders (n = 3,653), and Whites (n =
194,250) using FY 1998 RSA-911 data. The findings revealed Black applicants were less
likely to be accepted for VR services in comparison to White applicants which was
statistically significant. Further, the only groups that did not show any statistically
significant differences were among applicants who identified as AI/AN and Asian/Pacific
Islander. Therefore, the findings from this study contrasted the Wilson (1999) study and
Wheaton (1995) studies.
Also in 2002, Wilson, Alston, Harley, and Mitchell investigated the effects of several
variables on VR eligibility determination using FY 1998 RSA-911 data. Participants
included Blacks (n = 46,816), Whites (n = 164,183), Asian/Pacific Islander (n = 3,098), and

29
AI/AN (n = 2,476). In contrast to previous findings, they found that Black applicants were
over two times more likely to be determined eligible for VR services compared to White
applicants. Likewise, they also found a positive correlation among AI/AN applicants and
acceptance rates; however, this finding was not statistically significant. Also, it was noted
that Asians/Pacific Islanders had a negative correlation with VR eligibility determinations
(Wilson et al., 2002).
Chan et al. (2005) also investigated several factors related to acceptance rates using
the FY 2001 RSA-911 data and found race to be the second most important predictor of
acceptance rates (behind severe disability status). They reported that Whites and Asian
Americans with severe disabilities displayed higher acceptance rates (94% and 96%,
respectively) when compared to Blacks (91%), Latinos (91%), and AI/AN (93%) with severe
disabilities, which is somewhat incongruent with the previous literature reporting no
statistical significance or a negative correlation for individuals who identify as Asian or
Pacific Islander. Distinctly, they found a difference of six percent in acceptance rates
between Blacks and Whites, which fundamentally validates Capella’s (2002) finding of a
five percent difference in acceptance rates between Blacks and Whites (Chan et al., 2005).
Wilson and Senices (2005) also explored public VR acceptance rates by race,
particularly between consumers who identify as Latino (n = 34,563) and all other non-
Latinos (n = 157,131), as taken from the FY 1998 RSA-911 database. Overall, they found
that identifying as Latino or non-Latino accounted for 32% of the variance in state-federal
VR eligibility determination. Further, consumers who were Latino/a were more likely to be
accepted for VR services in comparison to consumers who were non- Latino/a (e.g., White,
Black, AI/AN, and Asian/Pacific Islander). Thus, the findings of this study were inconsistent
30
with previous findings (e.g., Herbert and Martinez, 1992; Dziekan and Okocha, 1993) that
Latinos were one of the least likely groups to be determined eligible for VR services.
Kolakowsky-Hayner (2010) also evaluated factors related to state-federal VR
acceptance rates from the FY 2001 RSA-911 database. When examining this outcome with
race and ethnicity, it was also reported that Whites (n = 3,852) and Asian Americans or
Pacific Islander had the highest acceptance rates (86% and 85% respectively) followed by
AI/AN (82%) and Blacks (82.3%). Further, the lowest acceptance rates were found among
Latinos (81.6%). Thus, the findings in the Kolakowsky-Hayner study related to Asians and
Pacific Islanders are compatible with Chan et al.’s (2005) findings, but contradict findings in
earlier studies such as Wilson (2000; 2002).
Gender. From the 2001 RSA-911 data, Chan et al. (2005) reported finding no
statistically significant differences in acceptance rates by gender (56% male; 44% female).
Kolakowsky-Hayner (2010) also did not find any statistically significant differences in VR
acceptances when comparing males (n = 12,151; 66%) and females (n = 6,153; 34%).
Education. In 2001, Wilson, Harley, and Alston revisited the interaction of race and
acceptance rates as a means to validate the earlier findings of Wilson (1999). This study,
however, included education as a control variable. Participants for this study (African
Americans [n = 1,453] and Whites [n = 3,122]) were taken from the FY 1998 RSA-911
database and focused on participants who were served a public VR agency in Michigan.
They concluded that VR acceptance rates were dependent on race. With regards to
education, they found that Blacks with a high school diploma or less were least likely to be
found eligible for VR services when compared to Whites with an equal level of education
(Wilson et al., 2001). Wilson et al. (2002) also explored educational levels with eligibility
31
determinations and reported that after controlling for educational levels, consumers with
greater than a high school diploma had lower chances of being accepted for VR services (i.e.,
as education increased, VR acceptance rates decreased).
In a study conducted by Wilson and Gines (2009), education was found to be the third
strongest statistically significant predictor in their study of VR applicants (n = 12,000)
acquired from the FY 1998 RSA-911 database. Applicants who had a high school diploma
or higher were more likely to be determined eligible for VR services regardless of other
factors such as race or significance of disability.
Kolakowsky-Hayner (2010) found education to be the most statistically significant
predictor or acceptance rates. Particularly, she reported that consumers who had participated
in special education services had higher acceptance rates (89%) compared to those who had
received their education in a public education system (85%). Moreover, those who had a
received special education services had a better rate of acceptance than those with more than
a high school diploma (86%), a high school diploma or equivalent (85%), and less than a
high school education (84%).
Significant disability. Chan et al. (2005) found severity of disability to be the most
statistically significant predictor of acceptance rates from the 2001 RSA-911 data.
Additionally, people with severe disabilities were more likely to be accepted for VR services
(93%) when compared to people who had no severe disability (45%). Thus, the effect size
found for severity of disability was 16.4, which is credited as a large effect. Chan et al. also
found that Asian Americans who had a severe disability had the highest rate of acceptance
(96%) while Blacks and Latinos with severe disabilities continued to have the lowest VR
acceptance rates (91%). When considering applicants who did not have a severe disability,

32
both Asian Americans and Latinos had the highest acceptance rates at 50% followed by
Whites (45%). Those who identified as Black and had no severe disability still had the
lowest rates of VR acceptance (37%). Hence, the difference in VR acceptance rates between
Blacks and Whites without severe disabilities increased to 8%.
Wilson and Gines (2009) also analyzed VR eligibility determinations among a
stratified sample of Blacks (n = 3,000), Whites (n = 3,000), AI/AN (n = 3,000), and
Asians/Pacific Islanders (n = 3,000) as obtained from the FY 1998 RSA-911 database.
Overall, they found that having a severe disability was a statistically significant predictor of
VR eligibility determination. Of the consumers who had a significant disability, 99.5% were
certified as eligible for VR services while 96.5% of those without a significant disability
were also accepted. When considering the influence of race and significant disability on
acceptance rates, those who identified as Black or AI/AN and had a significant disability
showed a somewhat greater rate of VR acceptance than all other racial/ethnic groups at
99.8%. For those without a significant disability, being White, Black, or AI/AN was
associated with higher rates of acceptance at 97%. Further, Asians/Pacific Islanders showed
the lowest rate of acceptance (93%) among those with no severe disability.
Summary of Acceptance Rates and the VR System
As found in the literature reviewed in this section, race and ethnicity also appears to
have a significant influence on VR acceptance rates for consumers with general disabilities.
For example, while one study found Black applicants were less likely to be accepted for VR
services than White applicants (Wilson, 2002); another reported they were more likely to be
accepted than Whites (Wilson et al., 2002). Wilson (2002) speculates that negative views of
particular ethnic groups may be a possible explanation for lower acceptance rates in

33
comparison to Whites; however, Wilson et al. (2002) note that because rates of disability are
higher among Blacks, this might explain why they found a higher acceptance rate among this
population in their study. One study found Latinos to have the highest acceptance rates over
non-Latinos (Wilson & Senices, 2005) while another study found Latinos to have the lowest
rates of VR acceptance in comparison to Whites, Asians, AI/AN, and Blacks (Kolakowsky-
Hayner, 2010). Moreover, Wilson and Senices (2005) point out that although their findings
appear to contradict the Dziekan and Okocha (1993) study, one possible explanation could be
that the participants used in the Dziekan and Okocha study may have categorized as Latino
only with no option to choose a race (e.g., White, Black) as participants did in the Wilson
and Senices study. In addition, one study found Asians/Pacific Islanders to have one of the
highest acceptance rates (Chan et al., 2005) while another found a negative correlation with
identifying as Asian/Pacific Islander and VR acceptance rates (Wilson et al., 2002). For
gender, two studies reported finding no significant differences between males and females
and acceptance into VR services (Chan et al., 2005; Kolakowsky-Hayner, 2010). The
findings on education were somewhat inconsistent in that those with a high school diploma
or less were least likely accepted for VR services, especially for Black applicants (Wilson et
al., 2002; Wilson et al., 2001), while another found consumers with high school diplomas to
have the highest rates of acceptance (Wilson & Gines, 2009). Also, another study found that
consumers who had received special education services were more likely determined eligible
for VR services over those with more than a high school diploma, high school diploma, or
less than a high school diploma from a regular education system (Kolakowsky-Hayner,
2010).

34
A few of the studies also found having a severe disability to be statistically significant
with acceptance into VR services compared to not having a severe disability (Chan et al.,
2005; Wilson & Gines, 2009). Chan et al. notes this to be consistent with the Rehabilitation
Act of 1973 in which consumers with the most severe disabilities have the highest priority in
being served in state VR agencies. Also, when analyzed by race, one study reported Asians
with a significant disability had the highest rate of VR acceptance while Blacks and Latinos
with significant disabilities had the lowest rates of acceptance (Chan et al., 2005). One
possible explanation mentioned in the Chan et al. study regarding this finding is that
consumers who present with stereotypes held by White professionals may provoke negative
judgments on that particular group. Another study found that Blacks and AI/AN with
significant disabilities had the highest rates of acceptance into VR services compared to all
other racial or ethnic groups (Wilson & Gines, 2009). Lastly, two of the studies reviewed
sources of support and its relationship with acceptance into the VR system. It was
determined that higher personal earnings and receiving support from family and friends
decreased a consumer’s chances into being determined eligible for VR services (Wilson,
2000; Wilson et al., 2002)
Summary
Demographic variables have an established and significant effect on VR acceptance
and outcomes. This chapter reviewed the influence of significant disability (i.e., mental
impairment), and race/ethnicity on the process of VR acceptance and outcomes. The primary
goal of the literature review was to establish salient variables that could be applied to people
with disabilities with criminal history and mental impairment in the current study. More than
thirty years of research has established race/ethnicity, age, gender, education, and primary

35
disability as salient demographic variables for empirical research. In addition, assessment,
counseling and guidance, diagnosis and treatment, job readiness assistance, job placement
assistance, job search assistance, and information and referral services were salient service
variables for analysis. Each of these variables was included in the overarching research
question of which variables predict successful employment outcomes for people with
criminal histories and mental impairment.

36
Chapter 3: Methodology
This study investigated VR outcomes of people with criminal histories and mental
impairment served by the state-federal VR system during FY 2010. More specifically, this
study examined predictors of successful competitive employment outcomes based on
consumer demographic information, types of services received, and delivery of services.
Additionally, this study analyzed differences in VR experiences among different racial and
ethnic groups. The following research questions were developed as a result of a review of the
literature.
Research Questions
1. What racial and ethnic group differences exist among people with criminal histories
and mental impairment served by the VR system?
2. For people with criminal histories and mental impairment served by the VR system,
what differences exist in the types of services received across racial and ethnic groups?
3. What are the reasons for case closure for people with criminal histories and mental
impairment served by the VR system across racial and ethnic groups?
4. How does demographic information and types of services for people with criminal
histories and mental impairment served by the VR system predict employment outcomes
across racial and ethnic groups?
Research Design
This study is an ex post facto design since it explores relationships with non-
manipulated independent variables. Additionally, groups and conditions had previously been
formed and applied prior to the start of this study. The research questions were derived from
the reviewed literature and tested after relationships between variables had been established.
37
In other words, ex post facto research designs use information that already exists among
intact groups and attempts to look backward to explain how a given set of independent
variables affected a dependent variable, with the term “ex post facto” literally translating to
“after the fact” (Heppner, Wampold, & Kivlighan Jr., 2008). One issue with utilizing an ex
post facto design is the likelihood of chance influencing the findings. Heppner et al. (2008)
note that particularly with a large set of variables results are likely to be affected by chance,
which may lead to erroneous conclusions.
Additionally, this study used a secondary data analysis in which data was not
collected by the researcher. The data came from the RSA-911 national database for FY
2010, which was developed by RSA and based on data collected from all state-federal VR
agencies throughout the U.S. and its territories (RSA, 2010).
Population
The population for this study was defined as state-federal VR consumers who (a)
applied from a correctional facility, (b) had a mental impairment, and (c) identified their
race/ethnicity as Black, White, Latino/a, American Indian/Alaska Native, Asian Americans,
and Native Hawaiian/Other Pacific Islander. The participant pool for this study was
comprised of 3,067 state-federal VR consumers with documented cases in the 2010 RSA-911
database. In this case, consumers matching the above three conditions were eligible for the
participant pool.
Power Analysis
Power is defined as the probability that a statistical test will yield statistically
significant results to reject the null hypothesis when the null hypothesis is false (Cohen,
1988). In order to determine the power in a study, three factors must be considered: alpha

38
level, population size, and effect size (Cohen, 1988). A power analysis is usually conducted
at the beginning of a study to calculate the minimum population size needed to detect a given
effect size (Grimm, 1993).
Many studies conducted in the social sciences field set the alpha level (i.e.,
significance level; a) at .05 to indicate the probability of making a Type 1 (i.e., rejecting the
null hypothesis when the null hypothesis is in fact true). In other words, a .05 alpha level
represents a 5% chance that a Type I error will be committed. Likewise, a Type II error (i.e.,
b) is committed when the null hypothesis is accepted when it is actually false (Cohen, 1988).
Cohen suggests that by increasing the sample size, variance can be decreased. Effect size
measures the relationship between two variables and as it increases, so does the magnitude
that this relationship would exist in the population. An effect size can be categorized as
small, medium, or large. The effect sizes reported in the studies reviewed ranged from .16
(small) to .28 (medium) to .53 (large) for a multiple logistic regression analysis; however, the
average effect size was .16 (small; Cohen, 1988).
All information from consumer records in this study was classified according to
RSA’s coding system, which is primarily binary and allows for easily translating responses
into a computer two-digit format (Neubauer, Freudenberger, & Kuhn, 2007). The Reporting
Manual for the RSA 911 Case Services Report is the codebook that describes reporting
formats and translation for codes used in the RSA-911 database. The RSA-911 database is
both mutually exclusive and exhaustive since data from consumers are classified into one
category (e.g., received job coaching, did not receive job coaching) and is exhaustive because
all data from consumers is placed into some type of category (Frankfor-Nachmias &
Nachmias, 1996, as cited in Boutin, 2006).

39
Additionally, it is acknowledged that some coding errors may exist within the data
since they are collected from an archived database. It should be noted, however, that two
separate parties monitor the RSA 911 database. The first party was the VR agency itself,
which is required to regularly review all consumer records involved with a caseload before
the information is officially passed on to RSA. Thus, it is assumed that each VR agency
systematically checks for errors in data recording. The second party that checks for errors in
the RSA 911 data is the central office assigned to each state VR agency. Agencies are given
a set amount of time to correct any inconsistencies or errors (i.e., anomalies) found within the
data that may have been overlooked by each individual unit (RSA, 2010).
Dependent Variables
Competitive Employment outcome was the primary dependent variable examined in
this study. It is a categorical variable with two levels: employed (Status 26) and not
employed (Status 28 or Status 30). According to RSA (2010), the variable successful
competitive employment is described as full or part time employment in an integrated setting,
becoming self employed, or employed in a state-managed Business Enterprise Program with
earnings either at or above federal or state minimum wage. Unsuccessful employment is
characterized as consumers who were not employed upon completion of VR services.
Eligibility status (i.e., acceptance for VR services) was the secondary dependent
variable examined in this study. This is a categorical variable with two levels: Status 08
(closed before eligibility, in which a consumer may be ineligible or withdraw from
eligibility) and Status 10 (acceptance, in which a consumer is certified by a VR counselor as
having a disability that results in a substantial impediment to employment, and the consumer
can benefit from VR services in terms of an employment outcome; RSA, 2010).
40
Block One Variables (Logistic Regression for Employment Outcomes)
Definitions outlined for each independent variable are based on information found in
the RSA-911 Case Service Report Manual (RSA, 2010). Explanations for coding decisions
with variables will be explained under each specific category of variables. Many of the
variables had to be recoded due to the lack of numbers in the population that disallowed
proper statistical analysis of hypotheses. All recoding decisions are explained.
Race/ethnicity. According to RSA (2010), race and ethnicity information should be
recorded for all consumers who applied for and/or received services through any state-federal
VR agency across the U.S. Furthermore, RSA (2010) assumes that many consumers should
willingly self-identify with the given racial/ethnic categories; however, it is explicitly stated,
“If a customer truly refuses to identify his/her race or Hispanic ethnicity status, the counselor
should, at a minimum notify respondents that if they fail to self-identify that observer-
identification may be used” (p.13). Likewise, those who identify as Latino/a must also
identify with at least one of the racial categories; however, if the consumer only chooses to
identify as Latino and does not identify with any of the racial categories, the VR counselor
must follow the same procedure outlined above. The options listed for this category that will
be considered for this study include Black or African American; American Indian or Alaska
Native; Asian; Native Hawaiian or Other Pacific Islander; and Hispanic or Latino. For the
current study, American Indian or Alaska Native; Asian; Native Hawaiian or Other Pacific
Islander; and Hispanic or Latino will be collapsed into one variable due to the lack of
numbers for these races and ethnicities. As a result, race and ethnicity was recoded as
combined race and ethnicity as value 0, White as value 1, and Black as value 2.
41
Age. This is a continuous variable that represents the age of the consumer based on
the date of birth provided at application.
Gender. This is a nominal variable rated as male or female. It should be noted,
though, that a consumer is not required to provide a response for this variable.
Level of education attained at application. This is a nominal variable with eight
categories: no formal schooling; elementary education (grades 1-8); secondary education, no
high school diploma (grades 9-12); special education certificate of completion/diploma or in
attendance; high school graduate or equivalency certificate (regular education students); post-
secondary education, no degree; associate’s degree or vocational/technical certificate;
bachelor’s degree; and master’s degree or higher. For the purposes of analysis, three values
were given to education level. No high school diploma or GED was value 0, high school or
GED was value 1, and associate’s degree or higher was value two.
Significant disability. This is a nominal variable that represents whether the
consumer had a significant disability at any time during the VR process (i.e., significant
disability, no significant disability). An individual is considered to have a significant
disability when s/he has a physical or mental impairment that seriously limits one or more
functional capacities towards successful employment (e.g., mobility, communication, self-
care, interpersonal skills, self-direction, work tolerance, work skills), when multiple VR
services can be expected over an extended period of time, and when s/he has one or more
physical or mental disabilities resulting from an amputation, arthritis, autism, blindness, burn
injury, cancer, cerebral palsy, cystic fibrosis, deafness, head injury, heart disease, hemiplegia,
hemophilia, respiratory or pulmonary dysfunction, mental retardation, mental impairment,
multiple sclerosis, muscular dystrophy, musculo-skeletal disorders, neurological disorders

42
(e.g., stroke, epilepsy), spinal cord conditions (e.g., paraplegia, quadriplegia), sickle cell
anemia, specific learning disability, end-stage renal disease, or another disability or
combination of disabilities that is diagnosed following an assessment used for eligibility
determination and specific VR needs.
Block Two Variables
Assessment. This is a nominal variable that refers to diagnostics performed to
determine a consumer’s eligibility for VR services as well as assisting with the types of
services that should be considered and/or included in the Individualized Plan of Employment
(IPE).
Diagnosis and treatment of impairments. This nominal variable includes types of
physical and mental restoration services needed to improve a physical or mental condition.
This can include corrective surgery or therapeutic treatment; diagnosis and treatment for
mental and emotional disorders; dentistry; nursing services; necessary hospitalization
(inpatient or outpatient) due to surgery or treatment; drugs and supplies; prosthetic, orthotic,
or other assistive devices including hearing aids; eyeglasses or visual services; podiatry;
physical therapy; occupational therapy; speech or hearing therapy; mental health services;
treatment of either acute or chronic medical complications and emergencies; special services
for treatment of end-stage renal disease; and other medical or medically related rehabilitation
services.
Vocational rehabilitation counseling and guidance. This is a nominal variable that
contains two levels (i.e., those who received this service and those who did receive this
service). Essentially, this service represents the rehabilitation counseling that may relate to
43
vocational, personal adjustment, medical, family, and social issues provided to a consumer as
needed to achieve and maintain a successful employment outcome.
Job readiness training. This is a nominal variable that represents the training a
consumer needs to prepare for work (e.g., appropriate work behaviors, punctuality, dressing
and grooming appropriately).
Job search assistance. This is a nominal variable that includes job search activities
such as resume preparation, job interview skills, and identifying appropriate job
opportunities.
Job placement assistance. This is a nominal variable that includes a referral to a
specific job.
Information and referral services. This is a nominal variable that includes services
offered at other agencies that are not offered through the VR program.
Data Analysis
For the first three research questions, the chi-square test of independence was used for
analysis. More detailed explanations will be provided in Chapter 4. For the last research
question, binary logistic regression was used to find variables that predicted successful
employment outcomes. As with the first three research questions, more detailed explanation
will be provided in Chapter 4.
44
Chapter 4: Results
The main objective of this study was to investigate salient variables within the state-
federal VR system that predict successful employment for people with criminal histories who
have mental impairment, which is a population that has not been previously explored in the
literature. As a result, a primary task of this study was to provide key descriptive statistics to
better illustrate who comprises the group of people who have mental impairments as well as
a criminal history. An exploration of descriptive statistics such as demographic information,
employment outcomes, employment acquired, services received, and reasons for closure was
conducted. In addition to providing descriptive statistics, another purpose of this study was to
investigate the relationship between selected control and predictor independent variables with
the dependent variable (i.e., competitive employment). In the first part of the chapter,
descriptive statistics are provided including population demographics. Then results for the
research questions are provided. The chapter ends with a final summary of results. Please
note all tables are located at the end of the chapter.
Descriptive Statistics for the Population
The original population for this study consisted of 3,637 people with criminal
histories from the state-federal VR program in FY 2010. Analysis revealed that a large
number (3,067, 85%) of the original population had a primary disability designation of
mental impairment. Further reductions were made from the focus population in the RSA-911
data set based on the desire to eliminate non-response bias. In an attempt to reduce or
completely eliminate response bias in the population, selected participants were removed
from the analysis of research questions two to four. The following categories were removed
based on the above rationale: unable to locate (n = 585), disability too significant (n = 9),

45
refused services (n = 169), death (n = 9), individual in institution (n = 428), transfer to
different agency (n =11), failure to cooperate (n = 289), no disabling condition (n = 12), no
impediments to employment (n = 25), transportation not feasible or available (n = 2), does
not require VR services (n = 11), and the category “all other reasons” (n = 170). These cases
will be treated as missing data. The majority of reasons for closure (48%) for people with
mental impairments and a criminal history came from four categories: unable to locate,
refused services, individual in institution, and failure to cooperate. It is assumed that none of
these categories are resultant from complications pertaining to the primary disability.
Implications of these categories will be further discussed in Chapter Five. The removal of the
above reasons for closures resulted in a reduction of population from 3,067 to 1,347 people
who achieved competitive employment.
Although research questions two through four were examined using the reduced
population of 1,347 people, research question one was examined using 3,067 participants.
My rationale for using the larger population for research question one was that the query
requires the inclusion of those previously described as missing data in order to get a more
accurate picture of successful closures. Due to the inclusion of the 3,067 participants in the
initial research question, demographic information will be provided on this larger population.
To be clear, outside of research question one, no other research question was analyzed using
the larger population.
There were 3,067 people with criminal histories and mental impairment who applied
to the state-federal VR program nationwide in FY 2010. Geographically, over half (58%) of
the population came from two states, Georgia (n = 1,122) and South Carolina (n = 643;
21%). Only four other states had applicants of 100 or more, Alabama (n = 100), Pennsylvania

46
(n = 109), Louisiana (n = 125), and Ohio (n = 128; see Table 1). The racial and ethnic
diversity among the population investigated can be found in Table 2.
Regarding gender and age, 84% (n = 2,575) were men and 16% (n = 492) were
women ranging from 16 to 70 years of age (M = 35.7, SD = 9.9). A full descriptive table of
all educational levels at application is presented in Table 3. Concerning highest level of
education at application, for the purpose of analysis, the data was recoded into three groups:
48.2% (n = 1,479) were high school graduates or had equivalency certificates, 37.8% (n =
1,159) did not complete high school, and 12.5% (n = 383) had post-secondary education
including no degree, associate’s (or vocational certification), bachelor’s, master’s, or a higher
degree. The level of education at application among the population investigated can be found
in Table 3.
Descriptive Statistics for the Independent Variables
The selection of mental impairment as the primary disability of focus is based on the
large percentage (85%) of people with this diagnosis in the state-federal VR data FY 2010.
Within the mental impairment category, 14.2% (n = 435) had a cognitive impairment, 68.8%
(n = 2,109) had a psychosocial impairment, and 17.1% (n = 523) had some other mental
impairments not specified in the codebook.
Types of closures and reasons for closure are closely related for the current study.
The inclusion of type of closure is to further illustrate the reduction of the population based
on the reasons for closures. Regarding type of closure, 8.8% (n = 269) exited as an applicant,
before eligibility; 0.1% (n = 4) exited during or after extended evaluation, before eligibility;
43.9% (n = 1,347) exited with employment; 28.8% (n = 884) exited without employment,
after receiving services; 1% (n = 32) exited after eligibility but before receiving services;

47
1.1% (n = 33) exited from an order of selection waiting list; and 16.2% (n = 498) exited after
eligibility, but before an individualized plan for employment (IPE) was developed. Thus,
86.9% (n = 2,794) were accepted for services and 8.9% (n = 273) were not accepted. The
rehabilitation acceptance rate was determined by dividing the number of applicants who
closed with employment (n = 1,347) by the number of applicants who closed with
employment (n = 1,347) plus the number of applicants who closed without employment after
receiving services (n = 884). This statistic resulted in a rehabilitation acceptance rate of
60.4%. The types of closures among the population investigated can be found in Table 4.
The reasons for closure among the population investigated can be found in Table 5.
Research Questions
Data in this study were analyzed using SPSS version 21.0 (SPSS, 2012). Descriptive
statistics were used to describe the demographic characteristics of the population and the
types of services they received. To answer the research questions, two types of analyses
were used. First, a chi-square test of independence was used to test VR closure by
race/ethnicity, types of services, and reasons for closure. For the chi-square test of
independence statistic, standardized residual scores and expected versus observed counts
were discussed to better explicate the results. Then, a binary logistic regression analysis was
used to test consumer demographic variables, VR service variables, and employment status at
case closure.
Research Question One: Employment Outcome by Race/Ethnicity
Research Question 1 examined whether there were ethnic/racial differences among
individuals with criminal histories and mental impairment who received VR services. In
other words, were there differences (dependence) among Blacks, Whites, American
48
Indians/Alaska Natives, Asians, Native Hawaiians/Other Pacific Islanders, and Latino/as in
exiting the VR program with an employment outcome? This question was investigated with
a 6 x 2 chi square test of independence. This was a 2 (type of closure) X 6 (race/ethnicity)
design. Type of closure consisted of two categories: (a) exited with an employment outcome
and (b) exited without an employment outcome after receiving services. The analysis found
statistically significant difference (dependence) among Blacks, Whites, American
Indian/Alaska Natives, Asians, and Native Hawaiian/Other Pacific Islanders in exiting the
system with a Status 26 (successfully closed), X2(N = 3,067) = 64.9, p < .001.
The overall count (i.e. successful employment, unsuccessful employment) for the
combined racial/ethnic group (Latino, Native American, Asian, and Pacific Islander) was two
hundred. Of the 200 people in the combined racial/ethnic group, 30% were successfully
employed. For Whites, the overall count was 1,280 people, of which 38% were successfully
employed. For Blacks, the overall count was 1,581, of which 51% were successfully
employed. By comparison, Blacks experienced more favorable outcomes with achieving
successful employment than their racial/ethnic counterparts.
For the combined racial/ethnic group, the model produced an expected count of
nearly 88 individuals that would be successfully employed, while 59 individuals were
observed in the data for those successfully employed. The standardized residual was -3.1(p <
.01), which indicates that when an individual was one of the combined races/ethnicities they
were less likely to be in competitive employment than the model posited. The chi-square
model for Whites produced an expected count of 560 individuals successfully employed,
while 483 were observed in the data for those successfully employed. The standardized
residual was -3.3 (p <.001), which indicates that Whites were less likely to have successful

49
competitive employment outcomes than the suggested model. While the combined racial
ethnic and White categories showed a significant inverse relationship to successful closure,
Blacks were employed far above what the chi-square model predicted. The expected count
for Blacks was 693 individuals, while the observed count was 799. The standardized residual
was 4.0 (p < .001), showing that Blacks actually exceeded the models expectations for
successful closure. Successful closure rates ranged from 29% to 51% with an overall
rehabilitation rate of 43.9%. A cross-tabulation of race/ethnicity by type of closure is
presented in Table 6.
Research Question Two: Types of Services by Race/Ethnicity
Research Question 2 examined whether there were differences in the types of services
received among Blacks, Whites, American Indian/Alaska Native, Asian Americans, Native
Hawaiian/Other Pacific Islander, and Latino/as with criminal histories and mental
impairment. R2 was examined with chi-square test of independence. This was a 7 (type of
service) X 6 (race/ethnicity) design. Type of services consisted of seven case service
variables (assessment, diagnosis/treatment, counseling/guidance, job readiness assistance, job
search assistance, job placement assistance, and information and referral) based on prior
literature on racial and ethnic minorities. The analysis found statistical significance
(dependence) among Blacks, Whites, American Indian/Alaska Natives, Asians, Native
Hawaiian/Other Pacific Islanders and Latino/as with MI, in the types of services received.
For Assessment, X2(N = 3,067) = 84.5, p < .001. For Diagnosis and Treatment of
Impairments, X2(N = 3,067) = 48.4, p < .001. For Counseling and Guidance, X2(N = 3,067) =
21.7, p < .001. For Job Readiness Training, X2(N = 3,067) = 6.4, p < .05. For Job Search
Assistance, X2(N = 3,067) = 22.5, p < .001. For Job Placement Assistance, X2(N = 3,067) =
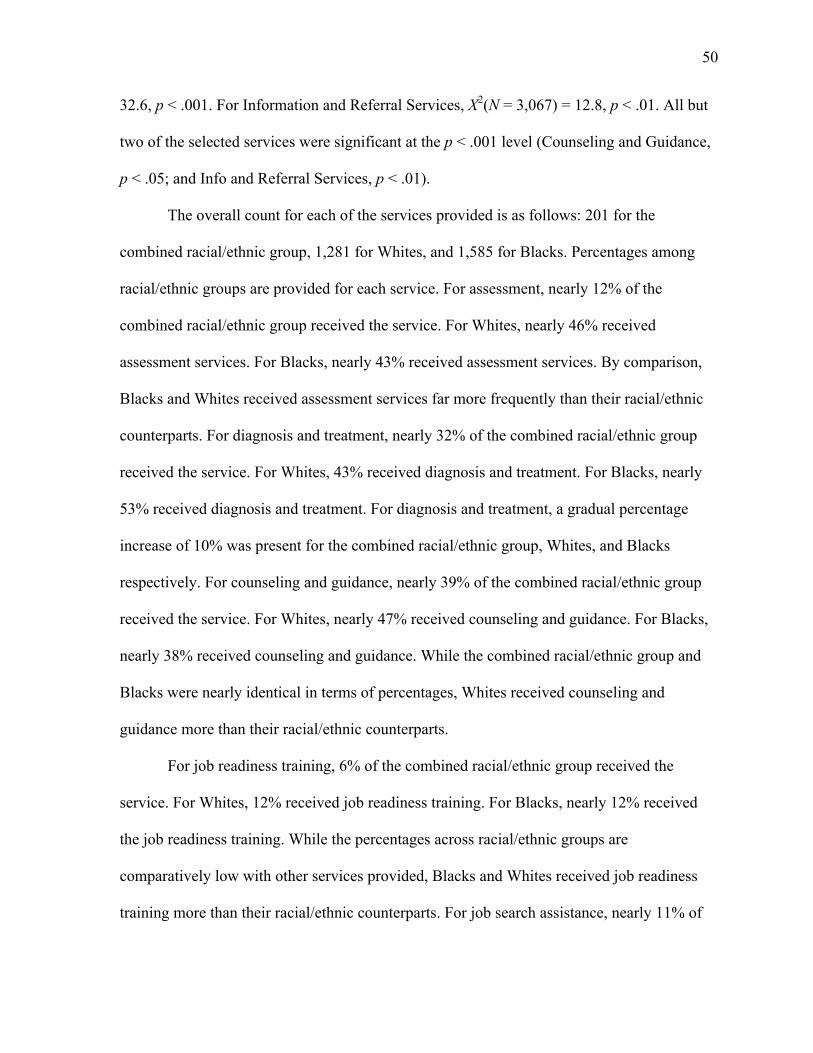
50
32.6, p < .001. For Information and Referral Services, X2(N = 3,067) = 12.8, p < .01. All but
two of the selected services were significant at the p < .001 level (Counseling and Guidance,
p < .05; and Info and Referral Services, p < .01).
The overall count for each of the services provided is as follows: 201 for the
combined racial/ethnic group, 1,281 for Whites, and 1,585 for Blacks. Percentages among
racial/ethnic groups are provided for each service. For assessment, nearly 12% of the
combined racial/ethnic group received the service. For Whites, nearly 46% received
assessment services. For Blacks, nearly 43% received assessment services. By comparison,
Blacks and Whites received assessment services far more frequently than their racial/ethnic
counterparts. For diagnosis and treatment, nearly 32% of the combined racial/ethnic group
received the service. For Whites, 43% received diagnosis and treatment. For Blacks, nearly
53% received diagnosis and treatment. For diagnosis and treatment, a gradual percentage
increase of 10% was present for the combined racial/ethnic group, Whites, and Blacks
respectively. For counseling and guidance, nearly 39% of the combined racial/ethnic group
received the service. For Whites, nearly 47% received counseling and guidance. For Blacks,
nearly 38% received counseling and guidance. While the combined racial/ethnic group and
Blacks were nearly identical in terms of percentages, Whites received counseling and
guidance more than their racial/ethnic counterparts.
For job readiness training, 6% of the combined racial/ethnic group received the
service. For Whites, 12% received job readiness training. For Blacks, nearly 12% received
the job readiness training. While the percentages across racial/ethnic groups are
comparatively low with other services provided, Blacks and Whites received job readiness
training more than their racial/ethnic counterparts. For job search assistance, nearly 11% of

51
the combined racial/ethnic group received the service. For Whites, nearly 22% received job
search assistance. For Blacks, nearly 26% received job search assistance. The combined
racial/ethnic group received job search assistance significantly less than Whites and Blacks.
For job placement, nearly 20% of the combined racial/ethnic group received the service. For
Whites, nearly 30% received job placement. For Blacks, nearly 37% received job placement.
Blacks received job placement services slightly more than their White counterparts, and far
more than the combined racial/ethnic group. For information and referral services, 8% of the
combined racial/ethnic group received the service. For Whites, nearly 7% received
information and referral services. For Blacks, nearly 4% received information and referral
services. While the percentages across racial/ethnic groups are comparatively low with other
services provided, Whites and the combined racial/ethnic group received information and
referral services more than Blacks.
The chi-square statistic provided data on expected versus observed data based on the
model. As each model was found to be statistically significant, valid results can be drawn
from the data. For Assessment, the combined racial/ethnic category had a model that had an
expected count of nearly 67 people, whereas the observed count was 117 with a 6.1 standard
residual. This finding reveals that significantly more people in the combined racial and ethnic
category received the service than expected. For Whites, the expected count was 426 people,
whereas the observed count was 466 with a 1.9 standard residual. The count for Whites is
fairly close, suggesting that slightly more Whites received the service than expected. Blacks
were the lone group to experience fewer observed numbers than expected. Blacks had an
expected count of 528 people and an observed count of 438 with a -3.9 standard residual. The
finding shows that significantly fewer Blacks received the service than expected.
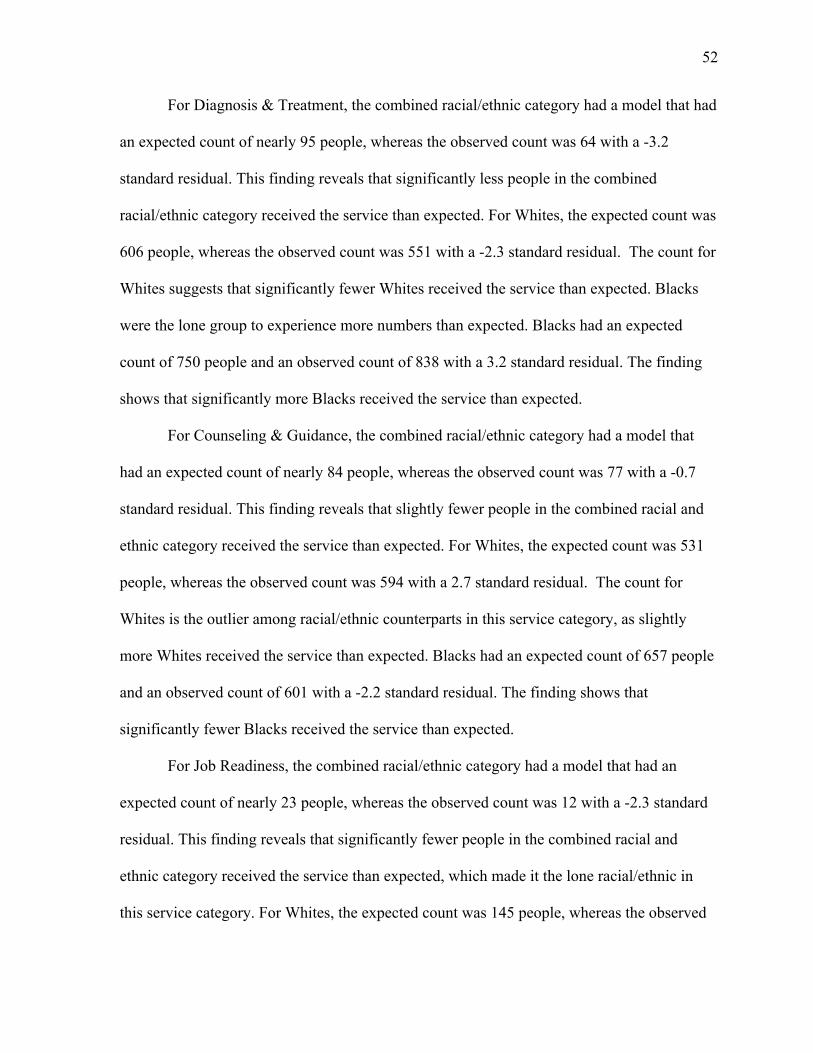
52
For Diagnosis & Treatment, the combined racial/ethnic category had a model that had
an expected count of nearly 95 people, whereas the observed count was 64 with a -3.2
standard residual. This finding reveals that significantly less people in the combined
racial/ethnic category received the service than expected. For Whites, the expected count was
606 people, whereas the observed count was 551 with a -2.3 standard residual. The count for
Whites suggests that significantly fewer Whites received the service than expected. Blacks
were the lone group to experience more numbers than expected. Blacks had an expected
count of 750 people and an observed count of 838 with a 3.2 standard residual. The finding
shows that significantly more Blacks received the service than expected.
For Counseling & Guidance, the combined racial/ethnic category had a model that
had an expected count of nearly 84 people, whereas the observed count was 77 with a -0.7
standard residual. This finding reveals that slightly fewer people in the combined racial and
ethnic category received the service than expected. For Whites, the expected count was 531
people, whereas the observed count was 594 with a 2.7 standard residual. The count for
Whites is the outlier among racial/ethnic counterparts in this service category, as slightly
more Whites received the service than expected. Blacks had an expected count of 657 people
and an observed count of 601 with a -2.2 standard residual. The finding shows that
significantly fewer Blacks received the service than expected.
For Job Readiness, the combined racial/ethnic category had a model that had an
expected count of nearly 23 people, whereas the observed count was 12 with a -2.3 standard
residual. This finding reveals that significantly fewer people in the combined racial and
ethnic category received the service than expected, which made it the lone racial/ethnic in
this service category. For Whites, the expected count was 145 people, whereas the observed

53
count was 154 with a 0.7 standard residual. The count for Whites is fairly close, suggesting
that slightly more Whites received the service than expected. Blacks had an expected count
of 180 people and an observed count of 182 with a 0.2 standard residual. The finding shows
that the model was nearly perfect for Blacks who received the job readiness service.
For Job Placement, the combined racial/ethnic category had a model that had an
expected count of nearly 65 people, whereas the observed count was 39 with a -3.2 standard
residual. This finding reveals that significantly fewer people in the combined racial and
ethnic category received the service than expected. For Whites, the expected count was
nearly 415 people, whereas the observed count was 376 with a -1.9 standard residual.
Significantly fewer Whites received the service than expected. Blacks were the lone group to
experience more observed numbers than expected. Blacks had an expected count of nearly
513 people and an observed count of 577 with a 2.8 standard residual. The finding reveals
that significantly more Blacks received the service than expected.
For Information and Referral Services, the combined racial/ethnic category had a
model that had an expected count of nearly 11 people, whereas the observed count was 16
with a 1.7 standard residual. This finding reveals that slightly more people in the combined
racial and ethnic category received the service than expected. For Whites, the expected count
was nearly 67 people, whereas the observed count was 82 with a 1.9 standard residual.
Significantly more Whites received the service than expected. Blacks were the lone group to
experience fewer observed numbers than expected. Blacks had an expected count of nearly
83 people and an observed count of 61 with a -2.3 standard residual. The finding shows that
significantly fewer Blacks received the service than expected. A cross-tabulation of
race/ethnicity by type of closure is presented in Table 7.

54
Research Question Three: Reasons for Closure by Race/Ethnicity
Research Question 3 examined whether there were differences in unsuccessful
closures among Blacks, Whites, American Indian/Alaska Native, Asian Americans, Native
Hawaiian/Other Pacific Islander, and Latino/as with criminal histories and mental
impairment. R3 was investigated with a 10 (reason for closure) X 6 (race/ethnicity) chi-
square test for independence. Reason for closure consisted of unable to locate or contact,
disability too significant to benefit from VR services, refused services or further services,
death, individual in institution, transferred to another agency, failure to cooperate,
transportation not feasible or available, extended services not available, and all other reasons.
Cases in this analysis included participants who exited the VR program without employment
after receiving services.
Since over 36% of the cells did not meet the 5 or more expected frequency
requirement for a valid chi square result (Preacher, 2001), the decision was made to collapse
this variable into five categories (unable to locate, refused services, individual in institution,
failure to cooperate, and all other closure reasons) and re-analyze the data using the same
statistical procedure. Subsequent re-analysis indicated that there are statistically significant
differences in the closure reasons found among Blacks (non-Latinos), Whites, American
Indian/Alaska Natives, Asians, and Native Hawaiian/Other Pacific Islanders with MI, X2(N =
1,720) = 20.01, p < .05.
The overall counts for reasons for closure are as follows: 585 for unable to locate, 169
for refused services, 428 for individual in institution, 289 for failure to cooperate, and 249 for
all other reasons. For unable to locate, nearly 25% of the combined racial ethnic group closed
for this reason. For Whites, nearly 22% closed as unable to locate. For Blacks, nearly 17%

55
closed as unable to locate. The combined racial/ethnic group had a higher percentage for
unable to locate than their White and Black counterparts. For refused services, nearly 8% of
the combined racial ethnic group closed for this reason. For Whites, nearly 8% as well closed
as refused services. For Blacks, nearly 4% closed as refused services. While Whites and the
combined racial/ethnic group were identical in their percentage of closure rates, Blacks
experienced the lowest percentage of those closed as refused services. For individual
institution, nearly 16% of the combined racial/ethnic group closed for this reason. For
Whites, nearly 14% closed as individual in institution. For Blacks, nearly 15% closed as
individual in institution. Among each racial/ethnic category, percentages were nearly
identical for those closed as individual in institution. For failure to cooperate, nearly 11% of
the combined racial/ethnic group closed as failure to cooperate. For Whites, nearly 11%
closed as failure to cooperate, compared with Blacks at nearly 9 percent. Again, the
percentages for failure to cooperate are nearly identical for all racial/ethnic categories with
Blacks slightly lower than their White and combined racial/ethnic counterparts. For all other
reasons, nearly 12% of the combined racial/ethnic group closed for these reasons. For
Whites, nearly 10% closed as all other reasons, compared to Blacks at nearly 7%. Blacks
were least likely to close for all other reasons than Whites or the combined racial/ethnic
category.
For Unable to Locate, the combined racial/ethnic category had a model that had an
expected count of nearly 38 people, whereas the observed count was 49 with a 1.7 standard
residual. This finding reveals that slightly more people in the combined racial and ethnic
category were closed as unable to locate than expected. For Whites, the expected count was
nearly 245 people, whereas the observed count was 272 with a 1.8 standard residual. For

56
Whites the observed count is slightly more than expected. Blacks were the lone group to
experience fewer observed numbers than expected. Blacks had an expected count of nearly
303 people and an observed count of 264 with a -2.2 standard residual. The finding shows
that significantly fewer Blacks were closed as unable to locate than expected.
For Refused Services, the combined racial/ethnic category had a model that had an
expected count of nearly 12 people, whereas the observed count was 15 with a 1.2 standard
residual. This finding reveals that slightly more people in the combined racial and ethnic
category were closed as refused services than expected. For Whites, the expected count was
nearly 71 people, whereas the observed count was 94 with a 2.8 standard residual. For
Whites the observed count for those closed as refused services is significantly more than
expected. Blacks were again (i.e. Unable to Locate), the lone group to experience fewer
observed numbers than expected. Blacks had an expected count of nearly 88 people and an
observed count of 60 with a -2.9 standard residual. The finding shows that significantly fewer
Blacks were closed as refused services than expected.
For Individual in Institution, the combined racial/ethnic category had a model that
had an expected count of 28 people, whereas the observed count was 32 with a 0.7 standard
residual. This finding reveals that slightly more people in the combined racial and ethnic
category were closed as individual in institution than expected. For Whites, the expected
count was nearly 179 people, whereas the observed count was 171 with a -0.6 standard
residual. For Whites, the observed count for those closed as individual in institution is
slightly less than expected. Blacks had an expected count of nearly 222 people and an
observed count of 225 with a 0.3 standard residual. The finding shows that the observed
count was closely aligned with the expected count.

57
For Failure to Cooperate, the combined racial/ethnic category had a model that had an
expected count of nearly 19 people, whereas the observed count was 21 with a 0.5 standard
residual. This finding reveals that slightly more people in the combined racial and ethnic
category were closed as failure to cooperate than expected. For Whites, the expected count
was nearly 121 people, whereas the observed count was 133 with a 1.1 standard residual.
For Whites, the observed count for people closed as failure to cooperate is slightly more than
expected. Blacks had an expected count of nearly 150 people and an observed count of 135
with a -1.2 standard residual. The finding showed that Blacks were slightly less likely than
closed as failure to cooperate than expected.
For All other Reasons (i.e. disability too significant to benefit from VR services,
death, transferred to another agency, transportation not feasible or available, extended
services not available), the combined racial/ethnic category had a model that had an expected
count of nearly 17 people, whereas the observed count was 24 with a 1.9 standard residual.
This finding reveals that more people in the combined racial and ethnic category were closed
as for all other reasons than expected. For Whites, the expected count was 104 people,
whereas the observed count was 127 with a 2.3 standard residual. For Whites, the observed
count for people closed for all other reasons was significantly more than expected. Blacks
had an expected count of nearly 150 people and an observed count of 135 with a -2.7
standard residual. The finding showed that significantly fewer Blacks were closed for all
other reasons than expected.. Results of this cross-tabulation and Chi-square test are shown
in Table 8.
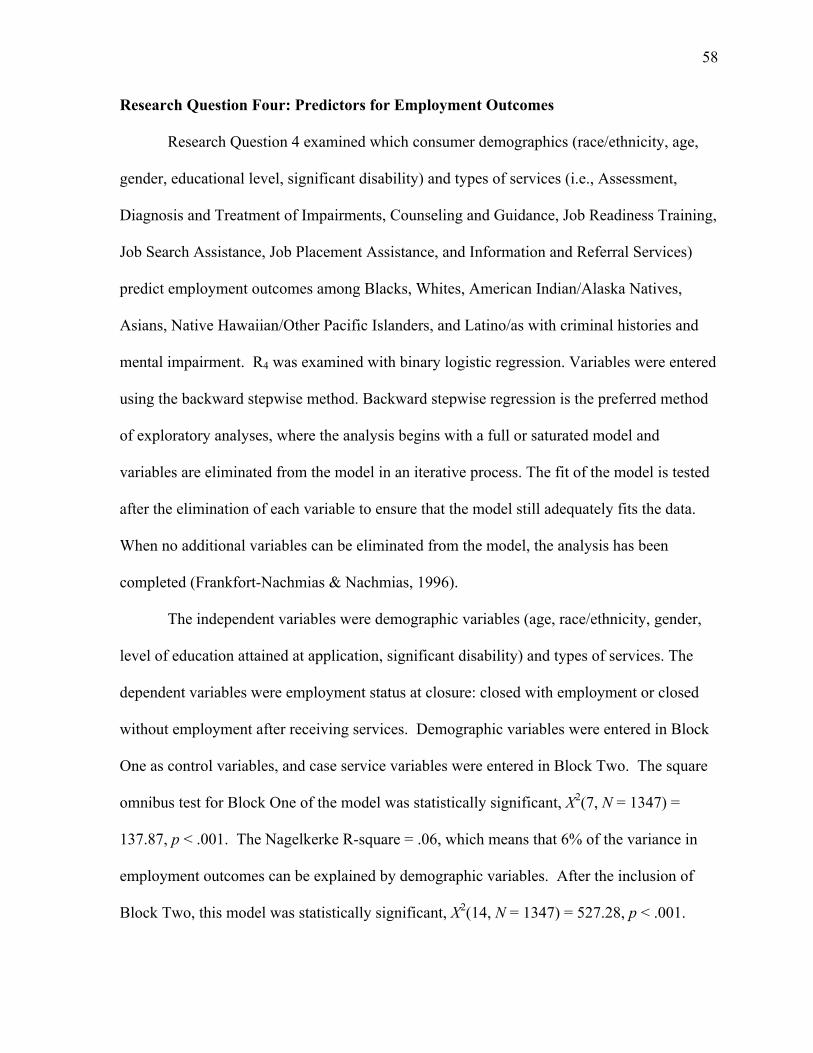
58
Research Question Four: Predictors for Employment Outcomes
Research Question 4 examined which consumer demographics (race/ethnicity, age,
gender, educational level, significant disability) and types of services (i.e., Assessment,
Diagnosis and Treatment of Impairments, Counseling and Guidance, Job Readiness Training,
Job Search Assistance, Job Placement Assistance, and Information and Referral Services)
predict employment outcomes among Blacks, Whites, American Indian/Alaska Natives,
Asians, Native Hawaiian/Other Pacific Islanders, and Latino/as with criminal histories and
mental impairment. R4 was examined with binary logistic regression. Variables were entered
using the backward stepwise method. Backward stepwise regression is the preferred method
of exploratory analyses, where the analysis begins with a full or saturated model and
variables are eliminated from the model in an iterative process. The fit of the model is tested
after the elimination of each variable to ensure that the model still adequately fits the data.
When no additional variables can be eliminated from the model, the analysis has been
completed (Frankfort-Nachmias & Nachmias, 1996).
The independent variables were demographic variables (age, race/ethnicity, gender,
level of education attained at application, significant disability) and types of services. The
dependent variables were employment status at closure: closed with employment or closed
without employment after receiving services. Demographic variables were entered in Block
One as control variables, and case service variables were entered in Block Two. The square
omnibus test for Block One of the model was statistically significant, X2(7, N = 1347) =
137.87, p < .001. The Nagelkerke R-square = .06, which means that 6% of the variance in
employment outcomes can be explained by demographic variables. After the inclusion of
Block Two, this model was statistically significant, X2(14, N = 1347) = 527.28, p < .001.

59
The Nagelkerke R-square = .21, which indicated that 21% of the variance in employment
outcomes can be explained by demographic and case service variables.
The demographic variables that were statistically significant for successful
employment were gender, age, and race/ethnicity. Gender and race/ethnicity were entered as
categorical variables. Male was coded as value one, and female was coded as value two. The
coding for racial and ethnicity was combined race/ethnicity (American Indian/Alaska
Natives, Asians, and Native Hawaiian/Other Pacific Islanders) with the value 0, Whites the
value 1, and Blacks the value 2. Although education was not found to be significant, it was
also entered as a categorical variable with less than high school with the value 0, high school
or Graduate Equivalency Diploma (GED) the value 1, and associate’s degree or higher the
value 2. Age was entered as a covariate, non-categorical variable. For gender, the odds (O)
value was 1.82 with a p value < .0005, meaning that men were nearly twice as likely to
obtain successful employment than women. For age, the odds value was 1.03 with a p value
< of .0005, meaning the younger an individual was, the more likely he/she was to obtain
successful employment. For race and ethnicity the combined race and ethnicity was the
comparison groups for Whites and Blacks. The logistic regression analysis found that based
on the odds (.58), Whites were 58% less likely to obtain a successful employment outcome
than the combined racial and ethnic comparison group. Blacks were 73% (odds, .73) as likely
to obtain a successful employment outcome than the combined racial and ethnic comparison
group.
The service variables that were statistically significant for successful employment
were diagnosis/treatment, job readiness assistance, and job placement. If participants
received job readiness, the odds (.49), value p < .0005 indicated that they would be 49% as

60
likely to achieve a successful employment outcome than those who did not receive the
service. For diagnosis and treatment, the odds (3.42), p value < .0005 indicated they would
be over three times as likely than those who did not receive the service to reach a successful
employment outcome. In addition, consumers who received job placement had odds (3.39), p
value < .0005 indicating that participants who received the service were well over three times
as likely to achieve a successful employment outcome than those who did not get the service.
These results are presented in Table 9.
Summary of Findings
Four research questions and associated hypotheses were tested. All three were found
to be statistically significant. Significant differences were observed in type of closure,
employment status at closure, types of services, and reasons for closure among Blacks (non-
Latinos), Whites, American Indian/Alaska Natives, Asians, Native Hawaiian/Other Pacific
Islanders and Latino/as with a history and incarceration and mental impairment. The
rehabilitation rate for this population was 43.9%.
Hierarchical logistic binary regression was used to investigate the predictors of
employment. The square omnibus test for Block One of the model was statistically
significant, X2(7, N = 1347) = 137.87, p < .001. The Nagelkerke R-square for demographic
variables was .06. The model after the inclusion of Block Two was statistically significant,
X2(14, N = 1347) = 527.28, p < .001. The Nagelkerke R-square = .21, which indicated that
21% of the variance in employment outcomes can be explained by demographic and case
service variables. Among the demographic variables, gender, age, and race/ethnicity were
statistically significant variables on successful employment. For age, the odds value was 1.03
with a p value of .000, meaning that the younger an individual was, the more likely he/she

61
was to obtain successful employment. For race and ethnicity the combined race and ethnicity
was the comparison groups for Whites and Blacks. The logistic regression analysis found that
based on the odds (.58), Whites were 58% as likely to obtain a successful employment
outcome than their counterparts. Blacks were 73% (odds, .73) as likely to obtain a successful
employment outcome than their counterparts.
Among the significant case service variables, job readiness, job placement, and
diagnosis had a significant effect on successful employment. If participants received job
readiness, the odds (.49), p value < .0005 found that they would be 49% as likely to achieve a
successful employment outcome. For diagnosis and treatment the odds (3.42), p value .000
found that they would be over three times as likely than those who did not receive the service
to reach a successful employment outcome. In addition, consumers who received job
placement had odds (3.39), p value .000 indicating that participants who received the service
were well over three times a likely to achieve a successful employment outcome than those
who did not get the service. A summary of findings among the population investigated can be
found in Table 10. Implications of these findings will be discussed in Chapter Five.
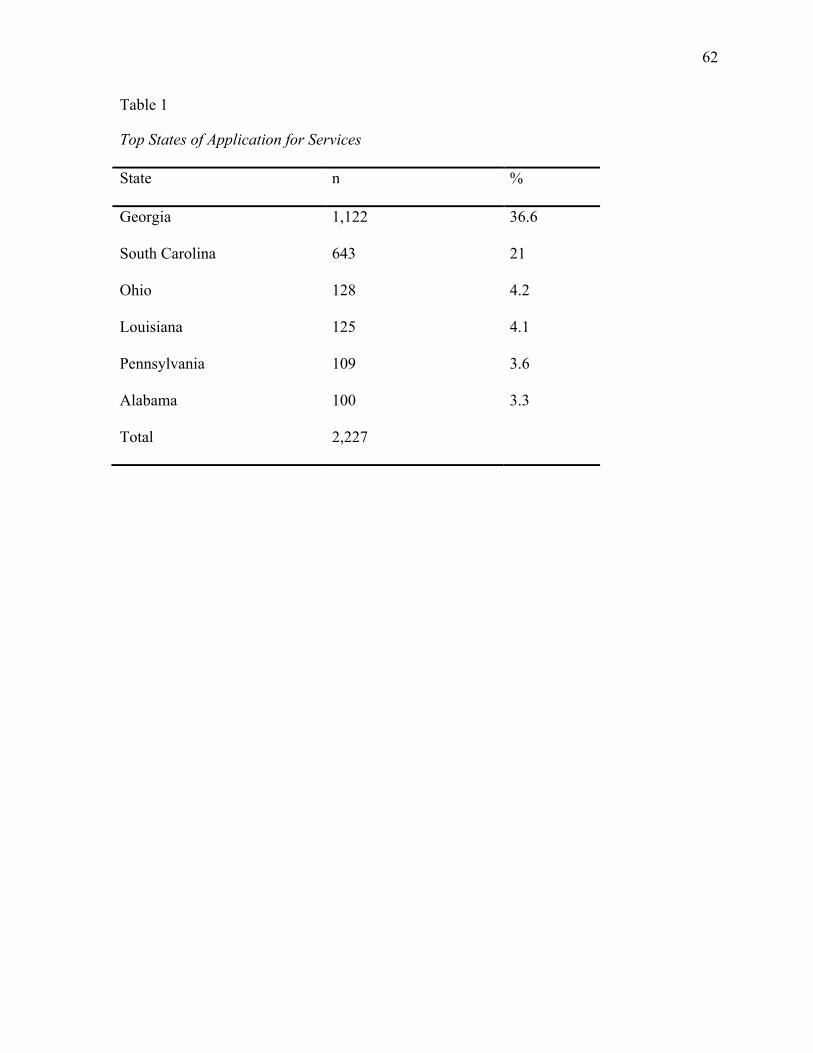
62
Table 1
Top States of Application for Services
State n %
Georgia 1,122 36.6
South Carolina 643 21
Ohio 128 4.2
Louisiana 125 4.1
Pennsylvania 109 3.6
Alabama 100 3.3
Total 2,227

63
Table 2
Race/Ethnicity
Race/Ethnicity n %
Black, Non Latino/a-Hispanic 1,585 51.7
White, Non Latino/a-Hispanic 1,281 41.8
Latino/a-Hispanic 98 3.2
American Indian/Alaska Native 72 2.3
Asian 7 .2
Native Hawaiian/Pacific Islander 24 .8
Total 3,067 100.0

64
Table 3
Highest Education Level at Application
Highest Education N % Cumulative
%
No formal schooling 13 .4 .5
Elementary education (grades 1-8) 162 5.3 5.7
Secondary education (no high school
diploma (grades 9-12) 983 32.1 37.8
Special education certificate of
completion/diploma or in attendance) 46 1.5 39.3
High school graduate or equivalency
certificate (regular education students) 1,479 48.2 87.5
Post-secondary education, no degree 230 7.5 95
Associate degree or Vocational/Technical
Certificate 109 3.6 98.6
Bachelor's degree 38 1.2 99.8
Master's degree or higher 6 .2 100.0
Total 3,067

65
Table 4
Type of Closure
Type of Closure n %
Exited as an applicant, before eligibility 269 8.8
Exited during/after trial work experience/extended evaluation, before
eligibility 4 .1
Exited with an employment outcome 1,347 52.8
Exited after services, without an employment outcome 884 28.8
Exited without employment, after signed IPE, but before receiving services 32 1
Exited from an order of selection waiting list 33 1.1
Exited without an employment outcome, after eligibility, before an IPE 498 16.2
Total 3,067 100.0

66
Table 5
Reasons for Closure
Reason for Closure n %
Employed 1,347 43.9
Unable to locate 585 19.1
Disability too significant 9 .3
Refused Services 169 5.5
Individual in institution (e.g. prison, jail, treatment center) 428 14
Transfer to a different agency 11 .4
Failure to cooperate 289 9.4
No disabling condition (no mental impairment exists) 12 .4
No impediment to employment (mild to no MI) 25 .8
Transportation not feasible or available 2 .1
Does not require VR services 11 .4
All other reasons 170 5.5
Total 3,067 100.0

67
Table 6
Cross-tabulation of Race/Ethnicity by Type of Closure
Type of Closure Employed Not Employed TOTAL
White 484 797 1,281
% within
race/ethnicity
37.8% 62.2% 100%
% of total 15.8% 26% 41.8%
Black, non-Latino 803 782 1,585
% within
race/ethnicity
50.7% 49.3% 100%
% of total 26.2% 25.5% 51.7%
Combined R & E 60 141 201
% within
race/ethnicity
29.9% 70.1% 100%
% of total 2% 4.6% 6.6%
Total 1,347 1,720 3,067
% within
race/ethnicity
43.9% 56.1% 100%
% of total 43.9% 56.1% 100%

68
Table 7
Selected VR Services Provided by Race/Ethnicity
VR Service White Black,
non-
Latino
Combined R&E Total
Assessment 466 438 117 1,021
% within service 45.6% 42.9% 11.5% 100%
% within
race/ethnicity
36.4% 27.6% 58.2% 33.3%
% of total 15.2% 14.3% 3.8% 33.3%
Counseling/Guidance 594 601 77 1,272
% within service 46.7% 47.2% 6.1% 100%
% within
race/ethnicity
46.4% 37.9% 38.3% 41.5%
% of total 19.4% 19.6% 2.5% 41.5%
Diagnosis &
Treatment
551 838 64 1453
% within service 37.9% 57.7% 4.4% 100%
% within
race/ethnicity
43% 52.9% 31.8% 47.4%
% of total 18% 27.3% 2.1% 47.4%
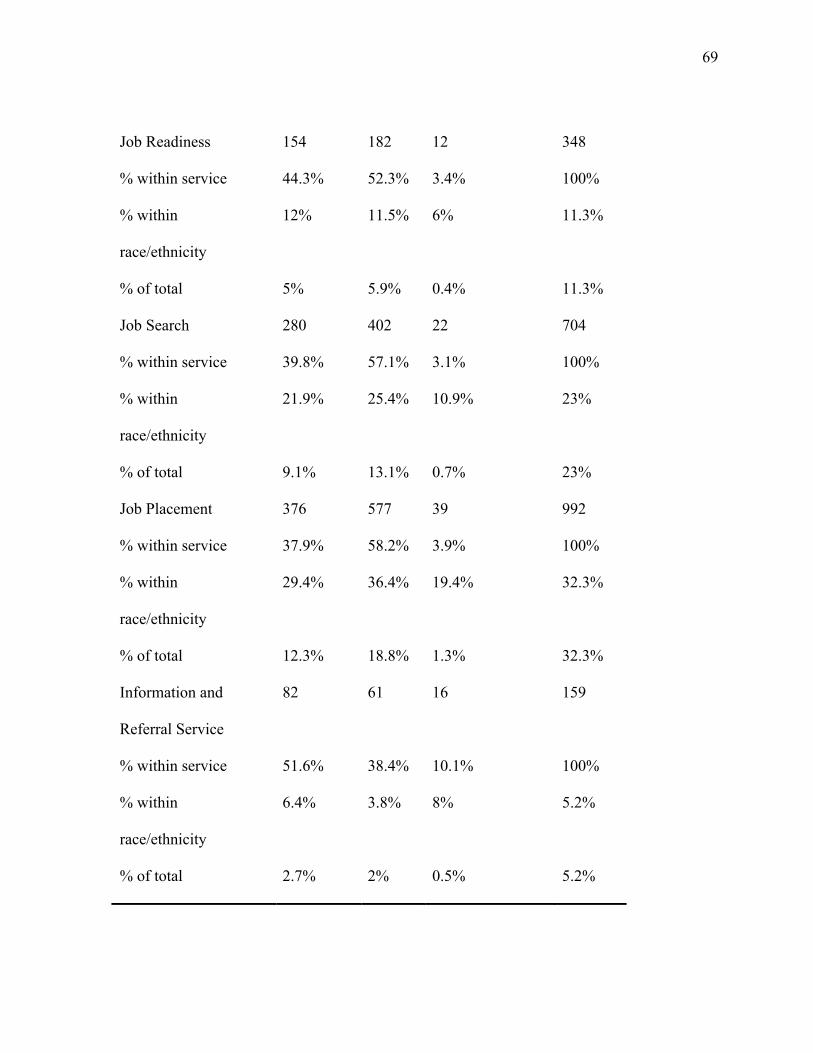
69
Job Readiness 154 182 12 348
% within service 44.3% 52.3% 3.4% 100%
% within
race/ethnicity
12% 11.5% 6% 11.3%
% of total 5% 5.9% 0.4% 11.3%
Job Search 280 402 22 704
% within service 39.8% 57.1% 3.1% 100%
% within
race/ethnicity
21.9% 25.4% 10.9% 23%
% of total 9.1% 13.1% 0.7% 23%
Job Placement 376 577 39 992
% within service 37.9% 58.2% 3.9% 100%
% within
race/ethnicity
29.4% 36.4% 19.4% 32.3%
% of total 12.3% 18.8% 1.3% 32.3%
Information and
Referral Service
82 61 16 159
% within service 51.6% 38.4% 10.1% 100%
% within
race/ethnicity
6.4% 3.8% 8% 5.2%
% of total 2.7% 2% 0.5% 5.2%
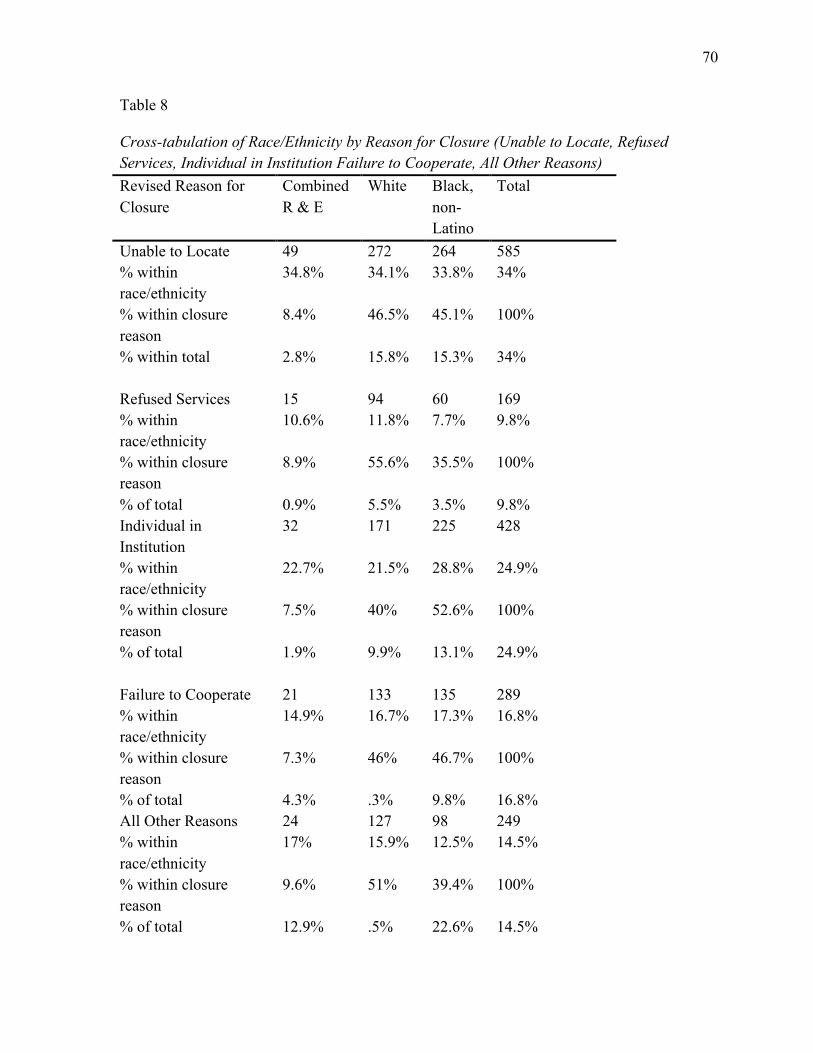
70
Table 8
Cross-tabulation of Race/Ethnicity by Reason for Closure (Unable to Locate, Refused Services, Individual in Institution Failure to Cooperate, All Other Reasons) Revised Reason for Closure
Combined R & E
White Black, non-Latino
Total
Unable to Locate 49 272 264 585 % within race/ethnicity
34.8% 34.1% 33.8% 34%
% within closure reason
8.4% 46.5% 45.1% 100%
% within total 2.8% 15.8% 15.3% 34% Refused Services 15 94 60 169 % within race/ethnicity
10.6% 11.8% 7.7% 9.8%
% within closure reason
8.9% 55.6% 35.5% 100%
% of total 0.9% 5.5% 3.5% 9.8% Individual in Institution
32 171 225 428
% within race/ethnicity
22.7% 21.5% 28.8% 24.9%
% within closure reason
7.5% 40% 52.6% 100%
% of total 1.9% 9.9% 13.1% 24.9% Failure to Cooperate 21 133 135 289 % within race/ethnicity
14.9% 16.7% 17.3% 16.8%
% within closure reason
7.3% 46% 46.7% 100%
% of total 4.3% .3% 9.8% 16.8% All Other Reasons 24 127 98 249 % within race/ethnicity
17% 15.9% 12.5% 14.5%
% within closure reason
9.6% 51% 39.4% 100%
% of total 12.9% .5% 22.6% 14.5%

71
Total 141 797 782 1720 % within race/ethnicity
100% 100% 100% 100%
% within closure reason
8.2% 46.3% 45.5% 100%
% of total 8.2% 46.3% 45.5% 100%
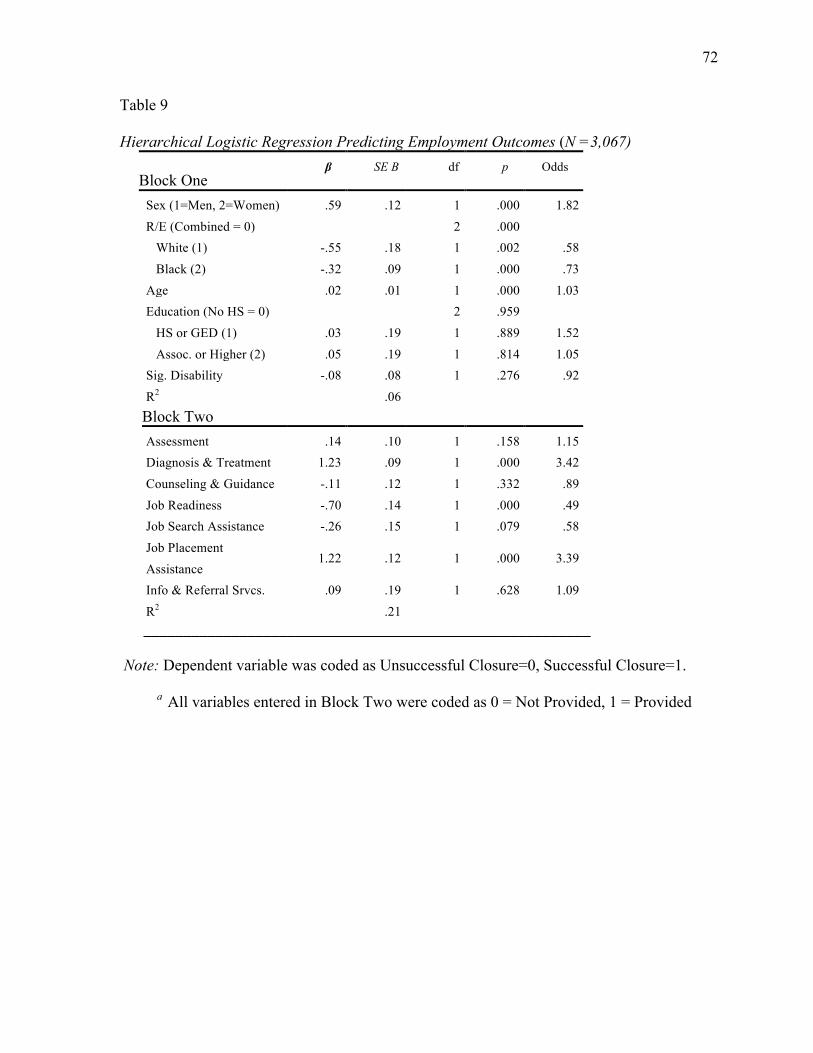
72
Table 9
Hierarchical Logistic Regression Predicting Employment Outcomes (N =3,067) Block One
β SE B df p Odds
Sex (1=Men, 2=Women) .59 .12 1 .000 1.82 R/E (Combined = 0) 2 .000 White (1) -.55 .18 1 .002 .58 Black (2) -.32 .09 1 .000 .73 Age .02 .01 1 .000 1.03 Education (No HS = 0) 2 .959 HS or GED (1) .03 .19 1 .889 1.52 Assoc. or Higher (2) .05 .19 1 .814 1.05 Sig. Disability -.08 .08 1 .276 .92 R2 .06 Block Two
Assessment .14 .10 1 .158 1.15 Diagnosis & Treatment 1.23 .09 1 .000 3.42 Counseling & Guidance -.11 .12 1 .332 .89 Job Readiness -.70 .14 1 .000 .49 Job Search Assistance -.26 .15 1 .079 .58 Job Placement Assistance
1.22 .12 1 .000 3.39
Info & Referral Srvcs. .09 .19 1 .628 1.09 R2 .21
________________________________________________________
Note: Dependent variable was coded as Unsuccessful Closure=0, Successful Closure=1.
a All variables entered in Block Two were coded as 0 = Not Provided, 1 = Provided

73
Table 10
Research Questions, Statistical Tests, and Outcomes
Research Questions Statistical Test Significance Supported/Not Supported
R1: Among individuals who received VR services, there are differences among Blacks, Whites, AI/AN, Asians, NH/PI and Latino/as with CH & MI in exiting with an employment outcome.
Chi-Square p < .001 Supported
R2: Among individuals who achieved employment outcomes, there are differences in the types of services received among Blacks, Whites, AI/AN, Asians, NH/PI and Latino/as with CH & MI.
Chi-Square p < .001 for five p < .05 for two
Supported
R3: Among individuals there are differences in reasons for closures (other than achieving employment outcomes) among Blacks Whites, AI/AN, Asians, NH/PI and Latino/as with CH & MI.
Chi-Square p < .05 Supported
R4: Consumer demographic information and delivery of services predict employment outcomes among Blacks Whites, AI/AN, Asians, NH/PI and Latino/as with CH & MI.
Hierarchical Binary Logistic Regression
p < .001 for model, but not all variables were significant predictors of employment
Partially Supported
74
Chapter 5: Discussion
This study examined racial and ethnic group differences among people with criminal
histories and mental impairment served by the VR system. This chapter summarizes findings
regarding client demographics and results for each research question using Self
Determination Theory (SDT) and Social Career Cognitive Theory (SCCT) as the theoretical
framework. A discussion of the study’s limitations will follow as well as implications for
practice and future research.
Summary of Descriptive Statistics
Almost 87% of the population from the 911-RSA data set was accepted for state-
federal VR services during FY 2010. Nearly 44% of this population closed in a Status 26
(successful employment outcome) while 29% closed in a Status 28 (unsuccessful
employment outcome after IPE services). Specifically, 59% of Blacks, non-Latinos; 36% of
Whites; .9% of American Indian/Native Alaskans; .5% of Asians; .8% of Native
Hawaiian/Pacific Islanders; and 2.2% of Latino/as closed in a Status 26.
In terms of Status 28 rates, 29% of this sample did not achieve successful vocational
rehabilitation closure rates after receiving IPE services. Specifically, 53% of Blacks, non-
Latinos; 42% of Whites; .2.6% of American Indian/Native Alaskans; .0% of Asians; .5% of
Native Hawaiian/Pacific Islanders; and 2.1% of Latino/as closed in a Status 26. Again, this is
the first known investigation into the VR outcomes of people with disabilities and criminal
history with mental impairment. As a result, no known research is available to compare with
these findings
When compared to the employment rates of people with disabilities who do not have
a history of incarceration in the larger population, at least 15% were unemployed in 2010
75
compared to only 9% for people without a disability (Bureau of Labor Statistics, 2012), a rate
much lower than that found in this study and previous studies. Among the larger population,
Blacks (non-Latinos) with general disabilities had the highest unemployment rate at 23.5%,
followed by Latinos (20%), while Asians (11%) had the lowest. On the other hand, almost
19% of people with disabilities were employed compared to 64% among people with no
disability in the larger population. Specifically, 18% were Asian (a similar rate found among
Whites), 16% were Latino/a, and 13% were Black, non-Latino. Thus, the rates for people of
color with disabilities in the national population were higher than the rates found in this
study. This could be a reflection of the implication disability type plays on the ability to
obtain and maintain employment.
Research Question One
Research question one queried whether significant differences existed in competitive
employment among Blacks, Whites, American Indian/Alaska Natives, Asians, Native
Hawaiian/Other Pacific Islanders and Latino/as with MI. The results showed that there were
statistically significant differences with reaching a successful employment outcome among
this sample in FY 2010. Again, no prior research on this specific population exists in the
literature, however other research has been conducted on racial and ethnic disparities in VR
outcomes. As a result, the current study’s findings are similar to prior research that also
found statistically significant differences in VR outcomes based on race and ethnicity
(Dunham, 1998; Moore, Feist-Price, & Alston, 2002). While learning disability, mental
retardation, and depressive/mood disorders were the focus of the aforementioned research on
VR outcomes, several studies conducted on sensory disabilities have returned mixed or
conflicted findings on racial and ethnic disparities (Martin, 2010).

76
In looking at the overall numbers for those in the study who successfully closed
versus those unsuccessfully closed, the number of combined racial/ethnic group (Latino,
Native American, Asian, and Pacific Islander) was two hundred people. Of the 200 people in
the combined racial/ethnic group, 30% were successfully employed. For Whites, the overall
count was 1,280 people, of which 38% were successfully employed. For Blacks, the overall
count was 1,581, of which 51% were successfully employed. By comparison, Blacks
experienced more favorable outcomes with achieving successful employment than their
racial/ethnic counterparts. The number of Blacks successfully closed is encouraging, given
that the majority of the prison population in the United States is Black men (NCSL, 2009).
The expectation that differences in achieving successful VR outcomes as a function
of consumer’s race or ethnicity is something that has been well documented in the literature
(i.e., Atkins & Wright, 1980; Dziekan & Okacha, 1993; Herbert & Martinez, 1992; Jackson
II & Wilson, 2001; Patterson et al., 2000; & Wilson, 2005). The current study is a
continuation of work on VR outcomes as a function of consumers’ race or ethnicity. The
inclusion of people with disabilities and criminal history with mental impairment, while a
new extension of previous research, continues the notion that race and ethnicity may continue
to play a role in VR outcomes. As race/ethnicity is a static factor, the results may suggest a
more dynamic approach in acquiring competitive employment. Brown, Lent, and Knoll
(2013), in a recent article on applying SCCT to criminal justice populations, suggested that
moving from a content to process focus when working with people with criminal histories
will be a more effective strategy. This change in focus allows for more ownership to be taken
by the individual, which the authors claim is an essential part of a successful transition from
prison to viable work in society. The change in focus also fits well onto the theoretical
77
process provided by Self Determination Theory, which supports the individual taking
responsibility for goal setting and completion.
Research Question Two
Research question two queried if differences existed in the types of services (i.e.
Assessment, Diagnosis & Treatment of Impairments, Counseling & Guidance, Job Readiness
Training, Job Search Assistance, Job Placement Assistance, and Information and Referral
Services) among Blacks, Whites, American Indian/Alaska Native, Asian Americans, Native
Hawaiian/Other Pacific Islander and Latino/a with MI. Results of analysis found that the Chi-
square test revealed statistically significant differences between the types of services received
by race and ethnicity. Specifically, this study found that all services were statistically
significant.
The overall count for each of the services provided is as follows: 201 for the
combined racial/ethnic group, 1,281 for Whites, and 1,585 for Blacks. Percentages among
racial/ethnic groups are provided for each service. For assessment, nearly 12% of the
combined racial/ethnic group received the service. For Whites, nearly 46% received
assessment services. For Blacks, nearly 43% received assessment services. By comparison,
Blacks and Whites received assessment services far more frequently than their racial/ethnic
counterparts. For diagnosis and treatment, nearly 32% of the combined racial/ethnic group
received the service. For Whites, 43% received diagnosis and treatment. For Blacks, nearly
53% received diagnosis and treatment. For diagnosis and treatment, a gradual percentage
increase of 10% was present for the combined racial/ethnic group, Whites, and Blacks
respectively. For counseling and guidance, nearly 39% of the combined racial/ethnic group
received the service. For Whites, nearly 47% received counseling and guidance. For Blacks,

78
nearly 38% received counseling and guidance. While the combined racial/ethnic group and
Blacks were nearly identical in terms of percentages, Whites received counseling and
guidance more than their racial/ethnic counterparts.
For job readiness training, 6% of the combined racial/ethnic group received the
service. For Whites, 12% received job readiness training. For Blacks, nearly 12% received
the job readiness training. While the percentages across racial/ethnic groups are
comparatively low with other services provided, Blacks and Whites received job readiness
training more than their racial/ethnic counterparts. For job search assistance, nearly 11% of
the combined racial/ethnic group received the service. For Whites, nearly 22% received job
search assistance. For Blacks, nearly 26% received job search assistance. The combined
racial/ethnic group received job search assistance significantly less than Whites and Blacks.
For job placement, nearly 20% of the combined racial/ethnic group received the service. For
Whites, nearly 30% received job placement. For Blacks, nearly 37% received job placement.
Blacks received job placement services slightly more than their White counterparts, and far
more than the combined racial/ethnic group. For information and referral services, 8% of the
combined racial/ethnic group received the service. For Whites, nearly 7% received
information and referral services. For Blacks, nearly 4% received information and referral
services. While the percentages across racial/ethnic groups are comparatively low with other
services provided, Whites and the combined racial/ethnic group received information and
referral services more than Blacks.
The statistically significant findings for assessment are consistent with prior research
(Wheaton & Hertzfeld, 2002). In addition, the current study confirmed former findings of
statistical significance for counseling and guidance from previous studies on types of services

79
impacting successful employment outcomes (Saunders, Leahy, McGlynn, & Estrada-
Hernandez, 2006). Further, the current study confirmed previous research that found
information and job referrals, job placement, and job search assistance statistically significant
services for successful VR employment outcomes (Bolton et al., 2000; Moore, 2002). None
of the aforementioned studies focused on people with disabilities and criminal history with
mental impairment, which may be a reason for differences in findings. As this is the first
empirical analysis on this specific population, it is not safe to posit any reasons as to why the
current study’s findings confirm results from previous research.
The work of Brown et al. (2013) has specific relevance for the types of services that
may be most useful for people with criminal histories in the VR system. The SCCT process
traditionally focuses on the capacity to predict types of educational and vocational by
individual career seekers. According to Brown et al. (2013), the shift from predictive (i.e.,
content) to process encourages individuals to direct their own behavior in pursuit of making
career choices. In addition, the process focus “is concerned with such questions as how
people make choices (rather than what specific choices they make), manage transitions (e.g.,
from school to work or prison to work), find jobs, maintain job involvement, respond to work
related setbacks, and disengage from work” (Brown et al., 2013, p. 1054). It is my
suggestion, based on the study findings, SCCT, as posited by Brown et al. (2013), has the
capacity to guide which services in the VR system are most effective at guiding the process
towards a successful transition from prison to work. For example, future counselors currently
being trained in accredited counselor programs could benefit from updated curriculums that
include SCCT when serving people with disabilities with criminal histories. In addition,
current practitioners would benefit from continuing education opportunities that provide

80
training on specific aspects of SCCT that directly address aforementioned internal and
external barriers faced by people with disabilities and criminal histories.
Research Question Three
Research question queried if differences existed in reasons for unsuccessful closure
among Blacks, Whites, American Indian/Alaska Native, Asian Americans, Native
Hawaiian/Other Pacific Islander and Latino/as with MI. Previous to collapsing this variable
into five categories (unable to locate, refused services, individual in institution, failure to
cooperate, and all other reasons [i.e., disability too significant, death, individual in institution,
transfer to different agency, transportation not available, extended services not available,
other reasons]) all other categories were present. Results of the Chi-square test showed that
there were statistically significant differences with client race and ethnicity. The combined
category of American Indian/Alaska Native with MI, Asian Americans with MI, and Native
Hawaiian/Other Pacific Islander with MI and Latino/as with MI accounted for the largest rate
of closure (34.8%) for “unable to locate.” By comparison, Whites were 34.1% and Blacks
33.8 percent. Blacks led rates of closures for “individual in institution,” and “failure to
cooperate” at 28.8% and 17.3% respectively. Whites led rates of closures for “refused
services” at 11.8% in comparison with their Black and Combined counterparts 7.7% and
10.6% respectively.
Several of these findings are consistent with disparities research focused on
differences between racial and ethnic minorities and their White counterparts (LeBlanc &
Smart, 2007; Leung, Flowers, Talley, & Sanderson, 2007; Rosenthal et al., 2005; Wilson,
Harley, McCormick, Jolivette, & Jackson, 2001). In these studies, the closure rate for racial
and ethnic minorities for “failure to cooperate” were consistently reported to be higher than
81
their White counterparts. There was, however, a difference in the current study as Whites
had a higher closure rate for “refused” services than their racial and ethnic counterparts. Of
note is a finding from this study that has not been previously researched, the closure rate for
people with disabilities and criminal history returning to an institution. Within this category,
Blacks far outpaced their White and combined racial and ethnic counterparts in the number
of clients returning to an institution prior to completing VR services.
Research Question Four
Research question four queried if demographic characteristics and types of services,
would predict employment outcomes among Blacks (non-Latinos), Whites, American
Indian/Alaska Natives, Asians, Native Hawaiian/Other Pacific Islanders and Latinos/as with
MI. Results of the hierarchical binary regression analysis revealed that among the
demographic variables, gender, age, and race/ethnicity were statistically significant variables
for successful employment for people with disabilities and criminal history with MI. These
findings were comparable to results reported in several studies looking at disparities in VR
outcomes on the basis of race and ethnicity (Moore, Feist-Price, & Alston, 2002; Schaller &
Yang, 2007). In these studies, the general findings were Whites were more likely to
successfully close with employment outcomes than racial or ethnic minorities.
The current study found Whites were 58% less likely to obtain a successful
employment outcome than the combined racial and ethnic comparison group. Blacks were
73% less likely to obtain a successful employment than the combined racial and ethnic
comparison group. While these numbers are far different than previous research showing that
Whites are employed at higher rates than their racial and ethnic counterparts, demographic
information may offer some insight into the reversal in the current study. Nearly 58% of this

82
population comes from two states, Georgia and South Carolina, which traditionally offer
opportunities for manual labor and construction jobs. Whitfield (2008) found that manual
labor, construction, and food service jobs were the highest job categories for people with
disabilities and criminal history in the RSA 911 database. One theory for the current findings
is that these job categories were more accessible, or offered to the combine racial and ethnic
category (i.e. Latino/as, Asian, etc.) in the south versus their White and Black counterparts.
Several barriers to employment not explored in the current study may contribute to
the differences in rates of achieving successful employment as well. Harris and Wade (2010)
report housing, familial support, employers’ attitudes and biases, and a lack of education and
training for people with disabilities and criminal history with MI as unique barriers facing
this population. It could be that the intersection of criminal history and racial/ethnic minority
status in conjunction with these barriers differentially impacts the likelihood of gaining
successful employment. Of course, this speculative offering is in need of further study.
Two other demographic variables, gender/sex (men and women) and age (18-70)
were found to be statistically significant predictors of employment outcomes for people with
disabilities and criminal history with mental impairment in FY 2010. Results of the
hierarchical binary regression analysis revealed that gender was a statistically significant
predictor of employment indicating men were nearly twice as likely to obtain successful
employment than women. Often, women with criminal histories face a higher level of stigma
than men (Masters, 2004). The stigma is often around the public perception that women have
abandoned their families while incarcerated, a burden not often placed on men with criminal
histories. It is possible that along with general gender bias in employment, those women are
also impacted by this additional stigma. This result differs slightly from previous research on

83
gender rates and acceptance into VR programs (Chan et al., 2005) that found no statistical
difference between genders.
For age, the odds value was 1.03, meaning that the younger an individual was, the
more likely he/she was to obtain successful employment. These results are consistent with
other research that found younger individuals have better employment outcomes than their
older counterparts (Beck et al., 1989; Blackwell, Leierer, Haupt, Kapitsis, & Wolfson, 2004;
Bose et al., 1998; Lustig, Strauser, Weems, Donnell, & Smith, 2003; Saxon et al., 1983;
Vander Kolk & Vander Kolk, 1990). This finding may also make sense from a criminal
justice perspective. With the age range from age 18 to 70, it makes sense that older people
with disabilities and criminal history with MI would have a harder time finding competitive
employment than their younger counterparts. While the current study did not have access to
the length of the prison sentences for this population, the higher the number of years spent
incarcerated greatly decreases the opportunities to return to gainful employment (Petersilia,
2003).
For VR service variables, job readiness, job placement, and diagnosis were
statistically significant, positive predictors of successful employment, meaning that an
increase in these services improved the odds of closing successfully with competitive
employment. Results of this study are similar to earlier studies of successful VR outcomes
among consumers with other disabilities. Both Moore (2002) and Bolton et al. (2000)
reported on the statistical significance of job placement. The current study found job
placement to be a statistically significant, positive predictor of employment, indicating job
placement increased the odds of reaching a successful employment outcome by nearly 3.5
times for those who received the service versus those who did not receive the service. This

84
represents an important clue that points to the relative importance of providing job placement
assistance to people with disabilities and criminal history with MI. As stated earlier,
additional barriers exist for individuals leaving correctional institutions that may not exist for
the general public, making job placement a potentially essential part of working with people
with disabilities and criminal history with MI.
Job readiness was also found to be a statistically significant predictor of employment.
This service variable was selected specifically for this population due to the unique barriers
that people with disabilities and criminal history face. For example, the stigma associated
with criminal history, lack of social skills, and a limited experience with workplace cultures
are all reported to be significant barriers people with disabilities and criminal history (Harris
& Wade, 2009). As a result, assistance with job readiness may be a critical service for people
with disabilities and criminal history with MI when returning to the community, and
workforce. While job readiness assistance was thought to be an important service for people
with disabilities and criminal history with MI, the current study found job readiness to be that
participants who received this service were nearly 50% less likely to obtain successful
employment than those who did not receive the service. This finding may point to the need to
take into account the particular needs of people with disabilities and criminal history when
providing job readiness services. Rakis (2005) reports that one of the key ingredients to
individuals with criminal histories returning to work is an ability to successfully explain their
past while convincing potential employers that they are a safe candidate for employment. In
discussions with several rehabilitation counselors, the author found that this was not a key
feature to job readiness assistance when serving people with disabilities and criminal history.

85
Limitations
As with all research there are limitations that need to be taken into consideration. One
limitation of this study is the lack of specificity with regard to certain variables such as
significant disability, reasons for and length of time in the criminal justice system, and
subsequent exit from VR services. A little over half of the population (56%) was eliminated
from the analysis due to five reasons for closures (unable to locate, refused services,
individual in institution, failure to cooperate, and all other closure reasons). The RSA-911
codebook does not offer any record of the type of offense or the length of time in prison or
jail settings, which could have an effect on the ability to obtain competitive employment
(Western, 2007). As a result, the population had to be reduced from 3,067 to 1,347 in order to
reduce selection bias.
Generalizability is a second limitation, This study used archival data from the FY
2010 RSA-911 database and used an ex-post facto design. Causality, therefore, cannot be
inferred from these results. Generalizability is also limited given that nearly half (58%) of
the data were represented from two states. In fact, the majority of states and U.S. territories
(n = 30) had only 1% or less of people with disabilities and criminal history with mental
impairment. Results are restricted to one disability type (mental impairment) and may not be
appropriate to people with other disabilities who have been incarcerated who sought VR
services.
As previously mentioned, data used in this study was extracted from the FY 2010
RSA-911 national database. The information found in this database is entered directly by
VR counselors at each state-federal VR agency across the U.S. and its territories for each
case that is open and/or closed. Therefore, the data are susceptible to human error. These
86
errors can include data input errors as well as errors with properly identifying a consumer’s
race/ethnicity, particularly for those who do not provide this type of information (RSA,
2010).
Implications for Rehabilitation Counselors
Several recommendations for state-federal vocational rehabilitation counselors can be
made based on the results from this study. First, services that were found to be the most
statistically significant predictors of successful employment were job readiness assistance,
job placement assistance, and diagnosis/treatment. Although the RSA-911 data do not
provide details about job placement procedures that VR counselors use as part of service
delivery, an earlier article by Fawber and Wachter (1987) provides five suggestions to
improve employment outcomes. Their suggestions include selecting placements that are
consistent with consumers’ abilities, strengths, interests, and limitations; conducting a job
analysis (i.e., identifying attributes and tasks needed to perform a particular job); educating
employers and co-workers of consumers’ strengths and limitations (if consumers choose to
disclose this information) to prevent any misunderstandings of consumers’ behaviors; acting
as the liaison between employers and the agency on behalf of consumers’ best interests and
abilities; and encouraging the support from consumers’ families to become an essential part
of the VR process.
As in previous research, race and ethnicity were found to be a significant factor in
determining positive employment outcomes in the state-federal VR system (LeBlanc &
Smart, 2007; Leung, Flowers, Talley, & Sanderson, 2007; Rosenthal et al., 2005; Wilson,
Harley, McCormick, Jolivette, & Jackson, 2001). Rehabilitation counselors may benefit from
continued efforts to broaden their multicultural competency when working with consumers
87
who are racially or ethnically different from them. While race and ethnicity is a factor, it may
also be relevant for rehabilitation counselors to focus on the intersectional impact of
consumers with criminal history, mental impairment, and racial or ethnic minority status.
Implications for Future Research
One of the difficulties in making assumptions about the impact of a given disability
and VR outcomes is that there is a vague explanation for the types of mental impairment. In
particular, the designation of psychosocial impairment as interpersonal and behavioral
impairments and difficulty coping provides very little insight into the actual issues facing
people with disabilities and criminal history with mental impairment. People with criminal
histories already face the stigma of being antisocial (Masters, 2004), so psychosocial
impairment may be a default category rather than an accurate description of the mental
impairment of this population. A first recommendation for future research is to make a
proposal to RSA to create a more specific variable in their case management system that
allows the rehabilitation counselor the ability to separate significant disability from actual
psychosocial barriers facing people with disabilities and criminal history. Specifically, this
variable should reflect challenges facing incarcerated populations such as low education, low
socioeconomic status, and release to crime ridden and unsafe environments (Harris & Wade,
2010). Therefore, having this information could expand upon established trends of
racial/ethnic disparities among state-federal VR consumers (Rosenthal et al., 2005).
This study represents a potentially impactful shift in the way counselors work with
people with disabilities and criminal history with MI. In the current social climate in the
United States where mass acts of violence (e.g. U.S. Navy Yard shooting, Newtown, CT
school shooting) are being linked with mental impairment, it is especially important to

88
reverse the public stigma through the reintegration of people with disabilities and criminal
history into communities through successful employment. Rehabilitation counseling can be
at the forefront of this reversal of negative perception for people with disabilities and
criminal history by embracing the challenges associated with having a criminal history,
mental impairment, and being a racial or ethnic minority. The current study can provide an
important empirical basis on which to bolster rehabilitation counselor’s efforts when working
with this population.
The second recommendation is to use relevant career theory and statistically
significant predictors found to influence employment outcomes in this study as a starting
place to bolster efforts in successfully employing people with disabilities and criminal history
with MI. Predictors like diagnosis and treatment and job placement assistance had a
significant relationship with employment outcomes. When each of these services was
provided to this population, clients were three times more likely to obtain successful
employment. Conversely, job readiness was negative predictors of employment, which may
suggest that robust changes are needed in service delivery for people with disabilities and
criminal history with MI. Rehabilitation counselors have a significant ability to be a positive
influence on people with disabilities and criminal history with MI due to the range and scope
of services that are available in state-federal VR. While the breadth of services is important
in state-federal VR, the current study suggest that a more targeted approach on job placement
assistance, diagnosis and treatment, and a revised job readiness service may increase the
likelihood of successful employment for people with disabilities and criminal history with
MI.

89
The potential for the influence of Social Cognitive Career Theory (Brown et al.,
2013) and Self-Determination Theory (Ryan & Deci, 2008) on the transition from prison to
work should not be underestimated. The intersection of race/ethnicity, criminal history, and
mental impairment erect specific and unique barriers to the acquisition of competitive
employment. When counselors apply these theories to people with criminal histories and
mental impairment, it could be seen as a form of self-empowerment for the population. The
process-focus on self determination and self decision-making may serve to break the pattern
of negative internalization experienced by many offenders when trying to transition from
incarceration to employment in community.
The current study has largely been motivated by a desire to understand people with
disabilities and criminal history with MI in the VR system beyond demographic information.
Although demographic information is essential, and certainly expanded upon here, it has
been the aim of this study to provide the counseling field with empirically based research that
could make an impact for both practitioners and researchers interested in improving service
to people with disabilities and criminal history. Future research in this area will continue to
focus on services that are appropriate for people with disabilities and criminal history with
MI and likely to increase the likelihood of successful employment. Further research may also
explore why certain regions of the country (e.g. Southeastern U.S.) have been more
successful at servicing people with disabilities and criminal history with MI. Future research
will also benefit from a focus on reasons for closure, in particular how rehabilitation
counseling can help reduce the number returning to a correctional institution. This is
particularly important because it disproportionality impacts racial and ethnic minorities. The
current study has attempted to advance knowledge on the salient variables (demographic and

90
case service) that predict outcomes for successful employment for people with disabilities
and criminal history with MI. It is my hope that researchers will continue to expand upon
research in this area for the betterment of those who experience tripartite stigma; disability,
criminal history, and race on the road to bringing employment disparities for ex-offenders to
an end.

91
References
Albert, K. A., & Luzzo, D. A. (1999). The role of perceived barriers in career development:
A social cognitive perspective.
Andrews, H., Barker, J., Pittman, J., Mars, L., Struening, E., & LaRocca, N. (1992). National
trends in vocational rehabilitation: a comparison of individuals with physical
disabilities and individuals with psychiatric disabilities. Journal of Rehabilitation.
58(1), 7-16.
Atkins, B. J., & Wright, G. N. (1980). Three views: Vocational rehabilitation of Blacks: The
statement. Journal of Rehabilitation, 46(2), 42-46.
Barclay, L. A., & Markel, K. S. (2009). Ethical fairness and human rights: The treatment of
employees with psychiatric disabilities. Journal of Business Ethics, 85(3), 333-345.
doi:10.1007/s10551-008-9773-5
Belgrave, F. Z., & Walker, S. (1991). Predictors of employment outcome of black persons
with disabilities. Rehabilitation Psychology, 36(2), 111-119. doi:10.1037/0090-
5550.36.2.111
Blackwell, T.L., Leierer, S. J., Haupt, S.S., Kapitsis, A., & Wolfson, J.R. (2004). Predictors
of vocational outcomes for workers' compensation claimants with Back Injury.
Journal of Applied Rehabilitation Counseling, 35(2), 32-37.
Boast, N., & Chesterman, P. (1995). Black-people and secure psychiatric facilities - patterns
of processing and the role of stereotypes. British Journal of Criminology, 35(2), 218-
235.
92
Boutin, D. L. (2006). Effectiveness of the state vocational rehabilitation program for
consumers with hearing impairments (Doctoral dissertation). The Pennsylvania State
University, University Park, PA.
Bolton, B., Bellini, J., & Brookings, J. (2000). Predicting client employment outcomes from
personal history, functional limitations, and rehabilitation services. Rehabilitation
Counseling Bulletin, 44(1), 10-21.
Breslau, J., Aguilar-Gaxiola, S., Kendler, K. S., Su, M., Williams, D., & Kessler, R. C.
(2006). Specifying race-ethnic differences in risk for psychiatric disorder in a USA
national sample. Psychological Medicine, 36(1), 57-68.
doi:10.1017/S0033291705006161
Brown, S., Lent, R., & Knoll, M. (2013). Applying social cognitive career theory to criminal
justice populations: A commentary. Counseling Psychologist, 41(7), 1052-1060.
doi:10.1177/0011000013482380
Capella, M. E. (2002). Inequities in the VR system: Do they still exist? Rehabilitation
Counseling Bulletin, 45, 143-153.
Capella, M.E. (2003a). Comparing employment outcomes of vocational rehabilitation
consumers with hearing loss to other consumers and the general labor force.
Rehabilitation Counseling Bulletin. 47(1), 24-33.
Capella, M.E. (2003b). Evaluating differences in demographics, services, and outcomes of
vocational rehabilitation consumers with hearing loss versus consumers with other
disabilities. Journal of Rehabilitation. 69(3), 39-46.

93
Chan, F., Wong, D. W., Rosenthal, D. A., Kundu, M. M., & Dutta, A. (2005). Eligibility
rates of traditionally underserved individuals with disabilities revisited: A data mining
approach. Journal of Applied Rehabilitation Counseling, 36(3), 3-10.
Cohen, J. (1988). Statistical power analysis for the behavioral sciences (2nd ed.). Hillsdale,
NJ: Lawrence Erlbaum Associates.
Danek, M. M. & Lawrence, R. E. (1982). Client-counselor racial similarity and
rehabilitation outcomes. Journal of Rehabilitation, 48(3), 54-58.
Disability awareness: A brief history of legislation. (n.d.). Retrieved from Colorado State
University website: http://rds.colostate.edu/history-of-legislation
Dunham, M.D., Schrader, M.P., & Dunham, K.S. (2000). Vocational rehabilitation outcomes
of adults with co-morbid borderline IQ and specific learning disabilities. Journal of
Rehabilitation, 66(4), 31-35.
Dutta, A., Gervey, R., Chan, F., Chou, C. C., & Ditchman, N. (2008). Vocational
rehabilitation services and employment outcomes for people with disabilities: A
United States study. Journal of Occupational Rehabilitation, 18, 326-334. doi:
10.1007/s10926-008-9154-z
Dzieken, K. I., & Okocha, A. G. (1993). Accessibility of rehabilitation services: Comparison
by race-ethnic status. Rehabilitation Counseling Bulletin, 36, 183-189.
Farish, J. M., & Moore, J. E. (1989). Rehabilitation feasibility of blind and visually impaired
disability beneficiaries. Journal of Rehabilitation, 55(1), 63-68.
Faul, F., Erdfelder, E., Buchner, A., & Lang, A. G. (2009). Statistical power analyses using
G*Power 3.1: Tests for correlation and regression analyses. Behavior Research
Methods, 41, 1149-1160.

94
Fawber, H. L., & Wachter, J. F. (1987). Job placement as a treatment component of the
vocational rehabilitation process. The Journal of Head Trauma Rehabilitation, 2(1),
27-33.
Feist-Price, S. (1995). African Americans with disabilities and equity in vocational
rehabilitation services: One state’s review. Rehabilitation Counseling Bulletin, 39,
119-129.
Fitzgerald, T., McGowan, D., Kutner, M., & Wenger, N. K. (1982). Demographic
determinants of success in the vocational rehabilitation of cardiac patients. Journal of
Rehabilitation, 48, 35-38.
Frankfort-Nachmias, C., & Nachmias, D. (1996). Research methods in the social sciences
(5th ed.). New York, NY: St. Martin’s Press.
Gary, F. A. (2005). Stigma: Barrier to mental health care among ethnic minorities. Issues in
Mental Health Nursing, 26(10), 979-979. doi:10.1080/01612840500280638
Giesen, J. M., Cavenaugh, B. S., & Sansing, W. K. (2004). Access to vocational
rehabilitation: The impact of race and ethnicity. Journal of Visual Impairment &
Blindness, 98, 410-419.
Grimm, L. G. (1993). Statistical applications for the behavioral sciences. New York, NY:
John Wiley & Sons.
Guerino, P., Harrison, P., & Sabol, W. (2011). Prisoners in 2010 (Research Report No. NCJ
236096). Retrieved from http://bjs.ojp.usdoj.gov/content/pub/pdf/p10.pdf
Grieco, E. C., Cassidy, R. C., & United States. Bureau of the Census. (2001). Overview of
race and Hispanic origin: 2000. Washington, DC: U.S. Dept. of Commerce, Economics and
Statistics Administration, U.S. Census Bureau.

95
Han, E., & Liu, G. G. (2005). Racial disparities in prescription drug use for mental illness
among population in US. The Journal of Mental Health Policy and Economics, 8(3),
131-143.
Harris, L., & Wade, J. (2009). Barriers to Employment. In M. McGuire-Kuletz, P.
Tomlinson, & M. Siblo (Eds.), Vocational rehabilitation and corrections: Achieving
successful employment outcomes for persons with disabilities and criminal history
(pp. 63-77). Institute on Rehabilitation Issues Monograph No. 35. Washington, DC:
The George Washington University, Technical Assistance and Continuing Education.
Harlow, C. W., & Department of Justice, Washington, DC. Bureau of Justice Statistics.
(2003). Education and correctional populations. bureau of justice statistics special
report Bureau of Justice Statistics, U.S.
Heppner, P. P., Wampold, B. E., & Kivlighan Jr., D. M. (2008). Research design in
counseling (3rd ed.). Belmont, CA: Thomson Brooks/Cole.
Herbert, J. T., & Martinez, M. Y. (1992). Client ethnicity and vocational rehabilitation case
service outcome. Journal of Job Placement, 8(1), 10-16.
Hill, M. A. (1989). Work status outcomes of vocational rehabilitation clients who are blind or
visually impaired. Rehabilitation Counseling Bulletin, 32(3), 219-230.
Hollingsworth, D. K. & Harris, R. (1980). The labor force participation of handicapped
women: An empirical analysis. Journal of Applied Rehabilitation Counseling, 11(2),
99-103.
Howden, L. M., & Meyer, J. A. (2011). Age and sex composition: 2010. Retrieved from
http://www.census.gov/prod/cen2010/briefs/c2010br-03.pdf

96
Humes, K. R., N. A. Jones, and R. R. Ramirez. (2011). Overview of race and Hispanic
origin: 2010. 2010 Census Briefs.
Immarigeon, R., & Petersilia, J. (2003). When prisoners come home: Parole and prisoner
reentry. WASHINGTON: US COURTS.
Jackson II, R. L., & Wilson, K. B. (2001). The dynamics of race and identity in vocational
rehabilitation settings: A systematic comparison of closure rates among Blacks and
Whites. The Journal of Intergroup Relations, 27(4), 28-39.
James, D., & Glaze, L. (2006). Mental health problems of prisons and jail inmates (Research
Report No. NCJ 213600). Retrieved from
http://bjs.ojp.usdoj.gov/index.cfm?ty=pbdetail&iid=4537
Jenkins, W., Patterson, J., & Szymanski, E. M. (1998). Philosophical, historical, and
legislative aspects of the rehabilitation counseling profession. In R. Parker & E.
Szymanski (Eds.), Rehabilitation counseling: Basics and beyond (3rd ed., pp. 1-40).
Austin (TX): Pro-Ed.
Johnson, K. F. (2013). Preparing ex-offenders for work: Applying the self-determination
theory to social cognitive career counseling. Journal of Employment Counseling,
50(2), 83-93. doi:10.1002/j.2161-1920.2013.00027.x
Jung, Y., & Bellini, J. L. (2011). Predictors of employment outcomes for vocational
rehabilitation with HIV/AIDS: 2002-2007. Rehabilitation Counseling Bulletin, 54(3),
142.
Jung, Y., Schaller, J., & Bellini, J. (2010). Predictors of employment outcomes for state-
federal vocational rehabilitation consumers with HIV/AIDS. Rehabilitation
Counseling Bulletin, 53(3), 175-185.
97
Kolakowsky-Hayner, S. A. (2010). Acceptance rates in state-federal vocational rehabilitation
of clients with brain injury: Is racial disparity an issue? Brain Injury : [BI], 24(12),
1428-1447. doi:10.3109/02699052.2010.523039
Kundu, M., & Schiro-Geist, C. (2006). Legislative aspects of rehabilitation. In P. Leung, C.
Flowers, W. Talley, & P. Sanderson, (Eds.), Multicultural issues in rehabilitation and
allied health (pp.17-43). Osage Beach, MO: Aspen Professional Services.
Lamb, H. R., Weinberger, L. E., & Gross, B. H. (2004). Mentally ill persons in the criminal
justice system: Some perspectives. Psychiatric Quarterly, 75(2), 107-126.
doi:10.1023/B:PSAQ.0000019753.63627.2c
LaVigne, N. G., Kane, K. M., & Visher, C. (2005). Substance use and criminal recidivism
among released prisoners returning to Chicago, Illinois. Proceedings of the 133rd
Annual Meeting and Exposition of the American Public Health Association.
LeBlanc, S., & Smart, J. F. (2007). Outcome discrepancies among racially/ethnically
diverse consumers of vocational rehabilitation services: Summary and critique of the
literature. Journal of Applied Rehabilitation Counseling, 38(1), 3.
Leung, P., Flowers, C., Talley, W. B., & Sanderson, P. (2007). Multicultural issues in
rehabilitation and allied health. LinnCreek, MO: Aspen.
Lindsay, S. (2011). Discrimination and other barriers to employment for teens and young
adults with disabilities. Disability and Rehabilitation, 33(15-16), 1340-1350.
doi:10.3109/09638288.2010.531372
Lustig, D., Strauser, D., Weems, G., Donnell, C., & Smith, L. (2003). Traumatic brain injury
and rehabilitation outcomes: Does working alliance make a difference? Journal of
Applied Rehabilitation Counseling, 34(4), 30–37.
98
Marshak, L. E., Bostick, D., 8c Turton, L. J. (1990). Closure outcomes for clients with
psychiatric disabilities served by the vocational rehabilitation system. Rehabilitation
Counseling Bulletin, 33, 247-250.
Martin, F. H. (2010). Racial variation in vocational rehabilitation outcomes: A structural
equation modeling approach. Rehabilitation Counseling Bulletin, 54(1), 26-35. doi:
10.1177/0034355209360420
Masters, R. (2004). Counseling criminal justice offenders. 2nd ed. Thousand Oaks, CA: Sage
Publications.
McCready, W. C. (2006). Applying sampling procedures. In F. T. L. Leong, & J. T. Austin
(Eds.), The psychology research handbook: A guide for graduate students and
research assistants (pp. 147-160). Thousand Oaks, CA: Sage.
McShane, S. L., & Karp, J. (1993). Employment following spinal cord injury: A covariance
structure analysis. Rehabilitation Psychology, 38(1), 27-40. doi:10.1037/h0080291
Mears, D. P., Aron, L., Bernstein, J., & National Council on Disability, Washington, DC.
(2003). Addressing the needs of youth with disabilities in the juvenile justice system:
The current status of evidence-based research National Council on Disability.
Moore, C.L. (2002). Comparative competitive employment levels for Latinos and non-
Latinos without 12 years of education. Journal of Applied Rehabilitation Counseling.
33( 1 ), 13-17.
Moore, C., Feist-Price, S., & Alston, R. (2002). Competitive employment and mental
retardation: Interplay among gender, race, secondary psychiatric disability, and
rehabilitation services. Journal of Rehabilitation, 68(1), 14-19.

99
Mwachofi, A. K. (2008). African Americans’ access to vocational rehabilitation services
after antidiscrimination legislation. Journal of Negro Education, 77(1), 39-59.
National Conference of State Legislatures. (2009). Cost of corrections, 35(3), 5.
National Institute of Mental Health. (2013). Prevalence of serious mental illness among U.S.
adults by sex, age, and race in 2008. Retrieved from
http://www.nimh.nih.gov/statistics/SMI_AASR.shtml
Neubauer, A., Freudenberger, J., & Kuhn, V. (2007). Coding theory: Algorithms,
architectures, and applications. West Sussex, England: John Wiley & Sons Ltd.
Patterson, J. B., Allen, T. B., Parnell, L., Crawford, R., & Beardall, R. L. (2000). Equitable
treatment in the rehabilitation process: Implications for future investigations related to
ethnicity. Journal of Rehabilitation, 66(2), 14-18.
Petersilia, J. (2003). When prisoners come home: Parole and prisoner reentry. Oxford:
Oxford University Press.
Petersilia, J. (2003). When prisoners come home. WASHINGTON: NATL AFFAIRS INC.
Peterson, G. E. (1996). An analysis of participation, progress, and outcome of individuals
from diverse racial and ethnic backgrounds in the public vocational rehabilitation
program in Nevada. Unpublished doctoral dissertation, University of Northern
Colorado, Greeley. Rehabilitation Act Amendments of 1992, Pub. L. No. 102-569,
106 Stat. 4344–4488 (1992).
Preacher, K. J. (2001). Calculation for the chi-square test: An interactive calculation tool for
chi-square tests of goodness of fit and independence. Computer software, Available from
http://quantpsy. org.
Prince, J. D., Akincigil, A., & Bromet, E. (2007). Incarceration rates of persons with first-
admission psychosis. Psychiatric Services (Washington, D.C.), 58(9), 1173-1180.
100
doi:10.1176/appi.ps.58.9.1173
Rakis, J. (2005). Improving the employment rates of ex-prisoners under parole. Federal
Probation, 69, 7-14.
Rehabilitation Act Amendments of 1992. 29. U.S.C. § 701 et seq.
Rehabilitation Act of 1973, 29 U.S.C. § 701 et seq.
Rehabilitation Services Administration. (1993). Rehabilitation Act of 1973 as amended by
the Rehabilitation Act of 1992. Washington, DC: U.S. Department of Education.
Rehabilitation Services Administration. (2010). Reporting manual for the case service report
(RSA-911) (RSA-PD-10-04). Washington, DC: Author.
Richman, L., Kohn-Wood, L., & Williams, D. (2007). The role of discrimination and racial
identity for mental health service utilization. Journal of Social and Clinical
Psychology, 26(8), 960-981. doi:10.1521/jscp.2007.26.8.960
Robinson, M., & Klein, M. (2008). Dual diagnosis: Does race affect vocational rehabilitation
outcomes? Journal of Applied Rehabilitation Counseling, 39(3), 19-24.
Rosenthal, D. A., Ferrin, J. M., Wilson, K., & Frain, M. (2005). Acceptance rates of
African-American versus White consumers of vocational rehabilitation services: A
meta-analysis. Journal of Rehabilitation, 71, 36–44.
Rosenthal, D. A., Wilson, K. B., Ferrin, J. M., & Frain, M. (2005). Acceptance rates of
African-American versus White consumers of vocational rehabilitation services: A
meta-analysis. Journal of Rehabilitation, 71, 36-44.
Ross, M. G., & Biggi, I. M. (1986). Critical vocational rehabilitation service delivery issues
at referral (02) and closure (08, 26, 28, 30) in serving select disabled persons. Equal
to the Challenge. Washington, DC: Howard University Research & Training Center.

101
Rubin, S., & Roessler, R. (2007). Foundations of the vocational rehabilitation process.
Austin TX: Pro-Ed.
Russell, M., & Stewart, J. (2001). Disablement, prison, and historical segregation. Monthly
Review-an Independent Socialist Magazine, 53(3), 61-75.
Ryan, R. M., & Deci, E. L. (2008). A self-determination theory approach to psychotherapy:
The motivational basis for effective change. Canadian Psychology/Psychologie
Canadienne, 49(3), 186-193. doi:10.1037/a0012753
Santiago, A. M. (1988). Provision of vocational rehabilitation services to blind and visually
impaired Hispanics: The case of New Jersey. Journal of Applied Rehabilitation
Counseling. 19(4), 11-15.
Saunders, J. L., Leahy, M. J., McGlynn, C., & Estrada-Hernandez, N. (2006). Predictors of
employment outcomes for persons with disabilities: An integrative review of
potential evidenced-based factors. Journal of Applied Rehabilitation Counseling,
37(2), 3.
Sambamoorthi, U. (2006). Employment of persons with disabilities: Evidence from the
national sample survey. Economic and Political Weekly, 41(3), 199-203.
Saxon, J. P., Spitznagel, R. J., & Shcllhorn Schutt, P. K.. (1983). Indicators of successful
vocational rehabilitation. Journal of Rehabilitation, 49(3), 69-71.
Schwab, A. J. & DiNitto, D. M. (1993). Factors related to the successful vocational
rehabilitation of substance abusers. Journal of Applied Rehabilitation Counseling,
24(3), 11-20.
Schmitt, J., & Warner, K. (2010). The changing face of U.S. labor, 1983-2008. Working
USA, 13(2), 263-279. doi:10.1111/j.1743-4580.2010.00286.x

102
Schmitt, J., & Warner, K. (2010). Ex-offenders and the labor market. Retrieved from
http://www.cepr.net/documents/publications/ex-offenders-2010-11.pdf
Silverstein, R., Julnes, G., & Nolan, R. (2005). What policymakers need and must demand
from research regarding the employment rate of persons with disabilities. Behavioral
Sciences & the Law, 23(3), 399-448. doi:10.1002/bsl.632
Smith, J. K. & Crisler, J. R. (1985). Variables associated with the vocational rehabilitation
outcome of chronic low back pain individuals. Journal of Applied Rehabilitation
Counseling, 16, 22-24.
Teplin, L. A. (1990). Detecting disorder: The treatment of mental illness among jail
detainees. Journal of Consulting and Clinical Psychology, 58(2), 233-236.
doi:10.1037/0022-006X.58.2.233
U.S. Census Bureau. (2010). 20th Anniversary of Americans with Disabilities Act: July 26.
Retrieved from https://www.census.gov/newsroom/releases/archives.html
U.S. Department of Health and Human Services, Agency for Healthcare Research and
Quality. (2011). National healthcare disparities report (AHRQ Publication No. 12-
0006). Retrieved from http://www.ahrq.gov/qual/qrdr10.htm
U.S. Department of Labor, Office of Disability Employment Policy. (2012). [need to add
document title, in italics]. Retrieved from http://www.dol.gov/odep/#.ULunqYV_SU4
United States. Substance Abuse and Mental Health Services Administration. Office of
Applied Studies, & National Survey on Drug Use and Health (U.S.). (2005). Results
from the national survey on drug use and health.
Vanderkolk, C., & Vanderkolk, J. (1990). Follow-up of persons with litigation related
injuries. Journal of Rehabilitation, 56(4), 36-40.

103
Visher, C. A., Winterfield, L., & Coggeshall, M. B. (2005). Ex-offender employment
programs and recidivism: A meta-analysis. Journal of Experimental Criminology, 1,
295-316. doi: 10.1007/s11292-005-8127-x
Western, B. (2007). The prison boom and the decline of American citizenship. Society, 44(5),
30-36. doi:10.1007/s12115-007-9000-5
Wheaton, J. E. (1995). Vocational rehabilitation acceptance rates for European Americans
and African Americans: Another look. Rehabilitation Counseling Bulletin, 38, 224-
231.
Wheaton, J. E., & Hertzfeld, J. (2002). Ancestry and severity of disability: A national
study. Rehabilitation Counseling Bulletin, 45, 154–161.
Whitfield, H. W. (2009). Occupations at case closure for vocational rehabilitation applicants
with criminal backgrounds. Rehabilitation Counseling Bulletin, 53(1), 56-58. doi:
10.1177/0034355208324589
Wilkerson, D. A., & Penn, L. A. (1938). The participation of Negroes in the federally-aided
program of civilian vocational rehabilitation. Journal of Negro Education, 7(3), 319-
330.
Williams, P. D. E. (2008). Differences in the vocational rehabilitation process between
African Americans and European Americans with specific learning disabilities on
acceptance, services, and reasons for closure (Doctoral dissertation). Retrieved from
http://search.proquest.com.ezaccess.libraries.psu.edu/docview/304483452
Wilson K. B., Harley, D. A., & Alston, R. J. (2001). Race as a correlate of vocational
rehabilitation acceptance: Revisited. Journal of Rehabilitation, 67(3), 35-41.
104
Wilson, K. B. (1999). Vocational rehabilitation acceptance: A tale of two races in a large
Midwestern state. Journal of Applied Rehabilitation Counseling, 30(2), 25-31.
Wilson, K. B. (2002). Exploration of VR acceptance and ethnicity: A national investigation.
Rehabilitation Counseling Bulletin, 45, 168-176. doi: 10.1177/003435520204500306
Wilson, K. B. (2005). Vocational rehabilitation closure statuses in the United States:
Generalizing to the Hispanic/Latino ethnicity. Journal of Applied Rehabilitation
Counseling, 36(2), 4-11.
Wilson, K. B., & Gines, J. E. (2009). A national reassessment: Exploring variables that
predispose people with disabilities to vocational rehabilitation acceptance.
Rehabilitation Education, 23, 159-170.
Wilson, K. B., & Senices, J. (2005). Exploring the vocational rehabilitation acceptance rates
for Hispanics versus non-Hispanics in the United States. Journal of Counseling and
Development, 83, 86-96.
Wilson, K. B., Alston, R. J., Harley, D. A., & Mitchell, N. A. (2002). Predicting VR
acceptance based on race, gender, education, work status at application, and primary
source of support at application. Rehabilitation Counseling Bulletin, 45, 132-142.
doi: 10.1177/003435520204500302
Wilson, K. B., Jackson II, R. L., & Doughty, J. D. (1999). What a difference a race makes:
Reasons for ineligibility within the vocational rehabilitation system. American
Rehabilitation, 25(2), 16-24.
Wright, G. N. (1980). Total rehabilitation. Boston: Little Brown.

JASON E. GINES, Ph.D. The Pennsylvania State University
Department of Educational Psychology, Counseling and Special Education University Park, PA 16802-3110
EDUCATION
Ph.D., Counselor Education, Penn State University, December 2013 M. Ed., Counselor Education (Rehabilitation Counseling), Penn State University, May 2010 M. Div., Vanderbilt University Divinity School, May 2008 B.A., Psychology, University of Missouri-Columbia, December 1999
REFEREED PUBLICATIONS
Wilson, K. B., Gines, J.E., Williams-Gary, K., & Brown, S.M. (In Press). Diversity and multiculturalism among personnel: Hiring, staffing, and supervising and emerging workforce. In Flowers, C., Robertson, S., Soldner, J. (Eds.) Counseling Supervision and Administrative Practices in Allied Health Professions. Aspen Professional Services
Bruce, R.L., Wilson, K.B., & Gines, J. E. (2011). Efficacy of transferable skills analysis: A long-
standing tool or an antiquated relic. Rehabilitation Counselors & Educators Journal. Wilson, K.B., Hinojosa, T. J., & Gines, J. E. (2010). Phenotype discrimination: The experiences of
black and white Latinos with disabilities in the united states. In F. Columbus (Eds.). Color perception: Physiology, processes and analysis.
Wilson, K. B., & Gines, J. E. (2009). A national reassessment: exploring variables that predispose
people with disabilities to vocational rehabilitation acceptance. Journal of Rehabilitation Education.
TEACHING EXPERIENCE
Client Assessment in Rehabilitation and Human Services (The Pennsylvania State University),
Fall 2012, Spring 2013. Introduction to Disability Studies: Culture and Disability (The Pennsylvania State University),
Fall 2012, Spring 2013. Introduction to Rehabilitation and Human Services (The Pennsylvania State University), Fall
2012, Spring 2013. Foundations of Multicultural Counseling and Development (The Pennsylvania State University),
Summers 2012, 2013.