Compensation Structure Shifts: Rationale and Likelihood … ANNUAL MEETINGS/2013-… ·...
29
Compensation Structure Shifts: Rationale and Likelihood of Introducing ‘New Components’ Rohit Sonika *† a a Department of Accounting and Finance. Lancaster University. Version 1.3: October 31, 2012 Abstract Managerial compensation is persistent with respect to the components in the structure, but dynamic with regards to the weights of each component in a struc- ture. Given the adoption of FAS 123R that required mandatory expensing of stock options, research has documented a significant decline in option grants. However, this decline has coexisted with contemporaneous introduction of new components in a compensation structure in the form of restricted stock and long-term incentive plans. We aggregate this information to ascertain the consequences of addition or substitution of new equity components in a manager’s compensation structure and how that relates to pay-performance sensitivity and future firm risk. Our findings here corroborate the theory of efficient contracting, conditional on the nature of change undertaken in a compensation structure. Additionally, we also document the nature of firms that are likely to resort to new additions or substi- tutions, to find them differentiated by research orientation, leverage, number of operating segments, level of fixed assets and age of the CEO. Keywords: Executive compensation, compensation structure. JEL Classification: M12, M48, M52, G30 * Corresponding Author: [email protected] † I am grateful to Shantanu Banerjee, Martin Conyon, Mark Shackleton and seminar participants at Lancaster University for their useful comments and suggestions. 1
Transcript of Compensation Structure Shifts: Rationale and Likelihood … ANNUAL MEETINGS/2013-… ·...
Compensation Structure Shifts: Rationale andLikelihood of Introducing ‘New Components’
Rohit Sonika∗†a
aDepartment of Accounting and Finance. Lancaster University.
Version 1.3: October 31, 2012
Abstract
Managerial compensation is persistent with respect to the components in thestructure, but dynamic with regards to the weights of each component in a struc-ture. Given the adoption of FAS 123R that required mandatory expensing of stockoptions, research has documented a significant decline in option grants. However,this decline has coexisted with contemporaneous introduction of new componentsin a compensation structure in the form of restricted stock and long-term incentiveplans. We aggregate this information to ascertain the consequences of additionor substitution of new equity components in a manager’s compensation structureand how that relates to pay-performance sensitivity and future firm risk. Ourfindings here corroborate the theory of efficient contracting, conditional on thenature of change undertaken in a compensation structure. Additionally, we alsodocument the nature of firms that are likely to resort to new additions or substi-tutions, to find them differentiated by research orientation, leverage, number ofoperating segments, level of fixed assets and age of the CEO.
Keywords: Executive compensation, compensation structure.JEL Classification: M12, M48, M52, G30
∗Corresponding Author: [email protected]†I am grateful to Shantanu Banerjee, Martin Conyon, Mark Shackleton and seminar participants
at Lancaster University for their useful comments and suggestions.
1
1 Introduction
The objective behind compensating a firm’s agent is to align their interest with that ofthe principal. The use of stock options, which have been historically thought to alleviatemuch of the agency problems that is apparent between the two sides, however has come un-der some objection in recent literature (Carpenter, 2000; Ross, 2004). Recent research byHayes, Lemmon, and Qiu (2012) has attributed the decline in stock option grants, or, morespecifically, the change in compensation structure to the adoption of FAS 123R1. In the dis-cussion of the reasons to use or not use stock options, not much has been talked about howand why firms are substituting a majority of option grants with other equity components2 andits implications on agency cost. We try and address these issues by examining the purposeand likelihood of addition and substitution of new incentive components in a compensationstructure and how such a change might impact on pay-performance sensitivity and firm valu-ation.
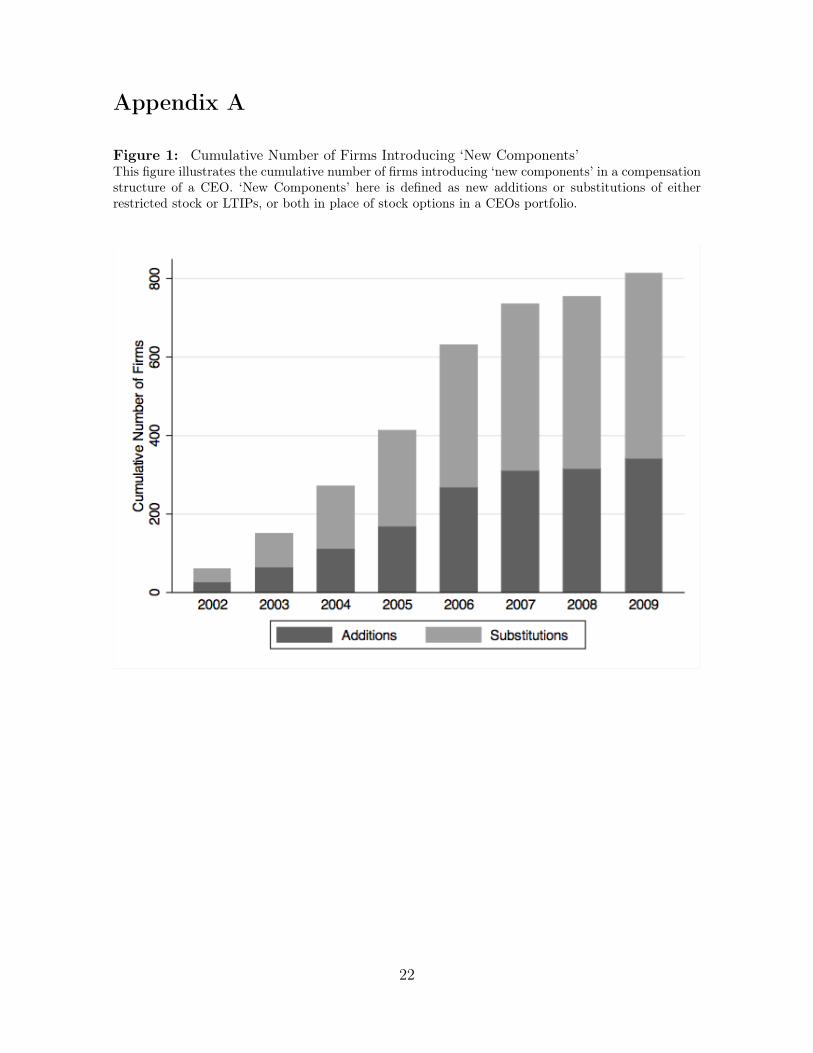
Literature on executive compensation is dense with debate on issues pertaining to pay-performance sensitivity3. In light of the importance of compensation structure in the debate,Mehran (1995) empirically examines the impact of compensation structure on firm perfor-mance. Laying more structure to this issue, Lambert, Larcker, and Verrecchia (1991) theoret-ically evaluate this relationship to find that the value of a compensation contract is conditionalon the structure of the package, and how components influence each other, rather than just thesum of all components. In their analysis of change in compensation components, the authorsfind that payoffs are consistent when new components are added to an existing compensa-tion structure. However, most firms adjust existing structure for new components to keep amanager’s expected utility unchanged4. In this context, Hayes et al. (2012) document a signif-icant decline in option grants post FAS 123R adoption due to mandatory expensing of stockoptions. Their approach to identifying the adoption of FAS 123R as the ‘exogenous’ eventinadvertently implies a change in compensation structure5 as an ex post event. While it isexpected that some firms would choose to change their compensation structure post FAS 123Radoption, there also exist firms that adjust their compensation structures prior to FAS 123Radoption. This is evident from the Figure I below, charting the cumulative number of firms
1The regulation came into effect in December 2005 for firms reporting after June 15, 2005, requiringall firms to mandatorily expense new option grants at ‘fair value’.
2Some minor exceptions include Carter, Lynch, and Tuna (2007), Irving, Landsman, and Lindsey(2011) and Brown and Lee (2011).
3See Murphy (1999), Aggarwal (2007) and Frydman and Jenter (2010) for an overview of the liter-ature.
4While the objective of Lambert et al. (1991) was to keep utility unchanged, this problem can bemodelled by adjusting a manager’s reservation utility as his expected utility prior to amendments incompensation structure. This adjusted reservation utility then feeds into the incentive feasibility setof a principal-agent problem.
5Henceforth, we imply as compensation structure that of the CEO alone.
2

that change their compensation structures by introducing new components through additionor substitution around the FAS 123R adoption. As is visible from the distribution of firmsaround the FAS 123R adoption, using a dummy variable to identify the event as exogenouswould bias the results.
[FIGURE I GOES HERE]
In order to correct the bias, we need to first account for how compensation structure haschanged in the last decade, and how this change in compensation structure impacts on thepay-performance sensitivity. Changes in compensation structure can be made in three differentways: addition, substitution or modification. If the board (or the firm) that contracts withthe CEO feels the need to introduce a new component, either in the form of a restrictedstock or long-term incentive plans (LTIPs), the contract between the CEO and the firm isrenegotiated. Depending on contractual agreements, the new component could be introducedin a compensation structure in two different ways. First, there could be a contemporaneousincrease in the value of new option grants when new components are introduced. This leads toan increase in the overall compensation. We define such firms as ‘adding’ firm. Second, the newcomponents could be introduced while contemporaneously substituting with the value of newoption grants. We define such firms as ‘substituting’ firm. While addition and substitutionof new components are most likely to trigger contract renegotiation, modification of weightsof existing components need not require any renegotiation. We define a firm as ‘modifying’ ifonly the weights of its existing components are changed and no new component is introducedin the compensation structure. Due to the increasing adoption of stock options in a CEO’sincentive portfolio (Hall and Liebman, 1998; Murphy, 1999), we only consider cases wherefirms are adding or substituting components in lieu of stock options. As for modifying firms,these could include a range of firms with either cash-only components (salary and bonus) toall cash and equity components (salary, bonus, stock options, restricted stocks and LTIPs),without any change in the number of components.
We borrow from the intuition of Lambert et al. (1991) to differentiate between firms onthe basis of their adjustment of compensation structure. We test our first hypothesis that ad-dition of new components to a structure creates incentives different from instances where newcomponents are introduced through substitution. As we verify the validity of this hypothesis,a corollary would be to identify if these differences in incentives are used to reduce agency costor extract rent by opportunistic managers. Through changes in compensation structure, afirms seeks to maintain the objective of incentivising its manager while maintaining his reser-vation utility. In case of incentive substitution, there is risk that new components introducedin place of stock options might not provide the necessary incentive to take risk-increasinginvestments, as desired by risk-neutral investors. Furthermore, additions made to a structuredirectly increase the total compensation of a CEO, which has the implication of inefficiency in
3
compensation. This inefficiency could be a cause or a consequence of new additions. What wemean by that is new additions could be made to align incentives or exhibit the ability of a CEOto extract rent. Hence, as our second hypothesis, we test the null argument that additionsto a compensation structure are made to provide incentives that temporarily get misalignedin the short term, mainly due to the introduction of FAS 123R, while substitutions createinefficiencies as incentives are directed away from stock options, which are thought to reduceagency costs. Additionally, due to magnitude of change in total compensation, as will becomeapparent later, we add a maximum-likelihood framework to our study to determine the natureof firms that add or substitute new components to a manager’s compensation structure.
Accounting for the endogenous nature of incentives in determining firm risk, our findingsfirst reveal a significant difference between firms that either make new addition or substitutionof new components. By way of our structural definition, new additions significantly increasea CEO’s total compensation, while substitutions have no effect on the same. Equity substi-tutions are also found to be negatively associated with total values of delta, measured by thesensitivity of CEO’s incentive to a firm’s share price, and vega, measured by the sensitivity ofa CEO’s incentive to the standard deviation of a firm’s stock return. Consequently, addition ofnew components is found to insignificantly affect our measure of delta, but marginally decliningvega. We examine if these changes in compensation components and sensitivities are associ-ated with incentive alignment or rent extraction. If the objective is to align principal-agentinterest, we should expect to see a non-negative association between vega and firm volatil-ity, our measure of firm risk, while if changes in compensation structure enable opportunisticmanagers to extract rent, then the same association will be negative. Using an instrumentvariable systems approach, our results exhibit that the association between incentive (vega)and forward-looking measure of firm risk is negative when firms add new components. Thesefindings are consistent with the managerial-power argument for additions where additions candiverge pay-performance relationships. When firms substitute away from stock options, andin to other forms of equity compensation like restricted stock and LTIPs, the association isinsignificant. This finding corroborates with the efficient bargaining argument that can helpmaintain a manager’s utility without compromising on firm performance. Finally, we exam-ine the likelihood of firms to add or substitute new components in a compensation structure.Our findings associate adding firms to be more research intensive, while substituting firms arefound to be dividend paying firms, with relatively lower investment opportunity.
Collectively, our findings make significant addition to the ever-growing debate on compen-sation policy and structure. We make contribution to the debate from a few ends. First, weprovide empirical evidence on the hypothesis of ‘new components’ developed by Lambert et al.(1991) and Hall and Murphy (2002). Research on executive compensation has mainly beenconcerned with the sensitivity of incentives provided to executives to the performance or risk ofthe underlying firm. While the dynamics of compensation structure is implied in the changing
4
incentives, it does not explicitly account for the new components introduced in a compensationstructure and its impact on pay-performance sensitivity. We provide evidence with respect tothe same.
Second, we are able to develop on the work of Carter et al. (2007) and Hayes et al. (2012)who use the adoption of FAS 123R as an exogenous shock to test pay-performance sensitivity.Our approach using the change in compensation structure is able to address the same questionwithout the issue of true exogeneity of the FAS 123R adoption. Our sample selection procedurehelps us incorporate the effect of FAS 123R as per the methodology of Carter et al. (2007)6.
Third, our analysis enables us to differentiate between firms that change incentives whileincreasing overall compensation, as compared to firms that change incentives without anychange in compensation. In addition, our analysis also enables us to understand the natureof firms that are likely to be of the former type, and what motivates them to be so. Increas-ing compensation is often perceived in the media with excess pay or entrenched CEO. Theidentification of firms adding or substituting new components helps shed light on this issue byassociating the rise or consistency in pay with cause or consequence.
The rest of the paper is organised as follows: the next section discusses the literature in briefand develops the hypotheses tested; Section 3 describes the research design and methodologyused in this study, Section 4 introduces the sample data and preliminary statistics on the dataused for this study; Section 5 presents the empirical results and their implications; Section 6concludes.
2 Literature review and hypothesis development
The agency problem between the principal (firm) and the agent (manager) has been widely dis-cussed since the early work of Ross (1973), Jensen and Meckling (1976) and Holmstrom (1979),all of which propose the use of equity-linked pay to better align the interest of the principal andthe agent. Even since, a lot of issues have been brought into the forefront of discussion in cor-porate finance in reference to executive compensation, including optimality of compensationcontracts (Demsetz and Lehn, 1985), convexity of stock options (Jensen and Murphy, 1990),pay-performance sensitivity (Smith and Watts, 1992), design of compensation contracts (Kole,1997), etc. The use of equity-based pay has certainly been the norm since Jensen and Murphy(1990) compared the pay of CEOs to be similar to those of bureaucrats. In the context ofcompensation components, the use of stock option has been the key driver for the increase inperformance-related pay, at least till the mid-1990s (Hall and Liebman, 1998; Murphy, 1999).Stock options have been thought be provide the convexity essential to enable a manager to
6Carter et al. (2007) define the financial year 2002-03 as the year when firms began expensing stockoption grants, although the same was not made mandatory until 2005.
5

undertake risk-increasing investments, as desired by risk-neutral investors. As such, grants ofstock options are expected to be positively associated with future firm valuation7.
Literature has verified two debatable issues with the above argument for stock options.The first relates to the endogenous relationship between firm valuation or performance andmanagerial incentives. Palia (2001) and Coles et al. (2006) take the initial steps in addressingthe endogeneity issue, while others like Gormley, Matsa, and Milbourn (2012) have resortedto a natural experiments approach. The second issue relates to the validity of stock optionsto provide the necessary incentives to a manager to increase firm risk. Theoretical work byCarpenter (2000) and Ross (2004) find the absence of any incentive levels that can minimisethe risk aversion of a utility maximising manager. The empirical findings of Hayes et al. (2012)lead in this direction.
From a technical standpoint, stock options also have issues with valuation and account-ing treatment. Managers, as opposed to shareholders, are undiversified, risk-averse and arerestricted from short-selling or hedging their equity holdings in their firm, all of which vio-late the standard assumptions of option valuation originally proposed by Black and Scholes(1973). The issue of executive stock option valuation using standard option pricing methodswas also brought to the forefront as early as Lambert et al. (1991), with more extensive workby Hall and Murphy (2002). Although these papers make use of simulation procedures tomodel a CEO’s private wealth, such forms of data are not easily obtainable. Additionally,accounting for stock option grants was not made mandatory until the adoption of FAS 123R,which required firms to expense the grants of stock options at fair value. In recent years, theimpact of such a rule change has been examined to associate issues like accounting benefitsand firm performance to incentives granted to a CEO (Carter et al., 2007; Irving et al., 2011;Hayes et al., 2012). They examine the impact of such a rule change, but remain silent onthe substitution between different components in a compensation structure that might im-pact firm risk and, potentially, future firm performance. Specifically, Hayes et al. (2012) andCarter et al. (2007) link the additional cost of option grants to its decline in a compensationstructure post FAS 123R.
In their critique of the optimal contracting view of Demsetz and Lehn (1985),Bebchuk, Fried, and Walker (2002) propose that managers hoping to maximise their rent ex-traction will continue to do so, but the process of rent extraction can be slow due to the stickynature of boards and compensation committees to stick to the norms established. Sticky na-ture of managerial contracts offer limited deviations in pay even when business environment iscontinuously evolving. Theoretical work has been rife in the examination of dynamic optimalcontracts, starting with the early work of Holmstrom and Milgrom (1987) but the empiri-cal application has been limited, usually involving long time-series data (Boschen and Smith,
7This may not always hold true if the concavity, or risk aversion of a manager supersedes theconvexity provided by option grants (Lambert et al., 1991).
6
1995; Frydman and Saks, 2010). The stickiness of compensation contracts can be understoodif exogenous shocks force firms to change incentives provided to managers. In this respect,papers like Carter et al. (2007) and Hayes et al. (2012) use the adoption of FAS 123R as theexogenous event to ascertain pay-performance relationships. The problem with using regula-tory events as exogenous shocks is that their effect is normally elongated over time, enablingfirms to either make changes voluntarily before the adoption of the regulation or mandatorilywhen regulation comes into effect. Due to this, using dummies to separate the effect of reg-ulation in a firm averages the effect of changes made in a firm, thus leading to inconsistentestimates. We hope to correct for this.
In understanding the effect of compensation on firm valuation in an endogenous frame-work, we take the approach of how the mix of compensation components changed in the lastdecade. Mehran (1995) and Bryan, Hwang, and Lilien (2000) provides an early empiricalanalysis of the importance of the structure of compensation contracts. Their work builds onthe theoretical argument of Lambert et al. (1991) who suggest that the mix of componentsin a structure provides different incentives to different managers. More specifically, theyrelate the difference in incentives to the changing nature of components in a compensationstructure. They propose that value of incentives of new components added to the structurewill depend on how adjustments are made to the existing components. We use this conjectureto estimate the change in total incentives of firms that adjust their compensation structureand its association with future firm risk. As our first hypothesis, we provide a direct test ofthe theory proposed by Lambert et al. (1991). We state our first hypothesis (in alternativeform) as follows:
H1 : Firms that add new components to a CEO’s compensation structure will createtotal incentives different to firms that substitute new components in lieu of stock options,both relative to firms that do not introduce new components in a compensation structure.
When new additions are made to the compensation structure, they are bound to in-crease total compensation. Literature has often argued for the benefits of stock optiongrants and the convexity provided can enable managers to take the level of risk desired byrisk-neutral investors. Alternatively, Hall and Murphy (2002) have also argued for the costbenefit of restricted stock and why they might be preferred when a company and its executiveare allowed to bargain their contract. Their numerical analysis suggests that equity-based payin the form of stock options provided as an add-on to a compensation creates inefficiencies,leading to overpaid executives. This might diverge the expected relationship between payand performance. On the other hand, substitution can facilitate efficient bargaining leadingto the use of other equity-based measure like restricted stock that can lower company cost,while still maintaining executive’s utility. However, their substitution argument relates to the
7
substitution of cash-based measures. The substitution of stock options for other equity-basedmeasures will reduce the sensitivities, but if efficient bargaining is undertaken to maintainthe CEO’s expected utility, then firm valuation should be maintained or improved. Thus, westate our second hypothesis (again, in alternative form) in two parts, as follows:
H2a: Addition of new components to a CEO’s compensation can diverge pay-performancerelationship, leading to a non-positive relationship between incentives and future firm risk.
H2b: Substitution of new components in place of stock options can further increasealignment of pay with performance, leading to a non-negative relationship between incentivesand future firm risk.
In the next section, we detail the research methodology we undertake to test the above hy-potheses, and our definition of firms that add or substitute new components in a compensationstructure.
3 Research design and methodology
3.1 New additions and substitutions
We categorise firms as adding, substituting or modifying firm depending on the nature ofchange in a compensation structure. In any given year, if firms introduce new componentsin a structure while also contemporaneously increasing or keeping fixed the value of currentoption grants, such firms are classified as those ‘adding’ new components. To ensure we arecapturing firms that are strictly adding new components in the firm-year in question, weimpose two further restriction. First, firms that add new components do not abandon stockoptions in the year before or after new component introduction. The reason for imposingthis restriction helps us ensure that the firm-year identified by us as the year of new additiondoes not reflect a one-off grant, or is not a temporary adjustment in the current year only toabandon stock options in the year following the new addition. Second, it is likely that firmsmight have introduced new components in some years prior to the firm-year of introductionidentified by us. To avoid this erroneous classification, we impose another restriction wherebyonly firms that have not introduced new components in at least 5 years prior to introductioncan be classified as either addition or substitution.
As is the case with new equity addition, we define firms as substituting if they introducenew components in a CEO’s compensation scheme while concurrently reducing the value ofnew option grants. We impose the same restriction of identifying new introductions as wedid above for additions, although we do not require firms to not abandon stock options. It is
8
very likely that firms that begin substituting stock options for other means try to eventuallyabandon new option grants. This is implied as part of the substitution argument.
While we test the theory of difference in incentives created due to either addition orsubstitution of ‘new components’, these incentives are measured against a basket case of firmthat do not change their mix of components offered to a CEO. Incentive differential createdthrough minor modifications in compensation will be be lower compared to the differentialswhen ‘new components’ are either added or substituted. Hence, we resort to a group of firmsthat do not introduce any new components in a CEO’s compensation structure. These firmscontinue to compensate the CEO using the same components, while only changing the weightsof the components to adjust their incentives to the CEO. We define such firms are ‘modifying’firms.
3.2 Methodology
The hypotheses defined in the previous section requires a mix of methodologies in our cur-rent study. In addressing the first hypothesis, which is a direct test of the theory proposedby Lambert et al. (1991), we need to control for unobserved heterogeneity that might bepresent between firms. Controlling for firm fixed-effects has been done consistently sincethe work of Himmelberg et al. (1999), and more recently in the the 2SLS framework byArmstrong and Vashishtha (2012). As a first step, we estimate the impact of new additionsand substitutions on compensation components. In a framework similar to Hayes et al. (2012),we adopt the spell regression as follows:
CCOMPit = β0 + β1DUMMYit + β2LTAit + β3TENUREit + φi + µt + εit (1)
In equation (1) above, the dependent variable (CCOMP) includes the proportion of all com-pensation components to total compensation, while also including the log-normalised measureof total compensation to assess the impact of addition and substitution on total compensation.The independent variables include a dummy (DUMMY ) for either addition or substitutionof new components, the log-normalised measure of a firm’s total assets (LTA) and the CEO’stenure (TENURE ). We also control for the unobserved firm fixed-effects (φi), while also con-trolling for the time effects (µt). εit captures the manager’s residual compensation.
Similar to the compensation component regression above, we evaluate the effect of additionand substitution on incentives in equation (2) below. The dependent variable (CSENS ) nowrefers to our log-normalised measures of total delta and total vega sensitivities, while theindependent variables in equation (2) are similar to (1), except for the new added variable of
9
CEO cash compensation (CASHC ).
CSENSit = γ0 + γ1DUMMYit + γ2LTAit + γ3CASHCit + γ04TENUREit
+φi + µt + εit (2)
The debate on executive compensation is rife with instances of causality run-ning in both directions between incentives and firm performance. Early research byMorck, Shleifer, and Vishny (1988) and McConnell and Servaes (1990) have shown incentivesto affect performance, while Smith and Watts (1992), Yermack (1995), Core and Guay (1999)and others have found firm performance to determine managerial incentives. In this argumentof causality, Palia (2001), and later Coles et al. (2006) utilise a systems approach to exam-ining the effect of incentives on firm performance. Their systems approach using two-stageleast square (2SLS) or generalised method of moments (GMM) has found popularity in recentwork by Brockman, Martin, and Unlu (2010) and Armstrong and Vashishtha (2012). Usingexogenous events, research by Gormley et al. (2012) and Low (2009) present intuitive findingsthat helps us better understand the causality of incentives and performance. Although usingan exogenous event sounds appealing, its use in our research question is difficult as changes incompensation structure cannot be easily made due to contractual obligations of a firm. Hence,using the methodology of Palia (2001) and Coles et al. (2006), we adopt a 2SLS frameworkusing instrument variables to address the endogenous nature between incentives and perfor-mance, while considering both measures of sensitivity, vega and delta, as endogenous8. Wedefine the first-stage and second-stage regressions as follows:
CSENSit = η0 + η1SDit + τZit + ηCit + λit + φi + µt + ε1it (3)
SDi(t+1) = θ0 + θ1V EGAit + θ2DELTAit + θCit + λit + φi + µt + ε2it (4)
Equation (3) above is the first-stage regression with each sensitivity (VEGA and DELTA)being regressed on our measure of firm risk (SD). The specification also includes a set ofinstruments, defined as Z . C relates to different control variables used in both first and second-stage regressions, including log-normalised value of total assets, leverage, market-to-book, salesgrowth, cash compensation, property, plant and equipment, CEO tenure, price-to-strike ratioand proportion of stock options to total compensation. The estimated value of VEGA andDELTA are then used in the second-stage regression using the specification defined in equation(4). The same set of included instruments, defined by C are used in the second-stage as well.Additionally, we also include a control variable (λit) for the self-selection problem inherent in
8The endogenous nature of both vega and delta was considered by both Coles et al. (2006) andArmstrong and Vashishtha (2012).
10
our study. We use the procedure described by Wooldridge (1995) to compute the inverse Mill’sratio cross-sectionally for each year of our panel and then pool them by interacting the ratiowith the year-specific dummies9. In both the specifications, we control for the firm fixed-effect(φi), while also controlling for time effects(µt).
For our first set of instrument, we follow Armstrong and Vashishtha (2012) and use a firm’sperformance, measured by contemporaneous stock returns (Returnt) as instrument of log-normalised vega and delta. The overall compensation of a CEO is highly dependent on equity-based measures of stock options, restricted stock and LTIPs. These grants of equity-basedcomponents and their sensitivity to stock returns and volatility is correlated with the pastperformance of a firm, which will indirectly affect a firm’s future valuation. Contemporaneousand past returns are not likely to be related a firm’s future valuation.
As a second instrument for our endogenous incentive variables, we use the meantotal compensation of firms incorporated in the same state as the underlying firm.Becker, Cronqvist, and Fahlenbrach (2010) adopt the approach to determine the effectof local wealthy individuals in attracting large blockholders. Proximity of local di-rectors as an important determinant of board governance was recently documented byKnyazeva, Knyazeva, and Masulis (2011). We use the approach in similar context but with adifferent application. We expect the average compensation levels in any given state to havean effect on the compensation level of a CEO in that particular state, without any directconsequence on the risk-taking ability of a firm.
4 Variable measurement and sample selection
4.1 Measuring sensitivities
In order to make our analysis easily comparable to some of the recent empirical work, wefollow the procedure described in Core and Guay (1999, 2002) to compute our measures ofsensitivities. Prior to computations of sensitivities, we first construct a CEO’s incentive port-folio, which included salary, bonus, stock options, restricted stock and LTIPs. Stock optionsare valued based on the methodology described by Core and Guay (2002) for past exercis-able and unexerciseable grants, while current grants are valued using the formula proposed byBlack and Scholes (1973), and as modified by Merton (1973) to include dividends. Since ex-ecutive options are never really held till maturity, we follow Coles, Daniel, and Naveen (2006)and adjust the maturity downwards to 70% of its stated life. We aggregate the valuationof all components to compute delta10, measured as the sensitivity of change in the value of
9The results on nine cross-sectional regressions are suppressed here for conciseness. Details onspecification and results are available upon request.
10This is equivalent to the Total Delta computation by Hayes et al. (2012).
11
the CEO’s incentive portfolio to a 1% change in the underlying stock’s price. Similarly, wecompute the option vega as the sensitivity of the change in the total option value to a 0.01change in the standard deviation of the return of the underlying stock.
In addition to estimating the value of stock option grants, the components of restrictedstock and LTIPs require valuation of both new grants as well as grants made earlier thatmay or may not have vested. In valuing these two components, we follow the computationprocedure provided by Hayes et al. (2012) where restricted stocks are valued based on the fairvalue estimates, while LTIPs are estimated using both pre and post FAS 123R disclosures, asprovided by Execucomp11.
4.2 Measuring firm risk
Our second hypothesis requires us to examine the effect of incentive sensitivities on firmperformance, while also taking into account the endogenous nature of relationship betweenthe two variables. Recent empirical work has highlighted the importance of choosing theright performance measure to test its association with incentive measures. Coles et al.(2006) and Hayes et al. (2012) use specific measures of risk like research and developmentcosts, capital expenditure, firm leverage, etc., while work by Low (2009) and more recentlyArmstrong and Vashishtha (2012) use aggregate measures of risk which is then segregated intosystematic and idiosyncratic specific risks. To ease the demand on our computation, we followLow (2009) and use the standard deviation of annualised daily returns from the following year.To facilitate comparison and robustness of our findings, we also use the specific measures ofresearch and development costs, capital expenditure and firm leverage used by Coles et al.(2006).
4.3 Sample selection
In order to make our study most easily comparable to other empirical work in the field, wecombine a range of different data sources which have become standard for studies on executivecompensation. We first obtain annual compensation data of a CEO from Execucomp. Asmentioned earlier, we merge the different tables provided in Execucomp as per the proceduredetailed in Hayes et al. (2012) to arrive at computations of different components. Next, wecombine this compensation data with firm fundamentals used in this study from Compustat.We also combine the CRSP dataset to compute the annualised daily stock return of the firmsrepresented by the CEO. Finally, we compute certain governance measures from RiskMetricsand combine it with the merged dataset. Due to certain data definitions and restrictions, our
11As per Hayes et al. (2012), pre-FAS 123R estimates can be found in the Long Term IncentiveAwards - 1992 Format file in Execucomp. For post-FAS 123R numbers, estimates are split betweenPlan Based Awards and Annual Compensation files for current and prior grants respectively.
12

data classification begins in the year 200212 until 2009, which encompasses 9,499 non-missingobservations.
[TABLE I GOES HERE]
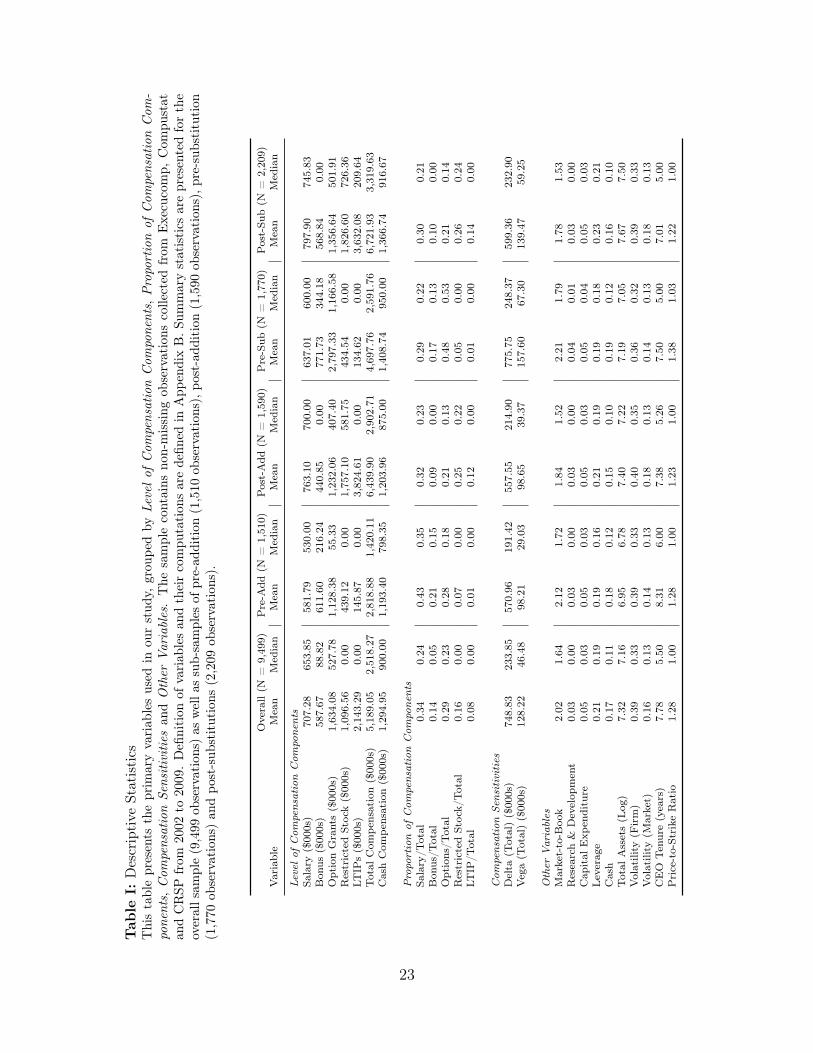
Table I above presents descriptive statistics of the variables used in our study. As describedin the previous section, our definition of new component additions or substitutions accounts5 years of compensation data prior to classification commencement. As we can see, mostof our measures of firm characteristics are near identical to the ones used by Hayes et al.(2012). Our computations of vega and delta are also comparable to the descriptive results ofHayes et al. (2012), while they are marginally larger than the means and medians reportedby Armstrong and Vashishtha (2012). This is likely due to our use of only recent data, whilethey use data beginning from 1992. As is the case with Armstrong and Vashishtha (2012) andCore and Guay (1999), our measures of vega and delta are also highly skewed, which we thenlog-normalise.
Table I above also presents the statistics for the sub-samples of firm adding and substi-tuting new components. The statistics presented are for both pre and post new addition orsubstitution. We observe a big change in total compensation for firms adding new components,wherein the average total compensation increases from $2.8 mln. to $6.4 mln. post-addition.In similar context, average total compensation between firms substituting increase from $4.7mln. to $6.7 mln. While the differences in compensation numbers are apparent between firmsadding and substituting, post-introduction, the proportion of compensation components tototal compensation are more aligned for the two groups of firms. Change in total compen-sation between the two groups of firms also leads to a change in the delta and vega. Foradding firms, the sensitivities remain consistent in both the pre and post periods. However,firms substituting substantially reduce their delta and vega of compensation to a CEO. As forother variables, most variables are consistent, except for firm size, which exhibits that firmsin both the groups in the post-introduction period are larger than their corresponding pre-introduction period. There is also a substantial decline in CEO tenure in the post-introductionperiod, while probably signifies a change in CEO, which we will explore further.
5 Empirical results
5.1 Impact of addition and substitution on compensation
In our first attempt to understand the impact of introducing ‘new components’ in a compensa-tion structure, we analyse, seperately, the significance of adding and substituting compensation
12Classification beginning in 2002 utilises new equity introduction data from 1998 onwards.
13
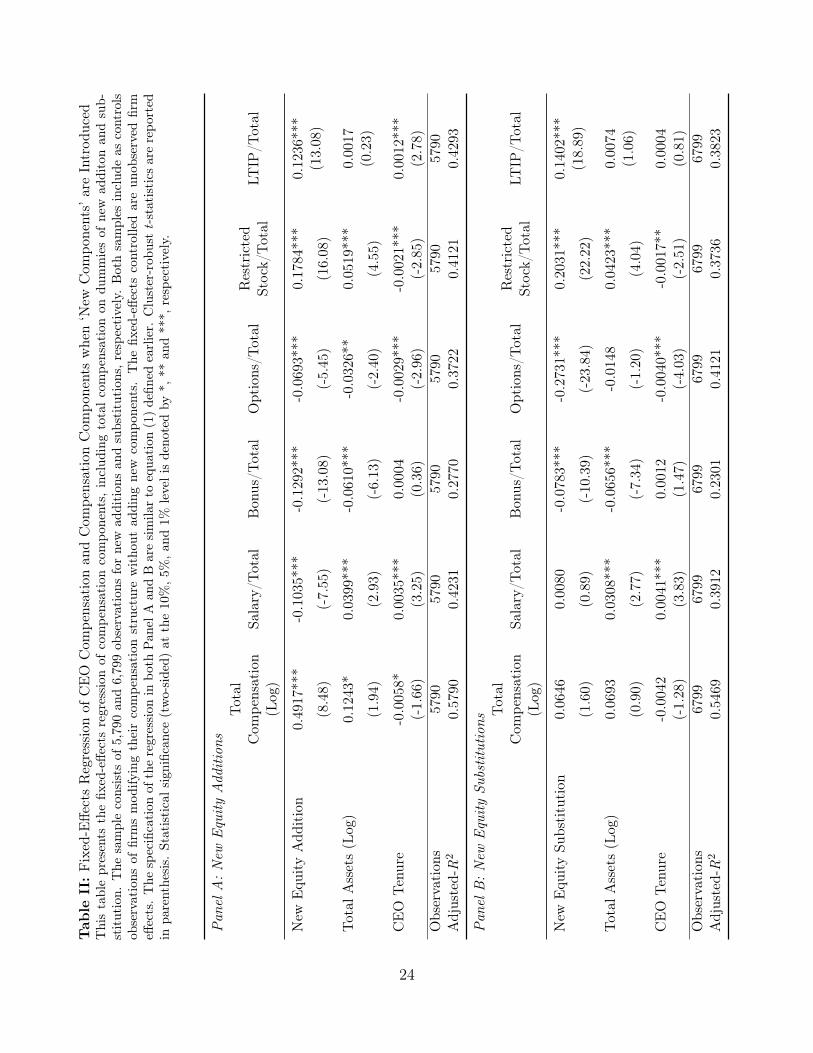
components in a compensation structure. In both the cases of addition and substitution, thefirm-year in which the ‘new component’ is introduced and subsequent firm-years are classifiedas adding or substituting firm-years. The control set includes both the firm-years prior to ‘newcomponent’ introduction as well firm-years with modification in a spell-regression framework.We present the results in Table II below.
[TABLE II GOES HERE]
Panel A presents the results for firms making addition. As expected, we can see thatadding new components increase a CEO’s total compensation by USD 1.68 mln on average13.We can also deduce that most of the increase in compensation is due to introduction of eitherrestricted stock or LTIPs. As for the fixed components of salary and bonus, we report anegative association with new additions. The decline in the proportion of cash components intotal compensation could either be due to the overall increase in total compensation withoutmuch change in cash compensation, or an eventual decline in cash compensation. Similarintuition applies to the negative association observed for the proportion of stock options.These associations are similar to the findings of Hayes et al. (2012), albeit our setup reportssignificantly larger coefficients for overall compensation, restricted stock and LTIPs, while ourcoefficient for stock options is significantly lower.
Results for substituting firms, as shown in Panel B, differ with both Hayes et al. (2012)and our findings for firms adding ‘new components’. Total compensation, although increasing,does not change significantly when firms substitute new components in place of stock options.In this regard, the coefficient for the proportion of stock option grants is significantly negative,and is lower than one reported by Hayes et al. (2012). Our coefficients in regressions of re-stricted stock and LTIPs also remain positive, although the coefficient is greater for restrictedstock when firms substitute than when firms add. It goes to show that restricted stock, as aproportion to total compensation, play an equivalent, if not more important role when firmssubstitute when compared to adding firms. Substituting firms are also found to make insignif-icant changes to a CEO’s salary, while the proportion of bonus to total compensation is foundto be lower by 6%.
5.2 Impact of addition and substitution on sensitivity
The use of stock options have been primarily motivated as a way to increase the con-vexity of a manager’s pay so as to enable him to undertake risk-increasing investments(Jensen and Meckling, 1976; Jensen and Murphy, 1990). However, our primary argument re-lates to impact of ‘new component’ introduction on sensitivities, and not the direct ability of
13As the total compensation variable is log-normalised, the coefficient on the new addition variableis exponentiated.
14

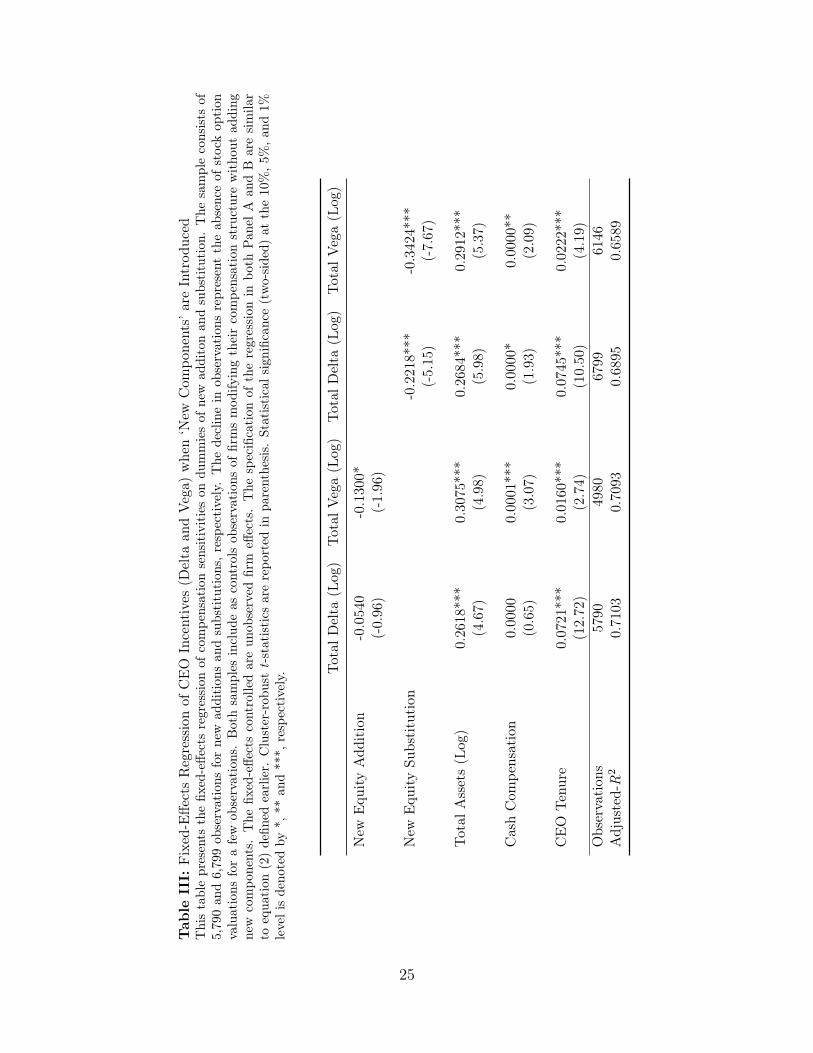
stock options to increase convexity, and its coexistence with a manager’s concave utility func-tion. Hence, a decline in stock option grants can invariably lead a reduction in the sensitivitiesof delta and vega. We present out findings in Table III below.
[TABLE III GOES HERE]
We observed from Table II earlier the impact of new additions and substitution on thecomponents of a compensation structure. We find new additions to significantly increase totalcompensation while marginally reducing the proportion of new option grants in the overallcompensation of a CEO. Similarly, substitution leads to an insignificant increase in totalcompensation, while significantly reducing the proportion of new option grants in the overallcompensation. This significant decline in the proportion of stock option grants and its impacton sensitivity is clearly visible in our findings in Table III above. When ‘new components’ areintroduced in a compensation structure through substitution of stock options, we observe asignificant decline in both the sensitivities of delta and vega. However, such is not the casewhen new additions are made to the compensation components. The delta sensitivity remainsunchanged when either restricted stocks or LTIPs or both components are introduced in aCEO’s compensation structure through addition, but leads to a marginally significant declinein vega. This finding is in line with the theory proposed by Lambert et al. (1991), highlightingthe difference in incentives created between new addition and substitutions. Lambert et al.(1991) evidences that when new components are added, the result can be similar to a standardcontract trying to induce convexity while balancing with the risk-averse nature of a manager.However, when components are introduced through substitution, ‘the partial derivative [ofmanager’s utility to stock return volatility] will be more negative than the correspondingderivative’ when new additions are made. This evidence is clear from our findings above, thuscorroborating with our first hypothesis.
5.3 Changes in firm risk with endogenous incentive contracts
We have seen above the difference in total compensation, compensation components and com-pensation sensitivities when new components are introduced either through addition or sub-stitution. In case of new additions, the function of partial derivative of a manager’s expectedutility on the standard deviation of stock return might increase the convexity of a manager ifexisting options are out of the money. However, excessive addition can make a manager riskaverse as the options get deep in the money (Lambert et al., 1991). This consequence of newaddition was also observed in the theory of ‘managerial power’ proposed by Bebchuk et al.(2002), citing the ability of managers to extract rent from their company when its most op-portunistic for them to do so. We provide empirical evidence on this matter to ascertain ifaddition of new components lead to a deviation away from proposed alignment of interest
15
between the principal and the agent, leading to a non-positive association between incentivesand firm risk. Results are presented in Table IV below.
[TABLE IV GOES HERE]
The columns of Total Vega (Log) and Total Delta (Log) correspond to first stage regres-sion in a two-stage least square (2SLS) regression framework, using instrument variables. Adescription of the instruments have been provided in an earlier section. The last column ofFirm Risk provide the coefficient estimates from the second-stage regression. Results hereexhibit a significant negative relationship between both the incentive measures of vega anddelta, and future firm risk. This finding falls in line with our expectation that entrenchedmanagers will want to extract rent when it is most opportunistic for them, thus creating adivergence between firm risk and the incentives provided. Other control measures that arestatistically significant include firm size, investment opportunity, CEO tenure, CEO age andcapital expenditure. Including the inverse Mill’s ratio for the self-selection correction alsoshows significance at 1%, highlighting the importance of selection in our setup. Other controlmeasures are not found to be statistically different from zero.
As suggested by Lambert et al. (1991), substituting new components can alter the slopeof the function, depending on the moneyness of the option. The theoretical work ofHall and Murphy (2002) suggests that efficient bargaining between the firm and its man-agers can lead to optimal substitution with the manager able to maintain his expected utilitywithout the firm having to sacrifice on firm performance. Hence, if substitution can lead todecline in the incentives (as shown in Table III above), then the relationship between suchincentives and future firm risk ought to be either positive or insignificant from zero. Resultsshown below in Table V proves the same when future firm risk and incentives are regressed inan endogenous framework. Corroborating with our hypothesis on substitution, we maintainthat efficient bargaining can lead to insignificant changes in pay-performance relationship,although granting fewer stock options can lower firm cost by minimising future liability. Inour specification, similar variables hold significance, excluding firm size and CEO age. Thecoefficient on the self-selection correction term is also significant at 1%.
[TABLE V GOES HERE]
Our findings above for both addition and substitution are robust to additional dum-mies for industry and time periods that have been included in prior literature (Palia, 2001;Armstrong and Vashishtha, 2012), albeit with some sacrifice in efficiency. Findings are alsorobust to different dependent variables used by Coles et al. (2006) and Hayes et al. (2012).Additionally, while our specification here is testing the average effect of the firms that intro-duce new components, the findings are robust to testing on firm-years when new componentsare added or substituted.
16
5.4 Nature of firms introducing ‘new components’
The discussion, until now, has been centred around the level and sensitivity of compensationcomponents, and its association with firm risk. Due to the sticky nature of compensationcommittee members to stock to the norm, and the rapid standardisation of stock optiongrants in the last decade or two, not much has been discussed about the nature of firms thatresort to alternative forms of pay, or firms that change the structure of their compensationcontracts. The research design of our study enables us to use a maximum-likelihood approachin a panel-data setup to determine the nature of firms that add or substitute new componentsto a compensation contract. Table VI below presents our findings.
[TABLE VI GOES HERE]
The findings above show that firms that add or substitute are very alike in some respect totheir firm size, investment opportunity, option moneyness and tenure of the CEO. However,they differ a lot in other aspects. Firms that add are highly research oriented, operating infewer business segments, while also being highly under-levered. The odds of total compen-sation is also very high amongst adding firms, relative to substituting firms. Compared tofirms adding new components, substituting firms are over-leveraged and have younger CEO’s.Substituting firms are also found to have larger fixed assets and higher stock returns to share-holders. Most other variables remain statistically insignificant.
6 Conclusion
The discussion of pay-performance sensitivity in the compensation literature has been pro-longed since the early works of Jensen and Meckling (1976) and Holmstrom (1979) proposingthe use of equity-based methods to compensate a manager to undertake risk-increasing activi-ties. In this light, researchers have take different approaches to analysing the pay-performancesensitivity, including the design of compensation contracts (Kole, 1997), structure of compen-sation contracts (Lambert et al., 1991; Mehran, 1995), etc. As part of the numerical analy-sis undertaken, Lambert et al. (1991) exhibit that the incentives created when compensationstructures are adjusted to add new components will be different from incentives when similaradjustments are made through substitution. We borrow from the intuition of Lambert et al.(1991) to differentiate between firms on the basis of their adjustment of compensation structurein our analysis of pay-performance sensitivity.
In our analysis of the impact of addition and substitution of new components on com-pensation structure, we find that firms that add new components significantly increase totalcompensation, mainly through increases in restricted stocks and LTIPs. While additions aremade by contemporaneously adding or keeping fixed the number of option grants, our analysis
17
reveals that, over time, the proportion of options to total compensation declines when firmsadd new components. Similarly, when firms substitute, new components are introduced bymaking insignificant changes in total compensation, but significant reductions in stock op-tion grants. When considering the sensitivities of delta and vega, we find additions makeinsignificant adjustments to both sensitivities. This result is expected as option grants areonly adjusted marginally. However, substitution significantly reduces the values of both deltaand vega. This is mainly due to the significant reduction in option grants when alternativeslike restricted stocks or LTIPs are used.
While the issue of valuing executive stock options is ever-present (Core and Guay, 2002),the endogeneity of the relationship between pay sensitivity and firm performance makes theanalysis more complex. Recent literature on executive compensation has been rife with discus-sion on pay-performance sensitivity, using a multitude of approaches including system equa-tions (Palia, 2001; Armstrong and Vashishtha, 2012), natural experiments (Gormley et al.,2012), potentially exogenous events (Carter et al., 2007; Hayes et al., 2012), etc. We use thesystems approach used by Palia (2001) to determine the relationship between incentives andfirm risk. Our findings suggest that firms that add new components do so at the cost of firmperformance as the relationship deviates between incentives and firm risk. When firms sub-stitute, the new components introduced have insignificant effect on the risk-taking ability ofthe manager, leading to a non-negative statistically insignificant association between the twomeasures.
Our findings have implications for the optimal-contracting theory proposed byDemsetz and Lehn (1985), conditional on the nature of adjustment undertaken in a com-pensation contract. The differences in incentives through addition or substitution and theiralignment with agency issues were also discussed by Hall and Murphy (2002), wherein addingto compensation contracts can create inefficiencies while substitution can stem from efficientbargaining between the principal and the agent. We provide empirical evidence with regardto both the views.
18

References
Aggarwal, R. K. 2007. Executive Compensation and Incentives. In B. E. Eckbo (ed.), Handbookof Empirical Corporate Finance, pp. 497–538. San Diego: Elsevier.
Armstrong, C. S., and R. Vashishtha. 2012. Executive stock options, differential risk-takingincentives, and firm value. Journal of Financial Economics 104:70–88.
Bebchuk, L., and J. Fried. 2003. Executive compensation as an agency problem. Journal ofEconomic Perspectives 17:71–92.
Bebchuk, L. A., J. M. Fried, and D. I. Walker. 2002. Managerial Power and Rent Extraction inthe Design of Executive Compensation. The University of Chicago Law Review 69:751–846.
Becker, B., H. Cronqvist, and R. Fahlenbrach. 2010. Estimating the Effects of Large Sharehold-ers Using a Geographic Instrument. Harvard Business School Working Paper No. 1101012.
Black, F., and M. Scholes. 1973. The Pricing of Options and Corporate Liabilities. Journal ofPolitical Economy 81:637–654.
Boschen, J. F., and K. J. Smith. 1995. You Can Pay Me Now and You Can Pay Me Later:The Dynamic Response of Executive Compensation to Firm Performance. The Journal ofBusiness 68:577–608.
Brockman, P., X. Martin, and E. Unlu. 2010. Executive Compensation and the MaturityStructure of Corporate Debt. The Journal of Finance 65:1123–1161.
Brown, L. D., and Y.-J. Lee. 2011. Changes in Option-Based Compensation Around theIssuance of SFAS 123R. Journal of Business Finance & Accounting 38:1053?1095.
Bryan, S., L. Hwang, and S. Lilien. 2000. CEO Stock-Based Compensation: An EmpiricalAnalysis of Incentive-Intensity, Relative Mix, and Economic Determinants. The Journal ofBusiness 73:661–693.
Carpenter, J. N. 2000. Does Option Compensation Increase Managerial Risk Appetite? TheJournal of Finance 55:2311–2331.
Carter, M. E., L. J. Lynch, and I. Tuna. 2007. The Role of Accounting in the Design of CEOEquity Compensation. The Accounting Review 82:327–357.
Coles, J. L., N. D. Daniel, and L. Naveen. 2006. Managerial incentives and risk-taking. Journalof Financial Economics 79:431–468.
19
Core, J., and W. Guay. 1999. The use of equity grants to manage optimal equity incentivelevels. Journal of Accounting and Economics 28:151–184.
Core, J., and W. Guay. 2002. Estimating the Value of Employee Stock Option Portfolios andTheir Sensitivities to Price and Volatility. Journal of Accounting Research 40:613–630.
Demsetz, H., and K. Lehn. 1985. The Structure of Corporate Ownership: Causes and Conse-quences. Journal of Political Economy 93:1155–1177.
Frydman, C., and D. Jenter. 2010. CEO Compensation. Annual Review of Financial Eco-nomics 2:75–102.
Frydman, C., and R. E. Saks. 2010. Executive Compensation: A New View from a Long-TermPerspective, 1936?2005. Review of Financial Studies 23:2099–2138.
Gormley, T. A., D. A. Matsa, and T. T. Milbourn. 2012. CEO Compensation andCorporate Risk-Taking: Evidence from a Natural Experiment. Available on SSRN:http://ssrn.com/abstract=1718125.
Hall, B. J., and J. B. Liebman. 1998. Are CEOS Really Paid Like Bureaucrats? The QuarterlyJournal of Economics 113:653–691.
Hall, B. J., and K. J. Murphy. 2002. Stock options for undiversified executives. Journal ofAccounting and Economics 33:3–42.
Hayes, R. M., M. Lemmon, and M. Qiu. 2012. Stock options and managerial incentives forrisk taking: Evidence from FAS 123R. Journal of Financial Economics 105:174–190.
Himmelberg, C. P., R. Hubbard, and D. Palia. 1999. Understanding the determinants of man-agerial ownership and the link between ownership and performance. Journal of FinancialEconomics 53:353–384.
Holmstrom, B. 1979. Moral Hazard and Observability. The Bell Journal of Economics 10:74–91.
Holmstrom, B., and P. Milgrom. 1987. Aggregation and Linearity in the Provision of Intertem-poral Incentives. Econometrica 55:303–328.
Irving, J. H., W. R. Landsman, and B. P. Lindsey. 2011. The Valuation Differences BetweenStock Option and Restricted Stock Grants for US Firms. Journal of Business Finance &Accounting 38:395–412.
Jensen, M. C., and W. H. Meckling. 1976. Theory of the firm: Managerial behavior, agencycosts and ownership structure. Journal of Financial Economics 3:305–360.
20

Jensen, M. C., and K. J. Murphy. 1990. Performance Pay and Top-Management Incentives.Journal of Political Economy 98:225–264.
Knyazeva, A., D. Knyazeva, and R. W. Masulis. 2011. Effects of Local Director Markets onCorporate Boards. ECGI - Finance Working Paper No. 315/2011.
Kole, S. R. 1997. The complexity of compensation contracts. Journal of Financial Economics43:79–104.
Lambert, R. A., D. F. Larcker, and R. E. Verrecchia. 1991. Portfolio Considerations in ValuingExecutive Compensation. Journal of Accounting Research 29:129–149.
Low, A. 2009. Managerial risk-taking behavior and equity-based compensation. Journal ofFinancial Economics 92:470–490.
McConnell, J. J., and H. Servaes. 1990. Additional evidence on equity ownership and corporatevalue. Journal of Financial Economics 27:595–612.
Mehran, H. 1995. Executive compensation structure, ownership, and firm performance. Jour-nal of Financial Economics 38:163–184.
Merton, R. C. 1973. Theory of Rational Option Pricing. The Bell Journal of Economics andManagement Science 4:141–183.
Morck, R., A. Shleifer, and R. W. Vishny. 1988. Management ownership and market valuation:An empirical analysis. Journal of Financial Economics 20:293–315.
Murphy, K. J. 1999. Executive compensation. pp. 2485–2563. Elsevier.
Palia, D. 2001. The Endogeneity of Managerial Compensation in Firm Valuation: A Solution.Review of Financial Studies 14:735–764.
Ross, S. A. 1973. The Economic Theory of Agency: The Principal’s Problem. The AmericanEconomic Review 63:134–139.
Ross, S. A. 2004. Compensation, Incentives, and the Duality of Risk Aversion and Riskiness.The Journal of Finance 59:207–225.
Smith, C. W., and R. L. Watts. 1992. The investment opportunity set and corporate financing,dividend, and compensation policies. Journal of Financial Economics 32:263–292.
Wooldridge, J. M. 1995. Selection corrections for panel data models under conditional meanindependence assumptions. Journal of Econometrics 68:115–132.
Yermack, D. 1995. Do corporations award CEO stock options effectively? Journal of FinancialEconomics 39:237–269.
21
Appendix A
Figure 1: Cumulative Number of Firms Introducing ‘New Components’This figure illustrates the cumulative number of firms introducing ‘new components’ in a compensationstructure of a CEO. ‘New Components’ here is defined as new additions or substitutions of eitherrestricted stock or LTIPs, or both in place of stock options in a CEOs portfolio.
22
Tab
leI:
Descriptive
Statistics
Thistablepresents
theprim
aryvariab
lesused
inou
rstud
y,grou
pedby
Leve
lof
Com
pens
atio
nC
ompo
nent
s,Pro
port
ion
ofC
ompe
nsat
ion
Com
-po
nent
s,C
ompe
nsat
ion
Sens
itiv
itie
san
dO
ther
Var
iabl
es.The
samplecontains
non-missing
observations
collected
from
Execucomp,
Com
pustat
andCRSP
from
2002
to2009.Definition
ofvariab
lesan
dtheircompu
tation
saredefin
edin
App
endixB.S
ummarystatistics
arepresentedforthe
overallsam
ple(9,499
observations)as
wella
ssub-samples
ofpre-ad
dition
(1,510
observations),po
st-add
ition(1,590
observations),pre-substitution
(1,770
observations)an
dpo
st-sub
stitutions
(2,209
observations).
Ove
rall
(N=
9,49
9)P
re-A
dd(N
=1,
510)
Pos
t-A
dd(N
=1,
590)
Pre
-Sub
(N=
1,77
0)Pos
t-Su
b(N
=2,
209)
Var
iabl
eM
ean
Med
ian
Mea
nM
edia
nM
ean
Med
ian
Mea
nM
edia
nM
ean
Med
ian
Leve
lof
Com
pens
atio
nC
ompo
nent
sSa
lary
($00
0s)
707.
2865
3.85
581.
7953
0.00
763.
1070
0.00
637.
0160
0.00
797.
9074
5.83
Bon
us($
000s
)58
7.67
88.8
261
1.60
216.
2444
0.85
0.00
771.
7334
4.18
568.
840.
00O
ptio
nG
rant
s($
000s
)1,
634.
0852
7.78
1,12
8.38
55.3
31,
232.
0640
7.40
2,79
7.33
1,16
6.58
1,35
6.64
501.
91R
estr
icte
dSt
ock
($00
0s)
1,09
6.56
0.00
439.
120.
001,
757.
1058
1.75
434.
540.
001,
826.
6072
6.36
LTIP
s($
000s
)2,
143.
290.
0014
5.87
0.00
3,82
4.61
0.00
134.
620.
003,
632.
0820
9.64
Tot
alC
ompe
nsat
ion
($00
0s)
5,18
9.05
2,51
8.27
2,81
8.88
1,42
0.11
6,43
9.90
2,90
2.71
4,69
7.76
2,59
1.76
6,72
1.93
3,31
9.63
Cas
hC
ompe
nsat
ion
($00
0s)
1,29
4.95
900.
001,
193.
4079
8.35
1,20
3.96
875.
001,
408.
7495
0.00
1,36
6.74
916.
67
Pro
port
ion
ofC
ompe
nsat
ion
Com
pone
nts
Sala
ry/T
otal
0.34
0.24
0.43
0.35
0.32
0.23
0.29
0.22
0.30
0.21
Bon
us/T
otal
0.14
0.05
0.21
0.15
0.09
0.00
0.17
0.13
0.10
0.00
Opt
ions
/Tot
al0.
290.
230.
280.
180.
210.
130.
480.
530.
210.
14R
estr
icte
dSt
ock/
Tot
al0.
160.
000.
070.
000.
250.
220.
050.
000.
260.
24LT
IP/T
otal
0.08
0.00
0.01
0.00
0.12
0.00
0.01
0.00
0.14
0.00
Com
pens
atio
nSe
nsitiv
itie
sD
elta
(Tot
al)
($00
0s)
748.
8323
3.85
570.
9619
1.42
557.
5521
4.90
775.
7524
8.37
599.
3623
2.90
Veg
a(T
otal
)($
000s
)12
8.22
46.4
898
.21
29.0
398
.65
39.3
715
7.60
67.3
013
9.47
59.2
5
Oth
erVar
iabl
esM
arke
t-to
-Boo
k2.
021.
642.
121.
721.
841.
522.
211.
791.
781.
53R
esea
rch
&D
evel
opm
ent
0.03
0.00
0.03
0.00
0.03
0.00
0.04
0.01
0.03
0.00
Cap
ital
Exp
endi
ture
0.05
0.03
0.05
0.03
0.05
0.03
0.05
0.04
0.05
0.03
Lev
erag
e0.
210.
190.
190.
160.
210.
190.
190.
180.
230.
21C
ash
0.17
0.11
0.18
0.12
0.15
0.10
0.19
0.12
0.16
0.10
Tot
alA
sset
s(L
og)
7.32
7.16
6.95
6.78
7.40
7.22
7.19
7.05
7.67
7.50
Vol
atili
ty(F
irm
)0.
390.
330.
390.
330.
400.
350.
360.
320.
390.
33Vol
atili
ty(M
arke
t)0.
160.
130.
140.
130.
180.
130.
140.
130.
180.
13C
EO
Ten
ure
(yea
rs)
7.78
5.50
8.31
6.00
7.38
5.26
7.50
5.00
7.01
5.00
Pri
ce-t
o-St
rike
Rat
io1.
281.
001.
281.
001.
231.
001.
381.
031.
221.
00
23
Tab
leII:Fixed-E
ffectsRegressionof
CEO
Com
pensationan
dCom
pensationCom
pone
ntswhe
n‘N
ewCom
pone
nts’
areIntrod
uced
Thistablepresents
thefix
ed-effe
ctsregression
ofcompe
nsationcompo
nents,
includ
ingtotalcompe
nsationon
dummiesof
new
additonan
dsub-
stitution.
The
sampleconsists
of5,790an
d6,799ob
servations
fornew
addition
san
dsubstitution
s,respectively.Bothsamples
includ
eas
controls
observations
offirmsmod
ifyingtheircompe
nsationstructurewitho
utad
ding
new
compo
nents.
The
fixed-effe
ctscontrolledareun
observed
firm
effects.The
specification
oftheregression
inbo
thPan
elA
andBaresimila
rto
equa
tion
(1)defin
edearlier.
Cluster-rob
ustt-statistics
arerepo
rted
inpa
renthesis.
Statisticals
ignific
ance
(two-sided)
atthe10%,5
%,a
nd1%
levelisdeno
tedby
*,**
and***,
respectively.
Pan
elA
:N
ewEqu
ity
Add
itio
nsTotal
Com
pensation
(Log
)Sa
lary/T
otal
Bon
us/T
otal
Options/T
otal
Restricted
Stock/
Total
LTIP
/Total
New
Equ
ityAdd
ition
0.49
17**
*-0.103
5***
-0.129
2***
-0.069
3***
0.17
84**
*0.12
36**
*
(8.48)
(-7.55
)(-13
.08)
(-5.45
)(16.08
)(13.08
)
Total
Assets(L
og)
0.12
43*
0.03
99**
*-0.061
0***
-0.032
6**
0.05
19**
*0.00
17
(1.94)
(2.93)
(-6.13
)(-2.40)
(4.55)
(0.23)
CEO
Tenure
-0.005
8*0.00
35**
*0.00
04-0.002
9***
-0.002
1***
0.0012
***
(-1.66
)(3.25)
(0.36)
(-2.96
)(-2.85
)(2.78)
Observation
s57
9057
9057
9057
9057
9057
90Adjusted-
R2
0.57
900.42
310.27
700.3722
0.41
210.42
93
Pan
elB:N
ewEqu
ity
Subs
titu
tion
s Total
Com
pensation
(Log
)Sa
lary/T
otal
Bon
us/T
otal
Options/T
otal
Restricted
Stock/
Total
LTIP
/Total
New
Equ
itySu
bstitution
0.06
460.00
80-0.078
3***
-0.273
1***
0.20
31**
*0.14
02**
*
(1.60)
(0.89)
(-10
.39)
(-23
.84)
(22.22
)(18.89
)
Total
Assets(L
og)
0.06
930.03
08***
-0.065
6***
-0.014
80.04
23**
*0.00
74
(0.90)
(2.77)
(-7.34
)(-1.20)
(4.04)
(1.06)
CEO
Tenure
-0.004
20.00
41**
*0.00
12-0.004
0***
-0.0017*
*0.00
04(-1.28
)(3.83)
(1.47)
(-4.03
)(-2.51
)(0.81)
Observation
s67
9967
9967
9967
9967
9967
99Adjusted-
R2
0.54
690.39
120.23
010.4121
0.37
360.38
23
24
Tab
leIII:
Fixed-E
ffectsRegressionof
CEO
Incentives
(Delta
andVega)
whe
n‘N
ewCom
pone
nts’
areIntrod
uced
Thistablepresents
thefix
ed-effe
ctsregression
ofcompe
nsationsensitivitieson
dummiesof
new
additonan
dsubstitution
.The
sampleconsists
of5,790an
d6,799ob
servations
forne
wad
dition
san
dsubstitution
s,respectively.The
declinein
observations
representtheab
senceof
stockop
tion
valuations
forafew
observations.Bothsamples
includ
eas
controls
observations
offirmsmod
ifyingtheircompe
nsationstructurewitho
utad
ding
new
compo
nents.
The
fixed-effe
ctscontrolledareun
observed
firm
effects.The
specification
oftheregression
inbo
thPan
elA
andB
aresimila
rto
equa
tion
(2)defin
edearlier.
Cluster-rob
ust
t-statistics
arerepo
rted
inpa
renthesis.
Statisticals
ignifican
ce(two-sided)
atthe10%,5
%,a
nd1%
levelisdeno
tedby
*,**
and***,
respectively. Total
Delta
(Log
)Total
Vega(L
og)
Total
Delta
(Log
)Total
Vega(L
og)
New
Equ
ityAdd
ition
-0.054
0-0.1300*
(-0.96
)(-1.96
)
New
Equ
itySu
bstitution
-0.221
8***
-0.342
4***
(-5.15
)(-7.67
)
Total
Assets(L
og)
0.26
18**
*0.30
75**
*0.26
84**
*0.29
12**
*(4.67)
(4.98)
(5.98)
(5.37)
CashCom
pensation
0.00
000.00
01**
*0.00
00*
0.00
00**
(0.65)
(3.07)
(1.93)
(2.09)
CEO
Tenure
0.07
21**
*0.01
60**
*0.07
45**
*0.02
22**
*(12.72
)(2.74)
(10.50
)(4.19)
Observation
s57
9049
8067
9961
46Adjusted-
R2
0.71
030.70
930.68
950.65
89
25

Table IV: 2SLS-IV Regression of Compensation Sensitivities on Firm Risk: AdditionsThis table presents the 2SLS-IV regression of endogenous compensation sensitivities and firm riskvariables when new additions are made. The specification of the regression, including instrument, issimilar to equations (3) and (4) for first and second stages, respectively. Angrist-Pischke multivariateF -statistics along with their respective p-values are included for first-stage regressions. Sargan statis-tics and its respective p-value is included for second-stage regressions. Cluster-robust t-statistics andz -statistics are reported in parenthesis for first-stage and second-stage regressions, respectively. Sta-tistical significance (two-sided) at the 10%, 5%, and 1% level is denoted by *, ** and ***, respectively.
Total Vega (Log) Total Delta (Log) Firm Risk
Total Vega (Log) -0.0940*(-1.83)
Total Delta (Log) -0.2219***(-4.81)
Total Assets (Log) 0.1670 0.5496*** 0.1478***(1.17) (6.89) (4.06)
Leverage 0.0811 -0.8179*** -0.0324(0.23) (-3.45) (-0.30)
Market-to-Book -0.0443 0.3988*** 0.0900***(-0.78) (8.78) (4.07)
Sales Growth (Lagged) 0.1086 0.2259** 0.0387(1.20) (2.13) (1.14)
Research & Development 0.6897 -1.7240*** -0.1129(1.43) (-2.79) (-0.44)
R&D Dummy -0.3957 -0.1010 -0.0548(-1.76) (-0.42) (-0.75)
Capital Expenditure 0.6371 0.0840 0.6376**(1.21) (1.49) (2.38)
Property, Plant & Equipment -1.4509** -0.6992 -0.2136(-2.20) (-1.65) (-1.02)
Cash Compensation 0.0001 0.0001 -0.0001**(0.36) (0.17) (-2.36)
CEO Tenure 0.0087 0.0735*** 0.0200***(0.95) (7.57) (5.17)
CEO Age -0.0020 -0.0104 -0.0069**(-0.19) (-1.25) (-2.51)
Count of Segments 0.0584 0.0212 0.0003(1.57) (0.79) (0.03)
Inverse Mill’s Ratio 0.3050 0.1429 -0.3308***(0.85) (0.73) (-4.07)
Stock Return -0.0531* 0.1094***(-1.81) (4.38)
Mean State Compensation 0.3822*** 0.2062**(3.55) (2.60)
Observations 1966 1966 1966Partial R2 0.02 0.32Angrist-Pischke F -statistic 12.11 36.27p-value 0.01 0.01Hausman Test for Endogneity 12.59p-value 0.01
26
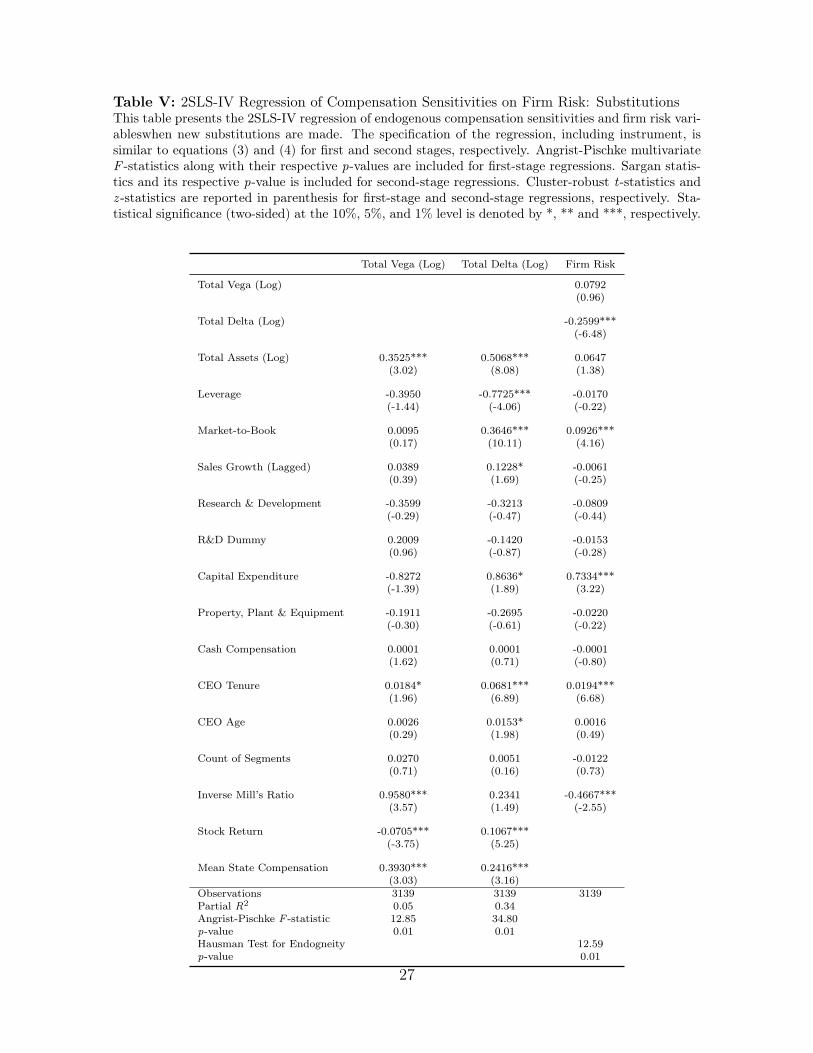
Table V: 2SLS-IV Regression of Compensation Sensitivities on Firm Risk: SubstitutionsThis table presents the 2SLS-IV regression of endogenous compensation sensitivities and firm risk vari-ableswhen new substitutions are made. The specification of the regression, including instrument, issimilar to equations (3) and (4) for first and second stages, respectively. Angrist-Pischke multivariateF -statistics along with their respective p-values are included for first-stage regressions. Sargan statis-tics and its respective p-value is included for second-stage regressions. Cluster-robust t-statistics andz -statistics are reported in parenthesis for first-stage and second-stage regressions, respectively. Sta-tistical significance (two-sided) at the 10%, 5%, and 1% level is denoted by *, ** and ***, respectively.
Total Vega (Log) Total Delta (Log) Firm Risk
Total Vega (Log) 0.0792(0.96)
Total Delta (Log) -0.2599***(-6.48)
Total Assets (Log) 0.3525*** 0.5068*** 0.0647(3.02) (8.08) (1.38)
Leverage -0.3950 -0.7725*** -0.0170(-1.44) (-4.06) (-0.22)
Market-to-Book 0.0095 0.3646*** 0.0926***(0.17) (10.11) (4.16)
Sales Growth (Lagged) 0.0389 0.1228* -0.0061(0.39) (1.69) (-0.25)
Research & Development -0.3599 -0.3213 -0.0809(-0.29) (-0.47) (-0.44)
R&D Dummy 0.2009 -0.1420 -0.0153(0.96) (-0.87) (-0.28)
Capital Expenditure -0.8272 0.8636* 0.7334***(-1.39) (1.89) (3.22)
Property, Plant & Equipment -0.1911 -0.2695 -0.0220(-0.30) (-0.61) (-0.22)
Cash Compensation 0.0001 0.0001 -0.0001(1.62) (0.71) (-0.80)
CEO Tenure 0.0184* 0.0681*** 0.0194***(1.96) (6.89) (6.68)
CEO Age 0.0026 0.0153* 0.0016(0.29) (1.98) (0.49)
Count of Segments 0.0270 0.0051 -0.0122(0.71) (0.16) (0.73)
Inverse Mill’s Ratio 0.9580*** 0.2341 -0.4667***(3.57) (1.49) (-2.55)
Stock Return -0.0705*** 0.1067***(-3.75) (5.25)
Mean State Compensation 0.3930*** 0.2416***(3.03) (3.16)
Observations 3139 3139 3139Partial R2 0.05 0.34Angrist-Pischke F -statistic 12.85 34.80p-value 0.01 0.01Hausman Test for Endogneity 12.59p-value 0.01
27

Table VI: Maximum-Likelihood Regression of ‘New Components’ Introduced in a Compen-sation StructureThis table presents the maximum-likelihood, fixed-effects regression of dummies of new addition andsubstitution. The sample consists of 1,754 and 2,999 observations for new additions and substitutions,respectively. The coefficients reported are odd ratios. The fixed-effects controlled are unobserved firmeffects. The specification of the regression is similar to equation (5) defined earlier. Cluster-robustz -statistics are reported in parenthesis. Statistical significance (two-sided) at the 10%, 5%, and 1%level is denoted by *, ** and ***, respectively.
New Equity Addition (Dummy) New Equity Substitution (Dummy)
Total Assets (Log) 170.2942*** 85.6240***(12.96) (17.16)
Leverage 0.0980*** 3.1840**(-2.73) (2.10)
Market-to-Book 0.4196*** 0.5366***(-5.06) (-5.56)
Sales Growth (Lagged) 0.5256 0.8039(-1.55) (-0.88)
Research & Development 1.324e+10*** 16865.9232***(5.27) (4.14)
R&D Dummy 118.3251*** 0.4291*(3.29) (-1.91)
Capital Expenditure 32.6888 9.6642(1.44) (1.09)
Property, Plant & Equipment 0.5856 0.0098***(-0.29) (-3.31)
Cash Compensation 0.9994*** 0.9999***(-6.62) (-3.16)
CEO Tenure 0.9838 1.0133(-0.76) (0.83)
CEO Age 0.9662 0.9524***(-1.60) (-3.25)
Count of Segments 0.7402*** 0.9891(-2.76) (-0.13)
Price-to-Strike Ratio 0.5752*** 0.8392*(-3.06) (-1.67)
Total Compensation (Log) 3.0189*** 1.2298***(9.49) (3.23)
Stock Return 1.0047 1.1732***(0.06) (2.61)
Mean State Compensation 1.7477 0.8381(1.53) (-0.80)
Observations 1754 2999chi2 631.7818 790.7046p-value 0.0000 0.0000
28

Appendix B
Variable DefinitionsSalary - Total dollar value of salary as provided by Execucomp.Bonus - Calculated as bonus plus the the value of non-equity target shares providedHayes et al. (2012).Option Grants - Computations based on the method provided by Core and Guay (2002).Restricted Stock - Sum of current restricted stock grants made that are unexercisable.LTIPs - Target and unearned value of equity grants made in the current year (Hayes et al.,2012).Total Compensation - Sum of salary, bonus, options grants, restricted stocks and LTIPs.Cash Compensation - Sum of salary and bonus.Salary/Total - Dollar value of salary scaled by total compensation.Bonus/Total - Dollar value of bonus scaled by total compensation.Options/Total - Dollar value of option grants scaled by total compensation.Restricted Stock/Total - Dollar value of restricted stock scaled by total compensation.LTIP/Total - Dollar value of LTIPs scaled by total compensation.Delta (Total) - Sum of Black-Scholes delta of current and prior option grants, 1% of valueof current and prior restricted stock grants and 1% of value of current and prior LTIP grants.Vega (Total) - 1% of the sum of current Black-Scholes vega of current and prior optiongrants.Market-to-Book - Market value of assets plus book value of long-term debt scaled by totalassets.Research & Development - Research and development expenditures to total assets.Capital Expenditure - Value of capital expenditure scaled by total assets.Leverage - Value of current and long-term liabilities scaled by total assets.Cash - Value of cash and cash equivalent scaled by total assets.Total Assets (Log) - Log-normalised value of total assets.Volatility (Firm) - Standard deviation of the last 252 trading day returns of a firm,annualised.Volatility (Market) - Standard deviation of the last 252 trading day returns of S&P500,annualised.CEO Tenure - Time difference, in years, between the data date and the date the executivewas appointed as CEO.Price-to-Strike Ratio - Computed as the ratio of market price to the avergae strike priceof the underlying stock option.
29