Compelling Wealth Management...
65
Oppenheimer funds are distributed by OppenheimerFunds Distributor, Inc., 225 Liberty Street, New York, NY 10281-1008 © 2015 OppenheimerFunds Distributor, Inc. All rights reserved. Shares of Oppenheimer funds are not deposits or obligations of any bank, are not guaranteed by any bank, are not insured by the FDIC or any other agency and involve investment risks, including the possible loss of the principal amount invested. Compelling Wealth Management Conversations Q4 2015
Transcript of Compelling Wealth Management...

Oppenheimer funds are distributed by OppenheimerFunds Distributor, Inc., 225 Liberty Street, New York, NY 10281-1008© 2015 OppenheimerFunds Distributor, Inc. All rights reserved.
Shares of Oppenheimer funds are not deposits or obligations of any bank, are not guaranteed by any bank, are not insured by the FDIC or any other agency and involve investment risks, including the possible loss of the principal amount invested.
Compelling Wealth
Management Conversations
Q4 2015

2
Agenda
• The Principles of Sound Investing
• Historical Context
• Current Opportunities

The Principles of
Sound Investing
Th
e P
rinc
iple
s
of S
ou
nd
Inve
stin
g
Consistency Courage Balance

4
“Everyone has a plan until they get hit.”– Joe Louis
The Principle ofConsistency

5
20-Year Annualized Returns % (1994–2013)
What Has the Greatest Impact on
Investment Results?
10.2%9.2%
5.8% 5.7% 5.7%
2.9%2.4% 2.5%
REITs U.S. Stocks Gold InternationalEquities
Government-Related Bonds
Homes Inflation AverageInvestor
Source: Bloomberg, 12/31/13. Average asset allocation investor return is based on an analysis by DALBAR, Inc., which utilizes the net of aggregate mutual fund sales,
redemptions and exchanges each month as a measure of investor behavior. Indices shown are as follows: REITs are represented by the FTSE NAREIT Equity REIT Index, Gold
is represented by the U.S. dollar spot price of one troy ounce, Homes are represented by U.S. existing home sales median price, inflation is represented by the Consumer Price
Index. U.S. stocks are represented by the S&P 500 Index, international equities are represented by the MSCI EAFE Index, government-related bonds are represented by the
Barclays U.S. Aggregate Bond Index. Indices are unmanaged and cannot be purchased directly by investors. Index performance is shown for illustrative purposes only and does
not predict or depict the performance of any investment. Index definitions can be found on Page 71. Past performance does not guarantee future results.
Investor BehaviorInvestment Returns

6
Missing Even the 10 Best Days in the Market Reduced
Returns by Almost 50% in the Last 20 YearsS&P 500 Index: performance of $100,000 investment (1994–2014)
The Truth About “Sell in May and Go Away”
Growth of $1,000: S&P 500 Index buy and hold vs. selling
every May, going to T-bills, and buying again in November
No One Has a Crystal Ball, Yet Often People
Act as Though They Do
Source: Morningstar Direct as of 12/31/14. For illustrative purposes only and is not intended as investment advice. The charts are hypothetical examples which are shown for
illustrative purposes only and do not predict or depict the performance of any investment. Index definitions can be found on Page 71. Past performance does not guarantee
future results.
0
1,000,000
2,000,000
3,000,000
4,000,000
5,000,000
$6,000,000
$1,268,814
$5,305,992
Sell in May
and Buy in
November
Buy and
HoldMay
AprilApr
Annualized
Return
8.09%
$474,257
Annualized
Return
4.41%
$236,864
Annualized
Return
-0.12%
$97,651
Annualized
Return
-3.76%
$46,486
Annualized
Return
-5.36%
$33,244
Annualized
Return
1.97%
$149,674
Annualized
Return
-2.03%
$66,416
Fully
Invested
Missed
10
Best
Days
Missed
20
Best
Days
Missed
30
Best
Days
Missed
40
Best
Days
Missed
50
Best
Days
Missed
60
Best
Days

7
Odds of Winning at Various Casino Games Percentage of Years U.S. Stocks Posted Positive
Returns Over Rolling Periods (1926–2014)
Is the Market Really Like a Casino?
Rolling Monthly Returns
Source: Morningstar Direct, 12/31/14. Chart is for illustrative purposes only and is not intended as investment advice. U.S. stocks are represented by the S&P 500 Index.
Source of Casino odds: Wizard of Odds. The charts are hypothetical examples which are shown for illustrative purposes only and do not predict or depict the
performance of any investment. Index definitions can be found on Page 71. Past performance does not guarantee future results.
40.0%
44.7%
48.0%
48.6%
46.6%
23.0%
46.5%
48.8%
40.0%
75.1%
82.9%87.1%
94.4%99.8%
1-Year 3-Year 5-Year 10-Year 15-Year

8
Stocks Go Up Because Earnings Improve
Source: Bloomberg, as of 12/31/14. Company logos are for illustrative purposes only and are not intended as investment advice. The mention of specific companies does
not constitute a recommendation on behalf of any fund or OppenheimerFunds, Inc. Correlation expresses the strength of relationship between distribution of returns of
two sets of data. The correlation coefficient is always between +1 (perfect positive correlation) and –1 (perfect negative correlation). A perfect correlation occurs when the
two series being compared behave in exactly the same manner. Index definitions can be found on Page 71. Past performance does not guarantee future results.

9
“Courage is rightly esteemed the first of human qualities because
it is the quality which guarantees all others.”
– Sir Winston Churchill
The Principle ofCourage

10
$2,520,587
$10,000
$100,000
$1,000,000
0.0%
1.0%
2.0%
3.0%
4.0% Dow Jones Industrial Average: Volatility(3-Month Moving Average), Left Axis
Dow Jones Industrial Average: Growth of$10,000 Right Axis
Every Generation Faces Its Share of Challenges
“In the 20th century, the United States endured two world wars...the Depression, a dozen or so recessions and
financial panics, oil shocks, a flu epidemic, and the resignation of a disgraced president. Yet the Dow rose from
66 to 11,497.” – Warren Buffett, 10/17/08
Dow Jones Industrial Average: Growth of $10,000 and Volatility (1900–2014)
Source: Morningstar Direct and Ibbotson, 12/31/14. The charts are hypothetical examples which are shown for illustrative purposes only and do not predict or depict the
performance of any investment. Index definitions can be found on Page 71. Past performance does not guarantee future results.
(Log S
cale
)
1900 1920 1940 1960 1980 2000 2014

11
-7-10
1517
1
26
15
2
12
27
-7
26
47
-2
34
20
31
27
20
-10-13
-23
26
9
3
14
4
-38
23
13
0
13
30
11
-18
-14
-7
-13
-8 -9
-33
-8 -8
-20
-6 -6-5
-9
-3
-8-11
-19
-12
-17
-26
-32
-14
-8 -7 -8-10
-47
-26
-16-19
-10
-6
1982 1984 1986 1988 1990 1992 1994 1996 1998 2000 2002 2004 2006 2008 2010 2012 2014
Volatility Does Not Equal Loss Unless You Sell
Source: Bloomberg, 12/31/14. Calendar year returns are price returns, meaning that they do not include the reinvestment of dividends. The index is unmanaged and
cannot be purchased directly by investors. Index performance is shown for illustrative purposes only and does not predict or depict the performance of any investment.
Index definitions can be found on Page 71. Past performance does not guarantee future results.
S&P 500 Index Calendar Year Price Return(%) S&P 500 Index Largest Intra-Year Price Decline (%)
Annualized
Total Return
+11.1%
Average Intra-
year Decline
–14.4%
“I’ve lived through some terrible things in my life some of which have actually happened.”
—Mark Twain

12
Stocks Outperform Most Asset Classes Over Time
Source: Morningstar Direct, 12/31/14. Small-Cap Stocks are represented by the total return for the SBBI U.S. Small Company Stock Index. Large-Cap Stocks are
represented by the SBBI U.S. Large Company Stock Index. Government bonds are represented by the SBBI U.S. Long-Term Government Bond Index. Gold is
represented by the U.S. dollar spot price of one troy ounce. Real estate is represented by the Shiller Real Home Price Index. Government bills are represented by the
SBBI U.S. (30-day) Treasury Bills. Inflation is represented by the Consumer Price Index. The charts are hypothetical examples which are shown for illustrative purposes
only and do not predict or depict the performance of any investment. Index definitions can be found on Page 71. Past performance does not guarantee future results.

13
-100%
0%
100%
200%
300%
400%
500%
1 2 3 4 5 6 7 8 9 10
Years after crisis
MSCI Mexico Index – December 1994 MSCI Korea Index – November 1997
“When there is blood on the street, I am buying”
– Baron RothschildCumulative Monthly Returns
Source: Bloomberg,12/31/14. The charts are hypothetical examples which are shown for illustrative purposes only and do not predict or depict the performance of any investment.
Index definitions can be found on Page 71. Past performance does not guarantee future results.
MSCI Russia Index – August 1998 MSCI Argentina Index – December 2001
-100%
-50%
0%
50%
100%
150%
200%
1 2 3 4 5 6 7 8 9 10
Years after crisis
0%
500%
1000%
1500%
2000%
1 2 3 4 5 6 7 8 9 10
Years after crisis
-1000%
0%
1000%
2000%
3000%
4000%
5000%
6000%
1 2 3 4 5 6 7 8 9 10
Years after crisis
443%
3891%
175%
1165%

14
$100,000 Investment in Barclays High Yield Bond Index
(1989–2014)
$100,000 Investment in Barclays Municipal Bond Index
(1981–2014)
Forget About the Price, Focus on Income
Source: Bloomberg,12/31/14. The charts are hypothetical examples which are shown for illustrative purposes only and do not predict or depict the performance of any investment.
Index definitions can be found on Page 71. Past performance does not guarantee future results.
“The most powerful force in the universe is compound interest.”— Albert Einstein
$816,740
$0
$200,000
$400,000
$600,000
$800,000
1989 1993 1996 1999 2002 2005 2008 2012
Price Growth Total Growth
$1,191,386
$0
$200,000
$400,000
$600,000
$800,000
$1,000,000
$1,200,000
1981 1986 1990 1994 1999 2003 2007 2012
Price Growth Total Growth
More than 101% of the return
has come from the income!
98% of the return
has come from the income!

15
“Life is about balance. The good and the bad. The highs and the lows.
The piña and the colada.”— Ellen DeGeneres
The Principle ofBalance

16
Annual Returns % (2003–YTD 2015)
Asset Classes Move In and Out of Favor
2003 2004 2005 2006 2007 2008 2009 2010 2011 2012 2013 2014 YTD
Emerging
Markets
55.82
REITs
31.58
Emerging
Markets
34.00
REITs
35.06
Emerging
Markets
39.42
U.S.
Aggregate
5.24
Emerging
Markets
78.51
MLPs
35.85
MLPs
13.88
Emerging
Markets
18.22
U.S.
Small Cap
38.82
REITs
30.14
U.S.
Aggregate
0.45
U.S.
Small Cap
47.25
Emerging
Markets
25.55
Commodities
21.36
Emerging
Markets
32.14
Commodities
16.23
High Yield
–26.55
MLPs
76.41
REITs
27.96
REITs
8.29
REITs
18.06
U.S.
Large Cap
33.11
U.S.
Large Cap
13.24
High Yield
0.04
MLPs
44.54
International
Stocks
20.25
International
Stocks
13.54
International
Stocks
26.34
MLPs
12.72
U.S.
Small Cap
–33.79
High Yield
58.17
U.S.
Small Cap
26.85
U.S.
Aggregate
7.84
International
Stocks
17.32
MLPs
27.58
U.S.
Aggregate
5.97
International
Stocks
–0.21
International
Stocks
38.59
U.S.
Small Cap
18.33
REITs
12.16
MLPs
26.07
International
Stocks
11.17
Commodities
–35.65
International
Stocks
31.78
Emerging
Markets
18.88
High Yield
6.97
U.S.
Large Cap
16.42
International
Stocks
22.78
U.S.
Small Cap
4.89
U.S.
Large Cap
–2.57
REITs
37.13
MLPs
16.67
MLPs
6.32
U.S.
Small Cap
18.37
U.S.
Aggregate
6.97
MLPs
–36.91
U.S.
Large Cap
28.43
Commodities
16.83
U.S.
Large Cap
1.50
U.S.
Small Cap
16.35
High Yield
8.23
MLPs
4.80
U.S.
Small Cap
–2.97
U.S.
Large Cap
29.89
U.S.
Large Cap
11.40
U.S.
Large Cap
6.27
U.S.
Large Cap
15.46
U.S.
Large Cap
5.77
U.S.
Large Cap
–37.60
REITs
27.99
U.S.
Large Cap
16.10
U.S.
Small Cap
–4.18
High Yield
15.39
REITs
2.47
High Yield
2.21
REITs
–6.52
High Yield
26.80
High Yield
11.10
U.S.
Small Cap
4.55
High Yield
11.56
High Yield
2.58
REITs
–37.73
U.S.
Small Cap
27.17
High Yield
14.74
International
Stocks
–12.14
MLPs
4.80
U.S.
Aggregate
–2.02
Emerging
Markets
–2.19
Commodities
–12.82
Commodities
23.93
Commodities
9.15
U.S.
Aggregate
2.43
U.S.
Aggregate
4.33
U.S.
Small Cap
–1.57
International
Stocks
–43.38
Commodities
18.91
International
Stocks
7.75
Commodities
–13.32
U.S.
Aggregate
4.21
Emerging
Markets
–2.60
International
Stocks
–4.90
Emerging
Markets
–12.85
U.S.
Aggregate
4.10
U.S.
Aggregate
4.34
High Yield
2.42
Commodities
2.07
REITs
–15.69
Emerging
Markets
–53.33
U.S.
Aggregate
5.93
U.S.
Aggregate
6.54
Emerging
Markets
–18.42
Commodities
–1.06
Commodities
–9.52
Commodities
–17.01
MLPs
–18.17
Source: FactSet, 8/31/15. High Yield is represented by the JPMorgan Domestic High Yield Index. U.S. Aggregate is represented by the Barclays Aggregate Bond Index. REITs are
represented by the FTSE NAREIT Equity REITs Index. MLPs are represented by the Alerian MLP Index. International Stocks are represented by the MSCI EAFE Index. EM is
represented by the MSCI EM Index. Commodities are represented by the Bloomberg Commodity Index. Small-Cap Stocks are represented by the total return for the Russell 2000
Index. Large-Cap Stocks are represented by the Russell 1000 Index. Index definitions can be found on Page 71. Diversification does not guarantee profit or protect against loss.
Past performance does not guarantee future results.

17
Countries Move In and Out of Favor
Sources: Morningstar, Dimon-Marsh-Staunton Global Indices. Study goes through 2010. The DMS Global and Country-Specific Indices measure the long-run performance of
stocks in 20 countries and three global regions around the world. Index definitions can be found on Page 71. Past performance does not guarantee future results.

1818
His
toric
al
Co
nte
xt
Historical ContextDebunking Mythsand Misperceptions

1919
“Our intuition about the future is linear. But the reality of technology is
exponential and that makes a profound difference. If I take 30 steps
linearly, I get to 30. If I take 30 steps exponentially, I get to a billion.”– Ray Kurzweil
Overpopulation,Demographics,and Energy

20
Overpopulation and Food Shortages?… Nope
Sources: United Nations and World Bank, as of 12/31/10.

21
Source: Bureau of Labor Statistics, Census Bureau, 2014.
How Are We Going to Handle All of Those
Baby Boomers?
20–39 59+ 40–59 20–39 59+ 40–59
59.0Million82.2
Million
85.3Million
Age in years Age in years
Perception RealityU.S. Population by Age
Top 10 Most Common Ages in the U.S.
23242021222526272829
#1
#10

22
Isn’t the U.S. Demographically Set to
Become the Next Japan?
Source: U.S. Census Bureau. Note: There are 19 permanent members of the G20.

23
Income and Unemployment Levels Reflect
Educational Attainment
Source: Brookings Institution and Federal Reserve Survey of Consumer Finances, June 2014.

24
Aren’t We in the Twilight of the American
Century?Answer: A. United States
Source: Ned Davis Research, 2013.

25
What About Peak Oil?
Source: BP Statistical Review of World Energy, 2014.

26
U.S. Energy Renaissance
1. Sources: U.S. Energy Information Administration, 2014, Bloomberg, New York Mercantile Exchange, 12/4/14.
2. Source: U.S. Department of Energy, 2013.
3. Sources: Bloomberg, New York Mercantile Exchange, 12/31/14.

27
U.S. Energy Consumption
Sources: U.S. Department of Energy, as of 12/31/11, and Census Bureau and U.S. Bureau of Economic Analysis, as of 12/31/13.

2828
“Where have you gone, Joe DiMaggio? A nation turns its lonely eyes to you.”– Simon & Garfunkel
The ImprovingHuman Condition

29
All Good Economies Evolve
Source: World Bank, 2013. For illustrative purposes only and not intended as investment advice. The placement of specific countries on the scale is based on the
percentage of economic activity coming from the agricultural, manufacturing and service sectors.

30
Global GDP Growth
Source: World Bank, as of 12/31/13.

31
The Big Story: Global Educated Middle Class
Sources: Middle Class Data: Brookings Institute, 2012, Population Data: World Bank: Health Nutrition and Population Statistics. Forecasts may not be achieved.
32
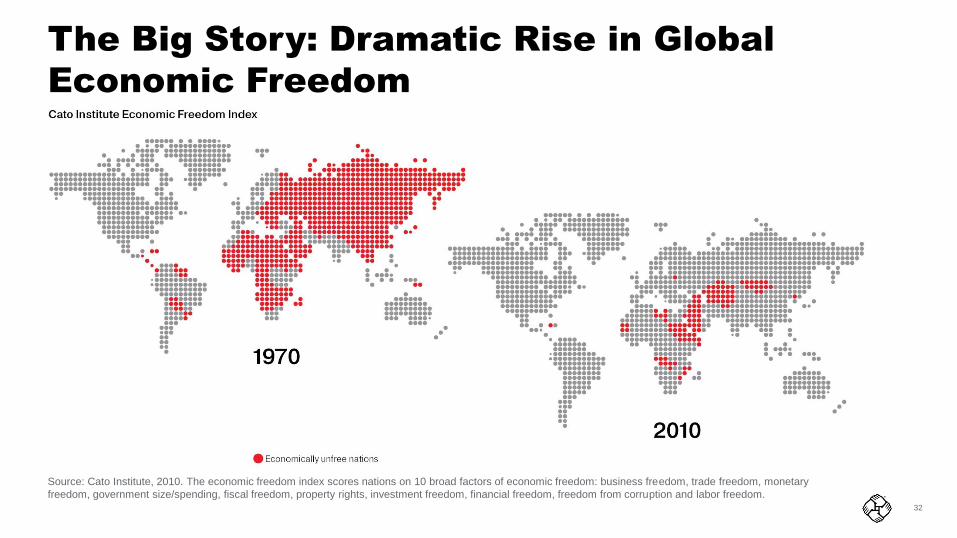
The Big Story: Dramatic Rise in Global
Economic Freedom
Source: Cato Institute, 2010. The economic freedom index scores nations on 10 broad factors of economic freedom: business freedom, trade freedom, monetary
freedom, government size/spending, fiscal freedom, property rights, investment freedom, financial freedom, freedom from corruption and labor freedom.

33
The Big Story: Dramatic Decrease in Global
Violence
Percentage of World Population that Was Killed in Specific World Events
Source: Statistics on Violent Conflict, 2014.
World War II(1939–1945)
3.7%
“The decline of violence may be the most significant and least appreciated
development in the history of our species.”—Steven Pinker, Psychologist, Harvard University

34
The Big Story: These Are the Good Old Days
Sources: Federal Reserve Bank of Boston, Statistical Abstract of the United States, International Labor Organization, United Nations, Bureau of Labor Statistics, as of
12/31/13. “Its Getting Better All The Time: 100 Greatest Trends of the Last 100 Years,” Stephen Moore & Julian L. Simon.

35
Our “Great Recession”....Like the Great
Depression?
Sources: Bureau of Labor Statistics, FDIC, Bureau of Economic Analysis, Bloomberg, and U.S. Federal Reserve, as of 12/31/14. For illustrative purposes only. Index
definitions can be found on Page 71. Past performance does not guarantee future results.

36
The Big Story: The American Dream Is Alive and Well
Source: United for a Fair Economy, 2011 and thomasjstanley.com
* 3% of the on deck individuals are undetermined.

37
U.S. Still a Manufacturing Powerhouse
Source: United Nations Industrial Development Organization, 2013. For illustrative purposes only and not intended as investment advice.

3838
“Americans always do the right thing but only after exhausting all other options.”— Winston Churchill
Hating theGovernmentIs Not anInvestmentStrategy

39
Gallup Poll Presidential Approval Ratings and Dow Jones Industrial Average Growth of $10,000
Approval Ratings and Markets Don’t Always
Move in the Same Direction
0
10
20
30
40
50
60
70
80
90%
Source: Gallup 12/31/14. The Presidential Approval ratings were introduced in the late 1930s to gauge public support for the President of the United States during the
term. For illustrative purposes only and not intended as investment advice. See Page 71 for index definitions. Past performance does not guarantee future results.
$100,000
$1,000,000
Log Scale
1961 1963 1969 1977 1981 1989 1993 2001 20091974 2014
Presidential Approval
RatingGain/
Annum% of Time
>65 2.4% 15.9%
50-65 6.8% 39.1%
36-50 11.8% 37.3%
<35 -13.8% 7.7%

40
Our Campaigns Have Never Been Filled with
Such Vitriol, Right?
For illustrative purposes only and not intended as investment advice.

41
But What About Debt and Deficits?
Source: Congressional Budget Office, 2014.

42
What About Those Trillions of Unfunded
Liabilities? The Reality of Social Security
Source: Congressional Budget Office Social Security Policy Options, July 2010.

4343
Cu
rren
tO
pp
ortu
nitie
s
CurrentOpportunities

44

45
Macro Insights
Deflationary Spiral Great Moderation 2.0 Expansion
Outcome:
• Broadly positive for bonds
• Extended period of low
equity returns
• Interest rates trend lower
Outcome:
• Stocks outperform bonds
• Interest rates low for long
• Growth and income scarce, investors pay up for it
Outcome:
• Stocks outperform bonds
• Cyclical sectors outperform
• Interest rates trend higher
Probability: Low Probability: High Probability: Low
Growth below trend,
disinflationary forces
Growth strong enough to support earnings but
not strong enough to raise inflation concerns
Secular growth forces prevail
ChineseConsumerism
EnergyRenaissance
Reform TechnologyRevolution
CrashingOil
PolicyMistake
FallingYuan
Trade
These views represent the opinions of OppenheimerFunds, Inc. and are not intended as investment advice or to predict or depict performance of any investment. These
views are as of the open of business on August 31, 2015, and are subject to change based on subsequent developments.

46
Global Contraction Extends the Cycle, Rather
than Curtailing It
Source: OFI Global Multi Asset Group Proprietary Leading Indicator and Organization for Economic Cooperation and Development (OECD), 8/31/15.
Past performance does not guarantee future results.
Output above trendOutput below trend
Acce
lera
tin
gD
ece
lera
ting
Recovery
Contraction
Expansion
Slowdown
Euro area
USChina Japan
Germany
France
UK
Brazil
Italy
Russia
India
Australia
Korea
Global
Indonesia
Poland
South Africa
Chile
49

47
And what do we know about bubbles?
Source: Strategas research partners 8/31/2015. Index definitions can be found on page 71. China is represented by the Shanghai SE Index. Oil is represented
by West Texas Intermediate Crude, Biotech is represented by the S&P Biotech index. Past performance does not guarantee future results.
Ind
ex b
ase
d to
10
0All indexes based to 100 at beginning of bubble period
0.0
100.0
200.0
300.0
400.0
500.0
600.0
1982 1985 1988 1991 1994 1997 2000 2003 2006 2009 2012 2015
Nikkei
China
Nasdaq
Oil
Biotech
China 2015
Nikkei
Nasdaq
China
Oil
Biotech
China

48
Fed in No Rush1
Composition of Fed (Based on member speeches/papers)
Global Central Banks in No Rush2
Consumer Price Index by Country and Central Bank Targets
“None of the... expansions… died of old age; every one
was murdered by the Federal Reserve” – Rudi Dornbush
1. U.S. Bank Asset Management Group analysis based on FOMC member speeches/papers
2. Source: Bloomberg, 8/31/15. Index definitions can be found on Page 71.
Dove Neutral Hawk
Yellen
Fischer
Tarullo
Dudley
Brainard
Powell
Evans Lacker
Lockhart
Williams
-0.1
0.1 0.2 0.20.3 0.3
1.3 1.5 1.6
-1.0
0.0
1.0
2.0
3.0
4.0
Y/Y
Perc
ent C
hange
Flag depicts Central Bank target
%

49
Most Likely Fed Path is Gradual
S&P 500 Index Around Start of Fed Tightening Cycles (Index based to 100 at beginning of rate hikes) Since 1946
Source: Ned Davis Research, 6/30/15. Index definitions can be found on Page 71. Past performance does not guarantee future results.
80
85
90
95
100
105
110
115Slow Tightening Cycles
Fast Tightening Cycles
Average
1-Year Returns
After 1st Rate Hike
10.78%
Pre-First Rate Hike Post-First Rate Hike
Fast
Tightening
Cycles
-2.67%
0
Time from Event
6 - Months 1 - Year-1 - Year -6 - Months

50
2.22%
3.70%3
6
9
12
15
1955 1958 1961 1964 1967 1970 1973 1976 1979 1982 1985 1988 1991 1994 1997 2000 2003 2006 2009 2012
10-Year U.S. Treasury Rate Nominal GDP (Real GDP + Consumer Price Index)
10-Year Treasury Rate and Nominal Gross Domestic Product (GDP) Y/Y Percent Change (10-Year Moving Average)
Interest Rates Likely to Stay Low for a
Long Time
Sources: U.S. Bureau of Economic Analysis and Bloomberg, as of 8/31/15. Nominal GDP is smoothed over 10 years, and as of 6/30/15. Forecasts may not be achieved. GDP (gross
domestic product) is the total value of all final goods and services produced in a country in a given year. Correlation expresses the strength of relationship between distribution of
returns of two sets of data. The correlation coefficient is always between +1 (perfect positive correlation) and –1 (perfect negative correlation). A perfect correlation occurs when the
two series being compared behave in exactly the same manner. Index definitions can be found on Page 71. Past performance does not guarantee future results.
Income Objective
Treasuries
Oversold
Correlation
0.90
Treasuries
Overbought
2014

51
350 bps
0 bps
500 bps
1,000 bps
1,500 bps
2000 2003 2006 2009 2012 2015
Senior Loans Spread Over LIBOR
A Conversation on Senior Loans
Source: Top Chart – Credit Suisse, 8/31/15. Left Chart – JPMorgan, 8/31/15. Right Chart – JPMorgan, 8/31/15. Senior loans are represented by the Credit Suisse
Leveraged Loan Index. High yield bonds are represented by the Barclays High Yield Bond Index. Index definitions can be found on Page 71. Past performance does
not guarantee future results.
Percent of New Loans Used for Refinancing
and Repricing
15 1625
42
52 50
3527
19 1911
45
35
5955
71
47
0
20
40
60
80
1998 2000 2002 2004 2006 2008 2010 2012 2014
Leveraged Loan and High Yield Bond
Maturity Schedule
0
50
100
150
200
250
2015 2016 2017 2018 2019 2020 2021 2022 2023
Senior Loans High Yield
Income Objective
Next 2 Years:
Only 3.8% of the
bond market matures
Only 0.7% of the
loan market matures
Num
ber
of M
atu
ring
Bonds a
nd L
oans

52
50
100
150
200
250%
2005 2006 2007 2008 2009 2010 2011 2012 2013 2014 2015
Municipal / Treasury Yield Ratio Average
BBB-Rated Spreads Attractive
Municipal Bond Spread Ratios
Low Issuance
U.S. Municipal Bond Issuance
229 221 258 274208
261 280
146 145 161 14490
88 131 79 76109
8699
90156 111 126
111
4256 51
8073
6255
51
7561 65
53
359408 388
430390 409
434
287
376333 335
254
0
100
200
300
400
500
2004 2005 2006 2007 2008 2009 2010 2011 2012 2013 2014 YTDas of
8/31/15New Money Refunding Combined
A Conversation on Municipal Bonds
Sources of spread charts: FactSet, Bloomberg, Merrill Lynch, 8/31/15. AAA and BBB are represented by Merrill Lynch Municipal Indices which are derived from data points on the Merrill Lynch
Municipal AAA Yield to Worst and Merrill Lynch BBB Yield to Worst, respectively. The yield ratio indicates the relationship between the Merrill Lynch Municipal Master Index and the U.S. 10-Year
Treasury. Source of issuance chart: The Bond Buyer, 8/31/15.
Source of municipal default rate chart: Moody’s Investors Service. Data regarding default rates is from a study titled “U.S. Municipal Bond Defaults and Recoveries, 1970-2014,” dated. July
24,2015 The study is conducted annually and this is the latest data available. The above figures provide cumulative default rates for Moody’s-rated Corporate and Municipal debt rated Baa. For
example, obligations in the Baa Municipal category had a default rate of 0.01% within one year of the initial rating, 0.03% within two years, etc.
Performance is shown for illustrative purposes only and does not predict or depict the performance of any Oppenheimer fund. Index definitions can be found on Page 71.
Low Historical Default RatesDefault Rates, Average Cumulative Issuer-Weighted, Moody’s Rated Baa Only, 1970–2014
0
1
2
3
4
5%
Year 1 Year 2 Year 3 Year 4 Year 5 Year 6 Year 7 Year 8 Year 9 Year 10
Baa Municipals Baa Corporates
Income Objective
100
150
200
250%
2005 2006 2007 2008 2009 2010 2011 2012 2013 2014 2015
BBB/AAA Yield Ratio Average

53
S&P 500 Index Minus 10-Year Treasury Yield
Stocks Trading Cheap to Bonds Globally
-8
-4
0
4
8%
1972 1975 1978 1981 1984 1987 1990 1993 1996 1999 2002 2005 2008 2011 2014
Source of chart data: Bloomberg, 8/31/15. The earnings yield is calculated as earnings divided by price. The earnings yield spread which is the difference between the
S&P 500 earnings yield and the 10-year U.S. Treasury yield and the spread between the earnings yield of the MSCI country specific indices and that country's 10-year
government bond yield. Index definitions can be found on Page 71.
Past performance does not guarantee future results.
Stocks cheap
to bonds
Bonds cheap
to stocks
Earnings Yields vs.
10-Year Government
Bond Yields
584 bps
450 bps
681 bps
529 bps
496 bps
363 bps
366 bps
Spre
ad (
%)
Growth Objective
380bps

54
Business Cycle: United States Valuations: U.S. and Developed Markets
0
5
10
15
20
25
SP500 MSCI EAFE
10 Yr Median P/E Current P/E
U.S. Economy Expanding, Valuations
Still Reasonable
Source: OFI Global Multi Asset Group Proprietary Leading Indicator and Organization for Economic Cooperation and Development (OECD) and Bloomberg, 8/31/15.
The charts are for illustrative purposes only and do not predict or depict the performance of any investment. Index definitions can be found on Page 71. Past
performance does not guarantee future results.
Current
P/E
Ratio
Growth Objective
Recovery Expansion
Contraction Slowdown
2 Years
Ago

55
Current
Business Cycle: Euro Area Valuations: U.S., Europe and Japan
Europe on the edge of a slowdown,
Japan recovering
Source: OFI Global Multi Asset Group Proprietary Leading Indicator and Organization for Economic Cooperation and Development (OECD) and Bloomberg, 8/31/15.
The charts are for illustrative purposes only and do not predict or depict the performance of any investment. Index definitions can be found on Page 71. Past
performance does not guarantee future results.P
/E R
atio
0
5
10
15
20
25
MSCI EuropeIndex
MSCI USA MSCI Japan Index
10-Year Median Current
Growth Objective
Business Cycle: Euro Area
RECOVERY EXPANSION
CONTRACTION SLOWDOWN
Current
2 Years
Ago
Business Cycle: Japan
RECOVERY EXPANSION
CONTRACTION SLOWDOWN
2 Years Ago

56
Valuations: U.S., Developed Markets and Emerging
Markets
0
5
10
15
20
25
S&P 500 Index MSCI EAFE Index MSCI EM Index
10 Yr Median P/E Current P/E
Emerging Markets in Recovery and
Valuations Are Favorable
Source: OFI Global Multi Asset Group Proprietary Leading Indicator and Organization for Economic Cooperation and Development (OECD) and Bloomberg, 8/31/15.
The charts are for illustrative purposes only and do not predict or depict the performance of any investment. Index definitions can be found on Page 71. Past
performance does not guarantee future results.P
/E R
atio
Growth Objective
Current
Business Cycle: China
RECOVERY EXPANSION
CONTRACTION SLOWDOWN
Current2 Years
Ago
RECOVERY EXPANSION
CONTRACTION SLOWDOWN
2 Years Ago
Business Cycle: India
57
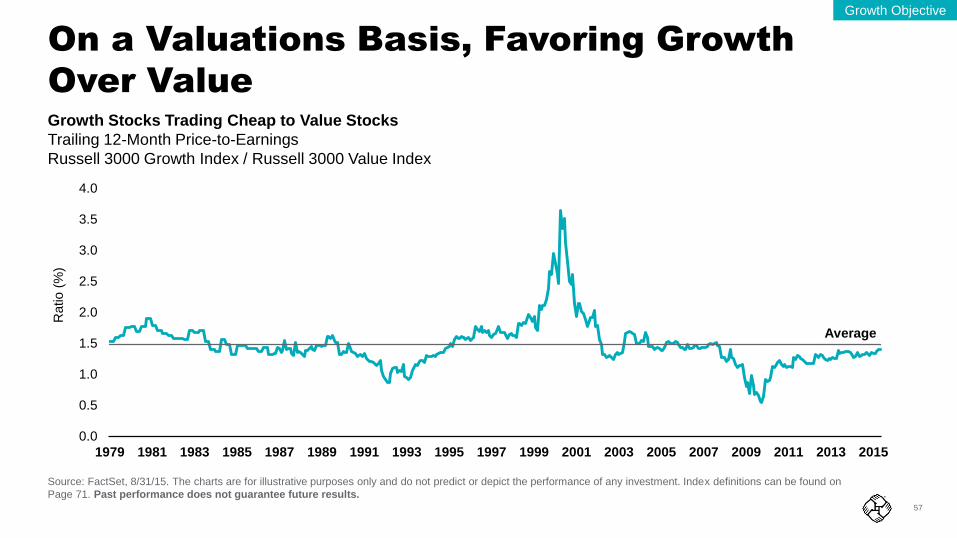
Growth Stocks Trading Cheap to Value Stocks
Trailing 12-Month Price-to-Earnings
Russell 3000 Growth Index / Russell 3000 Value Index
On a Valuations Basis, Favoring Growth
Over Value
0.0
0.5
1.0
1.5
2.0
2.5
3.0
3.5
4.0
1979 1981 1983 1985 1987 1989 1991 1993 1995 1997 1999 2001 2003 2005 2007 2009 2011 2013 2015
Ratio (
%)
Source: FactSet, 8/31/15. The charts are for illustrative purposes only and do not predict or depict the performance of any investment. Index definitions can be found on
Page 71. Past performance does not guarantee future results.
Growth Objective
Average

58
Growth Assets Historically Outperform in
Rising Rate Environments
Sources: Barclays Live, Credit Suisse, Alerian and Bloomberg, 12/31/14. The average 10-year Treasury rate over the past 20 years is 4%. “Low” is defined as below 4%. TIPS is represented by U.S. Generic Treasury Inflation
Protected Bond Securities. Core Bonds are represented by the Barclays Aggregate Bond Index. Gold is represented by the U.S. dollar spot price of one troy ounce. Commodities are represented by the Dow-Jones UBS
Commodity Index. Senior Loans are represented by the Credit Suisse Leveraged Loan Index. International Equities are represented by the MSCI EAFE Index. Emerging Market Equities are represented by the MSCI Emerging
Market Index. Large-Cap Stocks are represented by the Russell 1000 Index. Master Limited Partnerships are represented by the Alerian MLP Index. Small-Cap Stocks are represented by the Russell 2000 Index. Index
definitions can be found on Page 71. Past performance does not guarantee future results.

59
-0.23-0.08 -0.02
0.06 0.120.25 0.25 0.34
-0.50
0.00
0.50
U.S. DollarIndex
AlerianMLPIndex
CSLeveraged
LoanIndex
BloombergCommodity
Index
HFRIRelativeValue:Multi-
Strategy
FTSENAREITEquityREITIndex
Swiss ReCat Bond
Index
Gold
10 Yr Correlation with Barclays Aggregate Bond Index 10 Yr Correlation with S&P 500 Index
Correlations of Assets to Equities,
Fixed Income, and to Each Other
Sources: FactSet, 8/31/15. HFRI as of 7/31/15. Diversification does not guarantee profit or protect against loss. Correlation expresses the strength of relationship
between distribution of returns of two sets of data. The correlation coefficient is always between +1 (perfect positive correlation) and –1 (perfect negative correlation). A
perfect correlation occurs when the two series being compared behave in exactly the same manner. Index definitions can be found on Page 71. Past performance does
not guarantee future results.
-0.52
0.07 0.230.50 0.52 0.61 0.67 0.75
-1.0
0.0
1.0
U.S. DollarIndex
Gold Swiss ReCat Bond
Index
BloombergCommodity
Index
AlerianMasterLimited
PartnershipIndex
CSLeveragedLoan Index
HFRIRelative
Value: MultiStrategy
FTSENAREIT
Equity REITIndex
HFRI Relative
Value: Multi-
Strategy
Swiss Re Cat
Bond Index
CS Leveraged
Loan Index
Bloomberg
Commodity
Index Gold
FTSE NAREIT
Equity REIT
Index
U.S. Dollar
Index
Alerian MLP
Index
HFRI Relative Value: Multi-Strategy 1.00 0.40 0.83 0.58 0.21 0.49 -0.41 0.58Swiss Re Cat Bond Index 0.40 1.00 0.32 0.17 0.07 0.20 -0.16 0.18CS Leveraged Loan Index 0.83 0.32 1.00 0.43 0.03 0.54 -0.25 0.56Bloomberg Commodity Index 0.58 0.17 0.43 1.00 0.53 0.31 -0.67 0.45Gold - Continuous Contract 0.21 0.07 0.03 0.53 1.00 0.10 -0.42 0.00FTSE NAREIT Equity REIT Index 0.49 0.20 0.54 0.31 0.10 1.00 -0.38 0.33U.S. Dollar Index -0.41 -0.16 -0.25 -0.67 -0.42 -0.38 1.00 -0.28Alerian MLP Index 0.58 0.18 0.56 0.45 0.00 0.33 -0.28 1.00

60
Po
sitio
nin
gY
ou
r Pra
ctic
e
PositioningYour Practice

61
The Two Questions Everyone Wants an
Answer To

62
Our Three-Step Process

63
Why We Formed a Team

64
Contingency Planning: The Big Three
65
Index DefinitionsThe 10-Year U.S. Treasury Yield is generally considered to
be a barometer for long-term interest rates.
The Alerian MLP Index is a composite of the 50 most
prominent energy Master Limited Partnerships (MLPs).
The Barclays Aggregate Agencies Index, Agency Mortgage-
Backed Securities (MBS) Index and Commercial Mortgage-
backed Securities (CMBS) Index represent the U.S.
Government Related-Agencies, U.S. MBS and CMBS
components of the Barclays U.S. Aggregate Bond Index,
respectively.
The Barclays Aggregate Bond Index is an index of U.S.
Government and corporate bonds that includes reinvestment
of dividends.
The Barclays Aggregate Corporate Bond Index represents
primarily investment-grade corporate bonds within the
Barclays Aggregate Bond Index.
The Barclays Aggregate U.S. Treasuries Index represents
public obligations of the U.S. Treasury
with a remaining maturity of one year or more.
The Barclays High Yield Bond Index covers the universe of
fixed rate, non-investment- grade debt. The JPMorgan GBI-EM
Global Diversified Index tracks total returns for local-currency-
denominated money market instruments in the emerging
markets.
The Barclays Municipal Bond Index is a rules-based, market-
value-weighted index engineered for the long-term tax-exempt
bond market and includes bonds rated investment-grade by at
least two of the three major rating agencies (Moody’s, S&P
and Fitch).
The Bloomberg Commodity Index is comprised of commodities
traded on U.S. exchanges, with the exception of aluminum,
nickel and zinc, which trade on the London Metal Exchange.
The Citigroup Non-U.S. World Government Bond Index (USD
Unhedged) is comprised of foreign government bonds with
maturities over one year.
The Credit Suisse Leveraged Loan Index is a composite index
of senior loan returns representing an unleveraged investment
in senior loans that is broadly based across the spectrum of
senior bank loans and includes reinvestment of income (to
represent real assets).
Consumer Price Index (CPI) program produces monthly data
on changes in the prices paid by urban consumers for a
representative basket of goods and services.
The DMS Global Index, DMS Japan Index, DMS Spain Index,
DMS Australia Index, DMS Canada Index, DMS United Kingdom
Index, DMS United States Index, DMS France Index, DMS Europe
Index, DMS Italy Index, and DMS Germany Index represent equity
market performance in those countries or regions.
The Dow Jones Industrial Average is a price-weighted average of
30 blue-chip stocks that are generally the leaders in their industry.
The FTSE National Association of Real Estate Investment Trusts
(NAREIT) Equity REITs Index is an index consisting of certain
companies that own and operate income-producing real estate
that have 75% or more of their respective gross invested assets in
the equity or mortgage debt of commercial properties.
The Gold Spot price is quoted as U.S. dollar per troy ounce.
The HFRI RV (Hedge Fund Research, Inc. Relative Value) Multi-
Strategy Index employs an investment thesis predicated on
realization of a spread between related yield instruments in which
one or multiple components of the spread contains a fixed income,
derivative, equity, real estate, MLP or combination of these or
other instruments.
The JPMorgan Domestic High Yield Index tracks the investable
universe of domestic below-investment-grade bonds in the United
States.
The JPMorgan EMBI Global Diversified Bond Index is a uniquely
weighted version of the EMBI Global Index, which limits the
weights of those countries with larger debt stocks by only including
specified portions of these countries’ eligible current face amounts
of debt outstanding.
The MSCI EAFE Hedged to USD Index is 100% hedged to the
USD by selling each foreign currency forward at the one-month
forward weight.
The MSCI EAFE Index is designed to measure developed market
equity performance, excluding the U.S. and Canada.
The MSCI Emerging Markets (EM) Index is designed to measure
global emerging market equity performance.
The MSCI World Index is designed to measure global developed
market equity performance.
The Merrill Lynch AAA Municipal Indices measure the
performance of U.S. tax-exempt bonds rated AAA.
The Merrill Lynch BBB Municipal Bond Index is an index designed to
measure the performance of below-investment-grade municipal bonds.
BBB is the highest grade of rating by Moody’s that is considered below
investment grade.
The MSCI Italy, MSCI Germany, MSCI United Kingdom, MSCI
Canada, MSCI France, MSCI U.S., MSCI Thailand, MSCI Poland,
MSCI Mexico, MSCI Korea, MSCI Russia, MSCI Argentina and MSCI
Europe ex. U.K. represent equity market performance in those
countries or regions.
The Nikkei 225 Index components are among the most actively traded
issues on the TSE first section. The Index represents the performance
of first section stocks and the general market. Components have been
rebalanced from time to time to assure liquidity and representation of
Japan’s industrial structure.
SBBI U.S. Large Company Stock Index is an unmanaged index of
stocks of large U.S. companies.
SBBI U.S. Long-Term Government Bond Index is an unmanaged index
generally representative of the bond market.
SBBI U.S. Small Company Stock Index is an unmanaged index of
stocks of small U.S. companies.
SBBI U.S. (30-day) Treasury Bills is generally representative of the
rate of return on a savings investment.
Swiss Re Cat Bond Index is constructed to track the total return for
U.S. dollar- denominated catastrophe bonds.
The Russell 1000 Index measures the performance of large-
capitalization stocks.
The Russell 1000 Growth Index measures the performance of those
Russell 1000 companies with higher price-to-book ratios and higher
forecasted growth values.
The Russell 1000 Value Index measures the performance of those
Russell 1000 companies with lower price-to-book ratios and lower
forecasted growth values.
The Russell 2000 Index measures the performance of small-
capitalization stocks
The Russell 2000 Growth Index measures the performance of those
Russell 2000 companies with higher price-to-book ratios and higher
forecasted growth values.
The Russell 2000 Value Index measures the performance of
those Russell 2000 companies with lower price-to-book ratios
and lower forecasted growth values.
The Russell Midcap Index measures the performance of mid-
capitalization stocks.
The Russell Midcap Growth Index measures the performance of
those Russell Midcap companies with higher price-to-book ratios
and higher forecasted growth values.
The Russell Midcap Value Index measures the performance of
those Russell Midcap companies with lower price-to-book ratios
and lower forecasted growth values.
The S&P 500 Index is a market capitalization weighted index of
the 500 largest domestic U.S. stocks.
The S&P Biotechnology Select Industry Index is designed to
measure the performance of the Biotechnology GICS® sub-
industry. The Index comprises stocks in the S&P Total Market
Index that are classified in the GICS biotechnology sub-industry.
The Shanghai SSE Index is a domestic Chinese equity market
index where A shares in China are listed.
Shiller Home Price Index tracks changes in home prices
throughout the United States.
Treasury Inflation Protected Securities is generic U.S.
Government inflation-index bonds.
The U.S. existing home sales median price tracks changes in
residential property prices of existing single-family homes,
condos and co-op sales.
The West Texas Intermediate Crude price is the price of a barrel
of oil at the Cushing, Oklahoma-based distribution point for
almost all domestically produced oil in the United States.
Indices are unmanaged and cannot be
purchased directly by investors. Index
performance is shown for illustrative purposes
only and does not predict or depict the
performance of any investment. Past
performance does not guarantee future
results.