Compatibility Testing of Low VOC Alternative Cleaning Solvents for
49
Compatibility Testing of Low VOC Alternative Cleaning Solvents for Lithographic Printing Applications April 12, 2006 Developed for South Coast Air Quality Management District under contract # 03135 by the University of Tennessee Center for Clean Products and Clean technologies.
Transcript of Compatibility Testing of Low VOC Alternative Cleaning Solvents for

Compatibility Testing of Low VOC Alternative Cleaning Solvents
for Lithographic Printing Applications
April 12, 2006
Developed for South Coast Air Quality Management District under contract # 03135 by the University of Tennessee Center
for Clean Products and Clean technologies.

Disclaimer This document was written by the grantee. It has not been through a formal external peer review process and does not necessarily reflect all of the most recent policies of the South Coast Air Quality Management District, in particular those now under development. The use of specific trade names or the identification of specific products or processes in this document are not intended to represent an endorsement by South Coast AQMD. Discussion of environmental statutes is intended for information purposes only; this is not an official guidance document and should not be relied upon to determine applicable regulatory requirements.
For More Information To learn more about the South Coast Air Quality Management District or about he other activities associated with the material presented in this report, please visit the AQMD web site at:
www.AQMD.gov To learn more about the University of Tennessee Center for Clean Products and Clean Technologies, visit the Center’s web site at:
www.cleanproducts.org

Acknowledgments This testing was conducted by the University of Tennessee (UT) Center for Clean Products and Clean Technologies under funding through a grant from the South Coast Air Quality Management district. The authors would like to thank AQMD staff and project officers, including Lou Yuhas, Lee Lockie, Roberta Riggs, Abid Latif, and Adawale Oshinuga, who made this project possible and who prevoded project oversight and support. The authors would like to acknowledge the outstanding contributions of several key industry members, including Rick Williams (Bottcher), Gerry Whippie (Lithoroll), Gerry Benetto (PIA), Ron Conti (Varn), and Len Kruizenga (Rotadyne) who provided advice and collaborated on the development of the testing protocols and testing criteria used to conduct this testing. In addition, the authors would like to thank the following participants who provided blankets, roller compounds, solvents, or other assistance or support for the project in some other significant way. The testing could not have been completed without their considerable support.
• Reeves • Day International • Bottcher • Rotadyne • Lithoroll • Printers Service Corp • AEG Environmental Products • Mirachem Corporations • Fuji Hunt • Siebert • Institute for Research and Technical Assistance • Graphical Arts technical Foundation

UT Center for Clean Products April 12, 2006 4
Table of Contents 1. Introduction ………………………………………………………………… 5 2. Scope of Work……………………………………………………………… 5 3. Lithographic Printing Process Description………………………………… 6 4. Baseline and Alternative Solvents………………………………………….. 7 5. Compatibility of Cleaning Solvents with Lithographic Blankets …………. 8 5.1 Blanket Materials 8 5.2 Blanket Test Protocol 9 5.3 Blanket/Solvent Test Results
11
6. Compatibility of Cleaning Solvents with Lithographic Rollers …………... 14 6.1 Roller Materials 14 6.2 Roller Compatibility Test Protocol 14 6.3 Test Results
18
Appendix A : Test Protocol for the Measurement of the Effects of Low VOC Cleaning Solvents on Lithographic Printing Blankets………….… 22 Appendix B : Blanket Test Data Record Form……………………………........... 29 Appendix C : Blanket Test Apparatus Test Diagram…………………………….. 31 Appendix D : Blanket/Solvent Test Data- Compatibility Testing.……………… 33 Appendix E : Test Protocol for the Measurement of the Effects of Low VOC Cleaning Solvents on Lithographic Printing Rollers .……………… 37 Appendix F : Roller Test Data Record Form …………………………………….. 44 Appendix G : Roller/Solvent Test Data- Compatibility Testing ………………… 46

UT Center for Clean Products April 12, 2006 5
I. Introduction South Coast Air Quality Management District (AQMD), located in the Los Angeles basin area, is the local regulatory agency charged with regulating air emissions. Solvent cleaning operations have been identified as one of the major sources of volatile organic compounds (VOCs) emissions in the basin. These operations include removal of contaminants such as dirt, soil, grease, uncured coatings, adhesives, and inks. Rule 1171—Solvent Cleaning Operations, primarily regulates VOC emissions from solvent cleaning operations. Since its adoption, Rule 1171 has become a key component of AQMD’s ozone reduction strategy and has been amended several times to achieve greater VOC emission reductions. In an effort to further reduce VOC emissions, Rule 1171 was amended in 1999 to achieve additional reductions from the cleaning of ink application equipment used in lithographic printing. These reductions were to be achieved in two phases lowering the allowable VOC limits in 2001, and again in July 2005. Under the proposed VOC reductions, the allowable limit will be reduced from 900 grams/liter to a proposed 100 grams/liter for roller wash, blanket wash, and on-press components, and to 25 grams/liter for removable press components. The 1999 amendment requires AQMD to conduct a technology assessment of potential low VOC alternatives for cleaning printing ink from equipment and materials used in lithographic applications. The purpose of the assessment is to evaluate the feasibility of the proposed limits for implementation. The technology assessment includes a comprehensive evaluation of currently available lithographic cleaning solvents as well as alternative, low VOC solvents that may be available now or in the near future for use by the lithographic printing industry. 2. Scope of Work As part of the technical assessment for Rule 1171, the Center for Clean Products and Clean Technologies (Center) at the University of Tennessee (UT) has been contracted by South Coast to design and conduct a series of tests to determine the compatibility of selected existing solvents and new alternative low VOC solvents with both press blankets and print rollers used in lithographic printing. Protocols for testing were developed in collaboration with industry through a stakeholder group that included leading roller and blanket manufacturers. Compatibility testing of solvent/roller and solvent/blanket combinations was performed only on the most promising combinations for alternatives and on all of the benchmark solvents. The scope of work is part of a larger research effort that includes the contributions of two other organizations, the Institute for Research and Technical Assistance (IRTA) and the Graphic Arts Technical Foundation (GATF), responsible for evaluating the performance of the various solvents under the Rule 1171 technical assessment. To accomplish this scope of work, Center staff worked in conjunction and collaboration with members of the other research organizations to identify relevant solvent/roller and solvent/blanket combinations for compatibility testing. Solvents, both benchmark solvents and low VOC alternative solvents, were identified for testing through the work of IRTA and GATF.

UT Center for Clean Products April 12, 2006 6
In particular, IRTA was tasked with conducting field testing to identify alternative low VOC solvents for particular applications with a number of lithographic printers. Given the extensive nature of in-facility testing and the on-going extended testing at many of the facilities, it was not possible, nor practical, for the Center to test every alternative solvent introduced in the field. Compatibility testing was conducted, instead, to determine the potential of chemicals and chemical mixtures to serve as alternatives to high VOC solvents. As such, alternative solvents were tested to provide guidance to IRTA in their development and testing process, as well as to identify concentration thresholds that might indicate the potential for incompatibilities, thus indicating where extended testing over time might be warranted. For details of the work performed by IRTA or GATF, please contact AQMD. This report presents the testing results and conclusions of the compatibility testing conducted by the Center. Individual testing protocols developed by the Center are described, and results and conclusions presented for solvent compatibility with both rollers and printing blankets. 3. Background- Lithographic Printing Process Lithography is a printing technique that is well suited for printing both text and illustrations in short to medium length runs. Unlike other printing processes such as flexography and gravure where the image is transferred directly from the printing plate onto the substrate, the lithography process uses an offset process. In an offset process, ink is first applied to the printing plate using a metering roller and then transferred onto a rubber/synthetic blanket that is wrapped tightly around the print cylinder. The image is then transferred from the blanket to the substrate to form the printed product. The process allows for repetitive printing with excellent quality on a variety of substrates. All offset printing presses have at least three cylinders as well as roller trains for the inking and dampening systems, as shown in Figure 1. The plate cylinder, the offset cylinder, and the impression cylinders are responsible for transferring the intended image to the substrate. The printing image is created on the printing plate using a photochemical process. As the plate cylinder rotates, it comes in contact with the dampening system rollers, which apply water to the non-image portions of the plate, keeping them wet throughout the process. The ink, which is oily in nature, adheres to the image portion of the plate while being repelled from the
Figure 1. Lithographic print process roller train Source: http://en.wikipedia.org/wiki/Offset_printing

UT Center for Clean Products April 12, 2006 7
water-containing non-image areas. The flexible printing plate is wrapped around the plate cylinder and tightly secured. The ink image is then transferred from the plate cylinder to the blanket cylinder, which in turn, transfers the image to the substrate as it passes between the offset cylinder and the impression cylinder. Blankets are made out of a variety of rubber compounds, depending on the ink type and application. Typical types of blankets include EPDM, and nitrile-based rubber compounds. The primary purpose of the blanket is to accept the image from the plate cylinder and to transfer it to the substrate. The use of blankets in offset printing allows for increased production speeds and improved quality of the image in terms of fine tones. The flexibility of the blanket in the offset process both preserves the more expensive image plate and conforms more uniformly to the substrate. Lithographic processes are typically characterized by the manner in which the substrate is fed into the process and the mechanism through which the ink is cured. On sheet-fed presses, the substrate is fed into the press one sheet at a time at high speed. Web-fed presses print on a continuous roll of substrate, or web, that is later cut to size. Heat-set presses use a heat curing stage to cure the ink on the substrate after the product has been printed. Non-heatset processes allow the ink to air cure at ambient temperatures. 4. Baseline and Alternative Cleaning Solvents The primary task of the testing conducted by the Center was to test existing cleaning solvents as well as solvents developed over the course of the technology assessment. Solvents that were tested included high VOC solvents currently used for lithographic press cleaning as well as low VOC solvents that were identified or developed as alternatives. The baseline solvents currently used in industry were identified for testing by GATF as part of a parallel but complimentary scope of work. The following solvents were identified by GATF as baseline solvents for each individual application:
• Amberclean 455 (newsprint) • Anchor A-240 (heat-set) • Anchor T-100 (newsprint) • Autowash 6000 (sheet-fed) • Mirachem Pressroom Cleaner (newsprint) • PES C-34 (newsprint) • Varn 120 (Sheet-fed, newsprint) • Varn 230 (heat-set)
All of the above solvents were identified by GATF as baseline solvents for cleaning both lithographic rollers and blankets. Samples of each of the baseline solvents were provided to the Center for testing either by the manufacturers or by GATF. Low VOC solvents were also tested for compatibility with lithographic printing blankets and rollers. Under a separate contract, IRTA developed and conducted in-facility testing of low

UT Center for Clean Products April 12, 2006 8
VOC solvents for lithographic printing applications. Through that work, alternative solvents were identified and provided by IRTA for testing by the Center. Identified solvents include:
• Soy Gold 2000 • Acetone (92%)/DPM (8%) • Acetone/ Soy (various mixtures of soy content ranging from 8-75%) • Acetone/Water/Hydroclean (various mixtures) • Acetone (90%)/VMP Naptha (10%) • Acetone (50%) / Brulin (50%) • Siebert Magic UV Wash
Unlike the baseline solvents, alternative solvents may only be appropriate for cleaning either lithographic rollers or blankets. Alternatives were selected for testing with rollers or blankets based on the in-field testing conducted by IRTA. Solvent/material combinations for testing were identified in consultation with IRTA and AQMD. 5. Compatibility of Cleaning Solvents with Lithographic Blankets Under the scope of work set out by AQMD, the Center was contracted to test the compatibility of alternative low VOC solvents with existing lithographic blanket compounds widely available in the marketplace. Additionally, the Center was also to test currently used benchmark solvents identified by the industry. To conduct this testing, a testing protocol was developed by the Center in collaboration with blanket manufacturers and other industry stakeholders. The solvents and blanket materials tested, details of the test protocol, and the results of the testing are presented below. 5.1 Blanket Materials Lithographic printing blankets can be made from a variety of materials, but are primarily made from EPDM or nitrile. The type of blanket compound used depends on a number of factors including the particular print application, the ink type, and the type of printing process. A variety of blankets were submitted for testing by leading manufacturers including Day International and Reeves. Blankets specifically designed for heat-set web, newsprint, and sheet-fed applications were all submitted for testing. In total, four nitrile-based blanket compounds were tested, along with two EPDM blankets. Submitted blankets were cut into samples for testing as shown in Figure 2.
Figure 2: Blanket materials cut into samples for testing
UT Center for Clean Products April 12, 2006 9
5.2 Blanket Test Protocol To facilitate testing of the solvents under controlled test conditions in a consistent and repeatable manner, a testing protocol was developed by the Center and peer-reviewed by blanket manufacturers, lithographic printers, and trade association personnel. The protocol describes a test method that measures the comparative ability of lithographic printing blankets to withstand exposure to solvents used to remove printing ink and other debris during press operation. The complete testing protocol is presented in Appendix A. To test for compatibility, samples of rubber blankets used for lithographic printing are prepared and then secured into place in a test fixture. Solvent is introduced into each of the test cells of the fixture, coming into contact with a portion of the blanket surface. After the required amount of time, the solvent is removed from the fixture, the fixture is disassembled, and the blanket samples are removed and allowed to dry. After drying for 72 hours, any swelling or shrinkage of the samples was recorded. Test samples of blanket material obtained from blanket manufacturers were prepared by cutting sample sections of the blanket large enough that when placed in the test rig, the surface of the blanket is exposed to the solvent without exposing the side of the blanket. Prior to clamping the blanket samples into the test apparatus, samples were weighed and tested for thickness using a Cady Gauge, shown in Figure 3. All data was recorded on the data record shown in Appendix B. The back of each sample was labeled using permanent marker with a sample ID number, the initial mass and thickness of the sample, and the test solvent to be tested, as shown in Figure 4.
Once the samples were prepared, they were placed into the test rig, and the stainless steel cylinders were placed onto each sample. The cylinders were centered on the sample so that when clamped together, the cylinder formed a test cell confining the solvent to the top surface of the blanket, as shown in Figure 5. The top plate was than placed onto the test rig and clamped
Figure 3. Measuring blanket thickness
using a Cady Gauge
Figure 4. Back of blanket test sample

UT Center for Clean Products April 12, 2006 10
down using fasteners. Once the samples were clamped into the test rig, solvent was introduced into individual cells through the hole in the top of each test cell, as shown in Figure 6. The holes in the top plate were then covered with watch glasses to limit volatilization of the solvent over the test period. Different solvents were entered into individual test cells according to the planned solvent/blanket combinations to be tested. The test was allowed to run for a period of 5 hours. Upon completion of the test period, the solvent was siphoned off, samples were removed from the test cells, and individual samples were again weighed and measured using the Cady gauge. Data from the wet samples were again recorded on the data record sheet. Samples were then placed in Petri dishes with the covers loosely affixed to protect the surface from contamination, and allowed to air dry for a period of 72 hours under moderate air flow conditions.
The thickness and mass of the final dried samples were then measured and recorded, and results tabulated as follows:
Change in Blanket Thickness, ∆Tw = Tw – Ti (Equation 1)
where: ∆Tw = change in blanket thickness directly after exposure to solvent Ti = initial thickness of blanket sample Tw = thickness of blanket sample after exposure to solvent The change in thickness of the blanket sample after allowing the sample to dry in ambient air (72 hours) was calculated using the following equations:
Change in Blanket Thickness, ∆Td = Td – Ti (Equation 2)
Figure 5. Blanket Compatibility
Testing Apparatus
Figure 6. Solvent introduced to a
test cell

UT Center for Clean Products April 12, 2006 11
where: ∆Td = change in blanket thickness after allowing to dry Ti = initial thickness of blanket sample Td = thickness of blanket sample after drying
Criteria for acceptable performance in terms of swelling and shrinkage of the blanket under room temperature testing are presented in Table 1.
Table 1. Criteria for Acceptable Solvent/Blanket Compatibility Measurement Acceptable
Change in Thickness, ∆Tw (in thousandths of an inch)
and Change in Thickness, ∆Td
Tw < 0.005 swell
and Td < 0.001 shrinkage
More detailed information regarding the protocol is presented in the appendices to this report. The complete testing protocol is provided in Appendix A, while the data collection form used for this testing is presented in Appendix B. A schematic of the testing apparatus is provided in Appendix C. 5.3 Results of Blanket/Solvent Compatibility Testing Solvent and blanket combinations were prioritized based on the current understanding of the project team, consisting of AQMD, GATF, UT, and IRTA. Initial testing was conducted on a wide range of solvent/blanket combinations. However, to conserve project resources, when initial testing indicated that a solvent was not a likely replacement, further testing on the solvent was abandoned in favor of testing solvents with more promise. Results of the testing were reported back to the project team and used to inform the in-facility testing of IRTA as appropriate. Initial testing focused on benchmarking existing solvent/blanket combinations, both to validate the test and to provide a baseline against which to compare alternative solvents developed over the course of the project. Results of the baseline solvent/blanket combinations that were tested are presented in Table 2. After testing of the benchmark solvents, blanket/solvent combinations for testing of alternative solvents were selected based on their interest to the study, their potential for meeting the performance goals of the solvent at a low VOC level, and on their potential to add to the body of knowlede required to formulate better alternatives. As such, alternative solvents were tested initially on selected blanket compounds and then either confirmed through repeated testing, or scrapped based on the initial test results combined with field testing conducted simultaneously by IRTA. Table 3 presents the test results for the blanket/solvent combinations for which compatibility tests were conducted for alternative solvents. Complete testing data from individual tests, including measured and recorded data as well as all calculated values are presented in Appendix D.

UT Center for Clean Products April 12, 2006 12
Table 2. Blanket Test Matrix- Baseline Solvents Nitrile EPDM Baseline Solvents
A B C D E F Mirachem Pressroom Cleaner (100%) 2 2 Varn A-230 2 2 Varn V-120 2 2 2 PES C-34 2 2 Autowash 6000 2 2 Anchor T-100 2 2 Anchor A-240 2 2 1/1 Amberclean 455 2 2
Table 3. Blanket Test Matrix- Alternative Solvents Nitrile EPDM Low VOC Solvents
A B C D E F Soy Gold 2000 (100%) 1/1 2 2 Soygold 2000 (50%)/ Water (50%) 2 2 Acetone (92%)/ DPM (8%) 2 2 2 Acetone (25%)/ Soygold 2000 (75%) 2 2 Acetone (50%)/ Soygold 2000 (50%) 2 2 Acetone (75%)/ Soygold 2000 (25%) 2 Acetone (92%)/ Soygold 2000 (8%) 2 2 2 Acetone (75%)/ Water (12.5%)/ Hydroclean (12.5%) 2 Acetone (90%)/ VMP Naptha (10%) 2 2 2 Acetone (50%)/ Brulin (50%) 2 Acetone (25%)/ hydroclean (12.5%)/ water (62.5%) 2 Siebert Magic UV Wash 1/1 2 Siebert Magic Wash 522C 2 2 Siebert Autowash #3 2 Siebert 219 ES Emulsion 2 Key 2- Number in cell indicates the number of tests conducted Passing result - 1/1- indicates a split result- 1 passing test and 1 failing or borderline test Borderline result (bold) - Failing result -
A total of 92 compatibility tests were conducted over the course of the project on 46 different blanket/solvent combinations. The numbers in each table cell indicate the number of individual tests that were conducted for each solvent/blanket combination. Combinations for which all testing passed the established criteria were displayed as a passing result (non-shaded), while combinations where all tests conducted failed at least one criteria were displayed as a failed

UT Center for Clean Products April 12, 2006 13
result (shaded). Mixed results for blanket/solvent combinations with at least one passing and one failed test result are displayed as a ratio of passed to failed tests. Finally, test results that are considered borderline passing- defined as shrinkage or swelling within one thousandths of an inch of the criteria- are bolded in the table. These failed test results are likely within the margin of error (within 0.001 inches) in the testing so further testing should be conducted before the combination is not considered to be viable. Solvents identified by GATF as baseline solvents were tested extensively to calibrate the test method and the appropriateness of the criteria selected. A total of 18 combinations of blanket and solvents were tested. Six of the baseline solvents including Varn A-230, PES C-34, Autowash 6000, Amberclean 455 and Anchor T-100 passed the testing for each of the blanket types tested, while the results for Varn-120 consistently failed the swell testing criteria, but within the margin of error, indicating a borderline result. Only one baseline solvents, Anchor A-240, provoked unacceptable levels of swelling or shrinkage in the majority of the samples tested. This testing served as a benchmark against which to compare the performance of potential alternatives. Alternative solvents included a variety of mixtures submitted for testing by IRTA as well as commercially available solvents not identified as an industry baseline. A total of 28 blanket/solvent combinations were tested, covering 15 different solvent alternatives. Some alternatives were initially tested and then no longer considered based on the poor results. Others were identified for additional testing based on initial testing, in-field performance, or overall interest. Results for individual solvents are displayed in Table 3 above. Several conclusions were reached as a result of the testing. For nitrile-based blankets, soy-based solvents were found to be viable, with results borderline or passing in most categories. Conversely, the presence of high concentrations of acetone was confirmed to provoke a high degree of swelling in the blankets, regardless of the mixture. However, solvent mixtures with concentrations of acetone below 30 percent tested well. The 50% Soy/ 50% acetone mixture failed both swelling and shrinkage criteria substantially and should not be considered. For EPDM blankets, Siebert Magic Wash UV was the best performer, passing both test criteria handily. Solvents containing a high concentration of acetone also proved to be acceptable, however, when mixed with DPM provoked shrinkage in the samples that was considered borderline. Solvents with even small amounts of soy provoked substantial swelling, and their use with EPDM should be avoided. Combinations were also selected for testing to isolate differences between blankets manufactured by different companies to a particular solvent (e.g. type A and type B nitrile). Virtually every solvent was tested against 2 or more blankets within a particular category. Results across solvent and blanket types were remarkably consistent indicating that differences in the manufacturing of a blanket type, including any proprietary rubber compounding were not great enough to influence the overall compatibility of the blanket with any particular solvent. In no instance did a solvent test pass for one blanket and yet fail for a second blanket compound.
UT Center for Clean Products April 12, 2006 14
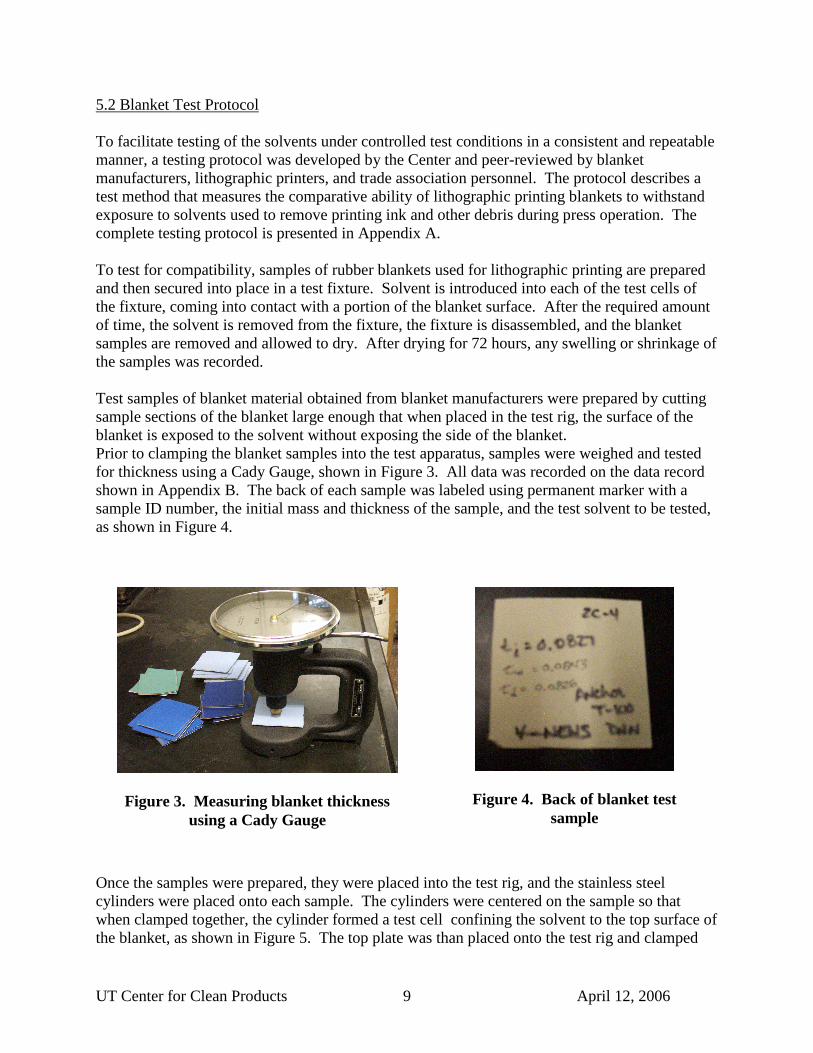
6. Compatibility of Solvents with Lithographic Rollers The Center was also tasked with testing the compatibility of alternative low VOC solvents with rubber compounds used to manufacture lithographic rollers. In addition, the Center ran compatibility testing of widely used baseline solvents to provide a benchmark against which to judge the performance of the alternative solvents. Like the blanket testing, a testing protocol was developed by the Center in collaboration with roller manufacturers and other industry stakeholders. The solvents and printing roller materials tested, details of the test protocol, and the results of the testing are presented below. 6.1 Roller Materials Lithographic printing rollers are made from specially formulated rubber compounds designed to withstand the unique conditions of lithographic printing. While the formulations for roller compounds differ across roller manufacturers, much like the print blankets, most are based on EPDM or nitrile. In addition, rollers are manufactured and sold across a range of hardness of the rubber compound. The type of roller compound used depends on a number of factors including the particular print application, the ink type, and the type of printing process. A variety of rollers were submitted for testing by leading manufacturers including Bottcher, Lithoroll, and Rotadyne. Rollers of varying hardnesses and for specific applications such as heat-set web, newsprint, and sheet-fed applications were all submitted for testing. In total, over 15 different roller compounds were submitted for testing. Rubber types submitted for testing included the following rubbers used in lithographic printing applications:
• Nitrile –25 • Nitrile –30 • Nitrile –35 • EPDM -25 • EPDM –35 • Hybrid – 25 (2 types)
6.2 Roller Test Protocol This test method measures the comparative ability of lithographic rollers and other rubber on-press parts to withstand exposure to solvents used to remove printing ink and other debris during press operation. The described test method presents a procedure for exposing rubber compounds used in lithographic printing rollers to solvent-laden press washes used to remove ink and other debris, under controlled test conditions. Methods for the measurements of volume and hardness,
Figure 7. Roller compounds submitted for testing

UT Center for Clean Products April 12, 2006 15
both before and after exposure of the samples, are described. The complete testing protocol is presented in Appendix D. To test for compatibility, samples of the rubber used to manufacture rollers for lithographic applications are prepared and initial sample data recorded. Samples are then submerged in test solvent under controlled conditions. After 24 hours, samples are removed, sample volume and density recorded, and placed out to dry under moderate air flow conditions for at least 72 hours. Once dry, changes in the hardness or volume of the sample was measured and recorded. Samples obtained from rubber manufacturers were required to be a minimum thickness of 0.25 inches to allow for proper hardness testing, but no thicker than 0.35 inches. Qualifying samples were prepared by cutting them into uniform strips of 1x2 inches and then marked with a sample number for identification purposes during testing. Duplicate samples were prepared for testing to demonstrate repeatability of testing results. Prior to exposure to the test solvent, key measurements of each sample were taken and recorded. The hardness of each sample was measured using a handheld Type A durometer. The hardness was measured by placing the sample flat on the surface and slowly but firmly pressing the durometer onto the sample surface as shown in Figure 8. The hardness value was assessed multiple times over the surface of the sample and the average recorded.
The mass of the sample was recorded both in air as well as with the sample submerged in water, using a specially equipped scale as shown in Figure 9. Measurements in both air and water were needed to calculate any future change in volume of the sample (see Equations 4 and 6). All data was recorded on the data record shown in Appendix E. Solvent samples were obtained as directed by the manufacturers or as indicated by GATF or IRTA. Solvents were diluted or combined as necessary to achieve the proper mixture. All solvents were mixed prior to usage.
Figure 8. Hardness measurement using durometer

UT Center for Clean Products April 12, 2006 16
Glass jars fitted with airtight caps were used to expose the rubber samples to the test solvents, with one sample per jar. Jars were large enough to allow complete submersion of the rubber sample when standing on end. Jars and lids were numbered for identification purposes. Samples were placed individually into each jar, and the jar number and sample recorded. The appropriate test solvent was then added to each jar to a volume that completely submerged the sample. Samples were placed standing on edge, or oriented in some other fashion as to minimize the contact area of the sample with the glass, allowing an even distribution of solvent around the surface of the sample, as shown in Figure 10. The lid was affixed to each jar to prevent the solvent from volatilizing. Samples remained submerged for a test period of 24 hours.
After the test period had concluded, samples were removed from the jars, excess solvent wiped from the surface, and then evaluated. The mass of the sample in both air and water and the hardness of the rubber sample were again measured and recorded. Samples were then loosely covered to prevent contamination, and placed under a fume hood to dry for a minimum of 72 hours. Moderate air flow was provided to facilitate the drying process. After 72 hours, samples
Figure 9. Determination of sample mass in water
Figure 10. Rubber samples submerged in solvent

UT Center for Clean Products April 12, 2006 17
were again evaluated and the data recorded. Samples that were still not fully dry were allowed to dry for a full 5 days, before the hardness and sample mass data were measured and recorded. Results of the testing were calculated using the following equations. Changes in the shore hardness and volume of the rubber sample after being removed from the solvent were calculated using the following equations: Change in Shore Hardness, ∆Hw = H1 – H0 (Equation 3) where: ∆Hw = change in shore hardness after immersion H0 = initial hardness of rubber sample H1 = hardness of rubber sample after immersion Change in Volume, ∆VW (%) = (Ma1 – Mw1) – (Ma0 – Mw0) x 100 (Equation 4) (Ma0 – Mw0) where: ∆Vw = change in rubber sample volume after immersion Ma0 = initial mass of rubber sample in air Mw0 = initial mass of rubber sample in water Ma1 = mass of rubber sample in air after immersion in solvent Mw1 = mass of rubber sample in water after immersion in solvent
Changes in the shore hardness and volume of the rubber sample after allowing the sample to dry were calculated using the following equations:
Change in Shore Hardness, ∆Hd = H2 – H0 (Equation 5) where: ∆H = change in shore hardness after drying in air H0 = initial hardness of rubber sample H2 = hardness of rubber sample after drying in air
Change in Volume, ∆VD (%) = (Ma2 – Mw2) – (Ma0 – Mw0) x 100 (Equation 6)
(Ma0 – Mw0) where: ∆VD = change in rubber sample volume after drying in ambient air Ma0 = initial mass of rubber sample in air Mw0 = initial mass of rubber sample in water Ma2 = mass of rubber sample in air after drying in ambient air Mw2 = mass of rubber sample in water after drying in ambient air

UT Center for Clean Products April 12, 2006 18
Criteria for acceptable performance results for both shore hardness and swelling of the rubber are presented in Table 4.
Table 4. Criteria for Acceptable Solvent/Rubber Compatibility Measurement Acceptable
Shore Hardness, ∆ Hw or ∆Hd
< 3 points
Change in Volume, ∆Vw or ∆Vd
< 10%
Results of the testing were compared to these criteria to determine the future viability of the solvent being tested. The above criteria were established in consultation with lithographic roller manufacturers and printers as a reasonable indicator of expected performance under actual operating conditions. Test results that meet the criteria will be considered compatible, and the solvent will be considered a viable alternative for cleaning the rubber tested. The greater the results deviate from the criteria presented in Table 1, the higher likelihood of potential problems occurring under operating print conditions. Results not meeting the above criteria do not necessarily indicate an incompatibility, but rather the need for in-depth performance evaluation under actual print conditions. Perhaps more important than the criteria, compatibility test results for alternative low VOC solvents were compared directly to the test results of the baseline solvents under the same testing conditions. Given the lack of compatibility issues associated with the baseline solvents, it is reasonable to assume that test results equal to or better than the baseline solvents would be an indicator of excellent compatibility. Test results and conclusions are presented in Sections 6 and 7 of this report. More detailed information regarding the roller testing protocol is presented in the appendices to this report. The complete testing protocol is provided in Appendix D, while the data collection form used for this testing is presented in Appendix E. 6.3 Results of Roller/Solvent Compatibility Testing Solvent and roller combinations were prioritized based on the current understanding of the project team, consisting of AQMD, GATF, UT, and IRTA. Initial testing was conducted on a wide range of solvent/roller compound combinations. However, to conserve project resources, when initial testing indicated that a solvent was not a likely replacement, further testing on the solvent was abandoned in favor of testing solvents with more promise. Results of the testing were reported back to the project team and used to inform the in-facility testing of IRTA as appropriate. Initial testing focused on benchmarking existing solvent/roller combinations, both to validate the test and to provide a baseline against which to compare alternative solvents developed over the

UT Center for Clean Products April 12, 2006 19
course of the project. Baseline solvent/roller combinations that were tested are displayed in Table 5. After testing the baseline solvents, roller/solvent combinations for testing of alternative solvents were selected based on their interest to the study, their potential for meeting the performance goals of the solvent at a low VOC level, and on their potential to add to the body of knowledge required to formulate better alternatives. As such, alternative solvents were tested initially on selected roller compounds and then either confirmed through repeated testing, or scrapped based on the initial test results combined with field testing conducted simultaneously by another IRTA. Table 6 indicates the roller/solvent combinations for which compatibility tests were conducted for alternative solvents. Complete testing data from individual tests, including measured and recorded data as well as all calculated values are presented in Appendix D.
Table 5. Roller Test Matrix- Baseline Solvents Nitrile EPDM Baseline Solvents
A B C D E F G H E1 E2 E3 Mirachem Pressroom Cleaner (100%) 2 2 2
Varn A-230 2 2
Varn V-120 2 2 2 2 2 2 2
PES C-34 2 2
Autowash 6000 2 2
Anchor T-100 2 2
Anchor A-240 2 2
Amberclean 455 2 2
The numbers in each table cell of tables 5 and 6 indicate the number of individual tests that were conducted for each solvent/roller combination. Combinations for which all testing passed the established criteria were displayed as a passing result (non-shaded), while combinations where all tests conducted failed at least one criteria were displayed as a failed result (shaded). Mixed results for roller/solvent combinations with at least one passing and one failed test result are displayed as a ratio of passed to failed tests. Finally, test results that are considered borderline passing- defined as shrinkage or swelling within one thousandths of an inch of the criteria- are bolded in the table. These failed test results are likely within the margin of error (within 0.001 inches) in the testing so further testing should be conducted before the combination is not considered to be viable. Solvents identified by GATF as baseline solvents were tested extensively to calibrate the test method and the appropriateness of the criteria selected. A total of 22 combinations of roller compounds and solvents were tested through the completion of 44 compatibility tests. Of the baseline solvents tested, only Varn A-230 and Mirachem Pressroom Cleaner consistently passed testing or all of the rubber compounds tested. All of the other baseline solvents failed tests for at least one and typically all of the rubber compounds tested. In fact, these baseline solvents failed at least one of the test criteria a full 30 of the 34 tests conducted. The criteria listed in Table 4, were established by printers and roller manufacturers prior to the commencement of testing. An analysis of the individual test data presented in Appendix F finds

UT Center for Clean Products April 12, 2006 20
that 28 of the failed tests were as a result of excessive softening of the rubber compound immediately after exposure to the solvent. This result is surprising given the fact that these solvents were selected as baseline solvents because each of them are currently in widespread use throughout the industry without discernable compatibility issues.
Table 6. Roller Test Matrix- Alternative Low VOC Solvents Nitrile EPDM Low VOC Solvents
A B C D E F G H E1 E2 E4
Soy Gold 2000 (100%) 2 2 2 2 2 Acetone (92%)/ DPM (8%) 1/1
Acetone (25%)/ Soygold 2000 (75%) 2 2 2 Acetone (50%)/ Soygold 2000 (50%) 2 2 2 2 Acetone (75%)/ Soygold 2000 (25%) 2 2
Acetone (92%)/ Soygold 2000 (8%) 2 Acetone (50%)/ Brulin (50%) 2 Acetone (25%)/ Water (12.5%)/ Hydroclean (62.5%) 2 2 Siebert Magic UV Wash 1 2 1
Siebert 219 ES Emulsion 2 2 Siebert Autowash #3 2 2 Siebert Magic Wash 522C 2 2
2- Number in cell indicates the number of tests conducted Passing result - B- indicates solvent/rubber combination is an established industry baseline Borderline fail - 1/1- indicates a split result- 1 passing test and 1 failing test Failing result -
After the first round of testing indicated that the baseline solvents had failed one or more of the criteria, results were shared with industry and comments sought on the validity of the test method and/or criteria used. After some consideration, it was the consensus of the group that the results are likely due to the lack of thickness of the sample (0.25-0.35 inches), and the limited duration of the drying cycle. It was agreed by the group that additional testing should proceed as planned using the same sample thickness, but that results of the alternatives should be directly compared to the performance of the baseline solvents as an additional predictor of compatibility. Average criteria values for the baselines solvent have been calculated and presented in Table 7. Analysis of the initial results produced expected outcomes in terms of known incompatibilities, and thus the testing was deemed valid and valuable to the advisory group. As such, testing was continued for the alternative solvents in a manner consistent with the protocol. Alternative solvents included a variety of mixtures submitted for testing by IRTA as well as commercially available solvents not identified as an industry baseline. A total of 27 roller/solvent combinations were tested, covering 12 different solvent alternatives. Some alternatives were initially tested and then no longer considered based on the poor results. Others were identified for additional testing based on initial testing, in-field performance, or overall interest. Results for individual solvents are displayed in Table 6 above.
UT Center for Clean Products April 12, 2006 21
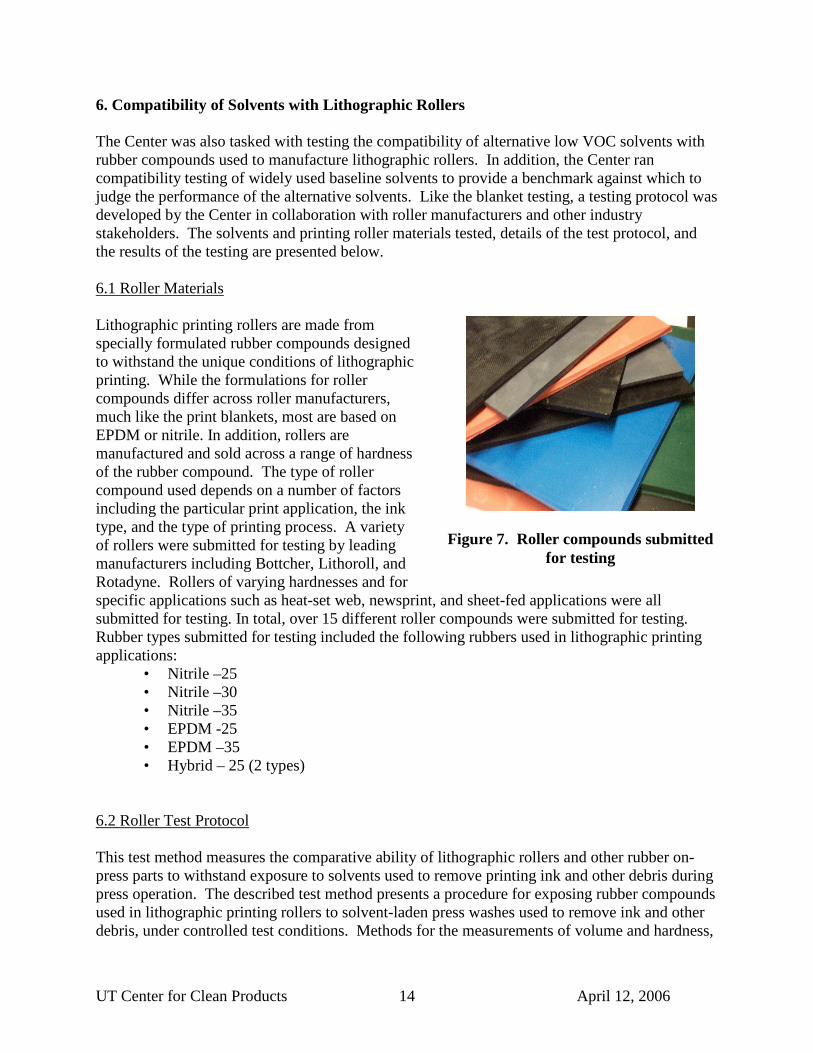
Several conclusions were reached a result of the testing. For nitrile-based rollers, soy-based solvents were found to be viable, with results borderline or passing in most categories for high soy content solvents such as Autowash 3, Magic Wash 522, and the Soy (75%)/Acetone (25%) mixture. The lone exception was the Soy Gold 2000 solvent, which for a reason not readily apparent, resulted in excessive softening of the rubber. Conversely, the presence of high concentrations of acetone was confirmed to provoke a excessive softening of the rubber as a result of a high degree of swelling in the rubber directly after exposure to the solvent. However, solvent mixtures with concentrations of acetone below 30 percent tested very well, regardless of what it was mixed with. Several of the solvents performed very well, including Autowash 3, Magic Wash 522, and the Soy (75%)/Acetone (25%). In addition, the acetone/water/hydroclean solvent performed well in comparison to the values presented in Table 7 for the baseline solvents.
Table 7. Average Test Criteria for Baseline Solvent/Nitrile Rubber Combinations
Baseline Solvents Hw Vw Hd Vd A-230 -2.375 5.102584 1.25 -1.12891 A-240 -7.875 46.38742 0.75 -0.94727 Amberclean 455 -10.625 20.09951 -7.875 14.81178 T-100 -4.375 9.211253 1.125 1.95172 Auto 6000 -4.25 11.60555 0.375 0.593173 PES C34 -5.5 9.500873 0.5 3.944168 Pressroom Cleaner -1.91667 5.273957 2 0.926761 V-120 -9.91667 21.4162 1.541667 -2.67249
There were no solvents specifically identified as baseline solvents for use with EPDM-based rollers. There were several alternative solvents tested in combination with EPDM rollers with several showing potential, including Siebert Magic UV wash as well as alternatives with low concentrations of soy. Solvents containing a high concentration of acetone also proved to acceptable regardless of the other solvent constituents. As with blankets, solvents with even small amounts of soy provoked substantial swelling, and their use with EPDM should be avoided. A similar comparison to that produced in table 7 was not possible for EPDM as no baseline solvents were identified and tested for comparison. Combinations were also selected for testing to isolate differences between rollers manufactured by different companies to a particular solvent (e.g. type A and type B nitrile). Virtually every solvent was tested against 2 or more rubber compounds within a particular category. Results across solvent and rubber types were remarkably consistent indicating that differences in the manufacturing of a particular rubber type did not directly impact compatibility within the confines of this testing protocol. In no instance did a solvent test pass for one blanket and yet fail for a second blanket compound.

UT Center for Clean Products April 12, 2006 22
APPENDIX A:
Test Protocol for the Measurement of the Effects of Low VOC Cleaning Solvents on Lithographic Printing Blankets

UT Center for Clean Products April 12, 2006 23
Test Protocol for the Measurement of the Effects of Low VOC
Cleaning Solvents on
Lithographic Printing Blankets
January 15, 2004
Developed for South Coast Air Quality Management District under contract # 03135 by the University of Tennessee Center
for Clean Products and Clean technologies.
UT Center for Clean Products April 12, 2006 24
Test Method for the Measurement of the Effects of Cleaning Solvents on Printing Blankets
1. Purpose
This test method measures the comparative ability of lithographic printing blankets to withstand exposure to solvents used to remove printing ink and other debris during press operation. The method has been developed for use in the testing of traditional and alternative low VOC cleaning solvents being evaluated by the South Coast Air Quality Management District in support of Rule 1171. This test is part of a larger technology evaluation being conducted by SCAQMD to evaluate the potential of new low VOC cleaning solvents to meet the lower VOC limits for lithographic printing set forth under the rule. 2. Description of Test
The described test method provides a procedure for exposing rubber blankets used in lithographic printing to solvent-laden press washes, under controlled test conditions. Washes to be evaluated include those currently used throughout the industry as well as proposed low VOC cleaning alternatives under evaluation. A method for the measurement of blanket swell resulting from exposure of blanket samples under ambient conditions is described. 3. Apparatus and Test Equipment
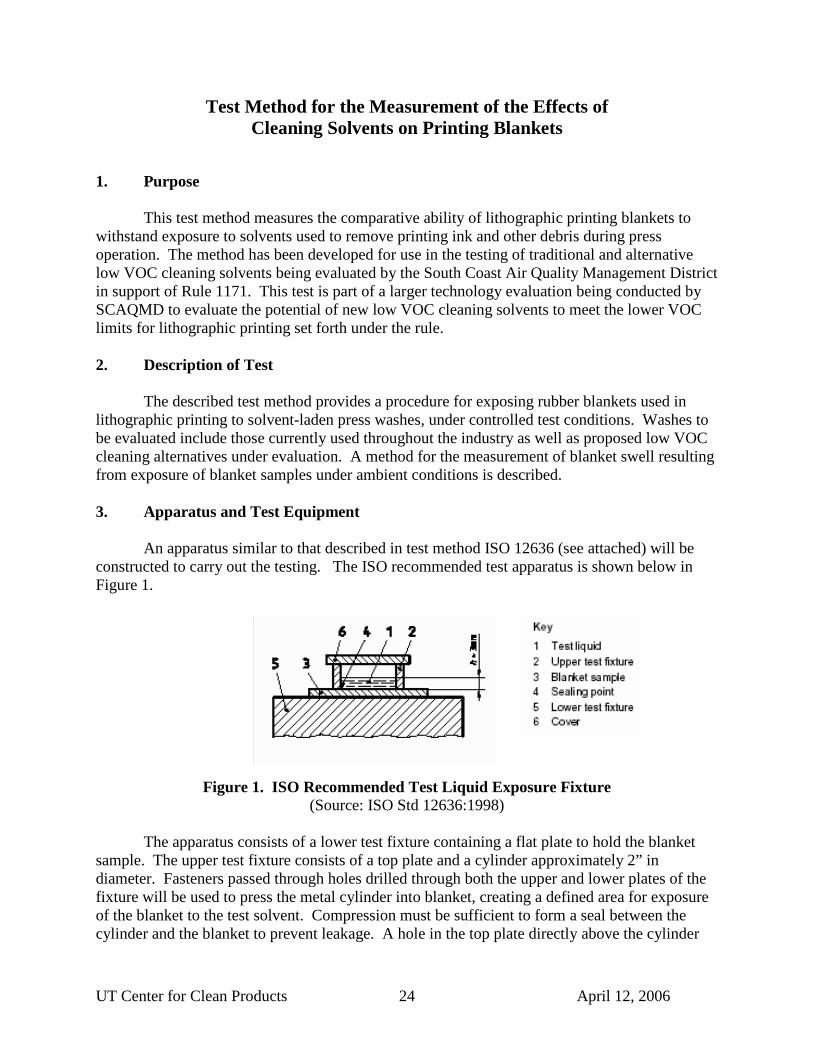
An apparatus similar to that described in test method ISO 12636 (see attached) will be constructed to carry out the testing. The ISO recommended test apparatus is shown below in Figure 1.
Figure 1. ISO Recommended Test Liquid Exposure Fixture (Source: ISO Std 12636:1998)
The apparatus consists of a lower test fixture containing a flat plate to hold the blanket
sample. The upper test fixture consists of a top plate and a cylinder approximately 2” in diameter. Fasteners passed through holes drilled through both the upper and lower plates of the fixture will be used to press the metal cylinder into blanket, creating a defined area for exposure of the blanket to the test solvent. Compression must be sufficient to form a seal between the cylinder and the blanket to prevent leakage. A hole in the top plate directly above the cylinder

UT Center for Clean Products April 12, 2006 25
provides an opening through which the test solvent can be introduced to the blanket sample, and then subsequently removed at the end of the test period. A watch glass will cover the opening to prohibit the loss of solvent through the opening during the test period. Multiple fixtures on the test rig will allow for simultaneous testing of several samples at once.
Blanket thickness will be measured both before and after exposure to the solvent using a Cady Gauge Model DWL, shown in Figure 2. A minimum of four measurements, each from different areas of the blanket test sample, will be taken and the values averaged to determine the initial thickness of the sample.
Figure 2. Cady Gauge Model DWL 4. Sample Preparation Printing Blanket
Blanket materials will be obtained directly from blanket manufacturers or vendors. Testing will be conducted using samples of printing blankets based on the following compounds, as appropriate for each solvent:
• EPDM -35 • Nitrile –35 • Hybrid compound
Square samples at least ¾ inch larger than the cylinder of the text fixture (approximately 3 inches square) will be cut from the blankets for testing. Blanket materials obtained from at least two blanket manufacturers will be included in the testing to account for potential differences in the rubber compounded by manufacturers within each of the blanket categories described above.
Solvent /Wash Press wash samples to be evaluated will be obtained from GATF and IRTA, project partners who are tasked with identifying baseline and alternative solvents through performance testing. Solvents will include baseline solvents currently being used by industry as well as potential low VOC alternative solvents for evaluation. If required, concentrated samples will be

UT Center for Clean Products April 12, 2006 26
diluted, as directed by GATF or IRTA, prior to testing to conform to conditions experienced during performance testing. All samples will be mixed thoroughly prior to testing. 5.0 Test Methodology The following procedures will be performed for each solvent sample to be evaluated for compatibility. Duplicate tests will be conducted for each material/solvent combination to confirm the results of initial testing. Swelling or Shrinkage of Blankets at Room Temperature Prior to the beginning of testing, record the following information on the Blanket/Solvent Compatibility Test Worksheet (Attachment 1):
• solvent type/description • solvent source • blanket sample type • printing application, as it pertains to blanket type (e.g., heatset web) • source of blanket sample • blanket sample ID
Clean and calibrate the test equipment as required. Using standard laboratory methods,
alternatively rinse the test apparatus with de-ionized water and solvent. Calibrate the Cady Gauge as specified by the manufacturer. Measure the initial thickness (Ti) of each blanket sample to be tested taking four measurements of the sample thickness, one in each quarter of the sample. Thickness of the blanket sample shall be measured to the nearest ten thousandth of an inch using a Model DWL Cady Gauge, and the results recorded. Calculate the average initial blanket sample thickness from the four individual measurements. In the case of testing multiple blanket samples simultaneously, data shall be recorded and the average determined for each individual sample.
Place the blanket sample on the lower fixture. Clamp the upper fixture to the lower fixture after orienting the cylinder on the center of the blanket sample so that at least a ¾ inch of blanket protrudes from all sides of the cylinder. Add solvent through the hole in the top the cylinder until solvent is at least 3 mm deep above the blanket. Cover the top hole of the cylinder with a watch glass to prevent evaporation of the solvent and to keep debris out of the test cell. Record the time the solvent was added to the test cell. Testing shall be conducted at a temperature of (23 ± 2) degrees Celsius for five hours. At the conclusion of the test period, use a pipette to remove the solvent from each of the test cells in the fixture. Remove the sample from the test fixture and record the time. Wipe any excess solvent from the blanket sample and note the physical appearance of the surface of the sample. Measure and record the thickness of the sample (Tw) directly after exposure using a technique similar to that used during the initial measurements. Determine the average thickness of the sample after solvent exposure by averaging the four individual thickness readings.
Place blanket in a dish and cover loosely to protect the sample from airborne contaminants. Allow blanket sample to dry in ambient air for a period of 72 hours. Remove the sample from the container and record the time. Measure and record the thickness of blanket sample in air after drying (Td ) in manner consistent with previous measurements.
UT Center for Clean Products April 12, 2006 27
Calculate results of the testing as described in Section 6. 6. Calculation of Solvent Effects and Criteria for Acceptance
Calculate the change in thickness of the blanket sample after exposure to the test solvent
(5 hours) using Equation 1 below. Change in Blanket Thickness, ∆Tw = Tw – Ti (Equation 1) where: ∆Tw = change in blanket thickness directly after exposure to solvent Ti = initial thickness of blanket sample Tw = thickness of blanket sample after exposure to solvent
Calculate the change in thickness of the blanket sample after allowing the sample to dry in ambient air (72 hours) using the following equations:
Change in Blanket Thickness, ∆Td = Td – Ti (Equation 2) where: ∆Td = change in blanket thickness after allowing to dry Ti = initial thickness of blanket sample Td = thickness of blanket sample after drying
Criteria for acceptable performance in terms of swelling and shrinkage of the blanket
under room temperature testing (Section 5) are presented in Table 1.
Table 1. Criteria for Acceptable Solvent/Blanket Compatibility
Measurement Acceptable Change in Thickness, ∆Tw (in thousandths of an inch)
and ∆Td
Tw < 0.005 swell and
Td < 0.001 shrinkage Results of the testing will be compared with these criteria to determine the future
viability of the solvent being tested, and then shared in a timely manner with AQMD and any appropriate contractors. Performance criteria for evaluated solvents were developed in consultation with lithographic blanket manufacturers and printers. Test results that meet the criteria will be considered compatible, and the solvent will be considered a potential alternative for cleaning the printing blanket tested contingent upon performance evaluations on the press. Results that do not meet the above criteria indicate an incompatibility. . Swell in excess of five thousandths of an inch result in increased print pressures, while shrinkage in excess of one thousandths of an inch results in loss of print pressure. The farther results are from the criteria presented in Table 1, the higher likelihood of potential problems occurring under operating print conditions. Compatibility criteria will be validated through the testing of identified baseline

UT Center for Clean Products April 12, 2006 28
blanket washes already used widely within industry, and may be modified according to the baseline results if appropriate 7.0 Referenced Documents International Standard ISO 12636 –Graphic Technology-Blanket for Offset Printing

UT Center for Clean Products April 12, 2006 29
APPENDIX B:
Blanket Test Data Record Form

UT Center for Clean Products April 12, 2006 30
Blanket/Solvent Compatibility Test Worksheet
Date: Testing Specifications
Room Temp Std Solvent Temp 23 C Immersion Time 5 Hours Air Drying Time 72 hours
Data Sample A Sample B Sample C Sample D
Blanket Type: Source of Sample: Sample ID: Solvent Type:
Immersion Start Immersion End Drying End
Cady Gauge-Zero? Solvent Mixed? Thickness-- Ti 1 Ti 2 Ti 3 Ti 4 Thickness Ti avg
Thickness-- Tw1
Tw2
Tw3
Tw4
Thickness Tw avg
Thickness-- Td1
Td2
Td3
Td4
Thickness Td avg
Results Summary Sample A Sample B Sample C Sample D
Blanket Type: Solvent Type:
Blanket Swell ∆∆∆∆Tw Blanket Shrinkage
∆∆∆∆Td
Fixture Number:

UT Center for Clean Products April 12, 2006 31
APPENDIX C:
Blanket Test Apparatus Design Diagram

UT Center for Clean Products April 12, 2006 32

UT Center for Clean Products April 12, 2006 33
APPENDIX D:
Blanket/Solvent Test Data- Compatibility Testing

UT Center for Clean Products April 12, 2006 34
Table D1. Baseline Solvent/Blanket Test Results Sample ID Blanket Solvent Swell Shrink
1C-4 A A-230 0.0012 0.0008 1D-4 A A-230 0.0012 0.001 1A-4 D A-230 0.0007 0.0007 1B-4 D A-230 0.0006 0.0008 3B-5 A A-240 0.0051 0 3D-5 A A-240 0.0052 0.0002 3A-5 D A-240 0.0047 0.0002 3C-4 D A-240 0.0054 0.001 2F-2 C A-240 0.0056 0.0015 4F-1 C A-240 0.0061 0.001 3F-1 A AmberClean 455 0.0036 -0.0003 3D-4 A AmberClean 455 0.0041 -0.0021 2F-1 B AmberClean 455 0.0048 -0.0024 2D-4 B AmberClean 455 0.0042 -0.0024 2F-3 A Anchor T-100 0.0022 0.0006 1A-5 A Anchor T-100 0.001 0.0004 2F-5 B Anchor T-100 0.002 0.0002 2C-4 B Anchor T-100 0.0016 0.0001 1B-5 A Auto 6000 0.0021 0.0003 1B-5 A Auto 6000 0.0027 0.0003 3A-4 C Auto 6000 0.0023 0.0008 3B-4 C Auto 6000 0.0023 0.0009 3D-2 A Mirachem Press (2:1) 0.0002 0.0003 2D-5 A Mirachem Press (2:1) 0.0003 0.0003 4A-1 B Mirachem Press (2:1) 0.0003 0.0003 4B-1 B Mirachem Press (2:1) 0.0007 0.0005 2G-3 A PES-C34 0.0027 -0.0003 3C-5 A PES-C34 0.002 -0.0004 3g-4 B PES-C34 0.0031 0.0001 2B-4 B PES-C34 0.0022 -0.0001 2C-3 A V-120 0.0053 0.0006 2D-3 A V-120 0.0055 0.0008 4C-1 B V-120 0.0063 0.0009 2A-4 B V-120 0.0059 0.0011 2A-3 C V-120 0.0058 0.0008 2B-3 C V-120 0.0056 0.001

UT Center for Clean Products April 12, 2006 35
Table D2. Solvent/Blanket Test Results-nitrile
Sample ID Blanket Solvent Swell Shrink
2C-5 B 25/12.5/62.5 Ace Water Hydro 0.0011 0.0002
5A-4 B 25/12.5/62.5 Ace Water Hydro 0.0014 0.0003
4C-3 B 50/50 Acetone Brulin 0.0041 0.0000 2A-5 B 50/50 Acetone Brulin 0.0042 -0.0001 4C-2 C 50/50 Acetone Brulin 0.0028 -0.0001 4B-2 C 50/50 Acetone Brulin 0.0033 0.0001 4D-3 A 25/75 Acetone Soy 0.0016 0.0004 5A-3 A 25/75 Acetone Soy 0.0014 0.0003 4C-4 B 25/75 Acetone Soy 0.0012 0.0006 4D-2 B 25/75 Acetone Soy 0.0018 0.0005 1A-1 A 50/50 Soy acetone 0.0121 -0.0023 2B-1 A 50/50 Soy acetone 0.01 -0.0022 5B-1 D 50/50 Soy acetone 0.0119 -0.0021 1C-5 D 50/50 Soy acetone 0.0125 -0.0023 3F-1 A 75/25 Acetone Soy 0.0167 -0.0012 3A-1 A 75/25 Acetone Soy 0.0164 -0.0014
1F-3 B 75/12.5/12.5 Ace Water Hydro 0.0156 0.0004
2B-5 B 75/12.5/12.5 Ace Water Hydro 0.0177 0.0001
1B-1 A 90/10 Acetone Naptha 0.0162 0.0013 2C-1 A 90/10 Acetone Naptha 0.0189 0.0014 1D-1 A 92/8 Acetone DPM 0.0171 0.0012 2D-1 A 92/8 Acetone DPM 0.0172 0.0009 1F-5 A 92/8 Acetone Soy 0.0164 0.0024 3D-1 A 92/8 Acetone Soy 0.0182 0 4B-3 D Soy Gold 2000 0.0011 -0.001 1D-5 D Soy Gold 2000 0.0014 -0.0013 1G-2 A Magic Wash 522 0.0035 0.0007 1G-1 A Magic Wash 522 0.0036 0.0002 2G-1 C Magic Wash 522 0.0038 0.0006 2G-4 C Magic Wash 522 0.0037 0.0006 3F-4 A Autowash 3 0.0056 0.0007 3F-5 A Autowash 3 0.0052 0.0006 1F-3 D 219 ES Emulsion 0.0053 0.0014 2F-1 D 219 ES Emulsion 0.0051 0.0013

UT Center for Clean Products April 12, 2006 36
Table D3. Solvent/Blanket Test Results- EPDM Sample ID Blanket Solvent Swell Shrink
1C-1 E 90/10 Acetone Naptha 0.0057 0.0017 3B-1 E 90/10 Acetone Naptha 0.0057 0.0017 4B-4 F 90/10 Acetone Naptha 0.0057 0.0016 5B-2 F 90/10 Acetone Naptha 0.0055 0.0013 4D-4 F 92/8 Acetone DPM 0.0005 0.0006 5B-3 F 92/8 Acetone DPM 0.0004 0.0008 2A-1 E 92/8 Acetone DPM 0.0007 0.0014 3C-1 E 92/8 Acetone DPM 0.001 0.0014 5A-1 E 92/8 Acetone Soy 0.0083 -0.0004 4A-2 E 92/8 Acetone Soy 0.0071 -0.0005 5B-4 F 92/8 Acetone Soy 0.0097 -0.0006 4A-4 F 92/8 Acetone Soy 0.0088 -0.0011 5C-1 E Magic UV Wash 0.0011 0.0011 5A-2 E Magic UV Wash 0.0007 0.0009 4A-3 F Magic UV Wash 0.0013 0.0008 4D-1 F Magic UV Wash 0.0012 0.0006

UT Center for Clean Products April 12, 2006 37
APPENDIX E:
Test Protocol for the Measurement of the Effects of Low VOC Cleaning Solvents on Lithographic Printing Rollers
UT Center for Clean Products April 12, 2006 38
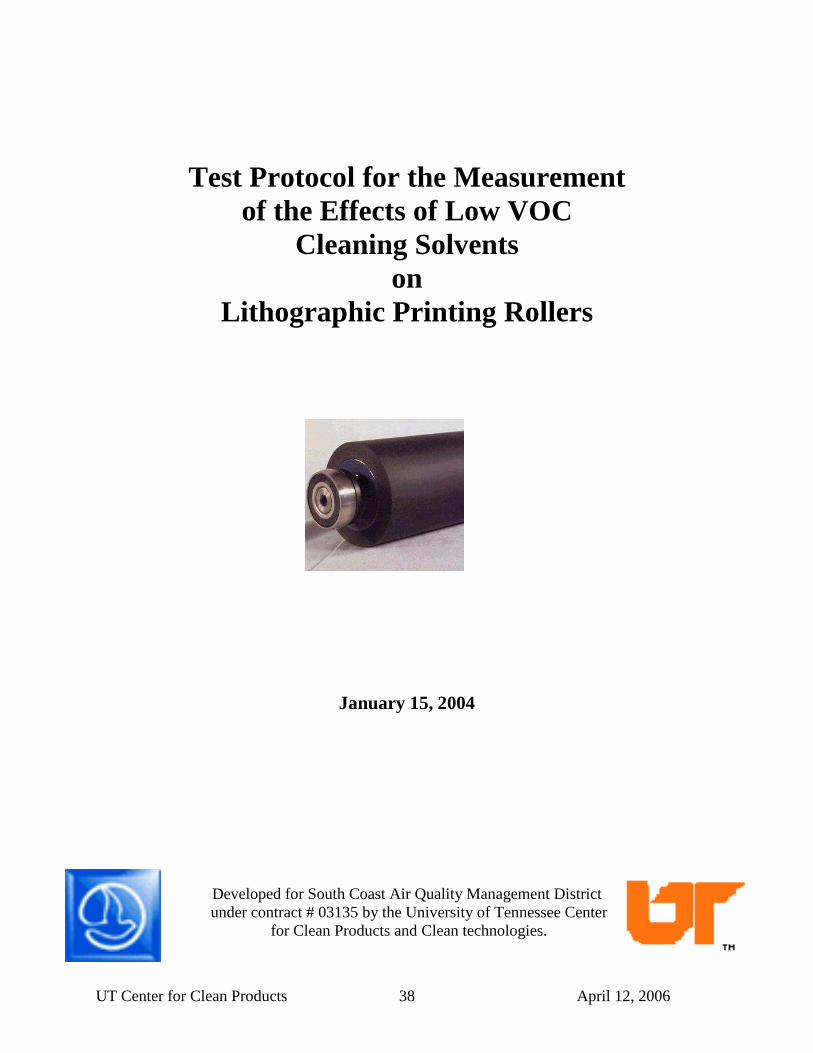
Test Protocol for the Measurement of the Effects of Low VOC
Cleaning Solvents on
Lithographic Printing Rollers
January 15, 2004
Developed for South Coast Air Quality Management District under contract # 03135 by the University of Tennessee Center
for Clean Products and Clean technologies.
UT Center for Clean Products April 12, 2006 39
Test Method for the Measurement of the Effects of Cleaning Solvents on Lithographic Press Rollers
1. Purpose
This test method measures the comparative ability of lithographic rollers and other rubber on-press parts to withstand exposure to solvents used to remove printing ink and other debris during press operation. The method has been developed for use in the testing of traditional and alternative low VOC cleaning solvents being evaluated by the South Coast Air Quality Management District in support of Rule 1171. This test is part of a larger technology evaluation being conducted by SCAQMD to evaluate the potential of new low VOC cleaning solvents to meet the lower VOC limits for lithographic printing set forth under the rule. 2. Description of Test
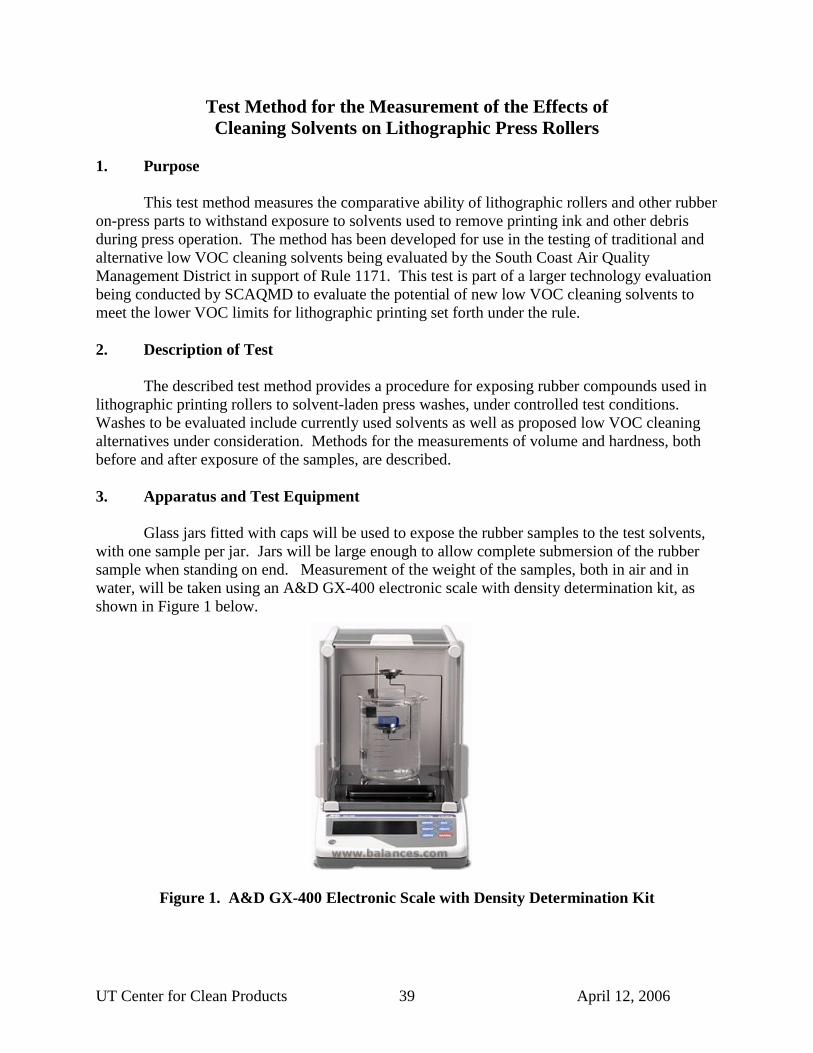
The described test method provides a procedure for exposing rubber compounds used in lithographic printing rollers to solvent-laden press washes, under controlled test conditions. Washes to be evaluated include currently used solvents as well as proposed low VOC cleaning alternatives under consideration. Methods for the measurements of volume and hardness, both before and after exposure of the samples, are described. 3. Apparatus and Test Equipment Glass jars fitted with caps will be used to expose the rubber samples to the test solvents, with one sample per jar. Jars will be large enough to allow complete submersion of the rubber sample when standing on end. Measurement of the weight of the samples, both in air and in water, will be taken using an A&D GX-400 electronic scale with density determination kit, as shown in Figure 1 below.
Figure 1. A&D GX-400 Electronic Scale with Density Determination Kit

UT Center for Clean Products April 12, 2006 40
The scale will be equipped with glass doors to prevent measurement deviations due to air. Shore hardness will be measured using an ASTM D2240 compliant type A durometer, similar to the one shown in Figure 2 below.
Figure 2. Type A Durometer
4. Sample Preparation Rubber Compound Test samples will be obtained directly from rubber compounders in sheets or in predetermined sections. Testing will be conducted using samples of the various rubber compounds, as appropriate for each solvent. Rubber types to be tested include, but are not limited to, the following rubbers used in lithographic printing applications:
• Nitrile –25 • Nitrile –30 • Nitrile –35 • EPDM -25 • EPDM –35 • Hybrid – 25 (2 types)
Testing will be conducted on specific rubber solvent combinations as dictated by the
combinations used in a particular print operation. Rubber samples will be obtained from a variety of roller manufacturers to account for differences in rubber formulations within a specific category of rubber. Samples will be cut into uniform strips of 1x2 inches, with a minimum thickness of 0.25 inches to allow for proper hardness testing. Compound samples will be marked for identification purposes during the testing.
Solvent /Wash Press wash samples to be evaluated will be obtained from Graphical Arts technical Foundation (GATF) and the Institute for Research and Technical Assistance (IRTA). If

UT Center for Clean Products April 12, 2006 41
required, concentrated samples will be diluted, as directed by GATF, IRTA, or as directed by manufacturer prior to testing to conform to conditions experienced during performance testing. 5.0 Test Methodology The following procedure will be followed for each solvent sample to be evaluated. For solvents to be tested against a variety of roller compounds, tests may be conducted simultaneously as long as sufficient space exists for uninhibited exposure of the sample to the solvent (max of four samples per test). Duplicate testing of each material/solvent combination will be performed to confirm repeatability. Duplicate testing will occur over separate rounds to minimize the effects of any one variable during the testing. Prior to the beginning of testing, record the following information on the Blanket/Solvent Compatibility Test Worksheet (Attachment 1):
• solvent name • solvent source • rubber sample type • source of rubber sample • rubber sample ID • room temperature
Additionally, measure and record the following information for each rubber sample to be tested:
• shore hardness of sample (H0) • mass of sample in air (Ma0) • mass of sample in water (Mw0) • water temperature
Shore hardness shall be measured using a Teclock Type A- ASTM 2240-03 compliant durometer, in a method consistent with ASTM 2240 (see attached). The rubber sample shall be stacked onto another like sample to achieve and adequate rubber thickness for hardness testing. Mass of the rubber sample shall be measured in both air and water using an A&D GX-400 electronic analytical scale prior to testing, and the results recorded. Measurements in both air and water are needed to determine the change in volume of the sample (see Equations 2 and 4). In the case of testing multiple rubber compounds simultaneously, data shall be recorded for each sample.
Clean and calibrate the test equipment as required. Using standard laboratory methods, alternatively rinse the test beaker with de-ionized water and solvent. Calibrate the scale and durometer as specified by the manufacturer. Fill the beaker with a volume of solvent sufficiently adequate to cover the rubber test samples. Submerge the rubber sample in the solvent. Place the samples standing on edge, or oriented in some other fashion as to minimize the contact area of the sample with the glass. If necessary, use a stainless steel screen to avoid excessive contact of the sample with the container surface. No more than one sample shall be submerged in the jar of solvent at a time. Fill jar to full with solvent to minimize the potential for volatilization of the solvents. Fit jar with an airtight lid to limit the loss of solvent through volatilization. Record the time of sample entry on

UT Center for Clean Products April 12, 2006 42
the worksheet. Testing shall be conducted at a fluid temperature of (23 ± 2) degrees Celsius for 24 hours. At the conclusion of the test period, remove the sample from the beaker and record the time. Wipe any excess solvent from the sample. Measure and record the following data in a manner consistent with initial measurements:
• shore hardness after immersion (H1) • mass of sample in air after immersion (Ma1) • mass of rubber sample in water after immersion (Mw1)
Place rubber sample on dish (e.g. watch glass) and allow to dry in an area free from
airborne contaminants. Allow rubber to dry in ambient air for a period of 72 hours. Remove sample from dish, record the time, then measure and record the following data in a manner similar to previous measurements:
• shore hardness after drying in ambient air (H2) • mass of sample in air after drying (Ma2) • mass of rubber sample in water after drying (Mw2)
Calculate results of the testing as described in Section 6. 6. Calculation of Solvent Effects and Criteria for Acceptance
Calculate the changes in shore hardness and volume of the rubber sample after being
removed from the solvent using the following equations: Change in Shore Hardness, ∆Hw = H1 – H0 (equation 1) where: ∆Hw = change in shore hardness after immersion H0 = initial hardness of rubber sample H1 = hardness of rubber sample after immersion Change in Volume, ∆VW (%) = (Ma1 – Mw1) – (Ma0 – Mw0) x 100 (equation 2) (Ma0 – Mw0) where: ∆Vw = change in rubber sample volume after immersion Ma0 = initial mass of rubber sample in air Mw0 = initial mass of rubber sample in water Ma1 = mass of rubber sample in air after immersion in solvent Mw1 = mass of rubber sample in water after immersion in solvent
Using the following equations, calculate the changes in shore hardness and volume of the
rubber sample after allowing the sample to dry in ambient air:

UT Center for Clean Products April 12, 2006 43
Change in Shore Hardness, ∆Hd = H2 – H0 (equation 3) where: ∆H = change in shore hardness after drying in air H0 = initial hardness of rubber sample H2 = hardness of rubber sample after drying in air
Change in Volume, ∆VD (%) = (Ma2 – Mw2) – (Ma0 – Mw0) x 100 (equation 4)
(Ma0 – Mw0) where: ∆VD = change in rubber sample volume after drying in ambient air Ma0 = initial mass of rubber sample in air Mw0 = initial mass of rubber sample in water Ma2 = mass of rubber sample in air after drying in ambient air Mw2 = mass of rubber sample in water after drying in ambient air
Criteria for acceptable performance results for both shore hardness and swelling of the rubber are presented in Table 1.
Table 1. Criteria for Acceptable Solvent/Rubber Compatibility
Measurement Acceptable Shore Hardness, ∆ Hw
or ∆Hd < 3 points
Change in Volume, ∆Vw or ∆Vd
< 10%
Results of testing will be compared with these criteria to determine the future viability of
the solvent being tested, and then shared in a timely manner with AQMD and any appropriate contractors. Performance criteria for evaluated solvents were developed in consultation with lithographic roller manufacturers and printers. Test results that meet the criteria will be considered compatible, and the solvent will be considered a viable alternative for cleaning the rubber tested. The greater the results deviate from the criteria presented in Table 1, the higher likelihood of potential problems occurring under operating print conditions. Results that do not meet the above criteria do not necessarily indicate an incompatibility, but rather the need for in-depth performance evaluation under actual print conditions. 7.0 Referenced Documents ASTM 2240-03 Test method for Rubber Property - Durometer Hardness (attached) ASTM D471-79 Standard Test Method for Rubber Property - Effect of Liquids (attached) Bottcher Immersion Test Procedure for Solvent Effect on Rubber Roller Compounds

UT Center for Clean Products April 12, 2006 44
APPENDIX F:
Roller Test Data Record Form

UT Center for Clean Products April 12, 2006 45
Roller/ Solvent Compatibility Testing Worksheet
Date: Testing Specifications Room Temp: Medium type: Solvent Std Test Temp 23 C Std Test
Duration 24 Hours
Data Sample A Sample B Sample C Sample D Jar No. Sample ID: Compound Type: Solvent Type:
Solvent Temp: Immersion Start Immersion End: Drying End:
Hardness H0 Mass in Air Ma0 Mass in H2O Mw0
Hardness H1 Mass In Air Ma1 Mass In H2O Mw1
Hardness H2 Mass in Air Ma2 Mass in H20 Mw2
Results Sample A Sample B Sample C Sample D Sample ID:
Shore Hardness ∆Hw
Shore Hardness ∆HD
Volume ∆VW % Volume ∆VD %

UT Center for Clean Products April 12, 2006 46
APPENDIX G:
Roller/Solvent Test Data- Compatibility Testing

UT Center for Clean Products April 12, 2006 47
Table G1. Baseline Solvent/Roller Test Results Sample ID Roller Solvent ))))Hw ))))Vw ))))Hd ))))Vd
10A A A-230 -3 5.1766 2.5 -4.961 1B A A-230 -2.5 5.0286 0.5 -0.286 5C A A-230 -1.5 6.387 0.5 -0.556 2C A A-230 -2.5 5.984 1.5 1.287 13B A A-240 -8 43.501 -0.5 6.8132 22A A A-240 -14 49.274 3 -11.84 14C H A-240 -5 NA 0.5 0.867 14B H A-240 -4.5 NA 0 0.373 15B C AmberClean 455 -7 29.348 -6.5 23.665 23A C AmberClean 455 -10 22.011 -7 19.317 11C G AmberClean 455 -13 14.212 -9 8.466 16B G AmberClean 455 -12.5 14.827 -9 7.7993 11B C Anchor T-100 -5.5 10.359 0.5 2.7252 21A C Anchor T-100 -6.5 12.09 1.5 1.3887 12B G Anchor T-100 -3 7.3708 1 1.907 12C G Anchor T-100 -2.5 7.0258 1.5 1.786 18A B Auto 6000 -4.5 14.732 3 -6.338 9B B Auto 6000 -5 13.728 -1 3.5346 5C F Auto 6000 -3.5 9.232 0 3.225 10B F Auto 6000 -4 8.7295 -0.5 1.9509 17A C PES-C34 -7 13.1 0.5 5.2953 8B C PES-C34 -7.5 11.39 -1 4.8814
10C C PES-C34 -3.5 5.682 1 2.38 8C C PES-C34 -4 7.832 1.5 3.22 1A C Pressroom Cleaner -1 6.3674 3 0.9734 7C C Pressroom Cleaner -2 6.497 2.5 1.0964 6A G Pressroom Cleaner -2 5.0253 1 0.0266 2A G Pressroom Cleaner -2.5 5.0552 0.5 0.0931 6C D Pressroom Cleaner -1.5 4.7988 2 2.1801 10C D Pressroom Cleaner -2.5 3.9 3 1.191 12A C V-120 -15 38.657 5 -9.174 3B C V-120 -14.5 38.119 -3.5 7.7216 11A B V-120 -15 NA 3.5 -12.13 2B B V-120 -13.5 NA -3.5 5.3998 16A G V-120 -8.5 32.889 4 -8.32 7B G V-120 -7.5 31.635 0.5 5.4755 13A D V-120 -4.5 NA 5.5 -17.09 4B D V-120 -4 NA 2 -0.092 14A E V-120 -10 29.346 5.5 -9.474 5B E V-120 -10.5 30.207 -1 4.7011 15A F V-120 -8 28.73 1.5 -6.115 6B F V-120 -8 27.411 -1 7.0277

UT Center for Clean Products April 12, 2006 48
Table G2: Alternative Low VOC Solvent test Results- Nitrile Sample ID Roller Solvent ))))Hw ))))Vw ))))Hd ))))Vd
20B B 25/12.5/62.5 Acetone Water Hydro -4.5 8.5871 -2.5 3.5251 21C B 25/12.5/62.5 Acetone Water Hydro -2 8.537 -1 3.5088 20C D 25/12.5/62.5 Acetone Water Hydro -2.5 7.6993 -0.5 3.2138 19C D 25/12.5/62.5 Acetone Water Hydro -3 5.2595 -2 1.2956 18B A 50/50 Acetone Soy -14.5 NA -10.5 52.61 5A A 50/50 Acetone Soy -16 NA -10 30.6 1D A 50/50 Acetone Soy -15 NA -12 59.37 4D A 50/50 Acetone Soy -14 46.83 -9 39.9 2D B 50/50 Acetone Brulin -6.5 28.45 -4 16.88 5D B 50/50 Acetone Brulin -5 24.15 -3.5 12.96 19B D 75/25 Acetone Soy -8 NA -1.5 4.7647 9A D 75/25 Acetone Soy -12.5 NA -1.5 4.6382
17D F Soy Gold 2000 -13 14.343 -7 14.062 7E F Soy Gold 2000 -7 14.181 -3 13.751
18D C Soy Gold 2000 -11 15.237 -10 16.402 8E C Soy Gold 2000 -14.5 19.624 -13.5 15.447 17B A Soy Gold 2000 -8 14.668 -4 14.759 3A A Soy Gold 2000 -10 14.722 -12 14.44
10D A 25/75 Acetone Soy -1 -2.986 0.5 -8.177 6E A 25/75 Acetone Soy 0.5 -5.67 2.5 -3.802 8D G 25/75 Acetone Soy 0.5 -5.587 1 -9.038 16D G 25/75 Acetone Soy -1.5 -9.919 1.5 -5.578 9D C 25/75 Acetone Soy 0 -3.868 1 -3.573 5E C 25/75 Acetone Soy -1 -4.577 3 -3.282
11D C Siebert 219 ES Emulsion -4 -4.03 -2 -13.12 4E C Siebert 219 ES Emulsion -3 -2.28 1 -10.22
15D D Siebert 219 ES Emulsion 1.5 -4.055 2 -9.27 12D D Siebert 219 ES Emulsion 1 -3.673 0.5 -14.05 7D B Autowash 3 -1 -3.034 0.5 -8.455 14D B Autowash 3 0.5 -7.322 2.5 -7.655 3E F Autowash 3 0.5 -6.662 1 -5.584
13D F Autowash 3 -1.5 -2.865 1.5 -7.332 3D C Magic Wash 522 1 -4.03 2.5 -8.033 6D C Magic Wash 522 2.5 -2.28 2 -6.903 1E D Magic Wash 522 1.5 -4.055 2 -5.664 2E D Magic Wash 522 1 -3.673 0.5 -8.443
UT Center for Clean Products April 12, 2006 49
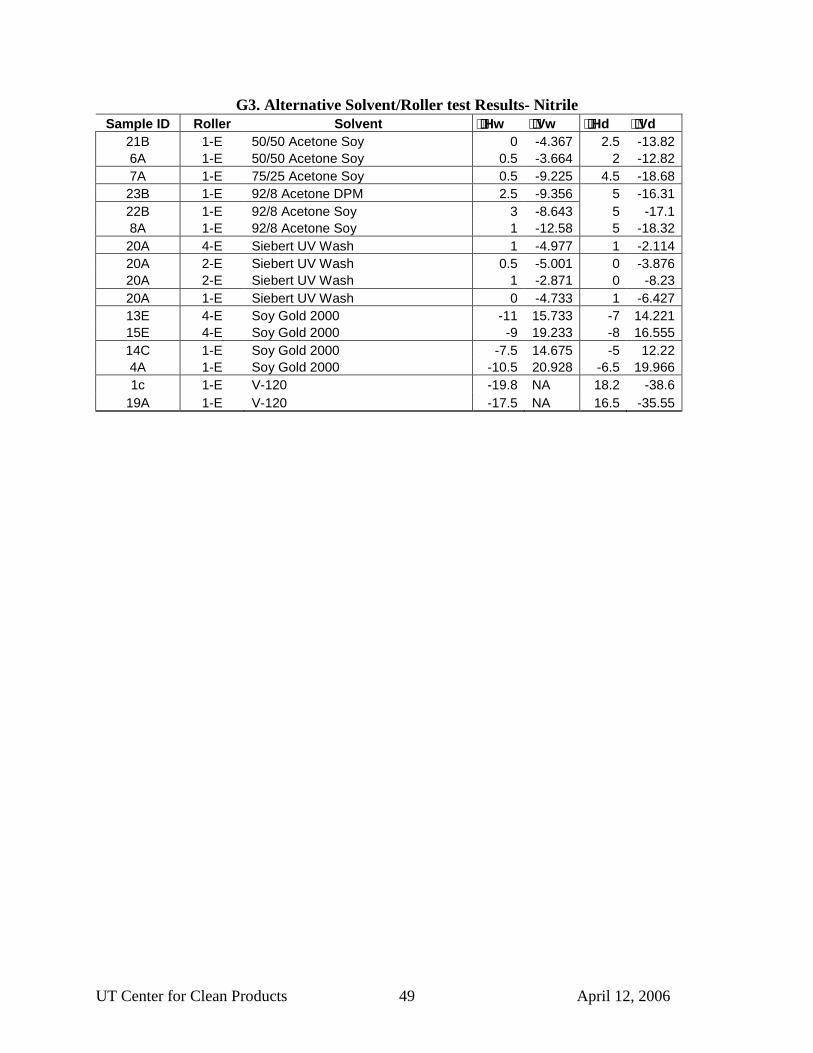
G3. Alternative Solvent/Roller test Results- Nitrile Sample ID Roller Solvent ))))Hw ))))Vw ))))Hd ))))Vd
21B 1-E 50/50 Acetone Soy 0 -4.367 2.5 -13.82 6A 1-E 50/50 Acetone Soy 0.5 -3.664 2 -12.82 7A 1-E 75/25 Acetone Soy 0.5 -9.225 4.5 -18.68 23B 1-E 92/8 Acetone DPM 2.5 -9.356 5 -16.31 22B 1-E 92/8 Acetone Soy 3 -8.643 5 -17.1 8A 1-E 92/8 Acetone Soy 1 -12.58 5 -18.32 20A 4-E Siebert UV Wash 1 -4.977 1 -2.114 20A 2-E Siebert UV Wash 0.5 -5.001 0 -3.876 20A 2-E Siebert UV Wash 1 -2.871 0 -8.23 20A 1-E Siebert UV Wash 0 -4.733 1 -6.427 13E 4-E Soy Gold 2000 -11 15.733 -7 14.221 15E 4-E Soy Gold 2000 -9 19.233 -8 16.555 14C 1-E Soy Gold 2000 -7.5 14.675 -5 12.22 4A 1-E Soy Gold 2000 -10.5 20.928 -6.5 19.966 1c 1-E V-120 -19.8 NA 18.2 -38.6
19A 1-E V-120 -17.5 NA 16.5 -35.55