COMPARISON - Tourism AZ...The Arizona Wine Tourism Industry – 2017 Executive Summary of a wine...
41
COMPARISON RATIOS/PROBABILITIES Alliance Bank Business Outreach Center The Arizona Wine Tourism Industry – 2017 Prepared for the Arizona Office of Tourism July 2017 Alliance Bank Business Outreach Center Northern Arizona University Ryan Fitch, Ph.D., Research Associate Thomas Combrink, M.S., Senior Research Specialist Tom Pitts, Chair of the Arizona Association for Economic Development’s Rural Task Force
Transcript of COMPARISON - Tourism AZ...The Arizona Wine Tourism Industry – 2017 Executive Summary of a wine...

COMPARISON
RATIOS/PROBABILITIES
Alliance BankBusiness Outreach Center
The Arizona Wine Tourism Industry – 2017Prepared for the
Arizona Office of TourismJuly 2017
Alliance Bank Business Outreach CenterNorthern Arizona University
Ryan Fitch, Ph.D., Research AssociateThomas Combrink, M.S., Senior Research Specialist
Tom Pitts, Chair of the Arizona Association for Economic Development’s Rural Task Force

Northern Arizona University Alliance Bank Business Outreach Center | July 2017
i
Acknowledgments
The Alliance Bank Business Outreach Center would like to thank the members of the Arizona Office of Tourism and the 11 co-sponsors who made this project possible. Without your support, this study would not have been possible. Special thanks to Colleen Floyd, Director of Research and Kari Roberg, Research Manager at the Arizona Office of Tourism and the 11 co-sponsors: Arizona Wine Growers Association, City of Sedona, Cottonwood Chamber of Commerce, Cottonwood Economic Development Council, Sedona Chamber of Commerce, Sonoita/Elgin Chamber of Commerce, Verde Valley Regional Economic Organization, Verde Valley Wine Consortium, Willcox Chamber of Commerce and Agriculture, Jerome Chamber of Commerce, and Town of Camp Verde. We would like to thank and acknowledge Tom Pitts, Chair of the Arizona Association for Economic Development’s Rural Task Force, for putting together this group of co-sponsors to help fund the project.
We received a tremendous amount of help and support with introductions, logistics, and survey dissemination. Again, Tom Pitts was instrumental in showing us around the Verde Valley and introducing us to winemakers throughout the region. Next, we would like to thank Alan Baker, Executive Director for the Willcox Chamber of Commerce and Agriculture, for taking us around the Willcox area and introducing us to the winemakers of the Willcox region. A big thanks to Kent Callaghan, Founder of Callaghan Vineyards, for taking the time to show us around the Sonoita/Elgin area and facilitating introductions to the winemakers of the Sonoita/Elgin region. Finally, we would like to thank all the participating tasting rooms, vineyards, and wineries for taking part in this study. Without your involvement, we would not have been able to collect the necessary data for this project.
We understand administering surveys to wine tourists is not the typical duty of staff at the participating sites. We are grateful for your professionalism and dedication in distributing the survey instrument. Lastly, we thank all the individuals who took the time to take our survey. We hope this report will better serve you, the wine consumer.
For the Alliance Bank Business Outreach Center:Ryan Fitch, Ph.D., Research AssociateThomas Combrink, M.S., Senior Research SpecialistHeather Cornea, Research AssistantWade Rousse, Ph.D., Interim Director


Northern Arizona University Alliance Bank Business Outreach Center | July 2017
1
This survey and analysis is a follow-up to “The Arizona Wine Tourism Industry” 2011 study conducted by Northern Arizona University’s (NAU’s) Arizona Hospitality Research and Resource Center (AHRRC), a unit of the Alliance Bank Business Outreach Center. On behalf of the Arizona Office of Tourism and 11 other co-sponsors, this study looks into the growth of Arizona wine tourism over the past six years. The survey was designed to collect information regarding general demographics, on-site expenditures, visitation length, and the overall wine tasting experience of visitors. Surveys were administered to visitors (one per party) at tasting rooms, vineyards, and wineries within the three dominant wine growing regions of Arizona. These regions are Cochise County, Willcox; Santa Cruz County, Sonoita/Elgin; and Yavapai County, Verde Valley. Five locations were surveyed in the Willcox area, nine locations were surveyed in the Sonoita/Elgin area, and 16 locations were surveyed in the Verde Valley. Over the four month survey period from February – May 2017, 1,026 surveys were collected. From the 1,026 surveys collected,
761 were deemed usable based on completion of several key questions in the survey.
Our surveys captured wine visitors from 41 states, the District of Columbia, and three foreign countries (Canada, Scotland, and Mexico). Arizona wine tourism is largely driven by in-state visitors with approximately 58% of all Arizona wine tourists traveling from a place within the state. Wine visitors from the greater Phoenix and Tucson Metro areas comprise over 77% of wine tourists originating from Arizona. Combined, Prescott and Flagstaff represent just over 3% of wine visitors originating from Arizona. Out-of-state places of origin that comprise greater than 1% of total wine visitors include: Illinois (approximately 6%), California (approximately 5%), Wisconsin (approximately 4%), New York (approximately 3%), Washington (approximately 3%), Canada (approximately 2%), Colorado (approximately 2%), Texas (approximately 2%), Indiana (approximately 1%), Florida (approximately 1%), and Ohio (approximately 1%).
We analyzed the impact party composition (men, women, and children) had on the probability
The Arizona Wine Tourism Industry – 2017
Executive Summary
of a wine purchase at the tasting room, vineyard, or winery. We did not find this variable to be significant in predicting the probability of purchasing a bottle of wine. However, wine tourists most commonly traveled as couples or in groups of men and women together. Approximately 67% of wine visitors traveled in groups of men and women. Groups of women only was the next most common party type with around 19% of wine visitors comprising a women only party.
Roughly 70% of survey respondents purchased a bottle of wine while visiting the tasting room, vineyard, or winery. We found age and income to be variables that can help determine the probability of a bottle of wine being purchased. As age increases, each additional year increases the odds ratio of purchasing a bottle of wine by 1.015. Survey respondents with an income greater than $150,000 are more likely to purchase a bottle of wine compared to survey respondents with an income less than $50,000 (odds ratio of 1.403). Surprisingly, survey respondents with an income between $50,000 and $99,999 were slightly less likely to purchase a bottle of wine compared to survey respondents

The Arizona Wine Tourism Industry – 2017
2
with an income of less than $50,000 (odds ratio of 0.964).
Wine tourists depart Arizona tasting rooms, vineyards, and
visitors spending the night in the region.
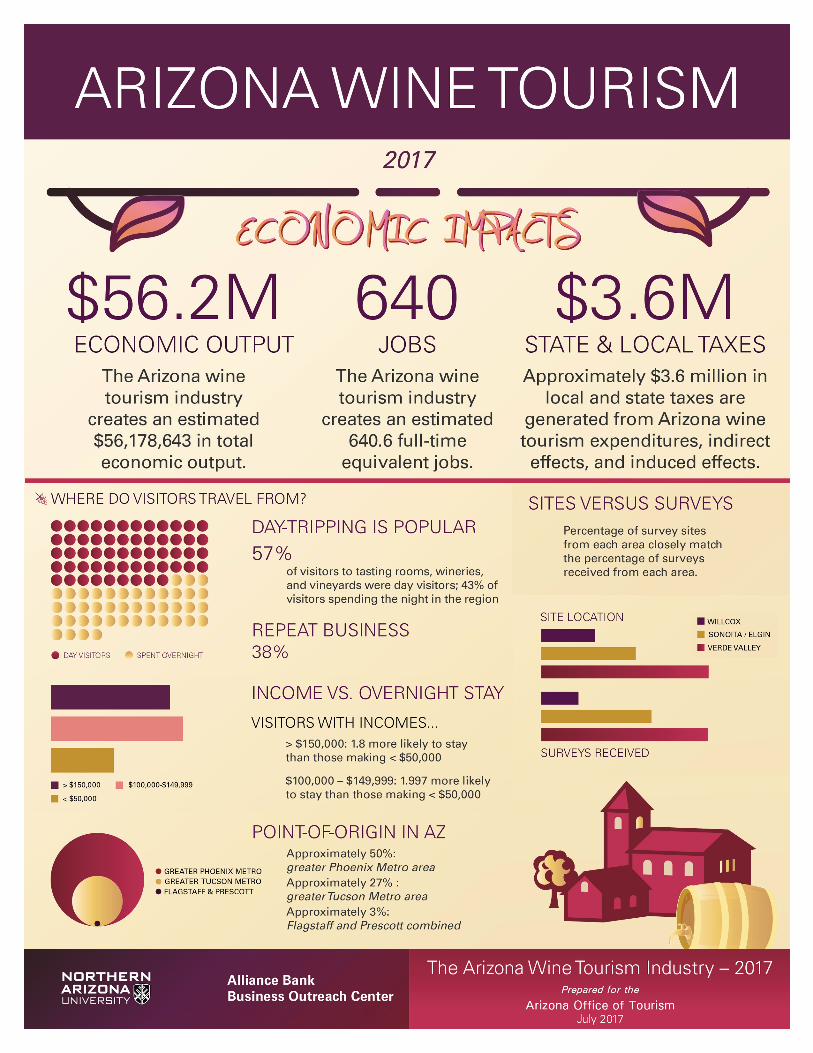
• Visitors with incomes ranging between $100,000 and $149,999 are estimated to have almost twice the odds of spending the night in the region compared to visitors with incomes less than $50,000 (odds ratio of 1.997).
• Visitors with incomes greater than $150,000 are estimated to have 1.8 the odds of spending the night in the region compared to visitors with incomes less than $50,000 (odds ratio of 1.8).
• Approximately 70% of visitors purchased a bottle of wine at the tasting room, winery, or vineyard they visited.
• Given at least one bottle of wine was purchased by a visitor at the tasting room, winery, or vineyard, the average expenditure on wine was roughly $78.
• Given at least one bottle of wine was purchased by a visitor at the tasting room, winery, or vineyard, the average total expenditure was roughly $101.
• The top five out-of-state places of origin are Illinois (approximately 6% of visitors), California (approximately
5% of visitors), Wisconsin (approximately 4% of visitors), New York (approximately 3% of visitors), and Washington (approximately 3% of visitors).
• About 50% of wine visitors from Arizona come from the greater Phoenix Metro area. Approximately 27% of wine visitors from Arizona come from the greater Tucson Metro area. Roughly 3% of wine visitors from Arizona come from Flagstaff and Prescott combined.
• Approximately 67% of wine tourists travel as couples or in groups of men and women.
• Over 78% of survey respondents rated their tasting room, vineyard, or winery experience as exceeding expectations.
• An additional year of age for the visitor increases the estimated odds ratio of making a wine purchase at the tasting room, winery, or vineyard by 1.015.
• Visitors making $150,000 or more have an estimated odds ratio for purchasing a bottle of wine at a tasting room, winery, or vineyard of 1.403 compared to visitors making less than $50,000.
Key Findings and Summary Statistics from the Survey Data
• The Arizona wine tourism industry creates an estimated $56,178,643 in total economic output.
• The Arizona wine tourism industry creates an estimated 640.6 full-time equivalent jobs.
• Approximately $3.6 million in local and state taxes are generated from Arizona wine tourism expenditures, indirect effects, and induced effects.
• Percentage of surveys received from each area closely match the percentage of survey sites from each area: Approximately 17% of the sites were located in Willcox, roughly 12% (93) of surveys analyzed came from Willcox; approximately 30% of the sites were located in Sonoita/Elgin, roughly 35% (263) of surveys analyzed came from Sonoita/Elgin; and 53% of the sites were located in the Verde Valley, approximately 53% (405) of surveys analyzed came from the Verde Valley.
• Approximately 38% of visitors to tasting rooms, wineries, and vineyards had previously visited the site (repeat visitors).
• Approximately 57% of visitors to tasting rooms, wineries, and vineyards were day visitors with the remaining 43% of
wineries with an experience that, on the whole, exceeds expectations. Over 63% of survey respondents rated their overall experience as “Much better than I
expected” with an additional 15% of survey respondents rating their experience as “A little better than I expected.”


Northern Arizona University Alliance Bank Business Outreach Center | July 2017
5
Table of Contents
Introduction ...........................................................7
Methods ...............................................................10
Summary Statistics ...............................................11
1. Overall .....................................................11
2. Regional ...................................................18
2011 – 2017 Comparison .....................................24
Odds Ratios and Purchasing Probabilities ...........29
Economic Impacts ................................................30

The Arizona Wine Tourism Industry – 2017
6

Northern Arizona University Alliance Bank Business Outreach Center | July 2017
7
Introduction
The wine industry in Arizona has a long, colorful, and truly unique history. In a very real sense, Arizona was both the first and the last state in the union to capitalize on its terroir to make fine wine. Following the Columbus voyage of discovery in 1492, the Spanish search for gold became the driving force for new world exploration. Southern Mexico and, subsequently, South America became the focus because of the fabulous wealth that was quickly discovered. North America could wait. That is, until tales of the Seven Cities of Cibola surfaced.
In 1528, the remnants of the ill-fated 600 member Narváez 1527 expedition to Florida was washed ashore on Galveston Island on the Texas coast, driven there by hurricanes. Ultimately, there were only four survivors, led by Álvar Núñez Cabeza de Vaca. He and a Moroccan slave named Esteban along with two others, spent eight years working their way on foot across Texas and New Mexico into Arizona and then south into Mexico where they were finally reunited with their Spanish countrymen, reaching Mexico City in 1536 and returning to Spain in 1537. They provided extensive reports on flora, fauna, native customs of the people they’d met on their journey, and stories and rumors of fabulous wealth they had been told about in the seven cities of Cibola. In 1539 a Franciscan
Priest, Fray Marcos de Niza, was appointed to head an expedition to find the seven cities and Esteban was sent along to guide him. Esteban went ahead of the group, leaving markers to guide them, and ultimately disappeared or, as reported, was killed by the Zunis. The expedition returned to Mexico and Marcos de Niza said that he had seen Zuni, supposedly one of the seven cities, on a high hill from a distance but he said he feared that his force was too small and if he tried to enter the city, they would all meet the same fate as Esteban.
In 1540 Francisco Vázquez de Coronado y Luján, the Governor of Nueva Galicia (New Galicia), a province located northwest of Mexico City and comprising the contemporary Mexican states of Jalisco, Sinaloa and Nayarit, determined to mount his own expedition, using Marcos de Niza as a guide. He put together a far larger group, consisting of 400 Spanish soldiers, 2,000 Mexican (Indian) soldiers, several Native and African slaves, four Franciscan monks (including Marcos de Niza), and numerous family members and servants who also joined in. He entered Arizona south of Willcox in the Sulfur Springs Valley of what is now Cochise County and explored at length all the way to Kansas. Elements of his force were the first to see the Colorado River, the Grand Canyon, and many other locations in Arizona,
New Mexico, Texas, Oklahoma, and Kansas before returning to Mexico in 1542, broke, discouraged, and disappointed, having found no golden city. All of this was within 50 years of the Columbus voyage, far before most of the rest of North America had been touched. In 1583, Spanish explorer Antonio de Espejo was sent from Mexico City and became the first European to explore the Verde Valley. He was followed in 1598 by Farfan de los Godos and a second expedition that year by Juan de Oñate, who revisited in 1604. The Padres quickly began planting so-called “Mission Grapes” to make their sacramental wine and other favorite wine varieties soon followed.
There are reports of European grapevines being established in Southern Arizona as early as the mid-16th century, as the Spanish explorers recognized similarities to their home soils in Spain, which would make these the first wine grapes planted in the United States. Nine missions were established between 1629 and 1691, with each establishing their own vineyards. Special success was attained in Southern Arizona north of Nogales in what is now Santa Cruz County. Missions and vineyards were also established in New Mexico during this period. The grapes flourished and, as permanent settlements independent of the missions were established,

The Arizona Wine Tourism Industry – 2017
8
such as Tubac in 1752, classical Spanish grape varietals such as Tempranillo were established. The first wine grapes were not planted in California until 1779 at the Mission San Diego Alcalá. By that time, Arizona had a 200 year head start and the number of wine grapes grown in Arizona and New Mexico far exceeded the production in California well into the 20th Century, a lead they had dramatically increased as mining became a driving economic force in Arizona, attracting many European wine drinking miners. And then political history intervened and literally changed the rules.
Arizona became the 48th and final of the contiguous states in 1912. In 1914 a small group of prohibitionists in Phoenix ushered a bill through the state legislature bringing wine production and consumption to a halt. Absolute prohibition came to Arizona on January 1, 1915, five years before federal prohibition came about. When federal prohibition was established, it happened with a constitutional amendment and was widely debated and well discussed all over the country. Under federal prohibition, many vineyards, especially in California, stayed in business because it allowed winemaking for medicinal and sacramental purposes and for personal consumption. In fact, you could make up to 60 gallons a year for your family. At harvest time, railroad box cars were lined
up in California wine country, loaded with lug boxes full of wine grapes for shipment to home winemakers all over the country, keeping at least some of those vineyards in business. No such thing occurred in Arizona. All production, sale, ownership, possession, and consumption was outlawed – even medicinal, scientific, and sacramental uses were forbidden. When it looked like the Catholic Church was going to take a case all the way to the Supreme Court, the state met with the Bishop in Phoenix and a deal was struck whereby if a priest used a small amount of wine during mass, he wouldn’t be arrested, but the law wouldn’t be changed. There was little public discussion of the bill and apparently none of the growers in the state, all of whom were located in higher elevations at some distance from the capital, even knew about the new rules until they were being enforced. Henry Schuerman, a large grower and winemaker with vineyards located along Oak Creek, near Red Rock Crossing outside of Sedona, had built a very lucrative business selling to the international miners in the nearby “Billion Dollar Mining Camp,” of Jerome. He didn’t hear about the law until the Yavapai County Sherriff arrived to tell him he was out of business. Schuerman said, “What? You can’t grow food?” He was promptly arrested and hauled off to jail in Prescott, the County Seat. It didn’t take long for the word to get around
and for the wine industry to completely disappear in Arizona. When federal prohibition took effect in 1920, most people forgot about the Arizona law completely. When the federal law was reversed in 1933, and future control of alcoholic beverages was given to the states, no one even thought about restoring production here. Arizona adopted the so-called three tier system of distribution utilized by many states. The state licenses a distributor to obtain alcoholic beverages from a producer or importer, bring in the state, and, in turn, sell the beverages to state licensed retailers such as liquor stores, bars, and restaurants. End consumers comprise the third tier where the alcoholic beverages are purchased and consumed.
No discussion of growing grapes and making wine occurred for almost 40 years. In 1970, Professor Gordon Dutt came to the College of Agriculture at the University of Arizona from his prior position at the University of California, Davis, known as California’s top wine school. He wasn’t a winemaker. He was a soil scientist, specializing in hydrology, who had done numerous soil studies for vineyards in California. When he began working in Arizona, he quickly concluded that Arizona’s soils could be well suited for growing wine grapes. Knowing nothing of the wine industry history here, he set out to see if he was right, placing a number of wine grape test plots around

Northern Arizona University Alliance Bank Business Outreach Center | July 2017
9
the state for study. Based on the apparent success of those sample plots, he approached Governor Raúl Castro, explaining that he felt the state was missing an opportunity to establish a new cash crop in the state. The Governor was encouraging but thought stronger data was needed. He helped develop a $95,000 grant in 1976 to conduct a full statewide study and tied in New Mexico, Colorado, and Utah, making it a ‘four corners’ study with shared data. In 1979 as the grape vines began to produce fruit, Dr. Dutt contacted an enologist (winemaker) friend at UC Davis to come to Tucson to make some test batches of wine from the young grapes. The batches were deemed to be quite good, with the favorite coming from a plot near Sonoita, in the hills southeast of Tucson. With test results in hand, it was time to go back to the Governor, who agreed to proceed. Opposition came from the liquor distributors who wanted to restrict product sales to those wineries with distribution agreements – something no winery could possibly have, as yet. After a serious battle, a bill was finally passed allowing winemaking to return to Arizona – but with major restrictions on how the product could be sold or shipped, seriously limiting the potential of the fledgling industry. The first license was issued in 1982 to R.W. Webb, who had seen the study at the U of A. He started his operations
in Vail, near Tucson. He quickly determined that it was too hot on the desert floor and began the first major vineyard in Arizona in the foothills of the Chiricauha Mountains near Willcox in Cochise County. The second license went to Bill Staltarni, a small producer in Yavapai County, and Gordon Dutt established Sonoita Vineyards with license #3 in an attempt to demonstrate that high quality wine could be produced in Arizona. His 1986 Reserve Cabernet Sauvignon was the first Arizona wine served at the White House and was served for the Bush inauguration in 1989. However, the legal restrictions were so severe that only a total of nine licenses had been issued by 2000. Battles raged in the legislature and the courts each year to loosen or tighten restrictions. Similar activity was also taking place elsewhere around the country – at least until 2005, when one of the cases made it all the way to the U.S. Supreme Court. In the case of Granholm vs. Heald 544 U.S. 460 (2005), the Court found the rules unconstitutional, with particular attention drawn to the Commerce Clause, and wiped away the restrictive shipping and other business regulations. On June 23, 2006, Governor Napolitano signed SB1276, finally making it legal for the wine industry in Arizona to operate as it does today. The laws tend to be fine-tuned every year, but the new legal operating structure has allowed the wine
industry in Arizona to experience dynamic growth, thus making it one of the last states, if not the last state to become a major player on the U.S. wine stage. Arizona is taking advantage of the opportunity in a big way.
As this is being written, the number of licensed and bonded wineries in Arizona is approaching 100, reflecting a large investment in Arizona’s future. Planting a vineyard typically costs between $25,000 to $35,000 per acre, not counting land acquisition and land preparation cost. New vineyards are now being planted constantly in Arizona, while many older holdings are being honed and expanded. It takes three to five years for new grapevines to generate the first usable crop and five to seven years to reach full production. The good news is that these vineyards then stay in production for 45 years or more. In addition to the vineyards, a full scale winery can easily cost over $1 million to build and equip. With aging of wine before release, it is not unusual for a new winery to take seven years or more to generate its first dollar of income. A huge plus is that people like to see where the grapes are grown and where their wine is made and this longevity of production in a proven location helps to explain the development of long-term interest and loyalty on the part of consumers to visit and continually return to their favorite wineries. Most of the wineries now have membership

The Arizona Wine Tourism Industry – 2017
10
clubs to encourage commitment and reward their customers’ loyalty. The wine industry in Arizona has had an enormous advantage in establishing their on-site customer base in that the state has been long established as a major tourist destination. Adding the attraction of the wineries has provided another good reason to visit. Hospitality and culinary opportunities quickly follow.
National recognition has followed, as well. A steady array of Gold Medals and other awards continues to bring attention to Arizona wine. With regard to our three established principle growing regions, the Federal Government has awarded American Viticultural Area (AVA) status as distinguished wine grape growing regions to Sonoita and Willcox, with the Verde Valley approval expected shortly.
This report examines several aspects of wine visitors within Arizona. Namely, we address demographic information, spending habits, and expectations and reactions of the Arizona wine visitors. From this information, we derive probability estimates of wine visitors making purchases at tasting rooms, vineyards, or wineries and we model the economic impacts Arizona wine tourists bring to the state in terms of employment, expenditures, and multiplier effects.
Methods
Northern Arizona University’s (NAU’s) Arizona Hospitality Research and Resource Center (AHRRC), within the Alliance Bank Business Outreach Center (ABBOC), (Henceforth, “The Center”) designed a survey, distributed the survey, and analyzed survey results to identify wine visitor demographics and estimate the economic impacts wine tourism has on Arizona’s economy. For comparisons sake, the 2017 survey was designed, and distributed based on “The Arizona Wine Tourism Industry” 2011 study.
Survey Design
The Center created a visitor survey compatible with Teleform scanning software to allow for data collection. The survey asks a series of questions pertaining to visitor demographics, wine spending patterns, and general wine interest. Questions range in type including numerical entries, five-point Likert Scale responses, yes/no responses, and written responses.
Survey Distribution
The Center distributed paper surveys to tasting rooms, vineyards, and wineries willing to participate in the study and located within the sample area. The three major wine producing areas of Arizona were defined as the study area: Cochise County, Willcox; Santa Cruz County, Sonoita/Elgin; and Yavapai
County, Verde Valley. Eight sites were asked to participate in the Willcox area, five sites returned surveys; 10 sites were asked to participate in the Sonoita/Elgin area, nine sites returned surveys; and 18 sites were asked to participate in the Verde Valley, 16 sites returned surveys. Twenty-five (25) surveys were delivered to tasting rooms, vineyards, and wineries each month of the survey period from February – May 2017. Employees were asked to distribute surveys to guests of their establishment. One survey was to be given per party. Completed surveys were returned to us via a self-addressed, postage paid return envelope.
In addition to paper surveys, electronic surveys were created in Qualtrics as a substitute to the paper format. A unique URL was created for each site and flyers were distributed to sites advertising the on-line survey. Final analysis was conducted on total paper and electronic surveys completed and returned.
Survey Analysis
Returned paper surveys were scanned with Teleform software and combined with the on-line survey results. Returned surveys were used in the analysis if age, income, and type of stay questions were completed. Of the 1,026 surveys returned to The Center, 761 surveys were deemed usable through the completion of the above questions. Acceptable survey results were compiled for
Northern Arizona University Alliance Bank Business Outreach Center | July 2017
11
economic and statistical analysis in IMPLAN 3.0, SAS 9.4, and SPSS 24 software packages.
Summary Statistics (Overall)
Places of Origin
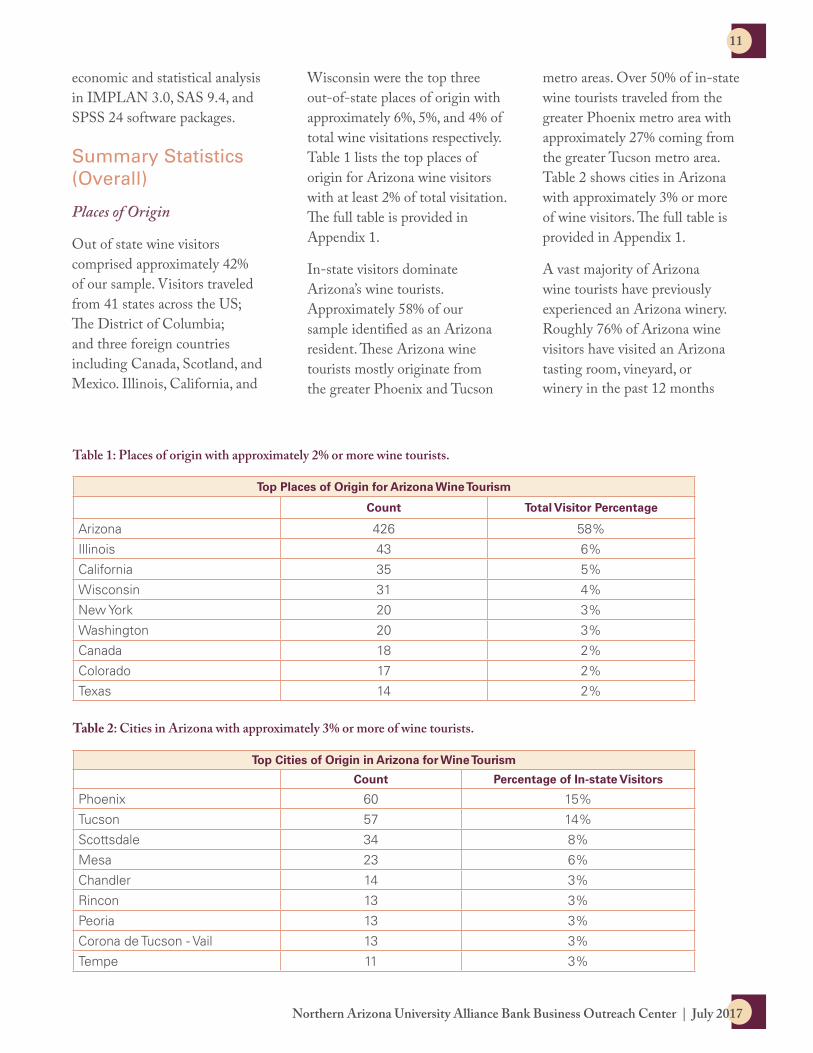
Out of state wine visitors comprised approximately 42% of our sample. Visitors traveled from 41 states across the US; The District of Columbia; and three foreign countries including Canada, Scotland, and Mexico. Illinois, California, and
Wisconsin were the top three out-of-state places of origin with approximately 6%, 5%, and 4% of total wine visitations respectively. Table 1 lists the top places of origin for Arizona wine visitors with at least 2% of total visitation. The full table is provided in Appendix 1.
In-state visitors dominate Arizona’s wine tourists. Approximately 58% of our sample identified as an Arizona resident. These Arizona wine tourists mostly originate from the greater Phoenix and Tucson
metro areas. Over 50% of in-state wine tourists traveled from the greater Phoenix metro area with approximately 27% coming from the greater Tucson metro area. Table 2 shows cities in Arizona with approximately 3% or more of wine visitors. The full table is provided in Appendix 1.
A vast majority of Arizona wine tourists have previously experienced an Arizona winery. Roughly 76% of Arizona wine visitors have visited an Arizona tasting room, vineyard, or winery in the past 12 months
Table 1: Places of origin with approximately 2% or more wine tourists.
Top Places of Origin for Arizona Wine Tourism
Count Total Visitor Percentage
Arizona 426 58%
Illinois 43 6%
California 35 5%
Wisconsin 31 4%
New York 20 3%
Washington 20 3%
Canada 18 2%
Colorado 17 2%
Texas 14 2%
Table 2: Cities in Arizona with approximately 3% or more of wine tourists.
Top Cities of Origin in Arizona for Wine Tourism
Count Percentage of In-state Visitors
Phoenix 60 15%
Tucson 57 14%
Scottsdale 34 8%
Mesa 23 6%
Chandler 14 3%
Rincon 13 3%
Peoria 13 3%
Corona de Tucson - Vail 13 3%
Tempe 11 3%

The Arizona Wine Tourism Industry – 2017
12
(Table 3). Given that a person had visited an Arizona tasting room, vineyard, or winery in the past 12 months, the average number of visits to one of these establishments in Arizona was approximately six. Getting more site specific, around 38% of survey respondents had visited the tasting room, vineyard, or winery where they took the survey in the past (Table 4). Given that the respondent has visited the site in the past, the average number of visits to the site was approximately seven. Some of the Arizona tasting rooms, vineyards,
and wineries have wine clubs to complement on site sales. Approximately 12% of our survey respondents stated they were a member of the wine club where they took the survey.
Party Type, Age, and CompositionArizona wine tourists most commonly visit tasting rooms, vineyards, and wineries with family members. Approximately 45% of survey respondents are at the establishment with “Family Only”. “Family and Friends” was the next most common party type with about 28% of survey
responses. “Friends Only” made up roughly 23% of the survey replies. Our surveys captured very few visitors traveling as part of an organized tour. Less than 1% of Arizona wine tourists stated they were traveling as the “Organized Tour Group” party. Table 5 summarizes party type composition.
Our survey further broke down party member composition by the number of adult women, adult men and children present in the party. Given a party type of “Family & Friends”, the party composition averaged
Table 3: Binomial distribution derived from the question, “Approximately how many Arizona wineries have you visited in the last 12 months?” If respondent entered one or more, they were classified “repeat visitor”.
Repeat Visitors to an Arizona Winery
Count Percentage
Repeat Visitor 580 76%
First Time Visitor 181 24%
Total 761 100%
Table 4: Binomial distribution derived from the question, “How many times have you visited this site before today’s visit?” If respondent entered one or more, they were classified “repeat visitor”.
Repeat Visitors to the Site
Count Percentage
Repeat Visitor 287 38%
First Time Visitor 474 62%
Total 761 100%
Table 5: Count Data from the question, “Who is in your travel party today?”
Arizona Wine Tourist Party Type
Count Percentage
Family & Friends 202 28%
Family Only 331 45%
Friends Only 168 23%
Traveling Alone 25 3%
Organized Tour Group 4 1%
Business Associates 1 0%
Total 731 100%
Northern Arizona University Alliance Bank Business Outreach Center | July 2017
13
approximately 2.2 women, 1.5 men, and 0.2 children. For the party type of “Family Only”, approximately 1.3 women, 1.1 men, and 0.1 children was the average. “Friends Only” party composition averaged approximately 2.1 women, 1.3 men, and no children. Men tended to visit Arizona tasting rooms, vineyards, or wineries slightly more often than women for the party group “Traveling Alone”. The approximate probability for a man or woman “Traveling Alone” was 60% for a man and 40% for a woman. Women dominated the party composition of “Organized Tour Group” at an average of roughly 3.5 with men at 1.3. The one party that identified as “Business Associates” was two women.
Another analysis with respect to party type was carried out with the age of the survey respondent. The overall average age of an Arizona wine tourist was approximately 48.2 years. The party type “Friends & Family” closely matched the overall average age at approximately 48.4 years. The average ages of the party groups “Organized Tour Group” and “Business Associates” was 66.8 and 28 years respectively. We attribute this larger divergence from the overall mean to the smaller sample sizes of “Organized Tour Group” and “Business Associates”. The party types of “Family Only”, “Friends Only”, and “Traveling Alone” were similar to the overall average with approximate average ages of 49.7, 45.9, and 45.4 years respectively.
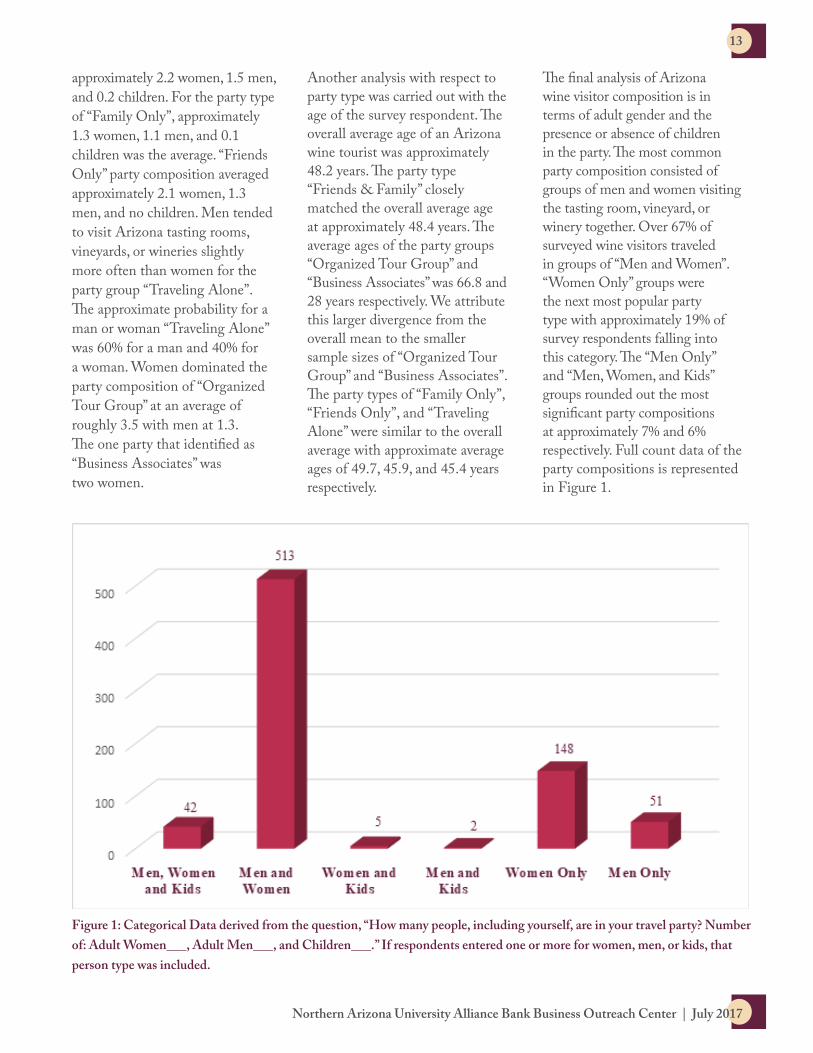
The final analysis of Arizona wine visitor composition is in terms of adult gender and the presence or absence of children in the party. The most common party composition consisted of groups of men and women visiting the tasting room, vineyard, or winery together. Over 67% of surveyed wine visitors traveled in groups of “Men and Women”. “Women Only” groups were the next most popular party type with approximately 19% of survey respondents falling into this category. The “Men Only” and “Men, Women, and Kids” groups rounded out the most significant party compositions at approximately 7% and 6% respectively. Full count data of the party compositions is represented in Figure 1.
Figure 1: Categorical Data derived from the question, “How many people, including yourself, are in your travel party? Number of: Adult Women___, Adult Men___, and Children___.” If respondents entered one or more for women, men, or kids, that person type was included.

The Arizona Wine Tourism Industry – 2017
14
Income and Expenditure Patterns
If wine is categorized as a luxury good, the consumer’s higher income could be correlated with increased consumption patterns. We designed a survey question to determine Arizona wine tourists income within a range of $25,000 increments. Figure 2 shows the count data of how our survey respondents were distributed across the eight income categories. Visitors with incomes greater than $175,000 comprised the largest group at approximately 20% of our sample. The next most common income brackets were $50,000 –
$74,999, $75,000 – $99,999, and $100,000 – $124,999 at approximately 16% for each group. Visitors with incomes less than $25,000 were the smallest group at approximately 3% of our sample size.
We further examined expenditure patterns at the tasting room, vineyard, or winery based on the eight income categories Arizona wine tourists were grouped into. Overall, approximately 70% of survey respondents entered a value greater than zero for the question, “How many bottles of wine did you purchase?” under the heading, “If you bought
anything at this venue today please complete the questions below:” Any value equal to or greater than one was considered a wine purchase. Surprisingly, Arizona wine tourists in the “less than $25,000” household income category had the highest probability of purchasing wine at over 76%. Apart from the high purchase probability of lower income households, probabilities of purchasing wine at the venue tended to decrease as household income decreased. Survey respondents with household incomes of greater than $175,000 had a wine purchase probability of approximately 74% with
Figure 2: Count Data of visitors’ responses to the question, “Which of the following categories best describes your annual household income?”

Northern Arizona University Alliance Bank Business Outreach Center | July 2017
15
decreasing probabilities as household incomes decreased. Table 6 summarizes the percentages of wine purchases per household income group.
Our survey asked Arizona wine visitors to state how much they spent on wine, food, and merchandise at the venue they took the survey. The following questions were asked under the heading, “If you bought anything at this venue today please complete the questions below:” “How much did you spend on wine?”, “How much did you spend on food?”, and
“How much did you spend on merchandise?” We analyzed expenditures on wine alone and the aggregate of all expenditures (total expenditure) for each household income category. The following statistics are based on at least one bottle of wine being purchased. The average expenditure on wine was $77.69; the average total expenditure was $100.57. In terms of average wine and total expenditures by household income categories, as household incomes increase, in general, so does average wine and total expenditure given a wine purchase was made. Survey
respondents in the $175,000 or greater household income category had the greatest average wine and total expenditure at $104.64 and $126.50 respectively. Household incomes of $50,000 – $74,999 had the lowest average expenditure on wine at $55.24. Household incomes of < $25,000 had the lowest average total expenditure at $68.31. Tables 7 summarize the average wine and total expenditure by household income groups given a wine purchase was made at the tasting room, vineyard, or winery.
Table 6: Row percentages for the probability of household income groups making a wine purchase.
Percentage Within Income Categories That Purchased Wine
Did Not Purchase Wine Did Purchase Wine
≥ $175 K 25.66% 74.34%
$150 K - $174.99 K 26.15% 73.85%
$125 K - $149.99 K 26.19% 73.81%
$100 K - $124.99 K 30.00% 70.00%
$75 K - $99.99 K 35.54% 64.46%
$50 K - $74.99 K 31.97% 68.03%
$25 K - $49.99 K 38.16% 61.84%
< $25 K 23.81% 76.19%
Table 7: Average wine and total expenditure at tasting rooms, vineyards, and wineries by household income groups given a wine purchase was made.
Average Wine and Total Expenditure Given a Purchase Was Made
Average Wine Expenditure Average Total Expenditure
≥ $175 K $104.64 $126.50
$150 K - $174.99 K $77.81 $99.42
$125 K - $149.99 K $84.11 $125.02
$100 K - $124.99 K $84.86 $109.15
$75 K - $99.99 K $67.23 $79.04
$50 K - $74.99 K $55.24 $69.45
$25 K - $49.99 K $55.89 $93.51
< $25 K $55.88 $68.31

The Arizona Wine Tourism Industry – 2017
16
Length of Stay
If Arizona wine tourists spend the night in the region of the tasting room, vineyard, or winery, there is a greater economic benefit to the area stemming from the initial wine visit. This analysis is performed in more detail within the “Economic Impacts” section of this report. However, some of the summary statistics on overnight and day visitors are presented here. Approximately 57% of our survey respondents were day visitors with the remaining 43% being overnight visitors. Table 8 summarizes this count data. Day visitors spent on average 4.3 hours touring the region. On average, overnight visitors spent 4.3 days in the wine region. Approximately 43% of overnight visitors reported staying in hotels or motels with an additional 15% staying in a bed and breakfast. Vacation Rentals and staying with friends or family were other common lodging types with approximately 11% and 10% of the survey sample staying in these accommodations respectively.
Wine Tasting Preferences
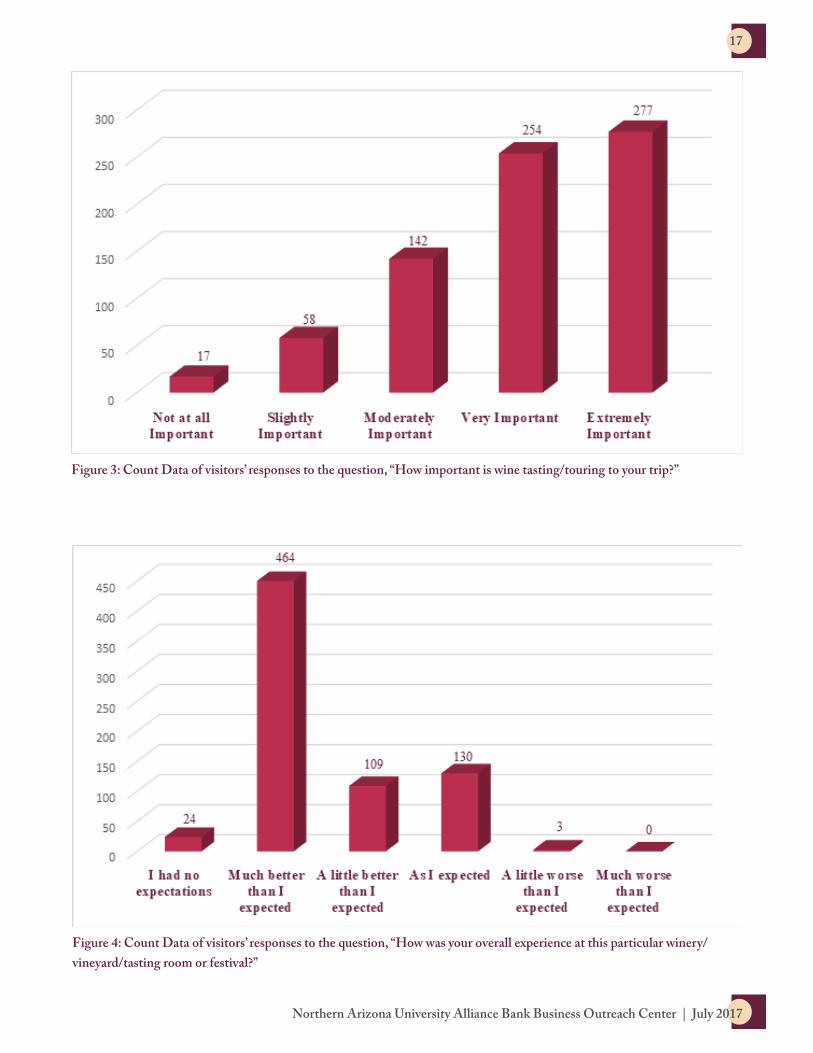
Many Arizona wine tourists stated that incorporating wine tasting or touring into their trip was at least “Very Important”. Approximately 71% of survey respondents answered the question, “How important is wine tasting/touring to your trip?” with “Very Important” or “Extremely Important”. Figure 3 shows the count data to the above question. Survey respondents were asked to identify any Arizona tasting room, vineyard, or winery they had visited in the past. In the Sonoita/Elgin region, Kief Joshua Vineyards had the largest number of previous visitations at over 28% of the sample. In the Willcox region, Flying Leap Vineyards had the largest proportion of previous visitations at over 16%. Finally, in the Verde Valley, Page Springs Cellars had the largest number of previous visitations at over 35% of visitors reporting they had previously been to that establishment. Arizona wine tourists appear to be satisfied with their wine tasting experience. Over 78% of
Arizona wine visitors rate their experience as “Much better than I expected” or “A little better than I expected”. Figure 4 shows the count data to the question, “How was your overall experience at this particular winery/vineyard/tasting room or festival?”
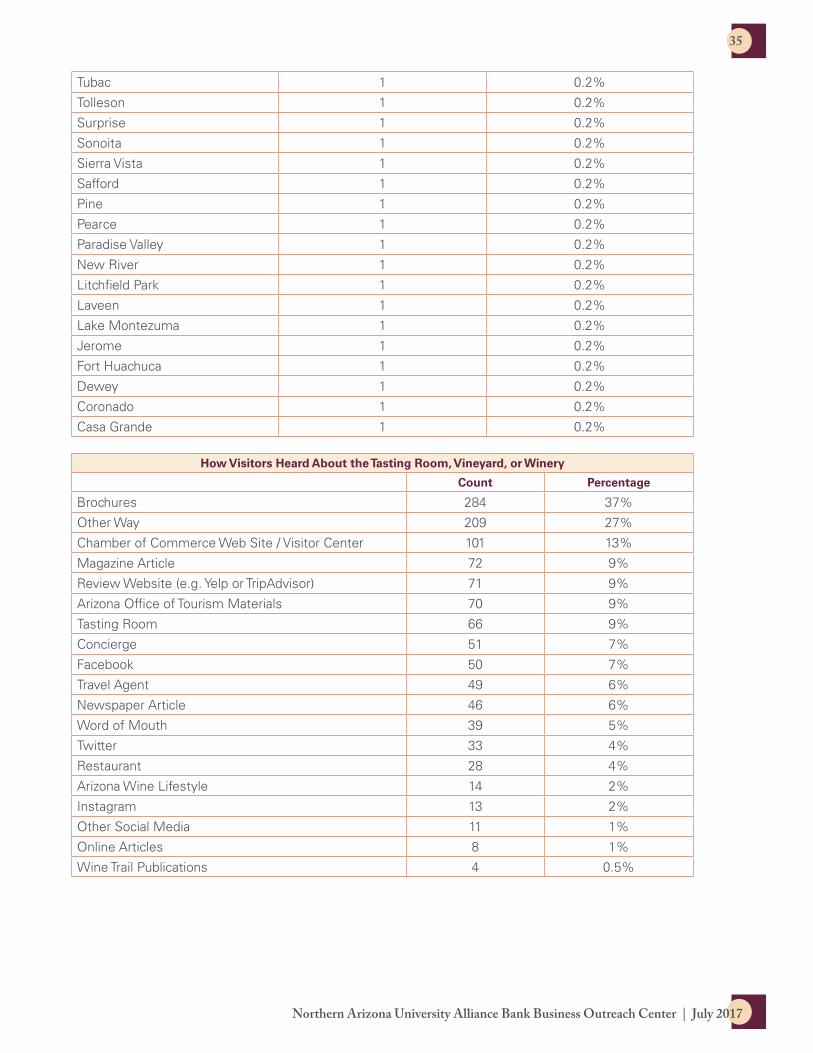
Tasting rooms, vineyards, and wineries can advertise their establishment in a number of ways. Our survey asked the question, “How did you hear about this winery/vineyard/tasting room? (Check all that apply)” to better understand how Arizona wine tourists are finding about the different establishments to visit. “Brochures” and “Other Way” were the most common methods survey respondents cited as knowing about the tasting room, vineyard, or winery. For the “Other Way” response, visitors could write in how they heard about the establishment. “Groupon” and “Google” were the most commonly stated “Other Way” responses. Table 9 lists the most common ways respondents heard about the establishment. A full table can be found in Appendix 1.
Table 8: Count and percentage data for the question, “How much time, in total, will you spend in this area? Hours (Day Visitors Only):___, Nights (Overnight Visitors Only):___”
Proportions of Day and Overnight Visitors
Count Percentage
Day Visitors 437 57.42%
Overnight Visitors 324 42.58%
Total 761 100%
Northern Arizona University Alliance Bank Business Outreach Center | July 2017
17
Figure 3: Count Data of visitors’ responses to the question, “How important is wine tasting/touring to your trip?”
Figure 4: Count Data of visitors’ responses to the question, “How was your overall experience at this particular winery/vineyard/tasting room or festival?”

The Arizona Wine Tourism Industry – 2017
18
Summary Statistics (Regional)
Visitor profiles vary considerably between the three major wine producing areas of Arizona. Of the demographic information collected from survey respondents, we analyze the differences in age, expenditures, overnight visitations, and incomes between the three regions and the overall averages. Our models for the probability and odds ratios of making a wine purchase or being an overnight visitor are based on the aggregate of all region. However, this information is provided to show regional differences in wine tourists. The overall statistics are largely influenced by the Verde Valley. 405 of the 761 analyzed were from Verde Valley sites with the Sonoita/Elgin area contributing 263 surveys and the Willcox area with 93.
Age
The average age of wine visitors across all regions was approximately 48 years. Wine visitors in the Willcox region were approximately six years older than the overall average with an average age of approximately 54 years. The average age of a wine visitor in the Sonoita/Elgin region was closest to the overall average age. Their average age was approximately a year and a half older than overall average. The average age of a Verde Valley wine visitor was 46 years, less than that of the overall average by more than two years. Figure 5 shows the differences in average ages of wine visitors.
Expenditure Patterns
Given a wine tourist bought a bottle of wine at a tasting room, vineyard, or winery, we calculated
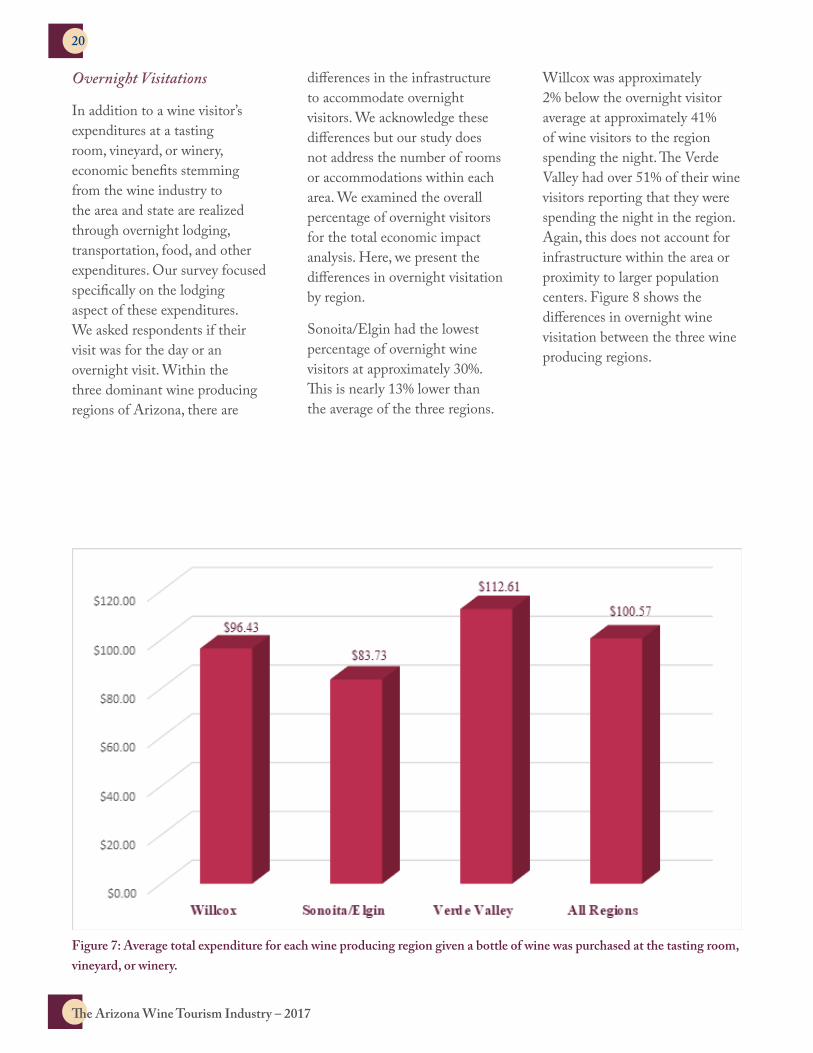
the average expenditure on wine and the average total expenditure. Total expenditure includes food or merchandise purchased in addition to wine. This analysis is shown by region but does not take into account the average price of wine by region or site specific. The Verde Valley had the highest average wine and total expenditure of the three regions. Over two thirds of wine visitors in the Verde Valley made a wine purchase with an average wine purchase of approximately $84 and an average total expenditure of approximately $113. The Willcox region had over 75% of visitors reporting a wine purchase. The average wine expenditure in the Willcox region was approximately $75 with an average total expenditure of approximately $96. The Sonoita/Elgin region had the lowest average and total expenditures.
Table 9: Count Data of visitors’ responses to the question, “How did you hear about this winery/vineyard/tasting room?” Visitors could select more than one option. Percentages represent proportions of survey respondents that used the information source. The table was amended to show ways that received at least a 5% rate. Full table can be found in Appendix 1.
How Visitors Heard About the Tasting Room, Vineyard, or Winery
Count Percentage
Brochures 284 37%
Other Way 209 27%
Chamber of Commerce Web Site / Visitor Center 101 13%
Magazine Article 72 9%
Review Website (e.g. Yelp or TripAdvisor) 71 9%
Arizona Office of Tourism Materials 70 9%
Tasting Room 66 9%
Concierge 51 7%
Facebook 50 7%
Travel Agent 49 6%
Newspaper Article 46 6%
Word of Mouth 39 5%

Northern Arizona University Alliance Bank Business Outreach Center | July 2017
19
Over 68% of wine visitors in this region purchased a bottle of wine with an average wine
expenditure of approximately $68 and an average total expenditure
Figure 5: Average age of wine visitors by region.
at around $84. Figures 6 and 7 summarize this data.
Figure 6: Average expenditure on wine for each wine producing region given a bottle of wine was purchased at the tasting room, vineyard, or winery.
The Arizona Wine Tourism Industry – 2017
20
Overnight Visitations
In addition to a wine visitor’s expenditures at a tasting room, vineyard, or winery, economic benefits stemming from the wine industry to the area and state are realized through overnight lodging, transportation, food, and other expenditures. Our survey focused specifically on the lodging aspect of these expenditures. We asked respondents if their visit was for the day or an overnight visit. Within the three dominant wine producing regions of Arizona, there are
differences in the infrastructure to accommodate overnight visitors. We acknowledge these differences but our study does not address the number of rooms or accommodations within each area. We examined the overall percentage of overnight visitors for the total economic impact analysis. Here, we present the differences in overnight visitation by region.
Sonoita/Elgin had the lowest percentage of overnight wine visitors at approximately 30%. This is nearly 13% lower than the average of the three regions.
Willcox was approximately 2% below the overnight visitor average at approximately 41% of wine visitors to the region spending the night. The Verde Valley had over 51% of their wine visitors reporting that they were spending the night in the region. Again, this does not account for infrastructure within the area or proximity to larger population centers. Figure 8 shows the differences in overnight wine visitation between the three wine producing regions.
Figure 7: Average total expenditure for each wine producing region given a bottle of wine was purchased at the tasting room, vineyard, or winery.

Northern Arizona University Alliance Bank Business Outreach Center | July 2017
21
Figure 8: Percentage of overnight wine visitors for each wine producing area.
Figure 9: Percentage of wine visitors with an income of $150,000 or above.

The Arizona Wine Tourism Industry – 2017
22
Income
Our logistical regression models in the probabilities and odds ratios section use income as a predictor variable in determining wine purchases and overnight visitation. Here, we give a breakdown of income categories amongst the three regions. Our survey had income divided into eight categories respondents could classify between. The categories were in $25,000 increments ranging from “less than $25,000” to “$175,000 or above”. For this analysis, we combined income groups into four $50,000 increments ranging from “less than $50,000” to “$150,000 or above”.
For the Willcox region, the “$50,000 – $99,999” income
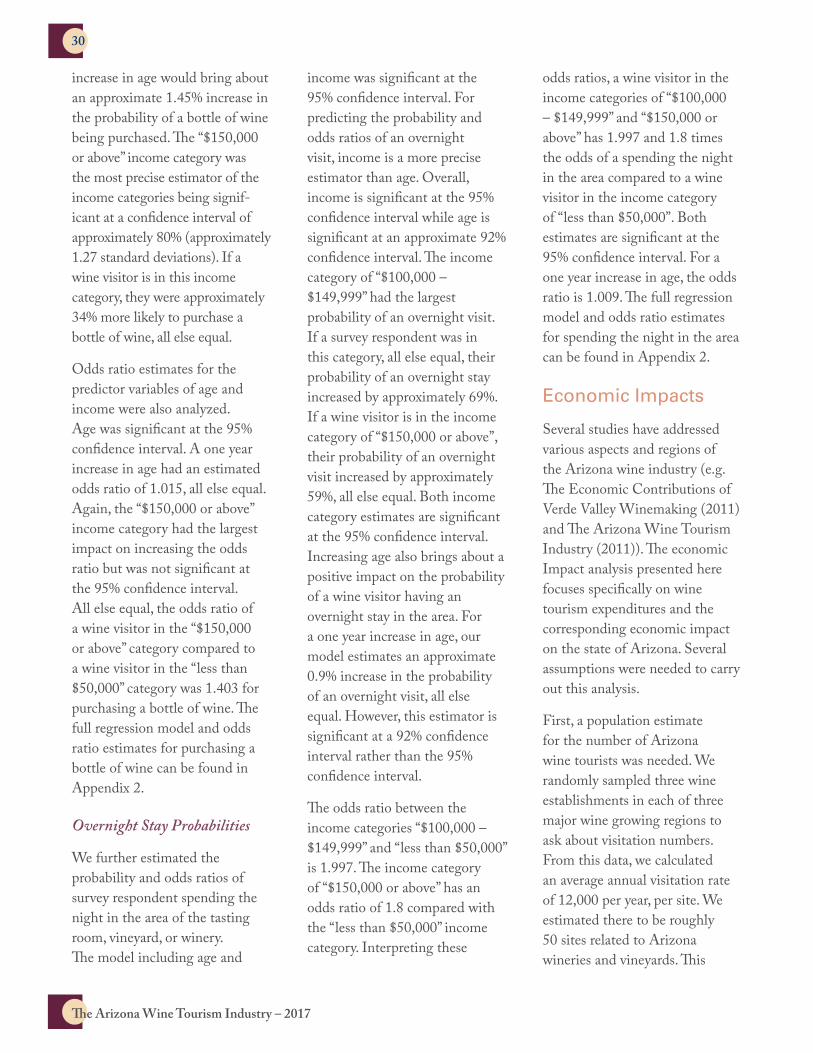
category comprised the largest segment of wine visitors at approximately 39% of visitors to the region. The next most common income group to the Willcox region were visitors in the “$100,000 – $149,999” income group which accounted for 31% of the wine visitors. The “$150,000 or above” and “less than $50,000” completed the wine visitors to Willcox at approximately 16% and 14% respectively.
In the Sonoita/Elgin wine region, the largest income group also fell into the category of “$50,000 – $99,999” at approximately 34%. The “$100,000 – $149,999” followed up at approximately 28% of wine visitors to the region. Finally, the “$150,000 or above” and “less than $50,000”
comprised approximately 24% and 15% of wine visitors to the Sonoita/Elgin region.
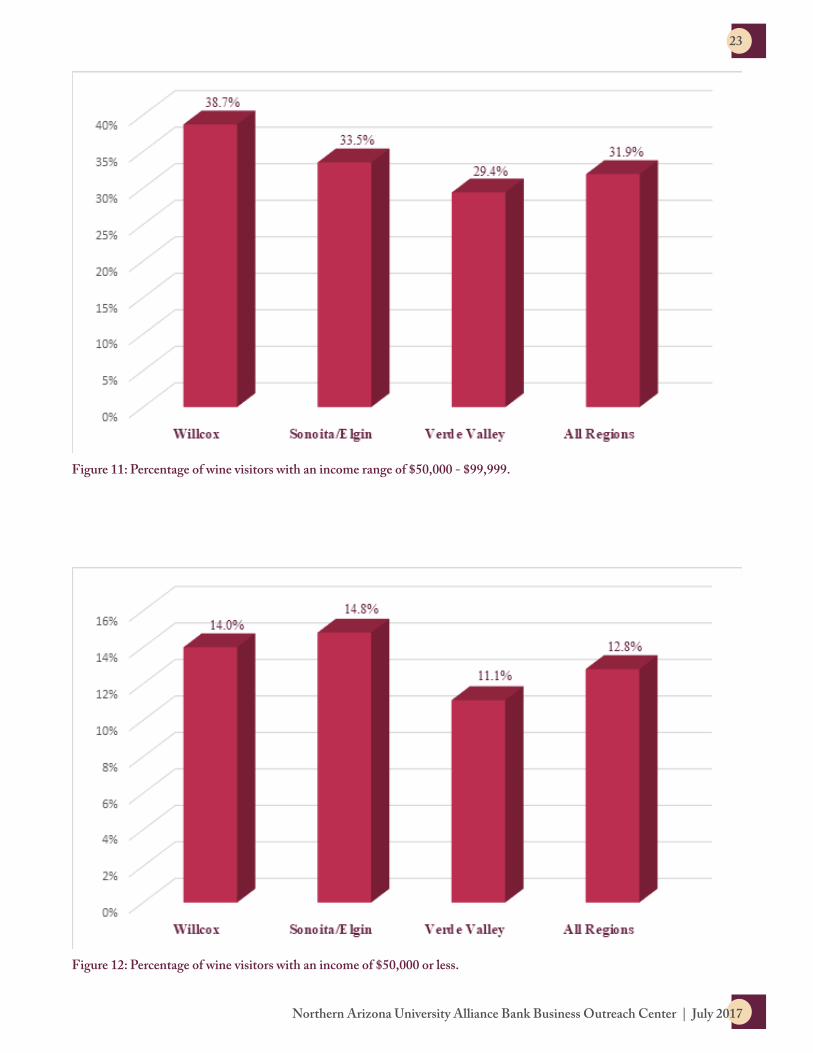
The Verde Valley attracted more affluent wine visitors with the “$150,000 or above” income group being the largest at approximately 34% of their wine visitors. The “$50,000 – $99,999” and “$100,000 – $149,999” income groups comprised approximately 29% and 25% of wine visitors to the area. The “less than $50,000” income group was again the smallest contingency at approximately 11% of the Verde Valley’s wine visitors. Figures 9 – 12 show the percentage of each income as a portion of total wine visitors to each region.
Figure 10: Percentage of wine visitors with an income range of $100,000 - $149,999.
Northern Arizona University Alliance Bank Business Outreach Center | July 2017
23
Figure 11: Percentage of wine visitors with an income range of $50,000 - $99,999.
Figure 12: Percentage of wine visitors with an income of $50,000 or less.

The Arizona Wine Tourism Industry – 2017
24
2011 – 2017 Comparison
The following section compares the 2011 study of wine tourism with the 2017 study. We examine summary statistics between the two studies that were obtained from survey respondents. There are two major differences between 2011 and 2017 studies. First, specific wine visitors’ motivation questions were removed from the 2017 study. Second, individual
visitor spending outside of the winery was removed in favor of secondary data in the 2017 study.
Places of Origin for Arizona Wine Tourists
Arizona visitors are the bellwether for wine tourism in the state. The proportion of Arizona wine visitors has remained about the same between 2017 and 2011 with the overall percentages being
58% and 59% respectively. Wine visitors from Canada represented approximately 2% of total wine visitors to Arizona in 2017. This group was not considered in the overall proportions in the 2011 study. Apart from Canada, the top places of origin for out-of-state Arizona wine visitors has changed in order but the states themselves haven’t changed drastically in proportions. Indiana was a top ten state of origin in 2017 but was much lower in
Table 10: Comparison of state of origin of wine tourism visitors for 2017 and 2011. Numbers in parenthesis represent the rank in 2011.
Top Places of Origin for Arizona Wine Tourism Comparison
2017 2011
Arizona 58% 59% (1)
Illinois 6% 4% (5)
California 5% 8% (2)
Wisconsin 4% 7% (3)
New York 3% 2% (8)
Washington 3% 4% (4)
Canada 2% -
Colorado 2% 1% (10)
Texas 2% 2% (7)
Indiana 1% 0% (20)
Table 11: Comparison of cities of origin within Arizona for wine tourism visitors between 2017 and 2011. Numbers in parenthesis represent the rank in 2011.
Top Cities of Origin in Arizona for Wine Tourism Comparison
2017 2011
Phoenix 15% 21% (1)
Tucson 14% 9% (3)
Scottsdale 8% 9% (2)
Mesa 6% 4% (6)
Chandler 3% 5% (5)
Rincon 3% 2% (20)
Peoria 3% 1% (37)
Corona de Tucson – Vail 3% 3% (8)
Tempe 3% 3% (11)
Glendale 2% 2% (16)

Northern Arizona University Alliance Bank Business Outreach Center | July 2017
25
rank in 2011. However, only 1% of total visitors originated from there in 2017 with less than 1% originating from there in 2011 (less than a 1% change). Table 10 summarizes the top 10 places of origin in 2017 and the proportion of visitors that originate from that place compared with 2011.
Within the state of Arizona, Phoenix continues to be the in-state place of origin where most wine visitors originate. Given its population density, this is not surprising. Here, we look at individual cities of origin rather than aggregating to “greater metro areas” as we did in the summary statistics. Phoenix (15% in 2017) has decreased by approximately a third in terms of proportion of wine visitors within Arizona. Scottsdale and Tucson have remained as top cities of origin with Tucson increasing by about 5% and Scottsdale decreasing by about 1%. Comparing the proportion of in-state wine visitors in 2017, 60% were from those two cities while in 2011, 59% came from those two cities.
Table 11 compares the top 10 cities of origin within Arizona in 2017 with the same cities from the 2011 study.
Repeat Wine Visitors
In the 2017 study, approximately 76% of survey respondents stated they had visited an Arizona tasting room, vineyard, or winery within the last 12 months. This proportion is up from the 2011 study. Approximately 71% of survey respondents in 2011 stated they had visited an Arizona tasting room, vineyard, or winery within the last 12 months. In addition to a higher proportion of wine visitors having previously experienced an Arizona tasting room, vineyard, or winery in 2017 than 2011, a higher proportion of wine visitors had previously visited the site where they took the survey in 2017 than in 2011. Approximately 38% of 2017 wine visitors said they had visited the establishment in the past compared to about 31% in 2011. Given the passage of time and high proportion of in-state visitors, it follows that more repeat visitors could be expected at Arizona wine establishments.
Party Type, Age, and Composition
Wine visitors traveling with a “Family Only” party increased by approximately 8% from 2011 to 2017. The party types of “Family & Friends”, “Friends Only”, and “Business Associates” decreased by approximately 3% each between the two studies. The other two party types remained relatively unchanged. Table 12 summarizes these comparisons.
The average age of an Arizona wine visitor in 2017 was approximately 48 years old. This is up from the 2011 study where the average age of a wine visitor was approximately 46 years old. When comparing gender between the two studies, we were unable to examine the “children” category as there was no distinction between male and female kids for survey respondents. Under this distinction, wine visitors to Arizona in 2017 were more balanced in terms of men and women in the party compared with the 2011 study. Approximately 58% of parties in 2017 were women compared to a 68% composition in 2011;
Table 12: Comparison of the approximate proportions of party types between 2017 and 2011
Arizona Wine Tourist Party Type Comparison
2017 2011
Family & Friends 28% 31%
Family Only 45% 37%
Friends Only 23% 26%
Traveling Alone 3% 3%
Organized Tour Group 1% 1%
Business Associates 0% 3%

The Arizona Wine Tourism Industry – 2017
26
this leaves a party composition of approximately 42% men for 2017 and 32% men for 2011.
Party size between the two studies didn’t change dramatically; however, party composition did show some interesting changes. Average party size, including men, women, and children, was approximately 3 in the 2017 study compared to an average party size of
approximately 3.1 in the 2011 study. Overall, average number of men, women, and children in the parties was down compared to the 2011 study. While the average number of children in the party was down in the 2017 study, the proportion of parties traveling with children was up. However, several distinctions should be made. The 2017 didn’t distinguish between “children under 18
years old” and “children”. Survey respondents could have indicated they were traveling with “children” but the children could have been over the age of 18 in the 2017 study. Given this distinction, approximately 6% of parties traveled with children in the 2017 study compared with 3% in the 2011 study. Table 13 summarizes the party composition comparisons.
Table 13: Comparison of the approximate proportions of party types between 2017 and 2011.
Party Composition Comparison
2017 2011
Average Number in Party 3 3.1
Average Number of Men 1.2 1.6
Average Number of Women 1.7 1.9
Average Number of Children Under 18 Years Old - 1.9
Average Number of Children 0.1 -
Percent of Parties with Children 6% 3%
Figure 13: Percentage of wine visitors in amended income categories for the 2017 study.

Northern Arizona University Alliance Bank Business Outreach Center | July 2017
27
Income and Expenditure Patterns
Direct comparisons between household incomes are difficult to compare between the 2017 and 2011 studies. The 2017 study utilized eight income categories in $25,000 increments. Seven income categories in $20,000 increments were used in the 2011 study. For comparison, the four upper income categories in the 2017 study are combined. In the 2011 study, the two upper income categories are combined to make the top end income category “$100,000 or above”. Within this modification, approximately 56% of survey respondents in the 2017 study reported an income of $100,000 or more compared
to approximately 48% in the 2011 study. In the lower income categories, approximately 3% of survey respondents reported a household income of “Less than $25,000” in 2017 compared with approximately 1% of wine visitors reporting a household income of “Less than $20,000” in 2011. Figures 13 and 14 can be used to draw comparisons between income groups in the 2017 and 2011 studies at the reader’s discretion.
Proportions of wine visitors making purchases at tasting rooms, vineyards, and wineries remains unchanged at approximately 70% between the 2017 and 2011 studies. However, there were declines in the average
number of bottles purchased per party and in the average dollar value spent on wine per party. The average number of bottles of wine purchased per party in 2017 was approximately 2 compared with approximately 3.3 per party in 2011. Average expenditure on wine per party at the establishments was also down between the 2017 and 2011 studies. Average per party expenditure on wine was approximately $55 in the 2017 study and approximately $70 from 2011. Because of differences in the phrasing of questions on food and merchandise expenditure between the two studies, total expenditure is not compared.
Figure 14: Percentage of wine visitors in amended income categories for the 2011 study.

The Arizona Wine Tourism Industry – 2017
28
Overnight Visitation
In 2011, almost two-thirds (approximately 61%) of wine tourism visitors were on a day trip, while the remainder (approximately 39%) stayed overnight. In 2017, there was an increase in the proportion of wine visitors spending the night in the wine region. Approximately 43% of Arizona wine visitors reported spending the night, with the remaining 57% being day trippers. Table 14 gives the percentage of day and overnight visitors for the two studies.
In 2011, the average length stay for a day trip visitor was 4.7 hours, while the average length of overnight trips was 2.9 nights. In 2017, the average length of stay for a day trip wine visitor declined slightly to 4.3 hours. However, the average length of
overnight trips increased from 2.9 nights to 4.3 nights. Table 15 shows this comparison.
Advertising for Arizona Wineries
Information sources change constantly and those focused on travel information are no exception. A majority of the Arizona wine information sources were comparable between the 2017 and 2011 studies; however, social media and other internet sources have grown in popularity and were not considered in the 2011 study. Survey respondents could select multiple sources of information on the survey so the percentages represent proportions of Arizona wine visitors who used a given information source.
Brochures remain the most common source of advertising
for Arizona wine tourism. The proportion of wine visitors who heard about Arizona wine establishments through brochures grew in 2017 to approximately 37% from approximately 32% in 2011. Combining social media sources of information on the 2017 survey yields approximately 27% (not including “Other Way” on-line sources) of respondents gaining information on Arizona wine establishments through social media. Approximately 8% of information sources were cited as “Social Media” in the 2011 study. While not a direct comparison, Arizona Wines and Vines was an important information source in 2011 accounting for approximately 20% of information sources, the magazine is no longer published and was compared to Arizona Wine Lifestyle which does
Table 14: Comparison of the approximate proportions of day and overnight visitors between 2017 and 2011.
Proportions of Day and Night Visitors Compared
2017 2011
Day Trip 57% 61%
Overnight Trip 43% 39%
Table 15: Comparison of the average length of stay for day and overnight visitors between 2017 and 2011.
Average Length of Stay Comparison
2017 2011
Average Day Trip Length of Stay 4.3 hours 4.7 hours
Average Overnight Length of Stay 4.3 days 2.9 days

Northern Arizona University Alliance Bank Business Outreach Center | July 2017
29
not appear to be widely used. Table 16 summarizes the top 10 information sources from the 2017 study with the 2011 study.
Experience
Arizona wine visitors continue to highly rate their wine experience. However, in 2017, approximately 64% of wine visitors rated their experience as “Much better than I expected”, down from approximately 67% in 2011. The proportion of survey respondents who rated their experience as “A little better than I expected” was also down in the 2017 study at approximately 15% from approximately 16% in 2011. In 2011, approximately 2% of respondents had a negative experience at an Arizona wine establishment. This percentage also fell in the 2017 study to below 0.5% of respondents having “A little worse than I expected” or “Much worse than I expected” experience.
Odds Ratios and Purchasing Probabilities
Purchase Probabilities
Our analysis implemented the demographic information obtained from survey respondents to predict changes in probabilities of purchasing wine and spending the night in the wine region. The three predictor variables we examined for correlations with wine expenditures and overnight visitation were age, income, and the composition of the party (e.g. men, women, children, and the various possible combinations). We did not find party composition to be significant in predicting the probability of a wine purchase or the visitor spending the night in the wine region at the 95% confidence interval. However, age and some categories of income were significant predictors.
Age was treated as a continuous variable while income was analyzed as a categorical variable. In our survey, income had eight categories the respondent could select from. The categories were in $25,000 increments that ranged from “Less than $25,000” to “$175,000 or above”. For our logistical regression model, income categories from the survey were grouped together to create four income categories in $50,000 increments ranging from “Less than $50,000” to $150,000 or above”.
With respect to predicting the probability of a survey respondent purchasing a bottle of wine at the tasting room, vineyard, or winery, the model including age and income was significant at the 95% confidence interval. However, age is a more precise estimator than income and is significant at the 95% confidence interval. All else equal, a one year
Table 16: Comparison of the top 10 information sources about Arizona wine establishments between 2017 and 2011. Numbers in parenthesis represent the rank in the 2011 study.
How Visitors Heard About the Establishment Comparison
2017 2011
Brochures 37% 32% (1)
Other Way 27% 1% (12)
Chamber of Commerce Web Site / Visitor Center 13% -
Magazine Article 9% 8% (8)
Review Website (e.g. Yelp or TripAdvisor) 9% 24% (2)
Arizona Office of Tourism Materials 9% 2% (11)
Tasting Room 9% -
Concierge 7% 14% (4)
Facebook 7% -
Travel Agent 6% -
The Arizona Wine Tourism Industry – 2017
30
increase in age would bring about an approximate 1.45% increase in the probability of a bottle of wine being purchased. The “$150,000 or above” income category was the most precise estimator of the income categories being signif-icant at a confidence interval of approximately 80% (approximately 1.27 standard deviations). If a wine visitor is in this income category, they were approximately 34% more likely to purchase a bottle of wine, all else equal.
Odds ratio estimates for the predictor variables of age and income were also analyzed. Age was significant at the 95% confidence interval. A one year increase in age had an estimated odds ratio of 1.015, all else equal. Again, the “$150,000 or above” income category had the largest impact on increasing the odds ratio but was not significant at the 95% confidence interval. All else equal, the odds ratio of a wine visitor in the “$150,000 or above” category compared to a wine visitor in the “less than $50,000” category was 1.403 for purchasing a bottle of wine. The full regression model and odds ratio estimates for purchasing a bottle of wine can be found in Appendix 2.
Overnight Stay Probabilities
We further estimated the probability and odds ratios of survey respondent spending the night in the area of the tasting room, vineyard, or winery. The model including age and
income was significant at the 95% confidence interval. For predicting the probability and odds ratios of an overnight visit, income is a more precise estimator than age. Overall, income is significant at the 95% confidence interval while age is significant at an approximate 92% confidence interval. The income category of “$100,000 – $149,999” had the largest probability of an overnight visit. If a survey respondent was in this category, all else equal, their probability of an overnight stay increased by approximately 69%. If a wine visitor is in the income category of “$150,000 or above”, their probability of an overnight visit increased by approximately 59%, all else equal. Both income category estimates are significant at the 95% confidence interval. Increasing age also brings about a positive impact on the probability of a wine visitor having an overnight stay in the area. For a one year increase in age, our model estimates an approximate 0.9% increase in the probability of an overnight visit, all else equal. However, this estimator is significant at a 92% confidence interval rather than the 95% confidence interval.
The odds ratio between the income categories “$100,000 – $149,999” and “less than $50,000” is 1.997. The income category of “$150,000 or above” has an odds ratio of 1.8 compared with the “less than $50,000” income category. Interpreting these
odds ratios, a wine visitor in the income categories of “$100,000 – $149,999” and “$150,000 or above” has 1.997 and 1.8 times the odds of a spending the night in the area compared to a wine visitor in the income category of “less than $50,000”. Both estimates are significant at the 95% confidence interval. For a one year increase in age, the odds ratio is 1.009. The full regression model and odds ratio estimates for spending the night in the area can be found in Appendix 2.
Economic Impacts
Several studies have addressed various aspects and regions of the Arizona wine industry (e.g. The Economic Contributions of Verde Valley Winemaking (2011) and The Arizona Wine Tourism Industry (2011)). The economic Impact analysis presented here focuses specifically on wine tourism expenditures and the corresponding economic impact on the state of Arizona. Several assumptions were needed to carry out this analysis.
First, a population estimate for the number of Arizona wine tourists was needed. We randomly sampled three wine establishments in each of three major wine growing regions to ask about visitation numbers. From this data, we calculated an average annual visitation rate of 12,000 per year, per site. We estimated there to be roughly 50 sites related to Arizona wineries and vineyards. This
Northern Arizona University Alliance Bank Business Outreach Center | July 2017
31
yields a total Arizona wine visitor population of 600,000 visitors. Our survey was conducted on a per party basis with party size averaging three persons per party. Applying this to our population estimate, we calculate 200,000 parties visiting Arizona wine establishments per year.
Next, an estimate for several expenditure types needed to be derived. For these estimates Longwoods International, Arizona, 2015 Visitor Report (Longwoods 2015) was used. $232 per party was used as the estimate for lodging and $171 per party was the estimate for food expenditures. Expenditures
at Arizona wine establishments were derived from our survey.
Lastly, we combined Longwoods’ (2015) expenditure data with our population estimates and survey results to obtain Arizona wine visitor expenditures. From our survey data, 43% of wine visitors were spending the night in the wine region. Of the 86,000 overnight parties, 32% of these parties are estimated to spend the night with friends and family or have their own accommodations (Longwoods 2015). This yields 58,480 parties that need some type of paid accommodation. 86,000 overnight parties were used to calculate overnight food and beverage expenditures.
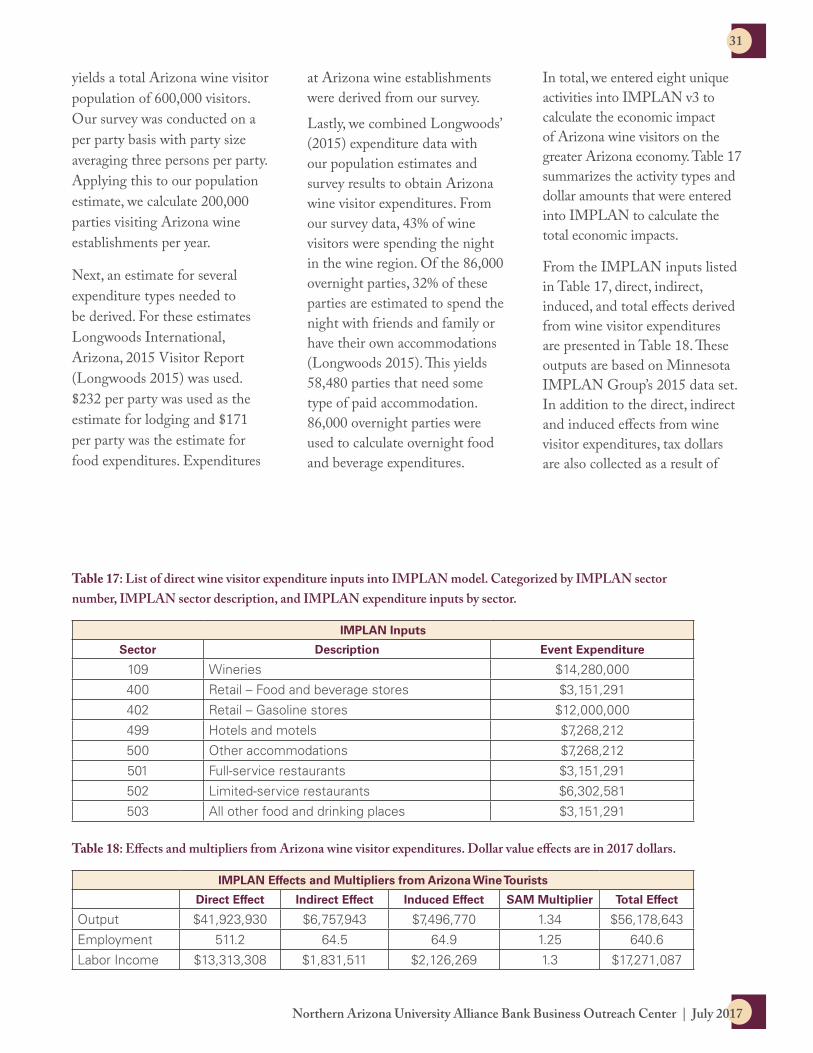
In total, we entered eight unique activities into IMPLAN v3 to calculate the economic impact of Arizona wine visitors on the greater Arizona economy. Table 17 summarizes the activity types and dollar amounts that were entered into IMPLAN to calculate the total economic impacts.
From the IMPLAN inputs listed in Table 17, direct, indirect, induced, and total effects derived from wine visitor expenditures are presented in Table 18. These outputs are based on Minnesota IMPLAN Group’s 2015 data set. In addition to the direct, indirect and induced effects from wine visitor expenditures, tax dollars are also collected as a result of
Table 17: List of direct wine visitor expenditure inputs into IMPLAN model. Categorized by IMPLAN sector number, IMPLAN sector description, and IMPLAN expenditure inputs by sector.
IMPLAN Inputs
Sector Description Event Expenditure
109 Wineries $14,280,000
400 Retail – Food and beverage stores $3,151,291
402 Retail – Gasoline stores $12,000,000
499 Hotels and motels $7,268,212
500 Other accommodations $7,268,212
501 Full-service restaurants $3,151,291
502 Limited-service restaurants $6,302,581
503 All other food and drinking places $3,151,291
Table 18: Effects and multipliers from Arizona wine visitor expenditures. Dollar value effects are in 2017 dollars.
IMPLAN Effects and Multipliers from Arizona Wine Tourists
Direct Effect Indirect Effect Induced Effect SAM Multiplier Total Effect
Output $41,923,930 $6,757,943 $7,496,770 1.34 $56,178,643
Employment 511.2 64.5 64.9 1.25 640.6
Labor Income $13,313,308 $1,831,511 $2,126,269 1.3 $17,271,087

The Arizona Wine Tourism Industry – 2017
32
these economic activities. Table 19 distinguishes the various sectors and amounts of state and local tax collections resulting from wine visitor expenditures and the carry on effects of that economic activity.
Our IMPLAN analysis for the 2017 Arizona wine tourism industry estimates a total economic contribution of $56,178,643 and 640.6 full-time equivalent jobs created. From this direct, indirect, and induced economic activity, approximately $3.6 million in local and state taxes are collected. In comparison to the 2011 study, the total economic impacts from tourism aspects of the wine industry have increased from approximately $37.6 million to approximately $56.2 million. This represents about a 49.3% increase in total economic activity over a six-year period. Our IMPLAN analysis also estimates 236 additional jobs created through Arizona wine tourism since 2011. This is a substantial economic driver of markets located outside of major population centers.
Table 19: Breakdown of total state and local taxes by sector from IMPLAN analysis. Taxes are reported in 2017 dollars.
State and Local Tax Implications of Arizona Wine Visitor Expenditures
Employee
Compensation
Tax on Production
and ImportsHouseholds Corporations Total
Total State and Local Tax $64,318 $3,190,929 $285,372 $38,964 $3,579,583

Northern Arizona University Alliance Bank Business Outreach Center | July 2017
33
Appendix 1
Place of Origin
Count Percentage (%)
Arizona 426 56.6%
Illinois 43 5.7%
California 35 4.6%
Wisconsin 31 4.1%
New York 20 2.7%
Washington 20 2.7%
Canada 18 2.4%
Colorado 17 2.3%
Texas 14 1.9%
Indiana 9 1.2%
Florida 8 1.1%
Ohio 8 1.1%
Nevada 7 0.9%
North Carolina 7 0.9%
Utah 7 0.9%
Iowa 6 0.8%
Massachusetts 6 0.8%
Michigan 6 0.8%
New Mexico 6 0.8%
New Jersey 5 0.7%
Pennsylvania 5 0.7%
Idaho 4 0.5%
Maryland 4 0.5%
Montana 4 0.5%
Nebraska 4 0.5%
Virginia 4 0.5%
Kansas 3 0.4%
Louisiana 3 0.4%
Tennessee 3 0.4%
Oregon 2 0.3%
Scotland 2 0.3%
South Dakota 2 0.3%
Washington DC 2 0.3%
Alabama 1 0.1%
Alaska 1 0.1%
Arkansas 1 0.1%
Connecticut 1 0.1%
Delaware 1 0.1%
Georgia 1 0.1%
Kentucky 1 0.1%
New Hampshire 1 0.1%
Mexico 1 0.1%
North Dakota 1 0.1%
South Carolina 1 0.1%
West Virginia 1 0.1%

The Arizona Wine Tourism Industry – 2017
34
City of Origin for Arizona Wine Visitors
Count Percentage
Phoenix 60 14.6%
Tucson 57 13.9%
Scottsdale 34 8.3%
Mesa 23 5.6%
Chandler 14 3.4%
Rincon 13 3.2%
Peoria 13 3.2%
Corona de Tucson – Vail 13 3.2%
Tempe 11 2.7%
Glendale 10 2.4%
Sun City 9 2.2%
Fry 9 2.2%
Green Valley 8 2%
Fort Lowell 7 1.7%
Flagstaff 7 1.7%
Queen Creek 6 1.5%
Prescott 6 1.5%
Kino 6 1.5%
Saddlebrooke 5 1.2%
Gilbert 5 1.2%
Cottonwood 5 1.2%
Anthem – Desert Hills 5 1.2%
Sahuarita 4 1%
Oro Valley 4 1%
Marana 4 1%
Hereford 4 1%
Goodyear 4 1%
Cave Creek 4 1%
Bisbee 4 1%
Sedona 3 0.7%
Paul Spur 3 0.7%
Nogales 3 0.7%
Groom Creek 3 0.7%
Buckeye 3 0.7%
Benson 3 0.7%
Avondale 3 0.7%
Wickenburg 2 0.5%
Turkey Creek 2 0.5%
Payson 2 0.5%
Guadalupe 2 0.5%
Cortaro 2 0.5%
Waddell 1 0.2%
Northern Arizona University Alliance Bank Business Outreach Center | July 2017
35
Tubac 1 0.2%
Tolleson 1 0.2%
Surprise 1 0.2%
Sonoita 1 0.2%
Sierra Vista 1 0.2%
Safford 1 0.2%
Pine 1 0.2%
Pearce 1 0.2%
Paradise Valley 1 0.2%
New River 1 0.2%
Litchfield Park 1 0.2%
Laveen 1 0.2%
Lake Montezuma 1 0.2%
Jerome 1 0.2%
Fort Huachuca 1 0.2%
Dewey 1 0.2%
Coronado 1 0.2%
Casa Grande 1 0.2%
How Visitors Heard About the Tasting Room, Vineyard, or Winery
Count Percentage
Brochures 284 37%
Other Way 209 27%
Chamber of Commerce Web Site / Visitor Center 101 13%
Magazine Article 72 9%
Review Website (e.g. Yelp or TripAdvisor) 71 9%
Arizona Office of Tourism Materials 70 9%
Tasting Room 66 9%
Concierge 51 7%
Facebook 50 7%
Travel Agent 49 6%
Newspaper Article 46 6%
Word of Mouth 39 5%
Twitter 33 4%
Restaurant 28 4%
Arizona Wine Lifestyle 14 2%
Instagram 13 2%
Other Social Media 11 1%
Online Articles 8 1%
Wine Trail Publications 4 0.5%

The Arizona Wine Tourism Industry – 2017
36
Appendix 2Appendix 2
Probability of a visitor purchasing a bottle of wine: Pr�Purchase��0�011�0�0145��ge�0������1�Ifincomegreaterthan$150,000�� 0��15�1�Ifincome$100,000‐$149,999�� 0�0����1�Ifincome$50,000‐$99,999�
Testing Global Null Hypothesis: BETA=0
Test Chi-Square DF Pr > ChiSq
Likelihood Ratio 11.5980 4 0.0206
Score 11.6225 4 0.0204
Wald 11.4769 4 0.0217
Analysis of Maximum Likelihood Estimates
Parameter DF Estimate Standard Error
Wald Chi-Square
Pr > ChiSq
Intercept 1 0.0110 0.3150 0.0012 0.9720
Age 1 0.0145 0.00559 6.6854 0.0097
Income4 1 1 0.3388 0.2674 1.6054 0.2051
Income4 2 1 0.2150 0.2670 0.6484 0.4207
Income4 3 1 -0.0367 0.2563 0.0205 0.8861
Odds Ratio Estimates
Effect Point Estimate 95% Wald Confidence Limits
Age 1.015 1.004 1.026
Income4 1 vs 4 1.403 0.831 2.370
Income4 2 vs 4 1.240 0.735 2.092
Income4 3 vs 4 0.964 0.583 1.593

Northern Arizona University Alliance Bank Business Outreach Center | July 2017
37
Probability of an overnight visitation: �r�OvernightStay��‐1�1����0�00����Age�0�5��1�1�Ifincomegreaterthan
$150,000��0��914�1�Ifincome$100,000‐$149,999��0��19��1�Ifincome$50,000‐$99,999�
Testing Global Null Hypothesis: BETA=0
Test Chi-Square DF Pr > ChiSq
Likelihood Ratio 13.4251 4 0.0094
Score 13.1991 4 0.0103
Wald 12.9720 4 0.0114
Analysis of Maximum Likelihood Estimates
Parameter DF Estimate Standard Error
Wald Chi-Square
Pr > ChiSq
Intercept 1 -1.1827 0.3147 14.1231 0.0002
Age 1 0.00886 0.00521 2.8953 0.0888
Income4 1 1 0.5881 0.2610 5.0778 0.0242
Income4 2 1 0.6914 0.2627 6.9276 0.0085
Income4 3 1 0.3196 0.2586 1.5273 0.2165
Odds Ratio Estimates
Effect Point Estimate 95% Wald Confidence Limits
Age 1.009 0.999 1.019
Income4 1 vs 4 1.800 1.080 3.003
Income4 2 vs 4 1.997 1.193 3.341
Income4 3 vs 4 1.377 0.829 2.285