Comparison of two output based schemes in Butare and
45
Global Partnership on Output-Based Aid (GPOBA) World Bank Ministry of Health, Rwanda Comparison of two output based schemes in Butare and Cyangugu provinces with two control provinces in Rwanda Consisting of: Survey among 64 staff members Survey among 16 health centre chiefs (“titulaires”) Quality indicator survey in 16 health centres HMIS analysis in four provinces Analysis Butare, Antwerp & The Hague August 6, 2005 Authors: Robert Soeters Laurent Musango Bruno Meessen Final Version
Transcript of Comparison of two output based schemes in Butare and
Global Partnership on Output-Based Aid (GPOBA) World Bank
Ministry of Health, Rwanda
Comparison of two output based schemes in Butare and Cyangugu provinces with two control
provinces in Rwanda
Consisting of: Survey among 64 staff members Survey among 16 health centre chiefs (“titulaires”) Quality indicator survey in 16 health centres HMIS analysis in four provinces Analysis
Butare, Antwerp & The Hague August 6, 2005
Authors:
Robert Soeters
Laurent Musango Bruno Meessen
Final Version

Report on a comparative survey in 16 health centre in four Rwandese provinces page 2
Table of content
TABLE OF CONTENT ...................................................................................................................................... 2 ABBREVIATIONS ........................................................................................................................................... 3 1. INTRODUCTION .................................................................................................................................... 4
1.1 Methodology .............................................................................................................................. 4 2. DESCRIPTION OF THE FOUR PROVINCES ................................................................................................. 6
2.1 The contractual approach in Butare and Cyangugu Provinces .................................................... 6 2.2 Subsidies per indicator in each scheme ....................................................................................... 8 2.3 Control provinces Kibungo and Gikongoro................................................................................. 8
3. FINDINGS HEALTH WORKER SURVEY ..................................................................................................... 9 3.1 Health worker income ................................................................................................................ 9 3.2 Is there a relationship between performance and income? ........................................................ 11 3.3 Is the income sufficient? ........................................................................................................... 11 3.4 Staff participation in health centre management? ..................................................................... 12 3.5 Perception about work conditions and infrastructure ................................................................ 13 3.6 Hours of work, perception of workload and quality of work ...................................................... 13 3.7 Health Centre internal supervision ........................................................................................... 14 3.8 Health Centre external supervision ........................................................................................... 14 3.9 Health Centre technical meetings ............................................................................................. 15 3.10 Staff opinion in Gikongoro and Kibungo provinces about the contractual approach .................. 15 3.11 Staff opinion in Butare and Cyangugu provinces about the contractual approach...................... 16 3.12 Influence of the contractual approach on staff well-being and salary ........................................ 16 3.13 Influence of the contractual approach on work condition and service quality ............................ 17 3.14 Final observations by Gikongoro and Kibungo staff.................................................................. 17 3.15 Final observations by Butare and Cyangugu staff ..................................................................... 18
4. COMPARISON OF SUPERVISION PRACTICES IN THE FOUR PROVINCES...................................................... 20 4.1 Supervision by district health teams .......................................................................................... 20 4.2 Supervision by Kigali-based vertical programmes (PNILT,VCT, etc)......................................... 21 4.3 Supervision by international partner organizations ................................................................... 22 4.4 Visits by administrative district authorities ............................................................................... 23
5. COMPARISON OF HEALTH CENTRE REVENUES IN FOUR PROVINCES ........................................................ 24 5.1 Comparison revenues 2002 and 2004 per province ................................................................... 24 5.2 Summary, overall health centre revenues .................................................................................. 26 5.3 Community financing contributions to overall health centre revenues ....................................... 26 5.4 External subsidies in comparison with overall health centre revenues ....................................... 27 5.5 Satisfaction health centre titulaires with external financial support ........................................... 27 5.6 General observations respondents ............................................................................................ 28
6. COMPARISON OF PERSONNEL IN FOUR PROVINCES ............................................................................... 29 6.1 Total staff comparison .............................................................................................................. 29 6.2 Comparison of qualified staff presence in four provinces .......................................................... 30 6.3 Comparison government employed staff.................................................................................... 30
7. COMPARISON OF OUTPUT PERFORMANCE IN THE FOUR PROVINCES ....................................................... 31 7.1 Outpatient department consultancies ........................................................................................ 31 7.2 Institutional deliveries .............................................................................................................. 32 7.3 New family planning acceptors ................................................................................................. 33 7.4 Measles immunization coverage rate ........................................................................................ 34
8. HEALTH CENTRE QUALITY REVIEW ..................................................................................................... 35 9. FINDINGS AND RECOMMENDATIONS .................................................................................................... 37
9.1 Main findings ........................................................................................................................... 37 9.2 Main findings HMIS output and external support ...................................................................... 39 9.3 Recommendations .................................................................................................................... 41

Report on a comparative survey in 16 health centre in four Rwandese provinces page 3
Abbreviations CS Centre de santé EU European Union GPOBA Global Partnership on Output-Based Aid HMIS Health Management Information System HNI HealthNet International IUD Intra Uterine Device MPA Minimum Package of Activities NGO Non Governmental Organization OPD Out Patient Department PBF Performance Based Financing SIS Système d’Information Sanitaire TBA Traditional Birth Attendants VAR Vaccin Anti Rougeoleux VCT Voluntary Counseling and Testing

Report on a comparative survey in 16 health centre in four Rwandese provinces page 4
1. Introduction This is the report of a GPOBA study, solicited by the Ministry of Health and financed by the World Bank’s GPOBA initiative. It includes a survey among 64 health workers, a quality review in 16 health centres, a survey among 16 health centre chiefs or “titulaires”, and an analysis of the Health Management Information System (HMIS) output data. The report also contains a summary of findings and analysis with proposals for the avenues forward of performance based financing in Rwanda. The field work was conducted from May 5 to 13, 2005 in four provinces. The performance based schemes in Butare and Cyangugu provinces are the main experiences with performance based financing in Rwanda since 2001.
1.1 Methodology There were three researchers involved in this GPOBA study: Bruno Meessen initially prepared the study with the Ministry of Health and the World Bank and proposed the first draft of the questionnaires. Laurent Musango – Director of the Public Health School in Butare - and Robert Soeters – public health specialist and health economist further developed the questionnaires, pre-tested them, trained the interviewers, and carried out the surveys. Data cleaning and entry was done in Excel Spreadsheets and analysis was done by using the Excel database function. Miriam Schneidman from the World Bank selected the researchers because of their involvement in developing the performance based schemes in Butare and Cyangugu provinces since 2001. As such the researchers could enrich the study with their experience and make the study more useful for the Rwandese government. An additional advantage was that they could exchange experiences, study each other projects and arrive at common recommendations how to proceed with performance based financing (PBF) in Rwanda. The four interviewers of the survey were also selected from Butare and Cyangugu provinces. They were 3 district supervisors with a long experience in dealing with quality of services at health centre level, and one Cordaid supervisor involved in the community development aspects of the contractual approach. A survey was carried out among 16 health centres in four provinces of Rwanda by randomly selecting two public and two church based health centres in each province (see table 1).1 The at random selection of health centres in Butare province identified four health centres in Kabutare district and accidentally none in Gakoma district. Butare and Cyangugu were studied being the main two provinces in Rwanda applying performances based financing (PBF). Gikongoro and Kibungo provinces were selected as control provinces. Their inclusion was thought necessary to compare the results of Butare and Cyangugu provinces against confounding factors such as economic development, and support through other government efforts or donor organizations. Gikongoro province did not receive significant donor support, although it did receive during the period under study more government support than the other provinces in terms of salary payments. The government salary payments to the health centres in Gikongoro were in terms of funding superior to the combined support of donors and government in Butare province, but less than in Cyangugu province.
1 There are 17 church-based health centres on a total of 36 ‘Minimum Package of Activities’ (MPA) health centres in Butare Province. Church-based health centres account for 10 of the 23 MPA in Cyangugu Province.

Report on a comparative survey in 16 health centre in four Rwandese provinces page 5
Province District sanitaire Centre de Santé Statut FOSA Butare Kabutare Gisagara Agréé Simbi Agréé Rango Public Busoro Public Cyangugu Bushenge Muyangwe Agréé Bushenge Public Mibilizi Mushaka Agréé Bugarama Public Gikongoro Kigeme Ruramba Agréé Kitabi Public Kigeme Nyarusiza Public Kibeho Agréé Kibungo Kibungo Rukoma Sake Agréé Zaza Agréé Kukumberi Public Rwamagana Ruramira Public
Table 1: Health centres randomly selected from two contractual approach provinces (Butare and Cyangugu) and two control provinces (Kibungo and Gikongoro) Kibungo province benefited from European Union support since the late 1990s. The Kibungo project is implemented with technical assistance recruited by the Rwandese government and managed under the responsibility of the Belgium Technical Cooperation. The EU project supported Kibungo province as well as Umtare province during a 14 month period starting in February 2004. The budget of $ 2.25 million is comparable on a per capita basis to the Cyangugu budget – but superior to the Butare budgets. In each setting, except in Gikongoro province, there has been a preliminary identification mission and a subsequent budgeting for resources to operate the health facilities. Therefore, our study compares two different responses by different international aid agencies as well as by the Rwandese government to a same challenge: support for rural health systems. The Kibungo project represents the traditional donor input strategy or line item financing. Butare and Cyangugu offer an alternative: performance based financing (PBF). The government recruited and posted for Gikongoro province additional health workers. We selected randomly two public and two church-owned health centres in each province. In each health centre, four of the most qualified health workers were requested to participate in individual interviews. The interviews were conducted in a confidential setting. In those health centres, which did not have four qualified staff members, we requested unqualified staff to participate. If there were no four health workers present during the visit we also interviewed the health centre chief. We also conducted a quality survey in the 16 random selected health centres. This quality survey was conducted by one supervisor from Kibogora health district in Cyangugu province and an independent former supervisor from Butare province. These supervisors did not visit any health centre for which they were responsible and we stressed during their training the need for unbiased assessments. The HMIS output data from the 16 health centres was collected from the Ministry of Health in Kigali. We selected the following indicators: outpatient department (OPD) consultations, family planning first acceptors coverage rates, institutional delivery rates and anti measles immunization coverage from 2001, 2002, and 2004.

Report on a comparative survey in 16 health centre in four Rwandese provinces page 6
The semi structured interviews with the health centre chiefs or “titulaires” were done by Laurent Musango and Robert Soeters. They focused their data collection on supervision practices by district health teams, vertical programmes & partner organizations, the health centre revenues, the staffing patterns and general questions about their points of view concerning performance based financing. Our study has some methodological limits. First, this study is based on only 4 health centres per province (approximately 15% of all health centres). A larger sample would have been desirable, but time and budget constraints did not allow it. Although designed by purpose and that the researchers tried to limit this bias, a second possible limit comes from the fact that the research has been conducted by researchers and surveyors directly involved in the design or operation of the performance-based approach. Third, for several dimensions, our findings rely on opinions. Eventually, we acknowledge that some dimensions, such as the quality of care assessment, are based on a limited number of indicators. For all these reasons, the results should be interpreted carefully. Nevertheless, findings converge. We believe that the global picture coming out of the study confirms that performance contracting is a promising track for Rwanda.
1.2 Working assumptions for the study The first working assumption for this study is that the European Union supported Kibungo health centres will have similar results with the health centres in Cyangugu and Butare provinces if there is no efficiency difference between input or line item financing and performance based financing (PBF). The second working assumption is that Gikongoro health centres will have similar results as Butare and Cyangugu health centres if there is no efficiency difference between simply investing money into recruiting more government staff and investing money to purchase services on a performance basis.
2. Description of the four provinces
2.1 The contractual approach in Butare and Cyangugu Provinces In January 2001 the NGO HealthNet International put forward the idea of the contractual approach in its Butare Project. In February 2001 a small baseline study took place at household level as well as at health facility level followed by participative meetings in Butare and Kigali with health authorities and partner organizations. Two health districts were selected (Kabutare and Gakoma) and the payment of performance based subsidies started in 20 health centres early 2002.2 The HealthNet International projected ended in July 2004. In Cyangugu, contracting started one year later, equally with a baseline study in January 2002. During 2002, several introduction seminars took place with community representatives, provincial administrative authorities and health facility representatives. In September 2002, the Cyangugu provincial authority requested Cordaid to start with immediate effect in Bushenge and Gihundwe districts, followed in January 2003 with the remaining two health districts Mibilizi and Kibogora.
2 For a more extensive presentation, cf. Meessen B, Musango L and Kashala J-P, “L’Initiative pour la Performance”, HNI-MINISANTE, Kigali 2004.

Report on a comparative survey in 16 health centre in four Rwandese provinces page 7
While the Butare scheme has been limited in scope and coverage, the Cyangugu has been more intensive and extensive as shown in table 23. By December 2004 the following organizations were involved or under contract in Butare and Cyangugu provinces: Organisations sous contrats en 2004 Butare province Cyangugu province Fund Holder ou organisation d’appui internationale HealthNet Int Cordaid Organisation qui vérifie les données SIS (=HMIS) Ecole Santé Publ Cordaid Associations locales contractées pour la vérification et pour suivi de la satisfaction de la population
0 24
Equipes cadre de districts contractés 2 4 Hôpitaux de districts sanitaires contractés 0 4 Centres de Santé contractés 19 25 Dispensaires privés sous contractés 0 21 Postes de santés sous contractés 0 14 Population cible dans les zones de rayonnement CS 380.000 624.000
Table 2: Comparison contractual approach in Cyangugu and Butare provinces
In 2004, the Butare scheme (the “Performance Initiative”) had two district health management teams (Kabutare and Gakoma) and 19 health centres under performance-based contract. Butare Public Health School played a role for conducting verification patient’s surveys. The Butare scheme mainly received financial support from Swedish SIDA until mid-2004. HealthNet International initiated performance based financing in Butare with a very light set-up: their team only consisted of one coordinator, two support staff and external consultants. Mid-2004 this team left as funding had finished. The Butare scheme currently operates with a small remaining fund from the Swedish SIDA, which is managed by a Steering Committee.4
The Cyangugu scheme contracted the four health districts in the province as well as the four district hospitals. Furthermore, during the course of 2003 – 2004 the health centres signed sub-contracts with 14 health posts and 19 private dispensaries. The Cyangugu scheme also contracted 25 local community groups for conducting patient surveys for the verification of data as well as to strengthen the community voice by collecting information about patient satisfaction. The Cyangugu contractual approach programme benefited since 2002 from several financing sources such as Cyangugu Province, the Community Development Funds (through the administrative districts and their association ADVAS), UNFPA (reproductive health), the World Bank (HIV/SIDA) and funds from Cordaid, the Netherlands. The international NGO Cordaid initiated performance based financing in Cyangugu in 2002. Currently, the team organizing the contracting process consists of six Rwandese qualified staff, one expatriate public health specialist and two external consultants visiting the project on average twice per year. Six support staff members are attached to the team.
3 For a more extensive description of the Cyangugu experience consult the paper: Soeters,R; Perrot,J; Sekaganda, E; Lozito,A 2005 Purchasing health packages for the poor through performance based contracting. Which changes in the district health system does it require? 4 It is noteworthy that the departure of the technical assistance has not led to major trouble so far.
Report on a comparative survey in 16 health centre in four Rwandese provinces page 8
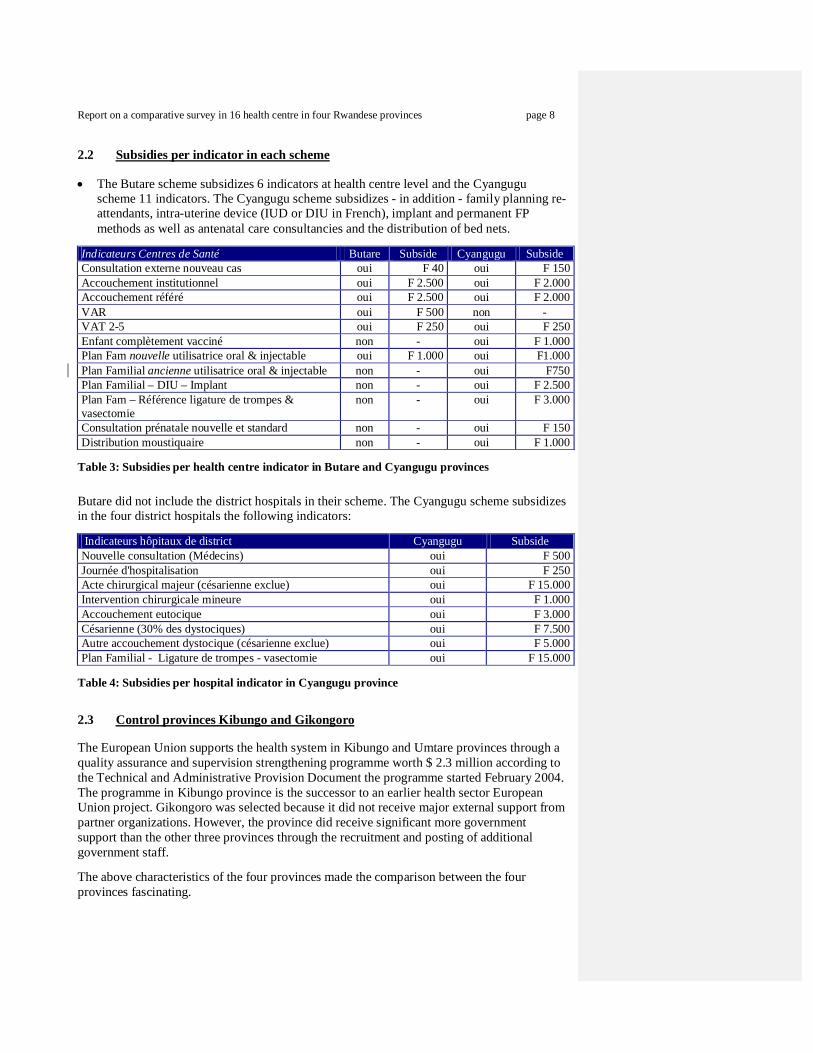
2.2 Subsidies per indicator in each scheme
The Butare scheme subsidizes 6 indicators at health centre level and the Cyangugu scheme 11 indicators. The Cyangugu scheme subsidizes - in addition - family planning re-attendants, intra-uterine device (IUD or DIU in French), implant and permanent FP methods as well as antenatal care consultancies and the distribution of bed nets.
Indicateurs Centres de Santé Butare Subside Cyangugu Subside Consultation externe nouveau cas oui F 40 oui F 150 Accouchement institutionnel oui F 2.500 oui F 2.000 Accouchement référé oui F 2.500 oui F 2.000 VAR oui F 500 non - VAT 2-5 oui F 250 oui F 250 Enfant complètement vacciné non - oui F 1.000 Plan Fam nouvelle utilisatrice oral & injectable oui F 1.000 oui F1.000 Plan Familial ancienne utilisatrice oral & injectable non - oui F750 Plan Familial – DIU – Implant non - oui F 2.500 Plan Fam – Référence ligature de trompes & vasectomie
non - oui F 3.000
Consultation prénatale nouvelle et standard non - oui F 150 Distribution moustiquaire non - oui F 1.000
Table 3: Subsidies per health centre indicator in Butare and Cyangugu provinces Butare did not include the district hospitals in their scheme. The Cyangugu scheme subsidizes in the four district hospitals the following indicators: Indicateurs hôpitaux de district Cyangugu Subside Nouvelle consultation (Médecins) oui F 500 Journée d'hospitalisation oui F 250 Acte chirurgical majeur (césarienne exclue) oui F 15.000 Intervention chirurgicale mineure oui F 1.000 Accouchement eutocique oui F 3.000 Césarienne (30% des dystociques) oui F 7.500 Autre accouchement dystocique (césarienne exclue) oui F 5.000 Plan Familial - Ligature de trompes - vasectomie oui F 15.000
Table 4: Subsidies per hospital indicator in Cyangugu province
2.3 Control provinces Kibungo and Gikongoro The European Union supports the health system in Kibungo and Umtare provinces through a quality assurance and supervision strengthening programme worth $ 2.3 million according to the Technical and Administrative Provision Document the programme started February 2004. The programme in Kibungo province is the successor to an earlier health sector European Union project. Gikongoro was selected because it did not receive major external support from partner organizations. However, the province did receive significant more government support than the other three provinces through the recruitment and posting of additional government staff. The above characteristics of the four provinces made the comparison between the four provinces fascinating.
Report on a comparative survey in 16 health centre in four Rwandese provinces page 9
3. Findings health worker survey In this chapter, we present the findings of the survey among 64 health workers; 16 in each province.
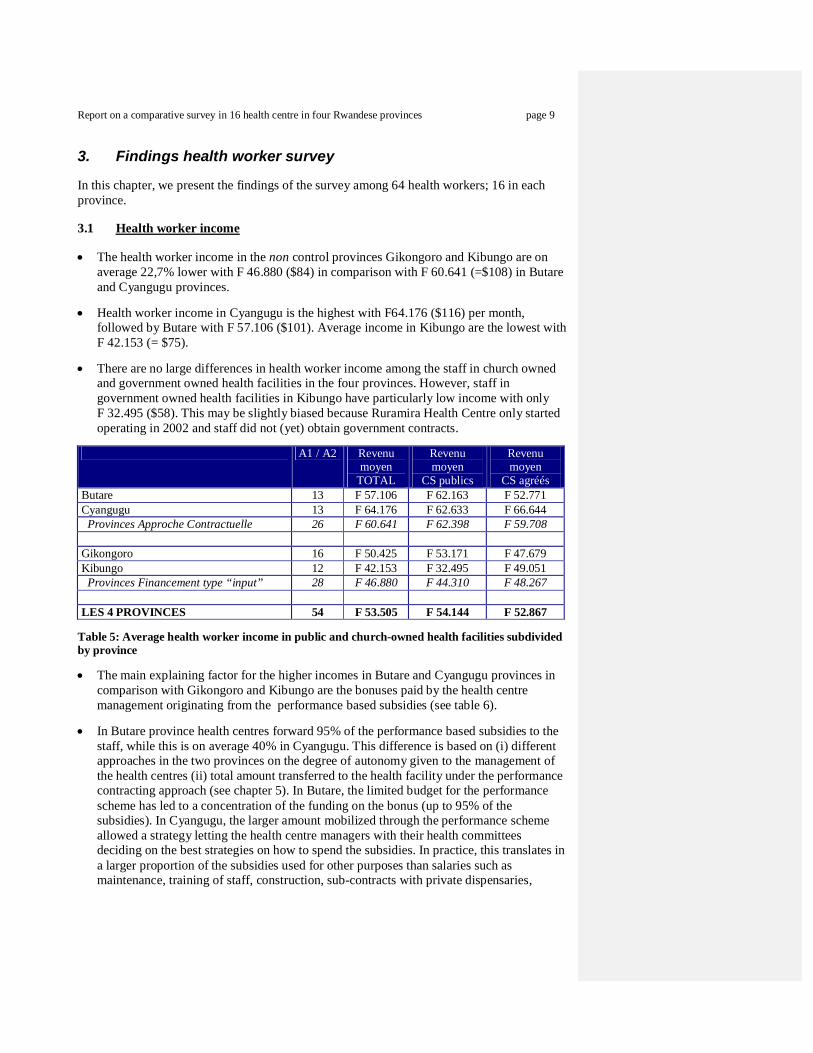
3.1 Health worker income
The health worker income in the non control provinces Gikongoro and Kibungo are on average 22,7% lower with F 46.880 ($84) in comparison with F 60.641 (=$108) in Butare and Cyangugu provinces.
Health worker income in Cyangugu is the highest with F64.176 ($116) per month, followed by Butare with F 57.106 ($101). Average income in Kibungo are the lowest with F 42.153 (= $75).
There are no large differences in health worker income among the staff in church owned and government owned health facilities in the four provinces. However, staff in government owned health facilities in Kibungo have particularly low income with only F 32.495 ($58). This may be slightly biased because Ruramira Health Centre only started operating in 2002 and staff did not (yet) obtain government contracts.
A1 / A2 Revenu
moyen TOTAL
Revenu moyen
CS publics
Revenu moyen
CS agréés Butare 13 F 57.106 F 62.163 F 52.771 Cyangugu 13 F 64.176 F 62.633 F 66.644 Provinces Approche Contractuelle 26 F 60.641 F 62.398 F 59.708 Gikongoro 16 F 50.425 F 53.171 F 47.679 Kibungo 12 F 42.153 F 32.495 F 49.051 Provinces Financement type “input” 28 F 46.880 F 44.310 F 48.267 LES 4 PROVINCES 54 F 53.505 F 54.144 F 52.867
Table 5: Average health worker income in public and church-owned health facilities subdivided by province
The main explaining factor for the higher incomes in Butare and Cyangugu provinces in comparison with Gikongoro and Kibungo are the bonuses paid by the health centre management originating from the performance based subsidies (see table 6).
In Butare province health centres forward 95% of the performance based subsidies to the staff, while this is on average 40% in Cyangugu. This difference is based on (i) different approaches in the two provinces on the degree of autonomy given to the management of the health centres (ii) total amount transferred to the health facility under the performance contracting approach (see chapter 5). In Butare, the limited budget for the performance scheme has led to a concentration of the funding on the bonus (up to 95% of the subsidies). In Cyangugu, the larger amount mobilized through the performance scheme allowed a strategy letting the health centre managers with their health committees deciding on the best strategies on how to spend the subsidies. In practice, this translates in a larger proportion of the subsidies used for other purposes than salaries such as maintenance, training of staff, construction, sub-contracts with private dispensaries,
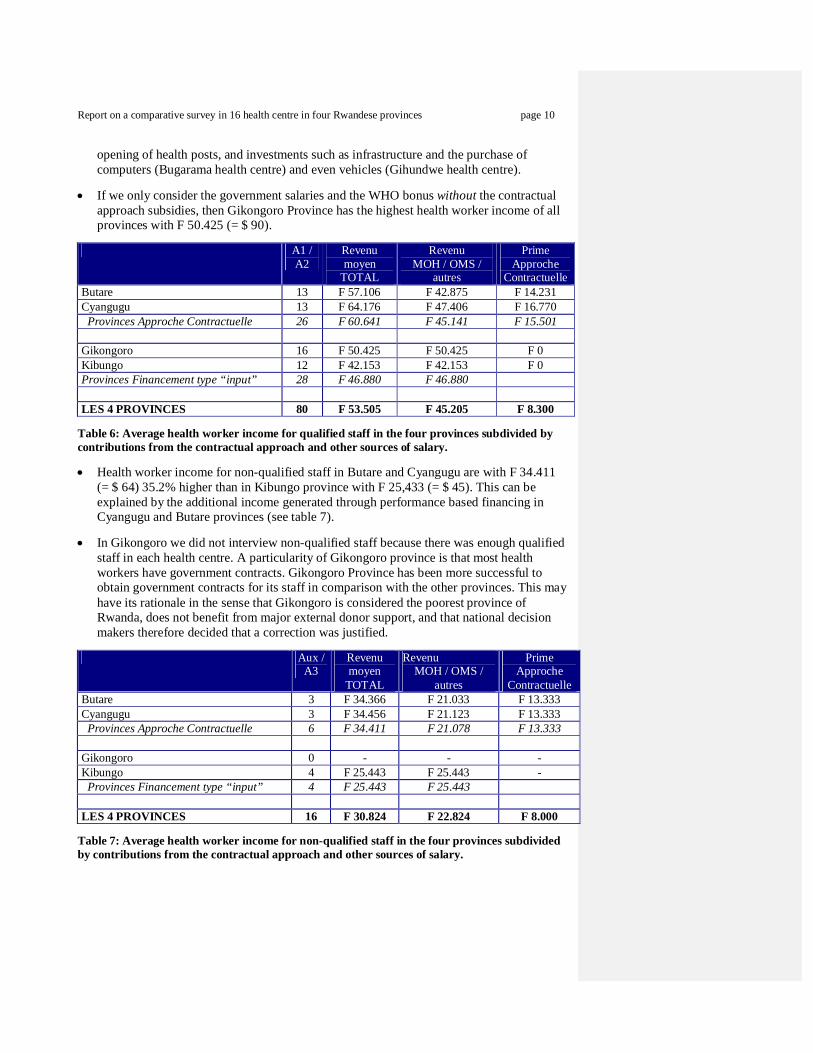
Report on a comparative survey in 16 health centre in four Rwandese provinces page 10
opening of health posts, and investments such as infrastructure and the purchase of computers (Bugarama health centre) and even vehicles (Gihundwe health centre).
If we only consider the government salaries and the WHO bonus without the contractual approach subsidies, then Gikongoro Province has the highest health worker income of all provinces with F 50.425 (= $ 90).
A1 /
A2 Revenu moyen
TOTAL
Revenu MOH / OMS /
autres
Prime Approche
Contractuelle Butare 13 F 57.106 F 42.875 F 14.231 Cyangugu 13 F 64.176 F 47.406 F 16.770 Provinces Approche Contractuelle 26 F 60.641 F 45.141 F 15.501 Gikongoro 16 F 50.425 F 50.425 F 0 Kibungo 12 F 42.153 F 42.153 F 0 Provinces Financement type “input” 28 F 46.880 F 46.880 LES 4 PROVINCES 80 F 53.505 F 45.205 F 8.300
Table 6: Average health worker income for qualified staff in the four provinces subdivided by contributions from the contractual approach and other sources of salary.
Health worker income for non-qualified staff in Butare and Cyangugu are with F 34.411 (= $ 64) 35.2% higher than in Kibungo province with F 25,433 (= $ 45). This can be explained by the additional income generated through performance based financing in Cyangugu and Butare provinces (see table 7).
In Gikongoro we did not interview non-qualified staff because there was enough qualified staff in each health centre. A particularity of Gikongoro province is that most health workers have government contracts. Gikongoro Province has been more successful to obtain government contracts for its staff in comparison with the other provinces. This may have its rationale in the sense that Gikongoro is considered the poorest province of Rwanda, does not benefit from major external donor support, and that national decision makers therefore decided that a correction was justified.
Aux /
A3 Revenu moyen
TOTAL
Revenu MOH / OMS /
autres
Prime Approche
Contractuelle Butare 3 F 34.366 F 21.033 F 13.333 Cyangugu 3 F 34.456 F 21.123 F 13.333 Provinces Approche Contractuelle 6 F 34.411 F 21.078 F 13.333 Gikongoro 0 - - - Kibungo 4 F 25.443 F 25.443 - Provinces Financement type “input” 4 F 25.443 F 25.443 LES 4 PROVINCES 16 F 30.824 F 22.824 F 8.000
Table 7: Average health worker income for non-qualified staff in the four provinces subdivided by contributions from the contractual approach and other sources of salary.
Report on a comparative survey in 16 health centre in four Rwandese provinces page 11
3.2 Is there a relationship between performance and income?
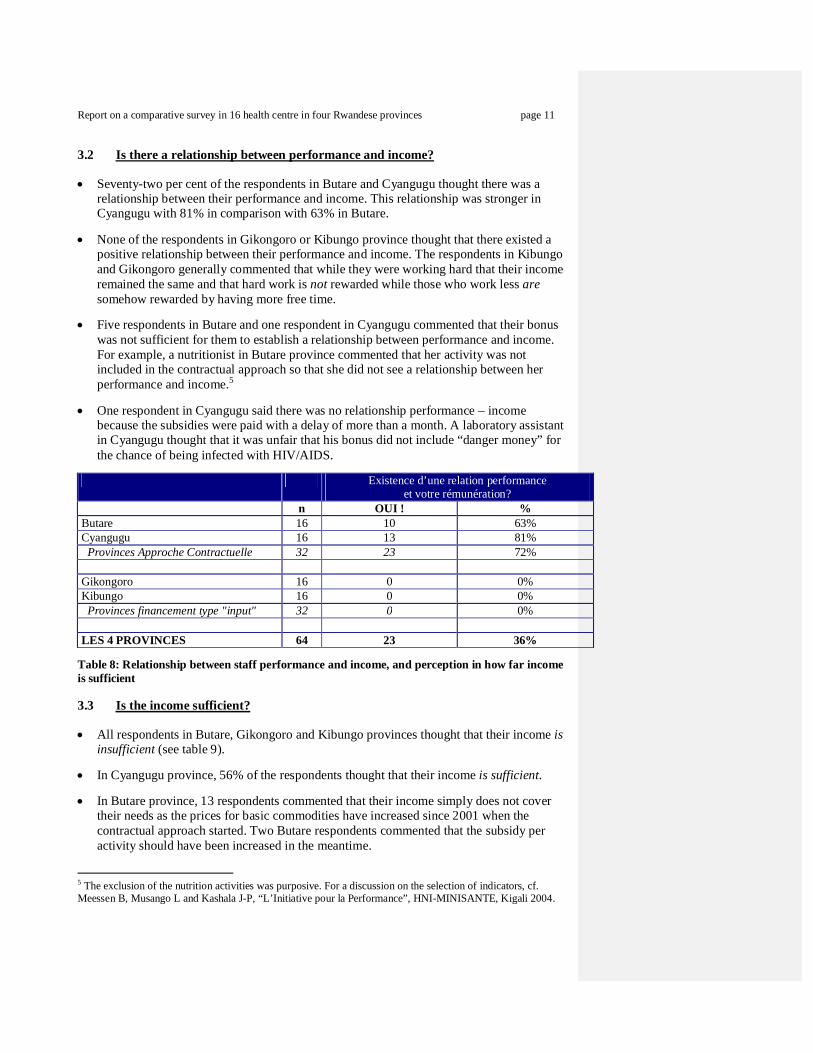
Seventy-two per cent of the respondents in Butare and Cyangugu thought there was a relationship between their performance and income. This relationship was stronger in Cyangugu with 81% in comparison with 63% in Butare.
None of the respondents in Gikongoro or Kibungo province thought that there existed a positive relationship between their performance and income. The respondents in Kibungo and Gikongoro generally commented that while they were working hard that their income remained the same and that hard work is not rewarded while those who work less are somehow rewarded by having more free time.
Five respondents in Butare and one respondent in Cyangugu commented that their bonus was not sufficient for them to establish a relationship between performance and income. For example, a nutritionist in Butare province commented that her activity was not included in the contractual approach so that she did not see a relationship between her performance and income.5
One respondent in Cyangugu said there was no relationship performance – income because the subsidies were paid with a delay of more than a month. A laboratory assistant in Cyangugu thought that it was unfair that his bonus did not include “danger money” for the chance of being infected with HIV/AIDS.
Existence d’une relation performance
et votre rémunération? n OUI ! % Butare 16 10 63% Cyangugu 16 13 81% Provinces Approche Contractuelle 32 23 72% Gikongoro 16 0 0% Kibungo 16 0 0% Provinces financement type "input" 32 0 0% LES 4 PROVINCES 64 23 36%
Table 8: Relationship between staff performance and income, and perception in how far income is sufficient
3.3 Is the income sufficient?
All respondents in Butare, Gikongoro and Kibungo provinces thought that their income is insufficient (see table 9).
In Cyangugu province, 56% of the respondents thought that their income is sufficient.
In Butare province, 13 respondents commented that their income simply does not cover their needs as the prices for basic commodities have increased since 2001 when the contractual approach started. Two Butare respondents commented that the subsidy per activity should have been increased in the meantime.
5 The exclusion of the nutrition activities was purposive. For a discussion on the selection of indicators, cf. Meessen B, Musango L and Kashala J-P, “L’Initiative pour la Performance”, HNI-MINISANTE, Kigali 2004.

Report on a comparative survey in 16 health centre in four Rwandese provinces page 12
In Cyangugu province, seven respondents commented that they were satisfied with their income, while three respondents thought their income was insufficient in comparison with their daily needs. One Cyangugu respondents commented that there were problems with the government salary payments, while another Cyangugu respondent criticized the delay in the contractual approach payments.
In Gikongoro and Kibungo provinces, 28 out of 32 respondents commented that their income simply does not cover their basic needs. Three respondents went as far to comment that their income constituted an injustice.
Est-ce que votre rémunération
est suffisante? n OUI % Butare 16 0 0% Cyangugu 16 9 56% Provinces Approche Contractuelle 32 9 28% Gikongoro 16 0 0% Kibungo 16 0 0% Provinces financement type "input" 32 0 0% LES 4 PROVINCES 64 9 14%
Table 9: Satisfaction with income among staff
3.4 Staff participation in health centre management?
On average in the four provinces, only 15% of respondents answered “yes” on the question whether they participated in the management of their Health Centre.
In Butare (29%) and Cyangugu (20%) a slightly higher proportion of respondents thought they fully participated in the management of the Health Centre in comparison with 0% in Gikongoro and 13% in Kibungo.
Personnel
(titulaires exclus) Participez-vous dans
la gestion du CS? n OUI % Butare 14 4 29% Cyangugu 15 3 20% Provinces Approche Contractuelle 29 7 24% Gikongoro 16 0 0% Kibungo 16 2 13% Provinces financement type "input" 32 2 6% LES 4 PROVINCES 61 9 15%
Table 10: Participation of staff in the management of the Health Centre

Report on a comparative survey in 16 health centre in four Rwandese provinces page 13
3.5 Perception about work conditions and infrastructure
There are no significant differences in the four provinces concerning the staff opinion about the availability of work means such as equipment & furniture, and the quality of the infrastructure.
Moyens pour
faire bien le travail? Infrastructure bonne pour
faire le travail? n OUI % OUI % Butare 16 8 50% 9 56% Cyangugu 16 9 56% 11 69% Provinces Approche Contractuelle 32 17 53% 20 63% Gikongoro 16 7 44% 11 69% Kibungo 16 8 50% 11 69% Provinces financement type "input" 32 15 47% 22 69% LES 4 PROVINCES 64 32 50% 42 66%
Table 11: Availability of work means and infrastructure
3.6 Hours of work, perception of workload and quality of work
The average number of hours worked is slightly higher in Cyangugu province with 8.2 and slightly lower in Gikongoro province with 7.4 hours.
Nevertheless, only 25% of the respondents in Cyangugu province think they are overloaded with work, while this is 50% in Butare and Gikongoro provinces and even 63% in Kibungo province. Cyangugu has most respondents with 81%, who think that their workload is adequate.
We assume that the higher average salary and its performance based character in Cyangugu province compensates for the higher number of working hours. On the contrary the lower average income in Kibungo may explain the perceived higher workload.
Heures de
travail moyennes
Etes vous sur-chargé?
Charge vous permet de bien travailler?
n OUI % OUI % Butare 16 7,9 H 8 50% 8 50% Cyangugu 16 8,2 H 4 25% 13 81% Provinces Approche Contractuelle 32 8.0 H 12 38% 21 66% Gikongoro 16 7,4 H 8 50% 8 50% Kibungo 16 7,9 H 10 63% 7 44% Provinces financement type "input" 32 7.7 H 18 56% 15 47% LES 4 PROVINCES 64 7,8 H 30 47% 36 56%
Table 12: Average hours of work per day and perception of workload and quality of work
Report on a comparative survey in 16 health centre in four Rwandese provinces page 14
3.7 Health Centre internal supervision
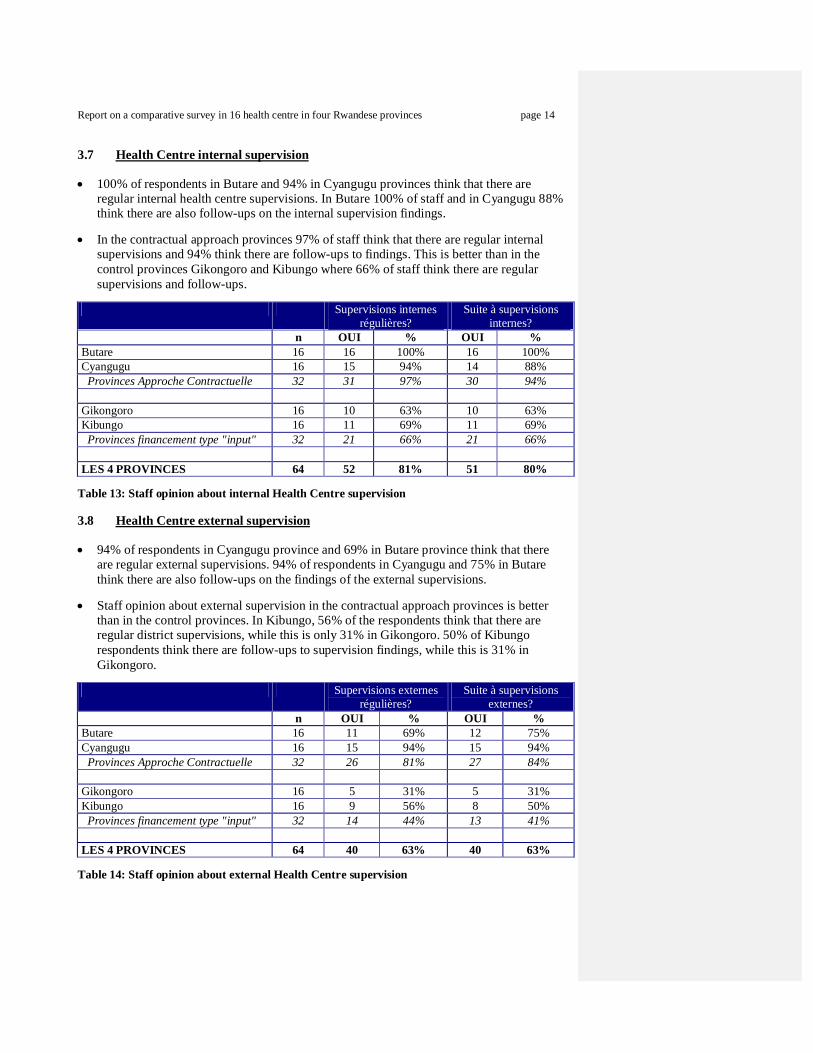
100% of respondents in Butare and 94% in Cyangugu provinces think that there are regular internal health centre supervisions. In Butare 100% of staff and in Cyangugu 88% think there are also follow-ups on the internal supervision findings.
In the contractual approach provinces 97% of staff think that there are regular internal supervisions and 94% think there are follow-ups to findings. This is better than in the control provinces Gikongoro and Kibungo where 66% of staff think there are regular supervisions and follow-ups.
Supervisions internes
régulières? Suite à supervisions
internes? n OUI % OUI % Butare 16 16 100% 16 100% Cyangugu 16 15 94% 14 88% Provinces Approche Contractuelle 32 31 97% 30 94% Gikongoro 16 10 63% 10 63% Kibungo 16 11 69% 11 69% Provinces financement type "input" 32 21 66% 21 66% LES 4 PROVINCES 64 52 81% 51 80%
Table 13: Staff opinion about internal Health Centre supervision
3.8 Health Centre external supervision
94% of respondents in Cyangugu province and 69% in Butare province think that there are regular external supervisions. 94% of respondents in Cyangugu and 75% in Butare think there are also follow-ups on the findings of the external supervisions.
Staff opinion about external supervision in the contractual approach provinces is better than in the control provinces. In Kibungo, 56% of the respondents think that there are regular district supervisions, while this is only 31% in Gikongoro. 50% of Kibungo respondents think there are follow-ups to supervision findings, while this is 31% in Gikongoro.
Supervisions externes
régulières? Suite à supervisions
externes? n OUI % OUI % Butare 16 11 69% 12 75% Cyangugu 16 15 94% 15 94% Provinces Approche Contractuelle 32 26 81% 27 84% Gikongoro 16 5 31% 5 31% Kibungo 16 9 56% 8 50% Provinces financement type "input" 32 14 44% 13 41% LES 4 PROVINCES 64 40 63% 40 63%
Table 14: Staff opinion about external Health Centre supervision

Report on a comparative survey in 16 health centre in four Rwandese provinces page 15
The poor performance of external supervision in Gikongoro province may be because there are no significant external partners.
The relatively poor rating on external supervision in Kibungo province is surprising as this province benefits from a substantial European Union project, focusing on supervision as one of the main components.
3.9 Health Centre technical meetings
100% of respondents in Cyangugu province and 94% in Butare province think that there are regular technical meetings in the health centres. In Cyangugu, 100% of the respondents and in Butare, 94% think there are also follow-ups on the findings from the technical meetings.
Staff opinion about technical meetings in the contractual approach provinces is better than in the control provinces. In Gikongoro, 75% of respondents say that there are regular technical meeting, while this is only 50% in Kibungo. 69% of Gikongoro respondents think there are follow-ups to supervision findings, while this is 50% in Kibungo. This finding is again surprising because Kibungo is supposed to benefit from quality assurance instruments put into place by the European Union project, while Gikongoro does not receive such support.
Réunions techniques de
travail régulières? Décisions appliquées des
réunions techniques? n OUI % OUI % Butare 16 15 94% 15 94% Cyangugu 16 16 100% 16 100% Provinces Approche Contractuelle 32 31 97% 31 97% Gikongoro 16 12 75% 11 69% Kibungo 16 8 50% 8 50% Provinces financement type "input" 32 20 63% 19 59% LES 4 PROVINCES 64 51 80% 50 78%
Table 15: Staff opinion about Health Centre technical meetings
3.10 Staff opinion in Gikongoro and Kibungo provinces about the contractual approach
Six respondents in Gikongoro and three in Kibungo Province heard about the contractual approach in Butare and Cyangugu provinces. All these nine respondents – who heard about the contractual approach - thought that it would be a good idea to introduce a similar performance based system in their provinces.
Entendu parler de l'Approche
Contractuelle? Approche Contractuelle
intéressante pour votre CS? n OUI % OUI % Gikongoro 16 6 38% 6 100% Kibungo 16 3 19% 3 100% TOTAL 32 9 28% 9 100%
Table 16: Knowledge and opinion about the contractual approach of respondents in Kibungo and Gikongoro provinces

Report on a comparative survey in 16 health centre in four Rwandese provinces page 16
3.11 Staff opinion in Butare and Cyangugu provinces about the contractual approach
All 32 respondents in Butare and Cyangugu provinces had a favorable opinion about the contractual approach.
They gave spontaneously the following reasons for their favorable opinion:
Commentaires des répondants Butare 16 Cyangugu 16 x mentionné % x mentionné % Le personnel est mieux motivé 16 100% 12 75% La qualité est améliorée 9 56% 7 44% La fréquentation des patients est augmentée 2 13% 2 13% Les prix sont diminués - ainsi l'accès financier pour la population est augmenté
0% 8 50%
Nous avons maintenant les moyens pour aller à la communauté
0% 5 31%
Le nombre de personnel est augmenté 0% 1 6% Nous avons plus de moyens pour faire le travail 0% 1 6%
Table 17: Comments by Butare and Cyangugu staff about contractual approach.
100% of respondents in Butare and 75% in Cyangugu spontaneously said that the contractual approach better motivated staff.
Quality improvement was mentioned by 56% of Butare respondents and 44% of Cyangugu respondents.
The Cyangugu respondents provided the following additional reasons for their favorable opinion about performance based financing:
o 50% said that the contractual approach has forced down prices so that more patients can afford the services.
o 31% also commented that the performance based subsidies better allowed the health centres to develop community based strategies.
o One respondent further mentioned that the contractual approach allowed the health centre to recruit additional staff.
o Another respondent said that the contractual approach provided the means to work well.
3.12 Influence of the contractual approach on staff well-being and salary
69% of staff in Butare and 88% in Cyangugu also worked in the old “input” or line item financing system (see table 18). Interestingly, this implies that already 22% of the health workers only worked in performance based system as Butare started in 2001 and Cyangugu in 2002.
64% of the respondents in Cyangugu and 27% in Butare thought that the contractual approach meant a big improvement of their personnel well-being. Equally, a higher proportion of 86% in Cyangugu thought that the contractual approach meant a big improvement for their income versus 55% in Butare.

Report on a comparative survey in 16 health centre in four Rwandese provinces page 17
Est-ce que vous avez travaillé dans
ancien système type "input"?
Approche Contractuelle constitue une GRANDE amélioration pour votre
BIEN-ETRE?
Approche Contractuelle constitue une GRANDE amélioration pour votre
REMUNERATION? n OUI % OUI % OUI % Butare 16 11 69% 3 27% 6 55% Cyangugu 16 14 88% 9 64% 12 86% TOTAL 32 25 78% 12 48% 18 72%
Table 18: Influence contractual approach on staff well-being and salary
3.13 Influence of the contractual approach on work condition and service quality
Of those respondents, who worked in the previous input based health system, 91% in Butare and 86% in Cyangugu think that the contractual approach meant a big improvement for their work conditions.
Of those respondents, who worked in previous input based health system, 100% in Cyangugu and 82% in Butare think that the contractual approach meant a big improvement for the quality of services provided to patients. This opinion confirms other previous reports.6
Vous avez travaillé
dans ancien système "input"?
Approche Contractuelle constitue une GRANDE amélioration pour votre
CONDITION DE TRAVAIL?
Approche Contractuelle constitue une GRANDE
amélioration pour la QUALITE de services
rendus? n OUI % OUI % OUI % Butare 16 11 69% 10 91% 9 82% Cyangugu 16 14 88% 12 86% 14 100% TOTAL 32 25 78% 22 88% 23 92%
Table 19: Influence contractual approach on work conditions and quality of services
3.14 Final observations by Gikongoro and Kibungo staff
Most observations made by staff in Gikongoro and Kibungo concerned income issues.
Eight respondents said that performance based incentives (“primes”) should also be introduced in their health facility.
Four respondents simply said that they wished an increase in salary.
Two respondents complained about the unfairness of the WHO incentive scheme, which favor staff with a government contract instead of favoring all staff.
Two respondents in Kibungo wished a government salary.
Most other comments concerned requests for specific inputs such as equipment, rehabilitation of infrastructure, ambulances, etc.
One respondent said he feared that the introduction of the “mutuelle” system would affect the quality of the services.
6 Cf. Meessen, Musango et Kashala, 2004, “L’Initiative pour la Performance”.
Report on a comparative survey in 16 health centre in four Rwandese provinces page 18
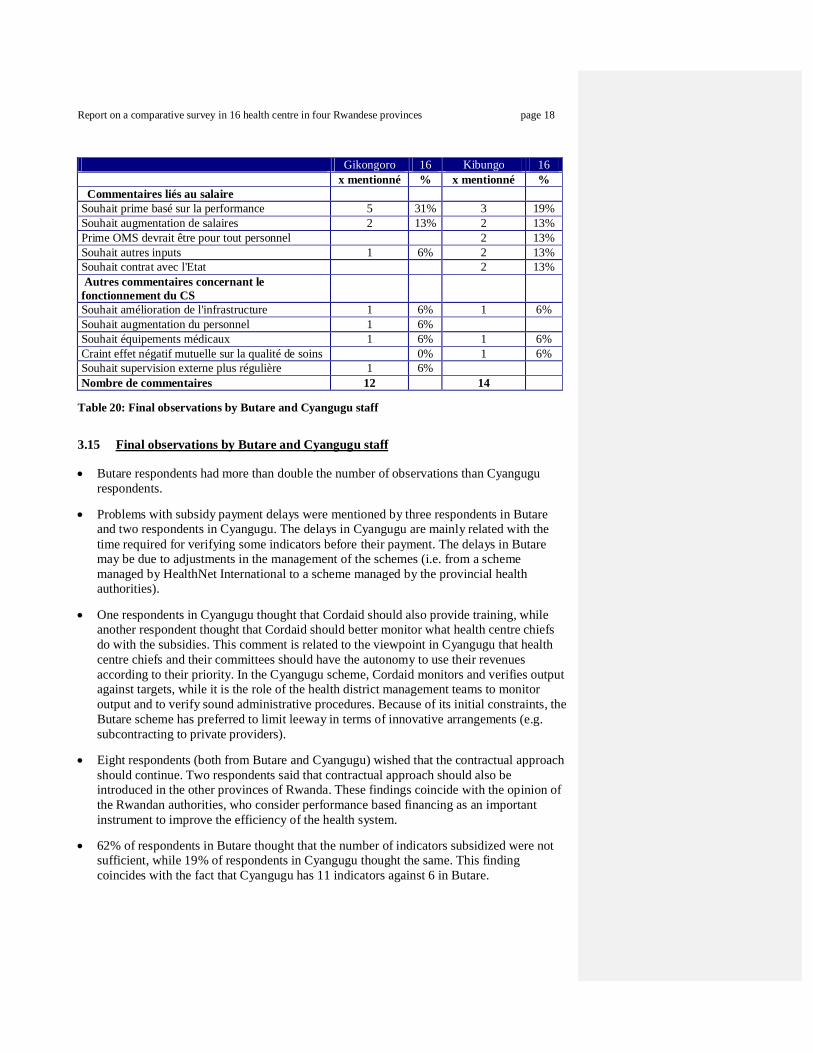
Gikongoro 16 Kibungo 16 x mentionné % x mentionné % Commentaires liés au salaire Souhait prime basé sur la performance 5 31% 3 19% Souhait augmentation de salaires 2 13% 2 13% Prime OMS devrait être pour tout personnel 2 13% Souhait autres inputs 1 6% 2 13% Souhait contrat avec l'Etat 2 13% Autres commentaires concernant le fonctionnement du CS
Souhait amélioration de l'infrastructure 1 6% 1 6% Souhait augmentation du personnel 1 6% Souhait équipements médicaux 1 6% 1 6% Craint effet négatif mutuelle sur la qualité de soins 0% 1 6% Souhait supervision externe plus régulière 1 6% Nombre de commentaires 12 14
Table 20: Final observations by Butare and Cyangugu staff
3.15 Final observations by Butare and Cyangugu staff
Butare respondents had more than double the number of observations than Cyangugu respondents.
Problems with subsidy payment delays were mentioned by three respondents in Butare and two respondents in Cyangugu. The delays in Cyangugu are mainly related with the time required for verifying some indicators before their payment. The delays in Butare may be due to adjustments in the management of the schemes (i.e. from a scheme managed by HealthNet International to a scheme managed by the provincial health authorities).
One respondents in Cyangugu thought that Cordaid should also provide training, while another respondent thought that Cordaid should better monitor what health centre chiefs do with the subsidies. This comment is related to the viewpoint in Cyangugu that health centre chiefs and their committees should have the autonomy to use their revenues according to their priority. In the Cyangugu scheme, Cordaid monitors and verifies output against targets, while it is the role of the health district management teams to monitor output and to verify sound administrative procedures. Because of its initial constraints, the Butare scheme has preferred to limit leeway in terms of innovative arrangements (e.g. subcontracting to private providers).
Eight respondents (both from Butare and Cyangugu) wished that the contractual approach should continue. Two respondents said that contractual approach should also be introduced in the other provinces of Rwanda. These findings coincide with the opinion of the Rwandan authorities, who consider performance based financing as an important instrument to improve the efficiency of the health system.
62% of respondents in Butare thought that the number of indicators subsidized were not sufficient, while 19% of respondents in Cyangugu thought the same. This finding coincides with the fact that Cyangugu has 11 indicators against 6 in Butare.

Report on a comparative survey in 16 health centre in four Rwandese provinces page 19
Both provinces subsidize OPD consultancies, deliveries, oral and injectable contraceptives and immunization. Cyangugu – in addition - subsidizes the distribution of mosquito nets, antenatal care consultancies, in patient days and the application of IUDs and implants.
44% of respondents in Butare thought that the subsidy per indicator was insufficient, against only 6% of respondents in Cyangugu, who thought the same. While Butare pays F 2.500 for a delivery – and this is considered reasonable – the F 40 for an OPD consultancy is considered low. It is interesting to note that despite the “low level of the fee”, OPD consultations have significantly increased (see chapter 7).7 The Family Planning subsidy of F 1.000 for a first FP attendant in Butare province is similar to Cyangugu, but Cyangugu also subsidizes with a standard payment each family planning re-attendant. While in Cyangugu family planning has seen a dramatic increase to 9.7% in 2004 and approximately 12% couple protection rate in 2005, this has not materialized in Butare Province.
Three respondents in Butare thought that the community aspect of the contractual approach was inadequately developed. This criticism has not been stated in Cyangugu. The commentary in Butare may be related to the fact that all the remunerated activities are facility-based. There is little incentive for the team to interact with the community. In Cyangugu, a larger proportion of the budget is accessed through activities requiring close contact with the community (e.g. promotion of impregnated bed nets and family planning).
Butare 16 Cyangugu 16 x mentionné % x mentionné % Commentaire méthodologie Approch. Contractuelle Souhait d’augmentation indicateurs à subventionner 10 63% 3 19% Souhait augmentation subside par indicateur 7 44% 1 6% Prime varient - difficile à planifier la vie 1 6% 0 0% Souhait plus variation entre la performance et le prime 1 6% Souhait de mieux développer volet communautaire 3 19% 0 0% Prime est payé avec retard 3 19% 2 13% Appr Contr doit aussi financer la formation 1 6% Cordaid doit mieux contrôler les titulaires dans utilisation de subside
1 6%
Commentaires généraux Souhait de la continuation de l'Approche Contractuelle 5 31% 3 19% Souhait introduction Appr. Contr. dans tout pays 1 6% 1 6% Collaboration entre le personnel est améliorée grâce à l'Approche Contractuelle
1 6% 2 13%
Souhait d’amélioration de l'infrastructure 1 6% Souhait d’augmentation du personnel 1 6% Nombre de commentaires 33 15
Table 21: Final observations by Butare and Cyangugu staff
7 It must not be forgotten that the OPD is a major source of income for the health centres through the user fees and the sale of drugs. If there were an increase in the fee paid by the scheme, it would make sense to negotiate a reduction on the cost charged to the patients.

Report on a comparative survey in 16 health centre in four Rwandese provinces page 20
4. Comparison of supervision practices in the four provinces
This chapter of the report is based on interviews with the health centre chiefs or “titulaires”.
4.1 Supervision by district health teams
Generally, the health centre ‘titulaires’ expressed their satisfaction with the quality of the supervision of their district management teams. Supervisors in most provinces do not use systematic checklists and their visits treat mostly a limited number of topics.8 Therefore, during the course of one year in most provinces certain topics are not covered by supervision.
Province District Sanitaire
Centre de Santé Supervision intégrée,
régulière?
Commentaire sur la supervision des superviseurs du district sanitaire
En résumé, satisfait ?
Butare Kabutare Gisagara à peu près rég supervisions non systématiques à peu près Rango à peu près rég superviseurs en nombre insuffisant à peu près Busoro à peu près rég pas intégrée à peu près Simbi à peu près rég pas intégrée à peu près Cyangugu Mibilizi Bugarama à peu près rég oui Mushaka régulier Supervision formative oui Bushenge Muyangwe Régulier Supervision formative oui Bushenge à peu près rég Supervision formative à peu près Gikongoro Kigeme Ruramba à peu près rég pas intégrée oui Kitabi pas régulier pas intégrée – superviseurs insuffisant à peu près Nyarusiza pas régulier pas intégrée - pas venu cette année pas du tout Munini Kibeho Régulier pas intégrée – seulement TB oui Kibungo Kibungo Kukumberi à peu près rég pas intégrée oui Rukoma Sake à peu près rég pas intégrée à peu près Zaza à peu près rég pas intégrée à peu près Rwamagana Ruramira pas régulier pas intégrée à peu près
Table 22: Opinion of health centre ‘titulaires’ about supervision by district health teams Cyangugu visits by district supervisors were considered regular by two ‘titulaires’. In this
province the district health teams have a performance contract as the result of which they must cover all health centre activities using a systematic checklist. 3 of 4 ‘titulaires’ were satisfied with the visits of the district supervisors.
Supervision visits in Butare province are “more or less” regular. One respondent thought that the supervisors were over burdened due to the high number of health centres in Kabutare district.9 The respondents also thought that the supervisors could not cover all topics regularly.
Gikongoro province seems to have supervision problems at different levels. The supervisors do not come regularly and do not cover all topics. In one health centre it was observed that TB receives most attention as the district supervisor receives a bonus from
8 This observation does not necessarily mean that the supervision is not effective. A supervision focusing on the current bottlenecks, if necessary with some continuity in time can be the best support to offer to a health centre. 9 The mere observation of the district team’s every day life confirms the statement. The current team of two nurses is largely insufficient to achieve the normal schedule of visits in such a huge district (15 MPA health centres with more than 320,000 people).

Report on a comparative survey in 16 health centre in four Rwandese provinces page 21
the national TB programme in Kigali, while not receiving such an incentive for his other supervision tasks. Nyarusiza health centre did not receive any supervisor during 2005.
Kibungo province lacks regular visits and the four ‘titulaires’ all said that the supervisors only covered a limited number of topics.
4.2 Supervision by Kigali-based vertical programmes (PNILT,VCT, etc) We requested the ‘titulaires’ their opinion about the different vertical programmes.10 Among the 16 respondents they mentioned the following seven programmes:
Programme vertical Supervision régulière? OUI
Qualité de supervision? BONNE
En résumé, satisfait? OUI
PNILT (TB) n = 11 4/11 9/11 6/11 VCT (VIH/SIDA) n = 5 1/5 5/5 3/5 NLP (Paludisme) n = 3 1/3 2/3 1/3 PMCT/TRAC (VIH/SIDA) n = 2 0/2 1/2 1/2 Animateurs de Santé n = 1 0/1 1/1 1/1 GAVI (Vaccination) n = 1 0/1 1/1 1/1 Programme de yeux n = 1 0/1 1/1 1/1
Moyenne tous les programmes 25% 83% 58% Table 23: Opinion of health centre ‘titulaires’ about supervision by Kigali based vertical programmes
According to this survey, the most active vertical programme in Rwanda is for tuberculoses and 11 out of 16 ‘titulaires’ reported visits from the tuberculosis programme (PNILT). 36% of the respondents said the visits by PNILT were regular, and 82% of the respondents thought the visits were useful. In summary, 55% of the respondents said they were satisfied with the visits.
The second most frequent vertical programme is the VCT HIV/AIDS dealing with voluntary HIV counseling services. Only one of five respondents thought that the VCT supervisions were regular. However, all respondents also thought the VCT visits were useful and the respondents were satisfied with the programme.
PMCT and TRAC programmes visited two health centres in our sample. The quality of the visit was mixed.
Three other national programmes (village health worker, immunization and eye care) each visited one health centre. The visits were considered positive, but not regular.
10 Not all the health centres are involved in the tuberculosis diagnosis and treatment strategy. This observation is also valid for HIV/AIDS activities. Another important caveat must be stated here: this section is not a discussion of ‘supervisions in Rwanda’. The very limited size of the sample and the small number of occurrences do not allow such an interpretation. Our purpose was much more to appreciate the number of contacts the health centers have with some kinds of support or monitoring systems.
Report on a comparative survey in 16 health centre in four Rwandese provinces page 22
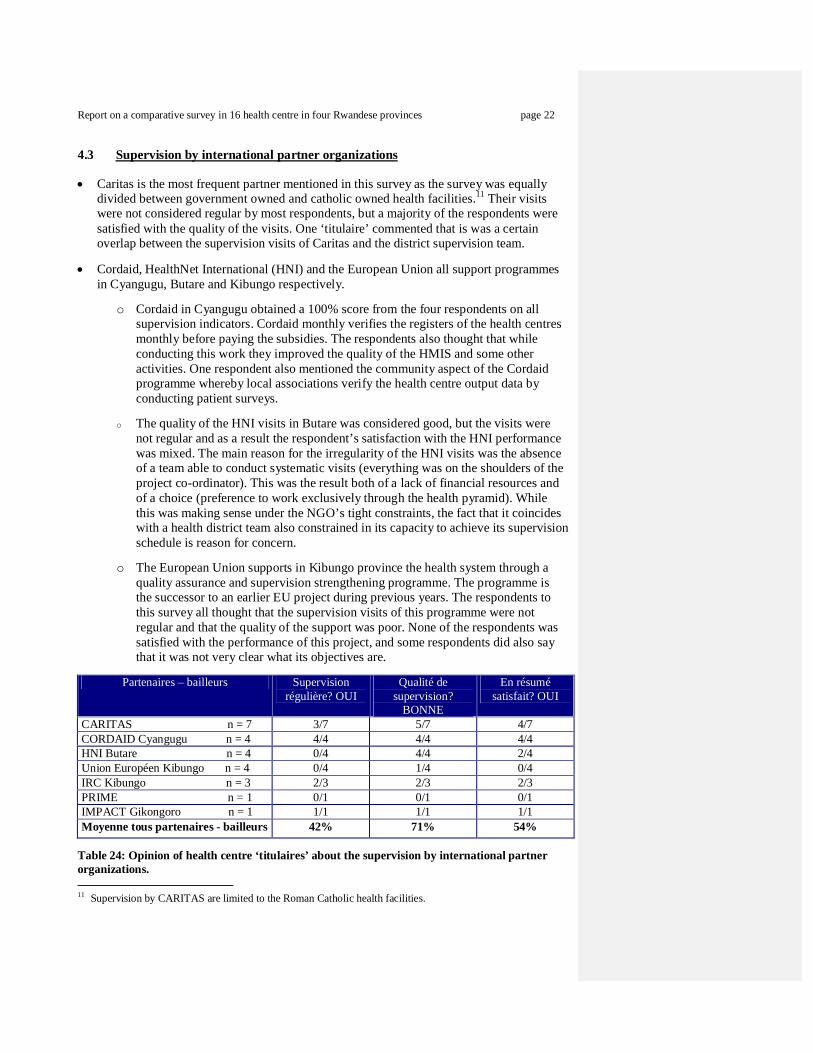
4.3 Supervision by international partner organizations
Caritas is the most frequent partner mentioned in this survey as the survey was equally divided between government owned and catholic owned health facilities.11 Their visits were not considered regular by most respondents, but a majority of the respondents were satisfied with the quality of the visits. One ‘titulaire’ commented that is was a certain overlap between the supervision visits of Caritas and the district supervision team.
Cordaid, HealthNet International (HNI) and the European Union all support programmes in Cyangugu, Butare and Kibungo respectively.
o Cordaid in Cyangugu obtained a 100% score from the four respondents on all
supervision indicators. Cordaid monthly verifies the registers of the health centres monthly before paying the subsidies. The respondents also thought that while conducting this work they improved the quality of the HMIS and some other activities. One respondent also mentioned the community aspect of the Cordaid programme whereby local associations verify the health centre output data by conducting patient surveys.
o The quality of the HNI visits in Butare was considered good, but the visits were
not regular and as a result the respondent’s satisfaction with the HNI performance was mixed. The main reason for the irregularity of the HNI visits was the absence of a team able to conduct systematic visits (everything was on the shoulders of the project co-ordinator). This was the result both of a lack of financial resources and of a choice (preference to work exclusively through the health pyramid). While this was making sense under the NGO’s tight constraints, the fact that it coincides with a health district team also constrained in its capacity to achieve its supervision schedule is reason for concern.
o The European Union supports in Kibungo province the health system through a
quality assurance and supervision strengthening programme. The programme is the successor to an earlier EU project during previous years. The respondents to this survey all thought that the supervision visits of this programme were not regular and that the quality of the support was poor. None of the respondents was satisfied with the performance of this project, and some respondents did also say that it was not very clear what its objectives are.
Partenaires – bailleurs Supervision
régulière? OUI Qualité de
supervision? BONNE
En résumé satisfait? OUI
CARITAS n = 7 3/7 5/7 4/7 CORDAID Cyangugu n = 4 4/4 4/4 4/4 HNI Butare n = 4 0/4 4/4 2/4 Union Européen Kibungo n = 4 0/4 1/4 0/4 IRC Kibungo n = 3 2/3 2/3 2/3 PRIME n = 1 0/1 0/1 0/1 IMPACT Gikongoro n = 1 1/1 1/1 1/1 Moyenne tous partenaires - bailleurs 42% 71% 54%
Table 24: Opinion of health centre ‘titulaires’ about the supervision by international partner organizations. 11 Supervision by CARITAS are limited to the Roman Catholic health facilities.
Report on a comparative survey in 16 health centre in four Rwandese provinces page 23
The International Red Cross conducts in Kibungo province a community strengthening programme though village health workers and traditional birth attendants (TBAs). The rating of this programme was considered positive by two of the three respondents. One respondent questioned the rational in particular of the TBA programme, as it appears that the national policy is not in support of TBA but in support of strengthening institutional safe deliveries by skilled health workers. This statement is supported by the literature on this topic.
The American supported PRIME project, strengthening the pre-payment or “mutuelles” schemes in Rwanda visited one health centre in Kabutare district. The respondent thought that the visits were neither regular nor was he satisfied with the quality of the visit.
One respondent commented on supervision visits from an international NGO IMPACT which operates in Gikongoro in an HIV/AIDS community programme. Both regularity and the quality of the visits were considered satisfactory.
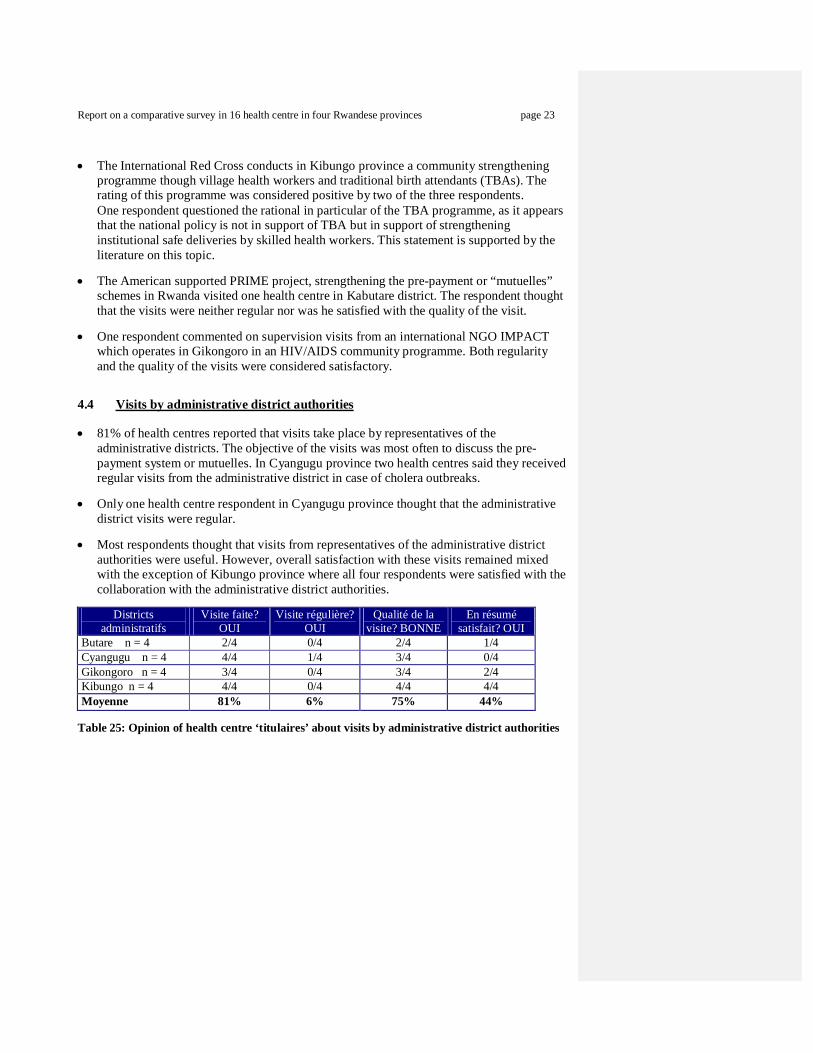
4.4 Visits by administrative district authorities
81% of health centres reported that visits take place by representatives of the administrative districts. The objective of the visits was most often to discuss the pre-payment system or mutuelles. In Cyangugu province two health centres said they received regular visits from the administrative district in case of cholera outbreaks.
Only one health centre respondent in Cyangugu province thought that the administrative district visits were regular.
Most respondents thought that visits from representatives of the administrative district authorities were useful. However, overall satisfaction with these visits remained mixed with the exception of Kibungo province where all four respondents were satisfied with the collaboration with the administrative district authorities.
Districts
administratifs Visite faite?
OUI Visite régulière?
OUI Qualité de la
visite? BONNE En résumé
satisfait? OUI Butare n = 4 2/4 0/4 2/4 1/4 Cyangugu n = 4 4/4 1/4 3/4 0/4 Gikongoro n = 4 3/4 0/4 3/4 2/4 Kibungo n = 4 4/4 0/4 4/4 4/4 Moyenne 81% 6% 75% 44%
Table 25: Opinion of health centre ‘titulaires’ about visits by administrative district authorities

Report on a comparative survey in 16 health centre in four Rwandese provinces page 24
5. Comparison of health centre revenues in four provinces We collected during the visits to the health centres the revenue data consisting of the following elements: direct cost recovery, payment through pre-payment schemes, government salaries, and performance based scheme subsidies, and finally any other subsidies in cash from aid agencies or NGOs. This study does not financially quantify in-kind support from any source.
5.1 Comparison revenues 2002 and 2004 per province
Health centre revenues in 2002
Province Popu-lation
2002 TOTAL
Revenus / hab / an
Contribution population
% Subside externe / hab / an
%
Butare 101.572 R 27.797.000 $ 0,58 $ 0,50 86,8% $ 0,08 13,2% Cyangugu 143.530 R 37.483.000 $ 0,55 $ 0,46 83,1% $ 0,09 16,9% Prov appr contr 245.102 R 65.280.000 $ 0,56 $ 0,47 84,7% $ 0,09 15,3% Gikongoro 62.686 R 21.206.500 $ 0,71 $ 0,54 75,8% $ 0,17 24,2% Kibungo 74.319 R 24.057.000 $ 0,68 $ 0,64 93,7% $ 0,04 6,3% Prov contrôle 137.005 R 45.263.500 $ 0,70 $ 0,59 85,3% $ 0,10 14,7% Les 4 provinces 382.107 R 110.543.500 $ 0,61 $ 0,52 84,9% $ 0,09 15,1%
Table 26: Health centre revenues in 2002 and proportion of income from the population and external sources
In 2002 total health centre revenues in the control provinces Gikongoro and Kibungo were
slightly higher with $0,70 per capita than in the contractual approach provinces Butare and Cyangugu with $0,56.
In 2002, proportional community financing contributions with on average 84,9% of the total health centre revenues were extremely high in all provinces. The highest contribution by the population was in Kibungo province with 93,7%, implying that only 6.3% of total health centre revenues was due to external financing12.
Gikongoro province health facilities in 2002 received the highest external financial support with $0,17 per capita per year representing 24,2% of total health centre revenues. This was due to the higher number of staff receiving government salary payments.
In summary, the situation in 2002 in terms of public funding of health centres with on average only $0,09 per capita per year can be considered extremely worrisome and explains the low utilization of health facilities in Rwanda due to financial access problems of the population as the result of high user fees.
12 By ‘external’, it is meant ‘not from the local community’. External financing = support by the central government (mainly salaries) + support by NGO or donors (mainly performance fees).
Report on a comparative survey in 16 health centre in four Rwandese provinces page 25
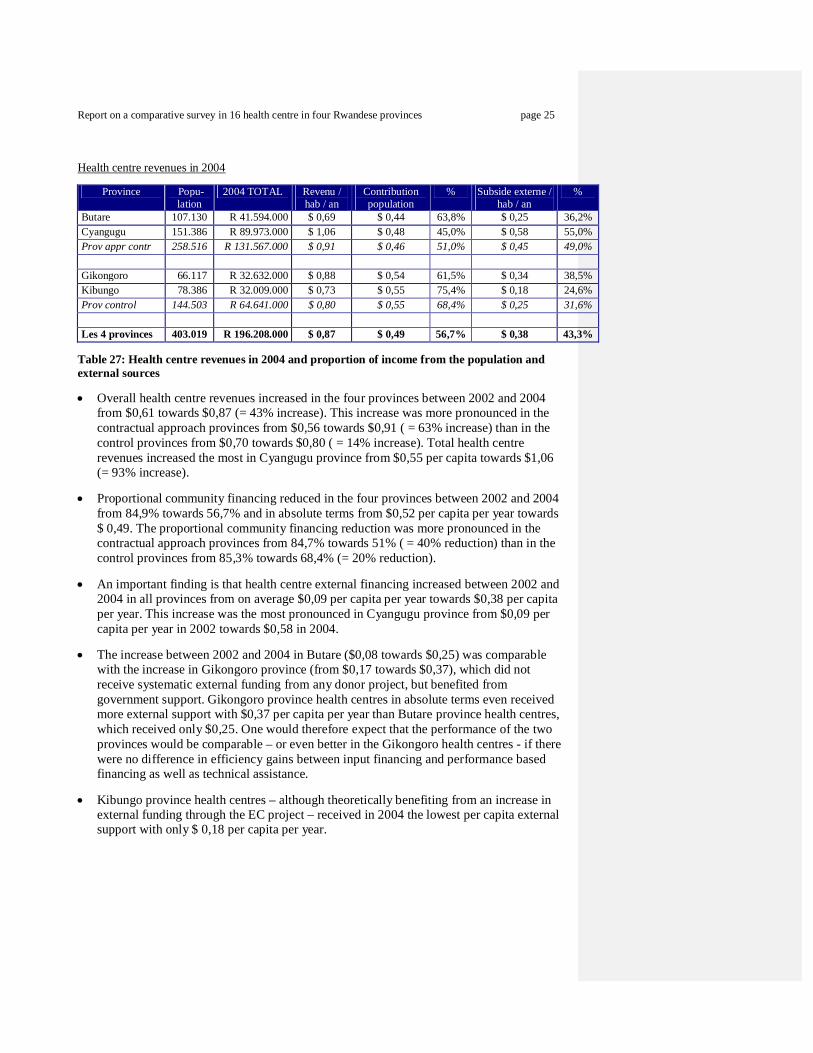
Health centre revenues in 2004
Province Popu-lation
2004 TOTAL Revenu / hab / an
Contribution population
% Subside externe / hab / an
%
Butare 107.130 R 41.594.000 $ 0,69 $ 0,44 63,8% $ 0,25 36,2% Cyangugu 151.386 R 89.973.000 $ 1,06 $ 0,48 45,0% $ 0,58 55,0% Prov appr contr 258.516 R 131.567.000 $ 0,91 $ 0,46 51,0% $ 0,45 49,0% Gikongoro 66.117 R 32.632.000 $ 0,88 $ 0,54 61,5% $ 0,34 38,5% Kibungo 78.386 R 32.009.000 $ 0,73 $ 0,55 75,4% $ 0,18 24,6% Prov control 144.503 R 64.641.000 $ 0,80 $ 0,55 68,4% $ 0,25 31,6% Les 4 provinces 403.019 R 196.208.000 $ 0,87 $ 0,49 56,7% $ 0,38 43,3%
Table 27: Health centre revenues in 2004 and proportion of income from the population and external sources
Overall health centre revenues increased in the four provinces between 2002 and 2004 from $0,61 towards $0,87 (= 43% increase). This increase was more pronounced in the contractual approach provinces from $0,56 towards $0,91 ( = 63% increase) than in the control provinces from $0,70 towards $0,80 ( = 14% increase). Total health centre revenues increased the most in Cyangugu province from $0,55 per capita towards $1,06 (= 93% increase).
Proportional community financing reduced in the four provinces between 2002 and 2004 from 84,9% towards 56,7% and in absolute terms from $0,52 per capita per year towards $ 0,49. The proportional community financing reduction was more pronounced in the contractual approach provinces from 84,7% towards 51% ( = 40% reduction) than in the control provinces from 85,3% towards 68,4% (= 20% reduction).
An important finding is that health centre external financing increased between 2002 and 2004 in all provinces from on average $0,09 per capita per year towards $0,38 per capita per year. This increase was the most pronounced in Cyangugu province from $0,09 per capita per year in 2002 towards $0,58 in 2004.
The increase between 2002 and 2004 in Butare ($0,08 towards $0,25) was comparable with the increase in Gikongoro province (from $0,17 towards $0,37), which did not receive systematic external funding from any donor project, but benefited from government support. Gikongoro province health centres in absolute terms even received more external support with $0,37 per capita per year than Butare province health centres, which received only $0,25. One would therefore expect that the performance of the two provinces would be comparable – or even better in the Gikongoro health centres - if there were no difference in efficiency gains between input financing and performance based financing as well as technical assistance.
Kibungo province health centres – although theoretically benefiting from an increase in external funding through the EC project – received in 2004 the lowest per capita external support with only $ 0,18 per capita per year.

Report on a comparative survey in 16 health centre in four Rwandese provinces page 26
5.2 Summary, overall health centre revenues
In 2002, total revenues per capita in the four surveyed health centres in Butare province was the second lowest with $0,58 in the four provinces and they became the lowest with $0,69 in 2004. This implied an increase by a rather low 20% in total health centre revenues. As demonstrated in section 7, despite the limited size of the increase, there has been a major progress in terms of outputs.
In 2002, total revenues in the four surveyed health centres in Cyangugu province were the lowest with $0,55 from the four provinces and they became the highest with $1,06 in 2004; an increase by 93%.
Gikongoro province health centres benefited from a 24% increase in total revenues comparable to the increase in Butare province.
Kibungo province health centres only increased their total revenues by 7% to $0,73, but this is still higher than Butare province.
Province 2002
Revenus totaux / hab / an
2004 Revenus totaux
/ hab / an
2004 /2002 Augmentation
en $
2004 / 2002 Augmentation
en % Butare $ 0,58 $ 0,69 $ 0,12 20% Cyangugu $ 0,55 $ 1,06 $ 0,51 93% Provinces appr contr $ 0,56 $ 0,91 $ 0,35 63% Gikongoro $ 0,71 $ 0,88 $ 0,17 24% Kibungo $ 0,68 $ 0,73 $ 0,05 7% Provinces de contrôle $ 0,70 $ 0,80 $ 0,10 14% Les 4 provinces $ 0,61 $ 0,87 $ 0,26 43%
Table 28: Comparison overall health centre revenues between 2002 and 2004
5.3 Community financing contributions to overall health centre revenues
Province 2002 Contribution population / hab / an
2004 Contribution population / hab / an
2004 /2002 Augmentation
en $
2004 / 2002 Augmentation
en %
Butare $ 0,50 $ 0,44 -$ 0,06 -12% Cyangugu $ 0,46 $ 0,48 $ 0,02 4% Provinces appr contr $ 0,47 $ 0,46 -$ 0,01 -2% Gikongoro $ 0,54 $ 0,54 $ 0,00 0% Kibungo $ 0,64 $ 0,55 -$ 0,09 -14% Provinces contrôle $ 0,59 $ 0,55 -$ 0,04 -7% Les 4 provinces $ 0,52 $ 0,49 -$ 0,03 -6%
Table 29: Comparison health centre community financing revenues between 2002 and 2004
In 2002, community financing in the contractual approach provinces was slightly lower than in the control provinces.
Report on a comparative survey in 16 health centre in four Rwandese provinces page 27
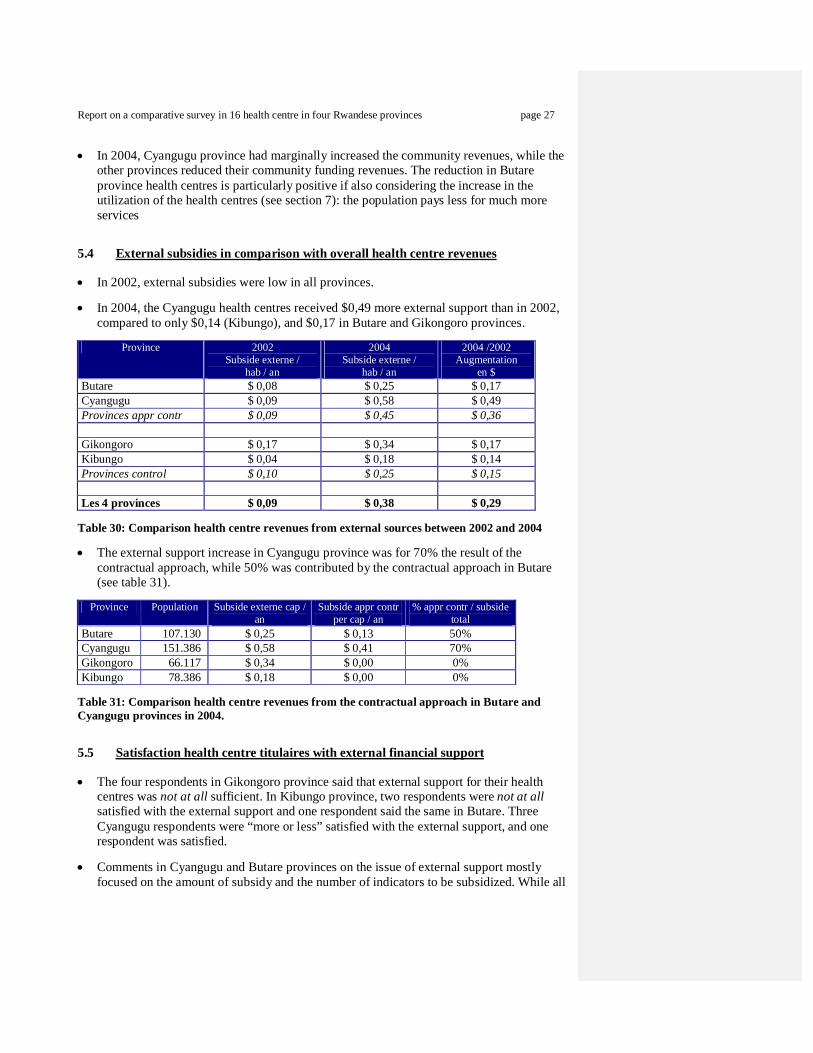
In 2004, Cyangugu province had marginally increased the community revenues, while the other provinces reduced their community funding revenues. The reduction in Butare province health centres is particularly positive if also considering the increase in the utilization of the health centres (see section 7): the population pays less for much more services
5.4 External subsidies in comparison with overall health centre revenues
In 2002, external subsidies were low in all provinces.
In 2004, the Cyangugu health centres received $0,49 more external support than in 2002, compared to only $0,14 (Kibungo), and $0,17 in Butare and Gikongoro provinces.
Province 2002
Subside externe / hab / an
2004 Subside externe /
hab / an
2004 /2002 Augmentation
en $ Butare $ 0,08 $ 0,25 $ 0,17 Cyangugu $ 0,09 $ 0,58 $ 0,49 Provinces appr contr $ 0,09 $ 0,45 $ 0,36 Gikongoro $ 0,17 $ 0,34 $ 0,17 Kibungo $ 0,04 $ 0,18 $ 0,14 Provinces control $ 0,10 $ 0,25 $ 0,15 Les 4 provinces $ 0,09 $ 0,38 $ 0,29
Table 30: Comparison health centre revenues from external sources between 2002 and 2004
The external support increase in Cyangugu province was for 70% the result of the contractual approach, while 50% was contributed by the contractual approach in Butare (see table 31).
Province Population Subside externe cap /
an Subside appr contr
per cap / an % appr contr / subside
total Butare 107.130 $ 0,25 $ 0,13 50% Cyangugu 151.386 $ 0,58 $ 0,41 70% Gikongoro 66.117 $ 0,34 $ 0,00 0% Kibungo 78.386 $ 0,18 $ 0,00 0%
Table 31: Comparison health centre revenues from the contractual approach in Butare and Cyangugu provinces in 2004.
5.5 Satisfaction health centre titulaires with external financial support
The four respondents in Gikongoro province said that external support for their health centres was not at all sufficient. In Kibungo province, two respondents were not at all satisfied with the external support and one respondent said the same in Butare. Three Cyangugu respondents were “more or less” satisfied with the external support, and one respondent was satisfied.
Comments in Cyangugu and Butare provinces on the issue of external support mostly focused on the amount of subsidy and the number of indicators to be subsidized. While all
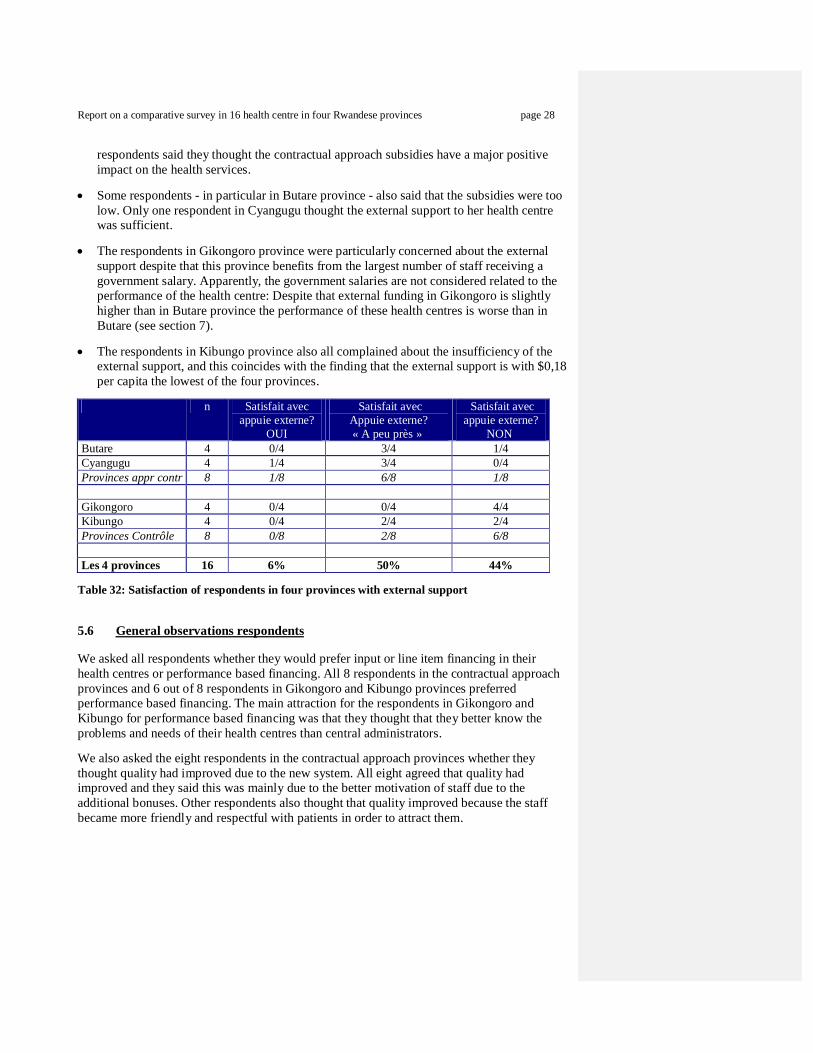
Report on a comparative survey in 16 health centre in four Rwandese provinces page 28
respondents said they thought the contractual approach subsidies have a major positive impact on the health services.
Some respondents - in particular in Butare province - also said that the subsidies were too low. Only one respondent in Cyangugu thought the external support to her health centre was sufficient.
The respondents in Gikongoro province were particularly concerned about the external support despite that this province benefits from the largest number of staff receiving a government salary. Apparently, the government salaries are not considered related to the performance of the health centre: Despite that external funding in Gikongoro is slightly higher than in Butare province the performance of these health centres is worse than in Butare (see section 7).
The respondents in Kibungo province also all complained about the insufficiency of the external support, and this coincides with the finding that the external support is with $0,18 per capita the lowest of the four provinces.
n Satisfait avec
appuie externe? OUI
Satisfait avec Appuie externe? « A peu près »
Satisfait avec appuie externe?
NON Butare 4 0/4 3/4 1/4 Cyangugu 4 1/4 3/4 0/4 Provinces appr contr 8 1/8 6/8 1/8 Gikongoro 4 0/4 0/4 4/4 Kibungo 4 0/4 2/4 2/4 Provinces Contrôle 8 0/8 2/8 6/8 Les 4 provinces 16 6% 50% 44%
Table 32: Satisfaction of respondents in four provinces with external support
5.6 General observations respondents We asked all respondents whether they would prefer input or line item financing in their health centres or performance based financing. All 8 respondents in the contractual approach provinces and 6 out of 8 respondents in Gikongoro and Kibungo provinces preferred performance based financing. The main attraction for the respondents in Gikongoro and Kibungo for performance based financing was that they thought that they better know the problems and needs of their health centres than central administrators. We also asked the eight respondents in the contractual approach provinces whether they thought quality had improved due to the new system. All eight agreed that quality had improved and they said this was mainly due to the better motivation of staff due to the additional bonuses. Other respondents also thought that quality improved because the staff became more friendly and respectful with patients in order to attract them.

Report on a comparative survey in 16 health centre in four Rwandese provinces page 29
6. Comparison of personnel in four provinces We asked the ‘titulaires’ to provide us with the staffing situation in their health centres in 2002 and 2004. We made a distinction between government paid staff and staff paid by the health centre. We also made a distinction between qualified staff and non-qualified staff. Eventually, to reflect the specifics of the Cyangugu scheme, we included the staff in the private clinics before and after the introduction of the contractual approach.
6.1 Total staff comparison
In 2002, the health centres in the control provinces had with 0,69 per 1000 inhabitants 28% more staff than the contractual approach provinces with 0,54 staff per 1000 habitants.
In 2004, Cyangugu province added 30 staff members in the four health centres (an increase by 26%), mainly with funds obtained from the contractual approach. On the contrary, the four health centres in Butare only added 4 staff members. The reason for this difference can be explained by the lower subsidy level in Butare and a possible preference of the existing Butare staff to protect their own income.13 It must also be noticed that contrarily to Cyangugu, the health centres in Butare were not allowed to subcontract private providers. The Butare project management thought collaboration with the private sector would be too risky considering their constraints with supervision capacity.
Kibungo and Gikongoro province health centres recruited a relatively small number of new staff members between 2002 and 2004. Yet, the number of staff in the Gikongoro health centres was in absolute terms in 2004 still the highest with 0,88 per 1000 inhabitants.
Provinces Personnel
TOTAL 2002
Personnel par 1000
habitants
Personnel TOTAL
2004
Personnel par 1000 habitants
Augmentation unitaire
personnel 2004 / 2002
Butare 45 0,44 49 0,46 4 Cyangugu 87 0,61 117 0,77 30 Provinces Approche Contractuelle 132 0,54 166 0,64 34 Gikongoro 53 0,85 58 0,88 5 Kibungo 42 0,57 46 0,59 4 Provinces de Contrôle 95 0,69 104 0,72 9 Les 4 provinces 227 0,59 270 0,67 43
Table 33: Total staff presence in the study health centres in the four provinces in 2002 and 2004
13 While formally, the performance scheme in Butare province allows the health centres to use the subsidies for the recruitment and payment of salaries, we are not aware of any health centre having made that choice.

Report on a comparative survey in 16 health centre in four Rwandese provinces page 30
6.2 Comparison of qualified staff presence in four provinces
The number of qualified staff increased between 2002 and 2004 from 88 to 141. Just over 50% of this increase was due to new recruitment of qualified staff in Cyangugu province (see table 34). The Cyangugu managers made use of the performance subsidies to add new staff.
The health centres in Kibungo and Gikongoro provinces recruited 20 additional qualified staff members, mainly due to the VCT programme.
The recruitment of qualified staff in Butare health centres lagged behind in comparison with the other three provinces.
Provinces Personnel
qualifié
2002
% Pers Qualifié
/ Pers TOTAL
2002
Personnel qualifié
2004
% Pers Qualifié / Pers
TOTAL 2004
Augmentation Personnel qualifié
2004 / 2002 en %
Augmentation unitaire
personnel qualifié
2004 / 2002 Butare 18 40% 22 45% 5% 4 Cyangugu 37 43% 66 56% 13% 29 Provinces Appr Contr 55 42% 88 53% 11% 33 Gikongoro 23 43% 32 55% 12% 9 Kibungo 10 24% 21 46% 22% 11 Provinces de Contrôle 33 35% 53 51% 16% 20 Les 4 provinces 88 39% 141 52% 13% 53
Table 34: Qualified staff presence in the four provinces in 2002 and 2004
6.3 Comparison government employed staff
The health centres in Gikongoro province have a much larger proportion of government employed staff than the other three provinces.
The number of government employed staff has reduced between 2002 and 2004 in the health centres of Butare and Cyangugu provinces.
Provinces Personnel
d'Etat 2002 Personnel
d'Etat par 1000 habitants
Personnel d'Etat 2004
Personnel d'Etat
par 1000 habitants
Augmentation unitaire
personnel d'Etat 2004 / 2002
Butare 16 0,16 10 0,09 -6 Cyangugu 16 0,11 14 0,09 -2 Provinces Approche Contractuelle 32 0,13 24 0,09 -8 Gikongoro 24 0,38 25 0,38 1 Kibungo 7 0,09 8 0,10 1 Provinces de Contrôle 31 0,23 33 0,23 2 Les 4 provinces 63 0,16 57 0,14 -6
Table 35: Government employed staff presence in the four provinces in 2002 and 2004.

Report on a comparative survey in 16 health centre in four Rwandese provinces page 31
7. Comparison of output performance in the four provinces This chapter describes the results of the following subsidized indicators: OPD consultations (new cases), institutional deliveries, first family planning acceptors and measles immunization coverage. Data are from the standard HMIS database in Kigali. They only refer to the 16 health centres in the study.14
7.1 Outpatient department consultancies15 Provinces
Cons Ext / hab / an 2001
Cons Ext /
hab / an 2002
Cons Ext /
hab / an 2004
Augmentation utilisation
2004 – 2001
Augmentation 2004 – 2001
(en %) Butare 0,20 0,37 0,47 0,27 133% Cyangugu 0,24 0,24 0,61 0,37 155% Provinces Appr Contr 0,22 0,29 0,55 0,33 147% Gikongoro 0,18 0,22 0,24 0,06 37% Kibungo 0,22 0,37 0,37 0,15 63% Provinces de Contrôle 0,20 0,29 0,30 0,10 52% Les 4 provinces 0,22 0,29 0,47 0,25 117%
Table 36: Comparison of OPD consultancy output in the four provinces
We used for OPD consultancies the new contact rate per year per inhabitant. In 2001, the starting situation of the OPD consultancy per capita per year was roughly equal between the contractual approach provinces and the control provinces: 0,22 versus 0,20.
In 2004 the contractual approach provinces outperformed with 0,55 new consultations per person per year the control provinces, which reached 0,30 contact per year per inhabitant. This constituted a 147% increase in the contractual approach provinces (+0.33 new consultations / year / inhabitant) against a 47% increase in the control provinces (+0.10 new consultations / year / inhabitant).
Butare province health centres started the contractual approach in March 2002 and during 2002 overall OPD coverage rates in Butare increased significantly from 0,20 to 0,37.
Cyangugu province health centres started the contractual approach in September 2002 and they achieved the increase in OPD coverage rate during 2003 and 2004 from 0,24 to 0,61.
In 2004 the highest OPD contact rate is achieved in the Cyangugu health centres with 0,61 in comparison with 0,47 in Butare health centres. The most likely explanation is the higher subsidy of F150 per OPD consultancy in Cyangugu against F40 in Butare. The higher subsidy facilitated the Cyangugu ‘titulaires’ to start several innovations such as more actively involving the community, sub-contracting private dispensaries and reducing the fees charged upon the patients.
14 For aggregate data on the Butare experiment, see Meessen, Musango and Kashala 2004. 15 Note that the last column in tables 37 – 39 provides each time the incremental gain in terms of utilization or coverage.

Report on a comparative survey in 16 health centre in four Rwandese provinces page 32
The OPD contact rate during 2004 was the highest in Cyangugu province with 0,61 and the lowest in Gikongoro province with 0,24. This difference in patient attendance rates constitutes a major inequitable situation that requires attention of the authorities in Gikongoro as well as at national level. Surprisingly the external subsidy in Gikongoro was not as low as expected in particular due to the high number of health workers in Gikongoro province, who have a government contract. The relatively low response of injecting resources through salaries on the utilization of the health services is an important finding. The alternative of increasing public funding by performance subsidies allows managers to link the additional revenues to better performance.
The introduction of pre-payment schemes during 2004 in Gikongoro (and all other provinces) may reduce this gap in terms of total number of consultancies. However, the pre-payment schemes will mostly benefit those inhabitants who contributed into the pre-payment scheme (so that the utilization of the services is skewed) and not necessarily those patients who most need the services but cannot afford to pay the health insurance premium.
7.2 Institutional deliveries Provinces Taux
Accouch Inst 2001
Taux Accouch Inst
2002
Taux Accouch Inst
2004
Augmentation couverture
2004 – 2001 Butare 6,3% 13,4% 19,1% 12,7% Cyangugu 21,0% 22,3% 26,8% 5,8% Provinces Appr Contr 12,2% 18,1% 23,1% 10,9% Gikongoro 4,1% 5,3% 6,7% 2,6% Kibungo 9,4% 13,6% 12,7% 3,3% Provinces de Contrôle 6,7% 9,4% 9,7% 2,9% Les 4 provinces 10,4% 14,9% 18,2% 7,8%
Table 37: Comparison of institutional delivery output in the four provinces
The target for the institutional delivery (i.e. in a health facility) is a coverage rate of 50% and none of the provinces achieved this target in 2004.
During 2001, the starting situation of the institutional delivery coverage rate was better in the contractual approach provinces than in the control provinces (12,2% against 6,7%). This was mainly due to the more favorable institutional delivery coverage in the four health centres of Cyangugu province, while Butare was with 6,3% below the average of the four provinces.
During 2004, the contractual approach provinces outperformed the control provinces by 23,1% institutional delivery coverage rate against 9,7%.
Butare province achieved a remarkable 12,7% increase (in absolute terms) of the institutional delivery coverage rate from 6,3% in 2001 to 19,1% in 2004. This may be explained by the relatively high subsidy of FRw 2500.
Cyangugu province increased the overall institutional delivery coverage rate in 2004 by 5.8% from 21% to 26,8%, which is the highest coverage among the four provinces.
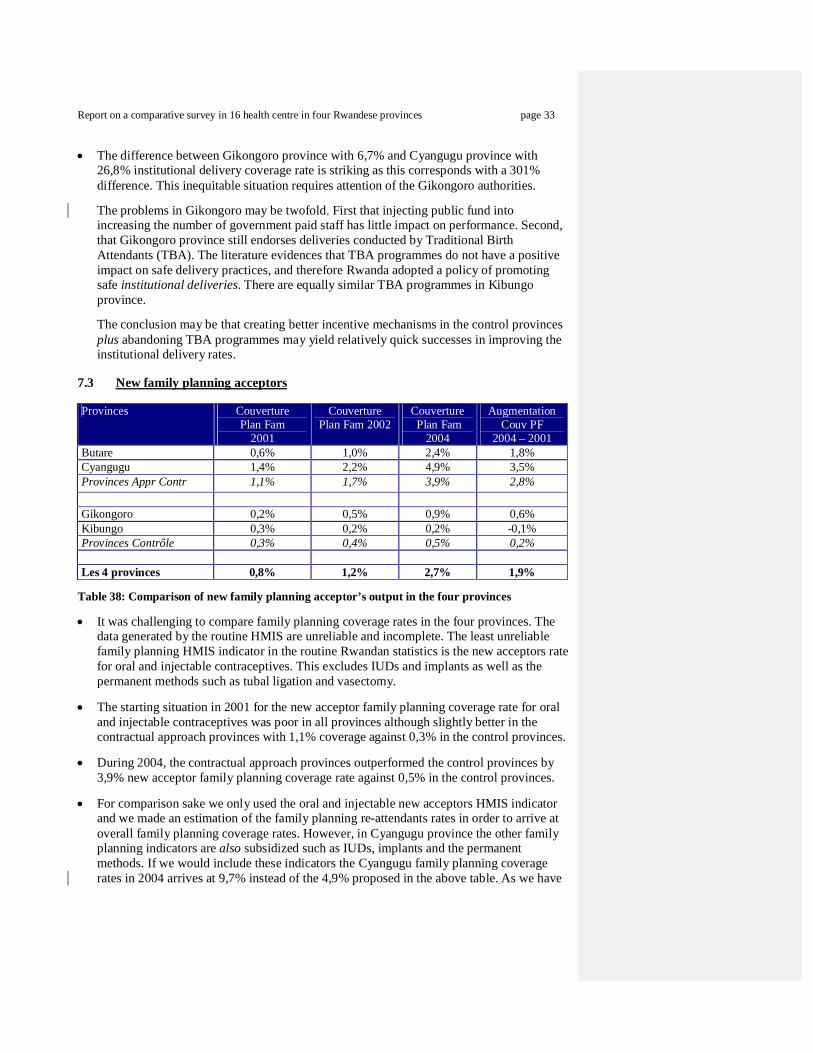
Report on a comparative survey in 16 health centre in four Rwandese provinces page 33
The difference between Gikongoro province with 6,7% and Cyangugu province with 26,8% institutional delivery coverage rate is striking as this corresponds with a 301% difference. This inequitable situation requires attention of the Gikongoro authorities.
The problems in Gikongoro may be twofold. First that injecting public fund into increasing the number of government paid staff has little impact on performance. Second, that Gikongoro province still endorses deliveries conducted by Traditional Birth Attendants (TBA). The literature evidences that TBA programmes do not have a positive impact on safe delivery practices, and therefore Rwanda adopted a policy of promoting safe institutional deliveries. There are equally similar TBA programmes in Kibungo province. The conclusion may be that creating better incentive mechanisms in the control provinces plus abandoning TBA programmes may yield relatively quick successes in improving the institutional delivery rates.
7.3 New family planning acceptors Provinces Couverture
Plan Fam 2001
Couverture Plan Fam 2002
Couverture Plan Fam
2004
Augmentation Couv PF
2004 – 2001 Butare 0,6% 1,0% 2,4% 1,8% Cyangugu 1,4% 2,2% 4,9% 3,5% Provinces Appr Contr 1,1% 1,7% 3,9% 2,8% Gikongoro 0,2% 0,5% 0,9% 0,6% Kibungo 0,3% 0,2% 0,2% -0,1% Provinces Contrôle 0,3% 0,4% 0,5% 0,2% Les 4 provinces 0,8% 1,2% 2,7% 1,9%
Table 38: Comparison of new family planning acceptor’s output in the four provinces
It was challenging to compare family planning coverage rates in the four provinces. The data generated by the routine HMIS are unreliable and incomplete. The least unreliable family planning HMIS indicator in the routine Rwandan statistics is the new acceptors rate for oral and injectable contraceptives. This excludes IUDs and implants as well as the permanent methods such as tubal ligation and vasectomy.
The starting situation in 2001 for the new acceptor family planning coverage rate for oral and injectable contraceptives was poor in all provinces although slightly better in the contractual approach provinces with 1,1% coverage against 0,3% in the control provinces.
During 2004, the contractual approach provinces outperformed the control provinces by 3,9% new acceptor family planning coverage rate against 0,5% in the control provinces.
For comparison sake we only used the oral and injectable new acceptors HMIS indicator and we made an estimation of the family planning re-attendants rates in order to arrive at overall family planning coverage rates. However, in Cyangugu province the other family planning indicators are also subsidized such as IUDs, implants and the permanent methods. If we would include these indicators the Cyangugu family planning coverage rates in 2004 arrives at 9,7% instead of the 4,9% proposed in the above table. As we have
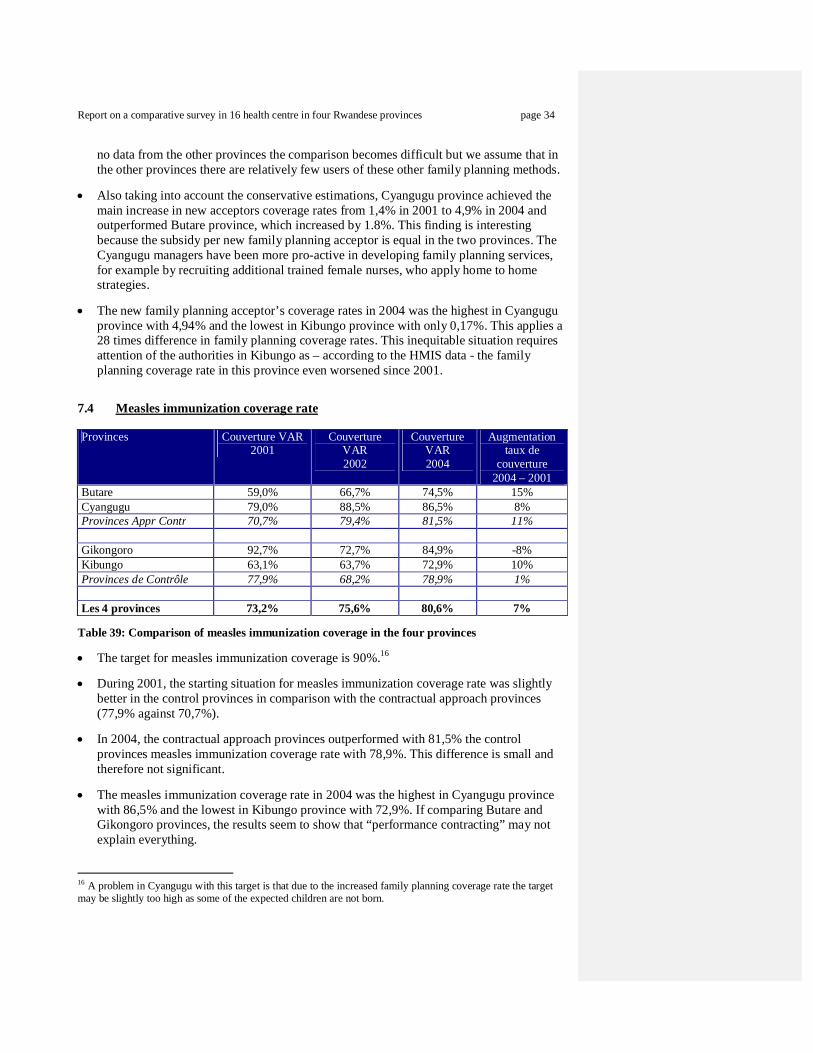
Report on a comparative survey in 16 health centre in four Rwandese provinces page 34
no data from the other provinces the comparison becomes difficult but we assume that in the other provinces there are relatively few users of these other family planning methods.
Also taking into account the conservative estimations, Cyangugu province achieved the main increase in new acceptors coverage rates from 1,4% in 2001 to 4,9% in 2004 and outperformed Butare province, which increased by 1.8%. This finding is interesting because the subsidy per new family planning acceptor is equal in the two provinces. The Cyangugu managers have been more pro-active in developing family planning services, for example by recruiting additional trained female nurses, who apply home to home strategies.
The new family planning acceptor’s coverage rates in 2004 was the highest in Cyangugu province with 4,94% and the lowest in Kibungo province with only 0,17%. This applies a 28 times difference in family planning coverage rates. This inequitable situation requires attention of the authorities in Kibungo as – according to the HMIS data - the family planning coverage rate in this province even worsened since 2001.
7.4 Measles immunization coverage rate Provinces Couverture VAR
2001 Couverture
VAR 2002
Couverture VAR 2004
Augmentation taux de
couverture 2004 – 2001
Butare 59,0% 66,7% 74,5% 15% Cyangugu 79,0% 88,5% 86,5% 8% Provinces Appr Contr 70,7% 79,4% 81,5% 11% Gikongoro 92,7% 72,7% 84,9% -8% Kibungo 63,1% 63,7% 72,9% 10% Provinces de Contrôle 77,9% 68,2% 78,9% 1% Les 4 provinces 73,2% 75,6% 80,6% 7%
Table 39: Comparison of measles immunization coverage in the four provinces
The target for measles immunization coverage is 90%.16
During 2001, the starting situation for measles immunization coverage rate was slightly better in the control provinces in comparison with the contractual approach provinces (77,9% against 70,7%).
In 2004, the contractual approach provinces outperformed with 81,5% the control provinces measles immunization coverage rate with 78,9%. This difference is small and therefore not significant.
The measles immunization coverage rate in 2004 was the highest in Cyangugu province with 86,5% and the lowest in Kibungo province with 72,9%. If comparing Butare and Gikongoro provinces, the results seem to show that “performance contracting” may not explain everything.
16 A problem in Cyangugu with this target is that due to the increased family planning coverage rate the target may be slightly too high as some of the expected children are not born.

Report on a comparative survey in 16 health centre in four Rwandese provinces page 35
8. Health centre quality review
We conducted a quality survey in the 16 random selected health centres. This survey was conducted by one supervisor from Cyangugu province and an independent former supervisor from Butare province. They did not visit any health centres for which they are also responsible in their daily jobs and we stressed during their training that they should score the indicators in an unbiased fashion. The 13 indicators – selected from a list of quality indicators recommended by the Ministry of Health – are shown in table 40. Availability of items has been checked for the whole year 2004. The correct utilization of partogrammes during deliveries and prescription practices concerning malaria treatment were assessed by taking a sample of 10 patient files in each health centre.
Each health centre could score one point for each of the 13 quality indicators and each province could score a maximum of 52 points ( = 4 health centres x 13 points). While such a scoring approach provides insights, one must not over interpret it. We acknowledge that such a score provides a very narrow representation of what quality of care really is. Indicateurs de qualité Butare
n = 4
Cyan-gugu
n = 4
Score provinces
Appr Contrn = 8
Gikon-goro
n = 4
Kibun-go
n = 4
Score provinces control
n = 8
Disponibilité médicaments traceurs Ministère de Santé (Amoxycilline, SRO etc..)
4 4 4,0 2 4 3,0
La prise en charge satisfaisante du Paludisme Simple 1 4 2,5 3 3 3,0 La prise en charge satisfaisante du Paludisme Grave 3 2 2,5 2 2 2,0 Utilisation systématique du partogramme 3 4 3,5 0 0 0,0 La prise de la tension artérielle lors de l’accouch.17 2 3 2,5 1 1 1,0 Prise systématique de l’APGAR lors de l’accouch.5 3 3 3,0 2 2 2,0 Disponibilité d’une toise 4 4 4,0 4 0 2,0 Disponibilité d’une centrifugeuse 4 4 4,0 2 2 2,0 Disponibilité permanentes des vaccins au niveau des centres de santé (absence de rupture de stock)
3 2 2,5 2 3 2,5
Contrôle régulière de la chaîne de froid 2 2 2,0 2 2 2,0 Respect des normes de la conservation des vaccins 2 4 3,0 2 4 3,0 Références avec feed-back au niveau du centre de santé qui a référé
1 2 1,5 0 0 0,0
Communication radio ou autres communications entre les centres de santé et l’hôpital de district
4 4 4,0 0 4 2,0
Total (n=52) 36 42 39,0 22 27 24,5 Score par rapport maximum possible = 52 points 69% 81% 75% 42% 52% 47%
Table 40: Scoring of 13 quality indicators in the 16 health centres of sample. The results were the following:
The contractual approach provinces outperformed the control provinces by a 75% score against 47%.
Cyangugu province health centres had a better score with 81% against Butare with 69%.
These results show that the output-based approach is compatible with technical quality. It seems that it can even enhance it.
17 The drawback of these 2 indicators is that their observation was dependent on the previous indicator (recording on the partogramme).

Report on a comparative survey in 16 health centre in four Rwandese provinces page 36
More intensified quality reviews (especially in Cyangugu Province) as well as the effort to attract more patients may contribute to this better quality score in the contractual approach provinces.
A more thorough examination and monitoring of the quality of care would be necessary.
Report on a comparative survey in 16 health centre in four Rwandese provinces page 37
9. Findings and recommendations
9.1 Main findings
Health workers in Butare and Cyangugu provinces receive on average a 23% higher income than their colleagues in Gikongoro and Kibungo provinces. The main explaining factor is the bonus paid by the health centre management originating from the performance based subsidies.
All respondents in Butare, Gikongoro and Kibungo provinces thought that their income is insufficient. In contrast, in Cyangugu province, 56% of the respondents thought that their income is sufficient. This perception in Cyangugu corresponds with the higher average health worker income (= $116 in Cyangugu, $101 in Butare, $90 in Gikongoro, and $75 in Kibungo).
In Butare province health centres forward 95% of their subsidies to their staff, while this is on average 40% in Cyangugu. This difference can be explained by two reasons. Firstly, a larger degree of autonomy was let to the health centre management in Cyangugu province. Secondly, the subsidy for the four Cyangugu health centres of on average $ 0,56 per capita per year is much higher than in Butare with only $0,25.
Seventy-two per cent of the respondents in Butare and Cyangugu thought that the new scheme created a relationship between their performance and their income. This positive relationship was with 81% stronger in Cyangugu than in Butare with 63%. In contrast, none of the respondents in Gikongoro or Kibungo province thought that there was a positive relationship between their performance and income. One would also not expect such a relationship as these control provinces do not apply performance based schemes.
The average number of hours worked is slightly higher in Cyangugu province with 8.2 and slightly lower in Gikongoro province with 7.4 hours. Nevertheless, only 25% of the respondents in Cyangugu province thought they were overloaded with work, while this was 50% in Butare and Gikongoro provinces and 63% in Kibungo province. Most likely the higher average health worker income in Cyangugu province compensates for the increased workload.
Health centre staff opinion about external district health team supervision in the contractual approach provinces is better than in the control provinces. 94% of respondents in Cyangugu province and 69% in Butare province think that there are regular external supervisions. In Kibungo, 56% of the respondents think that there are regular district supervisions, while this is only 31% in Gikongoro.
Staff opinion about health centre internal technical meetings in the contractual approach provinces is better than in the control provinces: 100% of respondents in Cyangugu province and 94% in Butare province said that there are regular technical meetings. In Gikongoro, 75% of respondents say that there are regular technical meeting, while this is only 50% in Kibungo.
The relatively poor opinion of health workers about external supervision and internal technical meetings in Gikongoro province may be understood in the absence of significant external partners helping with supervision and quality assurance. However, the poor rating on external supervision and technical meetings in Kibungo province is surprising as this
Report on a comparative survey in 16 health centre in four Rwandese provinces page 38
province benefits from a substantial European Union project focusing on supervision as one of the main components. Both health workers and the “titulaires” thought that the supervision visits of the EU programme were not regular and that the quality of the support was poor. None of the respondents was satisfied with the performance of this project, and some respondents said that it was not clear what its objectives were.
All health centre respondents in Cyangugu province considered the support and monitoring from the international NGO Cordaid – which manages the PBF scheme – to be regular and of good quality. Cordaid supervisors monthly verify the registers of the health centres before paying the subsidies. The respondents also thought that while conducting this verification the Cordaid supervisors also helped them to improve the quality of the data collection mechanism and other activities such as community outreach.
The quality of HealthNet International (HNI) – which managed the Butare scheme - was considered good, but not regular. The reason for the irregularity of the HNI team visits was their limited financial resources and, as a result, the absence of a team capable to conduct systematic visits. Leaving such tasks to already overburdened district supervisors would have to be reconsidered if more resources will be injected through performance schemes in Butare province. Indeed, for reducing the risk of fraud (e.g. forged output data) contracting requires close monitoring and auditing of providers. The experience in Cyangugu could be a source of inspiration.
The support by the vertical programmes is generally appreciated by the health centres in terms of quality, but they are not regular. The most frequent programme mentioned by the respondents was the TB programme PNILT.
64% of the respondents in Cyangugu and 27% in Butare thought that the contractual approach meant a big improvement of their personnel well-being. Equally, a higher proportion of 86% in Cyangugu thought that the contractual approach meant a big improvement for their income versus 55% in Butare. 91% in Butare and 86% in Cyangugu think that the contractual approach meant a big improvement for their work conditions. 100% in Cyangugu and 82% in Butare think that the contractual approach meant a big improvement for the quality of services provided to patients.
Most respondents from Butare and Cyangugu health centres wished that the contractual approach should continue. Two respondents said that contractual approach should also be introduced in the other provinces of Rwanda. All respondents from Gikongoro and Kibungo – who heard about the contractual approach - thought that it would be a good idea to introduce a similar performance based system in their provinces. We believe that the general satisfaction observed among the staff in Butare and Cyangugu health centers is crucial information for the policy makers: the health center staff is ready to accept that part of their income is related to performance. This could mean that the health staff of Rwanda would not oppose to a major reform in that direction. The fact that the introduction of the PBF goes along with an injection of funds for their income is of course not neutral.18
18 On the basis of the information collected by Nyandekwe and Meessen 2005, the PBF in Butare and Cyangugu health centers have topped up the individual income for an amount between 21% and 68% (average for all categories of staff, all the health centers).
Report on a comparative survey in 16 health centre in four Rwandese provinces page 39
62% of respondents in Butare thought that the number of indicators subsidized were not sufficient, while only 19% of respondents in Cyangugu thought the same. 44% of respondents in Butare thought that the subsidy per indicator was insufficient, while 6% of respondents in Cyangugu thought the same. While Butare pays F 2.500 for a delivery – and this is considered reasonable – the F 40 for an OPD consultancy is considered low by the staff. Three respondents in Butare thought that the community aspect of the contractual approach was inadequately developed.
9.2 Main findings HMIS output and external support
The contractual approach provinces outperformed the control provinces on all indicators in absolute achievement, in the proportional increase per indicator since the introduction of the output based schemes (see tables 41 & 42) as well as in quality (see table 40). For example there is a 28 times difference in family planning coverage between Cyangugu and Kibungo provinces and there is a 4 times difference between the institutional delivery coverage rates between Cyangugu and Gikongoro provinces.
Provinces Couverture
Cons Externe 2004
Couverture Accouch Inst
2004
Couverture Plan Fam
2004
Couverture VAR 2004
Butare 0,47 19,1% 2,4% 74,5% Cyangugu 0,61 26,8% 4,9% 86,5% Provinces Appr Contractuelle 0,55 23,1% 3,9% 81,5% Gikongoro 0,24 6,7% 0,9% 84,9% Kibungo 0,37 12,7% 0,2% 72,9% Provinces Contrôle 0,30 9,7% 0,5% 78,9% Les 4 provinces 0,47 18,2% 2,7% 80,6%
Table 41: Performance of output indicators in four provinces in 2004 Provinces Augmentation
Consultation Externe
2004 –2001
Augmentation Couverture
Accouch Inst 2004 – 2001
Augmentation Couverture Plan
Fam 2004 – 2001
Augmen-tation VAR 2004 – 2001
Butare + 0,27 + 12,7% + 1,8% + 15% Cyangugu + 0,37 + 5,8% + 3,5% + 8% Provinces Appr Contractuelle + 0,33 + 10,9% + 2,8% + 11%
Gikongoro + 0,06 + 2,6% + 0,6% - 8% Kibungo + 0,15 + 3,3% - 0,1% + 10% Provinces Contrôle + 0,10 + 2,9% + 0,2% + 1%
Les 4 provinces + 0,25 + 7,8% + 1,9% + 7% Table 42: Overview of incremental increase in four main indicators

Report on a comparative survey in 16 health centre in four Rwandese provinces page 40
Comparison between the four provinces and conclusions:
The comparison between the two contractual approach provinces Butare and Cyangugu and the control provinces Gikongoro and Kibungo confirms the first working assumption that performance-based financing is more efficient than classical input-based approach (see paragraph 1,2).
A further analysis of Gikongoro and Butare provinces is also illustrating: while the Butare health centres received in 2004 less external funding than the Gikongoro health centers ($0.25 per capita per year versus $0.34), their output was much higher. It is difficult to see another explanation than the way this funding was accessed by the health centers: through PBF in Butare, through salaries exclusively in Gikongoro.19 This confirms the second working assumption that performance based systems is more cost-effective than input-based financing through government salary payments.
The Cyangugu province scheme outperformed the other provinces on all output indicators (see table 41 & 42) as well as on the quality indicators (see table 40). It must be noted that the province has the highest external subsidy level for the health centres ($0.58). While this can be seen as a confounding factor for the study, we perceive it more as the demonstration of the dynamism of the project team to attract resources to a very remote province of Rwanda. Donors seem interested to support projects achieving results!
Three provinces benefited from a significant support by international assistance in 2004: Butare, Cyangugu and Kibungo. The relative low performance by the Kibungo health centres raises serious questions about the effectiveness of this intervention. The only explanation we see is the way the assistance is organized. While Butare and Cyangugu projects relied on operational proximity (through international NGOs) plus a performance-based approach, the Kibungo project is characterized by centralized management at Kigali level + input-based financing. We found that the Kibungo health centres only received a very limited amount of direct financial assistance. Such problems do not exist with the output-based approach: cash subsidies are ear-marked for the front line actors of the health system and they receive the subsidy justified by their performance.
Input financing approach - such as in Kibungo province – does not link cash support with performance, henceforth our difficulty to appreciate the exact assistance received. This approach leaves the management of input projects with little choice than to support the health providers in kind such as with medical equipment, drugs, furniture, and stationery. However, in kind support is rarely appreciated by health facility managers including the one’s in Kibungo we interviewed during this World Bank study. Some respondents justifiably argued that they have a better understanding of what they really need in their health centre than central administrators in Kigali. As a result, in kind provision of inputs is often wasteful in the sense that inputs are not needed, not enough or too much.
An additional advantage of performance based financing for peripheral health providers is that it strengthens the local economy. Cash subsidies instead of in-kind support means that health centre managers inject cash into the local economy by recruiting local craftsmen to carry out repairs, to conduct minor rehabilitations, to make furniture, etc. One health centre in Cyangugu built a new in-patient ward and a waiting area with their PBF subsidies. The subsidies can also be used for staff recruitment such as shown in the four Cyangugu health centres, which employed 30 additional health workers.
19 One must take into account that the district of Kabutare in the Butare project received external assistance during the last ten years, while this was not the case in Gikongoro Province.
Report on a comparative survey in 16 health centre in four Rwandese provinces page 41
9.3 Recommendations This section is meant as recommendations which require sharing and discussion, preferably during a conference with the main stakeholders in Rwanda. The authors of the report are aware about the importance for ownership of the findings as well as for the recommendations and do therefore not mean to be prescriptive. This section could be considered as a starting point for the conference.
The findings of the study confirm the rationality of the policy statement of the government wishing to expand performance based schemes to other provinces in Rwanda. The difference in terms of achieving the provision of the basic health package between the contractual approach and the control provinces are so large that it constitutes an inequitable situation that deserve attention by the national authorities to address. Scaling up of PBF schemes to other provinces in Rwanda is justified and feasible.
More government investment for increasing the number of government staff such as in Gikongoro province has a low cost-effectiveness if additional performance based incentives are not considered simultaneously. Such centralized salary payments should therefore be considered with care and may be replaced by investing public money into the extension of performance based subsidy schemes, which would also better encourage autonomous and innovative management of health facilities.
The Kibungo province European Union supported project shows that input-based aid has inferior results in comparison with the performance based financing support such as implemented in Butare and Cyangugu province. Kibungo province may benefit from the introduction of performance based funding mechanisms. External support may also need to be redirected towards the front line services – away from the administrative central levels. As a general guideline we propose that PBF projects should approximately allocate 70% of their budget for subsidy payments for health centres, hospitals and other potential providers. The remaining 30% is for district health teams, fund holders, community based organizations and other overheads such as consultancy support and operational research.
For successfully expanding performance based schemes in Rwanda we recommend a number of conditions to put into place. There should be adequate funding as well as adequate monitoring, verification, auditing and evaluation capacity of the contracting process. Involvement of local community organizations in the verification of output as well as patient satisfaction constitutes an important strategy to promote the consumer voice. NGOs may play an important role in terms of monitoring and auditing. The comparative advantages of the Rwandese private sector (grassroots organizations, NGOs and private health care providers) are instrumental for success and should be considered for inclusion. This is based on the principle that government should encourage participation and competition (when it is relevant and feasible) for the efficient use of public funds. Taking benefits of strengths of other actors may lead to a reconsideration of the key functions to be fulfilled by the government. Surely, no one else than the government can regulate the health market (by setting and monitoring quality standards, defining health packages and licensing health providers).
Adequate steering, monitoring and verification capacity as well as administrative and financial authority is important for the successful application of performance based schemes. This can best be done such as in Cyangugu and Butare locally by creating capable fund holder organizations, which have direct contact with the health providers (instead of doing this in a centralized fashion such as in the Kibungo project). Theory
Report on a comparative survey in 16 health centre in four Rwandese provinces page 42
indicates that preferably, fund holder should be independent from the local health authorities (in order to avoid conflicts of interests).
The fund holder organizations are important to monitor and negotiate performance with the health providers, to maintain a relationship with users, to audit subsidies and to be flexible in finding quick solutions for local problems. Experience in the two provinces as well as in other countries show that fund holder organizations with for example 4-7 qualified staff may be required on average for every 300.000 – 700.000 inhabitants. The exact population per fund holder depends on geographic and operational factors, the number of activities to be purchased and probably the maturity of the scheme. For example, does the fund holder only manage funds for the standard health packages (see table 3 and 4) or does it also include additional indicators such as for HIV/AIDS, which tend to be funded through separate sources? Obviously, if there are more indicators and more specialization required, a smaller target population per fund holder is appropriate. Introducing a PBF scheme means some major changes in the operation of a rural health system. We believe that this transformation must be accompanied by some close technical assistance, at least at the initial stage. We recommend any donor considering adopting PBF as a strategy for rural Rwanda to involve at least 1 operational organization to be present locally in the operational area.
If scaling up the PBF approach is considered, some constraints at national level must be tackled. It is unlikely in the short term that all staff for fund holder organizations can be recruited within Rwanda itself. This also if considering the effects of HIV-AIDS both on indigenous capacity and increases in the expected work load to deal with the pandemic. Skilled public health doctors, managers and other highly skilled staff to negotiate and monitor contracts are still rare in Rwanda and the need for them is acute. This coincides with the increase in funds for indicators linked to the Millennium Goals both from Rwandese government sources and external sources. The involvement of a greater number of international organizations, especially with operational capacities at peripheral level, will therefore probably be necessary.
Performance based approaches require some major changes in the practices and capacities of the different actors. New functions are to be put in place such as monitoring and verification of outputs, development of contracts with the health providers, data collection and processing new rules to be enforced. Rwanda must not be too hasty in developing fixed strategies during its scaling up: a constant concern for learning from existing projects must be practiced. Coordination of the performance strategy with new activities (e.g. HIV/AIDS) will particularly be a challenge. If some range of maneuver must be let to experienced actors, the Ministry of Health has to closely monitor and steer the overall process. The recent creation of a technical unit at Kigali is a good step forward.
Verification of output in order to justify the subsidies requires the fund holder and the district health teams to play an important role in strengthening the health management information system. As each activity is subsidized with public money, the payment should be considered the same manner as any other invoice under the scrutiny of government auditing procedures, and not merely an entry in a HMIS computer. It requires supervisors, who verify and sign off the output in the registers of each provider as well as verifying through random sample surveys among patients that the activity took place. For this purpose supervisors may be recruited and trained as well as contracting local community based organizations which conduct random patient surveys.

Report on a comparative survey in 16 health centre in four Rwandese provinces page 43
The exact role of the district health teams under PBF systems will have to be clarified. An option would be to strengthen their regulatory role. Yet, one must not underestimate their function today in terms of coordination and support to health facilities. Our feeling is that a new model of organizing the health system is under construction.
We recommend enhancing as much as possible the autonomy of health providers, which operate in some competition with each other for the funds. Yet, this does not mean a laissez-faire type of mechanism. On the contrary, control mechanisms can be put into place for example by health provider three-monthly action plans, which can be accepted or not by both the district health team and the fund holder. Once an action plan is accepted the verification comes from how the subsidies are used in terms of outputs of good quality. How internally the finds are used is of much less interest for the supervisors.
Involvement of the private sector providers in the contracting system seems to be a powerful strategy to extend the coverage. The Cyangugu health centers have so far sub-contracted 19 private clinics. This approach is seen as having at least two advantages: (1) the dispensaries improve geographic coverage and assist to achieve the targets; (2) involving the private sector implies that the private clinics could be submitted to quality assurance (e.g. through a licensing approach). Yet, as this approach conveys also some risks, a specific assessment by the Ministry of Health of the Cyangugu experience could be insightful and necessary.
The experiences in Butare and Cyangugu provinces have shown that a participatory approach is also important to coordinate at the local operational level the above described functions (regulation, provision, fund disbursement, consumer voice). Such participatory mechanisms were piloted in Butare province through the Steering Committee and in Cyangugu province through the Inter Administrative District Health Committee (ADVAS).
In terms of funding, the relationship ‘higher subsidy – higher outputs’ observed in Cyangugu province in comparison with Butare province indicates that it would be worth to increase the injection of funds in Butare (possibly combined with an increase in the number of indicators). There are still some gains to reap between $0,25 and $0,58.
Provinces 2002
Subside externe cap / an
2004 Subside externe
cap / an
2004 /2002 Augmentation
en $ Butare $ 0,08 $ 0,25 $ 0,17 Cyangugu $ 0,09 $ 0,58 $ 0,49 Provinces Appr Contr $ 0,09 $ 0,45 $ 0,36 Gikongoro $ 0,17 $ 0,34 $ 0,17 Kibungo $ 0,04 $ 0,18 $ 0,14 Provinces Control $ 0,10 $ 0,25 $ 0,15 Tous provinces $ 0,09 $ 0,38 $ 0,29
Table 43: External support in four provinces in 2002 and 2004.
Report on a comparative survey in 16 health centre in four Rwandese provinces page 44
Cyangugu province now spends approximately $1,50 per capita per year (including the subsidies for the four district hospitals, four district health management teams, 25 local community associations verifying patient satisfaction, and overheads for the monitoring team). It is expected that by 2007 the required funding for the Cyangugu scheme at its lowest estimate may reach $3.00 per capita and this experience could also serve as an example for other PBF provinces, whereby the subsidy increases gradually from $1,00 per capita in year one to $3 in year four. The need for $3,00 per capita per year can be approximately broken down as follows:
o Once target achievement improves at health centre level, funding must also
increase. For example, the increase of couples using family planning in Cyangugu province from 2% to 10% and a few health centres even reaching 20-33% couple protection rates, may absorb by 2007 $0,40 per capita without any increase in the amount of subsidy per activity.
o Total cost for the minimum health package at health centre level (see table 3): $1,10 per cap / year.
o District hospital subsidies (see table 4): $0,50 per cap / year o Including some additional indicators such as for HIV/AIDS,
Tuberculosis, hygiene, or nutrition: $0,60 per cap / year o Cost for operation fund holder, district health team, and
community based organizations conducting patient surveys: $0,80 per cap / year
Obviously in each specific project a more detailed costing would be required which calculates the required funding on the above variables as well as other specific variables.
In fact, the World Bank and the Commission on Macro Economics and Health argue for much higher external funding in the range of between $ 12 – 34 per capita per year (World Development Report 1993; WHO 2002). Our experience in countries such as Afghanistan, Vietnam and Cambodia makes us believe that $3-5 per capita are an absolute minimum for external investments at decentralized levels (sources: Ben Loevinsohn for Afghanistan, Indu Bushan for Cambodia, and the EC Delegation in Hanoi).
Some observers in Rwanda think that PBF schemes only require a fraction of the above mentioned $3 per capita per year. They may have overlooked the relationship that once performance based schemes become successful that total funding must also increase. Successful provision of health packages (including for the poorest of the poor), inclusion of additional indicators and the need to involve the private sector in providing the health packages all increase the need for funding. We hope that this report clarifies the funding issue as this would allow decision makers to base their analysis and expectations on realistic assumptions.
New indicators so far not yet tested may include the promotion of the use of latrines, mental health, access to clean water, access to supplementary feeding, etc. So far Cyangugu province applies 13 indicators at health centre level, which exclude nutrition, water & sanitation, mental health as well as TB and HIV/AIDS. Integration of such indicators in the performance based schemes requires additional funds and collaboration with the different vertical programmes in Rwanda.
An important objective of PBF could be to improve financial access for the population and in particular for the very poor groups in society. The study has shown that community financing as proportion of total health centre revenues in Butare and Cyangugu seem to have been reduced more than in the control provinces. This was achieved as the result of
Report on a comparative survey in 16 health centre in four Rwandese provinces page 45
the decision of health centre managers to reduce fees in order to increase utilization and then to obtain more subsidies. It would be worth to explore the potential to systematize this practice (e.g. pay higher subsidies for each OPD consultation and assuring that user fees are reviewed downward).
Despite that PBF has led to a reduction in the financial contribution by the users, we do not know how this reduction was distributed among the population. Much generally, we are still very ignorant whether the poorer groups have significantly benefited from the changes brought by the scheme. This issue deserves a specific documentation in the future. In the meantime, Rwanda could already explore the potential of strategies such as the health equity funds20,21.
There are still a lot of things that we must better explore, document and analyze with PBF in Rwanda, including in the experiences already in place such as the question how to urgently document the different strategies adopted by the health centers in Cyangugu to boost the coverage with family planning as well as the collaboration with the private sector. There will also be a need to learn lessons concerning the coordination mechanisms (such as the Steering Committee in Butare and the ADVAS committee in Cyangugu) in the context not only of the health services but also considering decentralization and administrative reforms in Rwanda aiming to change the role and size of the administrative districts and provinces. Other key questions are:
o What are the best mechanisms to ensure that PBF contributes positively to quality
of care? o Should the subsidy structure (e.g. with escalating subsidies) be different for
activities with ‘natural’ different coverage rates such the high achievement in Rwanda in terms of EPI and the very low coverage with family planning.
o What are the relevant indicators for complex services such as nutrition or HIV/AIDS.
o How many staff are required to operate a fund holder organization.
Building the relevant knowledge will clearly call for good collaboration between the different actors (e.g. Ministry of Health, MINECOFIN, donors, aid agencies, NGOs, schools of public health). It will require platforms for sharing experiences and the continued commitment of all to produce a better outcome for the population of Rwanda.
20 Cf. Meessen B. and Ir P., “Overcoming Barriers: Health Equity Fund in Cambodia”, Development Outreach, May 2005 (www.worldbank.org/devoutreach). 21 Caritas already developed such support for the very poor mechanisms in Rwanda.
Field Code Changed