Comparison of the purity of samples of organic solvents by ... · The effect of filtration through...
10
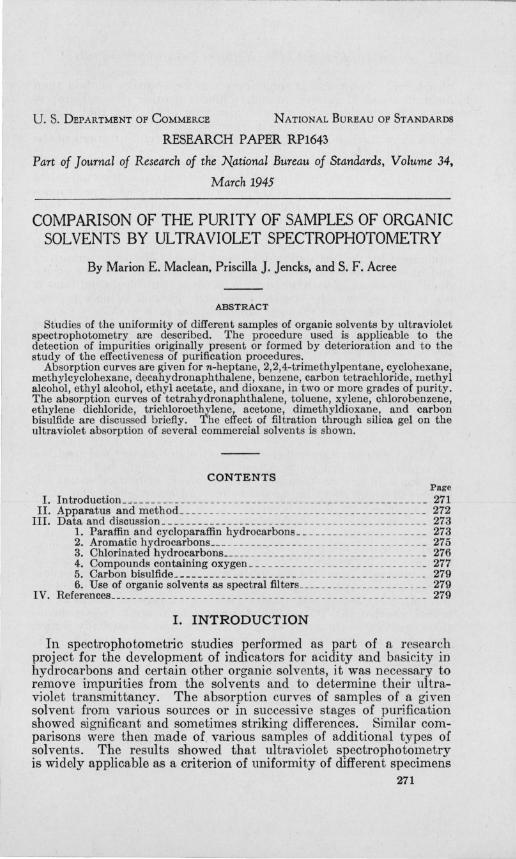
U. S. DEPARTMENT OF COMMERCE NATIONAL BUREAU OF STANDARDS RESEARCH PAPER RPl643 Part of Journal of Research of the National Bureau of Standards, Volume 34, March 1945 COMPARISON OF THE PURITY OF SAMPLES OF ORGANIC SOLVENTS BY ULTRA VIOLET SPECTROPHOTOMETRY By Marion E. Maclean, Priscilla J. Jencks, and S. F. Acree ABSTRACT Studies of the uniformity of different samples of organic solvents by ultraviolet spectrophotometry are described. The procedure used is applicable to the detection of impurities originally present or formed by deterioration and to the study of the effectiveness of purification procedures. Absorption curves are given for n-heptane, 2,2,4-trimethylpentane, cyclohexane, methylcyclohexane, decahydronaphthalene, benzene, carbon tetrachloride, methyl alcohol, ethyl alcohol, ethyl acetate, and dioxane, in two or more grades of purity. The absorption curves of tetrahydronaphthalene, toluene, xylene, chlorobenzene, ethylene dichloride, trichloroethylene, acetone, dimethyldioxane, and carbon bisulfide are discussed briefly. The effect of filtration through silica gel on the ultraviolet absorption of several commercial solvents is shown. CONTENTS Page 1. Introduction_ ___ __ _ __ _ _ __ __ _ _ ___ __ ____ _ ___ ____ __ _ __ __ __ _ ___ _ _ _ __ 271 II. Apparatus and method _ __ __ _ ___ _ __ ___ ___ __ ____ _ ____ ___ _ __ _ __ _ __ _ 272 III. Data and discussion _____________ ___ ___ __ ___ ____ ___________ ______ 273 1. Paraffin and cycloparaffin hydrocarbons __ __ ________ _______ ___ 273 2. Aromatic hydrocarbons ___ __ __ ____ ___ ____________ ______ ____ _ 275 3. Chlorinated hydrocarbons __ ___ ___ _____ ___________ __ ________ _ 276 4. Compounds containing oxygen _ _ _ _ ___ ____ ____ ___ _ __ _ __ _ _ _ _ __ 277 5. Carbon bisulfide _____________________ _________ ____________ . 279 6. Use of organic solvents as spectral filters ______ _____________ . __ 279 IV. References ____ ____ _____ _______________ __ ___ __ ___ __ ___ ___ __ _ ____ _ 279 1. INTRODUCTION In spectrophotometric studies performed as part of a research project for the development of indicators for acidity and basicity in hydrocarbons and certain other organic solvents, it was necessary to remove impurities from the solvents and to determine their ultra- violet transmittancy. The absorption curves of samples of a given solvent from various sources or in successive stages of purification showed significant and sometimes striking differences. Similar com- parisons were then made of various samples of additional types of solvents. The results showed that ultraviolet spectrophotometry is widely applicable as a criterion of uniformity of different specimens 271
Transcript of Comparison of the purity of samples of organic solvents by ... · The effect of filtration through...
U. S. DEPARTMENT OF COMMERCE NATIONAL BUREAU OF STANDARDS
RESEARCH PAPER RPl643
Part of Journal of Research of the National Bureau of Standards, Volume 34,
March 1945
COMPARISON OF THE PURITY OF SAMPLES OF ORGANIC SOLVENTS BY ULTRA VIOLET SPECTROPHOTOMETRY
By Marion E. Maclean, Priscilla J. Jencks, and S. F. Acree
ABSTRACT
Studies of the uniformity of different samples of organic solvents by ultraviolet spectrophotometry are described. The procedure used is applicable to the detection of impurities originally present or formed by deterioration and to the study of the effectiveness of purification procedures.
Absorption curves are given for n-heptane, 2,2,4-trimethylpentane, cyclohexane, methylcyclohexane, decahydronaphthalene, benzene, carbon tetrachloride, methyl alcohol, ethyl alcohol, ethyl acetate, and dioxane, in two or more grades of purity. The absorption curves of tetrahydronaphthalene, toluene, xylene, chlorobenzene, ethylene dichloride, trichloroethylene, acetone, dimethyldioxane, and carbon bisulfide are discussed briefly. The effect of filtration through silica gel on the ultraviolet absorption of several commercial solvents is shown.
CONTENTS Page
1. Introduction_ _ _ _ _ _ _ _ _ _ _ _ _ _ _ _ _ _ _ _ _ _ _ _ _ _ _ _ _ _ _ _ _ _ _ _ _ _ _ _ _ _ _ _ _ _ _ _ _ _ _ _ 271 II. Apparatus and method _ _ _ _ _ _ _ _ _ _ _ _ _ _ _ _ _ _ _ _ _ _ _ _ _ _ _ _ _ _ _ _ _ _ _ _ _ _ _ _ _ _ 272
III. Data and discussion _____________ ___ ___ __ ___ ____ ___________ ______ 273 1. Paraffin and cycloparaffin hydrocarbons __ __ ________ _______ ___ 273 2. Aromatic hydrocarbons ___ __ __ ____ ___ ____________ ______ ____ _ 275 3. Chlorinated hydrocarbons __ ___ ___ _____ ___________ __ ________ _ 276 4. Compounds containing oxygen _ _ _ _ _ _ _ _ _ _ _ _ _ _ _ _ _ _ _ _ _ _ _ _ _ _ _ _ _ _ 277 5. Carbon bisulfide _____________________ _________ ____________ . 279 6. Use of organic solvents as spectral filters ______ _____________ . __ 279
IV. References ____ ____ _____ _______________ __ ___ __ ___ __ ___ ___ __ _____ _ 279
1. INTRODUCTION
In spectrophotometric studies performed as part of a research project for the development of indicators for acidity and basicity in hydrocarbons and certain other organic solvents, it was necessary to remove impurities from the solvents and to determine their ultraviolet transmittancy. The absorption curves of samples of a given solvent from various sources or in successive stages of purification showed significant and sometimes striking differences. Similar comparisons were then made of various samples of additional types of solvents. The results showed that ultraviolet spectrophotometry is widely applicable as a criterion of uniformity of different specimens
271

272 Journal of Researoh of the National Bureaw of Standards
of a given solvent and is sometimes a more sensitive method than determinations of density, refractive index, or other physical properties. Tills should not be surprising in view of the fact that a large number of the organic solvents in common use may contain impurities which show intense spectral absorption, even in concentrations of the order of lO-S M or less.
A few examples of the use of ultraviolet spectrography or spectrophotometry in the examination of organic solvents have been published [1 to 6].12 However, a general application of ultraviolet spectrophotometry to the study of impurities in organic solvents has not been reported. Inasmuch as ultraviolet spectrophotometers are increasingly accessible to laboratory workers, the purpose of the present paper is to direct attention to possible advantages of using such equipment for the qualitative detection of illghly absorbing impurities and in some cases for their quantitative estimation. As the reproductibility obta,ined with the equipment under controlled conditions is 0.1 to 0.2 percent, the spectrophotometric method is more prpcise, rapid, and convenient than spectrography for such work.
This paper describes the procedure used in obtaining the absorption curves and shows its application to detecting the presence of impurities in the original solvent or the formation of impurities by deterioration of the solvent after purification, as well as to studying the relative efficiencies of different met.hods of purification.3 It may also be used in the selection of spectral cutoff filters for various regions in the ultraviolet [7, 8, 15, 16].
II. APPARATUS AND METHOD
A Beckman quartz photoelectric spectrophotometer4 was modified by replacing the cell compartment with a light-tight box having a slide for holding two 38-mm (inside diameter) cylindrical metal cell holders in ",-hich stoppered quartz cylinders 1 cm in length were fitted with matched crystalline quartz end plates to hold the solutions. One cell was fill pd with distilled water and the other with the solvent under investigation. The transmittancy of the cell containing distilled water was taken as 100 percent at each wavelength. Measurements were performed at 26° ± 2° O. Readings were recorded at 5-mJL intervals from 200 mJL to the wavelength at which the organic solvent showed 100-pen~E'nt transmission.s The reproducibility of the transmittancy values was usually within ±0.2 pE'rcent, except at the lowest wavelengths (200 to 230 mJL) where there occur greater deviations, usually of the order of ± 0.5 percent and occasionally larger, and where an apparent increase in transmittancy (see also fig. 3, A) may be due to scattered light.
I Figures in brackets indicate tbe Jiteraturereferences at the end of this paper. , According to a private communication the quartz spectrophotometer is being used for the determination
of benzene and toluene in mixtures of paraffins and naphtbenes. 3 Contamination of the solvent by an improperly chosen container, stopper, or cap interliner can likewise
be detected by this method. I J. Opt. Soc. Am. 31, 682 (1941). , In a few experiments with impure solvents, for example, meth yl alcohol, figure 5A, it was not considered
worthwhile to complete the measurements to lOO'percent transmission.
Purrity of Samples of Organic So7ments 273
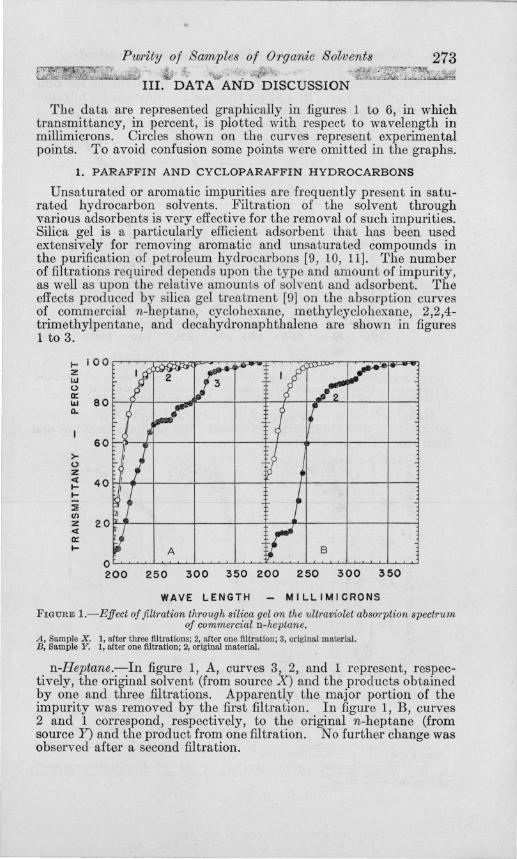
The data are represented graphically in figures 1 to 6, in which transmittancy, in percent, is plotted with respect to wavelength in millimicrons. Circles shown on the curves represent experimental points. To avoid confusion some points were omitted in the graphs.
1. PARAFFIN AND CYCLOPARAFFIN HYDROCARBONS
Unsaturated or aromatic impurities are frequently present in saturated hydrocarbon solvents. Filtration of the solvent through various adsorbents is very effective for the removal of such impurities. Silica gel is a particularly efficient adsorbent that has been used extensively for removing aromatic and unsaturated compounds in the purification of petroleum hydrocarbons [9, 10, 11]. The number of filtrations required depends upon the type and amount of impurity, as well as upon the relative amounts of solvent and adsorbent. The effects produced by silica gel treatment [9] on the absorption curves of commercial n-heptane, cyclohexane, methylcyclohexane, 2,2,4-trimethylpentane, and decahydronaphthalene are shown in figures 1 to 3.
I- I 0 0 t~'::M5m"W<F~a"''"T~"'""::Cp:o:=-loor-;;;j~~=-J z lU <.)
n: w 80 1---1-'-__�----=,.."----+-__�-+-_+-.1"'---"'-+---+--1 D.
><.)
z « .... .... ::E (/)
60~~,H1---__I--_+-~r+-~r--_+---+-~
z 20~L---+--_+--_+-~~~~--_+---r-_1 « n: .... A B
O~~~~~~~-W~~~~~~~~~~~~
200 250 300 350 200 250 300 350
WAVE LENGTH MILLIMICRONS FIGURE I.-Effect of filtration through silica gel on the ultraviolet absorption spectrum
of commercial n-heptane. A, Sample X. 1, after three filtrations; 2, after one filtration; 3, original material. B, Sample Y. 1, after one filtration; 2-, original material.
n-Heptane.-In figure 1, A, curves 3, 2, and 1 represent, respectively, the original solvent (from source X) and the products obtained by one and three filtrations. Apparently the major portion of the impurity was removed by the first filtration. In figure 1, B, curves 2 and 1 correspond, respectively, to the original n-heptane (from source Y) and the product from one filtration. No further change was observed after a second filtration.

274 Journal of Research of the National Bureau of Standards
Cyclohexane.-Figure 2, A, shows the absorption curves for commercial solvent (curve 2) and for the product obtained by filtration through silica gel to constant density (curve 1).6
.... 100 z LU (.)
~ 80 Cl.
>(.)
z ct .... .... ::E (f)
z ct a: ....
60
40
20
'I ~;--
2
-, j 1 [f ...._ .
I
'I jV""
/ 2
1 r: ?
1
1/ ~ h
A I J B
o 200 250 300 350 200 250 300 350
WAVE LENGTH MILLIMICRONS FIGURE 2.-Effect of filtration through silica gel on the ultraviolet absorption spectrum. A, Commercial cyclohexane. 1, after filtrations giving constant density; 2, original material. B, Commercial methylcyciohexane. 1, after four filtrations; 2, after one filtration; 3, original material.
Methylcyclohexane.-In figure 2, B, curves 3, 2, and 1 were obtained, respectively, with commercial solvent and the products from one and from four silica gel filtrations .
.... '00 Z LU (.)
0:: 80 LU Cl.
I ' 60
>-(.)
z
;n v.~ , W j..--e 2 3
~ 3 /. 't' t 'II'
1""
I ct 40 .... .... ::E (f)
20 z ct a: ....
~ --_ ...
~.I~ A fj B ~
o 200 250 300 200 250 300 350 400
WAVE LENGTH MILLIMICRONS FIGURE 3.-Effect oj filtration through silica gel on the ultraviolet-absorption spectrum. A, Commercial hlgh·grade 2, 2, 4·trimethylpentane. 1, after two filtrations; 2, after one filtration; 3, original
material. B, Co=ercial decahydronaphthalene. 1, after five filtrations; 2, after three filtrations; 3, after two fIltra·
tions; 4, after one filtration; 5, original material. 6 The original cyclohexane had the refractive index, no", 1.4246 (Abbe refractometer) and specific gravity,
d",0.77830. The final constants obtained were no", 1.4230 and d", 0.77580. These values were determined by Elizabeth Murray Uilsey.

- ~~- ---------------------------------...
Pwrity of Samples of 01'ganic Solments 275
2,2,4- Trimethylpentane 7.-In figure 3, A, absorption curves 3, 2, and 1 correspond, respectively, to a commercial high grade of solvent and to the products from one and from two silica gel filtrations. A third filtration did not produce further measurable change. The greater absorption in the region below 245 mp produced by one filtration of the solvent through silica gel seems anomalous (compare curves 3 and 2). Insufficient material was available to check these results. The only evident source of contamination was a possible indirect introduction of impurities by a refiuxing action of the solvent at room temperature upon a rubber connection. The use of all-glass apparatus for such materials is recommended. The most plausible alternative explanation is a cracking action of silica gel upon some impurity or impurities in the solvent during the first filtration.
Decahydronaphthalene.-Ourves 5, 4, 3, 2, and 1 in figure 3,B, were obtained with commercial solvent and the products from, respectively, 1,2,3, and 5 silica gel filtrations. In the region 250 to 270 mp, the fifth filtration increased the transmittancy about 1 percent above that observed after 4 filtrations.
2. AROMATIC HYDROCARBONS
Benzene.-In,figure 4, A, curves 3,2, and 1 were obtained with three grades of solvent: a technical grade,S a commercial high grade,9 and
... 100 z IIJ t)
cx: IIJ 80 0-
~. r,r'
~ r; ~. II ~
3 ;; 60
>-(:)
Z <l 40 ... ~4 ... ~ If)
z 20 <l cx: ...
J J I ,/.
I. Iv [j~ I 8 A I I
~, I~ o 200 250 300 350 200 250 300 350
WAVE LENGTH - MILLIMICRONS FIGURE 4.-Ultraviolet-absorption spectra of di;tJerent specimens.
A , Commercial benzene. 1, high-grade benzene after purification; 2, the same, before purification; 3, tech· nical-grade benzene.
B, Commercial carbon tetrachloride. 1 and 3, samples stated to meet ACS specifications; 2, "sulphur-free" grade; 4, technical grade.
the product obtained by drying the high-grade benzene for several days over Drierite and redistilling. Ourve 1 was also obtained from
, Said by the manufacturer to be 99.7 percent pure and to contain only isomeric octanes. 8 The technical grade of benzene possessed an odor that suggested the presence of carbon bisulfide and
gave positive reactions in the Liebermann-Seyewetz [12J and Pierce 113] tests for this substance, as well as a positive test for thiophene [14J .
• The commercial high-grade benzene gave negative tests for carbon bisulfide and thiophene •.
629617-45--5

276 Journal of Research of the National Bureau; of Standards
benzene purified by a second method, which involved shaking the benzene several times with fresh portions of concentrated sulfuric acid, allowing it to stand for some time over the acid, separating the two layers, washing, drying, and distilling. Since differences in the absorption curves of samples of benzene purified by these two methods might be observed in the region below 280 m,u if shorter absorption cells were used, the studies are to be extended to the use of 5-mm and 1-mm cells.
After approximately 20 ml of the purified benzene was stirred with a rod that had been dipped in carbon bisulfide, a narrow absorption band was obtained near 320 m,u and the transmittancy at 320 m,u was reduced nearly 25 percent. The similar absorption band in curve 3 was, therefore, probably due to the presence of carbon bisulfide in the technical grade of benzene. The magnitude of the absorption index at 320 m,u is therefore suggested as a possible quantitative measure of carbon bisulfide.
Homologs of benzene.-Comparative absorption curves for benzene, toluene, and xylene showed no inflections, but a gradual displacement toward the visible with increasing molecular weight of the solvent.
Tetrahydronaphthalene.- A commercial grade of the solvent gave no measurable transmission below 325 m,u and showed gradually diminishing absorption to 550 m,u. There seemed to be a very slight shoulder in the region below 350 m,u.
3. CHLORINATED HYDROCARBONS
Oarbon tetrachloride.-Absorption curves for four commercial grades of the solvent are given in figure 4, B. Curves 1 and 3 were obtained with products labeled as complying with ACS specifications. Curves 4 and 2 were obtained, respectively, with a technical grade and a grade labeled "sulfur-free." The absorption band near 320 m,u, obtained with a technical grade of carbon tetrachloride, as well as with a technical grade of benzene (fig. 4, A), was probably due to carbon bisulfide. One filtration of the technical carbon tetrachloride through silica gel was found to increase the transmittancy at 320 m,u more than 12 percent and the transmittancy at 290 m,u nearly 5 percent.
Ethylene dichloride.-Commercial products from two sources, X and Y, showed a band in the region 225 m,u and a "shoulder" in the region 265 to 285 m,u, but sample Y absorbed more light than sample X (e. g., 7.4 percent more at 275 m,u). Absorption by sample X diminished slightly (1.7 percent at 275 m,u) after it had been allowed to stand in a colorless bottle for some time.
Ohlorobenzene.-Simple distillation of a commercial high grade of the solvent produced a marked change in the spectrum (e. g., 25.5 percent higher transmittancy at 300 m,u). The solvent gave no measurable transmission below 285 m,u.
Trichloroethylent.-The absorption curve of a technical grade shifted appreciably toward the ultraviolet after the solvent was washed with dilute alkali and water, dried, and distilled. The unpurified solvent showed no measurable transmission up to 300 m,u and complete

Purrity of Samples of Organic SoZrvents 277
transmission at 620 mJ.L, but the purified solvent transmitted completely at 410 mJ.L and showed a shallow absorption band near 320 IDp and evidence of a second absorption band ncar 250 mJ.L.
4. COMPOUNDS CONTAINING OXYGEN
Methyl alcohol.-Curves 1,2, and 3 in figure 5, A, were obtained with three different specimens of this solvent, all supposedly of high grade. Sample X, which gave curve 1, was said to be synthetic methyl alcohol. The history of sample Y, which gave curve 2, is not known. Curve 3 was obtained from methyl alcohol that had been prepared a year previously by two distillations of a commercial grade (sample Z, probably not synthetic) from magnesium. Deterioration of the sample upon standing may have occurred.
r IOO~~~~~~~~~~~~~~~~~o-~~ :z LIJ (.)
a:: LIJ 8 0 E--~onl<Ul'9-"~ Q.
>(.)
z
6 0 r--+-~rl- - -i+----f---t-+-Ft---''---t----t--J
~ 40 ~~_+-~-+--~---1-~~+_-----'r---_+--1 r :::E CJ)
Z 201t-t-<i--ft---:--t------t-----+t-ff---f--------1i------t---J <I: a:: r A
o ~~~~~~~~~~~~u_~~~~~~~~ 200 250 300 200 250 300 350 400
WAVE LENGTH - MILLIMICRONS
FIGURE 5.-Ultraviolet-absorption spectra of different specimens.
A, Commercial methyl alcohol. 1 and 2, samples X and Y, respectively, both untreated; 3, sample Z, a year after purification.
B, Oommercial ethyl acetate. 2 and 3, "absolute" grade, samples X and Y, respectively; 1, sample X alter purification.
Ethyl alcohol.-In figure 6, A, curves 2 and 1, respectively, show the absorption of commercial 95-percent ethyl alcohol before and after simple distillation. The spectrum of commercial" absolute" ethyl alcohol showed a double shoulder in the region 250 to 270 mJ.L, which in part may have been due to a trace of benzene used in the industrial process for dehydrating 95-percent ethyl alcohoUo
Ethyl acetate.-Curves 2 and 3 in figure 5, B, represent, respectively, two commercial grades, X and Y, of "absolute" ethyl acetate from freshly opened bottles. Curve 1 was obtained from grade X after washing it with dilute alkali and water, drying, and distilling.
10 Traces 01 benzene may be pre,ent in various organic solvents [2).

278 j mtrnai o/"Research of the National Bureau; OT Stanaards
:)o z ~ 40~L---~--~----~---~~--~~--~----4---~ ~
::E III
~ 20 It: ~ A.
O~~~~~~~-W~~~~~~~~~~~~-W
200 250 300 350 200 250 300 350
WAVE LENGTH - MILLIMICRONS FIGURE 6.--Ultl'aviolet-absorplion spectra of different specimens.
A, Oommercial 95-percent ethyl alcohol. 1, after distillation; 2, before distillation. B, Dioxane. 1 and 2, different fractions from purification; 3, purified dioxane after more than a year and a
half; 4, commercial dioxane.
Dioxane.- The absorption curves of four specimens of dioxane are presented in figure 6, B. Curve 4 was obtained with cGmmercial dioxane. Curves 1 and 2 represent different fractions from distillation of the same dioxane after prolonged refluxing with an excess of sodium. rrhe curves were obtained immediately after collecting the fractions. The sample that gave curve 1 had the dielectric constant 2.199, and the one that gave curve 2 had the constant 2.213, both at 30° C.1l The specimen that gave curve 3 was part of the middle fraction of a sample of dioxane that had been purified in a similar way more than a year and a half earlier. Different investigators who have used dioxane as a solvent in the determination of dipole moments have obtained dielectric constants differing by as much as 7.5 percent at 25° C. Examination of the ultraviolet absorption spectra of specimens used for such measurements would probably account for some of the discrepancies and aid in deciding the most acceptable value for the dielectric constant.
Dimethyldioxane of commercial grade gave a very smooth band between 310 and 400 mIL, with the principal cutoff between 315 and 365 mIL. .
Acetone.- A commercial high grade of acetone showed greater transmittancy (e. g., 3.5 percent greater at 350 mj.L) after it had stood over anhydrous calcium chloride and had been redistilled. Neither sample showed measurable transmission of light up to 325 mIL, and the purified sample showed complete transmittancy above 390 mIL.
11 Fractionation of these two samples and measur~ment of the dielectric constants were performed by A. A. Maryott.

Pu~'ity of Salnples of Organic Soltvents 279
5. CARBON BISULFIDE
A commercial-grade carbon bisulfide showed complete transmission of light at 430 mJ.L but did not show measurable transmission below 375 mJ.L. A trace of this carbon bisulfide in purified benzene produced an absorption band near 320 mJ.L (see discussion on p. 276).
6. USE OF ORGANIC SOLVENTS AS SPECTRAL FILTERS
Ordinarily" filter photometry" is carried out by means of filters isolating certain narrow spectral regions. However, it has occasionally proved feasible to obtain spectroradiometric data by the use of "sharp cutoff" filters, such as those illustrated in this paper. Examples of this type of work are the experiments of (1) Koller and Taylor 115], who accomplished this effect in their studies of erythema due to ultraviolet light by using a Corex filter and ehanging the concentrations of their (Cd and Mg) photosensitive elements, and of (2) Coblentz r16], who in his study of stellar radiometry obtained data on the spectral distribution of stars by use of sharp cutoff glasses . It is possible that some of the organic solvents described in tIllS paper could be used for similar kinds of work in the ultraviolet, especially because narrow-band filters are almost unattainable below 300 m,u. For such purposes the solvents listed in table 1 are suggested.
TABLE I. - Possible solvents for use as cutoff filters
Figure Region of Solvent spectral number cutoff
mIL 2,2,4-T rim ethylpentane, best sample ___ 3,A 210 to 230 Carbon tetrachloride, best sample ____ _ 4, B 260 to 290 Ethyl acetate, best sample ____ _________ 5, B 265 to 275 Cyclobexane, commercial ____________ __ 2,A 270 to 280 Benzene, best sample ________________ __ 4,A 280 to 300 Dimetbyldioxane, commerciaL __ ______ 315 to 365
The data in table 1 refer to l-cm layers; longer or shorter layers of solvent could be used as desired.
IV. REFERENCES
[1] R. Ley and F . Vanheiden, Ber. deut. chern. Ges. 60, 2341 (1927). [2] W. R. Orndorff, R. C. Gibbs, S. A. McNulty, and C . V. Shapiro, J. Am.
Chern. Soc. 50, 831 (1928); A. W. Smith, C. E. Boord, C. S. Adams, and C. S. Pease, .. Am. Chern. Soc. 49, 3137 (1927).
[3] F. Jostes, Oel ~ohle, Erdoel Teer 14, 1012 (1938). [4] T. R. Rogness, F. P. Zscheile, Jr., and A. E. Sjdwell, Jr., J , Phys. Chern. 41,
411 (1937). [5] A. Luszcsak, Oel Kohle 38, 1065 (1942); Chern. Abstr. 37, 6213 (1942). [6] M . M. Graff, R. T. O'Connor, and E. L. Skau, Ind. Eng. Chern., Anal. Ed.t6.
556 (1944). [7] K . S. Gibson, J. Opt. Soc. Am.t3, 267 (1926); Int. Crit. Tables V, 271 (19~Q)
(National Research Council, Washington, D. C.). [8] W. R. Brod.e, J. Phy~. Chem. 30. 56 (l926).

280 Journal of Research of the National Bureau of Standards
[9] B . J . Mair and J. D. White, J . Research NBS 15, 51 (1935) RP809. [10] B. J. Mair and A. F . Forziati, J. Research NBS 32,151 (1944) RP 1582. [11] B. J. Mair and A. F . Forziati, J . Research NBS 32, 165 (1944) RP1583. [12] The Merck Index, 5th ed ., Test No. 2503, p. 814 (Merck and Co ., Rahway,
N . J ., 1940). [13] The Merck Index, 5th ed ., Test No . 3149, p . 865. [14] L . F . Fieser, Experiments in Organic Chemistry, p. 307 (D. C. Heath & Co.,
New York, N. Y., 1935) . (15] L. R . Koller and A. H . Taylor, J . Opt . Soc. Am. 25,184 (1935) . 16] W. W. Coblentz, BS Sci . Pap. 17, 725 (1922) .
WASHINGTON, December 27, 1944.
•