COMPARISON OF SPMDs AND BIOTIC SAMPLERS USING GNOSTIC ANALYSIS · PDF fileAND BIOTIC SAMPLERS...
39
COMPARISON OF SPMDs COMPARISON OF SPMDs AND BIOTIC SAMPLERS AND BIOTIC SAMPLERS USING GNOSTIC ANAL USING GNOSTI YSIS C ANALYSIS Institute of Public Health, Ostrava, Czech Republi Institute of Public Health, Ostrava, Czech Republic National reference laboratory for POPs National reference laboratory for POPs Tomas Ocelka, Tomas Ocelka, Pavel Pavel Kovanic Kovanic Tomas. Tomas [email protected] [email protected] 1 1
Transcript of COMPARISON OF SPMDs AND BIOTIC SAMPLERS USING GNOSTIC ANALYSIS · PDF fileAND BIOTIC SAMPLERS...

COMPARISON OF SPMDsCOMPARISON OF SPMDsAND BIOTIC SAMPLERSAND BIOTIC SAMPLERS
USING GNOSTIC ANALUSING GNOSTI YSISC ANALYSIS
Institute of Public Health Ostrava Czech RepubliInstitute of Public Health Ostrava Czech RepublicNational reference laboratory for POPsNational reference laboratory for POPs
Tomas OcelkaTomas Ocelka PavelPavel KovanicKovanic
TomasTomas OcelkazuovaczOcelkazuovacz
11
1
22
TOPICSTOPICS
Sampling methods to beSampling methods to be comparedcompared
Objects of measuringObjects of measuring Problems of analysisProblems of analysis Gnostic analysisGnostic analysis Methodsrsquo features to be comparedMethodsrsquo features to be compared Results of comparisonResults of comparison
2
33
Geographic locationGeographic location
3
ndash
ndash
ndash -
ndash
ndash
ndashndash
Centre laboratoriesCentre laboratories accreditationaccreditation
Personnel over 140 5+Person 2 workplacesnel over 140 5+2 workplaces According to ČSN EN ISOIEC 17According 025to ČSN EN ISOIEC 17 025
ndash Over 200 paraOver 200 p metersarameters PCDDFs PCBs OCPs PBDE hellipPCDDFs PCBs OCPs PBDE hellip
ndash Recognized by ILAC EA IAFRecognized by ILAC EA IAF Sampling and TestingSampling and Testing
ndash IntegralIntegral - waterwater SPMDsSPMDs DGTsDGTs POCIPOC SIS
ndash Biotic organiBioti smsc organisms IntercalibrationIntercalibration
ndash Czech + InternationalCzech + International Data analysis (univariatemultivariate)Data analysis (univariatemultivariate)
ndash StatisStati ticalsticalndash GnosticGnostic
44
4
-
-
InstrumentatiInstrumenta ontion (worth over 6 mil USD)(worth over 6 mil USD)
GC-MSMS (ion-trap)
GCQ Polaris
Since 1996 (starting to POPs issue)
GC-HRMS (POPs)
- MAT 95XP
- since 2003
LC-MSMS (pharmacy pesticides)
- ThermoFinigan
- since 2006 55
5
ndash
ndash
ndashndash ndash
Data source for comparison ofData source for comparison of methodsmethods
All rivers within Czech RepuAll rivers wi blicthin Czech Republic scale (15)scale (15)
21 sampling pr21 sampling p ofilesrofiles Complementary to bioticComplementary to biotic
sampling system (since 1999)sampling system (since 1999) with abiotic (SPMDs DGTswith abiotic (SPMDs DGTs POCIS)POCIS) ndashndash sincsi e 2003nce 2003
AimsAimsndash Pilot application 2 years beforePilot application 2 years before
routine applicationroutine application ndash Parallel exposure of DreissenaParallel exposure of Dreissena
Polymorpha Benthos PlantsPolymorpha Benthos Plantsndash POPs (basic OCPs PCBs)POPs (basic OCPs PCBs)ndash POPs (other PCBsPOPs (other PCBs ndash coc ngong
PCDDFs PAHs PBDEPCDDFs PAHs PBD s)Es)
66
6
77
SAMPLING METHODSSAMPLING METHODSTO BE COMPAREDTO BE COMPARED
ThreeThree bioticbiotic methodsmethods BentosBentos DreissenaDreissena PlantsPlantsOneOne abioticabiotic method SPMDmethod SPMD(Semipermeable Membrane Measuring(Semipermeable Membrane Measuring
Device)Device)
7
The selectionThe selection
Concentrations of selected permanentConcentrations of selected permanentorganic pollutants (POPs) in severalorganic pollutants (POPs) in severallocations of Elbe river in Czech Republiclocations of Elbe river in Czech Republic
ppDDEppDDE PCB138 PCB180 PCB138 PCB180 PCB101 PCB2831PCB101 PCB2831 ppDDTppDDT ppDDDppDDD PCB52 PCB118 PCB52 PCB118
88
8
PROBLEMS OF ANALYSISPROBLEMS OF ANALYSIS
Small data samplesSmall data samples Different mean concentrationsDifferent mean concentrations Strong vaStrong v riabilityariability Different length of data vectorsDifferent length of data vectors Data censoring (Data censoring (egeg data below the LOD)data below the LOD) NonNon--homogeneous and outlying datahomogeneous and outlying data
99
9
SPECIFICSSPECIFICS of MATHEMATICAL GNOSTICSof MATHEMATICAL GNOSTICS
Theory ofTheory of individualindividual datadata andand smallsmall data samplesdata samples
RealisticRealistic assumptionsassumptions UncertaintyUncertainty a lack of knowledgea lack of knowledge ldquoLet data speakldquoLet data speak for themsefor thems lveselvesrdquordquo ResultsResults maximizing informationmaximizing information NaturalNatural robustnessrobustness
1010
10
1111
Comparison of two approachesComparison of two approaches
1111
11
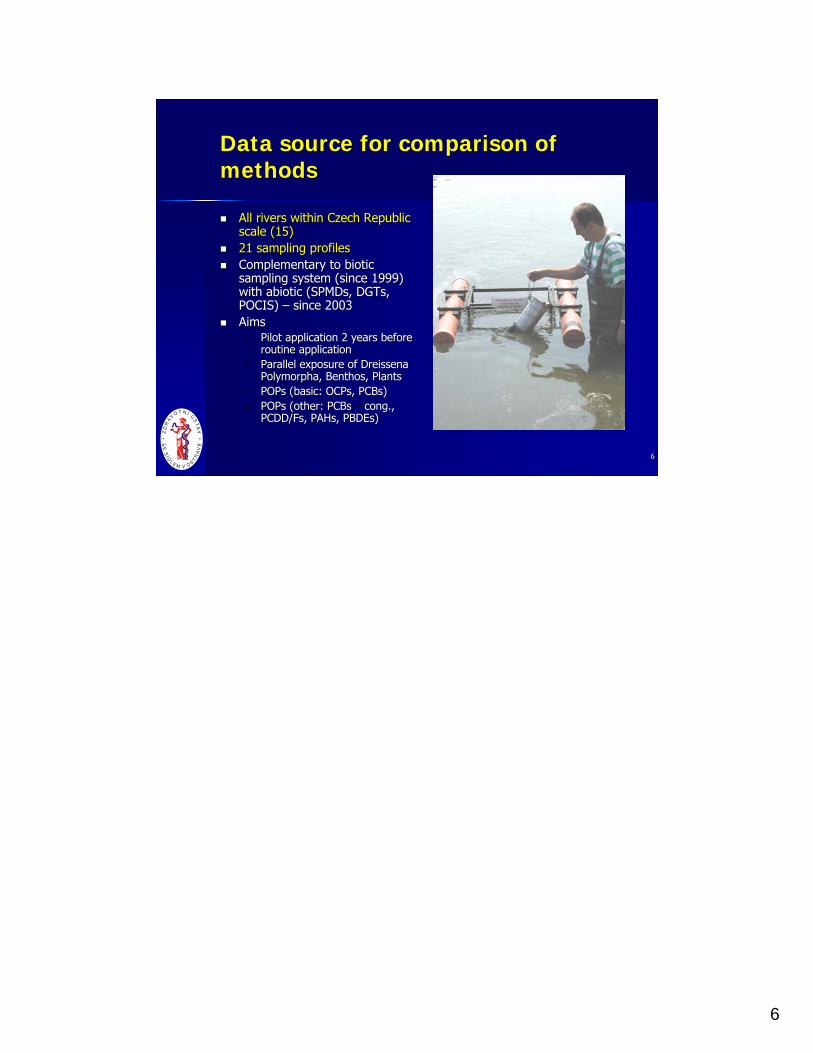
GNOSTICGNOSTICDISTRIBUTION FUNCTIONSDISTRIBUTION FUNCTIONS
No a priori modelNo a priori model (e( verything from data)everything from data)
MaximumMaximum informationinformation
RobustnessRobustness in estimation of probabilityin estimation of probability
quantilesquantiles scale and location parameters scale and location parameters
bounds of data support and membershipbounds of data support and membership
intervalinterval
frac34frac34 RobustRobust correlationscorrelations 1212
12
1313
GNOSTICGNOSTICDISTRIBUTION FUNCTIONS IIDISTRIBUTION FUNCTIONS II
DataData homogeneityhomogeneity teststests
MarginalMarginal cluster analysiscluster analysis
CrossCross--sectionsection filteringfiltering
Applicability toApplicability to censoredcensored datadata
Applicability toApplicability to heteroscedasticheteroscedastic datadata
13
QUALITY OF METHODSQUALITY OF METHODSTO BE COMPAREDTO BE COMPARED
Relative sensitivity (Relative sensitivity (tresholdtreshold range) range)Homogeneity of resultsHomogeneity of resultsConsistency of resultsConsistency of results Internal (of methodrsquos own results)Internal (of methodrsquos own results) External (mutual consistency of methExternal (mutual consistency of met ods)hods)
InformativInformati enessveness of resultsof resultsPrecissionPrecission
1414
14
RELATIVE SENSITIVITYRELATIVE SENSITIVITY
Methodrsquos relative sensitivity dependsMethodrsquos relative sensitivity dependsOn the pollutantrsquos concentrationOn the pollutantrsquos concentrationOn the methodrsquos measuring domainOn the methodrsquos measuring domain
RS = (1RS = (1 ndashndash NCN) x 100 ()NCN) x 100 ()NCNC hellip number of data in the intervhellip number of data in th ale interval[sensitivity threshold[sensitivity threshold max(rangemax(range)])]
NN hellip all data of the sahellip all data of the s mpleample1515
15
HOMOGENIZATIONHOMOGENIZATIONTO BE OR NOT TO BETO BE OR NOT TO BE
Homogeneous dataHomogeneous datathe samethe same originorigin of true valuesof true valuesthe same nature of thethe same nature of the uncertaintyuncertainty
To homogenizeTo homogenize ProsPros
More certain main clusterMore certain main cluster ConsCons
Possible loss of informationPossible loss of informationRule homogenize and verifyRule homogenize and verify
1616
16
MEASURABILITYMEASURABILITY
Homogenization hellip elimination of outliersHomogenization hellip elimination of outliersMeasMeas = (1= (1 ndashndash (NL+NU)N) x 100 ()(NL+NU)N) x 100 ()NL hellipNL hellip number of lower outliersnumber of lower outliersNU hellipNU hellip number of upper outliersnumber of upper outliersN hellipN hellip number of the samplersquos datanumber of the samplersquos dataNN ndashndash NLNL ndashndash NU hellipNU hellip data of the main clusterdata of the main cluster
1717
17
1818
METHODS OF ANALYSISMETHODS OF ANALYSIS
GEOMETRYGEOMETRY(angles between vectors)(angles between vectors)
STATISTICSSTATISTICS(robust correlations)(robust correlations)
MATHEMATICAL GNOSTICS MATHEMATICAL GNOSTICS (robust correlations robust(robust correlations robustdistribution functions information distribution functions information and entropy of small data samples)and entropy of small data samples)
Dec Log (concentration) ugsampling system
1818
18
1919
Dec Log (concentration) ugsampling system
1919
19
2020
Co
nce
ntr
atio
n u
gs
am
plin
g s
yste
m
2020
20
DIFFERENCES IN METHODSDIFFERENCES IN METHODS
Different accumulation of pollutantsDifferent accumulation of pollutantsbullbull different mean concentrationsdifferent mean concentrationsbullbull differentdifferent variabilitiesvariabilities
Different relations between meansDifferent relations between means Rare exception agreement in PCB118Rare exception agreement in PCB118 Impact of outliers to SPMDImpact of outliers to SPMD NONO
2121
21
METHODrsquoS CONSISTENCYMETHODrsquoS CONSISTENCY
Methods areMethods are consistentconsistent when they givewhen they givesimilar resultssimilar results
Measuring of similarityMeasuring of similarityCorrelations or (more generally)Correlations or (more generally)
mean angles between vectors of resultsmean angles between vectors of resultsSIMccSIMcc = 100 x= 100 x correlcoefficientcorrelcoefficient ()()SIMqaSIMqa = 100 x (1= 100 x (1 ndashndash |Ang|180) ()|Ang|180) ()
2222
22
GNOSTIC CORRELATIONSGNOSTIC CORRELATIONS
Data error inData error in gnosticgnostic irrelevanceirrelevanceirir = (2p= (2p -- 1)21)2
pp hellip probability of the data itemhellip probability of the data itemCorrelation coefficient of two samplesCorrelation coefficient of two samples
Gcc(MNGcc(MN) =) = ccir(m)ir(nccir(m)ir(n))(m in M n in N) cc (m in M n in N) cc statiststatist corcoefcorcoef
RobustnessRobustness-- 1 lt=1 lt= irir lt= + 1lt= + 1 2323
23
SIGNIFICANCESIGNIFICANCE OF CORRELATIONSOF CORRELATIONS
Problems false statistical modelProblems false statistical model (normality finite data support)(normality finite data support) small data samplessmall data samples unrobustnessunrobustness
Gnostic estimating of significanceGnostic estimating of significancefrac34frac34 fast auxiliaryfast auxiliary usinusi g Spearmanrsquosng Spearmanrsquos
robust estimate of significancerobust estimate of significancefrac34frac34 carefullycarefully distribution function ofdistribution function of
correlation coefficientscorrelation coefficients2424
24
2525
25
2525
QUANTILE VECTORSQUANTILE VECTORS
Make samplersquos distribution functionMake samplersquos distribution function Set a series of probabilitiesSet a series of probabilities p1hellipp1hellippNpN FindFind quantilesquantiles q1hellipq1hellipqNqN so thatso that PqkPqk==pkpk TakeTake q1hellipq1hellipqNqN as aas a quantilequantile vectorvectorAdvantagesAdvantages
Robustness making use of censored dataRobustness making use of censored dataindependence of data amount and ofindependence of data amount and of mean data value filtering effectmean data value filtering effect
2626
26
2727
27
2727
2828
28
2828
2929
Co
nce
ntr
atio
n u
gs
am
plin
g s
yste
m
2929
29
EXTERNAL CONSISTENCYEXTERNAL CONSISTENCY
ApproachesApproaches CorrelationsCorrelations Angles betwAngl een MDes between MD--vectors of meansvectors of means Angles betweenAngles between quantilequantile vectovect rsro s Conjunction of typical data intervalsConjunction of typical data intervals Conjunction of data supportsConjunction of data supports
3030
30
INTERVAL ANALYSISINTERVAL ANALYSIS
1)1) Distribution functionsDistribution functions2)2) Interval analysisInterval analysis
a)a) Data supportData support (LB UB)(LB UB)b)b) Membership intervalMembership interval (LSB USB)(LSB USB)c)c) Interval of typical dataInterval of typical data (ZL UL)(ZL UL)d)d) Tolerance intervalTolerance interval (Z0L Z0U)(Z0L Z0U)
3)3) OverlappingOverlapping 100xconjunction(I1 I2)union(I1I2) ()100xconjunction(I1 I2)union(I1I2) ()
3131
31
INFORMATIVENESSINFORMATIVENESS
1)1) Data sampleData sample2)2) Distribution functionDistribution function3)3) ProbabilityProbability pp of an individual data itemof an individual data item4)4) Information of the data itemInformation of the data item
Info=(pInfo=(p log(plog(p) + (1) + (1--p)log(1p)log(1--p))logp (12)())log 12)5)5) InformativenessInformativeness of a data sampleof a data sample
100 x100 x MeM an(Infoean(Info) ()) ()3232
32
3333
EVALUATIONEVALUATION OF PRECISIONOF PRECISION
Weak variabilityWeak variability PrecPrec = 100 x (1= 100 x (1 ndashndash STDAVG) ()STDAVG) ()
((STDSTD hellip standard deviationhellip standard deviation AVGAVG helliphellip mean)mean)
Strong uncertaintyStrong uncertaintyPrecPrec = 100 x (1= 100 x (1 -- Mean(GWMean(GW) ) ()) ) ()
((GWGW helliphellip gnosticgnostic weight of data entropyweight of data entropy change caused by the uncertainty)change caused by the uncertainty)
0 lt= GW lt= 10 lt= GW lt= 1
33
SUMMARY COMPARISONSUMMARY COMPARISON
AverigeAverige of 14 evaluationsof 14 evaluations
MethodMethod NonNon--homdatahomdata HomogHomog data data
BentosBentos 609 609 627 627
DreissenaDreissena 645 645 675 675
PlantsPlants 642 642 689 689
SPMDSPMD 675 675 695 695
3434
34
3535
35
3535
RATINGRATIN OF METHODSG OF METHODS
FeatureFeatureExtconsistencyExtconsistencyIntconsistencyIntconsistencyInformativenessInformativenessPrecissionPrecissionHomogeneityHomogeneityRelsensitivityRelsensitivityMean ratingMean rating
BentosBentos DreissDreiss PlantsPlants SPMDSPMD44 33 11 2244 33 22 1111 33 44 2233 11 44 2222 44 33 1133 11 22 11
2828 2525 2727 15153636
36
ndash
ndash
ndash
ConclusionsConclusions
Passive sampling like SPMDs shown the bestPassive sampling like SPMDs shown the best results if there are no legal requirements for biotaresults if there are no legal requirements for biota biotic organisms can be replacedbiotic organisms can be replaced
Do not forget to analyze data preciselyDo not forget to analyze data precisely independently before your interpretationindependently before your interpretationndash Do not rely ONLY on functionality of any processingDo not rely ONLY on functionality of any processing
packagepackagendash Statistical approach has some limitations on small dataStatistical approach has some limitations on small data
sets (majority of monitoring studies)sets (majority of monitoring studies)
Any headache from analytical tools can beAny headache from analytical tools can be eliminated by expeeliminated by exp rienceeriencendash Try itTry it
3737
37
Further intentionsFurther intentions
Finalization of Gnostic analytical toolFinalization of Gnostic analytical tool with GUI (Swith GUI (S--Plus)Plus)
Extension to other platforms byExtension to other platforms by interfaceinterface
Linking to databases (LIMS GIS hellip)Linking to databases (LIMS GIS hellip) Training and disseminationTraining and dissemination Projects solutions and participationsProjects solutions and participations
ndashndash Join us 2Join us 2--FUN projectFUN project www2www2--funorgfunorg
3838
38
3939
hellip thank you for your attention
PCDDF
39

22
TOPICSTOPICS
Sampling methods to beSampling methods to be comparedcompared
Objects of measuringObjects of measuring Problems of analysisProblems of analysis Gnostic analysisGnostic analysis Methodsrsquo features to be comparedMethodsrsquo features to be compared Results of comparisonResults of comparison
2
33
Geographic locationGeographic location
3
ndash
ndash
ndash -
ndash
ndash
ndashndash
Centre laboratoriesCentre laboratories accreditationaccreditation
Personnel over 140 5+Person 2 workplacesnel over 140 5+2 workplaces According to ČSN EN ISOIEC 17According 025to ČSN EN ISOIEC 17 025
ndash Over 200 paraOver 200 p metersarameters PCDDFs PCBs OCPs PBDE hellipPCDDFs PCBs OCPs PBDE hellip
ndash Recognized by ILAC EA IAFRecognized by ILAC EA IAF Sampling and TestingSampling and Testing
ndash IntegralIntegral - waterwater SPMDsSPMDs DGTsDGTs POCIPOC SIS
ndash Biotic organiBioti smsc organisms IntercalibrationIntercalibration
ndash Czech + InternationalCzech + International Data analysis (univariatemultivariate)Data analysis (univariatemultivariate)
ndash StatisStati ticalsticalndash GnosticGnostic
44
4
-
-
InstrumentatiInstrumenta ontion (worth over 6 mil USD)(worth over 6 mil USD)
GC-MSMS (ion-trap)
GCQ Polaris
Since 1996 (starting to POPs issue)
GC-HRMS (POPs)
- MAT 95XP
- since 2003
LC-MSMS (pharmacy pesticides)
- ThermoFinigan
- since 2006 55
5
ndash
ndash
ndashndash ndash
Data source for comparison ofData source for comparison of methodsmethods
All rivers within Czech RepuAll rivers wi blicthin Czech Republic scale (15)scale (15)
21 sampling pr21 sampling p ofilesrofiles Complementary to bioticComplementary to biotic
sampling system (since 1999)sampling system (since 1999) with abiotic (SPMDs DGTswith abiotic (SPMDs DGTs POCIS)POCIS) ndashndash sincsi e 2003nce 2003
AimsAimsndash Pilot application 2 years beforePilot application 2 years before
routine applicationroutine application ndash Parallel exposure of DreissenaParallel exposure of Dreissena
Polymorpha Benthos PlantsPolymorpha Benthos Plantsndash POPs (basic OCPs PCBs)POPs (basic OCPs PCBs)ndash POPs (other PCBsPOPs (other PCBs ndash coc ngong
PCDDFs PAHs PBDEPCDDFs PAHs PBD s)Es)
66
6
77
SAMPLING METHODSSAMPLING METHODSTO BE COMPAREDTO BE COMPARED
ThreeThree bioticbiotic methodsmethods BentosBentos DreissenaDreissena PlantsPlantsOneOne abioticabiotic method SPMDmethod SPMD(Semipermeable Membrane Measuring(Semipermeable Membrane Measuring
Device)Device)
7
The selectionThe selection
Concentrations of selected permanentConcentrations of selected permanentorganic pollutants (POPs) in severalorganic pollutants (POPs) in severallocations of Elbe river in Czech Republiclocations of Elbe river in Czech Republic
ppDDEppDDE PCB138 PCB180 PCB138 PCB180 PCB101 PCB2831PCB101 PCB2831 ppDDTppDDT ppDDDppDDD PCB52 PCB118 PCB52 PCB118
88
8
PROBLEMS OF ANALYSISPROBLEMS OF ANALYSIS
Small data samplesSmall data samples Different mean concentrationsDifferent mean concentrations Strong vaStrong v riabilityariability Different length of data vectorsDifferent length of data vectors Data censoring (Data censoring (egeg data below the LOD)data below the LOD) NonNon--homogeneous and outlying datahomogeneous and outlying data
99
9
SPECIFICSSPECIFICS of MATHEMATICAL GNOSTICSof MATHEMATICAL GNOSTICS
Theory ofTheory of individualindividual datadata andand smallsmall data samplesdata samples
RealisticRealistic assumptionsassumptions UncertaintyUncertainty a lack of knowledgea lack of knowledge ldquoLet data speakldquoLet data speak for themsefor thems lveselvesrdquordquo ResultsResults maximizing informationmaximizing information NaturalNatural robustnessrobustness
1010
10
1111
Comparison of two approachesComparison of two approaches
1111
11
GNOSTICGNOSTICDISTRIBUTION FUNCTIONSDISTRIBUTION FUNCTIONS
No a priori modelNo a priori model (e( verything from data)everything from data)
MaximumMaximum informationinformation
RobustnessRobustness in estimation of probabilityin estimation of probability
quantilesquantiles scale and location parameters scale and location parameters
bounds of data support and membershipbounds of data support and membership
intervalinterval
frac34frac34 RobustRobust correlationscorrelations 1212
12
1313
GNOSTICGNOSTICDISTRIBUTION FUNCTIONS IIDISTRIBUTION FUNCTIONS II
DataData homogeneityhomogeneity teststests
MarginalMarginal cluster analysiscluster analysis
CrossCross--sectionsection filteringfiltering
Applicability toApplicability to censoredcensored datadata
Applicability toApplicability to heteroscedasticheteroscedastic datadata
13
QUALITY OF METHODSQUALITY OF METHODSTO BE COMPAREDTO BE COMPARED
Relative sensitivity (Relative sensitivity (tresholdtreshold range) range)Homogeneity of resultsHomogeneity of resultsConsistency of resultsConsistency of results Internal (of methodrsquos own results)Internal (of methodrsquos own results) External (mutual consistency of methExternal (mutual consistency of met ods)hods)
InformativInformati enessveness of resultsof resultsPrecissionPrecission
1414
14
RELATIVE SENSITIVITYRELATIVE SENSITIVITY
Methodrsquos relative sensitivity dependsMethodrsquos relative sensitivity dependsOn the pollutantrsquos concentrationOn the pollutantrsquos concentrationOn the methodrsquos measuring domainOn the methodrsquos measuring domain
RS = (1RS = (1 ndashndash NCN) x 100 ()NCN) x 100 ()NCNC hellip number of data in the intervhellip number of data in th ale interval[sensitivity threshold[sensitivity threshold max(rangemax(range)])]
NN hellip all data of the sahellip all data of the s mpleample1515
15
HOMOGENIZATIONHOMOGENIZATIONTO BE OR NOT TO BETO BE OR NOT TO BE
Homogeneous dataHomogeneous datathe samethe same originorigin of true valuesof true valuesthe same nature of thethe same nature of the uncertaintyuncertainty
To homogenizeTo homogenize ProsPros
More certain main clusterMore certain main cluster ConsCons
Possible loss of informationPossible loss of informationRule homogenize and verifyRule homogenize and verify
1616
16
MEASURABILITYMEASURABILITY
Homogenization hellip elimination of outliersHomogenization hellip elimination of outliersMeasMeas = (1= (1 ndashndash (NL+NU)N) x 100 ()(NL+NU)N) x 100 ()NL hellipNL hellip number of lower outliersnumber of lower outliersNU hellipNU hellip number of upper outliersnumber of upper outliersN hellipN hellip number of the samplersquos datanumber of the samplersquos dataNN ndashndash NLNL ndashndash NU hellipNU hellip data of the main clusterdata of the main cluster
1717
17
1818
METHODS OF ANALYSISMETHODS OF ANALYSIS
GEOMETRYGEOMETRY(angles between vectors)(angles between vectors)
STATISTICSSTATISTICS(robust correlations)(robust correlations)
MATHEMATICAL GNOSTICS MATHEMATICAL GNOSTICS (robust correlations robust(robust correlations robustdistribution functions information distribution functions information and entropy of small data samples)and entropy of small data samples)
Dec Log (concentration) ugsampling system
1818
18
1919
Dec Log (concentration) ugsampling system
1919
19
2020
Co
nce
ntr
atio
n u
gs
am
plin
g s
yste
m
2020
20
DIFFERENCES IN METHODSDIFFERENCES IN METHODS
Different accumulation of pollutantsDifferent accumulation of pollutantsbullbull different mean concentrationsdifferent mean concentrationsbullbull differentdifferent variabilitiesvariabilities
Different relations between meansDifferent relations between means Rare exception agreement in PCB118Rare exception agreement in PCB118 Impact of outliers to SPMDImpact of outliers to SPMD NONO
2121
21
METHODrsquoS CONSISTENCYMETHODrsquoS CONSISTENCY
Methods areMethods are consistentconsistent when they givewhen they givesimilar resultssimilar results
Measuring of similarityMeasuring of similarityCorrelations or (more generally)Correlations or (more generally)
mean angles between vectors of resultsmean angles between vectors of resultsSIMccSIMcc = 100 x= 100 x correlcoefficientcorrelcoefficient ()()SIMqaSIMqa = 100 x (1= 100 x (1 ndashndash |Ang|180) ()|Ang|180) ()
2222
22
GNOSTIC CORRELATIONSGNOSTIC CORRELATIONS
Data error inData error in gnosticgnostic irrelevanceirrelevanceirir = (2p= (2p -- 1)21)2
pp hellip probability of the data itemhellip probability of the data itemCorrelation coefficient of two samplesCorrelation coefficient of two samples
Gcc(MNGcc(MN) =) = ccir(m)ir(nccir(m)ir(n))(m in M n in N) cc (m in M n in N) cc statiststatist corcoefcorcoef
RobustnessRobustness-- 1 lt=1 lt= irir lt= + 1lt= + 1 2323
23
SIGNIFICANCESIGNIFICANCE OF CORRELATIONSOF CORRELATIONS
Problems false statistical modelProblems false statistical model (normality finite data support)(normality finite data support) small data samplessmall data samples unrobustnessunrobustness
Gnostic estimating of significanceGnostic estimating of significancefrac34frac34 fast auxiliaryfast auxiliary usinusi g Spearmanrsquosng Spearmanrsquos
robust estimate of significancerobust estimate of significancefrac34frac34 carefullycarefully distribution function ofdistribution function of
correlation coefficientscorrelation coefficients2424
24
2525
25
2525
QUANTILE VECTORSQUANTILE VECTORS
Make samplersquos distribution functionMake samplersquos distribution function Set a series of probabilitiesSet a series of probabilities p1hellipp1hellippNpN FindFind quantilesquantiles q1hellipq1hellipqNqN so thatso that PqkPqk==pkpk TakeTake q1hellipq1hellipqNqN as aas a quantilequantile vectorvectorAdvantagesAdvantages
Robustness making use of censored dataRobustness making use of censored dataindependence of data amount and ofindependence of data amount and of mean data value filtering effectmean data value filtering effect
2626
26
2727
27
2727
2828
28
2828
2929
Co
nce
ntr
atio
n u
gs
am
plin
g s
yste
m
2929
29
EXTERNAL CONSISTENCYEXTERNAL CONSISTENCY
ApproachesApproaches CorrelationsCorrelations Angles betwAngl een MDes between MD--vectors of meansvectors of means Angles betweenAngles between quantilequantile vectovect rsro s Conjunction of typical data intervalsConjunction of typical data intervals Conjunction of data supportsConjunction of data supports
3030
30
INTERVAL ANALYSISINTERVAL ANALYSIS
1)1) Distribution functionsDistribution functions2)2) Interval analysisInterval analysis
a)a) Data supportData support (LB UB)(LB UB)b)b) Membership intervalMembership interval (LSB USB)(LSB USB)c)c) Interval of typical dataInterval of typical data (ZL UL)(ZL UL)d)d) Tolerance intervalTolerance interval (Z0L Z0U)(Z0L Z0U)
3)3) OverlappingOverlapping 100xconjunction(I1 I2)union(I1I2) ()100xconjunction(I1 I2)union(I1I2) ()
3131
31
INFORMATIVENESSINFORMATIVENESS
1)1) Data sampleData sample2)2) Distribution functionDistribution function3)3) ProbabilityProbability pp of an individual data itemof an individual data item4)4) Information of the data itemInformation of the data item
Info=(pInfo=(p log(plog(p) + (1) + (1--p)log(1p)log(1--p))logp (12)())log 12)5)5) InformativenessInformativeness of a data sampleof a data sample
100 x100 x MeM an(Infoean(Info) ()) ()3232
32
3333
EVALUATIONEVALUATION OF PRECISIONOF PRECISION
Weak variabilityWeak variability PrecPrec = 100 x (1= 100 x (1 ndashndash STDAVG) ()STDAVG) ()
((STDSTD hellip standard deviationhellip standard deviation AVGAVG helliphellip mean)mean)
Strong uncertaintyStrong uncertaintyPrecPrec = 100 x (1= 100 x (1 -- Mean(GWMean(GW) ) ()) ) ()
((GWGW helliphellip gnosticgnostic weight of data entropyweight of data entropy change caused by the uncertainty)change caused by the uncertainty)
0 lt= GW lt= 10 lt= GW lt= 1
33
SUMMARY COMPARISONSUMMARY COMPARISON
AverigeAverige of 14 evaluationsof 14 evaluations
MethodMethod NonNon--homdatahomdata HomogHomog data data
BentosBentos 609 609 627 627
DreissenaDreissena 645 645 675 675
PlantsPlants 642 642 689 689
SPMDSPMD 675 675 695 695
3434
34
3535
35
3535
RATINGRATIN OF METHODSG OF METHODS
FeatureFeatureExtconsistencyExtconsistencyIntconsistencyIntconsistencyInformativenessInformativenessPrecissionPrecissionHomogeneityHomogeneityRelsensitivityRelsensitivityMean ratingMean rating
BentosBentos DreissDreiss PlantsPlants SPMDSPMD44 33 11 2244 33 22 1111 33 44 2233 11 44 2222 44 33 1133 11 22 11
2828 2525 2727 15153636
36
ndash
ndash
ndash
ConclusionsConclusions
Passive sampling like SPMDs shown the bestPassive sampling like SPMDs shown the best results if there are no legal requirements for biotaresults if there are no legal requirements for biota biotic organisms can be replacedbiotic organisms can be replaced
Do not forget to analyze data preciselyDo not forget to analyze data precisely independently before your interpretationindependently before your interpretationndash Do not rely ONLY on functionality of any processingDo not rely ONLY on functionality of any processing
packagepackagendash Statistical approach has some limitations on small dataStatistical approach has some limitations on small data
sets (majority of monitoring studies)sets (majority of monitoring studies)
Any headache from analytical tools can beAny headache from analytical tools can be eliminated by expeeliminated by exp rienceeriencendash Try itTry it
3737
37
Further intentionsFurther intentions
Finalization of Gnostic analytical toolFinalization of Gnostic analytical tool with GUI (Swith GUI (S--Plus)Plus)
Extension to other platforms byExtension to other platforms by interfaceinterface
Linking to databases (LIMS GIS hellip)Linking to databases (LIMS GIS hellip) Training and disseminationTraining and dissemination Projects solutions and participationsProjects solutions and participations
ndashndash Join us 2Join us 2--FUN projectFUN project www2www2--funorgfunorg
3838
38
3939
hellip thank you for your attention
PCDDF
39

33
Geographic locationGeographic location
3
ndash
ndash
ndash -
ndash
ndash
ndashndash
Centre laboratoriesCentre laboratories accreditationaccreditation
Personnel over 140 5+Person 2 workplacesnel over 140 5+2 workplaces According to ČSN EN ISOIEC 17According 025to ČSN EN ISOIEC 17 025
ndash Over 200 paraOver 200 p metersarameters PCDDFs PCBs OCPs PBDE hellipPCDDFs PCBs OCPs PBDE hellip
ndash Recognized by ILAC EA IAFRecognized by ILAC EA IAF Sampling and TestingSampling and Testing
ndash IntegralIntegral - waterwater SPMDsSPMDs DGTsDGTs POCIPOC SIS
ndash Biotic organiBioti smsc organisms IntercalibrationIntercalibration
ndash Czech + InternationalCzech + International Data analysis (univariatemultivariate)Data analysis (univariatemultivariate)
ndash StatisStati ticalsticalndash GnosticGnostic
44
4
-
-
InstrumentatiInstrumenta ontion (worth over 6 mil USD)(worth over 6 mil USD)
GC-MSMS (ion-trap)
GCQ Polaris
Since 1996 (starting to POPs issue)
GC-HRMS (POPs)
- MAT 95XP
- since 2003
LC-MSMS (pharmacy pesticides)
- ThermoFinigan
- since 2006 55
5
ndash
ndash
ndashndash ndash
Data source for comparison ofData source for comparison of methodsmethods
All rivers within Czech RepuAll rivers wi blicthin Czech Republic scale (15)scale (15)
21 sampling pr21 sampling p ofilesrofiles Complementary to bioticComplementary to biotic
sampling system (since 1999)sampling system (since 1999) with abiotic (SPMDs DGTswith abiotic (SPMDs DGTs POCIS)POCIS) ndashndash sincsi e 2003nce 2003
AimsAimsndash Pilot application 2 years beforePilot application 2 years before
routine applicationroutine application ndash Parallel exposure of DreissenaParallel exposure of Dreissena
Polymorpha Benthos PlantsPolymorpha Benthos Plantsndash POPs (basic OCPs PCBs)POPs (basic OCPs PCBs)ndash POPs (other PCBsPOPs (other PCBs ndash coc ngong
PCDDFs PAHs PBDEPCDDFs PAHs PBD s)Es)
66
6
77
SAMPLING METHODSSAMPLING METHODSTO BE COMPAREDTO BE COMPARED
ThreeThree bioticbiotic methodsmethods BentosBentos DreissenaDreissena PlantsPlantsOneOne abioticabiotic method SPMDmethod SPMD(Semipermeable Membrane Measuring(Semipermeable Membrane Measuring
Device)Device)
7
The selectionThe selection
Concentrations of selected permanentConcentrations of selected permanentorganic pollutants (POPs) in severalorganic pollutants (POPs) in severallocations of Elbe river in Czech Republiclocations of Elbe river in Czech Republic
ppDDEppDDE PCB138 PCB180 PCB138 PCB180 PCB101 PCB2831PCB101 PCB2831 ppDDTppDDT ppDDDppDDD PCB52 PCB118 PCB52 PCB118
88
8
PROBLEMS OF ANALYSISPROBLEMS OF ANALYSIS
Small data samplesSmall data samples Different mean concentrationsDifferent mean concentrations Strong vaStrong v riabilityariability Different length of data vectorsDifferent length of data vectors Data censoring (Data censoring (egeg data below the LOD)data below the LOD) NonNon--homogeneous and outlying datahomogeneous and outlying data
99
9
SPECIFICSSPECIFICS of MATHEMATICAL GNOSTICSof MATHEMATICAL GNOSTICS
Theory ofTheory of individualindividual datadata andand smallsmall data samplesdata samples
RealisticRealistic assumptionsassumptions UncertaintyUncertainty a lack of knowledgea lack of knowledge ldquoLet data speakldquoLet data speak for themsefor thems lveselvesrdquordquo ResultsResults maximizing informationmaximizing information NaturalNatural robustnessrobustness
1010
10
1111
Comparison of two approachesComparison of two approaches
1111
11
GNOSTICGNOSTICDISTRIBUTION FUNCTIONSDISTRIBUTION FUNCTIONS
No a priori modelNo a priori model (e( verything from data)everything from data)
MaximumMaximum informationinformation
RobustnessRobustness in estimation of probabilityin estimation of probability
quantilesquantiles scale and location parameters scale and location parameters
bounds of data support and membershipbounds of data support and membership
intervalinterval
frac34frac34 RobustRobust correlationscorrelations 1212
12
1313
GNOSTICGNOSTICDISTRIBUTION FUNCTIONS IIDISTRIBUTION FUNCTIONS II
DataData homogeneityhomogeneity teststests
MarginalMarginal cluster analysiscluster analysis
CrossCross--sectionsection filteringfiltering
Applicability toApplicability to censoredcensored datadata
Applicability toApplicability to heteroscedasticheteroscedastic datadata
13
QUALITY OF METHODSQUALITY OF METHODSTO BE COMPAREDTO BE COMPARED
Relative sensitivity (Relative sensitivity (tresholdtreshold range) range)Homogeneity of resultsHomogeneity of resultsConsistency of resultsConsistency of results Internal (of methodrsquos own results)Internal (of methodrsquos own results) External (mutual consistency of methExternal (mutual consistency of met ods)hods)
InformativInformati enessveness of resultsof resultsPrecissionPrecission
1414
14
RELATIVE SENSITIVITYRELATIVE SENSITIVITY
Methodrsquos relative sensitivity dependsMethodrsquos relative sensitivity dependsOn the pollutantrsquos concentrationOn the pollutantrsquos concentrationOn the methodrsquos measuring domainOn the methodrsquos measuring domain
RS = (1RS = (1 ndashndash NCN) x 100 ()NCN) x 100 ()NCNC hellip number of data in the intervhellip number of data in th ale interval[sensitivity threshold[sensitivity threshold max(rangemax(range)])]
NN hellip all data of the sahellip all data of the s mpleample1515
15
HOMOGENIZATIONHOMOGENIZATIONTO BE OR NOT TO BETO BE OR NOT TO BE
Homogeneous dataHomogeneous datathe samethe same originorigin of true valuesof true valuesthe same nature of thethe same nature of the uncertaintyuncertainty
To homogenizeTo homogenize ProsPros
More certain main clusterMore certain main cluster ConsCons
Possible loss of informationPossible loss of informationRule homogenize and verifyRule homogenize and verify
1616
16
MEASURABILITYMEASURABILITY
Homogenization hellip elimination of outliersHomogenization hellip elimination of outliersMeasMeas = (1= (1 ndashndash (NL+NU)N) x 100 ()(NL+NU)N) x 100 ()NL hellipNL hellip number of lower outliersnumber of lower outliersNU hellipNU hellip number of upper outliersnumber of upper outliersN hellipN hellip number of the samplersquos datanumber of the samplersquos dataNN ndashndash NLNL ndashndash NU hellipNU hellip data of the main clusterdata of the main cluster
1717
17
1818
METHODS OF ANALYSISMETHODS OF ANALYSIS
GEOMETRYGEOMETRY(angles between vectors)(angles between vectors)
STATISTICSSTATISTICS(robust correlations)(robust correlations)
MATHEMATICAL GNOSTICS MATHEMATICAL GNOSTICS (robust correlations robust(robust correlations robustdistribution functions information distribution functions information and entropy of small data samples)and entropy of small data samples)
Dec Log (concentration) ugsampling system
1818
18
1919
Dec Log (concentration) ugsampling system
1919
19
2020
Co
nce
ntr
atio
n u
gs
am
plin
g s
yste
m
2020
20
DIFFERENCES IN METHODSDIFFERENCES IN METHODS
Different accumulation of pollutantsDifferent accumulation of pollutantsbullbull different mean concentrationsdifferent mean concentrationsbullbull differentdifferent variabilitiesvariabilities
Different relations between meansDifferent relations between means Rare exception agreement in PCB118Rare exception agreement in PCB118 Impact of outliers to SPMDImpact of outliers to SPMD NONO
2121
21
METHODrsquoS CONSISTENCYMETHODrsquoS CONSISTENCY
Methods areMethods are consistentconsistent when they givewhen they givesimilar resultssimilar results
Measuring of similarityMeasuring of similarityCorrelations or (more generally)Correlations or (more generally)
mean angles between vectors of resultsmean angles between vectors of resultsSIMccSIMcc = 100 x= 100 x correlcoefficientcorrelcoefficient ()()SIMqaSIMqa = 100 x (1= 100 x (1 ndashndash |Ang|180) ()|Ang|180) ()
2222
22
GNOSTIC CORRELATIONSGNOSTIC CORRELATIONS
Data error inData error in gnosticgnostic irrelevanceirrelevanceirir = (2p= (2p -- 1)21)2
pp hellip probability of the data itemhellip probability of the data itemCorrelation coefficient of two samplesCorrelation coefficient of two samples
Gcc(MNGcc(MN) =) = ccir(m)ir(nccir(m)ir(n))(m in M n in N) cc (m in M n in N) cc statiststatist corcoefcorcoef
RobustnessRobustness-- 1 lt=1 lt= irir lt= + 1lt= + 1 2323
23
SIGNIFICANCESIGNIFICANCE OF CORRELATIONSOF CORRELATIONS
Problems false statistical modelProblems false statistical model (normality finite data support)(normality finite data support) small data samplessmall data samples unrobustnessunrobustness
Gnostic estimating of significanceGnostic estimating of significancefrac34frac34 fast auxiliaryfast auxiliary usinusi g Spearmanrsquosng Spearmanrsquos
robust estimate of significancerobust estimate of significancefrac34frac34 carefullycarefully distribution function ofdistribution function of
correlation coefficientscorrelation coefficients2424
24
2525
25
2525
QUANTILE VECTORSQUANTILE VECTORS
Make samplersquos distribution functionMake samplersquos distribution function Set a series of probabilitiesSet a series of probabilities p1hellipp1hellippNpN FindFind quantilesquantiles q1hellipq1hellipqNqN so thatso that PqkPqk==pkpk TakeTake q1hellipq1hellipqNqN as aas a quantilequantile vectorvectorAdvantagesAdvantages
Robustness making use of censored dataRobustness making use of censored dataindependence of data amount and ofindependence of data amount and of mean data value filtering effectmean data value filtering effect
2626
26
2727
27
2727
2828
28
2828
2929
Co
nce
ntr
atio
n u
gs
am
plin
g s
yste
m
2929
29
EXTERNAL CONSISTENCYEXTERNAL CONSISTENCY
ApproachesApproaches CorrelationsCorrelations Angles betwAngl een MDes between MD--vectors of meansvectors of means Angles betweenAngles between quantilequantile vectovect rsro s Conjunction of typical data intervalsConjunction of typical data intervals Conjunction of data supportsConjunction of data supports
3030
30
INTERVAL ANALYSISINTERVAL ANALYSIS
1)1) Distribution functionsDistribution functions2)2) Interval analysisInterval analysis
a)a) Data supportData support (LB UB)(LB UB)b)b) Membership intervalMembership interval (LSB USB)(LSB USB)c)c) Interval of typical dataInterval of typical data (ZL UL)(ZL UL)d)d) Tolerance intervalTolerance interval (Z0L Z0U)(Z0L Z0U)
3)3) OverlappingOverlapping 100xconjunction(I1 I2)union(I1I2) ()100xconjunction(I1 I2)union(I1I2) ()
3131
31
INFORMATIVENESSINFORMATIVENESS
1)1) Data sampleData sample2)2) Distribution functionDistribution function3)3) ProbabilityProbability pp of an individual data itemof an individual data item4)4) Information of the data itemInformation of the data item
Info=(pInfo=(p log(plog(p) + (1) + (1--p)log(1p)log(1--p))logp (12)())log 12)5)5) InformativenessInformativeness of a data sampleof a data sample
100 x100 x MeM an(Infoean(Info) ()) ()3232
32
3333
EVALUATIONEVALUATION OF PRECISIONOF PRECISION
Weak variabilityWeak variability PrecPrec = 100 x (1= 100 x (1 ndashndash STDAVG) ()STDAVG) ()
((STDSTD hellip standard deviationhellip standard deviation AVGAVG helliphellip mean)mean)
Strong uncertaintyStrong uncertaintyPrecPrec = 100 x (1= 100 x (1 -- Mean(GWMean(GW) ) ()) ) ()
((GWGW helliphellip gnosticgnostic weight of data entropyweight of data entropy change caused by the uncertainty)change caused by the uncertainty)
0 lt= GW lt= 10 lt= GW lt= 1
33
SUMMARY COMPARISONSUMMARY COMPARISON
AverigeAverige of 14 evaluationsof 14 evaluations
MethodMethod NonNon--homdatahomdata HomogHomog data data
BentosBentos 609 609 627 627
DreissenaDreissena 645 645 675 675
PlantsPlants 642 642 689 689
SPMDSPMD 675 675 695 695
3434
34
3535
35
3535
RATINGRATIN OF METHODSG OF METHODS
FeatureFeatureExtconsistencyExtconsistencyIntconsistencyIntconsistencyInformativenessInformativenessPrecissionPrecissionHomogeneityHomogeneityRelsensitivityRelsensitivityMean ratingMean rating
BentosBentos DreissDreiss PlantsPlants SPMDSPMD44 33 11 2244 33 22 1111 33 44 2233 11 44 2222 44 33 1133 11 22 11
2828 2525 2727 15153636
36
ndash
ndash
ndash
ConclusionsConclusions
Passive sampling like SPMDs shown the bestPassive sampling like SPMDs shown the best results if there are no legal requirements for biotaresults if there are no legal requirements for biota biotic organisms can be replacedbiotic organisms can be replaced
Do not forget to analyze data preciselyDo not forget to analyze data precisely independently before your interpretationindependently before your interpretationndash Do not rely ONLY on functionality of any processingDo not rely ONLY on functionality of any processing
packagepackagendash Statistical approach has some limitations on small dataStatistical approach has some limitations on small data
sets (majority of monitoring studies)sets (majority of monitoring studies)
Any headache from analytical tools can beAny headache from analytical tools can be eliminated by expeeliminated by exp rienceeriencendash Try itTry it
3737
37
Further intentionsFurther intentions
Finalization of Gnostic analytical toolFinalization of Gnostic analytical tool with GUI (Swith GUI (S--Plus)Plus)
Extension to other platforms byExtension to other platforms by interfaceinterface
Linking to databases (LIMS GIS hellip)Linking to databases (LIMS GIS hellip) Training and disseminationTraining and dissemination Projects solutions and participationsProjects solutions and participations
ndashndash Join us 2Join us 2--FUN projectFUN project www2www2--funorgfunorg
3838
38
3939
hellip thank you for your attention
PCDDF
39

ndash
ndash
ndash -
ndash
ndash
ndashndash
Centre laboratoriesCentre laboratories accreditationaccreditation
Personnel over 140 5+Person 2 workplacesnel over 140 5+2 workplaces According to ČSN EN ISOIEC 17According 025to ČSN EN ISOIEC 17 025
ndash Over 200 paraOver 200 p metersarameters PCDDFs PCBs OCPs PBDE hellipPCDDFs PCBs OCPs PBDE hellip
ndash Recognized by ILAC EA IAFRecognized by ILAC EA IAF Sampling and TestingSampling and Testing
ndash IntegralIntegral - waterwater SPMDsSPMDs DGTsDGTs POCIPOC SIS
ndash Biotic organiBioti smsc organisms IntercalibrationIntercalibration
ndash Czech + InternationalCzech + International Data analysis (univariatemultivariate)Data analysis (univariatemultivariate)
ndash StatisStati ticalsticalndash GnosticGnostic
44
4
-
-
InstrumentatiInstrumenta ontion (worth over 6 mil USD)(worth over 6 mil USD)
GC-MSMS (ion-trap)
GCQ Polaris
Since 1996 (starting to POPs issue)
GC-HRMS (POPs)
- MAT 95XP
- since 2003
LC-MSMS (pharmacy pesticides)
- ThermoFinigan
- since 2006 55
5
ndash
ndash
ndashndash ndash
Data source for comparison ofData source for comparison of methodsmethods
All rivers within Czech RepuAll rivers wi blicthin Czech Republic scale (15)scale (15)
21 sampling pr21 sampling p ofilesrofiles Complementary to bioticComplementary to biotic
sampling system (since 1999)sampling system (since 1999) with abiotic (SPMDs DGTswith abiotic (SPMDs DGTs POCIS)POCIS) ndashndash sincsi e 2003nce 2003
AimsAimsndash Pilot application 2 years beforePilot application 2 years before
routine applicationroutine application ndash Parallel exposure of DreissenaParallel exposure of Dreissena
Polymorpha Benthos PlantsPolymorpha Benthos Plantsndash POPs (basic OCPs PCBs)POPs (basic OCPs PCBs)ndash POPs (other PCBsPOPs (other PCBs ndash coc ngong
PCDDFs PAHs PBDEPCDDFs PAHs PBD s)Es)
66
6
77
SAMPLING METHODSSAMPLING METHODSTO BE COMPAREDTO BE COMPARED
ThreeThree bioticbiotic methodsmethods BentosBentos DreissenaDreissena PlantsPlantsOneOne abioticabiotic method SPMDmethod SPMD(Semipermeable Membrane Measuring(Semipermeable Membrane Measuring
Device)Device)
7
The selectionThe selection
Concentrations of selected permanentConcentrations of selected permanentorganic pollutants (POPs) in severalorganic pollutants (POPs) in severallocations of Elbe river in Czech Republiclocations of Elbe river in Czech Republic
ppDDEppDDE PCB138 PCB180 PCB138 PCB180 PCB101 PCB2831PCB101 PCB2831 ppDDTppDDT ppDDDppDDD PCB52 PCB118 PCB52 PCB118
88
8
PROBLEMS OF ANALYSISPROBLEMS OF ANALYSIS
Small data samplesSmall data samples Different mean concentrationsDifferent mean concentrations Strong vaStrong v riabilityariability Different length of data vectorsDifferent length of data vectors Data censoring (Data censoring (egeg data below the LOD)data below the LOD) NonNon--homogeneous and outlying datahomogeneous and outlying data
99
9
SPECIFICSSPECIFICS of MATHEMATICAL GNOSTICSof MATHEMATICAL GNOSTICS
Theory ofTheory of individualindividual datadata andand smallsmall data samplesdata samples
RealisticRealistic assumptionsassumptions UncertaintyUncertainty a lack of knowledgea lack of knowledge ldquoLet data speakldquoLet data speak for themsefor thems lveselvesrdquordquo ResultsResults maximizing informationmaximizing information NaturalNatural robustnessrobustness
1010
10
1111
Comparison of two approachesComparison of two approaches
1111
11
GNOSTICGNOSTICDISTRIBUTION FUNCTIONSDISTRIBUTION FUNCTIONS
No a priori modelNo a priori model (e( verything from data)everything from data)
MaximumMaximum informationinformation
RobustnessRobustness in estimation of probabilityin estimation of probability
quantilesquantiles scale and location parameters scale and location parameters
bounds of data support and membershipbounds of data support and membership
intervalinterval
frac34frac34 RobustRobust correlationscorrelations 1212
12
1313
GNOSTICGNOSTICDISTRIBUTION FUNCTIONS IIDISTRIBUTION FUNCTIONS II
DataData homogeneityhomogeneity teststests
MarginalMarginal cluster analysiscluster analysis
CrossCross--sectionsection filteringfiltering
Applicability toApplicability to censoredcensored datadata
Applicability toApplicability to heteroscedasticheteroscedastic datadata
13
QUALITY OF METHODSQUALITY OF METHODSTO BE COMPAREDTO BE COMPARED
Relative sensitivity (Relative sensitivity (tresholdtreshold range) range)Homogeneity of resultsHomogeneity of resultsConsistency of resultsConsistency of results Internal (of methodrsquos own results)Internal (of methodrsquos own results) External (mutual consistency of methExternal (mutual consistency of met ods)hods)
InformativInformati enessveness of resultsof resultsPrecissionPrecission
1414
14
RELATIVE SENSITIVITYRELATIVE SENSITIVITY
Methodrsquos relative sensitivity dependsMethodrsquos relative sensitivity dependsOn the pollutantrsquos concentrationOn the pollutantrsquos concentrationOn the methodrsquos measuring domainOn the methodrsquos measuring domain
RS = (1RS = (1 ndashndash NCN) x 100 ()NCN) x 100 ()NCNC hellip number of data in the intervhellip number of data in th ale interval[sensitivity threshold[sensitivity threshold max(rangemax(range)])]
NN hellip all data of the sahellip all data of the s mpleample1515
15
HOMOGENIZATIONHOMOGENIZATIONTO BE OR NOT TO BETO BE OR NOT TO BE
Homogeneous dataHomogeneous datathe samethe same originorigin of true valuesof true valuesthe same nature of thethe same nature of the uncertaintyuncertainty
To homogenizeTo homogenize ProsPros
More certain main clusterMore certain main cluster ConsCons
Possible loss of informationPossible loss of informationRule homogenize and verifyRule homogenize and verify
1616
16
MEASURABILITYMEASURABILITY
Homogenization hellip elimination of outliersHomogenization hellip elimination of outliersMeasMeas = (1= (1 ndashndash (NL+NU)N) x 100 ()(NL+NU)N) x 100 ()NL hellipNL hellip number of lower outliersnumber of lower outliersNU hellipNU hellip number of upper outliersnumber of upper outliersN hellipN hellip number of the samplersquos datanumber of the samplersquos dataNN ndashndash NLNL ndashndash NU hellipNU hellip data of the main clusterdata of the main cluster
1717
17
1818
METHODS OF ANALYSISMETHODS OF ANALYSIS
GEOMETRYGEOMETRY(angles between vectors)(angles between vectors)
STATISTICSSTATISTICS(robust correlations)(robust correlations)
MATHEMATICAL GNOSTICS MATHEMATICAL GNOSTICS (robust correlations robust(robust correlations robustdistribution functions information distribution functions information and entropy of small data samples)and entropy of small data samples)
Dec Log (concentration) ugsampling system
1818
18
1919
Dec Log (concentration) ugsampling system
1919
19
2020
Co
nce
ntr
atio
n u
gs
am
plin
g s
yste
m
2020
20
DIFFERENCES IN METHODSDIFFERENCES IN METHODS
Different accumulation of pollutantsDifferent accumulation of pollutantsbullbull different mean concentrationsdifferent mean concentrationsbullbull differentdifferent variabilitiesvariabilities
Different relations between meansDifferent relations between means Rare exception agreement in PCB118Rare exception agreement in PCB118 Impact of outliers to SPMDImpact of outliers to SPMD NONO
2121
21
METHODrsquoS CONSISTENCYMETHODrsquoS CONSISTENCY
Methods areMethods are consistentconsistent when they givewhen they givesimilar resultssimilar results
Measuring of similarityMeasuring of similarityCorrelations or (more generally)Correlations or (more generally)
mean angles between vectors of resultsmean angles between vectors of resultsSIMccSIMcc = 100 x= 100 x correlcoefficientcorrelcoefficient ()()SIMqaSIMqa = 100 x (1= 100 x (1 ndashndash |Ang|180) ()|Ang|180) ()
2222
22
GNOSTIC CORRELATIONSGNOSTIC CORRELATIONS
Data error inData error in gnosticgnostic irrelevanceirrelevanceirir = (2p= (2p -- 1)21)2
pp hellip probability of the data itemhellip probability of the data itemCorrelation coefficient of two samplesCorrelation coefficient of two samples
Gcc(MNGcc(MN) =) = ccir(m)ir(nccir(m)ir(n))(m in M n in N) cc (m in M n in N) cc statiststatist corcoefcorcoef
RobustnessRobustness-- 1 lt=1 lt= irir lt= + 1lt= + 1 2323
23
SIGNIFICANCESIGNIFICANCE OF CORRELATIONSOF CORRELATIONS
Problems false statistical modelProblems false statistical model (normality finite data support)(normality finite data support) small data samplessmall data samples unrobustnessunrobustness
Gnostic estimating of significanceGnostic estimating of significancefrac34frac34 fast auxiliaryfast auxiliary usinusi g Spearmanrsquosng Spearmanrsquos
robust estimate of significancerobust estimate of significancefrac34frac34 carefullycarefully distribution function ofdistribution function of
correlation coefficientscorrelation coefficients2424
24
2525
25
2525
QUANTILE VECTORSQUANTILE VECTORS
Make samplersquos distribution functionMake samplersquos distribution function Set a series of probabilitiesSet a series of probabilities p1hellipp1hellippNpN FindFind quantilesquantiles q1hellipq1hellipqNqN so thatso that PqkPqk==pkpk TakeTake q1hellipq1hellipqNqN as aas a quantilequantile vectorvectorAdvantagesAdvantages
Robustness making use of censored dataRobustness making use of censored dataindependence of data amount and ofindependence of data amount and of mean data value filtering effectmean data value filtering effect
2626
26
2727
27
2727
2828
28
2828
2929
Co
nce
ntr
atio
n u
gs
am
plin
g s
yste
m
2929
29
EXTERNAL CONSISTENCYEXTERNAL CONSISTENCY
ApproachesApproaches CorrelationsCorrelations Angles betwAngl een MDes between MD--vectors of meansvectors of means Angles betweenAngles between quantilequantile vectovect rsro s Conjunction of typical data intervalsConjunction of typical data intervals Conjunction of data supportsConjunction of data supports
3030
30
INTERVAL ANALYSISINTERVAL ANALYSIS
1)1) Distribution functionsDistribution functions2)2) Interval analysisInterval analysis
a)a) Data supportData support (LB UB)(LB UB)b)b) Membership intervalMembership interval (LSB USB)(LSB USB)c)c) Interval of typical dataInterval of typical data (ZL UL)(ZL UL)d)d) Tolerance intervalTolerance interval (Z0L Z0U)(Z0L Z0U)
3)3) OverlappingOverlapping 100xconjunction(I1 I2)union(I1I2) ()100xconjunction(I1 I2)union(I1I2) ()
3131
31
INFORMATIVENESSINFORMATIVENESS
1)1) Data sampleData sample2)2) Distribution functionDistribution function3)3) ProbabilityProbability pp of an individual data itemof an individual data item4)4) Information of the data itemInformation of the data item
Info=(pInfo=(p log(plog(p) + (1) + (1--p)log(1p)log(1--p))logp (12)())log 12)5)5) InformativenessInformativeness of a data sampleof a data sample
100 x100 x MeM an(Infoean(Info) ()) ()3232
32
3333
EVALUATIONEVALUATION OF PRECISIONOF PRECISION
Weak variabilityWeak variability PrecPrec = 100 x (1= 100 x (1 ndashndash STDAVG) ()STDAVG) ()
((STDSTD hellip standard deviationhellip standard deviation AVGAVG helliphellip mean)mean)
Strong uncertaintyStrong uncertaintyPrecPrec = 100 x (1= 100 x (1 -- Mean(GWMean(GW) ) ()) ) ()
((GWGW helliphellip gnosticgnostic weight of data entropyweight of data entropy change caused by the uncertainty)change caused by the uncertainty)
0 lt= GW lt= 10 lt= GW lt= 1
33
SUMMARY COMPARISONSUMMARY COMPARISON
AverigeAverige of 14 evaluationsof 14 evaluations
MethodMethod NonNon--homdatahomdata HomogHomog data data
BentosBentos 609 609 627 627
DreissenaDreissena 645 645 675 675
PlantsPlants 642 642 689 689
SPMDSPMD 675 675 695 695
3434
34
3535
35
3535
RATINGRATIN OF METHODSG OF METHODS
FeatureFeatureExtconsistencyExtconsistencyIntconsistencyIntconsistencyInformativenessInformativenessPrecissionPrecissionHomogeneityHomogeneityRelsensitivityRelsensitivityMean ratingMean rating
BentosBentos DreissDreiss PlantsPlants SPMDSPMD44 33 11 2244 33 22 1111 33 44 2233 11 44 2222 44 33 1133 11 22 11
2828 2525 2727 15153636
36
ndash
ndash
ndash
ConclusionsConclusions
Passive sampling like SPMDs shown the bestPassive sampling like SPMDs shown the best results if there are no legal requirements for biotaresults if there are no legal requirements for biota biotic organisms can be replacedbiotic organisms can be replaced
Do not forget to analyze data preciselyDo not forget to analyze data precisely independently before your interpretationindependently before your interpretationndash Do not rely ONLY on functionality of any processingDo not rely ONLY on functionality of any processing
packagepackagendash Statistical approach has some limitations on small dataStatistical approach has some limitations on small data
sets (majority of monitoring studies)sets (majority of monitoring studies)
Any headache from analytical tools can beAny headache from analytical tools can be eliminated by expeeliminated by exp rienceeriencendash Try itTry it
3737
37
Further intentionsFurther intentions
Finalization of Gnostic analytical toolFinalization of Gnostic analytical tool with GUI (Swith GUI (S--Plus)Plus)
Extension to other platforms byExtension to other platforms by interfaceinterface
Linking to databases (LIMS GIS hellip)Linking to databases (LIMS GIS hellip) Training and disseminationTraining and dissemination Projects solutions and participationsProjects solutions and participations
ndashndash Join us 2Join us 2--FUN projectFUN project www2www2--funorgfunorg
3838
38
3939
hellip thank you for your attention
PCDDF
39

-
-
InstrumentatiInstrumenta ontion (worth over 6 mil USD)(worth over 6 mil USD)
GC-MSMS (ion-trap)
GCQ Polaris
Since 1996 (starting to POPs issue)
GC-HRMS (POPs)
- MAT 95XP
- since 2003
LC-MSMS (pharmacy pesticides)
- ThermoFinigan
- since 2006 55
5
ndash
ndash
ndashndash ndash
Data source for comparison ofData source for comparison of methodsmethods
All rivers within Czech RepuAll rivers wi blicthin Czech Republic scale (15)scale (15)
21 sampling pr21 sampling p ofilesrofiles Complementary to bioticComplementary to biotic
sampling system (since 1999)sampling system (since 1999) with abiotic (SPMDs DGTswith abiotic (SPMDs DGTs POCIS)POCIS) ndashndash sincsi e 2003nce 2003
AimsAimsndash Pilot application 2 years beforePilot application 2 years before
routine applicationroutine application ndash Parallel exposure of DreissenaParallel exposure of Dreissena
Polymorpha Benthos PlantsPolymorpha Benthos Plantsndash POPs (basic OCPs PCBs)POPs (basic OCPs PCBs)ndash POPs (other PCBsPOPs (other PCBs ndash coc ngong
PCDDFs PAHs PBDEPCDDFs PAHs PBD s)Es)
66
6
77
SAMPLING METHODSSAMPLING METHODSTO BE COMPAREDTO BE COMPARED
ThreeThree bioticbiotic methodsmethods BentosBentos DreissenaDreissena PlantsPlantsOneOne abioticabiotic method SPMDmethod SPMD(Semipermeable Membrane Measuring(Semipermeable Membrane Measuring
Device)Device)
7
The selectionThe selection
Concentrations of selected permanentConcentrations of selected permanentorganic pollutants (POPs) in severalorganic pollutants (POPs) in severallocations of Elbe river in Czech Republiclocations of Elbe river in Czech Republic
ppDDEppDDE PCB138 PCB180 PCB138 PCB180 PCB101 PCB2831PCB101 PCB2831 ppDDTppDDT ppDDDppDDD PCB52 PCB118 PCB52 PCB118
88
8
PROBLEMS OF ANALYSISPROBLEMS OF ANALYSIS
Small data samplesSmall data samples Different mean concentrationsDifferent mean concentrations Strong vaStrong v riabilityariability Different length of data vectorsDifferent length of data vectors Data censoring (Data censoring (egeg data below the LOD)data below the LOD) NonNon--homogeneous and outlying datahomogeneous and outlying data
99
9
SPECIFICSSPECIFICS of MATHEMATICAL GNOSTICSof MATHEMATICAL GNOSTICS
Theory ofTheory of individualindividual datadata andand smallsmall data samplesdata samples
RealisticRealistic assumptionsassumptions UncertaintyUncertainty a lack of knowledgea lack of knowledge ldquoLet data speakldquoLet data speak for themsefor thems lveselvesrdquordquo ResultsResults maximizing informationmaximizing information NaturalNatural robustnessrobustness
1010
10
1111
Comparison of two approachesComparison of two approaches
1111
11
GNOSTICGNOSTICDISTRIBUTION FUNCTIONSDISTRIBUTION FUNCTIONS
No a priori modelNo a priori model (e( verything from data)everything from data)
MaximumMaximum informationinformation
RobustnessRobustness in estimation of probabilityin estimation of probability
quantilesquantiles scale and location parameters scale and location parameters
bounds of data support and membershipbounds of data support and membership
intervalinterval
frac34frac34 RobustRobust correlationscorrelations 1212
12
1313
GNOSTICGNOSTICDISTRIBUTION FUNCTIONS IIDISTRIBUTION FUNCTIONS II
DataData homogeneityhomogeneity teststests
MarginalMarginal cluster analysiscluster analysis
CrossCross--sectionsection filteringfiltering
Applicability toApplicability to censoredcensored datadata
Applicability toApplicability to heteroscedasticheteroscedastic datadata
13
QUALITY OF METHODSQUALITY OF METHODSTO BE COMPAREDTO BE COMPARED
Relative sensitivity (Relative sensitivity (tresholdtreshold range) range)Homogeneity of resultsHomogeneity of resultsConsistency of resultsConsistency of results Internal (of methodrsquos own results)Internal (of methodrsquos own results) External (mutual consistency of methExternal (mutual consistency of met ods)hods)
InformativInformati enessveness of resultsof resultsPrecissionPrecission
1414
14
RELATIVE SENSITIVITYRELATIVE SENSITIVITY
Methodrsquos relative sensitivity dependsMethodrsquos relative sensitivity dependsOn the pollutantrsquos concentrationOn the pollutantrsquos concentrationOn the methodrsquos measuring domainOn the methodrsquos measuring domain
RS = (1RS = (1 ndashndash NCN) x 100 ()NCN) x 100 ()NCNC hellip number of data in the intervhellip number of data in th ale interval[sensitivity threshold[sensitivity threshold max(rangemax(range)])]
NN hellip all data of the sahellip all data of the s mpleample1515
15
HOMOGENIZATIONHOMOGENIZATIONTO BE OR NOT TO BETO BE OR NOT TO BE
Homogeneous dataHomogeneous datathe samethe same originorigin of true valuesof true valuesthe same nature of thethe same nature of the uncertaintyuncertainty
To homogenizeTo homogenize ProsPros
More certain main clusterMore certain main cluster ConsCons
Possible loss of informationPossible loss of informationRule homogenize and verifyRule homogenize and verify
1616
16
MEASURABILITYMEASURABILITY
Homogenization hellip elimination of outliersHomogenization hellip elimination of outliersMeasMeas = (1= (1 ndashndash (NL+NU)N) x 100 ()(NL+NU)N) x 100 ()NL hellipNL hellip number of lower outliersnumber of lower outliersNU hellipNU hellip number of upper outliersnumber of upper outliersN hellipN hellip number of the samplersquos datanumber of the samplersquos dataNN ndashndash NLNL ndashndash NU hellipNU hellip data of the main clusterdata of the main cluster
1717
17
1818
METHODS OF ANALYSISMETHODS OF ANALYSIS
GEOMETRYGEOMETRY(angles between vectors)(angles between vectors)
STATISTICSSTATISTICS(robust correlations)(robust correlations)
MATHEMATICAL GNOSTICS MATHEMATICAL GNOSTICS (robust correlations robust(robust correlations robustdistribution functions information distribution functions information and entropy of small data samples)and entropy of small data samples)
Dec Log (concentration) ugsampling system
1818
18
1919
Dec Log (concentration) ugsampling system
1919
19
2020
Co
nce
ntr
atio
n u
gs
am
plin
g s
yste
m
2020
20
DIFFERENCES IN METHODSDIFFERENCES IN METHODS
Different accumulation of pollutantsDifferent accumulation of pollutantsbullbull different mean concentrationsdifferent mean concentrationsbullbull differentdifferent variabilitiesvariabilities
Different relations between meansDifferent relations between means Rare exception agreement in PCB118Rare exception agreement in PCB118 Impact of outliers to SPMDImpact of outliers to SPMD NONO
2121
21
METHODrsquoS CONSISTENCYMETHODrsquoS CONSISTENCY
Methods areMethods are consistentconsistent when they givewhen they givesimilar resultssimilar results
Measuring of similarityMeasuring of similarityCorrelations or (more generally)Correlations or (more generally)
mean angles between vectors of resultsmean angles between vectors of resultsSIMccSIMcc = 100 x= 100 x correlcoefficientcorrelcoefficient ()()SIMqaSIMqa = 100 x (1= 100 x (1 ndashndash |Ang|180) ()|Ang|180) ()
2222
22
GNOSTIC CORRELATIONSGNOSTIC CORRELATIONS
Data error inData error in gnosticgnostic irrelevanceirrelevanceirir = (2p= (2p -- 1)21)2
pp hellip probability of the data itemhellip probability of the data itemCorrelation coefficient of two samplesCorrelation coefficient of two samples
Gcc(MNGcc(MN) =) = ccir(m)ir(nccir(m)ir(n))(m in M n in N) cc (m in M n in N) cc statiststatist corcoefcorcoef
RobustnessRobustness-- 1 lt=1 lt= irir lt= + 1lt= + 1 2323
23
SIGNIFICANCESIGNIFICANCE OF CORRELATIONSOF CORRELATIONS
Problems false statistical modelProblems false statistical model (normality finite data support)(normality finite data support) small data samplessmall data samples unrobustnessunrobustness
Gnostic estimating of significanceGnostic estimating of significancefrac34frac34 fast auxiliaryfast auxiliary usinusi g Spearmanrsquosng Spearmanrsquos
robust estimate of significancerobust estimate of significancefrac34frac34 carefullycarefully distribution function ofdistribution function of
correlation coefficientscorrelation coefficients2424
24
2525
25
2525
QUANTILE VECTORSQUANTILE VECTORS
Make samplersquos distribution functionMake samplersquos distribution function Set a series of probabilitiesSet a series of probabilities p1hellipp1hellippNpN FindFind quantilesquantiles q1hellipq1hellipqNqN so thatso that PqkPqk==pkpk TakeTake q1hellipq1hellipqNqN as aas a quantilequantile vectorvectorAdvantagesAdvantages
Robustness making use of censored dataRobustness making use of censored dataindependence of data amount and ofindependence of data amount and of mean data value filtering effectmean data value filtering effect
2626
26
2727
27
2727
2828
28
2828
2929
Co
nce
ntr
atio
n u
gs
am
plin
g s
yste
m
2929
29
EXTERNAL CONSISTENCYEXTERNAL CONSISTENCY
ApproachesApproaches CorrelationsCorrelations Angles betwAngl een MDes between MD--vectors of meansvectors of means Angles betweenAngles between quantilequantile vectovect rsro s Conjunction of typical data intervalsConjunction of typical data intervals Conjunction of data supportsConjunction of data supports
3030
30
INTERVAL ANALYSISINTERVAL ANALYSIS
1)1) Distribution functionsDistribution functions2)2) Interval analysisInterval analysis
a)a) Data supportData support (LB UB)(LB UB)b)b) Membership intervalMembership interval (LSB USB)(LSB USB)c)c) Interval of typical dataInterval of typical data (ZL UL)(ZL UL)d)d) Tolerance intervalTolerance interval (Z0L Z0U)(Z0L Z0U)
3)3) OverlappingOverlapping 100xconjunction(I1 I2)union(I1I2) ()100xconjunction(I1 I2)union(I1I2) ()
3131
31
INFORMATIVENESSINFORMATIVENESS
1)1) Data sampleData sample2)2) Distribution functionDistribution function3)3) ProbabilityProbability pp of an individual data itemof an individual data item4)4) Information of the data itemInformation of the data item
Info=(pInfo=(p log(plog(p) + (1) + (1--p)log(1p)log(1--p))logp (12)())log 12)5)5) InformativenessInformativeness of a data sampleof a data sample
100 x100 x MeM an(Infoean(Info) ()) ()3232
32
3333
EVALUATIONEVALUATION OF PRECISIONOF PRECISION
Weak variabilityWeak variability PrecPrec = 100 x (1= 100 x (1 ndashndash STDAVG) ()STDAVG) ()
((STDSTD hellip standard deviationhellip standard deviation AVGAVG helliphellip mean)mean)
Strong uncertaintyStrong uncertaintyPrecPrec = 100 x (1= 100 x (1 -- Mean(GWMean(GW) ) ()) ) ()
((GWGW helliphellip gnosticgnostic weight of data entropyweight of data entropy change caused by the uncertainty)change caused by the uncertainty)
0 lt= GW lt= 10 lt= GW lt= 1
33
SUMMARY COMPARISONSUMMARY COMPARISON
AverigeAverige of 14 evaluationsof 14 evaluations
MethodMethod NonNon--homdatahomdata HomogHomog data data
BentosBentos 609 609 627 627
DreissenaDreissena 645 645 675 675
PlantsPlants 642 642 689 689
SPMDSPMD 675 675 695 695
3434
34
3535
35
3535
RATINGRATIN OF METHODSG OF METHODS
FeatureFeatureExtconsistencyExtconsistencyIntconsistencyIntconsistencyInformativenessInformativenessPrecissionPrecissionHomogeneityHomogeneityRelsensitivityRelsensitivityMean ratingMean rating
BentosBentos DreissDreiss PlantsPlants SPMDSPMD44 33 11 2244 33 22 1111 33 44 2233 11 44 2222 44 33 1133 11 22 11
2828 2525 2727 15153636
36
ndash
ndash
ndash
ConclusionsConclusions
Passive sampling like SPMDs shown the bestPassive sampling like SPMDs shown the best results if there are no legal requirements for biotaresults if there are no legal requirements for biota biotic organisms can be replacedbiotic organisms can be replaced
Do not forget to analyze data preciselyDo not forget to analyze data precisely independently before your interpretationindependently before your interpretationndash Do not rely ONLY on functionality of any processingDo not rely ONLY on functionality of any processing
packagepackagendash Statistical approach has some limitations on small dataStatistical approach has some limitations on small data
sets (majority of monitoring studies)sets (majority of monitoring studies)
Any headache from analytical tools can beAny headache from analytical tools can be eliminated by expeeliminated by exp rienceeriencendash Try itTry it
3737
37
Further intentionsFurther intentions
Finalization of Gnostic analytical toolFinalization of Gnostic analytical tool with GUI (Swith GUI (S--Plus)Plus)
Extension to other platforms byExtension to other platforms by interfaceinterface
Linking to databases (LIMS GIS hellip)Linking to databases (LIMS GIS hellip) Training and disseminationTraining and dissemination Projects solutions and participationsProjects solutions and participations
ndashndash Join us 2Join us 2--FUN projectFUN project www2www2--funorgfunorg
3838
38
3939
hellip thank you for your attention
PCDDF
39
ndash
ndash
ndashndash ndash
Data source for comparison ofData source for comparison of methodsmethods
All rivers within Czech RepuAll rivers wi blicthin Czech Republic scale (15)scale (15)
21 sampling pr21 sampling p ofilesrofiles Complementary to bioticComplementary to biotic
sampling system (since 1999)sampling system (since 1999) with abiotic (SPMDs DGTswith abiotic (SPMDs DGTs POCIS)POCIS) ndashndash sincsi e 2003nce 2003
AimsAimsndash Pilot application 2 years beforePilot application 2 years before
routine applicationroutine application ndash Parallel exposure of DreissenaParallel exposure of Dreissena
Polymorpha Benthos PlantsPolymorpha Benthos Plantsndash POPs (basic OCPs PCBs)POPs (basic OCPs PCBs)ndash POPs (other PCBsPOPs (other PCBs ndash coc ngong
PCDDFs PAHs PBDEPCDDFs PAHs PBD s)Es)
66
6
77
SAMPLING METHODSSAMPLING METHODSTO BE COMPAREDTO BE COMPARED
ThreeThree bioticbiotic methodsmethods BentosBentos DreissenaDreissena PlantsPlantsOneOne abioticabiotic method SPMDmethod SPMD(Semipermeable Membrane Measuring(Semipermeable Membrane Measuring
Device)Device)
7
The selectionThe selection
Concentrations of selected permanentConcentrations of selected permanentorganic pollutants (POPs) in severalorganic pollutants (POPs) in severallocations of Elbe river in Czech Republiclocations of Elbe river in Czech Republic
ppDDEppDDE PCB138 PCB180 PCB138 PCB180 PCB101 PCB2831PCB101 PCB2831 ppDDTppDDT ppDDDppDDD PCB52 PCB118 PCB52 PCB118
88
8
PROBLEMS OF ANALYSISPROBLEMS OF ANALYSIS
Small data samplesSmall data samples Different mean concentrationsDifferent mean concentrations Strong vaStrong v riabilityariability Different length of data vectorsDifferent length of data vectors Data censoring (Data censoring (egeg data below the LOD)data below the LOD) NonNon--homogeneous and outlying datahomogeneous and outlying data
99
9
SPECIFICSSPECIFICS of MATHEMATICAL GNOSTICSof MATHEMATICAL GNOSTICS
Theory ofTheory of individualindividual datadata andand smallsmall data samplesdata samples
RealisticRealistic assumptionsassumptions UncertaintyUncertainty a lack of knowledgea lack of knowledge ldquoLet data speakldquoLet data speak for themsefor thems lveselvesrdquordquo ResultsResults maximizing informationmaximizing information NaturalNatural robustnessrobustness
1010
10
1111
Comparison of two approachesComparison of two approaches
1111
11
GNOSTICGNOSTICDISTRIBUTION FUNCTIONSDISTRIBUTION FUNCTIONS
No a priori modelNo a priori model (e( verything from data)everything from data)
MaximumMaximum informationinformation
RobustnessRobustness in estimation of probabilityin estimation of probability
quantilesquantiles scale and location parameters scale and location parameters
bounds of data support and membershipbounds of data support and membership
intervalinterval
frac34frac34 RobustRobust correlationscorrelations 1212
12
1313
GNOSTICGNOSTICDISTRIBUTION FUNCTIONS IIDISTRIBUTION FUNCTIONS II
DataData homogeneityhomogeneity teststests
MarginalMarginal cluster analysiscluster analysis
CrossCross--sectionsection filteringfiltering
Applicability toApplicability to censoredcensored datadata
Applicability toApplicability to heteroscedasticheteroscedastic datadata
13
QUALITY OF METHODSQUALITY OF METHODSTO BE COMPAREDTO BE COMPARED
Relative sensitivity (Relative sensitivity (tresholdtreshold range) range)Homogeneity of resultsHomogeneity of resultsConsistency of resultsConsistency of results Internal (of methodrsquos own results)Internal (of methodrsquos own results) External (mutual consistency of methExternal (mutual consistency of met ods)hods)
InformativInformati enessveness of resultsof resultsPrecissionPrecission
1414
14
RELATIVE SENSITIVITYRELATIVE SENSITIVITY
Methodrsquos relative sensitivity dependsMethodrsquos relative sensitivity dependsOn the pollutantrsquos concentrationOn the pollutantrsquos concentrationOn the methodrsquos measuring domainOn the methodrsquos measuring domain
RS = (1RS = (1 ndashndash NCN) x 100 ()NCN) x 100 ()NCNC hellip number of data in the intervhellip number of data in th ale interval[sensitivity threshold[sensitivity threshold max(rangemax(range)])]
NN hellip all data of the sahellip all data of the s mpleample1515
15
HOMOGENIZATIONHOMOGENIZATIONTO BE OR NOT TO BETO BE OR NOT TO BE
Homogeneous dataHomogeneous datathe samethe same originorigin of true valuesof true valuesthe same nature of thethe same nature of the uncertaintyuncertainty
To homogenizeTo homogenize ProsPros
More certain main clusterMore certain main cluster ConsCons
Possible loss of informationPossible loss of informationRule homogenize and verifyRule homogenize and verify
1616
16
MEASURABILITYMEASURABILITY
Homogenization hellip elimination of outliersHomogenization hellip elimination of outliersMeasMeas = (1= (1 ndashndash (NL+NU)N) x 100 ()(NL+NU)N) x 100 ()NL hellipNL hellip number of lower outliersnumber of lower outliersNU hellipNU hellip number of upper outliersnumber of upper outliersN hellipN hellip number of the samplersquos datanumber of the samplersquos dataNN ndashndash NLNL ndashndash NU hellipNU hellip data of the main clusterdata of the main cluster
1717
17
1818
METHODS OF ANALYSISMETHODS OF ANALYSIS
GEOMETRYGEOMETRY(angles between vectors)(angles between vectors)
STATISTICSSTATISTICS(robust correlations)(robust correlations)
MATHEMATICAL GNOSTICS MATHEMATICAL GNOSTICS (robust correlations robust(robust correlations robustdistribution functions information distribution functions information and entropy of small data samples)and entropy of small data samples)
Dec Log (concentration) ugsampling system
1818
18
1919
Dec Log (concentration) ugsampling system
1919
19
2020
Co
nce
ntr
atio
n u
gs
am
plin
g s
yste
m
2020
20
DIFFERENCES IN METHODSDIFFERENCES IN METHODS
Different accumulation of pollutantsDifferent accumulation of pollutantsbullbull different mean concentrationsdifferent mean concentrationsbullbull differentdifferent variabilitiesvariabilities
Different relations between meansDifferent relations between means Rare exception agreement in PCB118Rare exception agreement in PCB118 Impact of outliers to SPMDImpact of outliers to SPMD NONO
2121
21
METHODrsquoS CONSISTENCYMETHODrsquoS CONSISTENCY
Methods areMethods are consistentconsistent when they givewhen they givesimilar resultssimilar results
Measuring of similarityMeasuring of similarityCorrelations or (more generally)Correlations or (more generally)
mean angles between vectors of resultsmean angles between vectors of resultsSIMccSIMcc = 100 x= 100 x correlcoefficientcorrelcoefficient ()()SIMqaSIMqa = 100 x (1= 100 x (1 ndashndash |Ang|180) ()|Ang|180) ()
2222
22
GNOSTIC CORRELATIONSGNOSTIC CORRELATIONS
Data error inData error in gnosticgnostic irrelevanceirrelevanceirir = (2p= (2p -- 1)21)2
pp hellip probability of the data itemhellip probability of the data itemCorrelation coefficient of two samplesCorrelation coefficient of two samples
Gcc(MNGcc(MN) =) = ccir(m)ir(nccir(m)ir(n))(m in M n in N) cc (m in M n in N) cc statiststatist corcoefcorcoef
RobustnessRobustness-- 1 lt=1 lt= irir lt= + 1lt= + 1 2323
23
SIGNIFICANCESIGNIFICANCE OF CORRELATIONSOF CORRELATIONS
Problems false statistical modelProblems false statistical model (normality finite data support)(normality finite data support) small data samplessmall data samples unrobustnessunrobustness
Gnostic estimating of significanceGnostic estimating of significancefrac34frac34 fast auxiliaryfast auxiliary usinusi g Spearmanrsquosng Spearmanrsquos
robust estimate of significancerobust estimate of significancefrac34frac34 carefullycarefully distribution function ofdistribution function of
correlation coefficientscorrelation coefficients2424
24
2525
25
2525
QUANTILE VECTORSQUANTILE VECTORS
Make samplersquos distribution functionMake samplersquos distribution function Set a series of probabilitiesSet a series of probabilities p1hellipp1hellippNpN FindFind quantilesquantiles q1hellipq1hellipqNqN so thatso that PqkPqk==pkpk TakeTake q1hellipq1hellipqNqN as aas a quantilequantile vectorvectorAdvantagesAdvantages
Robustness making use of censored dataRobustness making use of censored dataindependence of data amount and ofindependence of data amount and of mean data value filtering effectmean data value filtering effect
2626
26
2727
27
2727
2828
28
2828
2929
Co
nce
ntr
atio
n u
gs
am
plin
g s
yste
m
2929
29
EXTERNAL CONSISTENCYEXTERNAL CONSISTENCY
ApproachesApproaches CorrelationsCorrelations Angles betwAngl een MDes between MD--vectors of meansvectors of means Angles betweenAngles between quantilequantile vectovect rsro s Conjunction of typical data intervalsConjunction of typical data intervals Conjunction of data supportsConjunction of data supports
3030
30
INTERVAL ANALYSISINTERVAL ANALYSIS
1)1) Distribution functionsDistribution functions2)2) Interval analysisInterval analysis
a)a) Data supportData support (LB UB)(LB UB)b)b) Membership intervalMembership interval (LSB USB)(LSB USB)c)c) Interval of typical dataInterval of typical data (ZL UL)(ZL UL)d)d) Tolerance intervalTolerance interval (Z0L Z0U)(Z0L Z0U)
3)3) OverlappingOverlapping 100xconjunction(I1 I2)union(I1I2) ()100xconjunction(I1 I2)union(I1I2) ()
3131
31
INFORMATIVENESSINFORMATIVENESS
1)1) Data sampleData sample2)2) Distribution functionDistribution function3)3) ProbabilityProbability pp of an individual data itemof an individual data item4)4) Information of the data itemInformation of the data item
Info=(pInfo=(p log(plog(p) + (1) + (1--p)log(1p)log(1--p))logp (12)())log 12)5)5) InformativenessInformativeness of a data sampleof a data sample
100 x100 x MeM an(Infoean(Info) ()) ()3232
32
3333
EVALUATIONEVALUATION OF PRECISIONOF PRECISION
Weak variabilityWeak variability PrecPrec = 100 x (1= 100 x (1 ndashndash STDAVG) ()STDAVG) ()
((STDSTD hellip standard deviationhellip standard deviation AVGAVG helliphellip mean)mean)
Strong uncertaintyStrong uncertaintyPrecPrec = 100 x (1= 100 x (1 -- Mean(GWMean(GW) ) ()) ) ()
((GWGW helliphellip gnosticgnostic weight of data entropyweight of data entropy change caused by the uncertainty)change caused by the uncertainty)
0 lt= GW lt= 10 lt= GW lt= 1
33
SUMMARY COMPARISONSUMMARY COMPARISON
AverigeAverige of 14 evaluationsof 14 evaluations
MethodMethod NonNon--homdatahomdata HomogHomog data data
BentosBentos 609 609 627 627
DreissenaDreissena 645 645 675 675
PlantsPlants 642 642 689 689
SPMDSPMD 675 675 695 695
3434
34
3535
35
3535
RATINGRATIN OF METHODSG OF METHODS
FeatureFeatureExtconsistencyExtconsistencyIntconsistencyIntconsistencyInformativenessInformativenessPrecissionPrecissionHomogeneityHomogeneityRelsensitivityRelsensitivityMean ratingMean rating
BentosBentos DreissDreiss PlantsPlants SPMDSPMD44 33 11 2244 33 22 1111 33 44 2233 11 44 2222 44 33 1133 11 22 11
2828 2525 2727 15153636
36
ndash
ndash
ndash
ConclusionsConclusions
Passive sampling like SPMDs shown the bestPassive sampling like SPMDs shown the best results if there are no legal requirements for biotaresults if there are no legal requirements for biota biotic organisms can be replacedbiotic organisms can be replaced
Do not forget to analyze data preciselyDo not forget to analyze data precisely independently before your interpretationindependently before your interpretationndash Do not rely ONLY on functionality of any processingDo not rely ONLY on functionality of any processing
packagepackagendash Statistical approach has some limitations on small dataStatistical approach has some limitations on small data
sets (majority of monitoring studies)sets (majority of monitoring studies)
Any headache from analytical tools can beAny headache from analytical tools can be eliminated by expeeliminated by exp rienceeriencendash Try itTry it
3737
37
Further intentionsFurther intentions
Finalization of Gnostic analytical toolFinalization of Gnostic analytical tool with GUI (Swith GUI (S--Plus)Plus)
Extension to other platforms byExtension to other platforms by interfaceinterface
Linking to databases (LIMS GIS hellip)Linking to databases (LIMS GIS hellip) Training and disseminationTraining and dissemination Projects solutions and participationsProjects solutions and participations
ndashndash Join us 2Join us 2--FUN projectFUN project www2www2--funorgfunorg
3838
38
3939
hellip thank you for your attention
PCDDF
39

1111
Comparison of two approachesComparison of two approaches
1111
11
GNOSTICGNOSTICDISTRIBUTION FUNCTIONSDISTRIBUTION FUNCTIONS
No a priori modelNo a priori model (e( verything from data)everything from data)
MaximumMaximum informationinformation
RobustnessRobustness in estimation of probabilityin estimation of probability
quantilesquantiles scale and location parameters scale and location parameters
bounds of data support and membershipbounds of data support and membership
intervalinterval
frac34frac34 RobustRobust correlationscorrelations 1212
12
1313
GNOSTICGNOSTICDISTRIBUTION FUNCTIONS IIDISTRIBUTION FUNCTIONS II
DataData homogeneityhomogeneity teststests
MarginalMarginal cluster analysiscluster analysis
CrossCross--sectionsection filteringfiltering
Applicability toApplicability to censoredcensored datadata
Applicability toApplicability to heteroscedasticheteroscedastic datadata
13
QUALITY OF METHODSQUALITY OF METHODSTO BE COMPAREDTO BE COMPARED
Relative sensitivity (Relative sensitivity (tresholdtreshold range) range)Homogeneity of resultsHomogeneity of resultsConsistency of resultsConsistency of results Internal (of methodrsquos own results)Internal (of methodrsquos own results) External (mutual consistency of methExternal (mutual consistency of met ods)hods)
InformativInformati enessveness of resultsof resultsPrecissionPrecission
1414
14
RELATIVE SENSITIVITYRELATIVE SENSITIVITY
Methodrsquos relative sensitivity dependsMethodrsquos relative sensitivity dependsOn the pollutantrsquos concentrationOn the pollutantrsquos concentrationOn the methodrsquos measuring domainOn the methodrsquos measuring domain
RS = (1RS = (1 ndashndash NCN) x 100 ()NCN) x 100 ()NCNC hellip number of data in the intervhellip number of data in th ale interval[sensitivity threshold[sensitivity threshold max(rangemax(range)])]
NN hellip all data of the sahellip all data of the s mpleample1515
15
HOMOGENIZATIONHOMOGENIZATIONTO BE OR NOT TO BETO BE OR NOT TO BE
Homogeneous dataHomogeneous datathe samethe same originorigin of true valuesof true valuesthe same nature of thethe same nature of the uncertaintyuncertainty
To homogenizeTo homogenize ProsPros
More certain main clusterMore certain main cluster ConsCons
Possible loss of informationPossible loss of informationRule homogenize and verifyRule homogenize and verify
1616
16
MEASURABILITYMEASURABILITY
Homogenization hellip elimination of outliersHomogenization hellip elimination of outliersMeasMeas = (1= (1 ndashndash (NL+NU)N) x 100 ()(NL+NU)N) x 100 ()NL hellipNL hellip number of lower outliersnumber of lower outliersNU hellipNU hellip number of upper outliersnumber of upper outliersN hellipN hellip number of the samplersquos datanumber of the samplersquos dataNN ndashndash NLNL ndashndash NU hellipNU hellip data of the main clusterdata of the main cluster
1717
17
1818
METHODS OF ANALYSISMETHODS OF ANALYSIS
GEOMETRYGEOMETRY(angles between vectors)(angles between vectors)
STATISTICSSTATISTICS(robust correlations)(robust correlations)
MATHEMATICAL GNOSTICS MATHEMATICAL GNOSTICS (robust correlations robust(robust correlations robustdistribution functions information distribution functions information and entropy of small data samples)and entropy of small data samples)
Dec Log (concentration) ugsampling system
1818
18
1919
Dec Log (concentration) ugsampling system
1919
19
2020
Co
nce
ntr
atio
n u
gs
am
plin
g s
yste
m
2020
20
DIFFERENCES IN METHODSDIFFERENCES IN METHODS
Different accumulation of pollutantsDifferent accumulation of pollutantsbullbull different mean concentrationsdifferent mean concentrationsbullbull differentdifferent variabilitiesvariabilities
Different relations between meansDifferent relations between means Rare exception agreement in PCB118Rare exception agreement in PCB118 Impact of outliers to SPMDImpact of outliers to SPMD NONO
2121
21
METHODrsquoS CONSISTENCYMETHODrsquoS CONSISTENCY
Methods areMethods are consistentconsistent when they givewhen they givesimilar resultssimilar results
Measuring of similarityMeasuring of similarityCorrelations or (more generally)Correlations or (more generally)
mean angles between vectors of resultsmean angles between vectors of resultsSIMccSIMcc = 100 x= 100 x correlcoefficientcorrelcoefficient ()()SIMqaSIMqa = 100 x (1= 100 x (1 ndashndash |Ang|180) ()|Ang|180) ()
2222
22
GNOSTIC CORRELATIONSGNOSTIC CORRELATIONS
Data error inData error in gnosticgnostic irrelevanceirrelevanceirir = (2p= (2p -- 1)21)2
pp hellip probability of the data itemhellip probability of the data itemCorrelation coefficient of two samplesCorrelation coefficient of two samples
Gcc(MNGcc(MN) =) = ccir(m)ir(nccir(m)ir(n))(m in M n in N) cc (m in M n in N) cc statiststatist corcoefcorcoef
RobustnessRobustness-- 1 lt=1 lt= irir lt= + 1lt= + 1 2323
23
SIGNIFICANCESIGNIFICANCE OF CORRELATIONSOF CORRELATIONS
Problems false statistical modelProblems false statistical model (normality finite data support)(normality finite data support) small data samplessmall data samples unrobustnessunrobustness
Gnostic estimating of significanceGnostic estimating of significancefrac34frac34 fast auxiliaryfast auxiliary usinusi g Spearmanrsquosng Spearmanrsquos
robust estimate of significancerobust estimate of significancefrac34frac34 carefullycarefully distribution function ofdistribution function of
correlation coefficientscorrelation coefficients2424
24
2525
25
2525
QUANTILE VECTORSQUANTILE VECTORS
Make samplersquos distribution functionMake samplersquos distribution function Set a series of probabilitiesSet a series of probabilities p1hellipp1hellippNpN FindFind quantilesquantiles q1hellipq1hellipqNqN so thatso that PqkPqk==pkpk TakeTake q1hellipq1hellipqNqN as aas a quantilequantile vectorvectorAdvantagesAdvantages
Robustness making use of censored dataRobustness making use of censored dataindependence of data amount and ofindependence of data amount and of mean data value filtering effectmean data value filtering effect
2626
26
2727
27
2727
2828
28
2828
2929
Co
nce
ntr
atio
n u
gs
am
plin
g s
yste
m
2929
29
EXTERNAL CONSISTENCYEXTERNAL CONSISTENCY
ApproachesApproaches CorrelationsCorrelations Angles betwAngl een MDes between MD--vectors of meansvectors of means Angles betweenAngles between quantilequantile vectovect rsro s Conjunction of typical data intervalsConjunction of typical data intervals Conjunction of data supportsConjunction of data supports
3030
30
INTERVAL ANALYSISINTERVAL ANALYSIS
1)1) Distribution functionsDistribution functions2)2) Interval analysisInterval analysis
a)a) Data supportData support (LB UB)(LB UB)b)b) Membership intervalMembership interval (LSB USB)(LSB USB)c)c) Interval of typical dataInterval of typical data (ZL UL)(ZL UL)d)d) Tolerance intervalTolerance interval (Z0L Z0U)(Z0L Z0U)
3)3) OverlappingOverlapping 100xconjunction(I1 I2)union(I1I2) ()100xconjunction(I1 I2)union(I1I2) ()
3131
31
INFORMATIVENESSINFORMATIVENESS
1)1) Data sampleData sample2)2) Distribution functionDistribution function3)3) ProbabilityProbability pp of an individual data itemof an individual data item4)4) Information of the data itemInformation of the data item
Info=(pInfo=(p log(plog(p) + (1) + (1--p)log(1p)log(1--p))logp (12)())log 12)5)5) InformativenessInformativeness of a data sampleof a data sample
100 x100 x MeM an(Infoean(Info) ()) ()3232
32
3333
EVALUATIONEVALUATION OF PRECISIONOF PRECISION
Weak variabilityWeak variability PrecPrec = 100 x (1= 100 x (1 ndashndash STDAVG) ()STDAVG) ()
((STDSTD hellip standard deviationhellip standard deviation AVGAVG helliphellip mean)mean)
Strong uncertaintyStrong uncertaintyPrecPrec = 100 x (1= 100 x (1 -- Mean(GWMean(GW) ) ()) ) ()
((GWGW helliphellip gnosticgnostic weight of data entropyweight of data entropy change caused by the uncertainty)change caused by the uncertainty)
0 lt= GW lt= 10 lt= GW lt= 1
33
SUMMARY COMPARISONSUMMARY COMPARISON
AverigeAverige of 14 evaluationsof 14 evaluations
MethodMethod NonNon--homdatahomdata HomogHomog data data
BentosBentos 609 609 627 627
DreissenaDreissena 645 645 675 675
PlantsPlants 642 642 689 689
SPMDSPMD 675 675 695 695
3434
34
3535
35
3535
RATINGRATIN OF METHODSG OF METHODS
FeatureFeatureExtconsistencyExtconsistencyIntconsistencyIntconsistencyInformativenessInformativenessPrecissionPrecissionHomogeneityHomogeneityRelsensitivityRelsensitivityMean ratingMean rating
BentosBentos DreissDreiss PlantsPlants SPMDSPMD44 33 11 2244 33 22 1111 33 44 2233 11 44 2222 44 33 1133 11 22 11
2828 2525 2727 15153636
36
ndash
ndash
ndash
ConclusionsConclusions
Passive sampling like SPMDs shown the bestPassive sampling like SPMDs shown the best results if there are no legal requirements for biotaresults if there are no legal requirements for biota biotic organisms can be replacedbiotic organisms can be replaced
Do not forget to analyze data preciselyDo not forget to analyze data precisely independently before your interpretationindependently before your interpretationndash Do not rely ONLY on functionality of any processingDo not rely ONLY on functionality of any processing
packagepackagendash Statistical approach has some limitations on small dataStatistical approach has some limitations on small data
sets (majority of monitoring studies)sets (majority of monitoring studies)
Any headache from analytical tools can beAny headache from analytical tools can be eliminated by expeeliminated by exp rienceeriencendash Try itTry it
3737
37
Further intentionsFurther intentions
Finalization of Gnostic analytical toolFinalization of Gnostic analytical tool with GUI (Swith GUI (S--Plus)Plus)
Extension to other platforms byExtension to other platforms by interfaceinterface
Linking to databases (LIMS GIS hellip)Linking to databases (LIMS GIS hellip) Training and disseminationTraining and dissemination Projects solutions and participationsProjects solutions and participations
ndashndash Join us 2Join us 2--FUN projectFUN project www2www2--funorgfunorg
3838
38
3939
hellip thank you for your attention
PCDDF
39
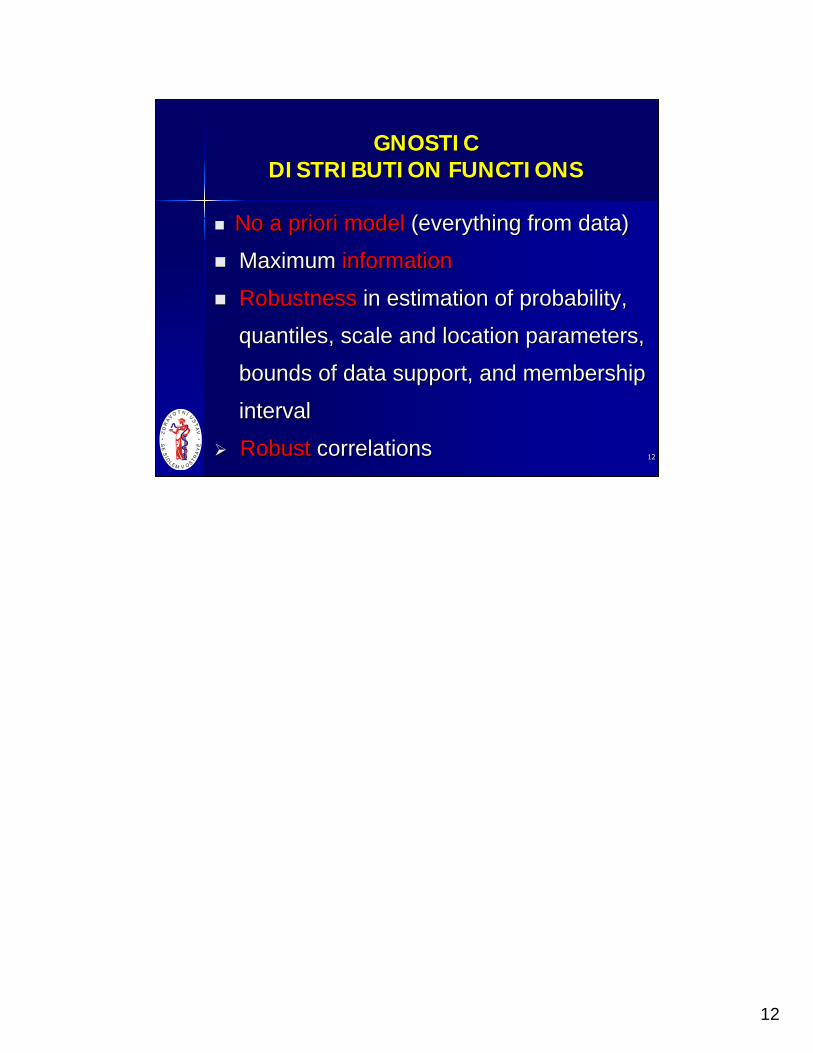

1818
METHODS OF ANALYSISMETHODS OF ANALYSIS
GEOMETRYGEOMETRY(angles between vectors)(angles between vectors)
STATISTICSSTATISTICS(robust correlations)(robust correlations)
MATHEMATICAL GNOSTICS MATHEMATICAL GNOSTICS (robust correlations robust(robust correlations robustdistribution functions information distribution functions information and entropy of small data samples)and entropy of small data samples)
Dec Log (concentration) ugsampling system
1818
18
1919
Dec Log (concentration) ugsampling system
1919
19
2020
Co
nce
ntr
atio
n u
gs
am
plin
g s
yste
m
2020
20
DIFFERENCES IN METHODSDIFFERENCES IN METHODS
Different accumulation of pollutantsDifferent accumulation of pollutantsbullbull different mean concentrationsdifferent mean concentrationsbullbull differentdifferent variabilitiesvariabilities
Different relations between meansDifferent relations between means Rare exception agreement in PCB118Rare exception agreement in PCB118 Impact of outliers to SPMDImpact of outliers to SPMD NONO
2121
21
METHODrsquoS CONSISTENCYMETHODrsquoS CONSISTENCY
Methods areMethods are consistentconsistent when they givewhen they givesimilar resultssimilar results
Measuring of similarityMeasuring of similarityCorrelations or (more generally)Correlations or (more generally)
mean angles between vectors of resultsmean angles between vectors of resultsSIMccSIMcc = 100 x= 100 x correlcoefficientcorrelcoefficient ()()SIMqaSIMqa = 100 x (1= 100 x (1 ndashndash |Ang|180) ()|Ang|180) ()
2222
22
GNOSTIC CORRELATIONSGNOSTIC CORRELATIONS
Data error inData error in gnosticgnostic irrelevanceirrelevanceirir = (2p= (2p -- 1)21)2
pp hellip probability of the data itemhellip probability of the data itemCorrelation coefficient of two samplesCorrelation coefficient of two samples
Gcc(MNGcc(MN) =) = ccir(m)ir(nccir(m)ir(n))(m in M n in N) cc (m in M n in N) cc statiststatist corcoefcorcoef
RobustnessRobustness-- 1 lt=1 lt= irir lt= + 1lt= + 1 2323
23
SIGNIFICANCESIGNIFICANCE OF CORRELATIONSOF CORRELATIONS
Problems false statistical modelProblems false statistical model (normality finite data support)(normality finite data support) small data samplessmall data samples unrobustnessunrobustness
Gnostic estimating of significanceGnostic estimating of significancefrac34frac34 fast auxiliaryfast auxiliary usinusi g Spearmanrsquosng Spearmanrsquos
robust estimate of significancerobust estimate of significancefrac34frac34 carefullycarefully distribution function ofdistribution function of
correlation coefficientscorrelation coefficients2424
24
2525
25
2525
QUANTILE VECTORSQUANTILE VECTORS
Make samplersquos distribution functionMake samplersquos distribution function Set a series of probabilitiesSet a series of probabilities p1hellipp1hellippNpN FindFind quantilesquantiles q1hellipq1hellipqNqN so thatso that PqkPqk==pkpk TakeTake q1hellipq1hellipqNqN as aas a quantilequantile vectorvectorAdvantagesAdvantages
Robustness making use of censored dataRobustness making use of censored dataindependence of data amount and ofindependence of data amount and of mean data value filtering effectmean data value filtering effect
2626
26
2727
27
2727
2828
28
2828
2929
Co
nce
ntr
atio
n u
gs
am
plin
g s
yste
m
2929
29
EXTERNAL CONSISTENCYEXTERNAL CONSISTENCY
ApproachesApproaches CorrelationsCorrelations Angles betwAngl een MDes between MD--vectors of meansvectors of means Angles betweenAngles between quantilequantile vectovect rsro s Conjunction of typical data intervalsConjunction of typical data intervals Conjunction of data supportsConjunction of data supports
3030
30
INTERVAL ANALYSISINTERVAL ANALYSIS
1)1) Distribution functionsDistribution functions2)2) Interval analysisInterval analysis
a)a) Data supportData support (LB UB)(LB UB)b)b) Membership intervalMembership interval (LSB USB)(LSB USB)c)c) Interval of typical dataInterval of typical data (ZL UL)(ZL UL)d)d) Tolerance intervalTolerance interval (Z0L Z0U)(Z0L Z0U)
3)3) OverlappingOverlapping 100xconjunction(I1 I2)union(I1I2) ()100xconjunction(I1 I2)union(I1I2) ()
3131
31
INFORMATIVENESSINFORMATIVENESS
1)1) Data sampleData sample2)2) Distribution functionDistribution function3)3) ProbabilityProbability pp of an individual data itemof an individual data item4)4) Information of the data itemInformation of the data item
Info=(pInfo=(p log(plog(p) + (1) + (1--p)log(1p)log(1--p))logp (12)())log 12)5)5) InformativenessInformativeness of a data sampleof a data sample
100 x100 x MeM an(Infoean(Info) ()) ()3232
32
3333
EVALUATIONEVALUATION OF PRECISIONOF PRECISION
Weak variabilityWeak variability PrecPrec = 100 x (1= 100 x (1 ndashndash STDAVG) ()STDAVG) ()
((STDSTD hellip standard deviationhellip standard deviation AVGAVG helliphellip mean)mean)
Strong uncertaintyStrong uncertaintyPrecPrec = 100 x (1= 100 x (1 -- Mean(GWMean(GW) ) ()) ) ()
((GWGW helliphellip gnosticgnostic weight of data entropyweight of data entropy change caused by the uncertainty)change caused by the uncertainty)
0 lt= GW lt= 10 lt= GW lt= 1
33
SUMMARY COMPARISONSUMMARY COMPARISON
AverigeAverige of 14 evaluationsof 14 evaluations
MethodMethod NonNon--homdatahomdata HomogHomog data data
BentosBentos 609 609 627 627
DreissenaDreissena 645 645 675 675
PlantsPlants 642 642 689 689
SPMDSPMD 675 675 695 695
3434
34
3535
35
3535
RATINGRATIN OF METHODSG OF METHODS
FeatureFeatureExtconsistencyExtconsistencyIntconsistencyIntconsistencyInformativenessInformativenessPrecissionPrecissionHomogeneityHomogeneityRelsensitivityRelsensitivityMean ratingMean rating
BentosBentos DreissDreiss PlantsPlants SPMDSPMD44 33 11 2244 33 22 1111 33 44 2233 11 44 2222 44 33 1133 11 22 11
2828 2525 2727 15153636
36
ndash
ndash
ndash
ConclusionsConclusions
Passive sampling like SPMDs shown the bestPassive sampling like SPMDs shown the best results if there are no legal requirements for biotaresults if there are no legal requirements for biota biotic organisms can be replacedbiotic organisms can be replaced
Do not forget to analyze data preciselyDo not forget to analyze data precisely independently before your interpretationindependently before your interpretationndash Do not rely ONLY on functionality of any processingDo not rely ONLY on functionality of any processing
packagepackagendash Statistical approach has some limitations on small dataStatistical approach has some limitations on small data
sets (majority of monitoring studies)sets (majority of monitoring studies)
Any headache from analytical tools can beAny headache from analytical tools can be eliminated by expeeliminated by exp rienceeriencendash Try itTry it
3737
37
Further intentionsFurther intentions
Finalization of Gnostic analytical toolFinalization of Gnostic analytical tool with GUI (Swith GUI (S--Plus)Plus)
Extension to other platforms byExtension to other platforms by interfaceinterface
Linking to databases (LIMS GIS hellip)Linking to databases (LIMS GIS hellip) Training and disseminationTraining and dissemination Projects solutions and participationsProjects solutions and participations
ndashndash Join us 2Join us 2--FUN projectFUN project www2www2--funorgfunorg
3838
38
3939
hellip thank you for your attention
PCDDF
39

1919
Dec Log (concentration) ugsampling system
1919
19
2020
Co
nce
ntr
atio
n u
gs
am
plin
g s
yste
m
2020
20
DIFFERENCES IN METHODSDIFFERENCES IN METHODS
Different accumulation of pollutantsDifferent accumulation of pollutantsbullbull different mean concentrationsdifferent mean concentrationsbullbull differentdifferent variabilitiesvariabilities
Different relations between meansDifferent relations between means Rare exception agreement in PCB118Rare exception agreement in PCB118 Impact of outliers to SPMDImpact of outliers to SPMD NONO
2121
21
METHODrsquoS CONSISTENCYMETHODrsquoS CONSISTENCY
Methods areMethods are consistentconsistent when they givewhen they givesimilar resultssimilar results
Measuring of similarityMeasuring of similarityCorrelations or (more generally)Correlations or (more generally)
mean angles between vectors of resultsmean angles between vectors of resultsSIMccSIMcc = 100 x= 100 x correlcoefficientcorrelcoefficient ()()SIMqaSIMqa = 100 x (1= 100 x (1 ndashndash |Ang|180) ()|Ang|180) ()
2222
22
GNOSTIC CORRELATIONSGNOSTIC CORRELATIONS
Data error inData error in gnosticgnostic irrelevanceirrelevanceirir = (2p= (2p -- 1)21)2
pp hellip probability of the data itemhellip probability of the data itemCorrelation coefficient of two samplesCorrelation coefficient of two samples
Gcc(MNGcc(MN) =) = ccir(m)ir(nccir(m)ir(n))(m in M n in N) cc (m in M n in N) cc statiststatist corcoefcorcoef
RobustnessRobustness-- 1 lt=1 lt= irir lt= + 1lt= + 1 2323
23
SIGNIFICANCESIGNIFICANCE OF CORRELATIONSOF CORRELATIONS
Problems false statistical modelProblems false statistical model (normality finite data support)(normality finite data support) small data samplessmall data samples unrobustnessunrobustness
Gnostic estimating of significanceGnostic estimating of significancefrac34frac34 fast auxiliaryfast auxiliary usinusi g Spearmanrsquosng Spearmanrsquos
robust estimate of significancerobust estimate of significancefrac34frac34 carefullycarefully distribution function ofdistribution function of
correlation coefficientscorrelation coefficients2424
24
2525
25
2525
QUANTILE VECTORSQUANTILE VECTORS
Make samplersquos distribution functionMake samplersquos distribution function Set a series of probabilitiesSet a series of probabilities p1hellipp1hellippNpN FindFind quantilesquantiles q1hellipq1hellipqNqN so thatso that PqkPqk==pkpk TakeTake q1hellipq1hellipqNqN as aas a quantilequantile vectorvectorAdvantagesAdvantages
Robustness making use of censored dataRobustness making use of censored dataindependence of data amount and ofindependence of data amount and of mean data value filtering effectmean data value filtering effect
2626
26
2727
27
2727
2828
28
2828
2929
Co
nce
ntr
atio
n u
gs
am
plin
g s
yste
m
2929
29
EXTERNAL CONSISTENCYEXTERNAL CONSISTENCY
ApproachesApproaches CorrelationsCorrelations Angles betwAngl een MDes between MD--vectors of meansvectors of means Angles betweenAngles between quantilequantile vectovect rsro s Conjunction of typical data intervalsConjunction of typical data intervals Conjunction of data supportsConjunction of data supports
3030
30
INTERVAL ANALYSISINTERVAL ANALYSIS
1)1) Distribution functionsDistribution functions2)2) Interval analysisInterval analysis
a)a) Data supportData support (LB UB)(LB UB)b)b) Membership intervalMembership interval (LSB USB)(LSB USB)c)c) Interval of typical dataInterval of typical data (ZL UL)(ZL UL)d)d) Tolerance intervalTolerance interval (Z0L Z0U)(Z0L Z0U)
3)3) OverlappingOverlapping 100xconjunction(I1 I2)union(I1I2) ()100xconjunction(I1 I2)union(I1I2) ()
3131
31
INFORMATIVENESSINFORMATIVENESS
1)1) Data sampleData sample2)2) Distribution functionDistribution function3)3) ProbabilityProbability pp of an individual data itemof an individual data item4)4) Information of the data itemInformation of the data item
Info=(pInfo=(p log(plog(p) + (1) + (1--p)log(1p)log(1--p))logp (12)())log 12)5)5) InformativenessInformativeness of a data sampleof a data sample
100 x100 x MeM an(Infoean(Info) ()) ()3232
32
3333
EVALUATIONEVALUATION OF PRECISIONOF PRECISION
Weak variabilityWeak variability PrecPrec = 100 x (1= 100 x (1 ndashndash STDAVG) ()STDAVG) ()
((STDSTD hellip standard deviationhellip standard deviation AVGAVG helliphellip mean)mean)
Strong uncertaintyStrong uncertaintyPrecPrec = 100 x (1= 100 x (1 -- Mean(GWMean(GW) ) ()) ) ()
((GWGW helliphellip gnosticgnostic weight of data entropyweight of data entropy change caused by the uncertainty)change caused by the uncertainty)
0 lt= GW lt= 10 lt= GW lt= 1
33
SUMMARY COMPARISONSUMMARY COMPARISON
AverigeAverige of 14 evaluationsof 14 evaluations
MethodMethod NonNon--homdatahomdata HomogHomog data data
BentosBentos 609 609 627 627
DreissenaDreissena 645 645 675 675
PlantsPlants 642 642 689 689
SPMDSPMD 675 675 695 695
3434
34
3535
35
3535
RATINGRATIN OF METHODSG OF METHODS
FeatureFeatureExtconsistencyExtconsistencyIntconsistencyIntconsistencyInformativenessInformativenessPrecissionPrecissionHomogeneityHomogeneityRelsensitivityRelsensitivityMean ratingMean rating
BentosBentos DreissDreiss PlantsPlants SPMDSPMD44 33 11 2244 33 22 1111 33 44 2233 11 44 2222 44 33 1133 11 22 11
2828 2525 2727 15153636
36
ndash
ndash
ndash
ConclusionsConclusions
Passive sampling like SPMDs shown the bestPassive sampling like SPMDs shown the best results if there are no legal requirements for biotaresults if there are no legal requirements for biota biotic organisms can be replacedbiotic organisms can be replaced
Do not forget to analyze data preciselyDo not forget to analyze data precisely independently before your interpretationindependently before your interpretationndash Do not rely ONLY on functionality of any processingDo not rely ONLY on functionality of any processing
packagepackagendash Statistical approach has some limitations on small dataStatistical approach has some limitations on small data
sets (majority of monitoring studies)sets (majority of monitoring studies)
Any headache from analytical tools can beAny headache from analytical tools can be eliminated by expeeliminated by exp rienceeriencendash Try itTry it
3737
37
Further intentionsFurther intentions
Finalization of Gnostic analytical toolFinalization of Gnostic analytical tool with GUI (Swith GUI (S--Plus)Plus)
Extension to other platforms byExtension to other platforms by interfaceinterface
Linking to databases (LIMS GIS hellip)Linking to databases (LIMS GIS hellip) Training and disseminationTraining and dissemination Projects solutions and participationsProjects solutions and participations
ndashndash Join us 2Join us 2--FUN projectFUN project www2www2--funorgfunorg
3838
38
3939
hellip thank you for your attention
PCDDF
39

2020
Co
nce
ntr
atio
n u
gs
am
plin
g s
yste
m
2020
20
DIFFERENCES IN METHODSDIFFERENCES IN METHODS
Different accumulation of pollutantsDifferent accumulation of pollutantsbullbull different mean concentrationsdifferent mean concentrationsbullbull differentdifferent variabilitiesvariabilities
Different relations between meansDifferent relations between means Rare exception agreement in PCB118Rare exception agreement in PCB118 Impact of outliers to SPMDImpact of outliers to SPMD NONO
2121
21
METHODrsquoS CONSISTENCYMETHODrsquoS CONSISTENCY
Methods areMethods are consistentconsistent when they givewhen they givesimilar resultssimilar results
Measuring of similarityMeasuring of similarityCorrelations or (more generally)Correlations or (more generally)
mean angles between vectors of resultsmean angles between vectors of resultsSIMccSIMcc = 100 x= 100 x correlcoefficientcorrelcoefficient ()()SIMqaSIMqa = 100 x (1= 100 x (1 ndashndash |Ang|180) ()|Ang|180) ()
2222
22
GNOSTIC CORRELATIONSGNOSTIC CORRELATIONS
Data error inData error in gnosticgnostic irrelevanceirrelevanceirir = (2p= (2p -- 1)21)2
pp hellip probability of the data itemhellip probability of the data itemCorrelation coefficient of two samplesCorrelation coefficient of two samples
Gcc(MNGcc(MN) =) = ccir(m)ir(nccir(m)ir(n))(m in M n in N) cc (m in M n in N) cc statiststatist corcoefcorcoef
RobustnessRobustness-- 1 lt=1 lt= irir lt= + 1lt= + 1 2323
23
SIGNIFICANCESIGNIFICANCE OF CORRELATIONSOF CORRELATIONS
Problems false statistical modelProblems false statistical model (normality finite data support)(normality finite data support) small data samplessmall data samples unrobustnessunrobustness
Gnostic estimating of significanceGnostic estimating of significancefrac34frac34 fast auxiliaryfast auxiliary usinusi g Spearmanrsquosng Spearmanrsquos
robust estimate of significancerobust estimate of significancefrac34frac34 carefullycarefully distribution function ofdistribution function of
correlation coefficientscorrelation coefficients2424
24
2525
25
2525
QUANTILE VECTORSQUANTILE VECTORS
Make samplersquos distribution functionMake samplersquos distribution function Set a series of probabilitiesSet a series of probabilities p1hellipp1hellippNpN FindFind quantilesquantiles q1hellipq1hellipqNqN so thatso that PqkPqk==pkpk TakeTake q1hellipq1hellipqNqN as aas a quantilequantile vectorvectorAdvantagesAdvantages
Robustness making use of censored dataRobustness making use of censored dataindependence of data amount and ofindependence of data amount and of mean data value filtering effectmean data value filtering effect
2626
26
2727
27
2727
2828
28
2828
2929
Co
nce
ntr
atio
n u
gs
am
plin
g s
yste
m
2929
29
EXTERNAL CONSISTENCYEXTERNAL CONSISTENCY
ApproachesApproaches CorrelationsCorrelations Angles betwAngl een MDes between MD--vectors of meansvectors of means Angles betweenAngles between quantilequantile vectovect rsro s Conjunction of typical data intervalsConjunction of typical data intervals Conjunction of data supportsConjunction of data supports
3030
30
INTERVAL ANALYSISINTERVAL ANALYSIS
1)1) Distribution functionsDistribution functions2)2) Interval analysisInterval analysis
a)a) Data supportData support (LB UB)(LB UB)b)b) Membership intervalMembership interval (LSB USB)(LSB USB)c)c) Interval of typical dataInterval of typical data (ZL UL)(ZL UL)d)d) Tolerance intervalTolerance interval (Z0L Z0U)(Z0L Z0U)
3)3) OverlappingOverlapping 100xconjunction(I1 I2)union(I1I2) ()100xconjunction(I1 I2)union(I1I2) ()
3131
31
INFORMATIVENESSINFORMATIVENESS
1)1) Data sampleData sample2)2) Distribution functionDistribution function3)3) ProbabilityProbability pp of an individual data itemof an individual data item4)4) Information of the data itemInformation of the data item
Info=(pInfo=(p log(plog(p) + (1) + (1--p)log(1p)log(1--p))logp (12)())log 12)5)5) InformativenessInformativeness of a data sampleof a data sample
100 x100 x MeM an(Infoean(Info) ()) ()3232
32
3333
EVALUATIONEVALUATION OF PRECISIONOF PRECISION
Weak variabilityWeak variability PrecPrec = 100 x (1= 100 x (1 ndashndash STDAVG) ()STDAVG) ()
((STDSTD hellip standard deviationhellip standard deviation AVGAVG helliphellip mean)mean)
Strong uncertaintyStrong uncertaintyPrecPrec = 100 x (1= 100 x (1 -- Mean(GWMean(GW) ) ()) ) ()
((GWGW helliphellip gnosticgnostic weight of data entropyweight of data entropy change caused by the uncertainty)change caused by the uncertainty)
0 lt= GW lt= 10 lt= GW lt= 1
33
SUMMARY COMPARISONSUMMARY COMPARISON
AverigeAverige of 14 evaluationsof 14 evaluations
MethodMethod NonNon--homdatahomdata HomogHomog data data
BentosBentos 609 609 627 627
DreissenaDreissena 645 645 675 675
PlantsPlants 642 642 689 689
SPMDSPMD 675 675 695 695
3434
34
3535
35
3535
RATINGRATIN OF METHODSG OF METHODS
FeatureFeatureExtconsistencyExtconsistencyIntconsistencyIntconsistencyInformativenessInformativenessPrecissionPrecissionHomogeneityHomogeneityRelsensitivityRelsensitivityMean ratingMean rating
BentosBentos DreissDreiss PlantsPlants SPMDSPMD44 33 11 2244 33 22 1111 33 44 2233 11 44 2222 44 33 1133 11 22 11
2828 2525 2727 15153636
36
ndash
ndash
ndash
ConclusionsConclusions
Passive sampling like SPMDs shown the bestPassive sampling like SPMDs shown the best results if there are no legal requirements for biotaresults if there are no legal requirements for biota biotic organisms can be replacedbiotic organisms can be replaced
Do not forget to analyze data preciselyDo not forget to analyze data precisely independently before your interpretationindependently before your interpretationndash Do not rely ONLY on functionality of any processingDo not rely ONLY on functionality of any processing
packagepackagendash Statistical approach has some limitations on small dataStatistical approach has some limitations on small data
sets (majority of monitoring studies)sets (majority of monitoring studies)
Any headache from analytical tools can beAny headache from analytical tools can be eliminated by expeeliminated by exp rienceeriencendash Try itTry it
3737
37
Further intentionsFurther intentions
Finalization of Gnostic analytical toolFinalization of Gnostic analytical tool with GUI (Swith GUI (S--Plus)Plus)
Extension to other platforms byExtension to other platforms by interfaceinterface
Linking to databases (LIMS GIS hellip)Linking to databases (LIMS GIS hellip) Training and disseminationTraining and dissemination Projects solutions and participationsProjects solutions and participations
ndashndash Join us 2Join us 2--FUN projectFUN project www2www2--funorgfunorg
3838
38
3939
hellip thank you for your attention
PCDDF
39

2525
25
2525
QUANTILE VECTORSQUANTILE VECTORS
Make samplersquos distribution functionMake samplersquos distribution function Set a series of probabilitiesSet a series of probabilities p1hellipp1hellippNpN FindFind quantilesquantiles q1hellipq1hellipqNqN so thatso that PqkPqk==pkpk TakeTake q1hellipq1hellipqNqN as aas a quantilequantile vectorvectorAdvantagesAdvantages
Robustness making use of censored dataRobustness making use of censored dataindependence of data amount and ofindependence of data amount and of mean data value filtering effectmean data value filtering effect
2626
26
2727
27
2727
2828
28
2828
2929
Co
nce
ntr
atio
n u
gs
am
plin
g s
yste
m
2929
29
EXTERNAL CONSISTENCYEXTERNAL CONSISTENCY
ApproachesApproaches CorrelationsCorrelations Angles betwAngl een MDes between MD--vectors of meansvectors of means Angles betweenAngles between quantilequantile vectovect rsro s Conjunction of typical data intervalsConjunction of typical data intervals Conjunction of data supportsConjunction of data supports
3030
30
INTERVAL ANALYSISINTERVAL ANALYSIS
1)1) Distribution functionsDistribution functions2)2) Interval analysisInterval analysis
a)a) Data supportData support (LB UB)(LB UB)b)b) Membership intervalMembership interval (LSB USB)(LSB USB)c)c) Interval of typical dataInterval of typical data (ZL UL)(ZL UL)d)d) Tolerance intervalTolerance interval (Z0L Z0U)(Z0L Z0U)
3)3) OverlappingOverlapping 100xconjunction(I1 I2)union(I1I2) ()100xconjunction(I1 I2)union(I1I2) ()
3131
31
INFORMATIVENESSINFORMATIVENESS
1)1) Data sampleData sample2)2) Distribution functionDistribution function3)3) ProbabilityProbability pp of an individual data itemof an individual data item4)4) Information of the data itemInformation of the data item
Info=(pInfo=(p log(plog(p) + (1) + (1--p)log(1p)log(1--p))logp (12)())log 12)5)5) InformativenessInformativeness of a data sampleof a data sample
100 x100 x MeM an(Infoean(Info) ()) ()3232
32
3333
EVALUATIONEVALUATION OF PRECISIONOF PRECISION
Weak variabilityWeak variability PrecPrec = 100 x (1= 100 x (1 ndashndash STDAVG) ()STDAVG) ()
((STDSTD hellip standard deviationhellip standard deviation AVGAVG helliphellip mean)mean)
Strong uncertaintyStrong uncertaintyPrecPrec = 100 x (1= 100 x (1 -- Mean(GWMean(GW) ) ()) ) ()
((GWGW helliphellip gnosticgnostic weight of data entropyweight of data entropy change caused by the uncertainty)change caused by the uncertainty)
0 lt= GW lt= 10 lt= GW lt= 1
33
SUMMARY COMPARISONSUMMARY COMPARISON
AverigeAverige of 14 evaluationsof 14 evaluations
MethodMethod NonNon--homdatahomdata HomogHomog data data
BentosBentos 609 609 627 627
DreissenaDreissena 645 645 675 675
PlantsPlants 642 642 689 689
SPMDSPMD 675 675 695 695
3434
34
3535
35
3535
RATINGRATIN OF METHODSG OF METHODS
FeatureFeatureExtconsistencyExtconsistencyIntconsistencyIntconsistencyInformativenessInformativenessPrecissionPrecissionHomogeneityHomogeneityRelsensitivityRelsensitivityMean ratingMean rating
BentosBentos DreissDreiss PlantsPlants SPMDSPMD44 33 11 2244 33 22 1111 33 44 2233 11 44 2222 44 33 1133 11 22 11
2828 2525 2727 15153636
36
ndash
ndash
ndash
ConclusionsConclusions
Passive sampling like SPMDs shown the bestPassive sampling like SPMDs shown the best results if there are no legal requirements for biotaresults if there are no legal requirements for biota biotic organisms can be replacedbiotic organisms can be replaced
Do not forget to analyze data preciselyDo not forget to analyze data precisely independently before your interpretationindependently before your interpretationndash Do not rely ONLY on functionality of any processingDo not rely ONLY on functionality of any processing
packagepackagendash Statistical approach has some limitations on small dataStatistical approach has some limitations on small data
sets (majority of monitoring studies)sets (majority of monitoring studies)
Any headache from analytical tools can beAny headache from analytical tools can be eliminated by expeeliminated by exp rienceeriencendash Try itTry it
3737
37
Further intentionsFurther intentions
Finalization of Gnostic analytical toolFinalization of Gnostic analytical tool with GUI (Swith GUI (S--Plus)Plus)
Extension to other platforms byExtension to other platforms by interfaceinterface
Linking to databases (LIMS GIS hellip)Linking to databases (LIMS GIS hellip) Training and disseminationTraining and dissemination Projects solutions and participationsProjects solutions and participations
ndashndash Join us 2Join us 2--FUN projectFUN project www2www2--funorgfunorg
3838
38
3939
hellip thank you for your attention
PCDDF
39
2727
27
2727
2828
28
2828
2929
Co
nce
ntr
atio
n u
gs
am
plin
g s
yste
m
2929
29
EXTERNAL CONSISTENCYEXTERNAL CONSISTENCY
ApproachesApproaches CorrelationsCorrelations Angles betwAngl een MDes between MD--vectors of meansvectors of means Angles betweenAngles between quantilequantile vectovect rsro s Conjunction of typical data intervalsConjunction of typical data intervals Conjunction of data supportsConjunction of data supports
3030
30
INTERVAL ANALYSISINTERVAL ANALYSIS
1)1) Distribution functionsDistribution functions2)2) Interval analysisInterval analysis
a)a) Data supportData support (LB UB)(LB UB)b)b) Membership intervalMembership interval (LSB USB)(LSB USB)c)c) Interval of typical dataInterval of typical data (ZL UL)(ZL UL)d)d) Tolerance intervalTolerance interval (Z0L Z0U)(Z0L Z0U)
3)3) OverlappingOverlapping 100xconjunction(I1 I2)union(I1I2) ()100xconjunction(I1 I2)union(I1I2) ()
3131
31
INFORMATIVENESSINFORMATIVENESS
1)1) Data sampleData sample2)2) Distribution functionDistribution function3)3) ProbabilityProbability pp of an individual data itemof an individual data item4)4) Information of the data itemInformation of the data item
Info=(pInfo=(p log(plog(p) + (1) + (1--p)log(1p)log(1--p))logp (12)())log 12)5)5) InformativenessInformativeness of a data sampleof a data sample
100 x100 x MeM an(Infoean(Info) ()) ()3232
32
3333
EVALUATIONEVALUATION OF PRECISIONOF PRECISION
Weak variabilityWeak variability PrecPrec = 100 x (1= 100 x (1 ndashndash STDAVG) ()STDAVG) ()
((STDSTD hellip standard deviationhellip standard deviation AVGAVG helliphellip mean)mean)
Strong uncertaintyStrong uncertaintyPrecPrec = 100 x (1= 100 x (1 -- Mean(GWMean(GW) ) ()) ) ()
((GWGW helliphellip gnosticgnostic weight of data entropyweight of data entropy change caused by the uncertainty)change caused by the uncertainty)
0 lt= GW lt= 10 lt= GW lt= 1
33
SUMMARY COMPARISONSUMMARY COMPARISON
AverigeAverige of 14 evaluationsof 14 evaluations
MethodMethod NonNon--homdatahomdata HomogHomog data data
BentosBentos 609 609 627 627
DreissenaDreissena 645 645 675 675
PlantsPlants 642 642 689 689
SPMDSPMD 675 675 695 695
3434
34
3535
35
3535
RATINGRATIN OF METHODSG OF METHODS
FeatureFeatureExtconsistencyExtconsistencyIntconsistencyIntconsistencyInformativenessInformativenessPrecissionPrecissionHomogeneityHomogeneityRelsensitivityRelsensitivityMean ratingMean rating
BentosBentos DreissDreiss PlantsPlants SPMDSPMD44 33 11 2244 33 22 1111 33 44 2233 11 44 2222 44 33 1133 11 22 11
2828 2525 2727 15153636
36
ndash
ndash
ndash
ConclusionsConclusions
Passive sampling like SPMDs shown the bestPassive sampling like SPMDs shown the best results if there are no legal requirements for biotaresults if there are no legal requirements for biota biotic organisms can be replacedbiotic organisms can be replaced
Do not forget to analyze data preciselyDo not forget to analyze data precisely independently before your interpretationindependently before your interpretationndash Do not rely ONLY on functionality of any processingDo not rely ONLY on functionality of any processing
packagepackagendash Statistical approach has some limitations on small dataStatistical approach has some limitations on small data
sets (majority of monitoring studies)sets (majority of monitoring studies)
Any headache from analytical tools can beAny headache from analytical tools can be eliminated by expeeliminated by exp rienceeriencendash Try itTry it
3737
37
Further intentionsFurther intentions
Finalization of Gnostic analytical toolFinalization of Gnostic analytical tool with GUI (Swith GUI (S--Plus)Plus)
Extension to other platforms byExtension to other platforms by interfaceinterface
Linking to databases (LIMS GIS hellip)Linking to databases (LIMS GIS hellip) Training and disseminationTraining and dissemination Projects solutions and participationsProjects solutions and participations
ndashndash Join us 2Join us 2--FUN projectFUN project www2www2--funorgfunorg
3838
38
3939
hellip thank you for your attention
PCDDF
39

2828
28
2828
2929
Co
nce
ntr
atio
n u
gs
am
plin
g s
yste
m
2929
29
EXTERNAL CONSISTENCYEXTERNAL CONSISTENCY
ApproachesApproaches CorrelationsCorrelations Angles betwAngl een MDes between MD--vectors of meansvectors of means Angles betweenAngles between quantilequantile vectovect rsro s Conjunction of typical data intervalsConjunction of typical data intervals Conjunction of data supportsConjunction of data supports
3030
30
INTERVAL ANALYSISINTERVAL ANALYSIS
1)1) Distribution functionsDistribution functions2)2) Interval analysisInterval analysis
a)a) Data supportData support (LB UB)(LB UB)b)b) Membership intervalMembership interval (LSB USB)(LSB USB)c)c) Interval of typical dataInterval of typical data (ZL UL)(ZL UL)d)d) Tolerance intervalTolerance interval (Z0L Z0U)(Z0L Z0U)
3)3) OverlappingOverlapping 100xconjunction(I1 I2)union(I1I2) ()100xconjunction(I1 I2)union(I1I2) ()
3131
31
INFORMATIVENESSINFORMATIVENESS
1)1) Data sampleData sample2)2) Distribution functionDistribution function3)3) ProbabilityProbability pp of an individual data itemof an individual data item4)4) Information of the data itemInformation of the data item
Info=(pInfo=(p log(plog(p) + (1) + (1--p)log(1p)log(1--p))logp (12)())log 12)5)5) InformativenessInformativeness of a data sampleof a data sample
100 x100 x MeM an(Infoean(Info) ()) ()3232
32
3333
EVALUATIONEVALUATION OF PRECISIONOF PRECISION
Weak variabilityWeak variability PrecPrec = 100 x (1= 100 x (1 ndashndash STDAVG) ()STDAVG) ()
((STDSTD hellip standard deviationhellip standard deviation AVGAVG helliphellip mean)mean)
Strong uncertaintyStrong uncertaintyPrecPrec = 100 x (1= 100 x (1 -- Mean(GWMean(GW) ) ()) ) ()
((GWGW helliphellip gnosticgnostic weight of data entropyweight of data entropy change caused by the uncertainty)change caused by the uncertainty)
0 lt= GW lt= 10 lt= GW lt= 1
33
SUMMARY COMPARISONSUMMARY COMPARISON
AverigeAverige of 14 evaluationsof 14 evaluations
MethodMethod NonNon--homdatahomdata HomogHomog data data
BentosBentos 609 609 627 627
DreissenaDreissena 645 645 675 675
PlantsPlants 642 642 689 689
SPMDSPMD 675 675 695 695
3434
34
3535
35
3535
RATINGRATIN OF METHODSG OF METHODS
FeatureFeatureExtconsistencyExtconsistencyIntconsistencyIntconsistencyInformativenessInformativenessPrecissionPrecissionHomogeneityHomogeneityRelsensitivityRelsensitivityMean ratingMean rating
BentosBentos DreissDreiss PlantsPlants SPMDSPMD44 33 11 2244 33 22 1111 33 44 2233 11 44 2222 44 33 1133 11 22 11
2828 2525 2727 15153636
36
ndash
ndash
ndash
ConclusionsConclusions
Passive sampling like SPMDs shown the bestPassive sampling like SPMDs shown the best results if there are no legal requirements for biotaresults if there are no legal requirements for biota biotic organisms can be replacedbiotic organisms can be replaced
Do not forget to analyze data preciselyDo not forget to analyze data precisely independently before your interpretationindependently before your interpretationndash Do not rely ONLY on functionality of any processingDo not rely ONLY on functionality of any processing
packagepackagendash Statistical approach has some limitations on small dataStatistical approach has some limitations on small data
sets (majority of monitoring studies)sets (majority of monitoring studies)
Any headache from analytical tools can beAny headache from analytical tools can be eliminated by expeeliminated by exp rienceeriencendash Try itTry it
3737
37
Further intentionsFurther intentions
Finalization of Gnostic analytical toolFinalization of Gnostic analytical tool with GUI (Swith GUI (S--Plus)Plus)
Extension to other platforms byExtension to other platforms by interfaceinterface
Linking to databases (LIMS GIS hellip)Linking to databases (LIMS GIS hellip) Training and disseminationTraining and dissemination Projects solutions and participationsProjects solutions and participations
ndashndash Join us 2Join us 2--FUN projectFUN project www2www2--funorgfunorg
3838
38
3939
hellip thank you for your attention
PCDDF
39

2929
Co
nce
ntr
atio
n u
gs
am
plin
g s
yste
m
2929
29
EXTERNAL CONSISTENCYEXTERNAL CONSISTENCY
ApproachesApproaches CorrelationsCorrelations Angles betwAngl een MDes between MD--vectors of meansvectors of means Angles betweenAngles between quantilequantile vectovect rsro s Conjunction of typical data intervalsConjunction of typical data intervals Conjunction of data supportsConjunction of data supports
3030
30
INTERVAL ANALYSISINTERVAL ANALYSIS
1)1) Distribution functionsDistribution functions2)2) Interval analysisInterval analysis
a)a) Data supportData support (LB UB)(LB UB)b)b) Membership intervalMembership interval (LSB USB)(LSB USB)c)c) Interval of typical dataInterval of typical data (ZL UL)(ZL UL)d)d) Tolerance intervalTolerance interval (Z0L Z0U)(Z0L Z0U)
3)3) OverlappingOverlapping 100xconjunction(I1 I2)union(I1I2) ()100xconjunction(I1 I2)union(I1I2) ()
3131
31
INFORMATIVENESSINFORMATIVENESS
1)1) Data sampleData sample2)2) Distribution functionDistribution function3)3) ProbabilityProbability pp of an individual data itemof an individual data item4)4) Information of the data itemInformation of the data item
Info=(pInfo=(p log(plog(p) + (1) + (1--p)log(1p)log(1--p))logp (12)())log 12)5)5) InformativenessInformativeness of a data sampleof a data sample
100 x100 x MeM an(Infoean(Info) ()) ()3232
32
3333
EVALUATIONEVALUATION OF PRECISIONOF PRECISION
Weak variabilityWeak variability PrecPrec = 100 x (1= 100 x (1 ndashndash STDAVG) ()STDAVG) ()
((STDSTD hellip standard deviationhellip standard deviation AVGAVG helliphellip mean)mean)
Strong uncertaintyStrong uncertaintyPrecPrec = 100 x (1= 100 x (1 -- Mean(GWMean(GW) ) ()) ) ()
((GWGW helliphellip gnosticgnostic weight of data entropyweight of data entropy change caused by the uncertainty)change caused by the uncertainty)
0 lt= GW lt= 10 lt= GW lt= 1
33
SUMMARY COMPARISONSUMMARY COMPARISON
AverigeAverige of 14 evaluationsof 14 evaluations
MethodMethod NonNon--homdatahomdata HomogHomog data data
BentosBentos 609 609 627 627
DreissenaDreissena 645 645 675 675
PlantsPlants 642 642 689 689
SPMDSPMD 675 675 695 695
3434
34
3535
35
3535
RATINGRATIN OF METHODSG OF METHODS
FeatureFeatureExtconsistencyExtconsistencyIntconsistencyIntconsistencyInformativenessInformativenessPrecissionPrecissionHomogeneityHomogeneityRelsensitivityRelsensitivityMean ratingMean rating
BentosBentos DreissDreiss PlantsPlants SPMDSPMD44 33 11 2244 33 22 1111 33 44 2233 11 44 2222 44 33 1133 11 22 11
2828 2525 2727 15153636
36
ndash
ndash
ndash
ConclusionsConclusions
Passive sampling like SPMDs shown the bestPassive sampling like SPMDs shown the best results if there are no legal requirements for biotaresults if there are no legal requirements for biota biotic organisms can be replacedbiotic organisms can be replaced
Do not forget to analyze data preciselyDo not forget to analyze data precisely independently before your interpretationindependently before your interpretationndash Do not rely ONLY on functionality of any processingDo not rely ONLY on functionality of any processing
packagepackagendash Statistical approach has some limitations on small dataStatistical approach has some limitations on small data
sets (majority of monitoring studies)sets (majority of monitoring studies)
Any headache from analytical tools can beAny headache from analytical tools can be eliminated by expeeliminated by exp rienceeriencendash Try itTry it
3737
37
Further intentionsFurther intentions
Finalization of Gnostic analytical toolFinalization of Gnostic analytical tool with GUI (Swith GUI (S--Plus)Plus)
Extension to other platforms byExtension to other platforms by interfaceinterface
Linking to databases (LIMS GIS hellip)Linking to databases (LIMS GIS hellip) Training and disseminationTraining and dissemination Projects solutions and participationsProjects solutions and participations
ndashndash Join us 2Join us 2--FUN projectFUN project www2www2--funorgfunorg
3838
38
3939
hellip thank you for your attention
PCDDF
39
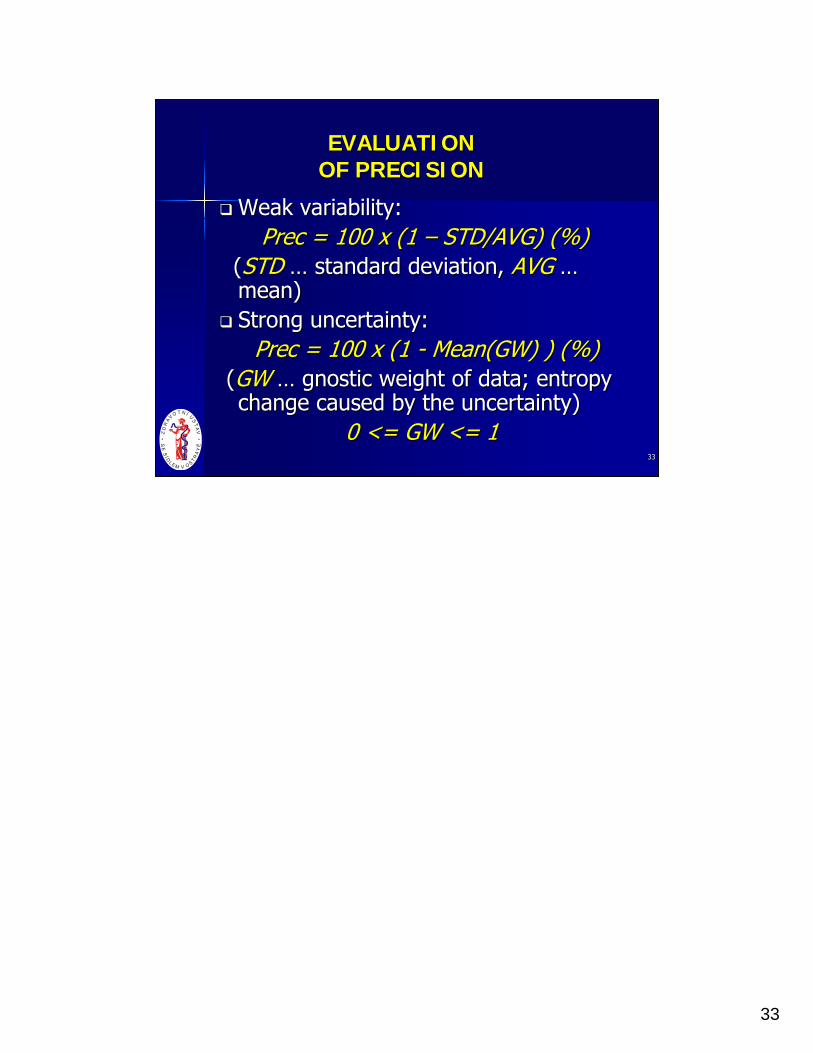
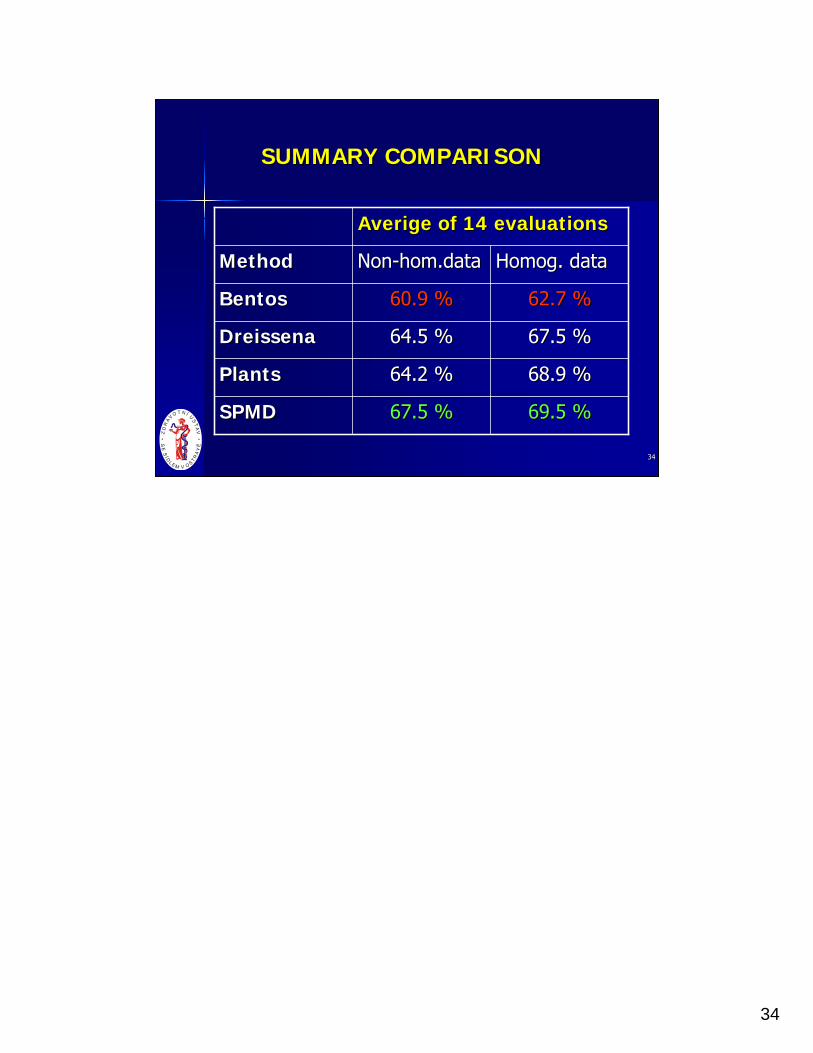

3535
35
3535
RATINGRATIN OF METHODSG OF METHODS
FeatureFeatureExtconsistencyExtconsistencyIntconsistencyIntconsistencyInformativenessInformativenessPrecissionPrecissionHomogeneityHomogeneityRelsensitivityRelsensitivityMean ratingMean rating
BentosBentos DreissDreiss PlantsPlants SPMDSPMD44 33 11 2244 33 22 1111 33 44 2233 11 44 2222 44 33 1133 11 22 11
2828 2525 2727 15153636
36
ndash
ndash
ndash
ConclusionsConclusions
Passive sampling like SPMDs shown the bestPassive sampling like SPMDs shown the best results if there are no legal requirements for biotaresults if there are no legal requirements for biota biotic organisms can be replacedbiotic organisms can be replaced
Do not forget to analyze data preciselyDo not forget to analyze data precisely independently before your interpretationindependently before your interpretationndash Do not rely ONLY on functionality of any processingDo not rely ONLY on functionality of any processing
packagepackagendash Statistical approach has some limitations on small dataStatistical approach has some limitations on small data
sets (majority of monitoring studies)sets (majority of monitoring studies)
Any headache from analytical tools can beAny headache from analytical tools can be eliminated by expeeliminated by exp rienceeriencendash Try itTry it
3737
37
Further intentionsFurther intentions
Finalization of Gnostic analytical toolFinalization of Gnostic analytical tool with GUI (Swith GUI (S--Plus)Plus)
Extension to other platforms byExtension to other platforms by interfaceinterface
Linking to databases (LIMS GIS hellip)Linking to databases (LIMS GIS hellip) Training and disseminationTraining and dissemination Projects solutions and participationsProjects solutions and participations
ndashndash Join us 2Join us 2--FUN projectFUN project www2www2--funorgfunorg
3838
38
3939
hellip thank you for your attention
PCDDF
39

ndash
ndash
ndash
ConclusionsConclusions
Passive sampling like SPMDs shown the bestPassive sampling like SPMDs shown the best results if there are no legal requirements for biotaresults if there are no legal requirements for biota biotic organisms can be replacedbiotic organisms can be replaced
Do not forget to analyze data preciselyDo not forget to analyze data precisely independently before your interpretationindependently before your interpretationndash Do not rely ONLY on functionality of any processingDo not rely ONLY on functionality of any processing
packagepackagendash Statistical approach has some limitations on small dataStatistical approach has some limitations on small data
sets (majority of monitoring studies)sets (majority of monitoring studies)
Any headache from analytical tools can beAny headache from analytical tools can be eliminated by expeeliminated by exp rienceeriencendash Try itTry it
3737
37
Further intentionsFurther intentions
Finalization of Gnostic analytical toolFinalization of Gnostic analytical tool with GUI (Swith GUI (S--Plus)Plus)
Extension to other platforms byExtension to other platforms by interfaceinterface
Linking to databases (LIMS GIS hellip)Linking to databases (LIMS GIS hellip) Training and disseminationTraining and dissemination Projects solutions and participationsProjects solutions and participations
ndashndash Join us 2Join us 2--FUN projectFUN project www2www2--funorgfunorg
3838
38
3939
hellip thank you for your attention
PCDDF
39
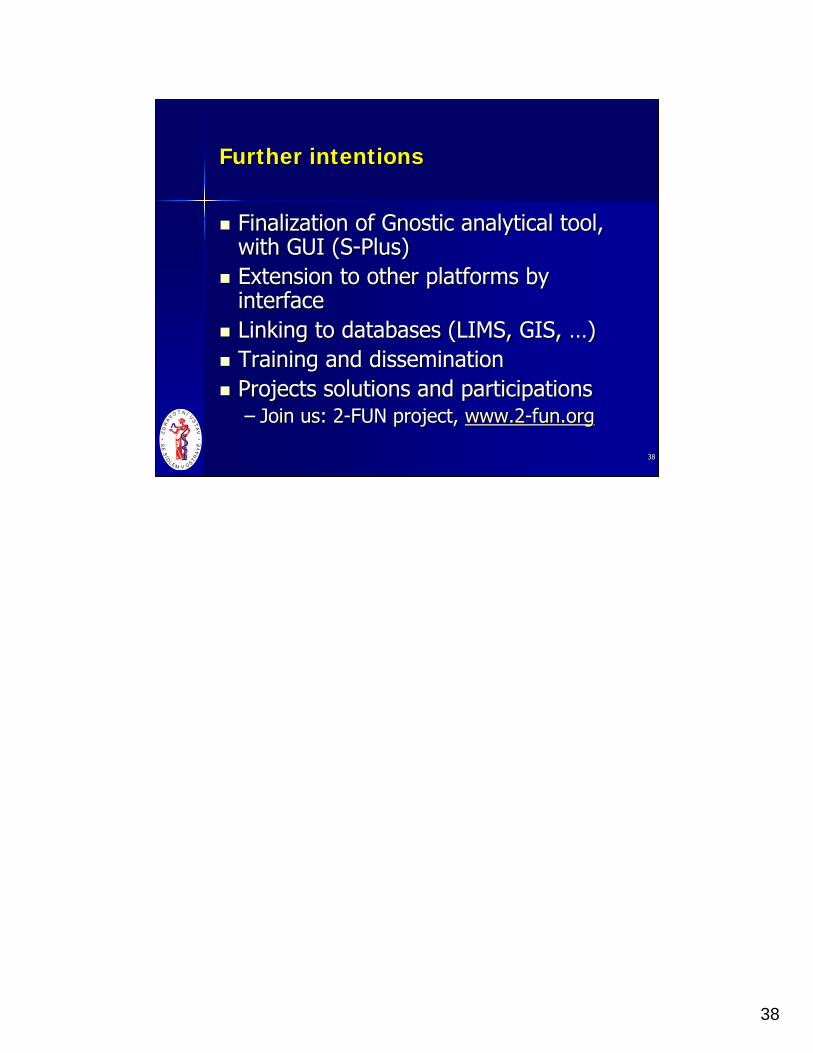

3939
hellip thank you for your attention
PCDDF
39


![The Gnostic Christ[1]](https://static.fdocuments.us/doc/165x107/577cc8721a28aba711a2d9d3/the-gnostic-christ1.jpg)