Comparison of Spacing Factors as Measured by the Air-Void ...
54
Report No. FHWA-KS-15-10 ▪ FINAL REPORT▪ December 2015 Comparison of Spacing Factors as Measured by the Air-Void Analyzer and ASTM C457 Will Lindquist, Ph.D., P.E. Rodney Montney, P.E. Kansas Department of Transportation Bureau of Research
Transcript of Comparison of Spacing Factors as Measured by the Air-Void ...
Report No. FHWA-KS-15-10 ▪ FINAL REPORT▪ December 2015
Comparison of Spacing Factors as Measured by the Air-Void Analyzer and ASTM C457
Will Lindquist, Ph.D., P.E.Rodney Montney, P.E.
Kansas Department of TransportationBureau of Research


i
Form DOT F 1700.7 (8-72)
1 Report No. FHWA-KS-15-10
2 Government Accession No.
3 Recipient Catalog No.
4 Title and Subtitle Comparison of Spacing Factors as Measured by the Air-Void Analyzer and ASTM C457
5 Report Date December 2015
6 Performing Organization Code SPR-73-1
7 Author(s) Will Lindquist, Ph.D., P.E., and Rodney Montney, P.E.
7 Performing Organization Report No.
9 Performing Organization Name and Address Kansas Department of Transportation Bureau of Research 2300 SW Van Buren Topeka, Kansas 66611-1195
10 Work Unit No. (TRAIS)
11 Contract or Grant No.
12 Sponsoring Agency Name and Address Kansas Department of Transportation Bureau of Research 2300 SW Van Buren Topeka, Kansas 66611-1195
13 Type of Report and Period Covered Final Report
14 Sponsoring Agency Code
15 Supplementary Notes For more information write to address in block 9.
The Kansas Department of Transportation (KDOT) began using the Air-Void Analyzer (AVA) in 2001 and first incorporated an AVA spacing factor requirement into paving specifications beginning in late 2002. In 2005, a statewide investigation to evaluate the AVA and specifications began with the collection of 4-inch diameter hardened concrete samples taken at or near locations where the spacing factor was determined with the AVA. The hardened concrete samples were tested to determine the spacing factor in accordance with ASTM C457 (2012), a well-established test method used to determine spacing factors in hardened concrete. A total of 270 data pairs were collected to evaluate KDOT’s current use of the AVA and ASTM C457 tests and to determine if a correlation (either direct or pass-fail criteria) exists between spacing factors obtained with the two methods. Results of the study indicate that average spacing factors obtained with the AVA were 1.67 higher than average spacing factors determined using ASTM C457. A strong direct correlation was not identified between the two test methods, although pass-fail criterion that limits KDOT’s risk of accepting concrete with an inadequate air-void system was identified.
17 Key Words Concrete, Spacing Factor, Air-Void Analyzer, Linear Traverse, Freeze-Thaw Durability
18 Distribution Statement No restrictions. This document is available to the public through the National Technical Information Service www.ntis.gov.
19 Security Classification (of this report)
Unclassified
20 Security Classification (of this page) Unclassified
21 No. of pages 54
22 Price

ii
This page intentionally left blank.

iii
Comparison of Spacing Factors as Measured by the
Air-Void Analyzer and ASTM C457
Final Report
Prepared by
Will Lindquist, Ph.D., P.E. Rodney Montney, P.E.
Kansas Department of Transportation Bureau of Research
A Report on Research Sponsored by
THE KANSAS DEPARTMENT OF TRANSPORTATION TOPEKA, KANSAS
December 2015
© Copyright 2015, Kansas Department of Transportation
iv
NOTICE The authors and the state of Kansas do not endorse products or manufacturers. Trade and manufacturers names appear herein solely because they are considered essential to the object of this report. This information is available in alternative accessible formats. To obtain an alternative format, contact the Office of Public Affairs, Kansas Department of Transportation, 700 SW Harrison, 2nd Floor – West Wing, Topeka, Kansas 66603-3745 or phone (785) 296-3585 (Voice) (TDD).
DISCLAIMER The contents of this report reflect the views of the authors who are responsible for the facts and accuracy of the data presented herein. The contents do not necessarily reflect the views or the policies of the state of Kansas. This report does not constitute a standard, specification or regulation.

v
Abstract
The Kansas Department of Transportation (KDOT) began using the Air-Void Analyzer
(AVA) in 2001 and first incorporated an AVA spacing factor requirement into paving
specifications beginning in late 2002. In 2005, a statewide investigation to evaluate the AVA and
specifications began with the collection of 4-inch diameter hardened concrete samples taken at or
near locations where the spacing factor was determined with the AVA. The hardened concrete
samples were tested to determine the spacing factor in accordance with ASTM C457 (2012), a
well-established test method used to determine spacing factors in hardened concrete. A total of
270 data pairs were collected to evaluate KDOT’s current use of the AVA and ASTM C457 tests
and to determine if a correlation (either direct or pass-fail criteria) exists between spacing factors
obtained with the two methods. Results of the study indicate that average spacing factors
obtained with the AVA were 1.67 higher than average spacing factors determined using ASTM
C457. A strong direct correlation was not identified between the two test methods, although
pass-fail criterion that limits KDOT’s risk of accepting concrete with an inadequate air-void
system was identified.
vi
Table of Contents
Abstract ........................................................................................................................................... v
Table of Contents ........................................................................................................................... vi
List of Tables ................................................................................................................................ vii
List of Figures .............................................................................................................................. viii
Chapter 1: Introduction ................................................................................................................... 1
1.1 General .................................................................................................................................. 1
1.2 Background ........................................................................................................................... 2
1.2.1 Units and Significant Figures ......................................................................................... 2
1.2.2 Historical Development .................................................................................................. 3
1.2.3 Current Specification ...................................................................................................... 5
1.3 Previous Work ....................................................................................................................... 7
1.4 Scope and Objective ............................................................................................................ 10
Chapter 2: Experimental Program ................................................................................................ 11
2.1 General ................................................................................................................................ 11
2.2 Equipment and Methods...................................................................................................... 11
2.3 Data Sources ........................................................................................................................ 12
2.4 Statistical Methods .............................................................................................................. 13
Chapter 3: Results and Evaluation ................................................................................................ 15
3.1 General ................................................................................................................................ 15
3.2 Distribution of Spacing Factor Data.................................................................................... 15
3.3 Comparison Based on All Data Collected........................................................................... 17
3.4 AVA Testing Performed with Deionized Water ................................................................. 23
Chapter 4: Conclusions and Recommendations ........................................................................... 29
4.1 General ................................................................................................................................ 29
4.2 Conclusions ......................................................................................................................... 29
4.3 Recommendations ............................................................................................................... 30
References ..................................................................................................................................... 32
Appendix: Raw Spacing Factor Data ............................................................................................ 34
vii
List of Tables
Table 3.1: Results of Using the AVA as a Screening Tool to Trigger C457 for Verification ...... 20
Table 3.2: Results of Using AVA as a Screening Tool to Trigger C457 for Verification (Including Only Samples Tested with Deionized Water) ........................................... 26
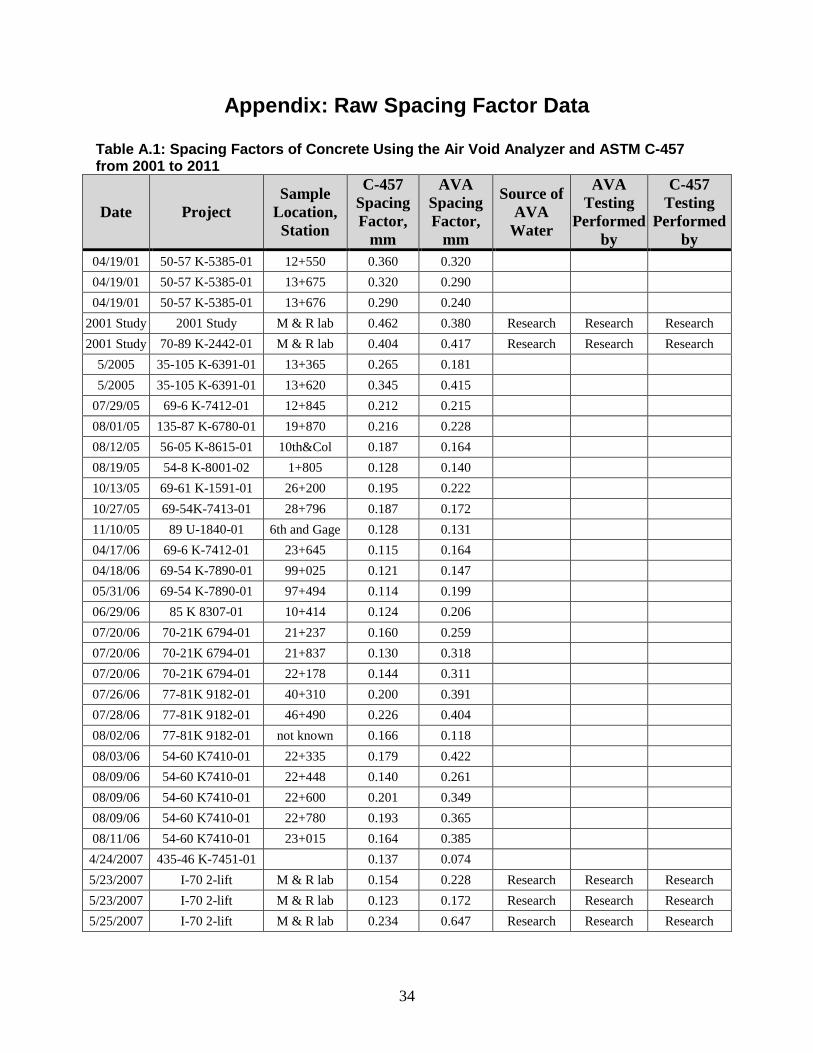
Table A.1: Spacing Factors of Concrete Using the Air Void Analyzer and ASTM C-457 from 2001 to 2011 ............................................................................................................... 34
Table A.2: Spacing Factors of Concrete Using the Air Void Analyzer and ASTM C457 from the “I-70 in Dickinson County” Project 70-21 K-6794-01 Placed in 2005 ................ 43

viii
List of Figures
Figure 1.1: KDOT Average Annual Spacing Factor as Measured by AVA Testing ...................... 4
Figure 1.2: AVA and C457 Spacing Factor Outcome Matrix ........................................................ 7
Figure 1.3: Correlation Between (a) AVA and ASTM C457 Spacing Factors, and (b) AVA and C457 Specific Surfaces .......................................................................................... 8
Figure 1.4: Pass-Fail Criterion Agreement for MoDOT and FHWA Mobile Lab Data Pairs ........ 9
Figure 3.1: Histograms and Normal Distributions to Assess Normality for Spacing Factors Obtained by (a) the AVA Conducted with Municipal Water, (b) the AVA Conducted with Deionized Water, and (c) ASTM C457 ........................................... 16
Figure 3.2: AVA Spacing Factor versus C457 Spacing Factor for AVA Tests Conducted With and Without Deionized Water ........................................................................... 17
Figure 3.3: AVA and ASTM C457 Spacing Factors for All Data ................................................ 18
Figure 3.4: Acceptance and Rejection Agreement in Spacing Factors Measured by the AVA and ASTM C457 ........................................................................................................ 20
Figure 3.5: Percent of AVA Test Results that Disagree (False Positive or False Negative, Q2 or Q4 in Figure 1.2) with ASTM C457 Test Results as a Function of the AVA Spacing Factor Threshold Triggering Hardened Air Testing and Average Failing C457 Spacing Factor for Samples in Q2 .................................................................... 22
Figure 3.6: Spacing Factor for AVA versus ASTM C457 with AVA Testing Performed Using Deionized Water .............................................................................................. 24
Figure 3.7: Spacing Factors from AVA (Testing Performed with Deionized Water) and ASTM C457 Testing with Specification Limits ......................................................... 26
Figure 3.8: Percent of AVA Test Results that Disagree (False Positive or False Negative) with C457 Test Results as a Function of the AVA Spacing Factor Threshold Triggering Hardened Air Testing ............................................................................... 28

1
Chapter 1: Introduction
1.1 General
Freezing and thawing cycles will result in damage to concrete that is saturated unless the
concrete is properly entrained with small and well-dispersed air voids. Durable concrete subject
to cycles of freezing and thawing must have an air-void system (in the cement paste) with an
adequate spacing factor, specific surface area, and air content. The spacing factor is defined as
the average distance from any point in the paste to the edge of the nearest (air) void, or more
simply, half of the average space between air voids, and is the most commonly used parameter to
evaluate air void systems (Neville, 1995). A maximum spacing factor of 0.200 mm (0.0080 in.)
measured in the hardened concrete is generally considered necessary to adequately protect paste
from freezing and thawing (ACI Committee 201, 2008), although the Canadian Standards
Association (CSA A23.2-09, 2009) recommends a slightly higher limit of 0.250 mm (0.0100 in.).
Specific surface area is the surface area of air voids per unit volume of paste and air content is
the volume of air per unit volume of concrete. In general, the size and distribution of the
entrained air is thought to be of more importance than the volume of air (Ley, Felice, &
Freeman, 2012). The Kansas Department of Transportation (KDOT) places limits on the air
content and spacing factor, which is the focus of this report (KDOT, 2015).
Various test methods exist to evaluate air-void systems in plastic and hardened concrete.
Evaluations of both the plastic and hardened concrete are used in Kansas to prequalify concrete
paving mixtures and verify performance in the field. The air-void system in hardened concrete is
determined in accordance with ASTM C457 (2012), which is the widely accepted method to
determine the spacing factor based on work by Powers (1954). It is important to note that ASTM
C457 spacing factor test results can vary by more than 50% and must be performed on hardened
concrete, making quality control testing difficult. The Air Void Analyzer (AVA) was developed
in the early 1990s as a relatively quick method (approximately 30 minutes) to determine the air
content and spacing factor of plastic (unhardened) concrete (Germann Instruments, Inc., n.d.).
Real-time determination of air-void characteristics provides a distinct advantage over ASTM
C457; however, questions remain regarding the accuracy and effectiveness of the tool. Although
2
both methods determine a spacing factor, they operate very differently and so it comes as no
surprise that differences exist in the values obtained between each test.
KDOT currently uses the AVA for prequalification and field verification and has
capabilities to run ASTM C457 at the Materials and Research Center in Topeka, KS. The goal of
this work is twofold: first, evaluate KDOT’s current use of the AVA and ASTM C457 in terms
of the risk of accepting concrete with an inadequate air void system, and second, determine if a
correlation (either direct or pass-fail criteria) exists between spacing factors obtained with ASTM
C457 and the AVA.
1.2 Background
KDOT began using the AVA in 2001 and first incorporated a spacing factor requirement
into the specifications beginning in late 2002. In 2005, a statewide investigation to evaluate the
AVA began with the collection of 4-inch diameter hardened concrete samples taken at or near
locations where the spacing factor was determined with the AVA. The spacing factor was
determined for the hardened concrete samples in accordance with ASTM C457 (2012) utilizing
Procedure A (linear traverse), and the results were compared with spacing factors measured with
the AVA in an effort to determine the efficacy of the AVA system. There is concern that the
original equipment (AVA-2000 model) is reaching its useful service life with limited options for
computer software upgrades and replacement parts. A new version of the AVA equipment
(AVA-3000 model) is available; however, acquiring new AVA equipment for KDOT labs across
the state will cost well over $150,000, making this evaluation timely.
1.2.1 Units and Significant Figures
The AVA spacing factor data included in this report was measured and recorded to the
nearest thousandth of a millimeter (0.001 mm), while the calculated ASTM C457 spacing factors
were generally reported to the nearest ten-thousandth of a millimeter (0.0001 mm). KDOT now
uses U.S. customary units and reports the AVA and ASTM C457 spacing factors to the nearest
ten-thousandth of an inch (0.0001 in.). For this report, the primary units for the collected data
(and any summary statistics) will remain in millimeters (nearest 0.001 mm) with inch equivalents
(nearest 0.0001 in.) shown in parentheses or secondary axes and calculated by dividing the

3
unrounded raw data by 25.4 mm/in. Spacing factor limits and previous specification
requirements are also reported with dual units, however, a soft conversion factor of 25 mm/in. is
used so that rounding is not required to interpret the specifications (e.g., 0.250 mm equals 0.0100
in.). Recommended changes to the current specification presented in Chapters 3 and 4 will be
based on data collected and analyzed in metric units and then converted to equivalent U.S.
customary units. Finally, discussion of the spacing factor limits in the current specification in
Section 1.2.3 will only be reported in inches in order to maintain consistency with the current
specification style and to avoid potential confusion due to rounding.
1.2.2 Historical Development
KDOT first began using the AVA for research in 2001. Data was collected for two
construction seasons before a spacing factor requirement was developed and incorporated into
the specifications beginning with projects let after December 2002. The original requirements
have undergone several revisions that have impacted spacing factors measured in the field, but
the specifications have consistently required the AVA for mix design approval and field
verification. Field verification for Quality Control/Quality Assurance (QC/QA) concrete projects
is currently required for portland cement concrete pavement once every four weeks of
production. The requirement is different for non-QC/QA projects and requires one test at the
start of paving and one during the second week of production. Statewide average annual AVA
spacing factors, as reported by each district, between 2001 and 2014 are shown in Figure 1.1
with key specification changes and target spacing factors identified.
The first AVA specification (December 2002) set a maximum spacing factor (as
measured by the AVA) of 0.250 mm (0.0100 in.) and contained a remove-and-replace clause for
concrete with spacing factors greater than 0.375 mm (0.0150 in.). The remove-and-replace limit
represents a 50% increase over the maximum specified limit of 0.250 mm (0.0100 in.), which is
similar to the acceptable range of results for ASTM C457. In 2006, KDOT agreed (with
industry) to not enforce the removal clause if contractors would agree to continue working to
improve the air-void characteristics through a reduction in spacing factors. This change in policy
was reflected in the February 2006 specification. Up to this point, the average annual AVA
spacing factor decreased from a high of 0.281 mm (0.0111 in.) in 2002 to 0.194 mm (0.0076 in.)

4
in 2005 (as shown in Figure 1.1). Average spacing factors immediately began to increase in
2006, and by 2009, the average spacing factor had risen to nearly the same level as when the
program began in 2001—losing all the gains previously made with the 2002 specification. It
should be noted that in April 2008, the remove-and-replace clause was reinstated for pavement
with a spacing factor greater than 0.375 mm (0.0150 in.) although there is some question whether
this penalty has been enforced, and there has not been a large subsequent impact on the average
annual spacing factors.
Figure 1.1: KDOT Average Annual Spacing Factor as Measured by AVA Testing
Average annual spacing factors oscillate above and below the maximum specified value
of 0.250 mm (0.0100 in.) from 2007 to 2011 before increasing to 0.291 mm (0.0115 in.) in
2012—the highest average annual spacing factor to date, as shown in Figure 1.1. Average annual
spacing factors decrease for 2013 and 2014 but are still at or above the maximum specified limit,
which appears to be the target used in the field since the remove-and-replace clause was first
0.006
0.007
0.008
0.009
0.010
0.011
0.012
0.013
0.014
0.015
0.150
0.200
0.250
0.300
0.350
0.400
2000 2002 2004 2006 2008 2010 2012 2014Av
erag
e Ann
ual A
VA S
paci
ng F
acto
r, in
.
Aver
age A
nnua
l AVA
Spa
cing
Fac
tor,
mm
Year
No Remove and Replace
2/6/2006 (90P-156-R8)
to4/18/2008 (07-04002)
Remove and Replace
Specification begins12/9/2002 (90P-156-
R4)
Remove and Replace
4/18-2008 (07-04002)to
7/1/2015 (15-403)
REMOVE AND REPLACE
MAXIMUMSPECIFIED
TARGET

5
removed in 2006. The specifications have recently been rewritten with an emphasis on field
adjustments to the mix following verification testing. The current specification is described next.
1.2.3 Current Specification
Beginning with projects let in July 2015, the remove-and-replace clause based on the
AVA spacing factor has been removed. A design AVA spacing factor of 0.0100 in.1 is required
for prequalification and mixes with AVA spacing factors larger than this value will not be
approved. Several strategies to reduce the spacing factor are provided if the AVA spacing factor
exceeds 0.0100 in. at any point during the course of the project (based on verification testing).
These strategies include the following:
1. Compare AVA spacing factors taken before and after the paver to
determine the loss of air and spacing factor due to the paving operation,
2. Verify calibration of the AVA,
3. Change the location of the AVA during testing,
4. Compare with results obtained from another machine,
5. Check the mix design for compliance with all relevant specifications,
6. Check aggregate gradations,
7. Check the total air content versus the target air content,
8. Check dosage rates of admixtures, and
9. Check for admixture compatibility using alternate sources.
If the preceding strategies do not decrease the spacing factor to an acceptable level (i.e.,
less than 0.0125 in.), two cores will be taken from the affected area (i.e., AVA sample location)
and tested to determine the hardened air spacing factor in accordance with ASTM C457. For this
report, the AVA spacing factor that prompts C457 testing (which ultimately is used for
acceptance) is referred to as the AVA threshold. If the AVA spacing factor is greater than 0.0125
in. and the average hardened air spacing factor is greater than 0.0080 in., then suspend paving
operations and submit (and prequalify) a new concrete mix design. The pavement will be
accepted if the average hardened air spacing factor is less than 0.0080 in. Using the AVA as a
1 Spacing factor limits in the current specification are only reported in inches in order to maintain consistency with the current specification style and to avoid potential confusion due to rounding.

6
screening tool that triggers additional air testing (ASTM C457) reemphasizes the importance of
spacing factors and addresses some industry concerns with the accuracy and precision of the
AVA by not relying solely on one test. The frequency of AVA field verification testing is
specified as once for every four weeks of production for QC/QA projects, and once at the
beginning of paving and once during the second week of paving for non-QC/QA projects. This
testing frequency may not be enough for these requirements to have a significant effect on the
actual spacing factors obtained over the course of a project.
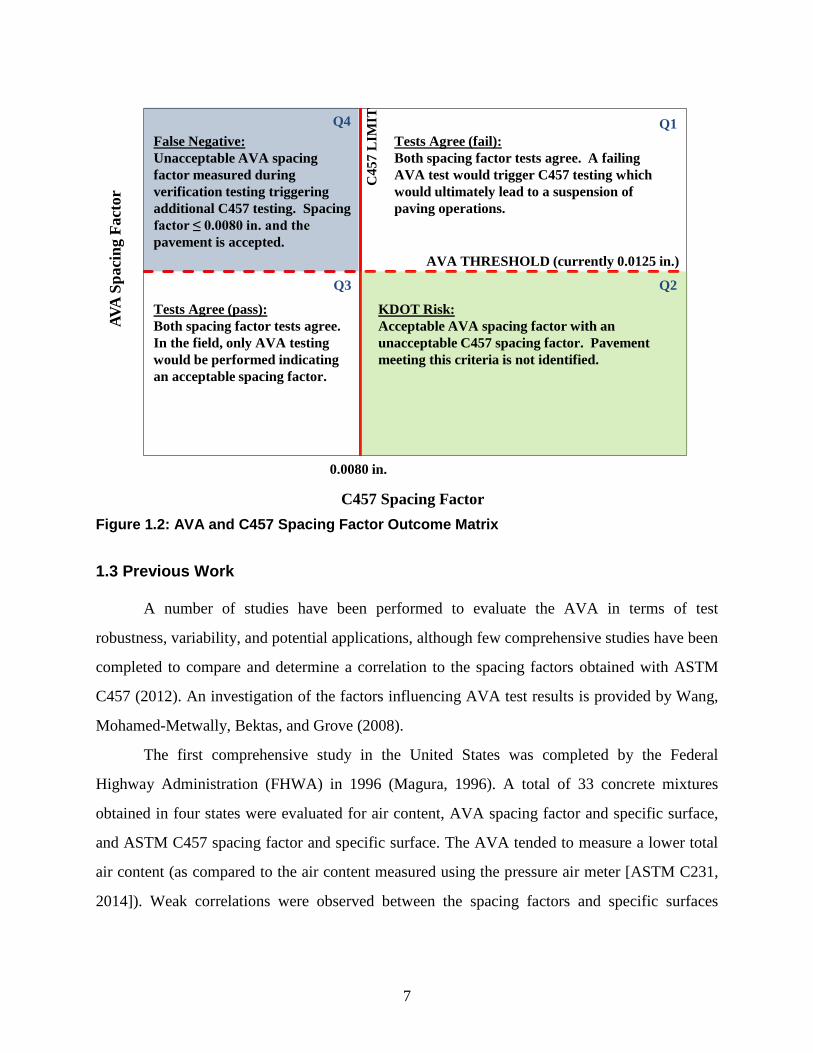
Four testing outcomes are possible when the two tests are conducted on the same
concrete as shown in Figure 1.2. Quadrants 1 and 3 (Q1 and Q3) indicate agreement in the test
methods (i.e., both tests identify passing or failing spacing factors). Quadrant 2 indicates samples
with acceptable AVA spacing factors and unacceptable C457 spacing factors. Pavement falling
into this quadrant, however, would not normally be tested using ASTM C457 as the AVA
spacing factor is less than the threshold value that triggers the test. This quadrant represents a
risk to KDOT by accepting potentially non-freeze-thaw durable concrete (i.e., C457 spacing
factor greater than 0.0080 in.). Quadrant 4 indicates pavement with a failing AVA spacing factor
that, in fact, has a spacing factor less than 0.0080 in. and passes the KDOT requirements for
ASTM C457. There is a need to establish an appropriate AVA threshold value that limits the risk
of accepting non-durable concrete, balances the amount of ASTM C457 testing, and encourages
contractors to produce concrete with spacing factors well below the limit. The objective of this
study is to evaluate the current AVA threshold using data collected since 2001, determine if
0.0125 in. produces an acceptable level of risk while balancing the number of ASTM C457
evaluations required, and if needed, recommend changes to the standard specification.
7
Figure 1.2: AVA and C457 Spacing Factor Outcome Matrix
1.3 Previous Work
A number of studies have been performed to evaluate the AVA in terms of test
robustness, variability, and potential applications, although few comprehensive studies have been
completed to compare and determine a correlation to the spacing factors obtained with ASTM
C457 (2012). An investigation of the factors influencing AVA test results is provided by Wang,
Mohamed-Metwally, Bektas, and Grove (2008).
The first comprehensive study in the United States was completed by the Federal
Highway Administration (FHWA) in 1996 (Magura, 1996). A total of 33 concrete mixtures
obtained in four states were evaluated for air content, AVA spacing factor and specific surface,
and ASTM C457 spacing factor and specific surface. The AVA tended to measure a lower total
air content (as compared to the air content measured using the pressure air meter [ASTM C231,
2014]). Weak correlations were observed between the spacing factors and specific surfaces
AVA
Spa
cing
Fac
tor
C457 Spacing Factor
AVA THRESHOLD (currently 0.0125 in.)
C45
7 L
IMIT
KDOT Risk:Acceptable AVA spacing factor with an unacceptable C457 spacing factor. Pavement meeting this criteria is not identified.
0.0080 in.
False Negative:Unacceptable AVA spacing factor measured during verification testing triggering additional C457 testing. Spacing factor ≤ 0.0080 in. and the pavement is accepted.
Tests Agree (pass): Both spacing factor tests agree. In the field, only AVA testing would be performed indicating an acceptable spacing factor.
Q1
Q2Q3
Q4Tests Agree (fail):Both spacing factor tests agree. A failing AVA test would trigger C457 testing which would ultimately lead to a suspension of paving operations.

8
measured by the AVA and C457 as shown in Figure 1.3. In general, C457 spacing factors were
lower and specific surface values were higher as compared to the results obtained with the AVA.
(a) (b)
Figure 1.3: Correlation Between (a) AVA and ASTM C457 Spacing Factors, and (b) AVA and C457 Specific Surfaces Note: 25.4 mm = 1 in. Source: Magura (1996)
Wang et al. (2008) compiled AVA and ASTM C457 spacing factor data obtained from
the Missouri Department of Transportation (MoDOT) for 38 data pairs obtained from 14 lab
mixtures and 4 field mixtures and 32 data pairs from the FHWA mobile lab. The results of the
comparison are shown in Figure 1.4. The correlation between AVA and C457 spacing factors is
weak, although unlike the data presented by Magura (1996), the AVA spacing factors for the
MoDOT data pairs are consistently higher than those determined using C457. For the MoDOT
data, there is good agreement between the AVA and C457 data pairs when pass-fail criterion is
used. With an AVA and C457 spacing factor limit of 0.200 mm (0.0080 in.)2, the two test
methods agree 55% of the time (i.e., both pass or both fail). When the AVA spacing factor limit
is increased to 0.375 mm (0.0150 in.) and the C457 spacing factor remains the same, the
agreement increases to 95%. In either case, only one of the samples (representing 3%) lies in Q2
with an acceptable AVA spacing factor and an unacceptable C457 spacing factor.
2 Unit conversions for limits and specification requirements are based on a soft conversion of 25 mm/in. The conversion factor for actual data is based on 25.4 mm/in. (see Section 1.2.1).

9
Figure 1.4: Pass-Fail Criterion Agreement for MoDOT and FHWA Mobile Lab Data Pairs Adapted from Wang et al. (2008)
Conversely, the AVA spacing factors for the FHWA mobile lab tend to be less than the
C457 spacing factors, but show similar agreement (59% compared to 55% for the MoDOT data)
when pass-fail criteria is used with AVA and C457 spacing factor limits of 0.200 mm (0.0080
in.). Increasing the AVA spacing factor limit to 0.375 mm (0.0150 in.), however, decreases the
test agreement to 28%. A number of factors could be responsible for the difference observed
between the two data sets, including test conditions and environment as well as the materials
used for testing. In any case, the variability in the AVA results (particularly for those performed
by different organizations) warrants development and evaluation using data obtained from the
State of Kansas.
0.0000 0.0080 0.0160 0.0240 0.0320 0.0400
0.0000
0.0080
0.0160
0.0240
0.0320
0.0400
0.000
0.200
0.400
0.600
0.800
1.000
1.200
0.000 0.200 0.400 0.600 0.800 1.000
C457 Spacing Factor, in.
AVA
Spa
cing
Fac
tor,
in.
AVA
Spa
cing
Fac
tor,
mm
C457 Spacing Factor, mm
MoDOT Data FHWA Mobile Lab Data0.200 mm (0.0080 in.) ASTM C457 Limit 0.200 mm (0.0080 in.) AVALine of Equality 0.375 mm (0.0150 in.) AVA
0.375 mm (0.0150 in.) AVA
0.200 mm (0.0080 in.) AVA
C45
7 L
IMIT
10
1.4 Scope and Objective
From 2001 to 2012, KDOT collected a total of 270 data pairs including AVA and ASTM
C457 spacing factors. Four-inch diameter concrete cores were taken for hardened air void
analysis (ASTM C457) at the same location where the spacing factor was determined using the
AVA. When the core drill was not available, a 4-inch diameter cylinder was cast from concrete
taken adjacent to the AVA sample location. The raw data are provided in Table A.1 and include
270 data pairs from laboratory mixtures prepared at the Materials and Research Center Lab and
pairs taken from projects in Kansas.
This report provides a comparison between spacing factors obtained with the AVA and
following ASTM C457 Procedure A (linear traverse). The overall objective of the project is to
evaluate the effectiveness of the AVA as a field verification and screening tool in mitigating the
risk of KDOT accepting non-durable concrete. The data pairs collected are used to evaluate
KDOT’s current use of the AVA and ASTM C457 tests, and to determine if a correlation (either
direct or pass-fail criteria) exists between spacing factors obtained with ASTM C457 and the
AVA.
11
Chapter 2: Experimental Program
2.1 General
The experimental program described in this chapter involves the collection of paired
plastic and hardened concrete samples for air void analysis. The hardened concrete air void
analysis was performed in accordance with ASTM C457 (2012) Standard Test Method for
Microscopical Determination of Parameters of the Air-Void System in Hardened Concrete using
Procedure A (linear traverse), and the plastic analysis was performed with an Air Void Analyzer
(AVA) in accordance with KT-71 (2015) and AASHTO TP 75-08 (2008). A total of 270 paired
samples were collected between 2001 and 2012 in the field and the laboratory.
2.2 Equipment and Methods
Hardened concrete air void analysis was performed in accordance with ASTM C457
using the linear traverse method Procedure A (linear traverse). KDOT purchased an automated
image analysis system (CAS-2000 Air Void Analysis System) to perform the testing in the mid-
1990s, which was replaced in 2007 with the AV-2000 Air Void Analysis System. The AV-2000
has the capability to eliminate any void size desired and can differentiate between entrapped and
entrained air. Testing follows ASTM C457 at a magnification of 100 times and includes all of
the voids in the total air evaluation. The operator performing the analysis will generally comment
on the number of voids over 0.500 mm (0.0200 in.), considering them as non-entrained air voids,
but they are still included in the results reported. The range of two spacing factor tests of samples
prepared and tested in the same lab (single operator) is 22.6% of their average (D2s%) which
increases to 49.5% when the specimens are prepared and tested in separate laboratories. The
corresponding coefficients of variation (1s%) are 8.0% and 17.5%, respectively (ASTM C457,
2012).
Plastic concrete air void analysis was performed using the AVA-2000 Air Void Analyzer.
Testing was conducted in accordance with KT-71, which formed the basis for the American
Association of State Highway and Transportation Officials (AASHTO) provisional test method
TP 75-08, Air-Void Characteristics of Freshly Mixed Concrete by Buoyancy Change. Details
regarding the testing principles used by the AVA are presented by Henrichsen and Vyncke

12
(1995). Only air voids less than 3 mm (0.1 in.) in diameter are included in the determination. An
official precision statement has not been adopted by AASHTO, but Germann Instruments, Inc.
(n.d.) reports that the single-operator coefficient of variation for the AVA spacing factor is
between 8 and 10%. Distlehorst and Kurgan (2007) reported single-operator and multi-machine
standard deviations of 0.0185 mm (0.0007 in.) and 0.0256 mm (0.0010 in.), respectively.
Therefore, results of two properly conducted tests by the same operator should not differ by more
than 0.050 mm (0.0020 in.) and the results of two properly conducted tests on different machines
should not differ by more than 0.070 mm (0.0028 in.).
Intensive multi-laboratory testing during the 2008 two-lift project on I-70 uncovered a
potential issue related to the water used for testing. It was determined that AVA data from
KDOT District 2 performed using Salina, KS, city water introduced a higher-than-normal
amount of variability in the test results. The decision was made to discontinue use of the
municipal water, and since that time, all KDOT AVA testing has been performed using
deionized water from the Materials and Research Center in Topeka, KS. The analysis presented
herein does not include any of the tests performed using Salina, KS, city tap water. Other
municipal sources are included in the analysis and compared with the results obtained using
deionized water.
2.3 Data Sources
From 2001 to 2012, KDOT collected a total of 270 data pairs including AVA and ASTM
C457 spacing factors. Four-inch diameter concrete cores were taken for hardened air void
analysis (ASTM C457) at the same location where the spacing factor was determined using the
AVA. When the core drill was not available, a 4-inch diameter cylinder was cast from concrete
taken adjacent to the AVA sample location. A total of 153 of the 270 (56.7%) data points were
collected from the 2008 two-lift construction of I-70 in Saline County, KS. Another 77 samples
were taken in the field, and 40 were batched, sampled, and tested in a laboratory. Of the 270
samples, 50 of the AVA spacing factor tests were performed with deionized water and 220 were
tested with municipal water local to the project. The raw data are provided in Table A.1.

13
In 2005, 70 additional AVA and C457 data pairs were obtained during the construction of
I-70 in Dickinson County (Project No. 70-21 K-6794-01). For this report, however, data from
this project is not included in the analysis. Very few passing AVA tests were obtained during
construction but the reason was not determined until 2008 during the I-70 two-lift project. At the
time, KDOT personnel could not explain the scatter and high overall AVA spacing factors
obtained during the project. Following the 2008 multi-laboratory testing, it was discovered that
the 2005 I-70 AVA testing was conducted using the problematic Salina, KS, city water. Spacing
factor data for this project is provided in Table A.2, but it is not included in the results presented
in Chapter 3. Future analysis could work to quantify the effect of water source on variability and
skew; however, all testing is now conducted with deionized water from the Materials and
Research Center in Topeka, KS.
2.4 Statistical Methods
The analysis presented in Chapter 3 includes a number of comparisons between spacing
factors obtained with the AVA and ASTM C457. When the data are separated into categories
based on AVA threshold values (as shown in Figure 1.2), it is instructive to calculate the
percentages of these samples within each category as well as the expected range (margin of
error) of values based on a predetermined level of confidence. The margin of error (ME) for
normally-distributed data is calculated using Equation 2.1.
𝐌𝐌𝐌𝐌 = 𝒛𝒛�𝒑𝒑�(𝟏𝟏 − 𝒑𝒑�)
𝒏𝒏 Equation 2.1
Where:
ME = margin of error
z = z-score (normal distribution) based on the confidence interval
𝒑𝒑� = estimate of the percentage of values in each category
𝒏𝒏 = sample size
The estimated percentage in each category 𝒑𝒑� is taken as the actual percentage of samples
within the category under investigation.
14
The t-distribution is also used to assess the difference between sample means (Student’s
t-test) and to construct prediction intervals enveloping linear trend lines. The t-test is parametric
and is frequently used when samples are small and the true population characteristics are
unknown. The t-test relies on the means of the two sample groups, the size of the samples, and
the standard deviation of each group to determine statistical significance or to develop prediction
intervals at a specified level of confidence α. Two-sided tests are used, meaning that there is a
probability of α/2 that the population means are different (smaller or larger) when in fact, they
are equal.

15
Chapter 3: Results and Evaluation
3.1 General
Comparisons between spacing factors collected with the Air Void Analyzer (AVA) and
ASTM C457 (denoted as C457) are presented in the following sections. The data is divided into
two categories depending on the source of water used to perform the AVA testing. The raw data,
including the source of water used for testing (when available), is provided in Table A.1. Figures
3.1 through 3.3 present the results obtained without regard to water source (Salina, KS, city tap
water is excluded as indicated in Chapter 2) and Figures 3.4 through 3.6 include only data pairs
tested with deionized water. In both cases, emphasis is placed on using the data collected since
2001 to evaluate the current specification limits for AVA spacing factors and to provide
recommendations moving forward.
3.2 Distribution of Spacing Factor Data
The comparisons between AVA and ASTM C457 spacing factors include confidence
intervals based on the underlying assumption that the data is normally distributed. Histograms
with normal probability distributions are shown in Figure 3.1 for both the AVA (with and
without deionized water) and C457 spacing factors to assess normality. Figure 3.1b appears to
have a slight positive skew, although the difference is not believed to justify an alternate skewed
distribution. In fact, for the purpose of calculating confidence intervals, the normal distribution
will conservatively estimate the upper confidence limit.
The average AVA spacing factor for tests conducted with municipal water is 0.271 mm
(0.0107 in.)3 with a standard deviation of 0.120 mm (0.0047 in.). For tests conducted with
deionized water, the average and standard deviation increase to 0.305 mm (0.0120 in.) and 0.158
mm (0.0062 in.), respectively. This difference is not statistically significant (90% confidence, p-
value = 0.148) based on a two-tailed t-test assuming unequal variances. As a result, this increase
is not believed to be a result of the test, but potentially indicative of the general increase in
spacing factors that began in 2006 (see Figure 1.1) and overall variability of the test. As shown
3 Unit conversions for limits and specification requirements are based on a soft conversion of 25 mm/in. The conversion factor for actual data is based on 25.4 mm/in. (see Section 1.2.1).

16
in Figure 3.1c., the C457 spacing factors have both a lower average of 0.161 mm (0.0063 in.)
and standard deviation of 0.060 mm (0.0024 in.).
(a) (b) (c)
Figure 3.1: Histograms and Normal Distributions to Assess Normality for Spacing Factors Obtained by (a) the AVA Conducted with Municipal Water, (b) the AVA Conducted with Deionized Water, and (c) ASTM C457 Note: 25.4 mm = 1 in.
Figure 3.2 presents a comparison of spacing factors obtained with C457 versus the
corresponding AVA spacing factor determined with deionized water and municipal water local
to the project. The majority of the AVA spacing factors are greater than their corresponding
C457 spacing factors (plot above the line of equality) and very little difference can be identified
between AVA water sources. This is consistent with manufacturer recommendations and
AASHTO TP 75-08 (2008) that only require potable water and does not differentiate between
results obtained with various potable water sources. However, KDOT will continue to use single-
source deionized water based on issues with at least one source in the state and the potential for
other sources to bias the test results. The potential for error due to water source is greater than
the cost of using a single deionized water source.
Two analyses are presented in the balance of this section. The first comparison includes
all of the AVA data (testing with municipal water and deionized water as shown in Figure 3.2)
since there is no statistical justification to analyze them separately. A second analysis including
just the AVA spacing factor data collected with deionized water is also presented and is
indicative of the testing procedure currently used by KDOT.

17
Figure 3.2: AVA Spacing Factor versus C457 Spacing Factor for AVA Tests Conducted With and Without Deionized Water
3.3 Comparison Based on All Data Collected
Hardened air spacing factors as measured by ASTM C457 are compared with the
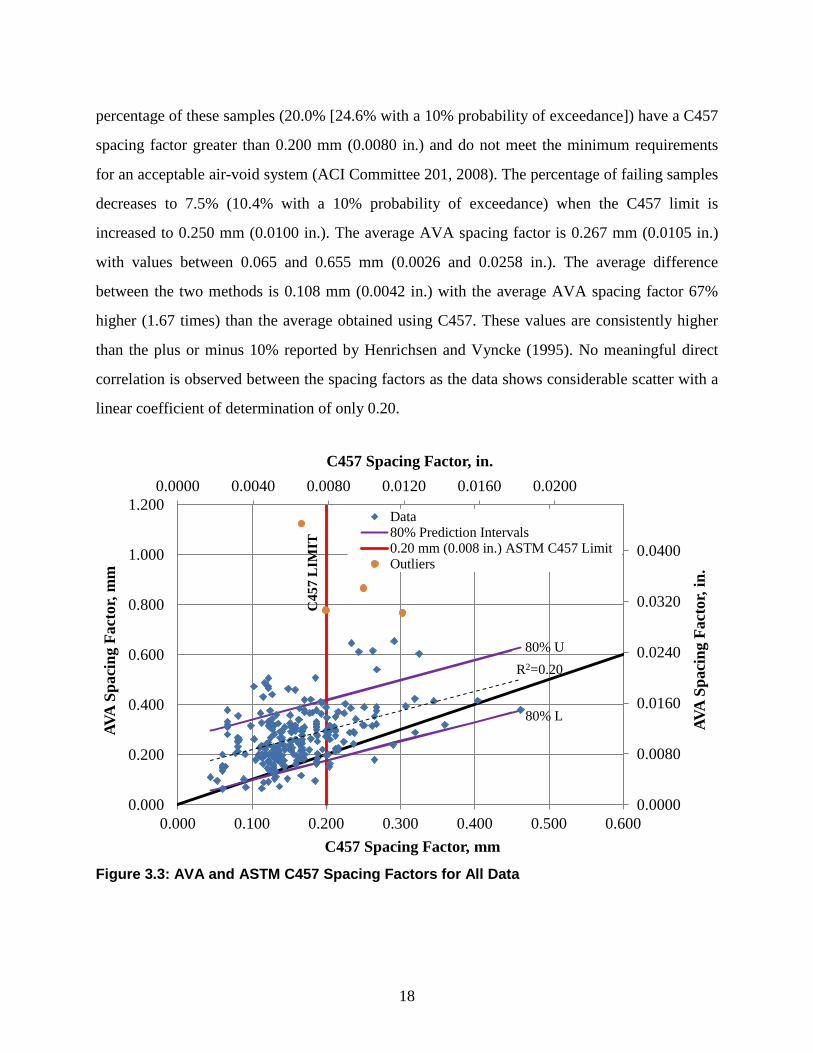
corresponding AVA spacing factor in Figure 3.3 for all of the collected data. The figure includes
a linear trend line, prediction intervals (based on a t-distribution), and for comparison, the
maximum allowable ASTM C457 spacing factor in the hardened concrete. The upper prediction
interval (labeled as 80% U) indicates the spacing factors that have a 10% probability of being
exceeded. The lower prediction interval (labeled as 80% L) indicates the spacing factors that
have a 90% probability of being exceeded. Four data pairs are identified as outliers based on a
standardized residual greater than 3. For normally distributed data, 99.7% of the pairs should
have a standardized residual within ±3 standard deviations (assuming random errors only). These
data pairs are not included in the analysis and discussion that follows.
The average hardened air spacing factor as measured by ASTM C457 is 0.160 mm
(0.0063 in.) with values between 0.044 and 0.462 mm (0.0017 and 0.0182 in.). A significant
0.0000 0.0040 0.0080 0.0120 0.0160 0.0200
0.0000
0.0080
0.0160
0.0240
0.0320
0.0400
0.000
0.200
0.400
0.600
0.800
1.000
1.200
0.000 0.100 0.200 0.300 0.400 0.500 0.600
C457 Spacing Factor, in.
AVA
Spa
cing
Fac
tor,
in.
AVA
Spa
cing
Fac
tor,
mm
C457 Spacing Factor, mm
Other Municipal Water Sources0.200 mm (0.0080 in.) ASTM C457 LimitDeionized Water
C45
7 L
IMIT
18
percentage of these samples (20.0% [24.6% with a 10% probability of exceedance]) have a C457
spacing factor greater than 0.200 mm (0.0080 in.) and do not meet the minimum requirements
for an acceptable air-void system (ACI Committee 201, 2008). The percentage of failing samples
decreases to 7.5% (10.4% with a 10% probability of exceedance) when the C457 limit is
increased to 0.250 mm (0.0100 in.). The average AVA spacing factor is 0.267 mm (0.0105 in.)
with values between 0.065 and 0.655 mm (0.0026 and 0.0258 in.). The average difference
between the two methods is 0.108 mm (0.0042 in.) with the average AVA spacing factor 67%
higher (1.67 times) than the average obtained using C457. These values are consistently higher
than the plus or minus 10% reported by Henrichsen and Vyncke (1995). No meaningful direct
correlation is observed between the spacing factors as the data shows considerable scatter with a
linear coefficient of determination of only 0.20.
Figure 3.3: AVA and ASTM C457 Spacing Factors for All Data
0.0000 0.0040 0.0080 0.0120 0.0160 0.0200
0.0000
0.0080
0.0160
0.0240
0.0320
0.0400
0.000
0.200
0.400
0.600
0.800
1.000
1.200
0.000 0.100 0.200 0.300 0.400 0.500 0.600
C457 Spacing Factor, in.
AVA
Spa
cing
Fac
tor,
in.
AVA
Spa
cing
Fac
tor,
mm
C457 Spacing Factor, mm
Data80% Prediction Intervals0.20 mm (0.008 in.) ASTM C457 LimitOutliers
80% U
80% L
C45
7 L
IMIT
R2=0.20

19
Spacing factors obtained with C457 are plotted versus the corresponding AVA spacing
factor for all data in Figure 3.4 (a subsequent analysis will only include AVA samples tested
using deionized water). The specification limits for the AVA and C457 are also included and
create the four quadrants described in Figure 1.2 with a summary of the data for each quadrant
provided in Table 3.1. Of the 266 data pairs (four outliers excluded), 128 (48.1%) meet the
design KDOT limit with AVA spacing factors less than 0.250 mm (metric units are not used in
the current specification, but the equivalent requirement using a soft conversion of 25 mm/in. is
0.0100 in.). The number of passing samples increases to 195 (73.3%) when compared to the
current maximum specification limit of 0.313 mm (equivalent to the specification value of
0.0125 in.), that triggers hardened air testing (AVA threshold). Of these 195 samples, 26 (9.8%
of the total) of the data pairs meet the AVA spacing requirements but, in fact, have a C457
spacing factor greater than the specified limit 0.200 mm (equivalent to 0.0080 in.). This concrete
was accepted and would have also been accepted under the current specification. This outcome
represents KDOT’s risk of accepting concrete with an inadequate spacing factor. When an 80%
confidence interval (10% probability of exceedance) is included (also shown in Table 3.1 for
each quadrant), the potential future risk to KDOT could be as high as 12.1% of the total number
of tests.
Overall, 73.7% (63.5+10.2%) of the AVA and C457 tests are in agreement (26.3%
disagree). An additional 16.5% (for a total of 90.2%) of the data pairs failed the AVA threshold
screening requirement (spacing factor greater than 0.0125 in. [equivalent to 0.313 mm]) but
would have ultimately been accepted based on C457. Samples meeting these criteria (see Q4 in
Figure 1.2) require additional testing, however, that is the extent of the risk to KDOT as the in-
place concrete has an adequate spacing factor to withstand freeze-thaw cycles. As previously
discussed, the remaining 9.8% passed the initial AVA screening test but had an actual C457
spacing factor greater than the recommended limit for concrete subject to freezing and thawing.
Reducing the AVA spacing factor threshold that triggers further testing will reduce the risk of
KDOT accepting non-durable concrete, but at the same time, increase the number of additional
tests required. Targeting a lower spacing factor in the field will also reduce KDOT risk and
would have the effect of shifting the data shown in Figure 3.4 towards Q3 (down and to the left).

20
Figure 3.4: Acceptance and Rejection Agreement in Spacing Factors Measured by the AVA and ASTM C457
Table 3.1: Results of Using the AVA as a Screening Tool to Trigger C457 for Verification
Subcategory No. data pairs
% of Total number of data points†
% of subcategory† Notes
169 63.5
(59.8 to 67.3) 86.7
(83.5 to 89.8) Both Tests Pass – agree
26 9.8 (7.4 to 12.1)
13.3 (10.2 to 16.5)
27 10.2 (7.8 to 12.5)
38.0 (30.6 to 45.4) Both Tests Fail – agree
44 16.5 (13.6 to 19.4)
62.0 (54.6 to 69.4)
AVA Fail & C457 Pass – disagree (False Negative)
266 Total 100.0% †The range shown represents the two-tailed 80% confidence interval (10% probability of exceeding the highest value and 10% probability of falling below the lowest). ‡Current AVA spacing factor threshold (Pass/Fail) that triggers C457 testing is 0.313 mm (equivalent to 0.0125 in.).
0.0000 0.0040 0.0080 0.0120 0.0160
0.0000
0.0040
0.0080
0.0120
0.0160
0.0200
0.0240
0.000
0.100
0.200
0.300
0.400
0.500
0.600
0.700
0.000 0.100 0.200 0.300 0.400 0.500
C457 Spacing Factor, in.
AVA
Spa
cing
Fac
tor,
in.
AVA
Spa
cing
Fac
tor,
mm
C457 Spacing Factor, mm
All Data0.0125 in. KDOT AVA Threshold0.010 in. KDOT AVA Design0.0080 in. ASTM C457 Limit
AVA THRESHOLD
AVA DESIGNC
457
LIM
IT
AVA Pass & C457 Fail – disagree (False Positive & KDOT Risk)
Pass AVA‡
≤0.313 mm (≤0.0125 in.)
Fail AVA‡
>0.313 mm (>0.0125 in.)
21
Table 3.1 also presents the data divided into two subcategories—concrete with an AVA
spacing factor above and below the AVA spacing factor threshold. A total of 169 out of the 195
data pairs (86.7%) with a passing AVA spacing factor also pass C457. The remaining 26 (13.3%)
pass the AVA threshold used to screen field test results and would be accepted by KDOT but
have a C457 spacing factor that exceeds the specification limit of 0.200 mm (equivalent to the
specification value of 0.0080 in.). Of the 71 samples that failed the AVA screening test, 27
(38.0%) also failed C457 and 44 (62.0%) passed. The goal is to establish an AVA threshold level
(currently 0.0125 in.) that produces an acceptable level of risk to KDOT (i.e., concrete that
passes the AVA but fails C457), and to a much lesser extent, limits the amount of false negatives
(i.e., concrete that fails the AVA but passes C457). These percentages expressed as a function of
the specified AVA threshold are discussed next.
The percentage of concrete samples with spacing factors that pass the AVA but fail C457
(i.e., false positive and KDOT’s level of risk shown in Figure 1.2 in Q2) and that fail the AVA
but pass C457 (i.e., false negatives, Q4 in Figure 1.2) are shown as a function of the AVA
spacing factor threshold in Figure 3.5. Figure 3.5 is used to select an appropriate AVA spacing
factor threshold that balances KDOT’s risk with the number of false negatives. The threshold
values shown along the x-axis of Figure 3.5 are shown in metric units to preserve the units of the
original data. Linear trend lines and error bars representing 80% confidence intervals (10%
probability of being above or below the designated range) are included. For example, with an
AVA spacing factor threshold of 0.0125 in. (equivalent to 0.313 mm), 13.3% (16.5% with a 10%
probability of exceedance) of the samples that pass the AVA can be expected to have a C457
spacing factor greater than 0.200 mm (equivalent to the specification value of 0.0080 in.), and
62.0% (69.4% with a 10% probability of exceedance) of the samples that fail the AVA in fact
have a spacing factor less than the C457 limit for freeze-thaw durable concrete.

22
Figure 3.5: Percent of AVA Test Results that Disagree (False Positive or False Negative, Q2 or Q4 in Figure 1.2) with ASTM C457 Test Results as a Function of the AVA Spacing Factor Threshold Triggering Hardened Air Testing and Average Failing C457 Spacing Factor for Samples in Q2 Note: 25.4 mm = 1 in.
As the AVA spacing factor limit is increased, more samples meet the screening
requirement that do not have an adequate C457 spacing factor and increase KDOT’s risk of
accepting concrete with an inadequate spacing factor. A smaller percentage of samples will fail
the AVA and pass C457, but over the range of potential AVA threshold values, the probability of
false negatives does not change significantly. Historically, the level of acceptable risk to KDOT
may be on the order of 10%. In order to meet this level of risk based on the linear trend line
shown in Figure 3.5, the AVA threshold should be set at 0.280 mm corresponding to a
specification value of 0.0110 in. (rounded to the nearest 0.001 in.). For samples at this AVA
threshold and below, the average C457 spacing factor is 0.141 mm (0.0055 in.) compared to
0.147 mm (0.0058 in.) with the current AVA threshold (0.313 mm [0.0125 in.]). The expected
59.1%58.5%
64.6%62.0%
65.6%64.9%67.4%
69.7%71.3%
74.1%
15.8%14.6%14.9%
13.3%12.1%
8.6%8.0%7.4%5.9%
4.1%
0.225 0.218 0.225 0.226 0.2230.227 0.225
0.231
0.232 0.231
0.000
0.100
0.200
0.300
0.400
0.500
0.600
0.700
0.800
0%
10%
20%
30%
40%
50%
60%
70%
80%
0.180 0.220 0.260 0.300 0.340 0.380
Aver
age
Faili
ng C
457
Spac
ing
Fact
or (f
or Q
2), m
m
Perc
ent o
f Dat
a Pa
irs i
n Q
2 or
Q4
with
80%
Con
fiden
ce In
terv
als
AVA Spacing Factor Threshold, mm
AVA Fail & C457 Pass (False Negative, Q4)AVA Pass & C457 Fail (False Positive & KDOT RISK, Q2)AVA Pass & C457 Fail Average C457 Spacing Factor (KDOT Risk, Q2)
0.313
y=-93.3x + 92.1R2=0.94
y=-76.9x - 11.3R2=0.96

23
level of KDOT’s risk is 8.6% at this threshold value. The actual percentages (with 80%
confidence intervals) based on the collected data are 8.6% (5.7 to 11.4%) and 64.9% (59.0 to
70.6%) for KDOT’s risk and false negatives, respectively.
The average failing C457 spacing factor for data pairs in Q2 (passing the AVA and
failing ASTM C457, see Figure 1.2) is also shown in Figure 3.5 plotted on a secondary vertical
axis. The average is nearly independent of the AVA spacing factor threshold, however, the range
of values (shown with the error bars in Figure 3.5) increases with the AVA spacing factor
threshold. The average failing C457 spacing factor is 0.223 mm (0.0088 in.) with values that
range between 0.203 and 0.290 mm (0.0080 and 0.0114 in.) when the AVA spacing factor
threshold is 0.280 mm (equivalent to 0.0110 in.). The average increases slightly to 0.225 mm
(0.0089 in.) with values that range between 0.203 and 0.320 mm (0.0080 and 0.0126 in.) for the
current specification threshold value 0.313 mm (0.0125 in.).
3.4 AVA Testing Performed with Deionized Water
The source of water used to conduct AVA testing was discovered to have an influence on
the measured spacing factor. AASHTO TP 75-08 (2008) only requires potable de-aerated water.
The AVA test method utilizes Stoke’s Law which relates the velocity of the air bubbles in the
chamber to their size using the dynamic viscosity of the fluid, so it comes as no surprise that the
source of the water (and possible differences in viscosity) may have an influence on the results.
In particular, tests conducted using city tap water from Salina, KS, resulted in abnormally high
spacing factors. Rather than conduct an exhaustive evaluation of the test procedure using water
from various sources, the AVA test procedure (used in Kansas) was changed to only include
deionized and de-aerated water from the Materials and Research Center in Topeka, KS.
An additional comparison between the average hardened air spacing factor as measured
by ASTM C457 and the corresponding average AVA spacing factor is shown in Figure 3.6. For
this data, however, only AVA tests conducted using the single-source deionized water are
included. A linear trend line, 80% prediction intervals, and the maximum allowable C457
spacing factor in the hardened concrete (KDOT, 2015) are included. One data pair is identified

24
as an outlier based on a standardized residual greater than three and is not included in the
analysis and discussion that follows.
Figure 3.6: Spacing Factor for AVA versus ASTM C457 with AVA Testing Performed Using Deionized Water
There is less scatter in the data at the high end of the measured spacing factors when the
tests conducted with non-deionized water are excluded. This is one indication that water source
was affecting the AVA test results. The average hardened air spacing factor as measured by
ASTM C457 is 0.153 mm (0.0060 in.) with values between 0.064 and 0.292 mm (0.0025 and
0.0115 in.). The average AVA spacing factor is 0.288 mm (0.0113 in.) with values between
0.103 and 0.655 mm (0.0041 and 0.0258 in.). The average difference between the two methods is
0.135 mm (0.0053 in.) with the average AVA spacing factor 88% higher (1.88 times) than the
average obtained using ASTM C457 (compared to 0.108 mm [0.0042 in.] and 67% when all of
0.0000 0.0040 0.0080 0.0120 0.0160 0.0200
0.0000
0.0080
0.0160
0.0240
0.0320
0.0400
0.000
0.200
0.400
0.600
0.800
1.000
1.200
0.000 0.100 0.200 0.300 0.400 0.500 0.600
C457 Spacing Factor, in.
AVA
Spa
cing
Fac
tor,
in.
AVA
Spa
cing
Fac
tor,
mm
ASTM C457 Spacing Factor, mm
Data80% Prediction Intervals0.20 mm (0.008 in.) ASTM C457 LimitOutlier
80% U
80% L
C45
7 L
IMIT
R2=0.14

25
the data is included). No meaningful correlation is observed between the two spacing factors
with a linear coefficient of determination of 0.14.
The spacing factor data in Figure 3.6 is included with specification limits and the
corresponding quadrants (see Figure 1.2) in Figure 3.7, and the data is tabulated in Table 3.2. Of
the 49 data pairs (one outlier excluded), 18 (36.7%) meet the design KDOT limit with AVA
spacing factors less than 0.250 mm (0.0100 in.). The number of passing samples increases to 35
(71.5%) when compared to the current maximum specification limit (0.313 mm [0.0125 in.]) that
triggers hardened air testing. Of these 35 samples, four (8.2% of the total, compared to 9.8% for
the tests performed with non-deionized water) of the data pairs meet the AVA spacing
requirements but have a C457 spacing factor greater than 0.200 mm (0.0080 in.). KDOT’s risk
with an 80% probability of occurring (based on this data set only) is 3.2 to 13.2%, compared to
7.4 to 12.1% when all of the data is included.
Overall, 69.4% (63.3+6.1%) of the AVA and C457 tests are in agreement (30.6%
disagree). An additional 22.4% (for a total of 91.8%) of the data pairs failed the AVA screening
requirement (spacing factor greater than 0.313 mm [equivalent to 0.0125 in.]) but would have
been accepted based on C457. This is similar to the 90.2% obtained when all of the data is
included in the analysis. The remaining 8.2% passed the initial AVA screening test but failed
C457 testing (i.e., KDOT’s risk). A total of 31 out of the 35 data pairs (88.6% compared to
86.7% when all samples are included) that pass the AVA requirement also pass C457. The
remaining four (11.4% of the samples passing the AVA compared to 13.3%) samples meet the
AVA spacing factor requirement and not the C457 requirement. Of the 14 samples that failed the
AVA screening test, three (21.4% compared to 38.0%) also failed C457 and 11 (78.6%
compared to 62.0%) passed. These percentages will be examined in further detail in the
following section.

26
Figure 3.7: Spacing Factors from AVA (Testing Performed with Deionized Water) and ASTM C457 Testing with Specification Limits
Table 3.2: Results of Using AVA as a Screening Tool to Trigger C457 for Verification (Including Only Samples Tested with Deionized Water)
Subcategory No. data pairs
% of Total number of data points†
% of subcategory† Notes
31 63.3
(54.4 to 72.1) 88.6
(81.7 to 95.5) Both Tests Pass – agree
4 8.2 (3.2 to 13.2)
11.4 (4.5 to 18.3)
3 6.1 (1.7 to 10.5)
21.4 (12.5 to 30.3) Both Tests Fail – agree
11 22.4 (14.8 to 30.1)
78.6 (64.5 to 92.6)
AVA Fail & C457 Pass – disagree (False Negative)
49 Total 100.0% †The range shown represents the two-tailed 80% confidence interval (10% probability of exceeding the highest value and 10% probability of falling below the lowest). ‡Current AVA spacing factor threshold (Pass/Fail) that triggers C457 testing is 0.313 mm (equivalent to 0.0125 in.).
0.0000 0.0040 0.0080 0.0120 0.0160
0.0000
0.0040
0.0080
0.0120
0.0160
0.0200
0.0240
0.000
0.100
0.200
0.300
0.400
0.500
0.600
0.700
0.000 0.100 0.200 0.300 0.400 0.500
C457 Spacing Factor, in.
AVA
Spa
cing
Fac
tor,
in.
AVA
Spa
cing
Fac
tor,
mm
C457 Spacing Factor, mm
Tested with Deionized Water0.0125 in. KDOT AVA Threshold0.010 in. KDOT AVA Design0.0080 in. ASTM C457 Limit
AVA THRESHOLD
AVA DESIGNC
457
LIM
IT
AVA Pass & C457 Fail – disagree (False Positive & KDOT Risk)
Pass AVA‡
≤0.313 mm (≤0.0125 in.)
Fail AVA‡
>0.313 mm (>0.0125 in.)

27
The percentages of samples with AVA and C457 test results that do not agree (either
false negatives or positives) are shown in Figure 3.8 as a function of the AVA spacing threshold
for the samples tested with deionized water. As the threshold value is increased, more samples
meet the screening requirement that do not have an adequate C457 spacing factor and increase
KDOT’s risk of accepting concrete with an inadequate spacing factor. If a spacing factor of
0.280 mm (0.0110 in.) is selected as suggested previously, the calculated level of risk based on
the linear trend line is 6.2%. The actual percentage based on the collected data is only 4.0%
which could be as high as 9.0% with a 10% probability of exceedance. The percentage of
samples that fail the AVA and pass C457 remains approximately constant over the range of
potential AVA limits. The estimated percentage (based on the linear trend line) of samples
failing the AVA screening test but ultimately passing C457 is 79.6%. In both cases, however, the
number of samples is small—only four data pairs in Q2 and 11 in Q4 (see Figure 1.2). Based on
this information and the small number of samples, 0.280 mm (0.0110 in.) appears to be an
appropriate limit for the AVA spacing factor threshold. As shown in Figure 3.8, this limit could
be increased to 0.300 mm (0.0120 in.) based on the trend line, but the calculated risk based on
the actual field data indicates a potential risk as high as 20.6%well above that acceptable to
KDOT. The average failing C457 spacing factor (data pairs in Q2 as shown in Figure 1.2) is
0.230 mm (0.0091 in.) even as the AVA threshold is increased to as high as 0.360 mm (0.0144
in.). The average failing C457 spacing factor as a function of the AVA spacing factor threshold
(see Figure 3.5) is not shown in Figure 3.8 due to a lack of available data.

28
Figure 3.8: Percent of AVA Test Results that Disagree (False Positive or False Negative) with C457 Test Results as a Function of the AVA Spacing Factor Threshold Triggering Hardened Air Testing
81.8%
78.6%78.6%
83.3%
75.0%77.8%78.1%80.6%82.1%
13.2%11.4%11.4%12.9%
4.0%4.5%
0.0%0.0%0.0%0%
10%
20%
30%
40%
50%
60%
70%
80%
90%
100%
0.180 0.220 0.260 0.300 0.340 0.380
Perc
ent o
f Dat
a Pa
irs i
n Q
2 or
Q4
with
80%
Con
fiden
ce In
terv
als
AVA Spacing Factor Threshold, mm
AVA Fail & C457 Pass (False Negative, Q4)
AVA Pass & C457 Fail (False Positive & KDOT Risk, Q2)
y=79.6R2=0
y=98.7x-21.2R2=086
29
Chapter 4: Conclusions and Recommendations
4.1 General
The purpose of this study is to evaluate the efficacy of the AVA system and establish
specification limits for the AVA spacing factor that correspond to concrete with an adequate
spacing factor as measured in the hardened concrete by ASTM C457 (2012). The study includes
a total of 270 data pairs collected between 2001 and 2012. Four-inch diameter concrete cores
were taken for hardened air void analysis (ASTM C457) at the same location where the spacing
factor was determined using the AVA in the plastic concrete. The evaluation includes AVA tests
performed with municipal water obtained at or near the project location as well as tests
performed with deionized water. Of the 270 data pairs in the study, 50 include AVA test results
obtained with deionized water while the remaining were obtained from a municipal source.
4.2 Conclusions
The following observations and conclusions are based on the results and analyses
presented in this report. Unless noted, probabilities are based on all of the data (testing
performed with municipal water and deionized water) included in this study.
1. KDOT should continue to use deionized water from the Materials and
Research Center in Topeka, KS, due to issues with specific sources of
water identified in the field (e.g., city of Salina, KS, tap water). This will
ensure that potential testing issues related to water source will not bias the
results.
2. AVA spacing factors are, on average, 1.67 times higher than spacing
factors determined using ASTM C457. When only the AVA tests
conducted with deionized water are included, the AVA spacing factors
are, on average, 1.88 times higher. In both cases, however, there is not a
strong direct linear correlation between tests methods.
30
3. Twenty percent (up to 24.6% with a 10% probability of exceedance) of the
samples do not meet standards for an “acceptable air-void system” with
spacing factors measured using ASTM C457 greater than 0.0080 in.
(0.200 mm).
4. At the current specification threshold of 0.0125 in. (equivalent to 0.313
mm) that triggers C457 testing:
63.5% of the samples pass both tests,
10.2% fail both tests, and
26.3% fail exactly one of the tests.
5. Of the samples with an AVA spacing factor less than the current
specification threshold of 0.0125 in. (equivalent to 0.313 mm), 13.3%
(16.5% with a 10% probability of exceedance) have an actual spacing
factor greater than the current C457 specification limit of 0.0080 in.
(0.200 mm). This exceeds KDOT’s traditional risk tolerance of 10%.
6. Of the samples with an AVA spacing factor greater than the current
specification threshold of 0.0125 in. (equivalent to 0.313 mm), 62.0%
(69.4% with a 10% probability of exceedance) have an actual spacing
factor less than the C457 limit.
4.3 Recommendations
Based on the observations and conclusions in this report, the following recommendations
are made to ensure freeze-thaw durable concrete is used and accepted for KDOT projects.
1. Set the AVA spacing factor threshold (limit that triggers additional C457
testing) at 0.011 in. (equivalent to 0.28 mm). At this level, KDOT’s risk of
accepting concrete based on AVA testing that does not actually have an
adequate spacing factor is approximately 10%. Historically, the average
C457 spacing factor for samples that do not meet this requirement is 0.223
mm (0.0088 in.).

31
2. Because the statewide spacing factor average has increased since 2005,
including large increases in 2011 and 2012, it may be necessary to
reconsider remove-and-replace or other punitive action such as QC/QA
pay factors. At a minimum, KDOT should continue efforts to improve the
passing rates of the air void system and evaluate the effectiveness of the
2015 specification requirements.
3. Increase the frequency of testing with the AVA to one test performed
randomly for each four weeks of production for non-QC/QA projects to
verify consistency of the in-place concrete. This recommendation matches
the testing frequency currently required for QC/QA projects.
4. Continue efforts studying the impact of statewide AVA testing begun in
2000 on the paste freeze-thaw durability of concrete. The 10-year follow-
up study of pavements constructed before and after implementation of
AVA testing will be a valuable guide for future specifications.

32
References
AASHTO Standard TP 75-08. (2008). Standard test method for air-void characteristics of
freshly mixed concrete by buoyancy change. Washington, DC: American Association of
State Highway and Transportation Officials.
ACI Committee 201. (2008). Guide to durable concrete (ACI 201.2R-08). Farmington Hills, MI:
American Concrete Institute.
ASTM C231 / C231M-14. (2014). Standard test method for air content of freshly mixed concrete
by the pressure method. West Conshohocken, PA: ASTM International. doi:
10.1520/C0231_C0231M-14, www.astm.org
ASTM C457 / C457M-12. (2012). Standard test method for microscopical determination of
parameters of the air-void system in hardened concrete. West Conshohocken, PA:
ASTM International. doi: 10.1520/C0457_C0457M-12, www.astm.org
CSA A23.2-09. (2009). Test methods and standard practices for concrete. Toronto, ON:
Canadian Standards Association.
Distlehorst, J.A., & Kurgan, G.J. (2007). Development of precision statement for determining air
void characteristics of fresh concrete with use of Air Void Analyzer. Transportation
Research Record, 2020, 45-49.
Germann Instruments, Inc. (n.d.). AVA. Retrieved October 13, 2015, from
http://www.germann.org/TestSystems/AVA%20-%20Air%20Void%20Analyzer/AVA%
20-%20Air%20Void%20Analyzer.pdf
Henrichsen, A., & Vyncke, J. (1995). Quality assurance of air void structures in concrete. In G.
Schickert, & H. Wiggenhauser (Eds.), International symposium of non-destructive testing
in civil engineering (NDT-CE) proceedings (Vol. 1, pp. 261-268). Berlin, Germany: The
German Society for Non-Destructive Testing (Die Deutsche Gesellschaft für
Zerstörungsfreie Prüfung).
Kansas Department of Transportation (KDOT). (2015). On grade concrete (Section 403).
Standard specifications for state road & bridge construction. Topeka, KS: Author.
33
KT-71 Kansas Test Method. (2015). Air-void analyzer. Kansas Department of Transportation
construction manual, part V. Topeka, KS: Kansas Department of Transportation.
Ley, T., Felice, R., & Freeman, J.M. (2012). Concrete pavement mixture design and analysis
(MDA): Assessment of air void system requirements for durable concrete. Ames, IA:
National Concrete Pavement Technology Center, Iowa State University.
Magura, D.D. (1996). Air Void Analyzer Evaluation (Report No. FHWA-SA-96-062).
Washington, DC: Office of Technology Applications, Federal Highway Administration.
Neville, A.M. (1995). Properties of concrete (4th ed.). England: Prentice Hall.
Powers, T.C. (1954). Void spacing as a basis for producing air-entrained concrete. Journal of the
American Concrete Institute, 50(5), 741-760.
Wang, K., Mohamed-Metwally, M., Bektas, F., & Grove, J. (2008). Improving Variability and
Precision of the Air-Void Analyzer (AVA) Test Results and Developing Rational
Specification Limits (Report No. DTFH-61-06-H-00011, W03). Washington, DC: Federal
Highway Administration.
34
Appendix: Raw Spacing Factor Data
Table A.1: Spacing Factors of Concrete Using the Air Void Analyzer and ASTM C-457 from 2001 to 2011
Date Project Sample
Location, Station
C-457 Spacing Factor,
mm
AVA Spacing Factor,
mm
Source of AVA
Water
AVA Testing
Performed by
C-457 Testing
Performed by
04/19/01 50-57 K-5385-01 12+550 0.360 0.320 04/19/01 50-57 K-5385-01 13+675 0.320 0.290 04/19/01 50-57 K-5385-01 13+676 0.290 0.240
2001 Study 2001 Study M & R lab 0.462 0.380 Research Research Research 2001 Study 70-89 K-2442-01 M & R lab 0.404 0.417 Research Research Research
5/2005 35-105 K-6391-01 13+365 0.265 0.181 5/2005 35-105 K-6391-01 13+620 0.345 0.415
07/29/05 69-6 K-7412-01 12+845 0.212 0.215 08/01/05 135-87 K-6780-01 19+870 0.216 0.228 08/12/05 56-05 K-8615-01 10th&Col 0.187 0.164 08/19/05 54-8 K-8001-02 1+805 0.128 0.140 10/13/05 69-61 K-1591-01 26+200 0.195 0.222 10/27/05 69-54K-7413-01 28+796 0.187 0.172 11/10/05 89 U-1840-01 6th and Gage 0.128 0.131 04/17/06 69-6 K-7412-01 23+645 0.115 0.164 04/18/06 69-54 K-7890-01 99+025 0.121 0.147 05/31/06 69-54 K-7890-01 97+494 0.114 0.199 06/29/06 85 K 8307-01 10+414 0.124 0.206 07/20/06 70-21K 6794-01 21+237 0.160 0.259 07/20/06 70-21K 6794-01 21+837 0.130 0.318 07/20/06 70-21K 6794-01 22+178 0.144 0.311 07/26/06 77-81K 9182-01 40+310 0.200 0.391 07/28/06 77-81K 9182-01 46+490 0.226 0.404 08/02/06 77-81K 9182-01 not known 0.166 0.118 08/03/06 54-60 K7410-01 22+335 0.179 0.422 08/09/06 54-60 K7410-01 22+448 0.140 0.261 08/09/06 54-60 K7410-01 22+600 0.201 0.349 08/09/06 54-60 K7410-01 22+780 0.193 0.365 08/11/06 54-60 K7410-01 23+015 0.164 0.385
4/24/2007 435-46 K-7451-01 0.137 0.074 5/23/2007 I-70 2-lift M & R lab 0.154 0.228 Research Research Research 5/23/2007 I-70 2-lift M & R lab 0.123 0.172 Research Research Research 5/25/2007 I-70 2-lift M & R lab 0.234 0.647 Research Research Research

35
Date Project Sample
Location, Station
C-457 Spacing Factor,
mm
AVA Spacing Factor,
mm
Source of AVA
Water
AVA Testing
Performed by
C-457 Testing
Performed by
5/25/2007 I-70 2-lift M & R lab 0.244 0.612 Research Research Research 5/30/2007 I-70 2-lift M & R lab 0.163 0.247 Research Research Research 5/30/2007 I-70 2-lift M & R lab 0.203 0.201 Research Research Research 6/1/2007 I-70 2-lift M & R lab 0.142 0.177 Research Research Research
7/17/2007 70-85 K-6779-01 0.203 0.281 7/23/2007 28 U-1898-01 0.232 0.289 7/26/2007 156-28 K-9177-01 0.200 0.198 7/26/2007 24-105 K-8248-01 0.177 0.220 7/31/2007 54-60 K-7410-01 0.163 0.187 7/31/2007 24-105 K-8248-01 0.216 0.219 9/20/2007 283-42 KA-0488-01 0.307 0.395 10/4/2007 50-78 K-7409-01 0.251 0.318 10/4/2007 50-78 K-7409-01 0.240 0.343 10/9/2007 50-78 K-7409-01 0.263 0.616
10/16/2007 50-78 K-7409-01 0.268 0.541 11/13/2007 Research 07-4081 M & R lab 0.250 0.866 Research Research 11/13/2007 Research 07-4082 M & R lab 0.167 0.186 Research Research 11/13/2007 Research 07-4083 M & R lab 0.171 0.202 Research Research 11/13/2007 Research 07-4084 M & R lab 0.122 0.092 Research Research 11/13/2007 Research 07-4085 M & R lab 0.092 0.071 Research Research 11/14/2007 Research 07-4086 M & R lab 0.185 0.096 Research Research 11/14/2007 Research 07-4087 M & R lab 0.204 0.153 Research Research 11/14/2007 Research 07-4088 M & R lab 0.113 0.066 Research Research 11/14/2007 Research 07-4089 M & R lab 0.116 0.090 Research Research 11/14/2007 Research 07-4090 M & R lab 0.156 0.203 Research Research 11/14/2007 Research 07-4091 M & R lab 0.265 0.354 Research Research 11/15/2007 Research 07-4092 M & R lab 0.140 0.165 Research Research 11/15/2007 Research 07-4093 M & R lab 0.129 0.220 Research Research 11/15/2007 Research 07-4094 M & R lab 0.158 0.460 Research Research 11/15/2007 Research 07-4095 M & R lab 0.178 0.367 Research Research 11/15/2007 Research 07-4096 M & R lab 0.224 0.367 Research Research 11/15/2007 Research 07-4097 M & R lab 0.233 0.387 Research Research
2008 US 69 2-lift 4+723 0.134 0.194 2008 US 69 2-lift 4+950 0.122 0.141 2008 I-70 2-lift M & R lab 0.319 0.425 Research Research Research 2008 K-8262-01 0.131 0.104 Research Research Research 2008 U.S. 24/7 0.205 0.164 2008 U.S. 24/7 0.170 0.185
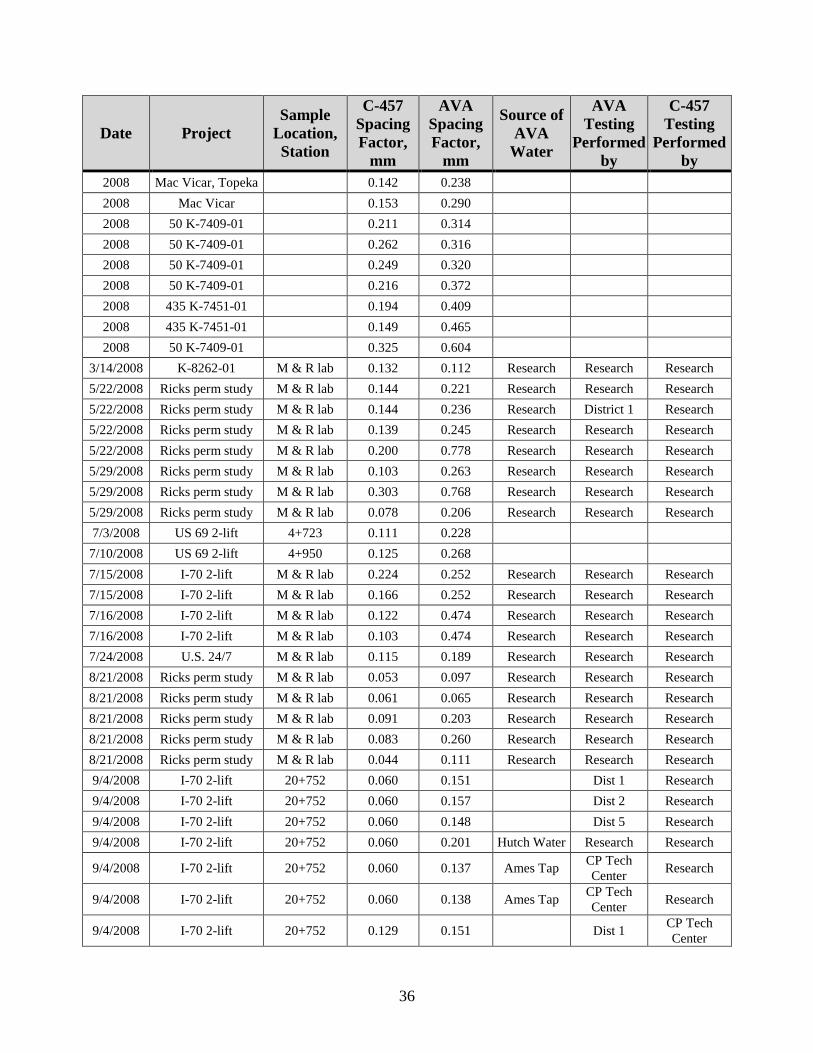
36
Date Project Sample
Location, Station
C-457 Spacing Factor,
mm
AVA Spacing Factor,
mm
Source of AVA
Water
AVA Testing
Performed by
C-457 Testing
Performed by
2008 Mac Vicar, Topeka 0.142 0.238 2008 Mac Vicar 0.153 0.290 2008 50 K-7409-01 0.211 0.314 2008 50 K-7409-01 0.262 0.316 2008 50 K-7409-01 0.249 0.320 2008 50 K-7409-01 0.216 0.372 2008 435 K-7451-01 0.194 0.409 2008 435 K-7451-01 0.149 0.465 2008 50 K-7409-01 0.325 0.604
3/14/2008 K-8262-01 M & R lab 0.132 0.112 Research Research Research 5/22/2008 Ricks perm study M & R lab 0.144 0.221 Research Research Research 5/22/2008 Ricks perm study M & R lab 0.144 0.236 Research District 1 Research 5/22/2008 Ricks perm study M & R lab 0.139 0.245 Research Research Research 5/22/2008 Ricks perm study M & R lab 0.200 0.778 Research Research Research 5/29/2008 Ricks perm study M & R lab 0.103 0.263 Research Research Research 5/29/2008 Ricks perm study M & R lab 0.303 0.768 Research Research Research 5/29/2008 Ricks perm study M & R lab 0.078 0.206 Research Research Research 7/3/2008 US 69 2-lift 4+723 0.111 0.228
7/10/2008 US 69 2-lift 4+950 0.125 0.268 7/15/2008 I-70 2-lift M & R lab 0.224 0.252 Research Research Research 7/15/2008 I-70 2-lift M & R lab 0.166 0.252 Research Research Research 7/16/2008 I-70 2-lift M & R lab 0.122 0.474 Research Research Research 7/16/2008 I-70 2-lift M & R lab 0.103 0.474 Research Research Research 7/24/2008 U.S. 24/7 M & R lab 0.115 0.189 Research Research Research 8/21/2008 Ricks perm study M & R lab 0.053 0.097 Research Research Research 8/21/2008 Ricks perm study M & R lab 0.061 0.065 Research Research Research 8/21/2008 Ricks perm study M & R lab 0.091 0.203 Research Research Research 8/21/2008 Ricks perm study M & R lab 0.083 0.260 Research Research Research 8/21/2008 Ricks perm study M & R lab 0.044 0.111 Research Research Research 9/4/2008 I-70 2-lift 20+752 0.060 0.151 Dist 1 Research 9/4/2008 I-70 2-lift 20+752 0.060 0.157 Dist 2 Research 9/4/2008 I-70 2-lift 20+752 0.060 0.148 Dist 5 Research 9/4/2008 I-70 2-lift 20+752 0.060 0.201 Hutch Water Research Research
9/4/2008 I-70 2-lift 20+752 0.060 0.137 Ames Tap CP Tech Center Research
9/4/2008 I-70 2-lift 20+752 0.060 0.138 Ames Tap CP Tech Center Research
9/4/2008 I-70 2-lift 20+752 0.129 0.151 Dist 1 CP Tech Center
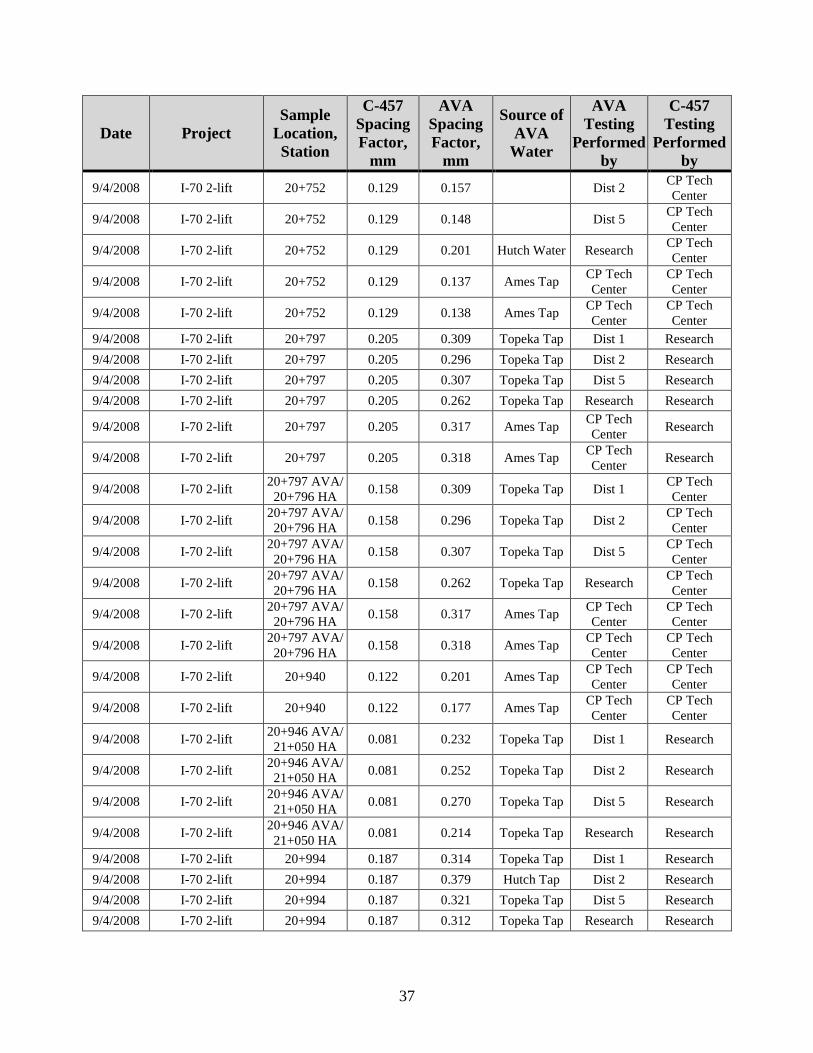
37
Date Project Sample
Location, Station
C-457 Spacing Factor,
mm
AVA Spacing Factor,
mm
Source of AVA
Water
AVA Testing
Performed by
C-457 Testing
Performed by
9/4/2008 I-70 2-lift 20+752 0.129 0.157 Dist 2 CP Tech Center
9/4/2008 I-70 2-lift 20+752 0.129 0.148 Dist 5 CP Tech Center
9/4/2008 I-70 2-lift 20+752 0.129 0.201 Hutch Water Research CP Tech Center
9/4/2008 I-70 2-lift 20+752 0.129 0.137 Ames Tap CP Tech Center
CP Tech Center
9/4/2008 I-70 2-lift 20+752 0.129 0.138 Ames Tap CP Tech Center
CP Tech Center
9/4/2008 I-70 2-lift 20+797 0.205 0.309 Topeka Tap Dist 1 Research 9/4/2008 I-70 2-lift 20+797 0.205 0.296 Topeka Tap Dist 2 Research 9/4/2008 I-70 2-lift 20+797 0.205 0.307 Topeka Tap Dist 5 Research 9/4/2008 I-70 2-lift 20+797 0.205 0.262 Topeka Tap Research Research
9/4/2008 I-70 2-lift 20+797 0.205 0.317 Ames Tap CP Tech Center Research
9/4/2008 I-70 2-lift 20+797 0.205 0.318 Ames Tap CP Tech Center Research
9/4/2008 I-70 2-lift 20+797 AVA/ 20+796 HA 0.158 0.309 Topeka Tap Dist 1 CP Tech
Center
9/4/2008 I-70 2-lift 20+797 AVA/ 20+796 HA 0.158 0.296 Topeka Tap Dist 2 CP Tech
Center
9/4/2008 I-70 2-lift 20+797 AVA/ 20+796 HA 0.158 0.307 Topeka Tap Dist 5 CP Tech
Center
9/4/2008 I-70 2-lift 20+797 AVA/ 20+796 HA 0.158 0.262 Topeka Tap Research CP Tech
Center
9/4/2008 I-70 2-lift 20+797 AVA/ 20+796 HA 0.158 0.317 Ames Tap CP Tech
Center CP Tech Center
9/4/2008 I-70 2-lift 20+797 AVA/ 20+796 HA 0.158 0.318 Ames Tap CP Tech
Center CP Tech Center
9/4/2008 I-70 2-lift 20+940 0.122 0.201 Ames Tap CP Tech Center
CP Tech Center
9/4/2008 I-70 2-lift 20+940 0.122 0.177 Ames Tap CP Tech Center
CP Tech Center
9/4/2008 I-70 2-lift 20+946 AVA/ 21+050 HA 0.081 0.232 Topeka Tap Dist 1 Research
9/4/2008 I-70 2-lift 20+946 AVA/ 21+050 HA 0.081 0.252 Topeka Tap Dist 2 Research
9/4/2008 I-70 2-lift 20+946 AVA/ 21+050 HA 0.081 0.270 Topeka Tap Dist 5 Research
9/4/2008 I-70 2-lift 20+946 AVA/ 21+050 HA 0.081 0.214 Topeka Tap Research Research
9/4/2008 I-70 2-lift 20+994 0.187 0.314 Topeka Tap Dist 1 Research 9/4/2008 I-70 2-lift 20+994 0.187 0.379 Hutch Tap Dist 2 Research 9/4/2008 I-70 2-lift 20+994 0.187 0.321 Topeka Tap Dist 5 Research 9/4/2008 I-70 2-lift 20+994 0.187 0.312 Topeka Tap Research Research

38
Date Project Sample
Location, Station
C-457 Spacing Factor,
mm
AVA Spacing Factor,
mm
Source of AVA
Water
AVA Testing
Performed by
C-457 Testing
Performed by
9/4/2008 I-70 2-lift 20+994 0.187 0.332 Ames Tap CP Tech Center Research
9/4/2008 I-70 2-lift 20+994 0.187 0.282 Ames Tap CP Tech Center Research
9/4/2008 I-70 2-lift 20+994 0.067 0.314 Topeka Tap Dist 1 CP Tech Center
9/4/2008 I-70 2-lift 20+994 0.067 0.379 Hutch Tap Dist 2 CP Tech Center
9/4/2008 I-70 2-lift 20+994 0.067 0.321 Topeka Tap Dist 5 CP Tech Center
9/4/2008 I-70 2-lift 20+994 0.067 0.312 Topeka Tap Research CP Tech Center
9/4/2008 I-70 2-lift 20+994 0.067 0.332 Ames Tap CP Tech Center
CP Tech Center
9/4/2008 I-70 2-lift 20+994 0.067 0.282 Ames Tap CP Tech Center
CP Tech Center
9/9/2008 I-70 2-lift 21+293 0.109 0.199 Ames Tap CP Tech Center
CP Tech Center
9/9/2008 I-70 2-lift 21+293 0.109 0.200 Ames Tap CP Tech Center
CP Tech Center
9/9/2008 I-70 2-lift 21+478 0.199 0.295 Ames Tap CP Tech Center
CP Tech Center
9/9/2008 I-70 2-lift 21+478 0.199 0.274 Ames Tap CP Tech Center
CP Tech Center
9/9/2008 I-70 2-lift 21+485 0.122 0.466 Topeka Tap Dist 2 Research 9/9/2008 I-70 2-lift 21+485 0.122 0.507 Topeka Tap Dist 2 Research 9/9/2008 I-70 2-lift 21+485 0.122 0.334 Chanute Tap Dist 4 Research 9/9/2008 I-70 2-lift 21+485 0.122 0.316 Koss Plant Dist 4 Research 9/9/2008 I-70 2-lift 21+485 0.122 0.332 Koss Plant Research Research 9/9/2008 I-70 2-lift 21+485 0.122 0.249 Topeka Tap Research Research 9/9/2008 I-70 2-lift 21+500 0.268 0.376 Koss Plant Dist 2 Research 9/9/2008 I-70 2-lift 21+500 0.268 0.391 Chanute Tap Dist 4 Research 9/9/2008 I-70 2-lift 21+500 0.268 0.323 Koss Plant Research Research
9/10/2008 I-70 2-lift 21+910 0.151 0.359 Koss Plant Dist 4 Research 9/10/2008 I-70 2-lift 21+910 0.151 0.327 Topeka Tap Research Research
9/10/2008 I-70 2-lift 21+910 0.151 0.258 Ames/Koss CP Tech Center Research
9/10/2008 I-70 2-lift 21+910 0.151 0.240 Ames/Koss CP Tech Center Research
9/10/2008 I-70 2-lift 21+977 0.138 0.293 Topeka Tap Dist 4 Research 9/10/2008 I-70 2-lift 21+977 0.138 0.268 Koss Plant Research Research
9/10/2008 I-70 2-lift 21+977 0.138 0.197 Ames/Koss CP Tech Center Research
9/10/2008 I-70 2-lift 21+977 0.138 0.180 Ames/Koss CP Tech Center Research

39
Date Project Sample
Location, Station
C-457 Spacing Factor,
mm
AVA Spacing Factor,
mm
Source of AVA
Water
AVA Testing
Performed by
C-457 Testing
Performed by
9/10/2008 I-70 2-lift 21+977 0.140 0.293 Topeka Tap Dist 4 CP Tech Center
9/10/2008 I-70 2-lift 21+977 0.140 0.268 Koss Plant Research CP Tech Center
9/10/2008 I-70 2-lift 21+977 0.140 0.197 Ames/Koss CP Tech Center
CP Tech Center
9/10/2008 I-70 2-lift 21+977 0.140 0.180 Ames/Koss CP Tech Center
CP Tech Center
9/10/2008 I-70 2-lift 22+207 AVA/ 22+212 HA 0.129 0.160 Ames/Koss CP Tech
Center Research
9/10/2008 I-70 2-lift 22+212 0.129 0.189 Koss Plant Dist 4 Research 9/10/2008 I-70 2-lift 22+212 0.129 0.233 Topeka Tap Dist 4 Research 9/10/2008 I-70 2-lift 22+212 0.129 0.203 Koss Plant Research Research 9/10/2008 I-70 2-lift 22+212 0.129 0.403 Salina Tap Research Research
9/10/2008 I-70 2-lift 22+257 0.166 0.242 Ames/Koss CP Tech Center
CP Tech Center
9/10/2008 I-70 2-lift 22+257 0.166 0.215 Ames/Koss CP Tech Center
CP Tech Center
9/10/2008 I-70 2-lift 22+262 0.171 0.420 Koss Plant Dist 4 Research 9/10/2008 I-70 2-lift 22+262 0.171 0.379 Topeka Tap Dist 4 Research 9/10/2008 I-70 2-lift 22+262 0.171 0.370 Koss Plant Research Research 9/10/2008 I-70 2-lift 22+262 0.171 0.311 Topeka Tap Research Research 9/10/2008 I-70 2-lift 22+413 0.187 0.300 Koss Plant Dist 2 Research 9/10/2008 I-70 2-lift 22+413 0.187 0.325 Koss Plant Dist 4 Research 9/10/2008 I-70 2-lift 22+413 0.187 0.282 Koss Plant Research Research 9/11/2008 I-70 2-lift 22+853 0.168 0.296 Koss Plant Dist 2 Research 9/11/2008 I-70 2-lift 22+853 0.168 0.261 Topeka Tap Dist 2 Research 9/11/2008 I-70 2-lift 22+853 0.168 0.278 Koss Plant Research Research 9/11/2008 I-70 2-lift 22+853 0.168 0.305 Topeka Tap Research Research 9/11/2008 I-70 2-lift 22+853 0.168 0.220 Topeka Tap Research Research 9/15/2008 I-70 2-lift 23+296 0.136 0.212 Topeka Tap Dist 2 Research 9/15/2008 I-70 2-lift 23+296 0.136 0.198 Topeka Tap Research Research 9/16/2008 I-70 2-lift 23+820 0.144 0.153 Topeka Tap Dist 2 Research 9/16/2008 I-70 2-lift 23+820 0.144 0.158 Topeka Tap Research Research 9/16/2008 I-70 2-lift 23+840 0.118 0.222 Topeka Tap Dist 2 Research 9/16/2008 I-70 2-lift 23+840 0.118 0.202 Topeka Tap Research Research 9/16/2008 I-70 2-lift 24+212 0.161 0.196 Topeka Tap Dist 2 Research 9/16/2008 I-70 2-lift 24+212 0.161 0.178 Topeka Tap Research Research 9/17/2008 I-70 2-lift 24+560 0.113 0.238 Deionized Dist 2 Research 9/17/2008 I-70 2-lift 24+560 0.113 0.202 Topeka Tap Dist 2 Research 9/17/2008 I-70 2-lift 24+560 0.113 0.190 Topeka Tap Dist 2 Research

40
Date Project Sample
Location, Station
C-457 Spacing Factor,
mm
AVA Spacing Factor,
mm
Source of AVA
Water
AVA Testing
Performed by
C-457 Testing
Performed by
9/17/2008 I-70 2-lift 24+560 0.113 0.328 Topeka Tap Research Research 9/17/2008 I-70 2-lift 24+560 0.113 0.200 Topeka Tap Research Research 9/18/2008 I-70 2-lift 25+133 0.127 0.344 Deionized Dist 1 Research 9/18/2008 I-70 2-lift 25+133 0.127 0.317 Deionized Dist 1 Research 9/18/2008 I-70 2-lift 25+133 0.127 0.442 Deionized Dist 2 Research 9/18/2008 I-70 2-lift 25+133 0.127 0.322 Distilled Dist 2 Research 9/18/2008 I-70 2-lift 25+133 0.127 0.310 Deionized Research Research 9/18/2008 I-70 2-lift 25+133 0.127 0.303 Distilled Research Research 9/18/2008 I-70 2-lift 25+212 0.135 0.236 Deionized Dist 1 Research 9/18/2008 I-70 2-lift 25+212 0.135 0.180 Distilled #1 Dist 1 Research 9/18/2008 I-70 2-lift 25+212 0.135 0.218 Distilled #1 Dist 2 Research 9/18/2008 I-70 2-lift 25+212 0.135 0.326 Distilled #2 Dist 2 Research 9/18/2008 I-70 2-lift 25+212 0.135 0.207 Deionized Research Research 9/18/2008 I-70 2-lift 25+212 0.135 0.211 Deionized Research Research 9/18/2008 I-70 2-lift 25+375 0.213 0.300 Deionized Dist 1 Research 9/18/2008 I-70 2-lift 25+375 0.213 0.224 Topeka Tap Dist 1 Research 9/18/2008 I-70 2-lift 25+375 0.213 0.352 Deionized Dist 2 Research 9/18/2008 I-70 2-lift 25+375 0.213 0.295 Distilled Dist 2 Research 9/18/2008 I-70 2-lift 25+375 0.213 0.277 Distilled Research Research
9/19/2008 I-70 2-lift 25+408 0.120 0.245 Ames/Koss CP Tech Center
CP Tech Center
9/19/2008 I-70 2-lift 25+408 0.120 0.235 Ames/Koss CP Tech Center
CP Tech Center
9/19/2008 I-70 2-lift 25+416 AVA/ 25+425 HA 0.153 0.315 Distilled Dist 2 Research
9/19/2008 I-70 2-lift 25+416 AVA/ 25+425 HA 0.153 0.218 Topeka Tap Dist 2 Research
9/19/2008 I-70 2-lift 25+416 AVA/ 25+425 HA 0.153 0.255 Deionized Research Research
9/19/2008 I-70 2-lift 25+416 AVA/ 25+425 HA 0.153 0.293 Deionized Research Research
9/19/2008 I-70 2-lift 25+561 AVA/ 25+562 HA 0.132 0.197 Deionized Dist 2 Research
9/19/2008 I-70 2-lift 25+561 AVA/ 25+562 HA 0.132 0.207 Topeka Tap Dist 2 Research
9/19/2008 I-70 2-lift 25+561 AVA/ 25+562 HA 0.132 0.199 Deionized Research Research
9/19/2008 I-70 2-lift 25+561 AVA/ 25+562 HA 0.132 0.194 Topeka Tap Research Research
9/19/2008 I-70 2-lift 25+627 0.163 0.341 Ames/Koss CP Tech Center
CP Tech Center
9/19/2008 I-70 2-lift 25+627 0.163 0.342 Ames/Koss CP Tech Center
CP Tech Center
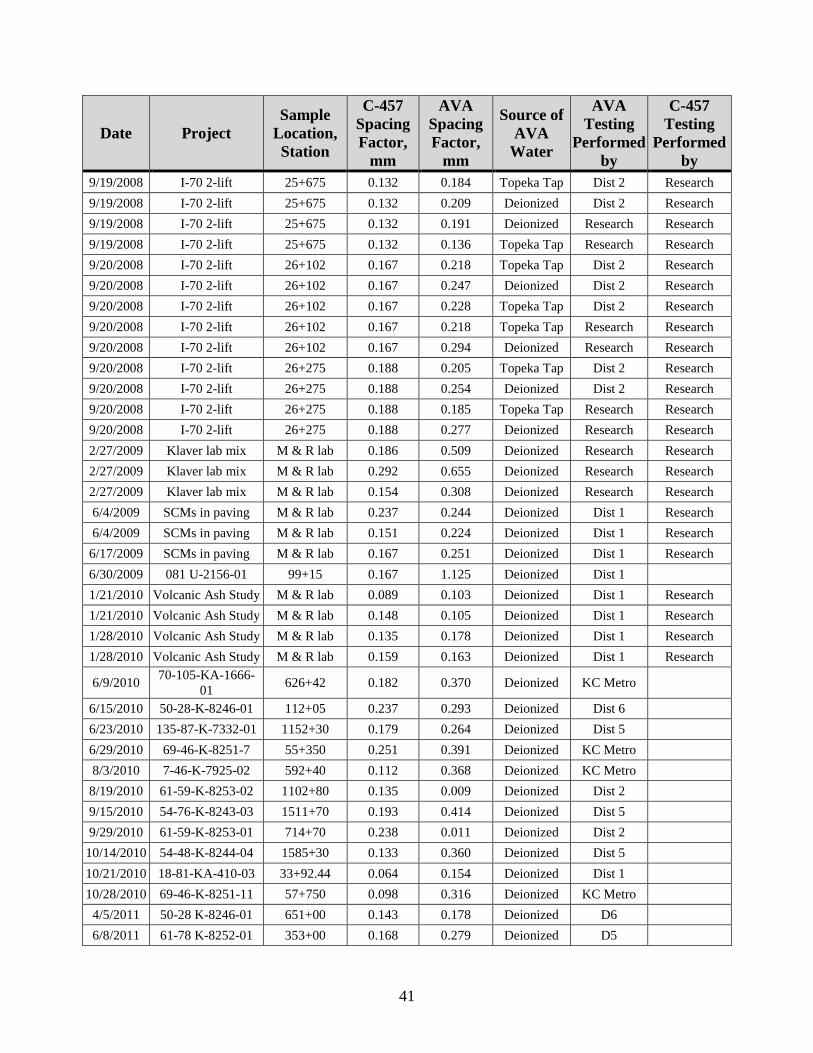
41
Date Project Sample
Location, Station
C-457 Spacing Factor,
mm
AVA Spacing Factor,
mm
Source of AVA
Water
AVA Testing
Performed by
C-457 Testing
Performed by
9/19/2008 I-70 2-lift 25+675 0.132 0.184 Topeka Tap Dist 2 Research 9/19/2008 I-70 2-lift 25+675 0.132 0.209 Deionized Dist 2 Research 9/19/2008 I-70 2-lift 25+675 0.132 0.191 Deionized Research Research 9/19/2008 I-70 2-lift 25+675 0.132 0.136 Topeka Tap Research Research 9/20/2008 I-70 2-lift 26+102 0.167 0.218 Topeka Tap Dist 2 Research 9/20/2008 I-70 2-lift 26+102 0.167 0.247 Deionized Dist 2 Research 9/20/2008 I-70 2-lift 26+102 0.167 0.228 Topeka Tap Dist 2 Research 9/20/2008 I-70 2-lift 26+102 0.167 0.218 Topeka Tap Research Research 9/20/2008 I-70 2-lift 26+102 0.167 0.294 Deionized Research Research 9/20/2008 I-70 2-lift 26+275 0.188 0.205 Topeka Tap Dist 2 Research 9/20/2008 I-70 2-lift 26+275 0.188 0.254 Deionized Dist 2 Research 9/20/2008 I-70 2-lift 26+275 0.188 0.185 Topeka Tap Research Research 9/20/2008 I-70 2-lift 26+275 0.188 0.277 Deionized Research Research 2/27/2009 Klaver lab mix M & R lab 0.186 0.509 Deionized Research Research 2/27/2009 Klaver lab mix M & R lab 0.292 0.655 Deionized Research Research 2/27/2009 Klaver lab mix M & R lab 0.154 0.308 Deionized Research Research 6/4/2009 SCMs in paving M & R lab 0.237 0.244 Deionized Dist 1 Research 6/4/2009 SCMs in paving M & R lab 0.151 0.224 Deionized Dist 1 Research
6/17/2009 SCMs in paving M & R lab 0.167 0.251 Deionized Dist 1 Research 6/30/2009 081 U-2156-01 99+15 0.167 1.125 Deionized Dist 1 1/21/2010 Volcanic Ash Study M & R lab 0.089 0.103 Deionized Dist 1 Research 1/21/2010 Volcanic Ash Study M & R lab 0.148 0.105 Deionized Dist 1 Research 1/28/2010 Volcanic Ash Study M & R lab 0.135 0.178 Deionized Dist 1 Research 1/28/2010 Volcanic Ash Study M & R lab 0.159 0.163 Deionized Dist 1 Research
6/9/2010 70-105-KA-1666-01 626+42 0.182 0.370 Deionized KC Metro
6/15/2010 50-28-K-8246-01 112+05 0.237 0.293 Deionized Dist 6 6/23/2010 135-87-K-7332-01 1152+30 0.179 0.264 Deionized Dist 5 6/29/2010 69-46-K-8251-7 55+350 0.251 0.391 Deionized KC Metro 8/3/2010 7-46-K-7925-02 592+40 0.112 0.368 Deionized KC Metro
8/19/2010 61-59-K-8253-02 1102+80 0.135 0.009 Deionized Dist 2 9/15/2010 54-76-K-8243-03 1511+70 0.193 0.414 Deionized Dist 5 9/29/2010 61-59-K-8253-01 714+70 0.238 0.011 Deionized Dist 2
10/14/2010 54-48-K-8244-04 1585+30 0.133 0.360 Deionized Dist 5 10/21/2010 18-81-KA-410-03 33+92.44 0.064 0.154 Deionized Dist 1 10/28/2010 69-46-K-8251-11 57+750 0.098 0.316 Deionized KC Metro
4/5/2011 50-28 K-8246-01 651+00 0.143 0.178 Deionized D6 6/8/2011 61-78 K-8252-01 353+00 0.168 0.279 Deionized D5

42
Date Project Sample
Location, Station
C-457 Spacing Factor,
mm
AVA Spacing Factor,
mm
Source of AVA
Water
AVA Testing
Performed by
C-457 Testing
Performed by
8/11/2011 70-27 K-0729-01 529+20 0.130 0.283 Deionized D2 10/11/2011 59-23 K-7888-02 434+20 0.105 0.180 Deionized D1 6/26/2012 70-27 KA-0728-01 51+75 0.117 0.488 Deionized 2 6/26/2012 70-27 KA-0728-01 61+25 0.115 0.432 Deionized 2 6/27/2012 70-27 KA-0728-01 108+80 0.124 0.377 Deionized 2 7/9/2012 70-27 KA-0728-01 330+75 0.081 0.356 Deionized 2

43
Table A.2: Spacing Factors of Concrete Using the Air Void Analyzer and ASTM C457 from the “I-70 in Dickinson County” Project 70-21 K-6794-01 Placed in 2005
Date Station
C-457 Hardened Air
Spacing Factor (mm)
AVA Spacing Factor
(mm)
9/9/2005 10+090.9 0.350 0.401 9/9/2005 right side 0.323 0.313 9/13/2005 10+97.5 0.289 0.310 9/13/2005 left side 0.256 0.368 9/13/2005 10+97.5 0.274 0.365 9/13/2005 left side 0.154 0.366 9/16/2005 11+570 0.175 0.420 9/16/2005 left side 0.174 0.412 9/16/2005 11+932.5 0.186 0.361 9/16/2005 left side 0.198 0.365 9/17/2005 11+932.5 0.200 0.330 9/17/2005 left side 0.254 0.352 9/17/2005 12+552 0.254 0.407 9/17/2005 left side 0.238 0.393 9/19/2005 12+858 0.203 0.389 9/19/2005 left side 0.226 0.324 9/19/2005 12+858 0.203 0.320 9/19/2005 left side 0.226 0.413 9/19/2005 13+141.5 0.234 0.314 9/19/2005 left side 0.242 0.356 9/19/2005 13+141.5 0.234 0.261 9/19/2005 left side 0.242 0.299 9/20/2005 13+500 0.190 0.320 9/20/2005 left side 0.223 0.331 9/20/2005 13+500 0.190 0.236 9/20/2005 left side 0.223 0.318 9/20/2005 14+026 0.180 0.332 9/20/2005 P 4.55 from Lt. 0.208 0.366 9/20/2005 14+026 0.180 0.251 9/20/2005 P 4.55 from Lt. 0.208 0.240 9/22/2005 14+702 0.183 0.258 9/22/2005 left side 0.213 0.212 9/22/2005 14+702 0.213 0.238 9/22/2005 left side 0.183 0.259